t , ; ..
MOLECULAR PHYLOGENY OF GROUPER BASED ON CYTOCHROME OXIDASE I GENE ANALYSIS
Muhammad Hafizie Bin Abu Bakar
QP Bachelor of Science with Honours 603
(Aquatic Resource Science and Management) C85 2014M952
2014
Pusat Khidmat Maklumat Akademik UNlVERSm MALAYSiA SARAWAK
Molecular Phylogeny of Grouper based on Cytochrome Oxidase I Gene Analysis
Muhammad Hafizie bin Abu Bakar
This project is submitted in partial fulfilment of the requirements for the degree of Bachelor of Science with Honours
(Aquatic Resource Science and Management)
Faculty of Resource Science and Technology
UNIVERSITI MALAYSIA SARA W AK
2014
· , ;0.
DECLARATION
No portion of the work referred in this dissertation has been submitted in support of an
application for another degree qualification of this or any other university or institution of
higher learning.
Muhammad Hafizie Bin Abu Bakar
Aquatic Resource Science and Management Programme
Department of Aquatic Science
Faculty of Resource Science and Technology
Universiti Malaysia Sarawak

I
i
.. ., ;.~
ACKNOWLEDGEMENT
Alhamdulillah, my utmost gratitude to Allah SWT, with His power, I completed my
Final Year Project. I hereby wish to take this opportunity to express my gratitude and
appreciation to all those that have assisted and guided me throughout the completion of this
Final year Project.
First of all, I would like to express my sincere gratitude and appreciation to my
supervisor Dr Ruhana binti Hassan for all her guidance, patience and encouragement; I have
come this far through my project. Deepest thanks for all the valuable knowledge and
experiences I had gained. Further thanks to all the laboratory assistants of Faculty Resource
Science and Technology UNIMAS, especially Mrs. Lucy Darn for their contribution during
laboratory works.
Special gratitude to post graduates students Khairnlazman, Nursyuhaida, Mohd. Izwan
Zulaini, Amirnl, Arif and to all my labmates for their help, cooperation and assistance in
completing this project. Many thanks also to Fisheries Research Institute Bintawa, Sarawak
for providing me with samples.
Last but not least my heartiest gratitude goes to my parents Mr. Abu Bakar
Muhammad and Mrs. Maziah binti Awang as well as my sister Ms. Nor Amiera Abu Bakar for
their amazing love and continuous support in accomplishing this project. Thank you .
•
1
I
Pusat Khidmat ~faklumat Akademi~ UNIVERSm MALAYSIA SARAWAK.
TABLE OF CONTENTS
ACKNOWLEDGEMENT... ...... .. .................. ... ... ........ ..... ... ...... ... ......... . .... I
IITABLE OF CONTENTS.......... ... ........ .. .... ... ..... ...... .. ................. ... ..... ..... ..
LIST OF ABBREVIATION... ... ... ... ... ... ... ... ... ... ... ... ... ... . .. ... ... ... ... ... ... ... .... N
LIST OF TABLES... ... .. .... ................. ... ..... ....... .. .. ..... ............. ............. ... V
LIST OF FIGURES....... . .......... .... ..... ... .......... ... ................. . ....... . ........ ...... VI
LIST OF APPENDICES.................. ...... ... ... ...... ... ...... ... ... ... ............... ....... VII
ABSTRACT. . . . . . . . . . . . . . . . .. . . . . . . . . . . . . .. . . .. .. . . . . .. . . .. . . . . . . ... . . . . . . . . . .. . ... . . . ... . . . . . . . . . .. VIII
1.0 INTRODUCTION.................. ..... .... .... .. .. ...... . ............ ... .... .. .............. .. .
2.0 LITERATURE REVIEW... . ............. .... .. ... .... .... ........ .... ..... ... ................... 3
2.1 Epinephelus sexfasciatus......... ... ... ...... . ..... ... ... .... .... . ...... ... ... ... ....... 3
2.2 Mitochondrion DNA... ... ... . .. ... ... ... ... ... ... .. . ... ... ... ... ... ......... ... ... .... 5
2.3 Mitochondrion DNA Markers... .. . ......... ... ... ... ... ... ...... . .. ... ... ... .......... 7
2.3.1 Cytochorome c Oxidase 1.............................. .. ....... .... .. ....... 7
3.0 MATERIALS AND METHOD ..... . ............. .. ... .... ........... ... .. . .. ......... ...... . 9
3.1 Sample Collection and Preservation. .. . . . . . . . . . . . . . . . . . . .. . . . . . . . . .. . . . . . . . .. . . . . . . . 9
3.2 Laboratory Work... . . . ... ... ... ... ... ... ... ... . .. ... ... ... ... ... ... ......................... 10 )
3.2.1 DNA Extraction.... .. ............ . ..... .... ...... ..... ...... .. ..... ... ...... 10
3.2.2 DNA Quantification.......... ... ..... ... ... . ...... .. ..... ... ............... 10
3.2.3 OD Reading......... .. ....... ...... .... ...... .... . ...... ..... ....... .. .. ..... 11
3.2.4 Polymerase Chain Reaction. . . ............ ...... ..................... ... . .. 11
3.2.5 Sequencing.................... . ....... .... ........ .... .... ..... .. .. ... ....... 13
3.2.6 Data Analysis... ... .. . ............... .................. ............... ....... 13
II
I
4.0 RESULT AND DISCUSSION... ....................................... . .................. ... 14
4.1 Total Genomic DNA Extraction ... '" ................ ,. ... ...... ....................... 14
4.2 Optical Density Reading................ .. ............... ..... ............. ....... .. ..... 16
4.3 Polymerase Chain Reaction . .............. " . . . . . . . . . . . . . . . . . . . . . . . . . . . . . . . . . . . ......... 17
4.4 Data Analysis........................ ............................... .. ............ ...... 19
4.4.1 Sequencing of COl gene... ... ... ... .. . ...... ...... ...... ...... .. .... ........ 19
4.4.2 Aligmnent.. ... .... ...... ... ............... ... ... ......... ...... ... ........... 21
4.4.3 Genetic Divergence. . . . .. . . . . . . . . . . .. ... . . . . . . . . . .. . . . . . .. .. . . . . . . . ........... 22
4.4.4 Phylogenetic Relationship... ... ...... ... .... .. ...... .................. .... 24
5.0 CONCLUSION AND RECOMMENDATION...... .... .... ................ .. .... .. .. .. ... 27
5.1 Conclusion.......................................................................... ..... 27
5.2 Reconunendation.... . . ................... . ........ . ...................... ... ... .......... 27
6.0 REFERENCES ... ...... . ........ . ................ . .. '" ... .... .. ...... ... ... ... ... ................ 28
APPENDIX .. ....... ....... ..... . ...... .. ... ................ .... ....... .. ............... ... ......... . 34
III
i
,... ,....
~l
Bp
CTAB
COl
CIA
DNA
dNTPs
EtBr
EtOH
MgClz
mtDNA
MI
NaCI
NCBI
PCR
Rpm
TBE
uv
v
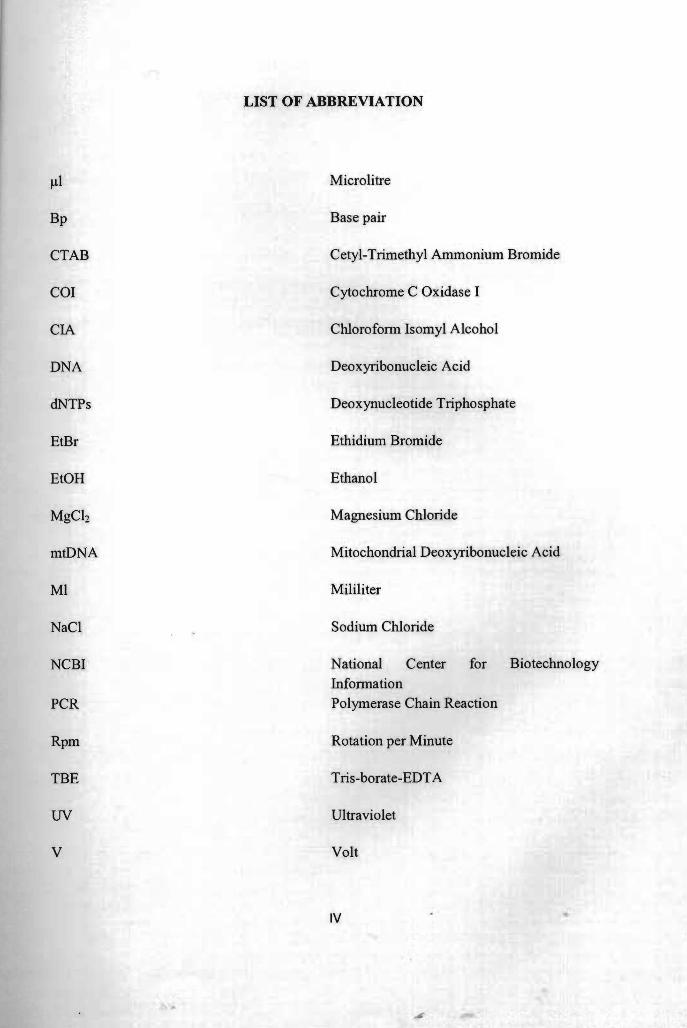
LIST OF ABBREVIATION
Microlitre
Base pair
Cetyl-Trimethyl Ammonium Bromide
Cytochrome C Oxidase I
Chlorofonn Isomyl Alcohol
Deoxyribonucleic Acid
Deoxynucleotide Triphosphate
Ethidium Bromide
Ethanol
Magnesium Chloride
Mitochondrial Deoxyribonucleic Acid
Mililiter
Sodium Chloride
National Center for Biotechnology
Infonnation
Polymerase Chain Reaction
Rotation per Minute
Tris-borate-EDTA
Ultraviolet
Volt
IV

LIST OF TABLES
Table Caption Page
4.1 Optical Density reading for sample of grouper ESMO l-ESM04. 17
4.2 List of COl gene sequence obtained from GenBank along with their 21
accession number.
4.3 Pairwise genetic distance values among genus Epinephelus (%). 22
v
, '"
Figure
2.1
2.2
3.1
3.2
4.1
4.2
4.3
4.4
4.5
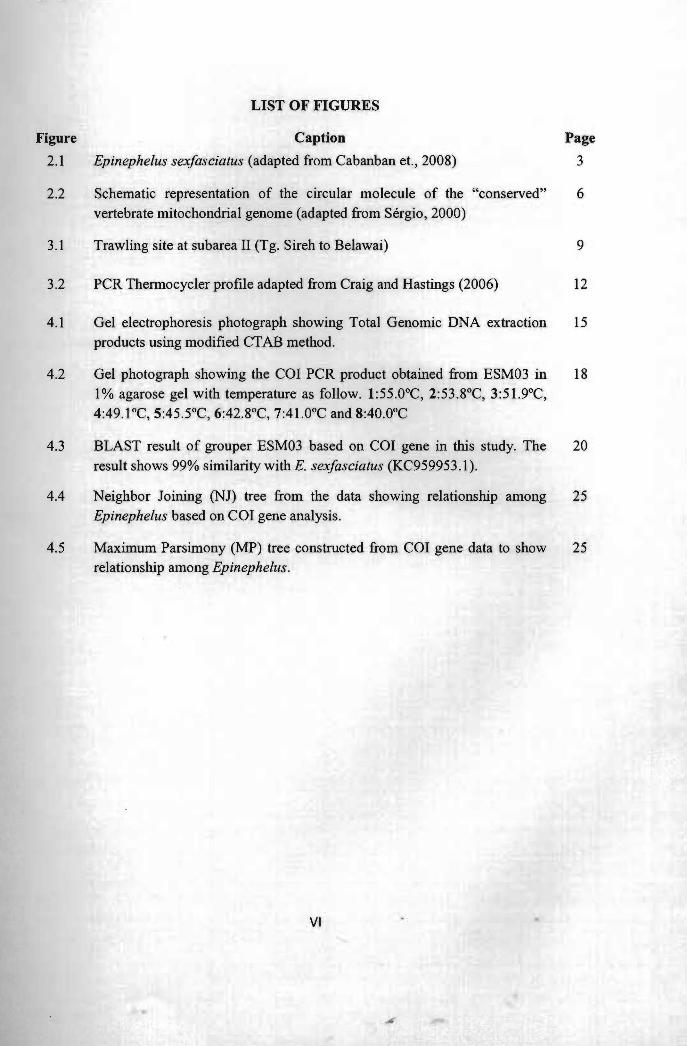
LIST OF FIGURES
Caption
Epinephelus sexfasciatus (adapted from Cabanban et., 2008)
Schematic representation of the circular molecule of the "conserved"
vertebrate mitochondrial genome (adapted from Sergio, 2000)
Trawling site at subarea II (Tg. Sireh to Belawai)
PCR Thermocycler profile adapted from Craig and Hastings (2006)
Gel electrophoresis photograph showing Total Genomic DNA extraction
products using modified CTAB method.
Gel photograph showing the COl PCR product obtained from ESM03 in
1 % agarose gel with temperature as follow. 1:55.0°C, 2:53.8°C, 3:51.9°C,
4:49.1 °c, 5:45.5°C, 6:42.8°C, 7:41.0°C and 8:40.0°C
BLAST result of grouper ESM03 based on COl gene in this study. The
result shows 99% similarity with E. sexfasciatus (KC959953 .1).
Neighbor Joining (NJ) tree from the data showing relationship among
Epinephelus based on COl gene analysis.
Maximum Parsimony (MP) tree constructed from COl gene data to show
relationship among Epinephelus.
Page
3
6
9
12
15
18
20
25
25
)
VI
.. ,... I
LIST OF APPENDICES
Figure Title Page
7.1 - 7.5 Chromatogram of grouper ESM03 sequence. 34 - 36
7.6 Comparison of BLAST results between grouper ESM03 and E. awoara 37 JXI09835.1.
7.7 Comparison of BLAST results between grouper ESM03 and E. tukula 38 10414470.1.
1
VII
I
r= 1
".
Molecular Phylogeny of Grouper based on Cytochrome Oxidase I Gene Analysis
Muhammad Ha ....zie bin Abu Bakar
Aquatic Resource and Management Programme Faculty ofScience and Technology
Universiti Malaysia Sarawak
ABSTRACT
Epinephelus sexfasciatlls (six bar grouper) is a reef-associated species that often known as seafood delicacy in Asian countries. This fish is well-distributed across western Pacific region. Limited molecular data is available for this species, but none came from Malaysia.This study is aimed to sequence COl gene from genus Epinephellls ESM03 followed by determination of the genetic divergence values and phylogenetic analysis. This study involved total genomic DNA extraction, optical density reading, agarose gel electrophoresis, polymerase chain reaction and DNA sequencing as well as data analysis. A total of 496 bp of COl gene from grouper ESM03 had been successfully sequenced and it matched 99% with E. sexfasciatus KC959953.1. Results obtained from this gene showed that there are mutations present in certain base. Pairwise genetic divergence analysis revealed that there is 2.6% of difference between grouper ESM03 and E. sexfasciatus KC959953.l. The phylogenetic trees constructed showed that genus Epinephellis is monophyletic.
Keyword : Epinephelus sexfasciatlls, PCR, COl gene, genetic divergence, monophyletic
ABSTRAK
Epinephelus sexfasciatus (kerapu belang) adalah spesies ikan terumbu yang sering dikenali sebagai makanan laut yang terkenal di negara-negara Asia. Ikan ini sering dijumpai di seluruh rant au Pasifik Barat. Data molekul adalah terhad untuk spesies ini, tetapi masih lagi tiada di Malaysia. Kajian ini bertujuan untuk menentukan urutan gen COl dari genus EpinepIJe/lis ESM03 dan menentukan nilai perbezaan genetik bersama analisi filogenetik. Kajian ini melibatkan penyelidikan protokol biologi molekul iaitu jumlah pengekstrakan DNA genomik, bacaan ketumpatan optik, agarose gel elektroforesis, tindak balas rantai polimerase dan penjujukan DNA serta analisis data. Sebanyak 496 bp gen COl dari kerapu ESM03 berjaya diperolehi dan persamaan sebanyak 99% dapat dibandingkan dengan E. sexfasciatus KC959953.1. Perbezaan genetik menunjukkan bahawa 2.6% perbezaan berlaku antara kerapu ESM03 dan E. sexfasciatlls KC959953.1. Pokok-pokok filogenetik yang dibina menunjukkan bahawa genus Epinephe/us adalah monofiletik.
Kata kunci: Epinephelus sexfasciatus, PCR, gen COl, perbezaan genetic, monofiletik
VIII
1.0 Introduction
The family Serranidae or 'grouper' is a group of predatory marine fishes,
commonly inhabiting coral and rocky reefs (Randall & Heemstra, 1991) in tropical and
subtropical waters around the world (Craig & Hastings, 2006). Jordan and Eigenmann
(1890) as cited by Craig and Hastings, (2006) were among the first taxonomist who had
tried to resolve the relationship within the Serranidae by defining six subfamililies which
are Serraninae, Epinephelinae, Anthiinae, Grarnmistinae, Latinae and Percichthyinae, since
the understanding of relationships within this family is complicated. In order to solve this
complicated problem, studies have been made in terms of preliminary molecular analysis
on the Serranidae (Craig et at., 2001).
Epinephelus sexfasciatus or sixbar grouper is a reef-associated speCIes that is
commonly found on silty, soft sand or mud bottoms (10 to 80 m depth). Its preference for
soft-bottom habitats may account for its restricted distribution and absence at oceanic
islands. The maximum size is listed as 40.0 cm in total length (Kuiter & Tonozuka, 2001)
but more usually 21 cm in standard length (Heemstra & Randall, 1993). Since they are
predatory, they feed of small fish and crustaceans and thus, play important role in food
web as secondary consumer. In Malaysia, they are known as 'kerapu', 'kerapu bebeh' or
'balang' while in Chinese, they often referred as 'siak-ban'. Sixbar grouper is considered
as high price fish category, enjoyed as delicacy and as main source of protein because fish
contributes 60% to 70% of protein which is very important for human growth and
development (Nurul Nadiah et al., 2011).
Heemstra & Randall (1993) stated that this fish is primarily threatened by
overfishing. Although they are small species, it is commonly caught in trawls and often
seen in local markets. In year 2013, statistics from Department of Fisheries Malaysia !
1
f '
(DOFM) stated that from 159, 826 tonnes of total landings of marine fish in Sarawak, only
1, 188 tonnes were 'kerapu'. Average retail price of fresh fish in Sarawak for genus
Epinephelus is RM 15.58lkg. According to International Union for Conservation of Nature
(IUCN), E. sexfasciatus is listed under data deficient because little is known of the biology,
fisheries or their population status.
Studies had been carried out on groupers in Malaysia in terms of nutritional values
(Wan Rosli et al., 2012) and contamination with hydrocarbon (Nurul Nadiah et al., 2011)
but very limited information available on molecular aspect of Epinephelus spp. The
phylogenetic relationships among the fishes in the perciform family Epinephelini
(Serranidae) also have long been poorly understood, in large part because of the numerous
taxa that must be measured and the large distribution of the group (Craig & Hastings,
2006). Although Craig et al. (200 I) presented the first molecular analysis of the grouper as
well as provided evidence for a monophyletic Epinephelinae and paraphyletic of
Cephalopholis and Epinephelus, their studies were only based on limited number of taxa.
Therefore, this study is designed to access genetic information of Epinephelus obtained
from Mukah, Sarawak. The objectives of this study are:
I) To sequence COl gene from Epinephelus sample from Mukah, Sarawak.
2) To determine genetic divergence value between Epinephelus from Mukah and
other Epinephelus from Genbank.
3) To construct phylogenetic tree based on COl gene information.
2
2.0 Literature Review
2.1 Epinephelus sexfasciatus (Valenciennes 1828)
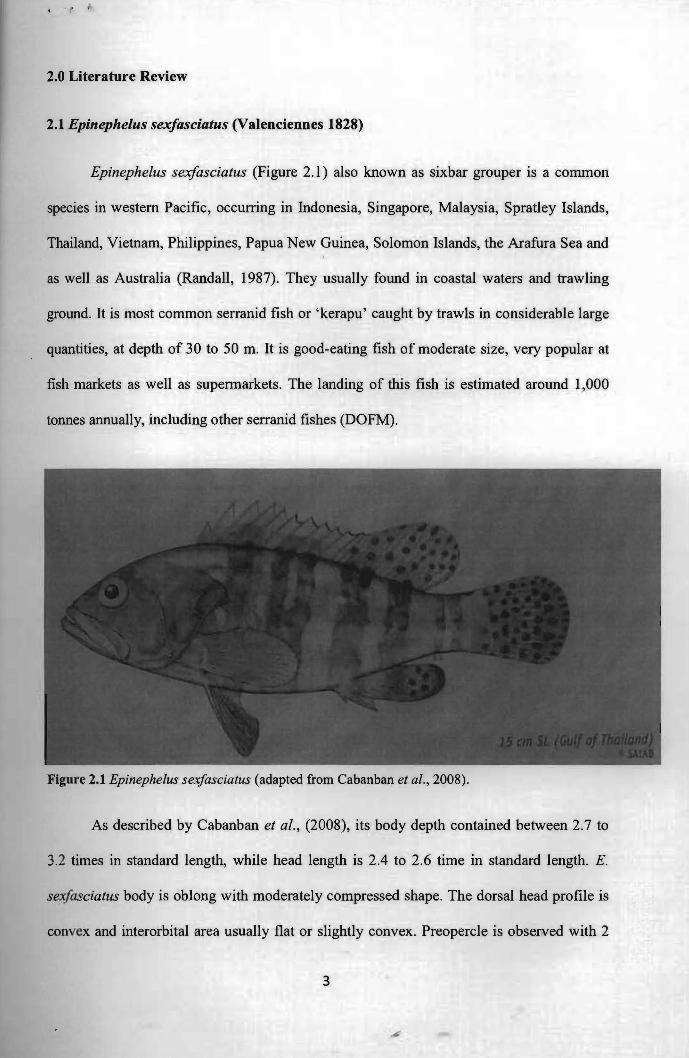
Epinephelus sexfasciatus (Figure 2.1) also known as sixbar grouper is a common
species in western Pacific, occurring in Indonesia, Singapore, Malaysia, Spratley Islands,
Thailand, Vietnam, Philippines, Papua New Guinea, Solomon Islands, the Arafura Sea and
as well as Australia (Randall, 1987). They usually found in coastal waters and trawling
ground. It is most common serranid fish or 'kerapu' caught by trawls in considerable large
quantities, at depth of 30 to 50 m. It is good-eating fish of moderate size, very popular at
fish markets as well as supennarkets. The landing of this fish is estimated around 1,000
tonnes annually, including other serranid fishes (DOFM).
Figure 2.1 Epinephe/us sexfasciatus (adapted from Cabanban et al., 2008) .
As described by Cabanban et aI., (2008), its body depth contained between 2.7 to
3.2 times in standard length, while head length is 2.4 to 2.6 time in standard length. E.
sexfasciatus body is oblong with moderately compressed shape. The dorsal head profile is
convex and interorbital area usually flat or slightly convex. Preopercle is observed with 2
3
to 4 greatly enlaged serrae at the angle and the upper edge of operculum is straight. For the
anterior part, the nostrils of six bar grouper are subequal in size; its maxilla reaches to or
slightly past vertical at rear edge of the eye and also with 2 rows sub equal teeth in
midlateral part of the lower jaw. The total of gill rakers is between 20 to 23, with 7 or 8 on
upper limb and between 13 to 15 on lower limb. The longest gill raker recorded is shorter
than longest gill filaments. The dorsal fm of this grouper consists of 11 spines and 14 to 16
rays approximately and the longest spine is between 3rd or 4th spine, with the length 2.3 to
2.7 times in head length. Anal fin composed of 3 spines and 8 rays and its pectoral fins
does not contain any flesh with 17 to 19 rays, around 1.5 to 1.7 times in length. E.
sexfasciatus has pelvic fin that 1.8 to 2.2 times longer than head length. The caudal
peduncle depth usually about 2.6 to 3.4 times in head length and caudal fin is rounded in
shape. The body is covered with ctenoid scales, with only a few auxiliary scales while
lateral line scales usually counted up to 51 scales. In western Pacific area, the maximum
recorded size of the grouper is 30 em in standard length.
According to Heemstra and Randall (1993), E. sexfasciatus is found on silty, soft
sand or mud bottoms in depth between 10 to 80 m and prey on fish as wen as crustaceans.
In life, head and body of 'kerapu' appeared to be pale grayish brown and consist of 5 dark
brown bars on the body plus 1 on the nape. Dark bars usually more or less divided
vertically by a narrow pale bar, along with scattered pale spots mayor may not present on
the body. Furthermore, there are also some faint small brown spots that are often visible on
the edges of the dark bars.
4
Pusat Kbidmat Maklumat Akademn. UNlVtRSm MALAYSIA SARAWAJ<
2.2 Mitochondrial DNA (mtDNA)
A molecular study has the benefit over biochemical and morphological data due to
accuracy in detecting relationships within the population of various organisms (Esa et al.,
2008). Mitochondrial DNA (mtDNA) has been effectively studied as a molecular marker
for species classification and to detennine the structure of population genetic in a wide
variety of fish phyla (Meyer, 1993). Mitochondrion act as 'power house ' that produce
energy by converting food to a fonn of that cells are able to utilize. Most of DNA is
located in the nucleus, but mitochondria also have a small amount of circular double-
stranded DNA. Other than that, compared to nuclear markers, mtDNA shows a better
estimation of genetic differentiation since it is roughly fourfold more sensitive (Birky et
al., 1983).
During the fertilization, a spenn cell only donates its nuclear DNA to the egg but
never mitochondrial genome. So, the mitochondrion DNA is maternally inherited from the
female egg to both male and female individuals (Strachan & Read, 1999). Moreover, since
the DNA is maternally inherited, mitochondrial DNA has a smaller effective population
size (Liu & Cordes, 2004). According to Luo et aI., (2011), there are several advantages of
using mitochondrial DNA in genetic study such as limited exposure to recombinant, faster
mutation, high copy numbers and lack of introns. When the sample tissue is limited,
mitochondrion can provide a lot of DNA since each mitochondrion consist of several
complete sets of genes (Drake et al., 1998).
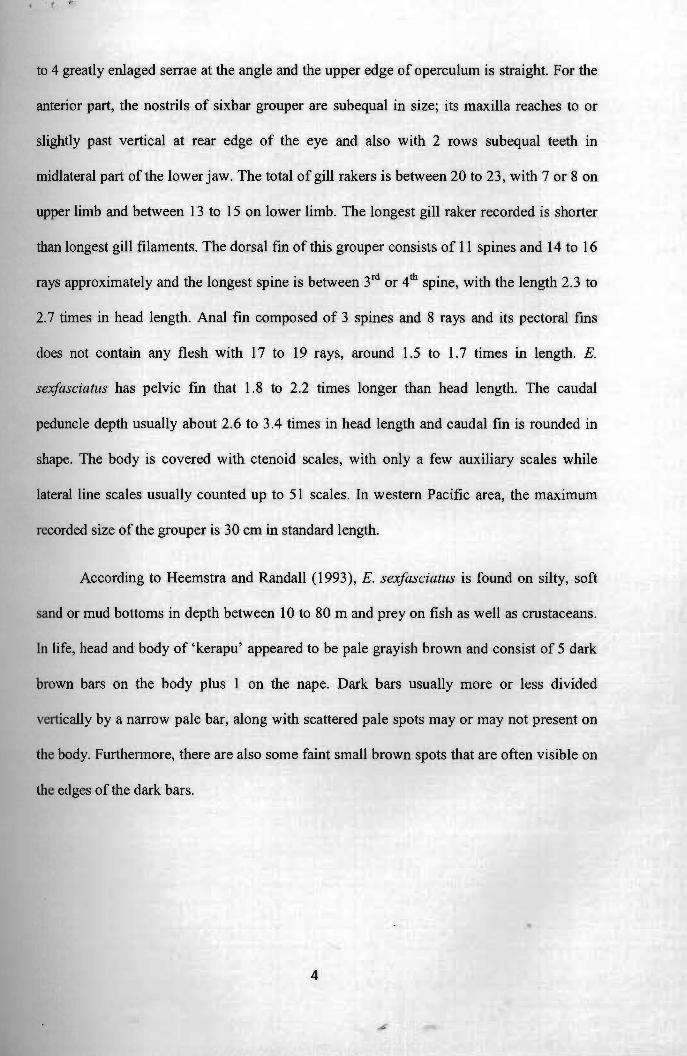
Animal mtDNA mostly consists of 37 genes (Boore, 1999), but only 13 genes are
responsible in oxidative phosphorylation process, while the rest contribute in the making of
molecules called transfer RNA (tRNA) and ribosomal RNA (rRNA). Boore (1999) stated
5
, ,
that there is one non-coding control area called D-Ioop which is the site for mtDNA
replication and transcription of mtRNA.
....... Figure 2.2 Schematic representation of the circular molecule of the "conserved" vertebrate mitochondrial genome (adapted from Sergio, 2000).
6
2.3 mtDNA genetic markers
Molecular genetic studies have become well-known and powerful methods for
assessing population genetics, evolutionary studies, conservation biology and mapping
projects (lame & Lagoda, 1996). In the mitochondrial DNA of vertebrate, the circular
region consist of protein coding genes such as cytochrome b (cyt b), cytochrome c oxidase
subunits (CO I, CO II and CO nn, subunits 1 to 6 of the NADH reductase (NO 1-6), non
protein coding regions involving D-loop control region, 12S rONA and 16S rONA (Sergio,
2000). Moreover, cyt b, CO I-III and NDl-6 are known as conserved markers and used in
different studies (Sergio, 2000). Although mtDNA sequence data have been proved
valuable in determining phylogenetic relationships, the choice of gene used must also be
considered to obtain ideal data (Lunt et at., 1996). D-loop control region usually used in
population studies because of its high variability in nucleotide sequence (Brown et aI.,
1996; Gissi et aI., 1998) and protein coding genes such as cytochrome c oxidase I are
generally used for phylogenetic studies (Sergio, 2000) because COl have greater range of
phylogenetic signal compared to other mtDNA markers (Habeeb & Sanjayan, 2011).
2.3.1 Cytochrome c oxidase I (COl)
DNA barcoding is commonly considered as a dependable, cost-effective and
powerful molecular identification tool with a broad application across wide taxonomic
range, including animals such as birds, fish and insects (Hebert et at., 2004; Ward et aI.,
2005; Hajibabaei et at., 2006). However, Frezal and Leblois (2008) claimed that the main
problem of DNA barcoding is to find the suitable gene sequence that allows robust and
repeatable amplification and sequencing, and can differentiate between species. COl gene
known as single, short sequence of mtDNA which is capable to code a large
7
transmembrane protein found in the mitochondrion which is greatly preserved among
species. In the respiratory chain, cytochrome c oxidase protein acts as tenninal electron
acceptor in the reduction ofoxygen to water (Waugh, 2007).
Hebert et al. (2004) argued in favor of a 5' fragment of the mitochondrial gene for
COl gene as universal marker because of its two main advantages. First, the universal
primers for this gene are very robust, enabling recovery of its 5' fragment from most
organisms in animal phyla (Folmer et aI., 1994; Zhang & Hewitt 1997). Secondly, COl
appears to have a broad range of phylogenetic signal than any other mitochondrial gene
(Habeeb & Sanjayan, 2011). In fact, compared to 12S and 16S rONA, COl has three times
faster molecular evolution rate because of its third-position nucleotides show a high
incidence of base substitutions (Knowlton & Weigt, 1998). Moreover, the evolution of
COl gene is fast enough to allow differentiation of phylogeographic groups within a single
species (Cox & Hebert, 2001).
In the study by Persis et aI., (2008), 28 Indian carangid fish species were identified
and the result of COl gene sequence analysis stated that all the 28 fish species belong into
five distinct groups, which are genetically far between each other and shows identical
phylogenetic reservation. Even though COl may be competing with other mtDNA genes in
recent years, this gene is more likely to provide deeper phylogenetic connections because
the changes of its amino acid sequence occur more slowly (Lynch & Jarrell, 1993).
8
.'
3.0 Materials and Methods
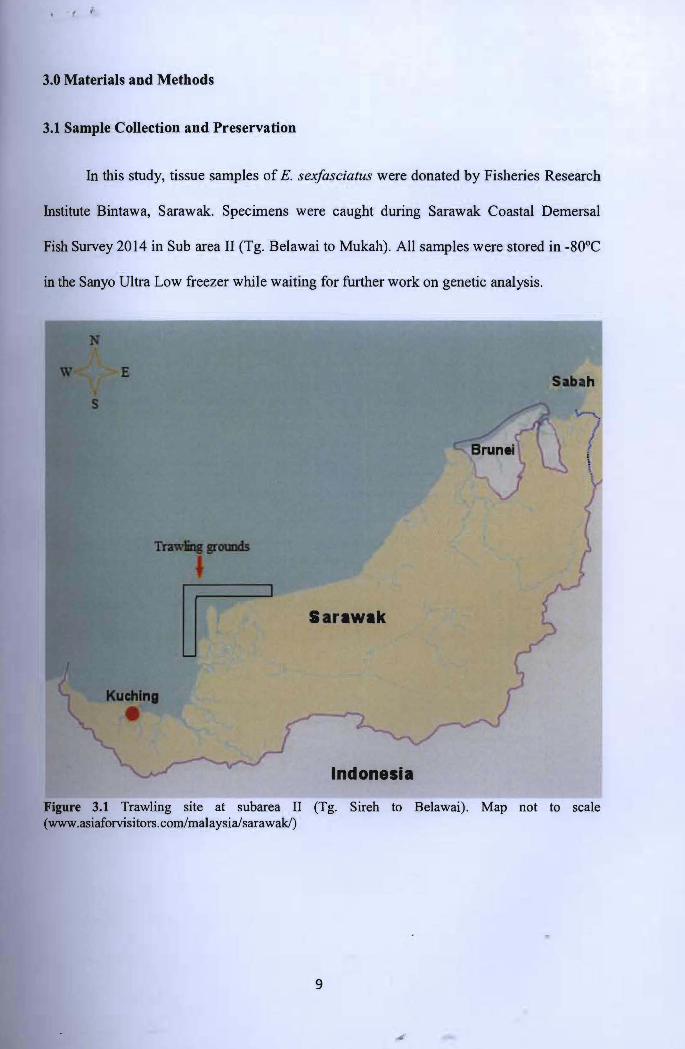
3.1 Sample Collection and Preservation
In this study, tissue samples of E. sexfasciatus were donated by Fisheries Research
Institute Bintawa, Sarawak. Specimens were caught during Sarawak Coastal Demersal
Fish Survey 2014 in Sub area II (Tg. Belawai to Mukah). All samples were stored in -80°C
in the Sanyo Ultra Low freezer while waiting for further work on genetic analysis.
ah
Sarawak
Indonesia
Figure 3.1 Trawling site at subarea II (Tg. Sireh to Belawai). Map not to scale (www.asiaforvisitors.com/malaysia/sarawak/)
9
-------
3.2 Laboratory work
3.2.1 DNA Extraction
Total genomic DNA was extracted using modified version of CTAB protocol
(Doyle & Doyle, 1987) with the presence of Proteinase K. 0.5 mg of sample was minced
into small pieces using a stainless steel scalpel and was placed into 1.5 ml Eppendorf tube.
A total of 700 III of 2xCT AB buffer and 5 III of Proteinase K were added into the tube.
Sample was incubated in waterbath Protech 903 at 60°C for 2 hours. After the incubation,
700 III of CIA was added into tube and was centrifuged using refrigerated high speed
microcentrifuge Hitachi, Himax CF 15RX at 15000 rpm in 4°C for 15 minutes. The upper
aqueous phase was transferred into a new tube. Absolute ethanol with the same volume to
aqueous phase was added into the tube and mixed well. Tube was incubated overnight at
20°C in the freezer. After incubation, sample was centrifuged at 13000 rpm in 4°C for 15
minutes. Excess ethanol was removed from the tube with micropipette. A total of 500 III of
70% cold ethanol were pipetted into the tubes. Sample was centrifuged again at 13000 rpm
and 40C for 15 minutes. Excess ethanol was removed completely and the pellet was air
dried on the bench. Lastly, 50 III of deionized water was added into the tube and kept in
200C freezer for further analysis. All DNA extraction products were subjected to 1%
agarose gel electrophoresis pre-stained with EtBr to confirm the presence of DNA.
3.2.2 DNA Quantification
The occurrence of DNA was detected by using (i) 1 % agarose gel electrophoresis
(AGE) and (ii) spectrophotometery. AGE was prepared by mixing 0.5g of agarose powder
with 50ml Tris-acetate-EDTA (TAE) solution and mixed well. After that, the mixture was
heated in the Panasonic microwave oven at medium high temperature for 3 minutes. Then,
10
of " .
the solution was transferred into a contaminated beaker and 1 drop of Ethidium bromide
(EtBr) was added into the beaker. The solution was mixed well and poured into a gel tray
with comb for the well. The agarose mixture was left on the bench at room temperature for
30 minutes to let it solidify. After that, the container was filled with T AE solution until the
maximum level indication. For DNA ladder, 2111 of DNA ladder (lkb) was mixed with 2111
of loading dye and pipetted into the left well. For the DNA, 5111 of DNA was mixed with
1111 of loading dye and pipetted into the well. The gel was run with 90 V for 1 hour and
viewed under UVP, High performance UV Transilluminator to determine the presence of
DNA bands. The DNA isolated from the fish was later used in the PCR.
3.2.3 OD reading
The concentration of the extracted DNA was checked by adding 5111 of DNA to
495J.l of sterile deionized water to achieve 100 times dilution factor before checking its
optical density at 260 and 280 nm using Ultraspec® 100 Pro spectrophotometer.
3.2.4 Polymerase Chain Reaction
The polymerase Chain Reaction (PCR) was used to amplify approximately 500-600
bp of COl gene. PCR amplifications were carried out in a total volume of 25 III solution
containing 1 III of DNA template, 9 III of deionized distilled water (ddH20) and 15 III of
Master Mix. The PCR cocktails of 15 ).1.1 reagents which comprises of 5 III of PCR buffer, 5
J.ll of MgCh, 0.5 III of Taq polymerase, 2.5 III of dNTPs mix, 1.0 III for both reversed and
forward primer which are COle-H foward (5'- CCA GAG ATT AGA GGG AAT CAG TG
11
t ..
-3') and COIf-L reversed (5'- CCT GCA GGA GGA GGA GAY CC -3') as suggested by
Palumbi (1996).
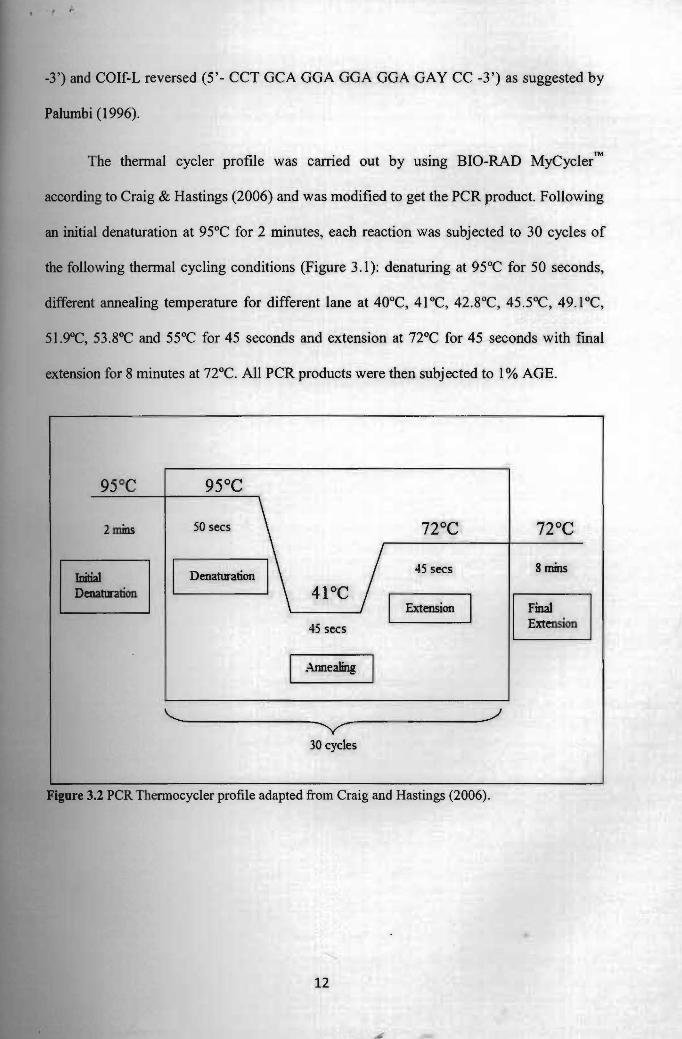
The thermal cycler profile was carried out by usmg BIO-RAD MyCyclerTM
according to Craig & Hastings (2006) and was modified to get the PCR product. Following
an initial denaturation at 95°C for 2 minutes, each reaction was subjected to 30 cycles of
the following thermal cycling conditions (Figure 3.1): denaturing at 95°C for 50 seconds,
different annealing temperature for different lane at 40°C, 4 1°C, 42.8°C, 45.5°C, 49.1°C,
51.9"<:, 53.8°C and 55°C for 45 seconds and extension at noc for 45 seconds with fmal
extension for 8 minutes at n°c. All PCR products were then subjected to 1 % AGE.
50 sees2mins
~I 8 mins45 seesDenaturation
~ ~.--------~ Extension ~
4S sees ~ Annealing
~--------------- ------------~~-V30 cycles
Figure 3.2 PCR Thermocycler profile adapted from Craig and Hastings (2006).
12
• I
3.2.5 Sequencing
The PCR products were sent to First BASE Laboratories Sdn. Bhd. for DNA
sequencing for both forward and reverse strands.
3.2.6 Data analysis
The DNA sequencing result was visualized using CHROMAS PRO program. All
data sequences were subjected to Basic Local Alignment Search Tool (BLAST) to confinn
the sequence. The sequences were aligned using Clustal X program with default settings
(Thompson et ai., 1997). The data was analyzed by using Molecular Evolutionary Genetic
Analysis (MEGA) program (Tamura et ai., 2007) to calculate the pairwise genetic distance
and construct the phylogenetic tree.
13
Recommended