Mokogwu, Ikechukwu (2011) Generation and migration of oil from perhydrous Longyear coal. MSc(Res) thesis, University of Nottingham.
Access from the University of Nottingham repository: http://eprints.nottingham.ac.uk/12382/3/Generation_and_Migration_of_Oil_from_Perhydrous_Longyear_Coal.pdf
Copyright and reuse:
The Nottingham ePrints service makes this work by researchers of the University of Nottingham available open access under the following conditions.
This article is made available under the University of Nottingham End User licence and may be reused according to the conditions of the licence. For more details see: http://eprints.nottingham.ac.uk/end_user_agreement.pdf
For more information, please contact [email protected]
1
Generation and Migration of Oil from Perhydrous
Longyear Coal
by
Ikechukwu Mokogwu (BSc. Hons)
A thesis submitted as part of the requirements for the Degree of Master of Science (by Research)
in
Petroleum and Environmental Process Engineering
University of Nottingham
September 2011

2
ACKNOWLEDGEMENT
I would like to express my unreserved appreciation to my project supervisor; Dr. David
Large for his patience and careful guidance throughout the course of this research.
Special thanks to Dr. Clement Uguna who painstakingly guided me through all the
experimental procedures. Dr. Will Meredith, Archibald Vikki and Chris Marshall were also
extremely helpful during this period.
Gratitude goes to my brothers and parents, Mr. and Mrs. Mokogwu for their financial and
moral support.
Finally, I would like to thank all my friends; Eghosa, Dami, Stella, Akin, Bolaji, Samuel,
Tobi and the Pastors and members of Harvest Chapel Nottingham for their
encouragement and support.
3
ABSTRACT
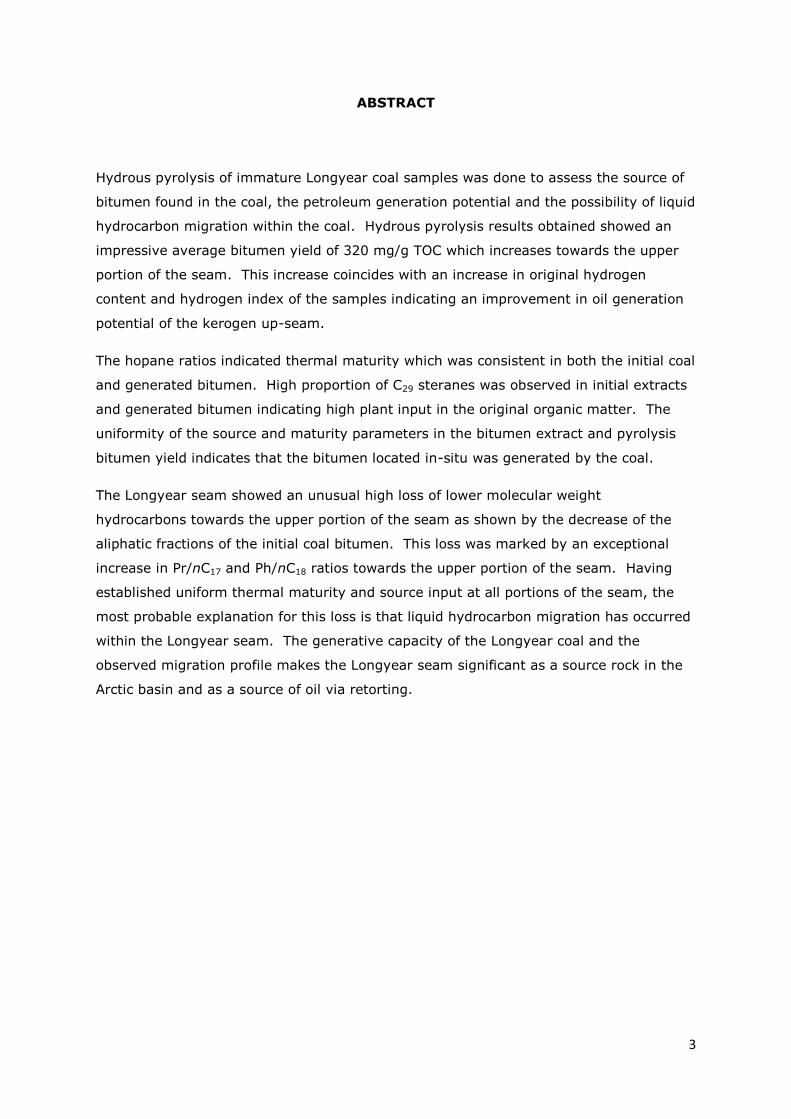
Hydrous pyrolysis of immature Longyear coal samples was done to assess the source of
bitumen found in the coal, the petroleum generation potential and the possibility of liquid
hydrocarbon migration within the coal. Hydrous pyrolysis results obtained showed an
impressive average bitumen yield of 320 mg/g TOC which increases towards the upper
portion of the seam. This increase coincides with an increase in original hydrogen
content and hydrogen index of the samples indicating an improvement in oil generation
potential of the kerogen up-seam.
The hopane ratios indicated thermal maturity which was consistent in both the initial coal
and generated bitumen. High proportion of C29 steranes was observed in initial extracts
and generated bitumen indicating high plant input in the original organic matter. The
uniformity of the source and maturity parameters in the bitumen extract and pyrolysis
bitumen yield indicates that the bitumen located in-situ was generated by the coal.
The Longyear seam showed an unusual high loss of lower molecular weight
hydrocarbons towards the upper portion of the seam as shown by the decrease of the
aliphatic fractions of the initial coal bitumen. This loss was marked by an exceptional
increase in Pr/nC17 and Ph/nC18 ratios towards the upper portion of the seam. Having
established uniform thermal maturity and source input at all portions of the seam, the
most probable explanation for this loss is that liquid hydrocarbon migration has occurred
within the Longyear seam. The generative capacity of the Longyear coal and the
observed migration profile makes the Longyear seam significant as a source rock in the
Arctic basin and as a source of oil via retorting.
4
TABLE OF CONTENT
ACKNOWLEDGEMENT i
ABSTRACT ii
LIST OF FIGURES vi
LIST OF TABLES vii
1 INTRODUCTION
1.1 Background 1
1.2 Aims of study 3
1.3 Objectives 3
2 LITERATURE REVIEW
2.1 Coal Formation 4
2.2 Petroleum generation and migration from coal 6
2.3 Coal as a source rock for oil 9
2.4 Characterising Oil prone coals 9
2.4.1 Coal petrography and coal macerals 10
2.4.1.1 The vitrinite group 11
2.4.1.2 The liptinite group 11
2.4.1.3 The inertinite group 12
2.4.2 Coal maturity and maturity parameters 13
2.4.2.1 Vitrinite reflectance (VR/R0) and Hydrogen index 13
2.4.3 Biological markers 14
2.4.3.1 Hopanes 15
2.4.3.2 Steranes 16
2.4.3.3 Isoprenoids and n-alkanes 18
5
2.5 Geography of the study area 19
2.6 Geological setting of the investigated region 20
2.7 The Longyear seam 24
3 EXPERIMENTAL TECHNIQUES AND METHODS
3.1 Experimental techniques 26
3.1.1 Gas Chromatography (GC) 26
3.1.2 Gas chromatography-mass spectrometry (GC-MS) 27
3.1.3 Hydrous pyrolysis technique 28
3.2 Experimental methods 29
3.2.1 Samples studied 29
3.2.2 Vitrinite reflectance and maceral composition determination 30
3.2.3 Elemental analysis of the samples 31
3.2.4 Hydrous Pyrolysis 31
3.2.5 Recovery and analysis of generated gas 33
3.2.6 Recovery generated bitumen 33
3.2.7 Separation of bitumen into fractions 34
3.2.8 Gas chromatography mass spectrometry (GC-MS)
analysis of aliphatic fractions 34
4 RESULTS AND DISCUSSION
4.1 Elemental composition of Longyear coal 36
4.2 Gas yields 41
4.3 Bitumen yields 43
4.4 Bitumen composition 48
6
4.5 Biological marker distribution in the aliphatic fraction of Longyear
Coals 50
5 CONCLUSIONS AND FUTURE WORK
5.1 Conclusion 58
5.2 Future work 59
REFERENCES 60
APPENDICES
Appendix A Figures 68
Appendix B Calculations 88
7
LIST OF FIGURES
Figure 2.1: Hopanes and associated stereoisomers 16
Figure 2.2: Steranes and associated stereoisomers 17
Figure 2.3: Pristane structure 18
Figure 2.4: Phytane structure 18
Figure 2.5: The Svalbard archipelago 20
Figure 2.6: Topographic Map of Svalbard 21
Figure 2.7: The geologic map of Spitsbergen central basin 22
Figure 2.8: The stratigraphic units of the central basin 23
Figure 2.9: The stratigraphic generalised column of the central basin 24
Figure 2.10: The lithologic section of the Basilikaelva section of the
Firkanten formation showing the Todalen member 25
Figure 3.1: Schematic diagram of a gas chromatograph 26
Figure 3.2: Schematic diagram of the gas chromatograph-mass spectrometer 27
Figure 3.3: Experimental configurations for the pyrolysis experiments 28
Figure 3.4: A typical hydrous pyrolysis experimental setup 29
Figure 3.5: The Parr 4740 series hastalloy cylindrical reactor vessel 32
Figure 3.6: Pressure gauge showing the inlet/outlet and valve 32
Figure 3.7: Soxhlet extraction setup 34
Figure 4.1: Hydrogen content of initial Longyear samples at different depths
showing the perhydrous line 36
Figure 4.2: The vitrinite reflectance and hydrogen content profiles of the Longyear
seam 37
8
Figure 4.3: Hydrogen content of the Longyear coal samples showing a decrease in
hydrogen content with hydrocarbon generation 39
Figure 4.4: Changes in the TOC content change with depth of Longyear coals
at various stages of maturity 40
Figure 4.5: TOC content change with depth of the Longyear coals at various
stages of simulated maturity 40
Figure 4.6: Total gas yields of the Longyear seam at various depths 42
Figure 4.7: Changes in generated gas yields with depth of the Longyear seam 42
Figure 4.8: C1-C4 gas fractions of the Longyear coals at different depths 43
Figure 4.9: Bitumen yields from extracted Longyear coal samples at
different sample sizes 44
Figure 4.10: Changes in bitumen yield with seam depth 44
Figure 4.11: Hydrous pyrolysis yields from Longyear coals samples at various
Depths 45
Figure 4.12: Comparism between HI and bitumen yield of the Longyear coal
samples 47
Figure 4.13: Percentage composition of each fraction in extracted bitumen at
various depths 48
Figure 4.14: Change in aliphatic yields from initial coal extracts with depth of the
seam 49
Figure 4.15: Percentage composition of each fraction in generated bitumen at
various depths 50
Figure 4.16: Tri-plot of the C27, C28 and C29 steranes 52
Figure 4.17: Pr/nC17 trend with depth in the aliphatic fraction of initial coal bitumen
Extract 57
9
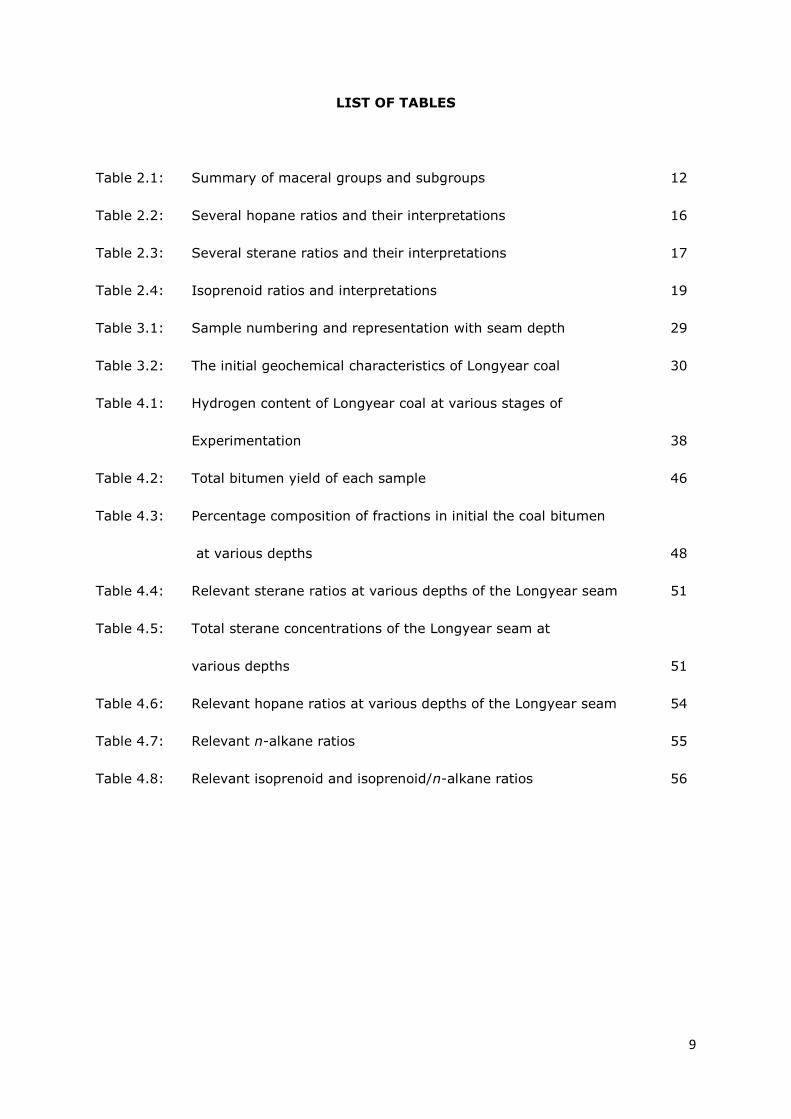
LIST OF TABLES
Table 2.1: Summary of maceral groups and subgroups 12
Table 2.2: Several hopane ratios and their interpretations 16
Table 2.3: Several sterane ratios and their interpretations 17
Table 2.4: Isoprenoid ratios and interpretations 19
Table 3.1: Sample numbering and representation with seam depth 29
Table 3.2: The initial geochemical characteristics of Longyear coal 30
Table 4.1: Hydrogen content of Longyear coal at various stages of
Experimentation 38
Table 4.2: Total bitumen yield of each sample 46
Table 4.3: Percentage composition of fractions in initial the coal bitumen
at various depths 48
Table 4.4: Relevant sterane ratios at various depths of the Longyear seam 51
Table 4.5: Total sterane concentrations of the Longyear seam at
various depths 51
Table 4.6: Relevant hopane ratios at various depths of the Longyear seam 54
Table 4.7: Relevant n-alkane ratios 55
Table 4.8: Relevant isoprenoid and isoprenoid/n-alkane ratios 56
10
CHAPTER ONE
INTRODUCTION
1.1 Background
Abundant perhydrous (~6 wt% H) coal deposits are located within Spitsbergen, in the
high latitude Svalbard archipelago of Norway. These coal deposits are very rich in
terrestrially derived organic matter and are believed to be oil prone (Cmiel and
Fabianska, 2004; Orheim et al., 2007). The oil content of these coals has the potential
to enhance their value both directly as a source for oil via retorting and indirectly as a
petroleum source rock in the Arctic basin. As little is known about the oils present in
these coals, this project will determine:
1. The origin of the oil present in the coals
2. Whether the oil has migrated within the coal sequence
The first is essential as it has not been proven that the oil comes from the coal. The
second question is also essential as migration within the coal could give a misleading
impression of the oil potential of the coals.
The interest in coal as a hydrocarbon source has been renewed in the wake of a steady
increase in global energy demands. Soaring oil prices have re-established the need for
more rigorous oil prospecting, new field development and proper characterisation of
existing hydrocarbon reserves. As these energy concerns continue to grow, the need for
the efficient utilisation of alternative fossil fuel sources such as coal is also being brought
into focus. The relevance of coal as a natural resource goes beyond its energy
generating capability. In recent times, scientists have developed a very strong scientific
opinion on coal and its ability to generate and expel liquid hydrocarbons in geologic
basins. This has resulted in coal deposits being classified based on their calorific value,
oil generation and hydrocarbon source rock potential. However, greater research
emphasis is now being laid on the source rock potential of coals. This is because of the
discovery of several large coal-sourced oil deposits around the world (Klerk, 2009;
Powell et al., 1991).
Previous investigative studies have yielded positive results in the area the source rock
capabilities of coal and several coal sourced oil deposits have been recognised (Larter,
1995). The most significant coal-sourced oil deposits are found in the Grippsland and
Cooper basins in Australia, the Beaufort-Mackenzie basin in Canada, the Turpan basin in
China and the Taranaki basin in New Zealand (Czochanska et al., 1988; Issler and
11
Snowdon, 1990; Moore et al., 1992; Vincent et al., 1985). Nevertheless, these
discoveries have not put to rest the prolonged scientific debate that coal can serve as a
source rock for liquid hydrocarbons. The factors that determine the formation and
existence of oil prone coals are yet to be clearly understood. The isolated patterns of
these discoveries and the heterogeneous nature of coal deposits have not favoured the
argument that coal can act as a source rock for liquid hydrocarbons. Hence, several
workers still maintain the opinion that coal could at best still be a source of gaseous
hydrocarbons (van Krevelen, 1982).
The perhydrous and oil prone nature of the Svalbard coal deposits offers a unique
prospect for investigating and understanding the conditions and controls responsible for
the formation of oil prone coals. Better understanding of these controls can be attained
by examining the nature and composition of the oil found within these coal deposits.
However, the primary challenge will be to determine whether the oil present in the
Svalbard coal was originally derived in-situ or has migrated into the coal sequence from
a nearby organic sedimentary sequence. This could be ascertained by biomarker
analysis and by simulating the oil generation process in coal using the hydrous pyrolysis
technique (Carr et al., 2009; Lewan, 1997). Although pyrolysis could be hydrous or
anhydrous (absence of water), adopting the hydrous pyrolysis technique will be more
suitable for this study because of its ability to generate higher yields of oil and bitumen
for analysis. Comparing biological marker compositions in the oil extracted from the coal
before hydrous pyrolysis with the oil obtained from hydrous pyrolysis will be definitive in
determining the source and depositional environment of the oil present in the coal.
The understanding of these controls often finds relevance in oil exploration and in
characterising the nature and quantity of oil in reservoirs that are sourced from coals.
Geologists have the task of making exploration decisions based on whether or not oil has
been generated from coal in a basin. A thorough understanding of oil migration patterns
will help to open up new plays and reduce exploration cost as the risk of drilling dry wells
could be reduced. The nature and composition of the oils if ascertained will play a key
role in business decision making and production economics. Oil rich bituminous coals
are also a strong target for coal liquefaction (Klerk, 2009).

12
1.2 Aim of study
To ascertain if the bitumen present in the Svalbard coal was generated by the coal and
to investigate the possibility of migration of such oils within the sequence.
1.3 Objectives
To evaluate the source of the oil present in the coal and to identify any changes
in its nature of using biomarker analysis.
To determine the amount of bitumen or oil that can be generated from Svalbard
coal using hydrous pyrolysis and soxhlet extraction.
To measure the changes in bitumen composition, concentration and nature from
the bottom to the top of the coal seam.
To assess oil migration by noting the changes in bitumen volume, composition
and identifying changes in relevant biomarker concentrations within the aliphatic
fractions of the extracted bitumen.
13
CHAPTER TWO
LITERATURE REVIEW
The factors responsible for the formation of oil prone coals will be better understood if
several fundamental concepts are established. These concepts include; coal formation,
its petrographic properties and organic constituents. The most widely accepted
parameters that serve as pointers to oil proneness also need to be defined. General
considerations on petroleum generation and the possibility of oil migration within a coal
sequence will be accessed. The geology and geography of the study region will be
reviewed in order to determine what role these have played in the origin of perhydrous
coals in the region.
2.1 Coal Formation
The word coal is derived from the Greek word “col” and represents a readily combustible
rock containing more than 50 weight % and more than 70 volume % of carbonaceous
material (Tatsch, 1980). Coal is an organically formed sedimentary rock, composed
mainly of decayed and lithified plant remains. It is derived from the rapid accumulation
and burial of land derived (terrestrial) plant materials in a specialised depositional
environment known as a sedimentary basin (Morris, 1998). Most coals are formed under
non-marine conditions and result from the accumulation of freshwater or lacustrine
sediments. The original sediment formed by this process is a damp, spongy material
called peat. This later becomes dried, compressed and modified both in composition and
texture due to the overburden pressure associated with burial (Ward, 1984). Different
kinds of peat originate as a result of varying original material and burial conditions. This
eventually leads to the formation of different kinds of coals. The formation of peat is
governed by certain controls. These controls are a combination of geologic, geographic,
biochemical and geochemical aspects (Tissot and Welte, 1984).
Peat formation is facilitated by the presence and rapid accumulation of large amounts of
plant materials. This sort of accumulation depends on the efficiency of photosynthesis
(Ward, 1984). Plant productivity on land became possible for the first time after the
evolution of higher plants during the Devonian period (350-401 million years ago). This
allowed the production of the necessary biomass for the formation of peat which
flourished during the Carboniferous period (Ward, 1984). Teichmüller and Teichmüller
(1982) are of the opinion that the conditions necessary for the formation of thick peat
deposits and invariably coal seams are:
14
A slow, steady and continuous rise of the groundwater table i.e. subsidence,
Adequate protection of the swamp area (by sand bars, spits etc.) against major
floods by sea and flood waters from rivers, and
A low energy relief which would restrict the supply of river sediments which could
hinder the peat formation process.
Previous studies by Dallmann (1993) revealed that these kinds of conditions operated in
the early Svalbard basin. However, coal seam formation generally depends on the
palaeogeographical and structural interactions within the sedimentary region
(Teichmüller and Teichmüller, 1982). Although the tectonic setting is similar to that for
the formation of petroleum, the source lithofacies involved differ (Teichmüller, 1989;
Ward, 1984).
Mechanical breakage, biochemical and geochemical processes are initiated soon after the
accumulation of dead plant remains. Biochemical changes take place at the surface
under oxidizing conditions but as burial depth increases, the presence of stagnant water
causes reducing conditions to prevail (Ward, 1984). At this point, the PH ranges from
neutral to slightly acidic and the acidity increases with burial depth (Teichmüller and
Teichmüller, 1979). The degree of acidity also depends on the original plant material.
The acidity of peat plays an important role in determining the rate of bacterial activity as
highly acidic conditions hinder the activity of bacteria (Teichmüller and Teichmüller,
1982). Although Teichmüller and Teichmüller (1982) argue that microbial activities play
a prominent role in the initial stage of peat formation only, the ultimate peat
characteristic is determined by the type and composition of the parent organic material
known as kerogen (Tissot and Welte, 1984). In a situation where the peat is derived
from abundant hydrogen-rich land-plant debris, such peat will mature to coals that will
have the capacity to generate liquid hydrocarbons. This is believed to be the case of the
Svalbard coals and some Australian coals (Larter, 1995).
A combination of geochemical and geologic processes eventually pave the way for
coalification which is the physical and chemical conversion of peat into various types of
coal due to the action of temperature, pressure, time and biochemical interactions (Orem
and Finkelman, 2003). The degree of coalification is proportional to the intensity of the
above mentioned factors. The common terms peat, brown coal, bituminous coal and
anthracite represent various levels of the coalification series (Teichmüller and
Teichmüller, 1979; Thomas, 1992). These stages of coalification are referred to as
levels of rank which serve as an indication of the progression of peat all the way to
anthracite coal (Tissot and Welte, 1984). Increasing rank (i.e. from peat to anthracite)
is characterised by a decrease in moisture content and an increase in calorific value
(Teichmüller and Teichmüller, 1982). According to Hunt (1979), the process of
15
maturation is what converts the immature organic matter in source rocks to oil and gas
and for coals, this would occur during the initial stages of coalification (Hunt, 1991;
Larter, 2011). Thermal maturity of a coal or any source rock depends on the interplay of
the previously mentioned factors. This will eventually affect their ability to generate and
expel liquid hydrocarbons.
2.2 Petroleum generation and migration from coal
The processes that yielded hydrocarbons within the Svalbard coals have not been
previously defined. However, these processes would not differ greatly from the ideas
already expressed by several scientists that petroleum generation from a source rock is
as a result of kerogen maturation. Kerogen which is the naturally occurring, dense,
insoluble organic matter composition of a source rock is the vital raw material for
hydrocarbon generation (Vandenbroucke and Largeau, 2007). Kerogen represents the
most abundant strain of organic matter on the earth and is the major component of
coals, shales and source rocks. The possibility and ease with which an organic matter
rich sedimentary rock will expel liquid hydrocarbons is dependent on the original
constituents of the kerogen (Van Krevelen, 1984). Conventional organic constituents of
kerogen are woody plant material (terrestrial origin) and algae (marine origin).
Kerogens are described as Type I when they contain mainly algal constituents and Type
III when they have a greater proportion of woody plant materials. Type II kerogens fall
in between the woody and algal composition having a mixture of the terrestrial and
marine (Vandenbroucke and Largeau, 2007). Coal is typically characterised as a type III
kerogen.
Hydrocarbon generation in coal occurs as a result of thermal decomposition of kerogen.
The chemical and physical changes which occur in coal as a result of increasing
temperature and pressure with burial lead to coalification and increase in coal rank
(Ward, 1984). Geochemical changes such as the increase in carbon and relative
decrease in elemental oxygen and hydrogen also take place (Tissot and Welte, 1984).
The result of these changes is an increase in aromaticity, elimination of functional groups
and decrease in the chain-like structures on coal. These considerations signify a loss in
carbon, oxygen and also hydrogen resulting in the release of hydrogen and oxygen rich
carbon containing molecules (Tissot and Welte, 1984). This process typically gives rise
to low molecular weight volatiles and mainly gases which are widely regarded as the
actual hydrocarbon generating capacity of coals (Hunt, 1991; Isaksen et al., 1998;
Larter, 1995; Sykes and Snowdon, 2002). However, Tissot (1969) is of the opinion that
higher molecular weight hydrocarbons and oils are also generated during this process.
16
These findings are backed up with examples of liquid hydrocarbon accumulations that
linked to coal as reported by (Czochanska et al., 1988; Issler and Snowdon, 1990;
Moore et al., 1992; Vincent et al., 1985).
Oil and gas accumulations are mainly located in relatively coarse-grained permeable and
porous sedimentary rocks which contain very a little amount of organic matter (Hunt et
al., 1967). It is highly unlikely that the huge volumes of petroleum found in these rocks
have originated in them from organic matter which would leave no trace or remains.
Hence it can be concluded that the point of petroleum origin is not identical with the site
where it is located in economically exploitable quantities. Under geologic conditions and
geochromatographic effects, generated oil has the tendency to move horizontally or
vertically through the coal sequence and accumulate in pools (Huang, 1999).
Petroleum migration can be defined as the movement of hydrocarbons generated by a
source rock in a thermal maturation process from the parent to the carrier strata (Zhao
and Cheng, 1998). The initial movement (typically up to a maximum of a few hundred
metres) of newly generated hydrocarbons out of the source rock which is synonymous
with expulsion is termed primary migration. Further movement of hydrocarbons into a
more permeable porous rock unit, or basin of accumulation is termed secondary
migration (Huang, 1999; Tissot, 1988). Secondary migration eventually leads to the
separation of oil and gas in selected parts of these rocks (Hunt, 1979). In several cases,
liquid and gaseous hydrocarbons could migrate through fine-grained sedimentary rocks
like mudstones or a coal sequence. Such a case has been reported in the Gulf of Mexico
where petroleum migrates vertically through a mudstone sequence assisted by very high
pressure (Larter, 2011). This could also be the case in Svalbard because of the
unusually high concentrations of bitumen found in the coals. Three major viewpoints
have dominated the research of petroleum migration from coal:
The initial view is that oil from coal cannot migrate out of the coal matrix.
Migration would occur only when the generated oil is cracked into smaller
hydrocarbon gas molecules (Durand, 1983; van Krevelen, 1982).
Migration of oil can only occur under a combination of very stringent conditions.
The coal pore structure and the maceral composition being the most important
conditions (England, 1993; Powell, 1986).
Coals expel oil readily even with greater ease than mudstones (Huang, 1999; Huc
and Hunt, 1980).
Petroleum migration is actually the most important factor in determining whether and to
what extent a coal sequence has given rise to liquid hydrocarbons (Wilkins and George,
2002). The viewpoint of several workers is that there are some major controlling factors
17
responsible for the migration of oil from coal (Huc and Hunt, 1980; Hunt, 1979; Killops
et al., 1998; Zhao and Cheng, 1998). These factors are broadly classified into the
distribution characteristics of the coal pore and the external tectonic stresses (Zhao and
Cheng, 1998). The distribution characteristics relate directly to the coal structure and
porosity which is as a result of the maceral composition and maceral associations.
Despite the heterogeneity and complexity of coal macerals, coals generally exhibit a
porous microstructure. This microstructure has a significant influence on the migration
of liquid hydrocarbons from coal (Given, 1984). Coals have a molecular sieve-like
structure which limits the free movement of liquid hydrocarbons (Radke et al., 1984).
Hence, it is unlikely that the larger hydrocarbon molecules would be able to drift
significant distances from their source of generation. The hydrocarbons are stored up
within the coal structure until some level of cracking occurs and smaller (usually
methane) molecules can readily migrate through the tiny pores. Littke et al. (1990)
suggested that coal exhibits weak microporosity with an increase in burial depth and
invariably, as the coal rank increases, the porosity disappears. Should the coal sequence
exhibits a macroporous structure; hydrocarbons are easily expelled and migrate from the
coal core (Littke et al., 1990; Zhao and Cheng, 1998). Higher molecular weight
hydrocarbons are most often trapped within the structure or released last under intense
stress. Because of this ability of coal to withhold generated hydrocarbons, the oil from
coal is quite often light oil.
Hunt (1991) suggested that tectonic compressive shear stresses which result from
overburden acts as an external force for the migration and expulsion of hydrocarbons
from coal. These stresses drive hydrocarbons from the porous structure in the direction
of weaker stresses to carrier strata. The greater the shear stress, the more the
tendency for the hydrocarbons to migrate (Zhao and Cheng, 1998). Although there are
reported evidences of such stresses in the Svalbard region, there are no documented
evidences of oil migration from coal in this region (Dallmann et al., 1988). This may be
due to the general limitations of most migration mechanisms, which is the relative ratio
of oil to water in a sedimentary basin during hydrocarbon generation and primary
migration. In as much as the mechanism for the separation of generated oil from
formation water is not fully understood, the ratio of oil to water should not be ignored in
petroleum migration models (Hunt, 1991).
When compared to mudstones, oil migration from coal leaves a greater
geochromatographic effect on the strata and surrounding beds than mudstones. This
means that there is an apparent change in the chemical and physical properties of the
hydrocarbons as they migrate (Zhao and Cheng, 1998). This geochromatographic effect
shows a direct relationship with the pore distribution characteristics, pore intensity, the
molecular size and the organic abundance of the source rock. Hence, identifying these
18
changes in residual oil or bitumen property in coals and other source rocks is vital for
unlocking the questions of migration.
2.3 Coal as a source rock for oil
A petroleum source rock is defined as an organic matter rich sedimentary rock that in its
natural state will generate and expel sufficient hydrocarbons to form a commercial
accumulation of oil or gas (Hunt, 1979). Source rocks act as the centre for petroleum
generation from insoluble organic matter known as kerogen. Larter (2011) explained
that a source rock is a fine-grained sediment with abundant organic matter that could
generate liquid or gaseous hydrocarbons on thermal modification in a sedimentary basin.
Classic source rocks, usually limestones or shales display similar characteristics,
containing at least 0.5% total organic carbon (TOC) and about 1% organic matter
(Schlumberger, 2011). Based on this definition of a source rock, coal immediately
qualifies to be considered as a source rock because of its organic matter rich nature.
However, source rock classification is not exactly straightforward and in a strict sense,
other factors such as expulsion and migration need to be considered (Fleet and Scott,
1994). Coal also presents a very complex petrography which makes it challenging to
determine exactly which coal sequence will act as a source rock. In various studies
conducted by Boreham and Powell (1991), Diessel (1992), Durand (1983), Hunt (1991)
and Petersen (2002), these challenges have been reviewed and attempts have been
made to discuss the geochemical and petrological issues relating to the nature, and
identification of coal source rocks and the issue of migration (Fleet and Scott, 1994).
2.4 Characterising Oil prone coals
Early characterisation efforts have been based on coal petrology and maceral
composition. However, the complete reliance on maceral composition for the
classification of coals as oil prone has proven to be unreliable (Petersen, 2002). This has
led several scientists to adopt other microscopic and geochemical parameters that can
be used to characterise coals based on their source rock potential (Horsfield et al., 1988;
Murchison, 1991). These parameters include the Hydrogen index (HI), Vitrinite
Reflectance (VR denoted by R0) and Hydrogen/Carbon (H/C) ratios which can be
obtained by various experimental techniques. Coal petrography along with some other
relevant experimental and classification techniques that will be applied in this study are
discussed in the sections below:
19
2.4.1 Coal petrography and coal macerals
The oil prone nature of coals is attributed to the composition of the original materials
found in them (Wilkins et al., 2002). Teichmüller and Teichmüller (1982) defined coal
facies as the primary genetic types of coal, which are dependent on the environment
under which peats originate. Petrography in a broader sense refers to the systematic
description of a coal sample in hand specimen and under thin section while coal macerals
are the basic organic constituents of coals which can be recognised at the microscopic
level (Kearey, 1996). The petrography of Svalbard coals make them unique and oil
prone (Orheim et al., 2007). From a petrology viewpoint, coal genesis is discussed
based on the genesis of coal macerals, microlithotypes and lithotypes. While coal
macerals are the most uniform microscopic constituents of coal, microlithotypes are
typical maceral associations that can be recognized under the microscope, and lithotypes
are layers of coal seams which can be distinguished with the naked eye (Teichmüller,
1989).
Coal macerals can be compared with minerals in rocks but differ from minerals in that
minerals have a well-defined chemical composition and are most often crystalline
whereas coal macerals vary greatly in their chemical composition as well as physical
properties. Teichmüller (1989) observed that apart from the parent plant materials and
climate, the degree and length of burial (which signifies rank) of these materials is
pivotal for the microscopic appearance of macerals. As rank increases, macerals vary
and their physical, chemical and technological properties are altered. Coal technologists
have established the presence of a clear relation between the reflectance of a coal
maceral and the coal rank (Stach, 1982). Invariably, the carbon or volatile matter yield
of coal can be estimated by measuring its reflectance on a polished surface.
Coal structure and reflectance under incident light are the main parameters used to
differentiate macerals and maceral groups under the microscope. Three main maceral
groups have been identified in coals. These maceral groups can be subdivided to contain
macerals, submacerals and maceral variety for a simpler and more practical classification
(Teichmüller and Teichmüller, 1982). Each maceral group contains a series of macerals
that are quite similar in origin and mode of conservation. The maceral groups are to
some extent characterised based on their chemical composition and linked directly to the
elemental composition of hydrogen, oxygen and carbon (Scott, 2002). However, Stach
(1982) suggested that macerals belonging to the same maceral group differ from each
other in morphology and structure rather than in reflectance. This means that there is
only a relatively small difference in the elementary composition, volatile-matter yield and
technological properties of macerals belonging to the same group. The three maceral
groups are:
20
2.4.1.1 The vitrinite group
Vitrinites are by far the most frequent, complex and abundant maceral group occurring
in bituminous coals (Scott, 2002). They are also the most important in source rock
studies because of their abundance, differences in their reflectance which is due to
varying original plant materials and the degree of preservation which serves as a pointer
to hydrogen-richness and paleo-environment of deposition. When compared with other
macerals, they have an intermediate reflectance which is lowest in high volatile coals
and increases with rank. Orheim et al. (2007) has established that vitrinites are the
most abundant macerals in the Svalbard coals. Teichmüller (1989) noted that vitrinites
arise from lignin and cellulose of plant cell wall and also from tannings which permeate
cell walls and fill cell lumens. Beyond containing true plant material, this group also
contains detrital materials and chemical precipitates. For coal petrologists, the main
morphological distinction between the members of this group is made between the cell
wall (telinites), gels (gellinites/collinites) and the detrital material (detrinites). The
circumstances under which the vitrinites originate make them very popular among
terrigenous organic matter like coals, marls and carbonaceous shales (Scott, 2002).
Hydrogen rich (perhydrous) vitrinites like detrovitrinites are regarded as oil prone and
are very important in source rock studies. The most abundant vitrinite maceral in the
Longyear coal is detrovitrinite (Orheim et al., 2007). Table 2.1 shows a summary of the
maceral groups and relevant submacerals in these groups.
2.4.1.2 The liptinite group
They are often referred to as the exinite group and comprise of the sporonite, cutinite,
resinite, alginate and liptodetrinite macerals. Liptinites originate from hydrogen-rich
plant organs as well as from decomposition products and algal and bacterial substances
(Teichmüller, 1989). Crelling (1987) stated that the most outstanding petrographic
property of the liptinite group is that they have a reflectance that is lower than that of
the vitrinites and inertinites in the same coal sample. In low rank coals, liptinites are
distinguished from vitrinites by higher hydrogen content. Liptinite macerals show a high
sensitivity to progressive coalification and on carbonisation they yield high volumes of
tar and gas (Stach, 1982). The liptinites are the least abundant, lightest and most
volatile macerals. Their hydrogen rich nature makes them important as oil prone
macerals despite their limited distribution (Hunt, 1991; Scott, 2002). Orheim et al.
(2007) reported an extremely low percentage (2-3%) of liptinites in the Svalbard coals
which usually existed as sporonites, liptodetrinite and cutinite.

21
Group maceral Maceral Submaceral*
Vitrinite Telinite Telinite 1
Telinite 2
Telocollinite
Gelocollinite
Collinite Desmocollinite
Corpocollinite
Detrovitrinite
Liptinite Sporinite
Cutinite
Resinite
Alginate
Liptodetrinite
Inertinite Micrinite
Micrinite
Semifusinite
Fusinite Pyrofusinite
Degradofusinite
Sclerotinite Fungosclerotinite
Inertodetrnite
Table 2.1. Summary of maceral groups and subgroups
* Incomplete and can be expanded
2.4.1.3 The inertinite group
Inertinite is obtained from the word “inert” which means that they are typically
unreactive in their behaviour. They are quite unimportant with regards to their oil
proneness but are relevant in classifying coals in a general sense and are present in
Svalbard coals. This group comprises of macerals derived from plant relics similar to the
vitrinites (Melendez, 2001). The distinguishing properties of inertinites include high
reflectance, little or no fluorescence, high carbon and low hydrogen contents and low
aromatization (Scott, 2002). Inertinite was initially used to refer to the maceral
behaviour in coals of coking rank in which much of the inertinite did not soften (react)
during carbonization unlike vitrinites and liptinites (Teichmüller, 1989). However,
Diessel (1983) has been able to show that certain inertinites from Gondwana coals are
partially reactive. Stach (1982) also observed that the maceral micrinite is not inert and
in fact, differs in its origin from the rest of the inertinites. Nevertheless, micrinite is still
grouped under the inertinite group which is a very diverse group, and its exact nature is
still a subject controversy (Crelling et al., 1988; Diessel, 1983; Scott, 2002). Micrinite is

22
reported to be distributed in all the seam sections of the Svalbard coals. However, they
do not play any role in classifying these coals as oil prone. Cmiel and Fabianska (2004)
reported an abundance of fusinites and semifusinites in Longyear coals.
2.4.2 Coal maturity and maturity parameters
Thermal maturity is a measure of the degree to which the metamorphism of organic
matter has progressed with time (Crelling, 2008). During the process of coal
maturation, mobile products such as gas or crude oil are expelled from the coal lattice
with subsequent aromatisation and condensation of the solid residual product (coal)
taking place (Van Krevelen, 1984). Petroleum generation from coal organic matter
begins under the pressure, temperature and time conditions when the coals pass
through the sub-bituminous stage and end when the coals have reached a medium-
bituminous rank. The degree of bituminisation is synonymous with the maturity of the
crude oil generated by the coal and this serves as the basis for measuring the maturity
at which coals can expel crude oil (Teichmüller, 1989). Understanding the process of
maturity of coals is important in characterising oil prone coals and this degree of
maturation can be measured by different parameters. These parameters include vitrinite
reflectance (VR), hydrogen index (HI) and biological markers.
2.4.2.1 Vitrinite reflectance (VR/R0) and Hydrogen index
Petersen et al. (2009) defined the vitrinite reflectance as a measure of the amount white
light that will be reflected off the surface of the prepared vitrinite maceral. The
reflectance measurement is usually done on the vitrinite maceral. This is because the
vitrinites show a moderately consistent increase in reflectance with increasing rank
(Crelling et al., 1988). This makes vitrinite reflectance an invaluable tool in assessing the
level of thermal maturity of sediments. Thermal maturity has been established as the
route to petroleum generation and vitrinite reflectance serves as a correlating tool for
determining the maturity at which source rocks will generate and expel oil (Killops et al.,
2002; Killops et al., 1998). Vitrinite Reflectance ranges of 0.5-0.6% R0 to 1.3-1.35%
have been suggested as the maturity threshold for which coals will generate oil (Hunt,
1991). Orheim et al. (2007) reported Ro values averaging 0.71% for the Longyear seam
indicating that they are in a maturity range for petroleum generation. However, a major
limitation of this technique was observed by (Teichmüller and Teichmüller, 1967). They
noted certain important jumps or disconformities in VR ranges with increase in rank.
The first jump is between the 0.6-0.7% range and the second is between the 1.30-

23
1.40% ranges. These, were referred to as the first and second coalification jumps
respectively. Orheim et al. (2007) noted a striking coalification jump from the lower to
the upper section of the Longyear seam. A suppression of vitrinite reflectance by
adsorption of hydrogen rich components by vitrinites has also been reported by (Diessel
and Gammidge, 1998). The effect of this suppression is the reduction of Ro values in
very hydrogen rich coals. Vitrinite reflectance measurements have been applied over
the years by coal petrologists in determining the maturity and rank of coals. Presently,
the VR tool is used to trace the organic matter metamorphism from kerogen to
hydrocarbons which would occur within certain VR ranges. Such ranges have been
suggested by (Hunt, 1991; Isaksen et al., 1998; Petersen, 2002).
Hydrogen index (HI) is a measure of the ratio of the density of hydrogen in a material to
its density in water while the hydrogen, carbon (H/C) ratio simply looks at the ratio of
elemental hydrogen and carbon present in the coal sample. The hydrogen index of a
source rock is measured using rock-eval pyrolysis. Hydrogen index varies with the
maturity of a coal sample and several studies have suggested that there is increase in HI
with thermal maturity up to a maximum (HImax) value (Behar et al., 1995; Cooles et al.,
1986; Pepper and Corvi, 1995; Sykes and Snowdon, 2002; Verheyen et al., 1984).
Petersen and Nytoft (2006) have been able to show how a combination of VR and HI
parameters can be used to determine maturity range for oil generation some other key
relationships. Petersen (2006) explained the existence of a direct relationship between
VR and HI at certain maturity ranges and eventually reported that oil prone coals fall
within a HI range of 150-370mg HC/g TOC and a VR range of 0.6-0.95% R0 while gas
prone coals are typically found below these HI and VR ranges.
2.4.3 Biological markers
Biological markers are useful in reconstructing the ecology of peat-forming
environments. In a geologic setting, they represent the remains of ancient organic
matter-forming materials (Curtis et al., 2004; Peters et al., 2007). The information held
in these relics aid in the differentiation, characterisation and assessment of depositional
environments, age and maturity of sediments. In the discipline of organic geochemistry,
the application of biological marker compounds for the correlation of sediments and
petroleum accumulations has been firmly established (Jiamo et al., 1990; Moore, 1969).
They are also very useful in distinguishing ancient non-marine and marine source rocks.
Biological marker compounds bring insight into the history of oil formation and
accumulation within a sedimentary system (Brassell et al., 1986).
24
Brassell et al. (1986) stressed that identifying coal sourced oils within a basin is achieved
by correlating the inherent properties of the oil with that of the surrounding organic
sedimentary sequences using biological markers. Oil source correlation within a basin
will not be to coal in a strict sense but to sequences bearing terrigeneous organic matter.
However, biomarker information alone may be somewhat ambiguous since they may
have been derived from terrigeneous organic matter that has been deposited in a
lacustrine or marine environment (Fleet and Scott, 1994). In summary, Ji-Yang et al.
(1982) established that biological marker measurements can be used to access:
a. The maturity of organic matter rich sediments and oils
b. The extent of migration of an individual pool of oil
c. The correlation of source rocks and oils.
A wide range of biological markers are available for achieving these measurements.
However, for the purpose of this study, greater emphasis will be laid on the hopanes,
steranes and acyclic isoprenoid biomarkers.
2.4.3.1 Hopanes
Hopanes are pentacyclic triterpenoids (six isoprene units) that contain between 27 – 30
carbon atoms. Although they can be found in both prokaryotic and eukaryotic
organisms, they are most commonly derived from the cell membranes of prokaryotes
(phototropic cyanobacteria and heterotrophic bacteria). The widespread distribution of
hopanes in sedimentary organic matter is attributed to their prokaryote antecedent
(Nytoft and Bojesen-Koefoed, 2001). Hopanes are characterised by several maturity-
sensitive stereoisomers with ββ configurations easily converting to αβ and βα under
heightened stress (Chandru et al., 2008). Hopanes are widely used in providing
maturity estimates in petroleum provinces as well as assessing paleoenvironments.
Their high resistance to biodegradation also makes them very useful in assessing the
biodegradation rates in highly degradable oil (Peters et al., 2007). Hopanes rations are
partly relied on to provide oil-source and oil-oil correlations (Moldowan et al., 1991).
Several hopane rations are vital in interpreting source and maturity of oils. These
maturity ratios are obtained from C29 to C35 stereoisomers on the chromatograms m/z
191. Table 2.2 shows some the relevant hopane ratios and interpretations.
25
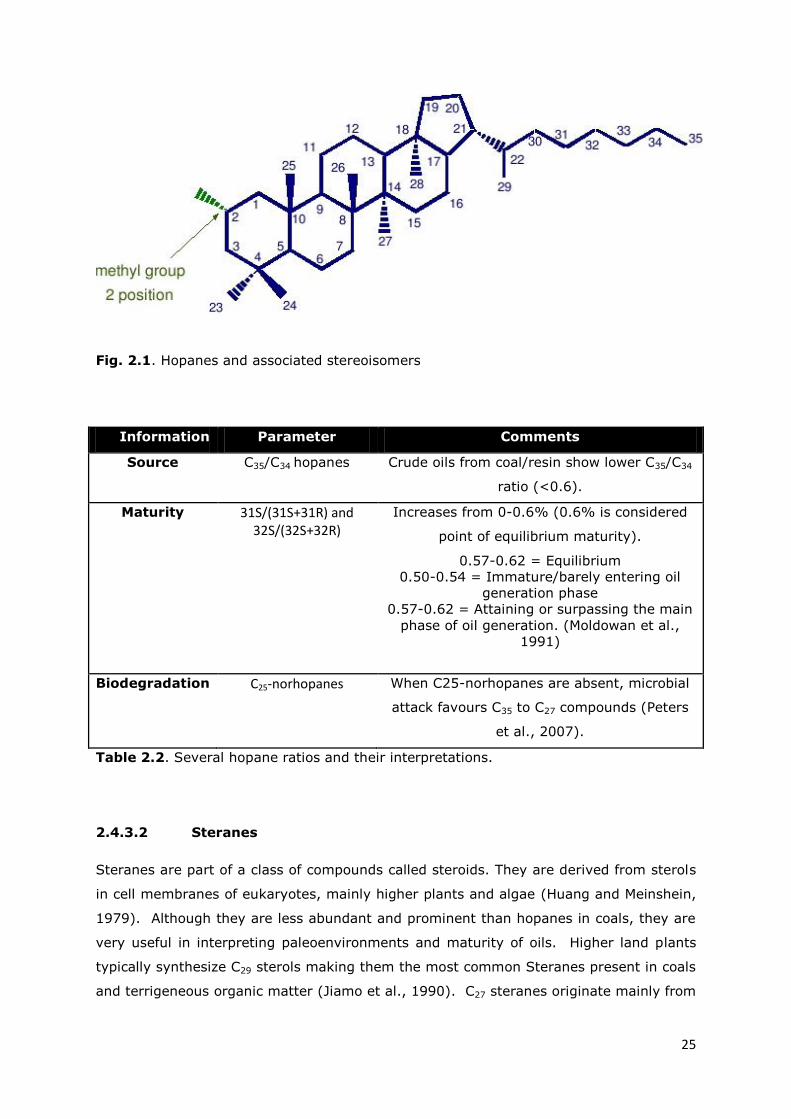
Fig. 2.1. Hopanes and associated stereoisomers
Information Parameter Comments
Source C35/C34 hopanes Crude oils from coal/resin show lower C35/C34
ratio (<0.6).
Maturity 31S/(31S+31R) and 32S/(32S+32R)
Increases from 0-0.6% (0.6% is considered
point of equilibrium maturity).
0.57-0.62 = Equilibrium
0.50-0.54 = Immature/barely entering oil
generation phase
0.57-0.62 = Attaining or surpassing the main
phase of oil generation. (Moldowan et al.,
1991)
Biodegradation C25-norhopanes When C25-norhopanes are absent, microbial
attack favours C35 to C27 compounds (Peters
et al., 2007).
Table 2.2. Several hopane ratios and their interpretations.
2.4.3.2 Steranes
Steranes are part of a class of compounds called steroids. They are derived from sterols
in cell membranes of eukaryotes, mainly higher plants and algae (Huang and Meinshein,
1979). Although they are less abundant and prominent than hopanes in coals, they are
very useful in interpreting paleoenvironments and maturity of oils. Higher land plants
typically synthesize C29 sterols making them the most common Steranes present in coals
and terrigeneous organic matter (Jiamo et al., 1990). C27 steranes originate mainly from

26
marine planktons and are vital constituents of marine sediments. C28 steranes are also
characteristic of marine sediments.
Fig. 2.2. Steranes and associated stereoisomers
Steranes exist in various diastereometric configurations which are affected largely by
thermal maturity (Seifert, 1978). The more thermodynamically stable Steranes occur
with increasing maturity. Table 2.3 shows some the relevant sterane ratios that are vital
in interpreting source and maturity of oils. Such ratios can be obtained from C27 to C29
stereoisomers on the m/z 217 chromatogram.
Information Parameter Comments
Source C29 steranes Higher plant input to source
rock. High C29 steranes relative
to C27 – C29 steranes.
Age C29 Monoaromatic steranes High in oils derived from
sources older than 350 million
years.
Maturity 29αααS/29αααS+29αααR and 29αββR+S/(29αββR+S+29αααS+29αααR)
Increases from 0-0.5 (0.5 is
considered point of equilibrium
maturity). Parameter increases
with thermal maturity
(Moldowan et al., 1991)
Table 2.3. Several sterane ratios and their interpretations.
27
2.4.3.3 Isoprenoids and n-alkanes
Isoprenoids are derived from isoprene units located within the wax component of most
plants. Isoprene constitutes the fundamental unit of isoprenoids consisting of five (5)
carbon atoms (Burnham et al., 1982). Isoprenoids are typically stronger than
biologically assembled proteins and polysaccharides because of the existence of a
covalent C-C bond between the isoprene units. This makes them vital tools in assessing
the rate of biodegradation in oils (Chandru et al., 2008). Naturally occurring Isoprenoids
typically have chain lengths ranging from C10 to C20 with alternating sites of functionality
and unsaturation as well as a different linking approach for the isoprene units (tail to tail,
tail to head and head to head). Acyclic Isoprenoids are straight chained aliphatic
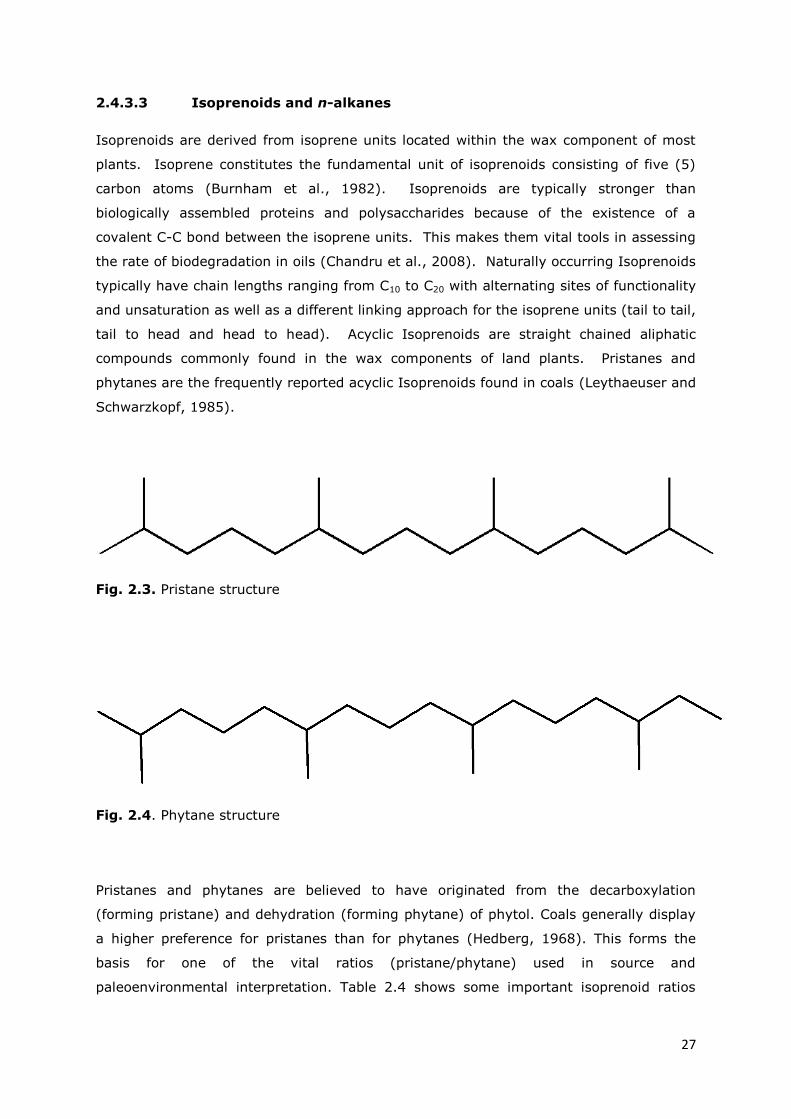
compounds commonly found in the wax components of land plants. Pristanes and
phytanes are the frequently reported acyclic Isoprenoids found in coals (Leythaeuser and
Schwarzkopf, 1985).
Fig. 2.3. Pristane structure
Fig. 2.4. Phytane structure
Pristanes and phytanes are believed to have originated from the decarboxylation
(forming pristane) and dehydration (forming phytane) of phytol. Coals generally display
a higher preference for pristanes than for phytanes (Hedberg, 1968). This forms the
basis for one of the vital ratios (pristane/phytane) used in source and
paleoenvironmental interpretation. Table 2.4 shows some important isoprenoid ratios
28
and their relevance. These ratios are obtained from the C15 – C31 n-alkane compounds on
the chromatogram m/z 71.
Information Parameter Comments
Source Pristane/phytane Very high in coal sourced oils
(>3.0) (Hedberg, 1968).
Migration Pristane/n-C17 An increasing ratio through a
source rock profile could indicate
migration. Branched chained
pristanes will be eluted less
readily than straight chained n-
C17.
Maturity Pristane/n-C17 and Phytane/n-C18 These ratios decrease with
increasing maturity (Tissot et al.,
1987).
Table 2.4. Isoprenoid ratios and interpretations.
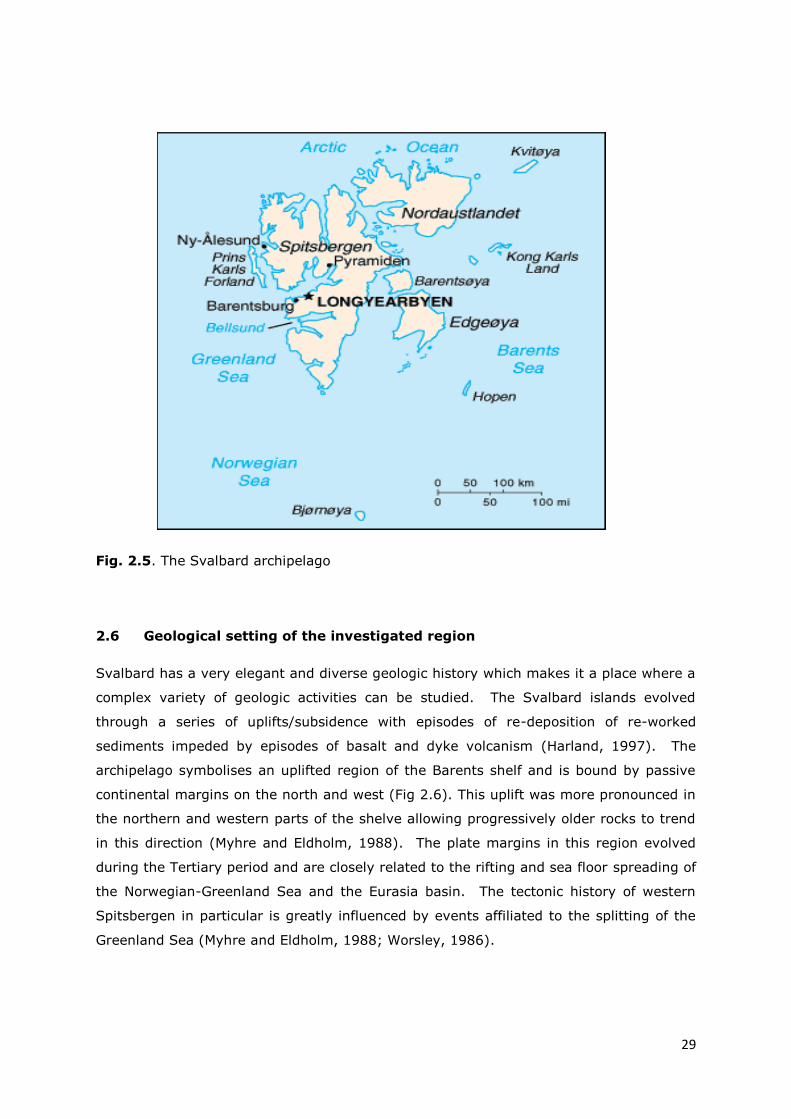
2.5 Geography of the study area
The coals investigated are from the Longyear seam located on the Spitsbergen Island
found within the Svalbard archipelago. Spitsbergen is the largest island on the Svalbard
archipelago in the Arctic Ocean and is located in-between Norway and the North Pole
(Harland, 1998). Svalbard consists of all the islands between latitude 74o North and
latitude 81o North and between longitude 10o East and longitude 35o East (Fig 2.5). The
Svalbard archipelago is located in the northern part of the kingdom of Norway covering
an area of approximately 62,049 square kilometres (sq. Km) and is roughly centred on
78o North latitude and 20o East longitudes (Dallmann et al., 1988). In this region, the
mean annual temperature ranges from -5oC at sea level to about -15oC within the
mountains leaving the area covered with ice for more than 6 months of the year. The
climate is arctic with extensive glaciations covering about 60% of the region (Svendsen
et al., 2002). Svalbard is located within an area of extensive permafrost and permafrost
related features. These features are more pronounced in the dry central area of
Spitsbergen which is not fully covered by glaciers (Harland, 1998). Glacial cut troughs
also known as Fjord’s characterise this region. Heavy glaciations and the northern
latitude generally choke up arable land hindering the growth of trees and shrubs on the
island.
29
Fig. 2.5. The Svalbard archipelago
2.6 Geological setting of the investigated region
Svalbard has a very elegant and diverse geologic history which makes it a place where a
complex variety of geologic activities can be studied. The Svalbard islands evolved
through a series of uplifts/subsidence with episodes of re-deposition of re-worked
sediments impeded by episodes of basalt and dyke volcanism (Harland, 1997). The
archipelago symbolises an uplifted region of the Barents shelf and is bound by passive
continental margins on the north and west (Fig 2.6). This uplift was more pronounced in
the northern and western parts of the shelve allowing progressively older rocks to trend
in this direction (Myhre and Eldholm, 1988). The plate margins in this region evolved
during the Tertiary period and are closely related to the rifting and sea floor spreading of
the Norwegian-Greenland Sea and the Eurasia basin. The tectonic history of western
Spitsbergen in particular is greatly influenced by events affiliated to the splitting of the
Greenland Sea (Myhre and Eldholm, 1988; Worsley, 1986).

30
Fig. 2.6. Topographic Map of Svalbard
The sedimentary sequence of Svalbard appears to stretch from the upper Palaeozoic to
the lower Tertiary periods. Abundant tertiary deposits exist within the central region of
Spitsbergen in an extensive depression trending in the North, North, West (NNW)
direction (Cmiel and Fabianska, 2004; Myhre and Eldholm, 1988). These central tertiary
deposits exceed a 2300m thickness and consist mainly of sandstones, conglomerates,
siltstones, claystones, coals and coaly shales. The Svalbard platform consists of a broad
syncline with a fold belt trending west and a mildly ascending limb towards the east.
Located within the syncline is the central basin which represents the middle part of
Spitsbergen (Orheim et al., 2007).
31
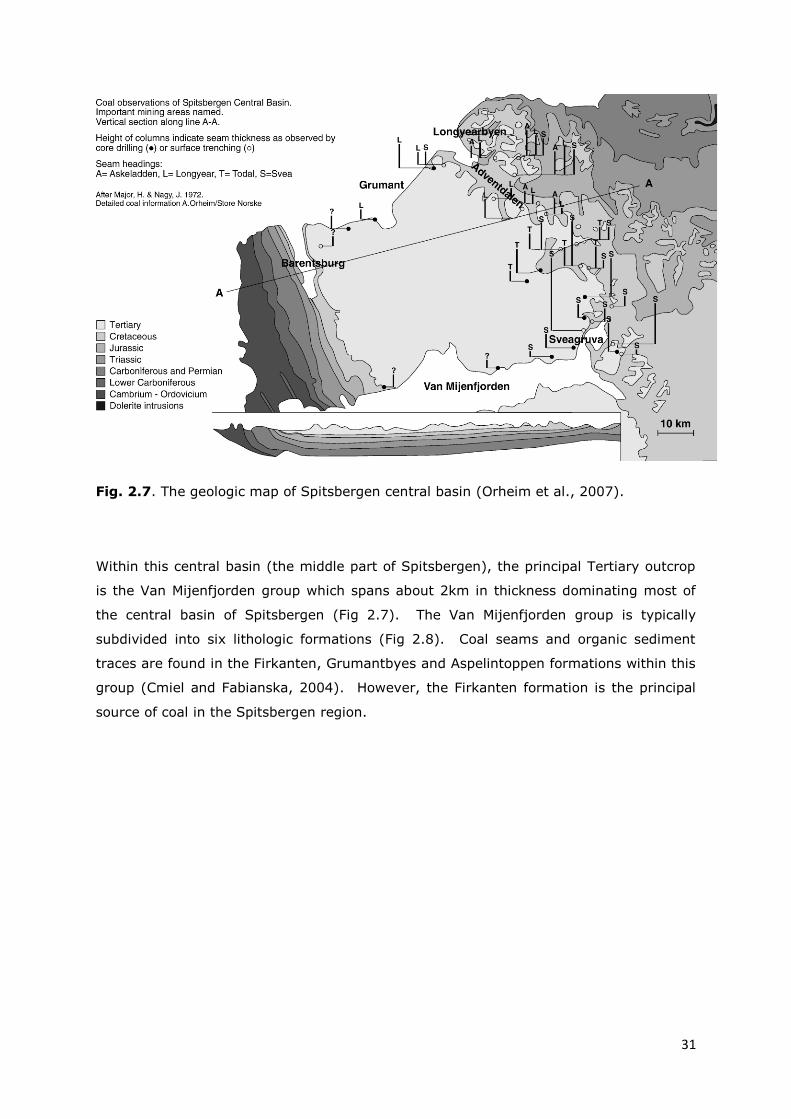
Fig. 2.7. The geologic map of Spitsbergen central basin (Orheim et al., 2007).
Within this central basin (the middle part of Spitsbergen), the principal Tertiary outcrop
is the Van Mijenfjorden group which spans about 2km in thickness dominating most of
the central basin of Spitsbergen (Fig 2.7). The Van Mijenfjorden group is typically
subdivided into six lithologic formations (Fig 2.8). Coal seams and organic sediment
traces are found in the Firkanten, Grumantbyes and Aspelintoppen formations within this
group (Cmiel and Fabianska, 2004). However, the Firkanten formation is the principal
source of coal in the Spitsbergen region.
32
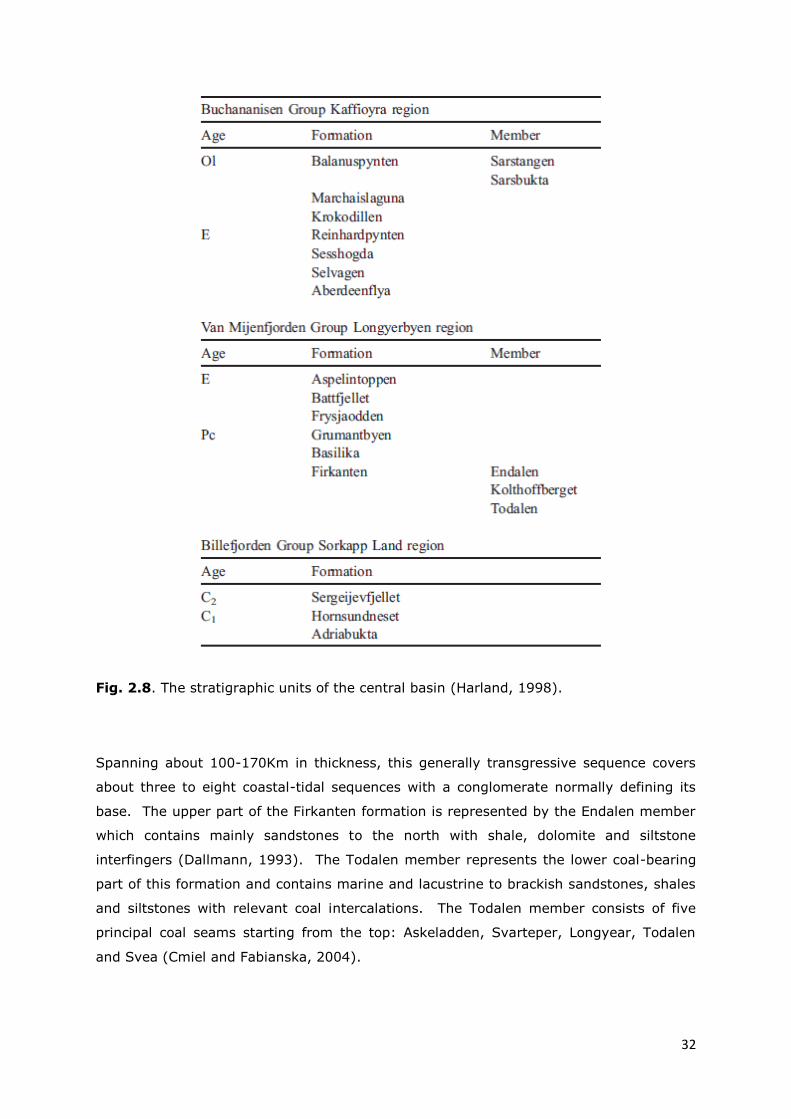
Fig. 2.8. The stratigraphic units of the central basin (Harland, 1998).
Spanning about 100-170Km in thickness, this generally transgressive sequence covers
about three to eight coastal-tidal sequences with a conglomerate normally defining its
base. The upper part of the Firkanten formation is represented by the Endalen member
which contains mainly sandstones to the north with shale, dolomite and siltstone
interfingers (Dallmann, 1993). The Todalen member represents the lower coal-bearing
part of this formation and contains marine and lacustrine to brackish sandstones, shales
and siltstones with relevant coal intercalations. The Todalen member consists of five
principal coal seams starting from the top: Askeladden, Svarteper, Longyear, Todalen
and Svea (Cmiel and Fabianska, 2004).
33
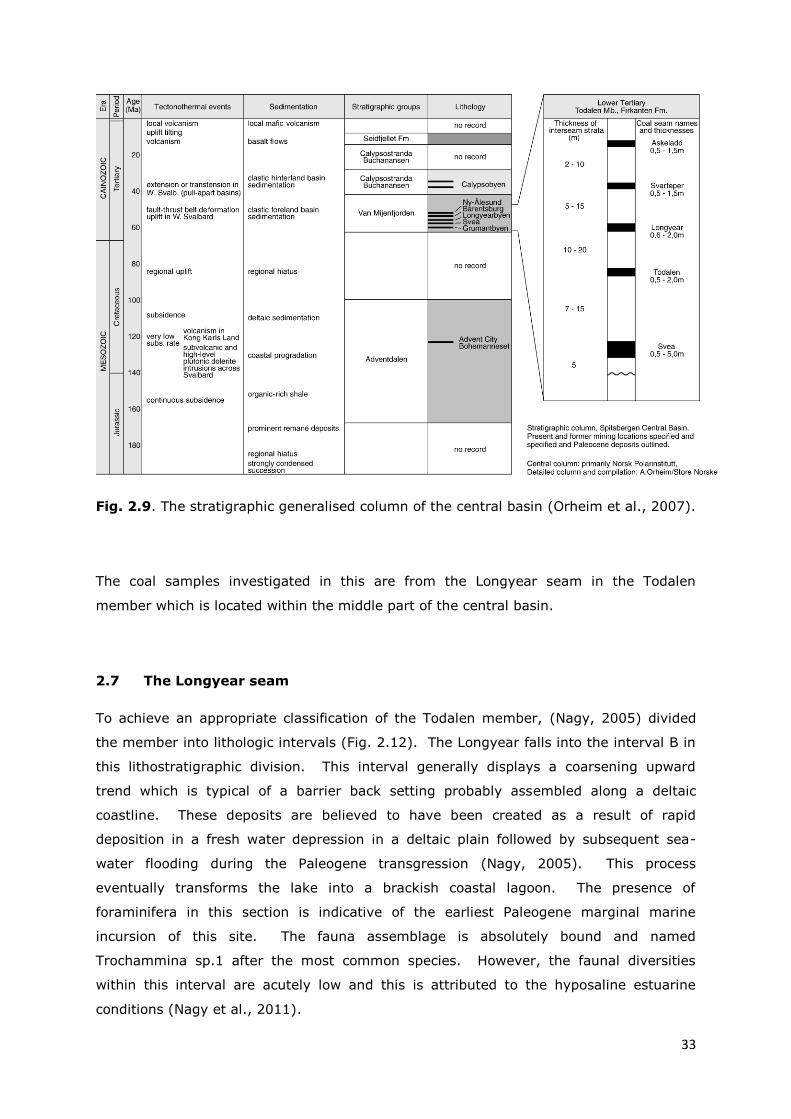
Fig. 2.9. The stratigraphic generalised column of the central basin (Orheim et al., 2007).
The coal samples investigated in this are from the Longyear seam in the Todalen
member which is located within the middle part of the central basin.
2.7 The Longyear seam
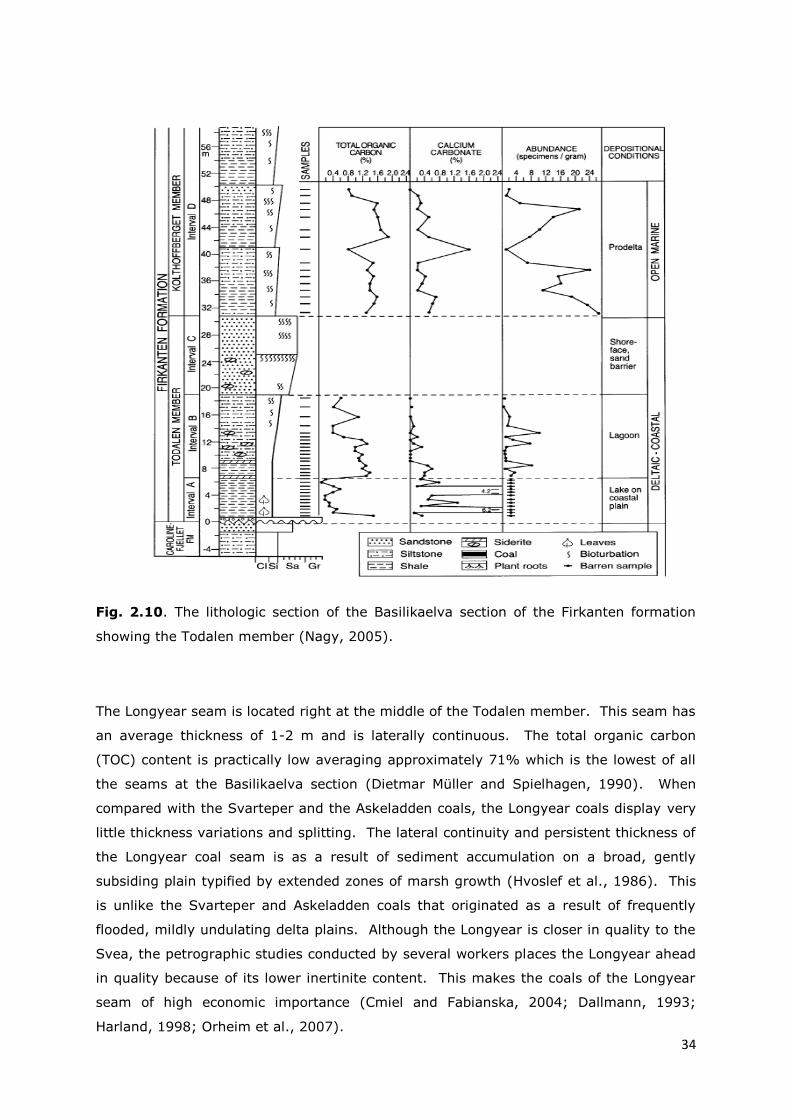
To achieve an appropriate classification of the Todalen member, (Nagy, 2005) divided
the member into lithologic intervals (Fig. 2.12). The Longyear falls into the interval B in
this lithostratigraphic division. This interval generally displays a coarsening upward
trend which is typical of a barrier back setting probably assembled along a deltaic
coastline. These deposits are believed to have been created as a result of rapid
deposition in a fresh water depression in a deltaic plain followed by subsequent sea-
water flooding during the Paleogene transgression (Nagy, 2005). This process
eventually transforms the lake into a brackish coastal lagoon. The presence of
foraminifera in this section is indicative of the earliest Paleogene marginal marine
incursion of this site. The fauna assemblage is absolutely bound and named
Trochammina sp.1 after the most common species. However, the faunal diversities
within this interval are acutely low and this is attributed to the hyposaline estuarine
conditions (Nagy et al., 2011).
34
Fig. 2.10. The lithologic section of the Basilikaelva section of the Firkanten formation
showing the Todalen member (Nagy, 2005).
The Longyear seam is located right at the middle of the Todalen member. This seam has
an average thickness of 1-2 m and is laterally continuous. The total organic carbon
(TOC) content is practically low averaging approximately 71% which is the lowest of all
the seams at the Basilikaelva section (Dietmar Müller and Spielhagen, 1990). When
compared with the Svarteper and the Askeladden coals, the Longyear coals display very
little thickness variations and splitting. The lateral continuity and persistent thickness of
the Longyear coal seam is as a result of sediment accumulation on a broad, gently
subsiding plain typified by extended zones of marsh growth (Hvoslef et al., 1986). This
is unlike the Svarteper and Askeladden coals that originated as a result of frequently
flooded, mildly undulating delta plains. Although the Longyear is closer in quality to the
Svea, the petrographic studies conducted by several workers places the Longyear ahead
in quality because of its lower inertinite content. This makes the coals of the Longyear
seam of high economic importance (Cmiel and Fabianska, 2004; Dallmann, 1993;
Harland, 1998; Orheim et al., 2007).
35
CHAPTER THREE
EXPERIMENTAL TECHNIQUES AND METHODS
3.1 Experimental techniques
3.1.1 Gas Chromatography (GC)
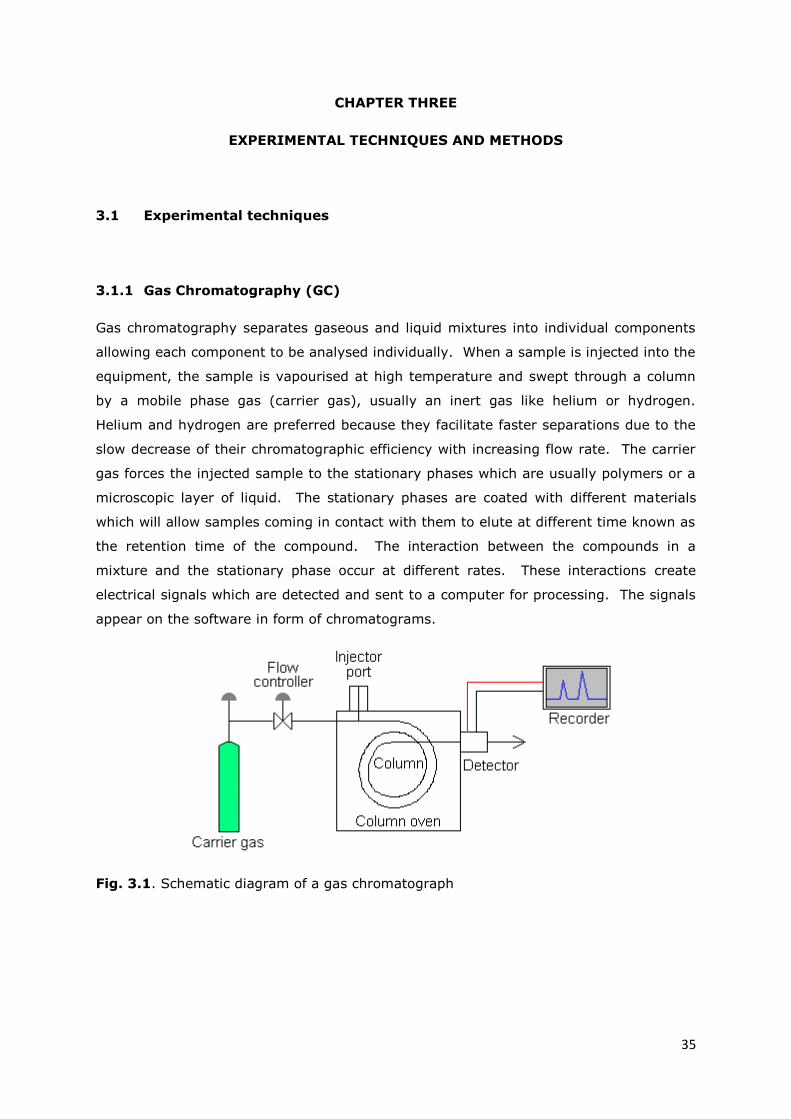
Gas chromatography separates gaseous and liquid mixtures into individual components
allowing each component to be analysed individually. When a sample is injected into the
equipment, the sample is vapourised at high temperature and swept through a column
by a mobile phase gas (carrier gas), usually an inert gas like helium or hydrogen.
Helium and hydrogen are preferred because they facilitate faster separations due to the
slow decrease of their chromatographic efficiency with increasing flow rate. The carrier
gas forces the injected sample to the stationary phases which are usually polymers or a
microscopic layer of liquid. The stationary phases are coated with different materials
which will allow samples coming in contact with them to elute at different time known as
the retention time of the compound. The interaction between the compounds in a
mixture and the stationary phase occur at different rates. These interactions create
electrical signals which are detected and sent to a computer for processing. The signals
appear on the software in form of chromatograms.
Fig. 3.1. Schematic diagram of a gas chromatograph
36
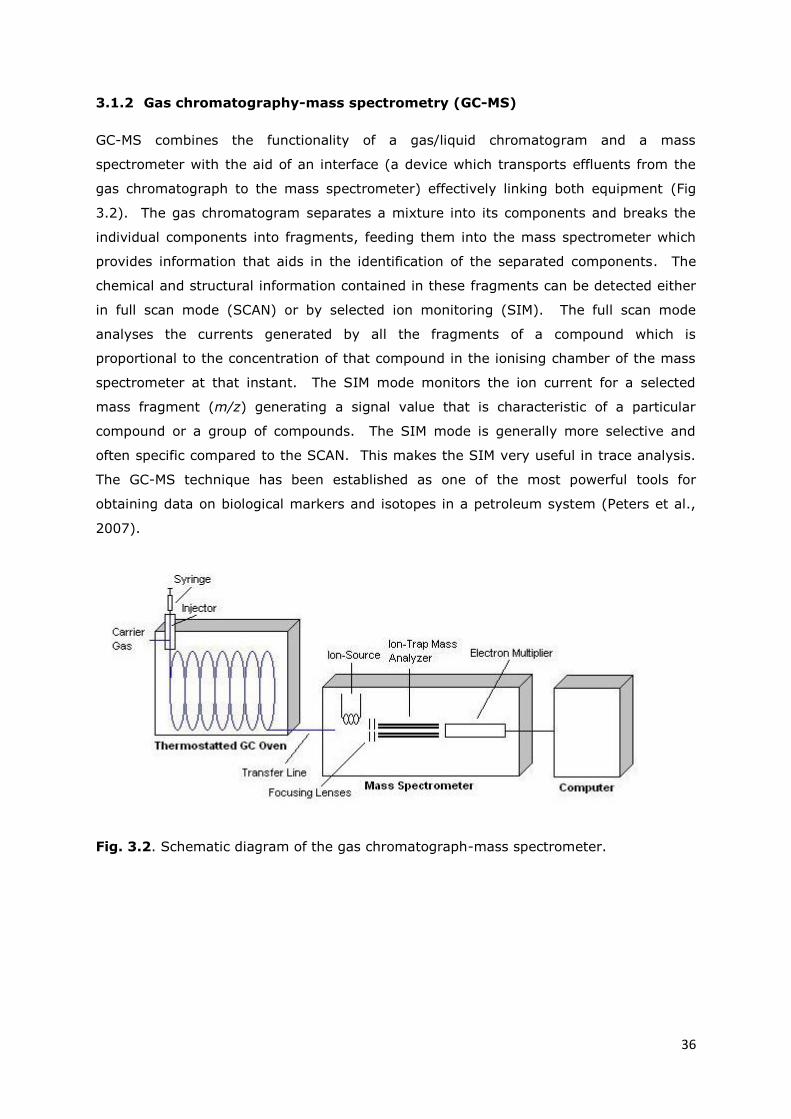
3.1.2 Gas chromatography-mass spectrometry (GC-MS)
GC-MS combines the functionality of a gas/liquid chromatogram and a mass
spectrometer with the aid of an interface (a device which transports effluents from the
gas chromatograph to the mass spectrometer) effectively linking both equipment (Fig
3.2). The gas chromatogram separates a mixture into its components and breaks the
individual components into fragments, feeding them into the mass spectrometer which
provides information that aids in the identification of the separated components. The
chemical and structural information contained in these fragments can be detected either
in full scan mode (SCAN) or by selected ion monitoring (SIM). The full scan mode
analyses the currents generated by all the fragments of a compound which is
proportional to the concentration of that compound in the ionising chamber of the mass
spectrometer at that instant. The SIM mode monitors the ion current for a selected
mass fragment (m/z) generating a signal value that is characteristic of a particular
compound or a group of compounds. The SIM mode is generally more selective and
often specific compared to the SCAN. This makes the SIM very useful in trace analysis.
The GC-MS technique has been established as one of the most powerful tools for
obtaining data on biological markers and isotopes in a petroleum system (Peters et al.,
2007).
Fig. 3.2. Schematic diagram of the gas chromatograph-mass spectrometer.
37
3.1.3 Hydrous pyrolysis technique
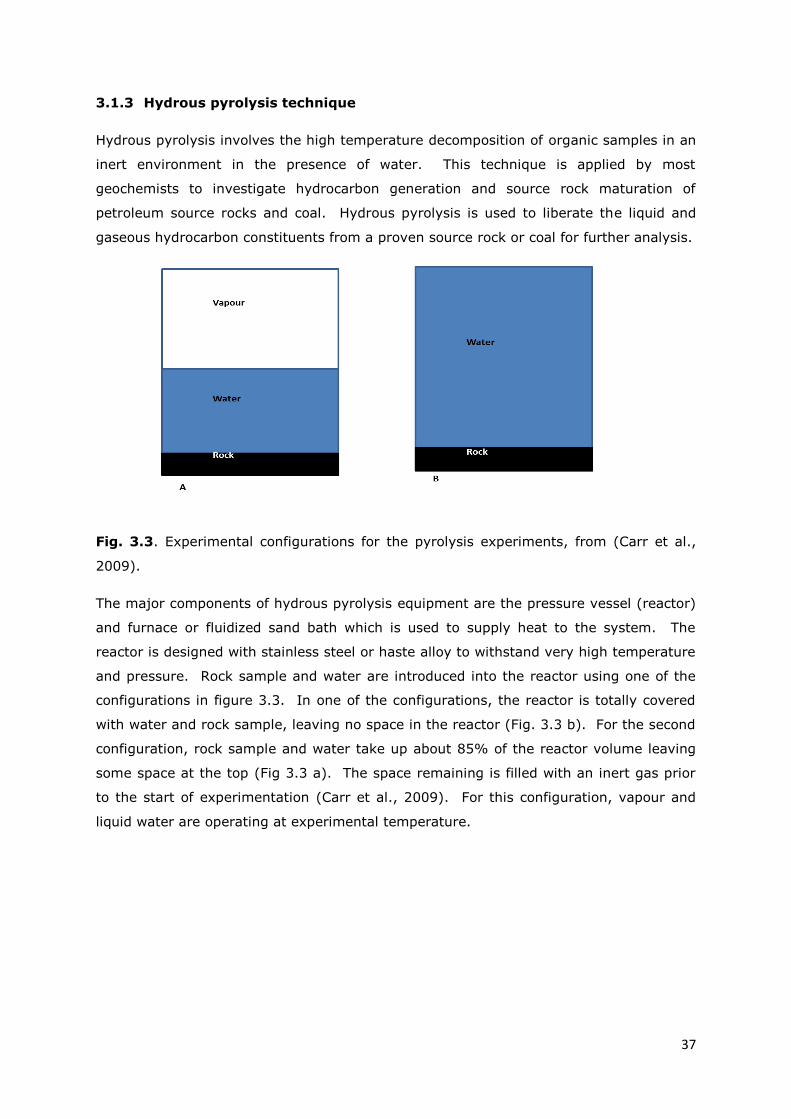
Hydrous pyrolysis involves the high temperature decomposition of organic samples in an
inert environment in the presence of water. This technique is applied by most
geochemists to investigate hydrocarbon generation and source rock maturation of
petroleum source rocks and coal. Hydrous pyrolysis is used to liberate the liquid and
gaseous hydrocarbon constituents from a proven source rock or coal for further analysis.
Fig. 3.3. Experimental configurations for the pyrolysis experiments, from (Carr et al.,
2009).
The major components of hydrous pyrolysis equipment are the pressure vessel (reactor)
and furnace or fluidized sand bath which is used to supply heat to the system. The
reactor is designed with stainless steel or haste alloy to withstand very high temperature
and pressure. Rock sample and water are introduced into the reactor using one of the
configurations in figure 3.3. In one of the configurations, the reactor is totally covered
with water and rock sample, leaving no space in the reactor (Fig. 3.3 b). For the second
configuration, rock sample and water take up about 85% of the reactor volume leaving
some space at the top (Fig 3.3 a). The space remaining is filled with an inert gas prior
to the start of experimentation (Carr et al., 2009). For this configuration, vapour and
liquid water are operating at experimental temperature.
38
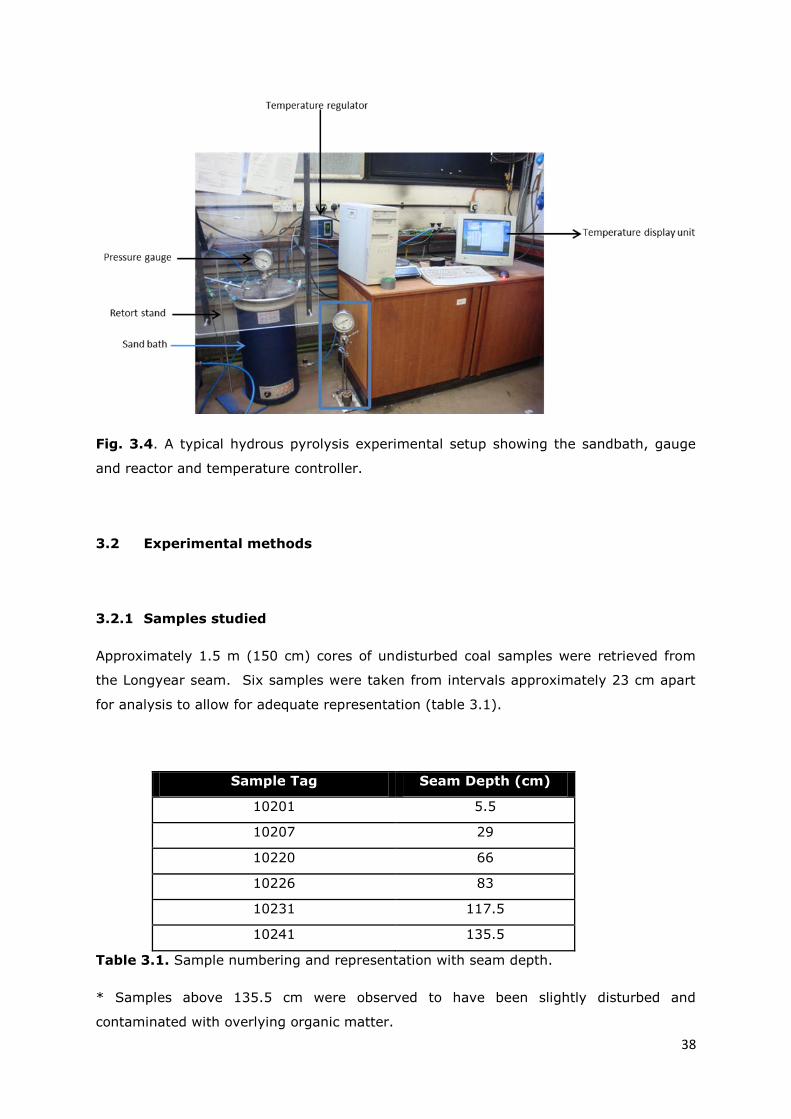
Fig. 3.4. A typical hydrous pyrolysis experimental setup showing the sandbath, gauge
and reactor and temperature controller.
3.2 Experimental methods
3.2.1 Samples studied
Approximately 1.5 m (150 cm) cores of undisturbed coal samples were retrieved from
the Longyear seam. Six samples were taken from intervals approximately 23 cm apart
for analysis to allow for adequate representation (table 3.1).
Sample Tag Seam Depth (cm)
10201 5.5
10207 29
10220 66
10226 83
10231 117.5
10241 135.5
Table 3.1. Sample numbering and representation with seam depth.
* Samples above 135.5 cm were observed to have been slightly disturbed and
contaminated with overlying organic matter.
39
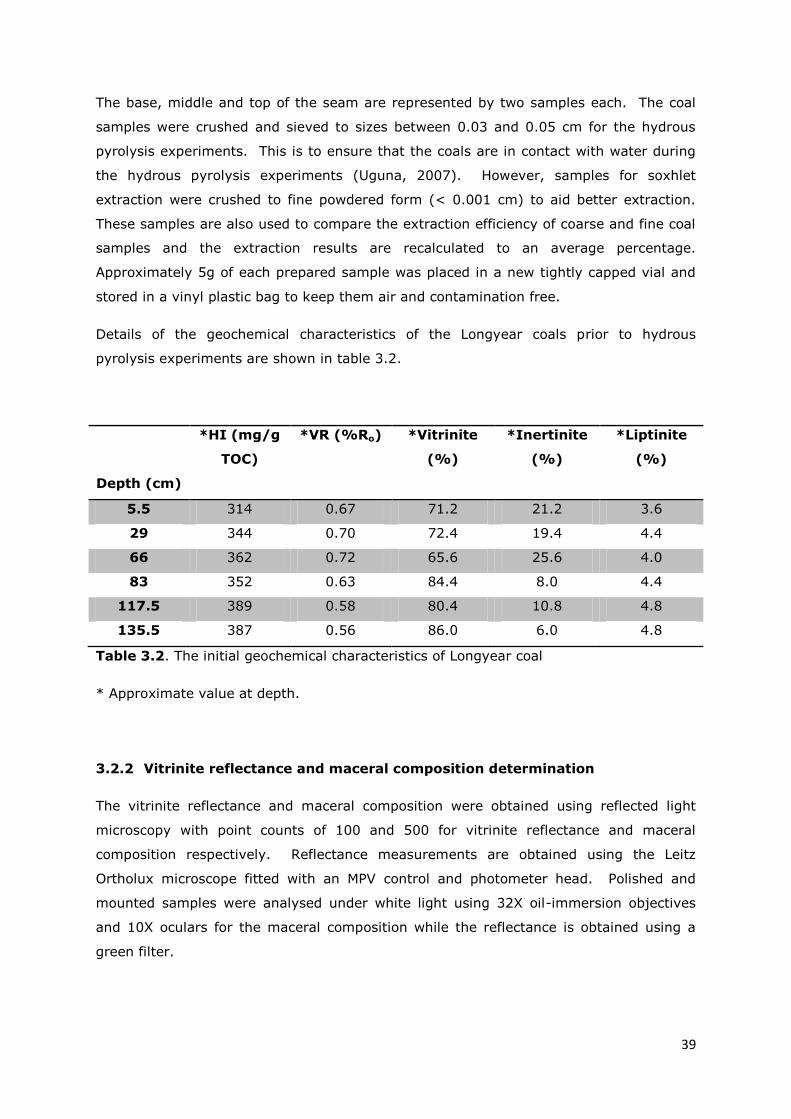
The base, middle and top of the seam are represented by two samples each. The coal
samples were crushed and sieved to sizes between 0.03 and 0.05 cm for the hydrous
pyrolysis experiments. This is to ensure that the coals are in contact with water during
the hydrous pyrolysis experiments (Uguna, 2007). However, samples for soxhlet
extraction were crushed to fine powdered form (< 0.001 cm) to aid better extraction.
These samples are also used to compare the extraction efficiency of coarse and fine coal
samples and the extraction results are recalculated to an average percentage.
Approximately 5g of each prepared sample was placed in a new tightly capped vial and
stored in a vinyl plastic bag to keep them air and contamination free.
Details of the geochemical characteristics of the Longyear coals prior to hydrous
pyrolysis experiments are shown in table 3.2.
Depth (cm)
*HI (mg/g
TOC)
*VR (%Ro) *Vitrinite
(%)
*Inertinite
(%)
*Liptinite
(%)
5.5 314 0.67 71.2 21.2 3.6
29 344 0.70 72.4 19.4 4.4
66 362 0.72 65.6 25.6 4.0
83 352 0.63 84.4 8.0 4.4
117.5 389 0.58 80.4 10.8 4.8
135.5 387 0.56 86.0 6.0 4.8
Table 3.2. The initial geochemical characteristics of Longyear coal
* Approximate value at depth.
3.2.2 Vitrinite reflectance and maceral composition determination
The vitrinite reflectance and maceral composition were obtained using reflected light
microscopy with point counts of 100 and 500 for vitrinite reflectance and maceral
composition respectively. Reflectance measurements are obtained using the Leitz
Ortholux microscope fitted with an MPV control and photometer head. Polished and
mounted samples were analysed under white light using 32X oil-immersion objectives
and 10X oculars for the maceral composition while the reflectance is obtained using a
green filter.

40
3.2.3 Elemental analysis of the samples
The hydrogen and total organic carbon (TOC) content of the coal sample was determined
by combusting the samples in an oxygen-rich atmosphere using the thermo electron
flashEA 1112 elemental analyser. The equipment is controlled by the EAGER300
software for windows. The equipment consists of a quartz reactor tube with beds of
copper oxide as the oxidizing agent and a copper wire as the reductant. The furnace
temperature is held at 900oC before the sample is introduced. When the sample is
introduced and the equipment starts, an aliquot of pure oxygen is automatically injected
into the reactor to aid flash combustion of the sample organic matter. A steady stream
of helium gas (which acts as the carrier gas) is passed through the reactor at a rate of
140 L min-1. The products of this initial reaction (CO2, H2O, SOx and NOx) are swept
from the oxidation stage of the reactor by a stream of helium gas. These gases are
reduced to CO2, H2O, SO2 and N2 in the reducing stage of the reactor and then passed
into the GC column for separation. The separated components are quantified by
comparing them to similar combustion products of a known standard material. The
standard material used for this study was BBOT (2.5 Bis [5-tert-butyl-benzoxazol-2-yl]
Thiophene).
3.2.4 Hydrous Pyrolysis
Hydrous pyrolysis experiment was conducted on 1g TOC of pre-extracted coal sample
(1g TOC weight equivalent of sample was calculated from the TOC content of immature
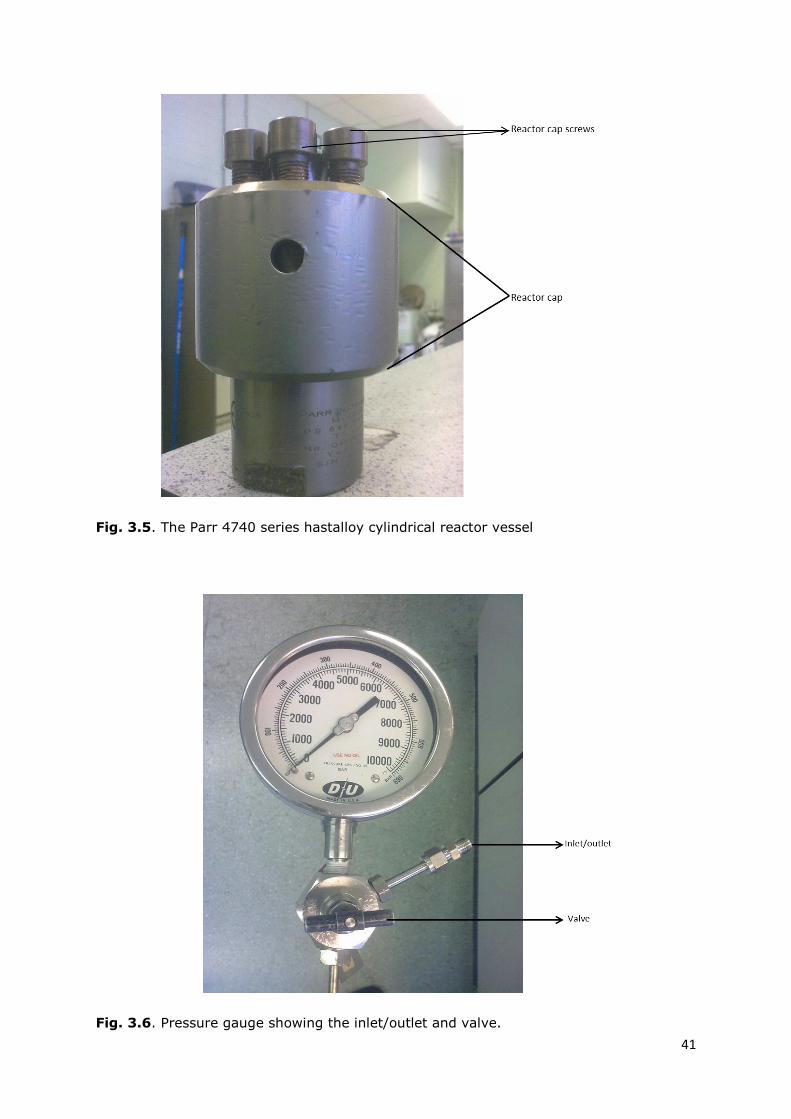
coals) at 350oC for 24 hours. Prior to heating, the sample was introduced into the Parr
4740 series hastalloy cylindrical pressure vessel with a 22 ml capacity (Fig. 3.5). 15 ml
of distilled water is added to the reactor after which the reactor was assembled and
connected to the pressure gauge rated to 690 bar (Fig 3.6). The reactor is flushed with
nitrogen after which nitrogen is pumped into the reactor at 2 bar pressure. This is to
produce a relatively inert atmosphere during the experiment. The volume of nitrogen
eventually retained in the system is measured after trapping the nitrogen for 1 minute.
41
Fig. 3.5. The Parr 4740 series hastalloy cylindrical reactor vessel
Fig. 3.6. Pressure gauge showing the inlet/outlet and valve.

42
The assembled reactor was then lowered into a pre-heated fluidised sand bath controlled
by an external temperature controller. During the experiment, the reaction temperature
is also monitored every 10 seconds by an additional K-type thermocouple connected to a
computer. The average temperature of the experiment is recorded form the computer
software just before the experiment is turned off. When the standard experimental time
has elapsed, the sand bath is turned off and the reactor is allowed to cool to ambient
temperature before product recovery.
3.2.5 Recovery and analysis of generated gas
The gas generated during the pyrolysis experiment was collected using a gas tight
syringe and immediately transferred to a gas bag for analysis. Analysis of the gas is
done on a Carlo Erba HRGC 5300 gas chromatograph fitted with FID and TCD detectors
operating at 200C and 180oC respectively. Hydrocarbon gases were determined by FID
using a Chrompak CPPorapakplotQ capillary column (with a 27.5 m x 0.32 mm, 10µm
film thickness) by injecting 10 µl of gas sample. Helium was the carrier gas used and an
oven temperature programme of 70C (hold 2 min) to 90C (3 min) at 40C min-1, then
to 140C (3 min) at 40C min-1 and finally to 180C (49 min) at 40C min-1. Individual
gas yields were determined quantitatively in relation to an external gas standard (pure
methane gas was used for this study). On completion of the experiment, the
chromatograms produced are analysed for gas areas which are used to calculate
individual gas volumes.
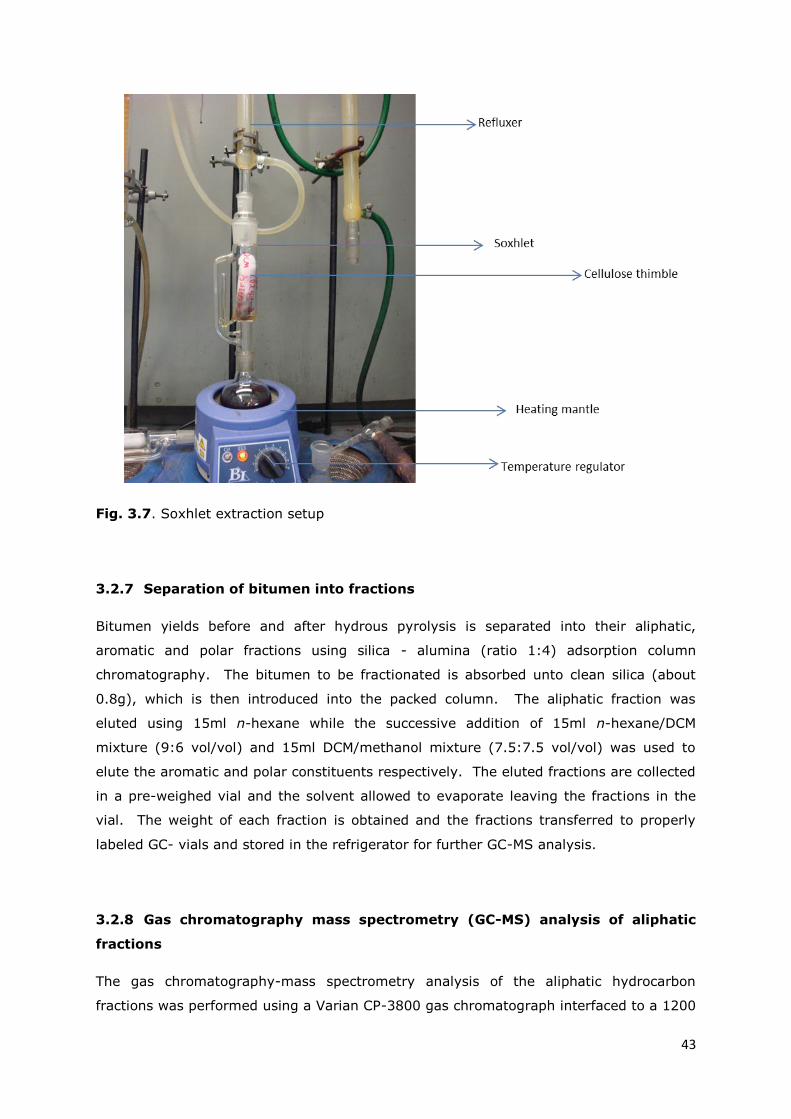
3.2.6 Recovery generated bitumen
The reactor vessel dismantled following gas collection and the water in the vessel is
carefully decanted into a glass beaker. The Samples retained in the pressure gauge are
forced out into a beaker by repeatedly injecting dichloromethane (DCM) into the gauge.
The reactor vessel and coal residue collected in a beaker are transferred to a vacuum
oven to dry at 45oC for 3 to 4 hours. The dry coal sample is then transferred to a pre-
extracted cellulose thimble for soxhlet extraction and the vessel is rinsed with DCM to
recover any product attached to the vessel wall. The reacted coal sample was extracted
using a 250ml dichloromethane (DCM)-methanol mixture (93:7 vol/vol) for 72 hours.
The dichloromethane-methanol mixture is separated from the generated bitumen using a
rotary evaporator and the extracted bitumen transferred into a pre-weighed vial and
allowed to evaporate. The coal residue is allowed to dry properly in a fume cupboard,
weighed, and transferred to a tightly capped vial for TOC content analysis.
43
Fig. 3.7. Soxhlet extraction setup
3.2.7 Separation of bitumen into fractions
Bitumen yields before and after hydrous pyrolysis is separated into their aliphatic,
aromatic and polar fractions using silica - alumina (ratio 1:4) adsorption column
chromatography. The bitumen to be fractionated is absorbed unto clean silica (about
0.8g), which is then introduced into the packed column. The aliphatic fraction was
eluted using 15ml n-hexane while the successive addition of 15ml n-hexane/DCM
mixture (9:6 vol/vol) and 15ml DCM/methanol mixture (7.5:7.5 vol/vol) was used to
elute the aromatic and polar constituents respectively. The eluted fractions are collected
in a pre-weighed vial and the solvent allowed to evaporate leaving the fractions in the
vial. The weight of each fraction is obtained and the fractions transferred to properly
labeled GC- vials and stored in the refrigerator for further GC-MS analysis.
3.2.8 Gas chromatography mass spectrometry (GC-MS) analysis of aliphatic
fractions
The gas chromatography-mass spectrometry analysis of the aliphatic hydrocarbon
fractions was performed using a Varian CP-3800 gas chromatograph interfaced to a 1200

44
Quadruple mass spectrometer (Electron ionisation mode, 70eV, source temperature
280oC). A VF-1MS fused silica column (50 m x 0.25 mm i.d., 0.25 µm thickness), with
helium as the carrier gas used to achieve separation. An oven programme of 50oC (hold
2 min) to 450oC (hold 33 min) at 5o/min was used. The aliphatic fractions were diluted
with 0.3 mL of dichloromethane and 1666 ng of cholane was injected into the samples to
serve as an internal standard. Analyses were performed in both full scan (m/z 50 –
450), selective ion response (SIR) modes (ions – m/z: 69, 71, 113, 149, 151, 177, 183,
191, 205, 217, 218, and 259 monitored).
45
CHAPTER FOUR
RESULTS AND DISCUSSION
Results from experiments conducted will be used to investigate evidences of petroleum
generation and migration within the Longyear seam. Hydrous pyrolysis and initial coal
extract yields will be useful in determining the generative capacity for the coal seam.
This will be backed up with other petroleum generation and maturity parameters like
vitrinite reflectance, hydrogen index, elemental and maceral composition. Aliphatic
aromatic and polar fractions from the pyrolysis and initial coal extract yields will also
serve as clues to the composition of the bitumen and will also be used to examine the
maturity and source of the bitumen present in the coal as well as petroleum migration
within the coal seam.
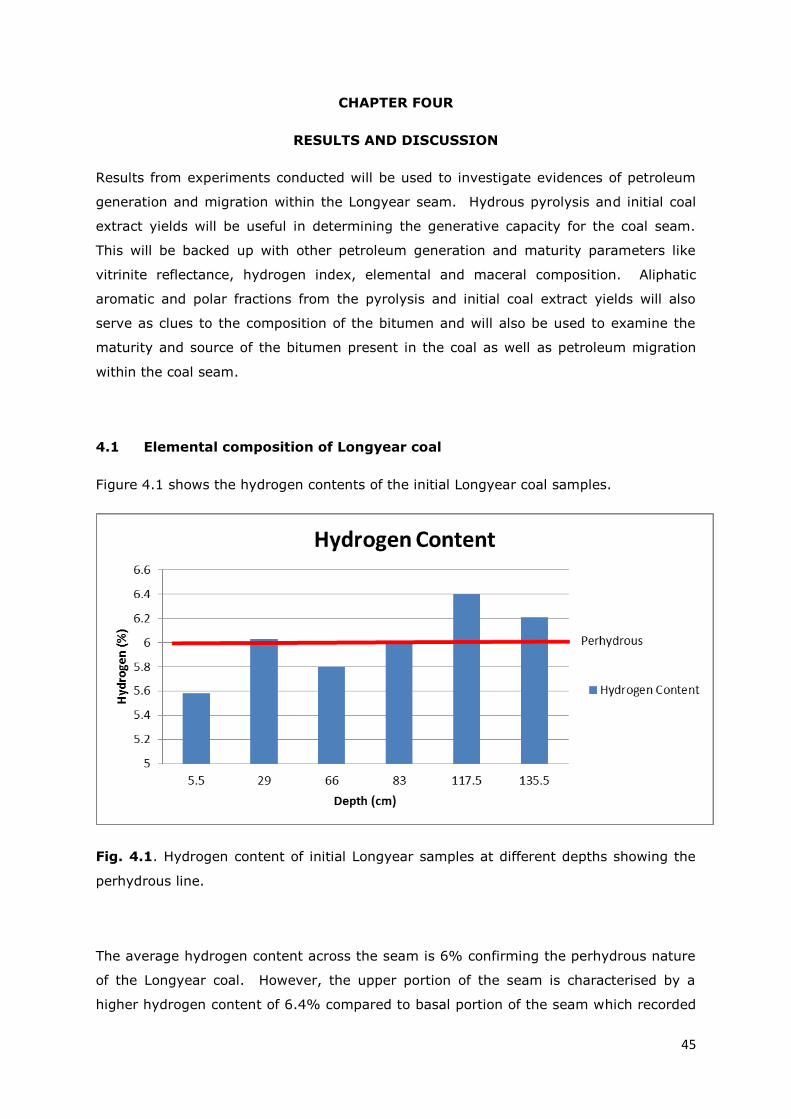
4.1 Elemental composition of Longyear coal
Figure 4.1 shows the hydrogen contents of the initial Longyear coal samples.
Fig. 4.1. Hydrogen content of initial Longyear samples at different depths showing the
perhydrous line.
The average hydrogen content across the seam is 6% confirming the perhydrous nature
of the Longyear coal. However, the upper portion of the seam is characterised by a
higher hydrogen content of 6.4% compared to basal portion of the seam which recorded
46
a hydrogen content of 5.6%. The relatively high hydrogen content of the Longyear coals
is due to the abundance of perhydrous vitrinites which has been reported by (Cmiel and
Fabianska, 2004). According to Teichmuller (1987), the presence of the perhydrous
vitrinites causes the coal organic matter to resemble type II organic matter. This is due
to the incorporation of lipids within the biopolymer derived from plant materials (lignin,
cellulose or tannings) which affects the chemical structure, properties and behavior of
perhydrous vitrinites, enabling them to expel petroleum-like products. This ultimately
affects the ability of such coals to generate and expel liquid hydrocarbons.
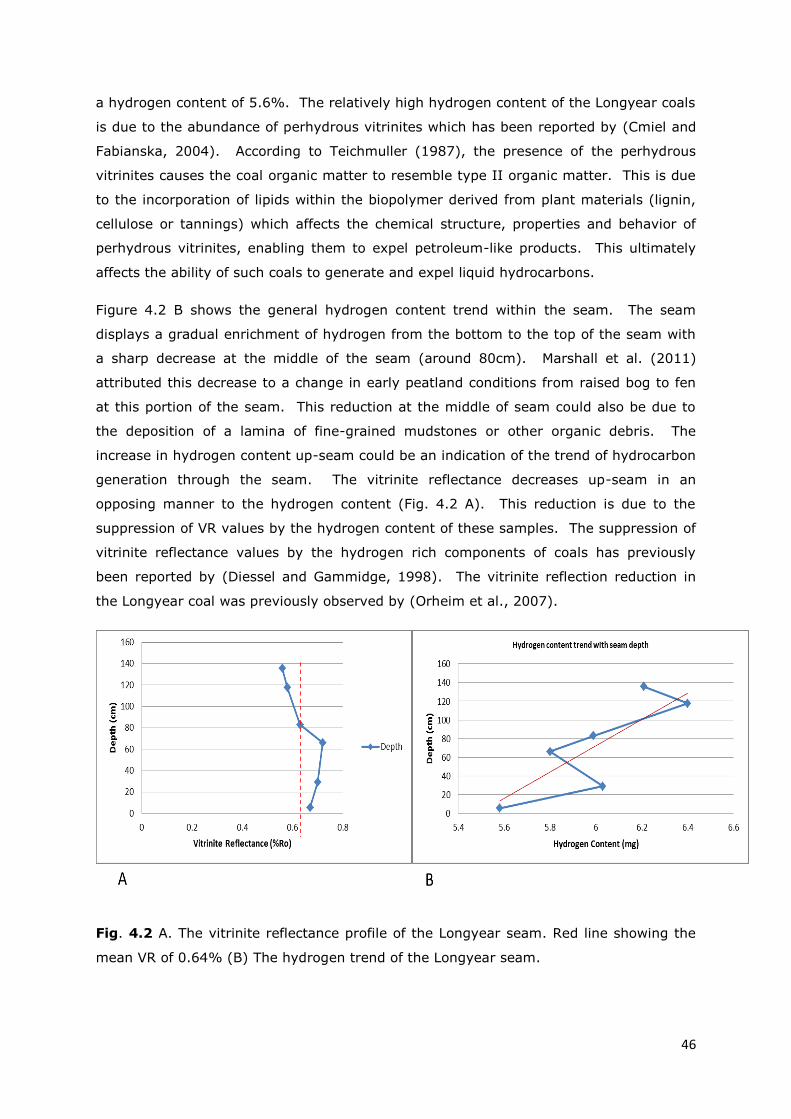
Figure 4.2 B shows the general hydrogen content trend within the seam. The seam
displays a gradual enrichment of hydrogen from the bottom to the top of the seam with
a sharp decrease at the middle of the seam (around 80cm). Marshall et al. (2011)
attributed this decrease to a change in early peatland conditions from raised bog to fen
at this portion of the seam. This reduction at the middle of seam could also be due to
the deposition of a lamina of fine-grained mudstones or other organic debris. The
increase in hydrogen content up-seam could be an indication of the trend of hydrocarbon
generation through the seam. The vitrinite reflectance decreases up-seam in an
opposing manner to the hydrogen content (Fig. 4.2 A). This reduction is due to the
suppression of VR values by the hydrogen content of these samples. The suppression of
vitrinite reflectance values by the hydrogen rich components of coals has previously
been reported by (Diessel and Gammidge, 1998). The vitrinite reflection reduction in
the Longyear coal was previously observed by (Orheim et al., 2007).
Fig. 4.2 A. The vitrinite reflectance profile of the Longyear seam. Red line showing the
mean VR of 0.64% (B) The hydrogen trend of the Longyear seam.
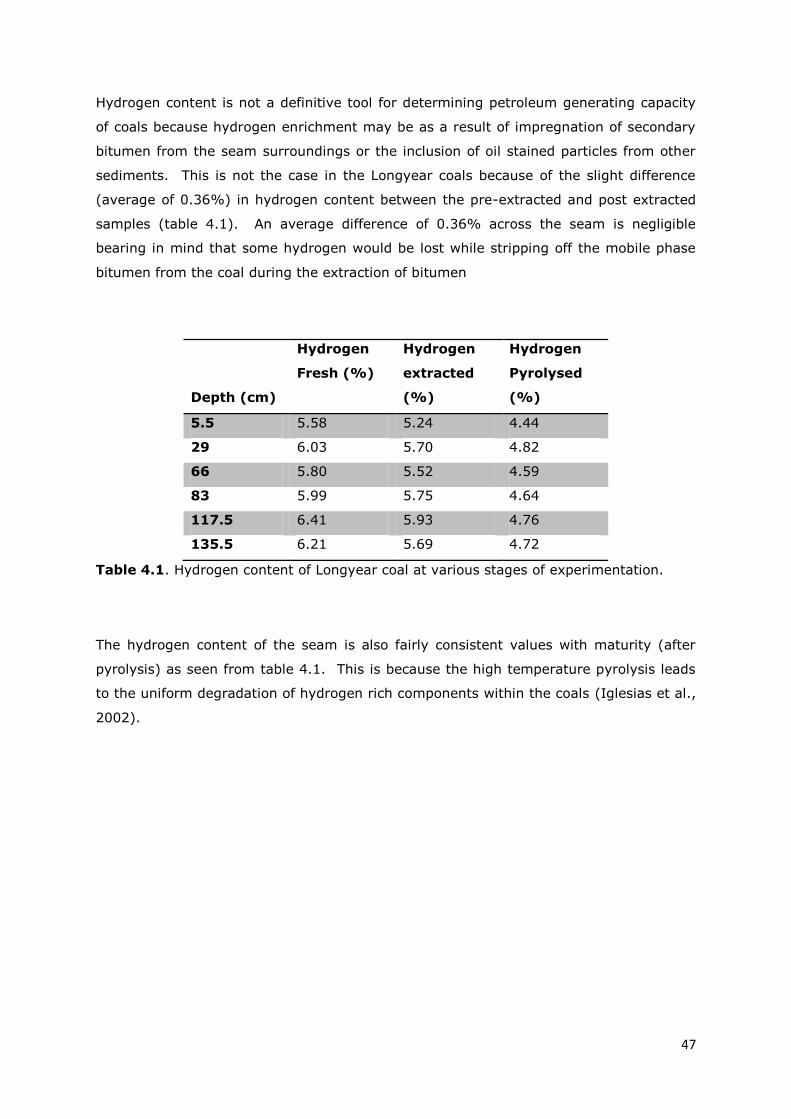
47
Hydrogen content is not a definitive tool for determining petroleum generating capacity
of coals because hydrogen enrichment may be as a result of impregnation of secondary
bitumen from the seam surroundings or the inclusion of oil stained particles from other
sediments. This is not the case in the Longyear coals because of the slight difference
(average of 0.36%) in hydrogen content between the pre-extracted and post extracted
samples (table 4.1). An average difference of 0.36% across the seam is negligible
bearing in mind that some hydrogen would be lost while stripping off the mobile phase
bitumen from the coal during the extraction of bitumen
Depth (cm)
Hydrogen
Fresh (%)
Hydrogen
extracted
(%)
Hydrogen
Pyrolysed
(%)
5.5 5.58 5.24 4.44
29 6.03 5.70 4.82
66 5.80 5.52 4.59
83 5.99 5.75 4.64
117.5 6.41 5.93 4.76
135.5 6.21 5.69 4.72
Table 4.1. Hydrogen content of Longyear coal at various stages of experimentation.
The hydrogen content of the seam is also fairly consistent values with maturity (after
pyrolysis) as seen from table 4.1. This is because the high temperature pyrolysis leads
to the uniform degradation of hydrogen rich components within the coals (Iglesias et al.,
2002).

48
Fig. 4.3. Hydrogen content of the Longyear coal samples showing a decrease in
hydrogen content with hydrocarbon generation.
The total organic carbon (TOC) content of the fresh Longyear coal samples fall between
the range of 80.07% - 82.66% which is fairly consistent with the 81% - 83.05% range
reported by Cmiel and Fabianska (2004) for the Longyear coals. An average of 3.5%
decrease in TOC values was observed after solvent extraction. This is due to a carbon
loss associated with the loss of hydrocarbons from the coal. After pyrolysis, the TOC
values increase when compared with the solvent extracted samples. This is expected
because during the process of coalification (which occurs during pyrolysis), there is a net
increase in carbon content with rank. Similar TOC values are observed between the
fresh samples and the mature samples with the only inconsistency at 117.5 cm probably
due to residual bitumen trapped in the sample. The proximity in TOC values is an
indication of the similarity in rank between the fresh and the mature samples.
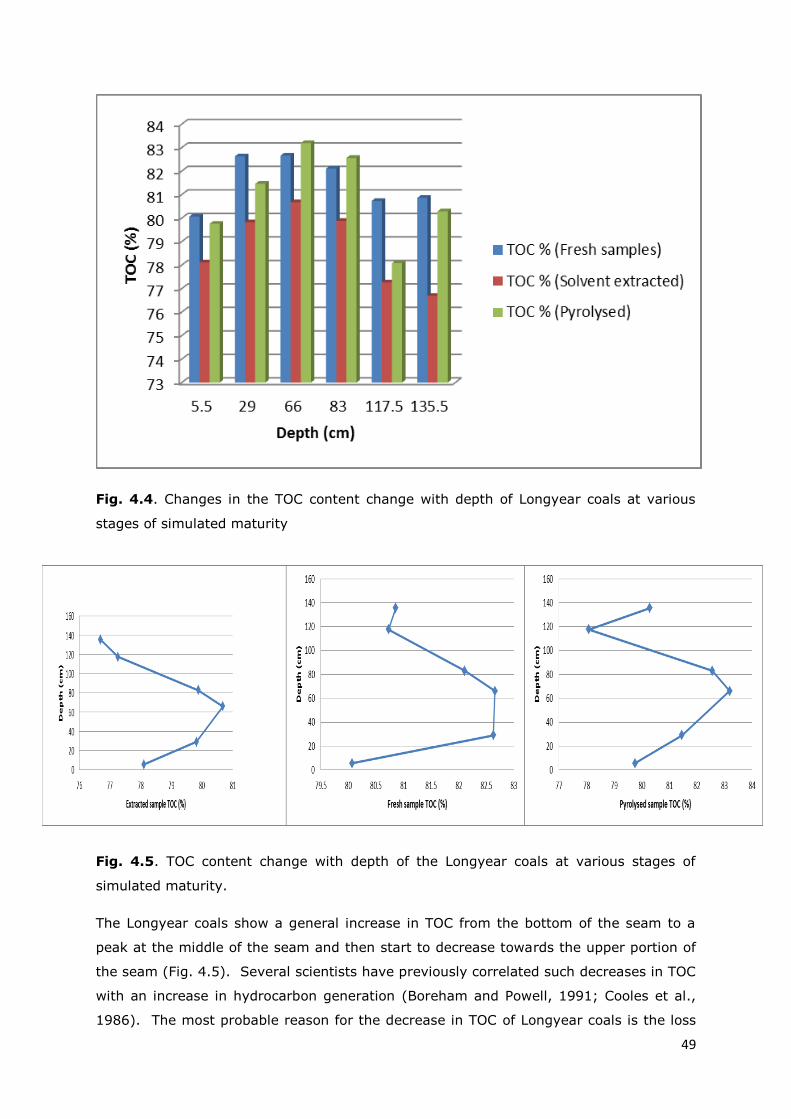
49
Fig. 4.4. Changes in the TOC content change with depth of Longyear coals at various
stages of simulated maturity
Fig. 4.5. TOC content change with depth of the Longyear coals at various stages of
simulated maturity.
The Longyear coals show a general increase in TOC from the bottom of the seam to a
peak at the middle of the seam and then start to decrease towards the upper portion of
the seam (Fig. 4.5). Several scientists have previously correlated such decreases in TOC
with an increase in hydrocarbon generation (Boreham and Powell, 1991; Cooles et al.,
1986). The most probable reason for the decrease in TOC of Longyear coals is the loss

50
of carbon in form of free-oil carbon in the samples that have yielded more hydrocarbons.
The TOC content of the Longyear coals falls within the range of some other proven oil
prone coals like those found in the Cooper and Taranaki basin (Curry et al., 1994).
4.2 Gas yields
The individual and total (C1 – C4) hydrocarbon yields generated from hydrous pyrolysis
are shown in Fig. 4.6. The range of gas generation for the Longyear coals after pyrolysis
at 350oC fall between 5.74 – 9.93 mg/g TOC (Fig. 4.6). The maximum value for gas
generated in this study is much lower than marine source rocks like the Kimmeridge clay
(24.06 mg/g TOC at 350oC) which is renowned for its accumulation of commercial
quantities of natural gas (Carr et al., 2009). However, it is believed that coals will
generate greater amounts of gas at higher thermal maturity. Although there is little
information available on the quantitative features of gas generation with relation to
maturity, Powell et al. (1991) were able to relate the abundance of gas fractions (C1-C4)
from the Walloon coal measures with an increase in maturity. Highest gas yield was
observed towards the top of the seam and also corresponded with the very higher
hydrogen content of the coals and lower TOC. The general trend of gaseous
hydrocarbon yields shows an increase from the bottom to the top of the seam (Fig. 4.7).
The prolific gas generation of the Longyear coal can be compared to the tertiary
Australian coals of the Cooper basin reported by (Vincent et al., 1985). At a thermal
maturity similar to that simulated in the Laboratory, the Longyear coals could have
sourced some of the commercial gas accumulations in the Barents Sea (that lies
between 74˚30'N and Spitsbergen).
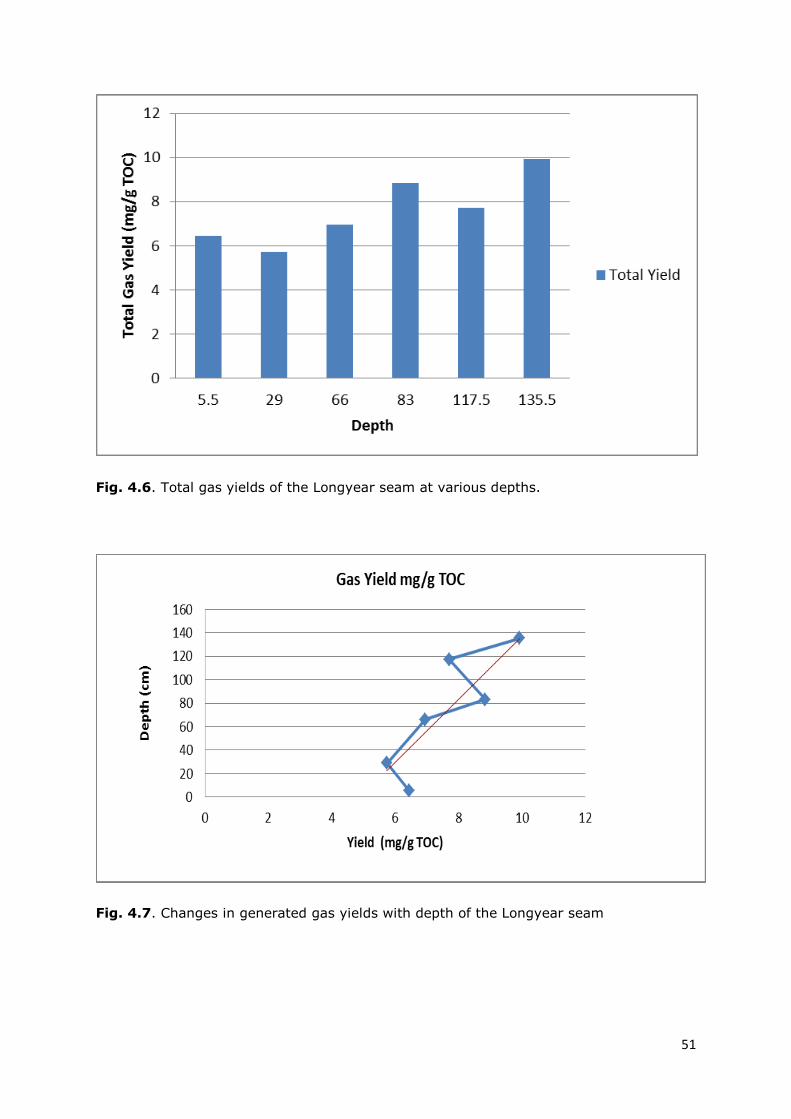
51
Fig. 4.6. Total gas yields of the Longyear seam at various depths.
Fig. 4.7. Changes in generated gas yields with depth of the Longyear seam
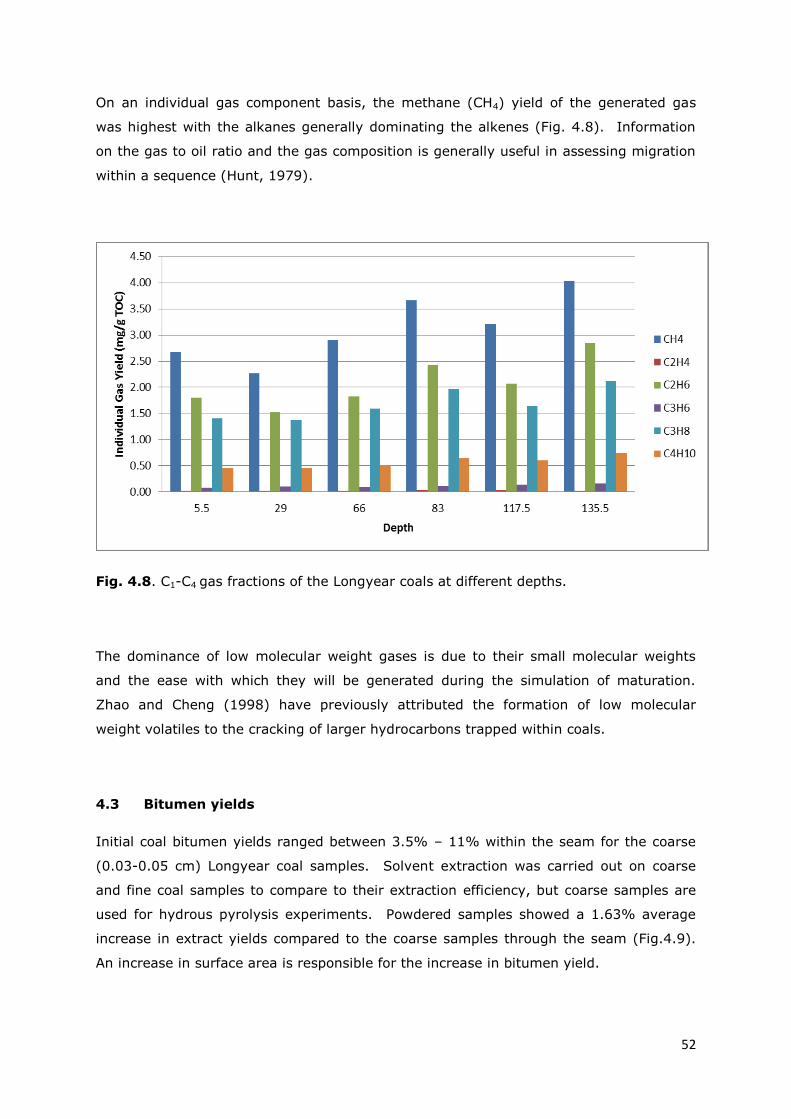
52
On an individual gas component basis, the methane (CH4) yield of the generated gas
was highest with the alkanes generally dominating the alkenes (Fig. 4.8). Information
on the gas to oil ratio and the gas composition is generally useful in assessing migration
within a sequence (Hunt, 1979).
Fig. 4.8. C1-C4 gas fractions of the Longyear coals at different depths.
The dominance of low molecular weight gases is due to their small molecular weights
and the ease with which they will be generated during the simulation of maturation.
Zhao and Cheng (1998) have previously attributed the formation of low molecular
weight volatiles to the cracking of larger hydrocarbons trapped within coals.
4.3 Bitumen yields
Initial coal bitumen yields ranged between 3.5% – 11% within the seam for the coarse
(0.03-0.05 cm) Longyear coal samples. Solvent extraction was carried out on coarse
and fine coal samples to compare to their extraction efficiency, but coarse samples are
used for hydrous pyrolysis experiments. Powdered samples showed a 1.63% average
increase in extract yields compared to the coarse samples through the seam (Fig.4.9).
An increase in surface area is responsible for the increase in bitumen yield.
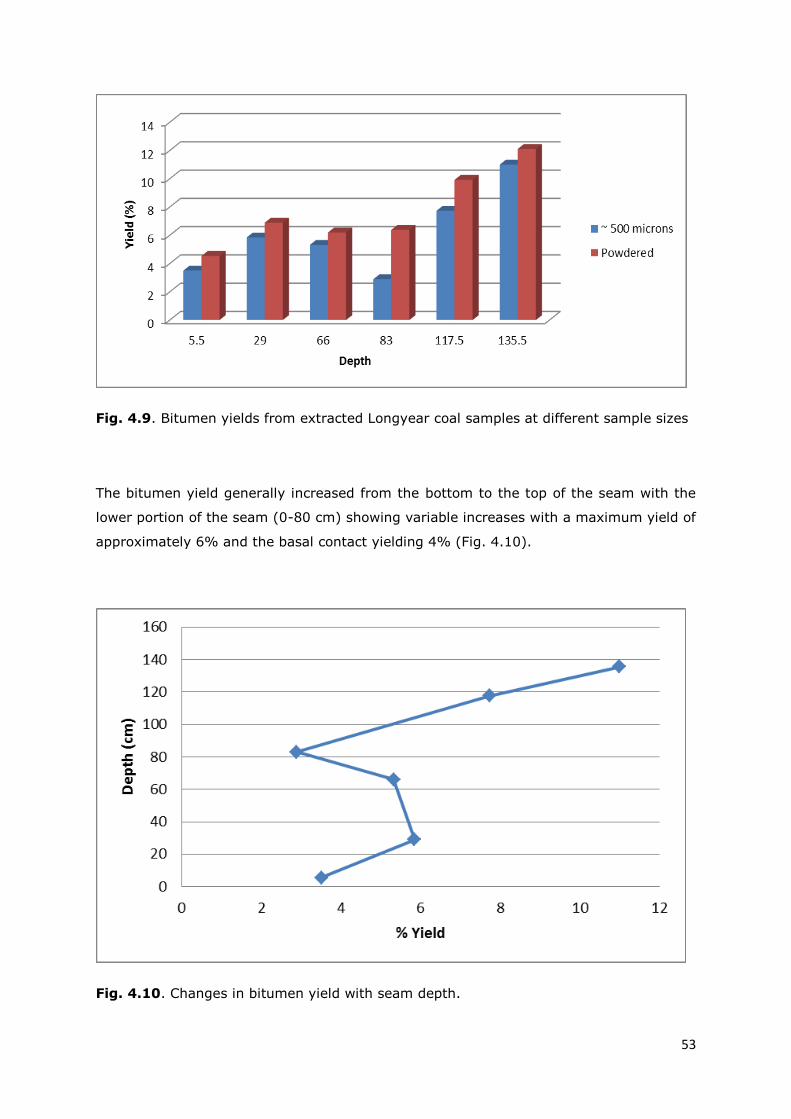
53
Fig. 4.9. Bitumen yields from extracted Longyear coal samples at different sample sizes
The bitumen yield generally increased from the bottom to the top of the seam with the
lower portion of the seam (0-80 cm) showing variable increases with a maximum yield of
approximately 6% and the basal contact yielding 4% (Fig. 4.10).
Fig. 4.10. Changes in bitumen yield with seam depth.
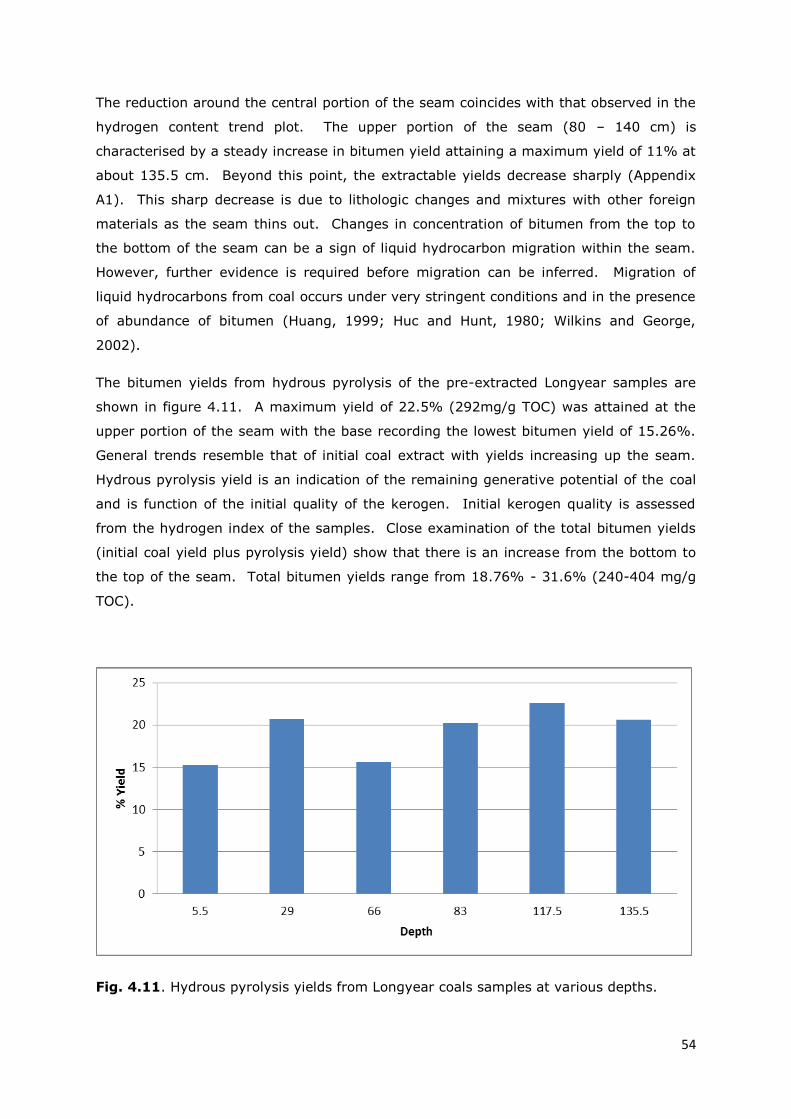
54
The reduction around the central portion of the seam coincides with that observed in the
hydrogen content trend plot. The upper portion of the seam (80 – 140 cm) is
characterised by a steady increase in bitumen yield attaining a maximum yield of 11% at
about 135.5 cm. Beyond this point, the extractable yields decrease sharply (Appendix
A1). This sharp decrease is due to lithologic changes and mixtures with other foreign
materials as the seam thins out. Changes in concentration of bitumen from the top to
the bottom of the seam can be a sign of liquid hydrocarbon migration within the seam.
However, further evidence is required before migration can be inferred. Migration of
liquid hydrocarbons from coal occurs under very stringent conditions and in the presence
of abundance of bitumen (Huang, 1999; Huc and Hunt, 1980; Wilkins and George,
2002).
The bitumen yields from hydrous pyrolysis of the pre-extracted Longyear samples are
shown in figure 4.11. A maximum yield of 22.5% (292mg/g TOC) was attained at the
upper portion of the seam with the base recording the lowest bitumen yield of 15.26%.
General trends resemble that of initial coal extract with yields increasing up the seam.
Hydrous pyrolysis yield is an indication of the remaining generative potential of the coal
and is function of the initial quality of the kerogen. Initial kerogen quality is assessed
from the hydrogen index of the samples. Close examination of the total bitumen yields
(initial coal yield plus pyrolysis yield) show that there is an increase from the bottom to
the top of the seam. Total bitumen yields range from 18.76% - 31.6% (240-404 mg/g
TOC).
Fig. 4.11. Hydrous pyrolysis yields from Longyear coals samples at various depths.
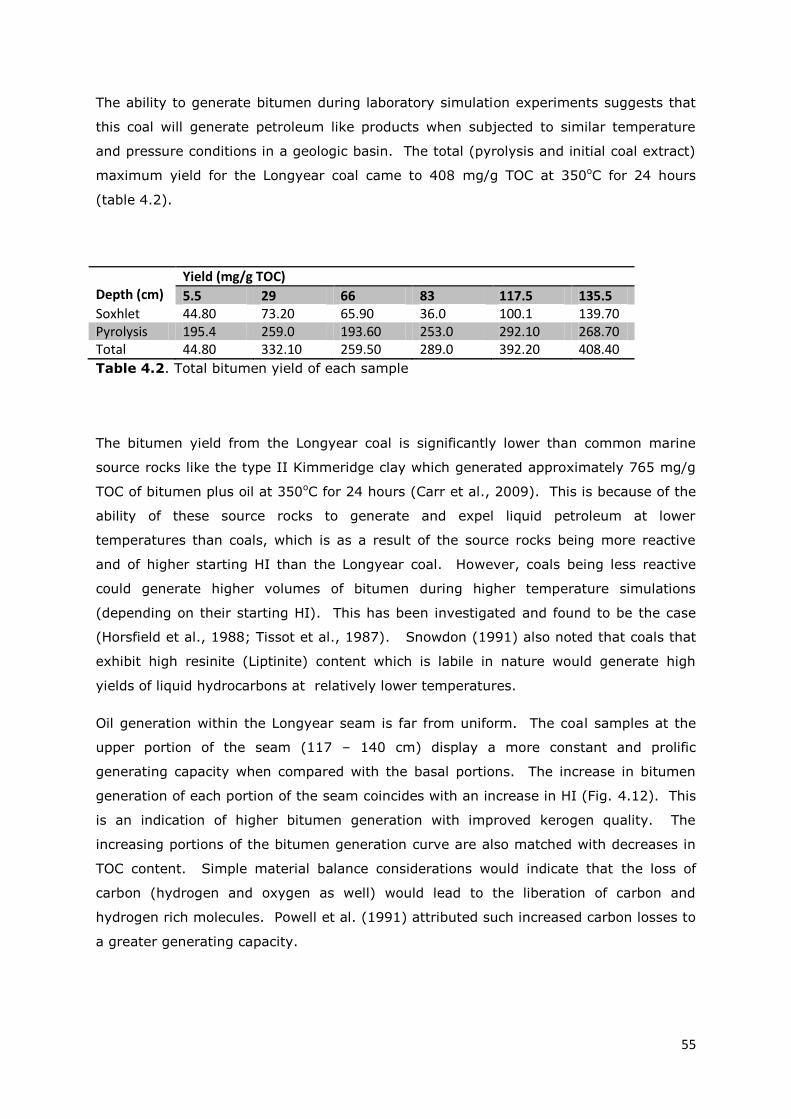
55
The ability to generate bitumen during laboratory simulation experiments suggests that
this coal will generate petroleum like products when subjected to similar temperature
and pressure conditions in a geologic basin. The total (pyrolysis and initial coal extract)
maximum yield for the Longyear coal came to 408 mg/g TOC at 350oC for 24 hours
(table 4.2).
Depth (cm)
Yield (mg/g TOC)
5.5 29 66 83 117.5 135.5 Soxhlet 44.80 73.20 65.90 36.0 100.1 139.70 Pyrolysis 195.4 259.0 193.60 253.0 292.10 268.70 Total 44.80 332.10 259.50 289.0 392.20 408.40
Table 4.2. Total bitumen yield of each sample
The bitumen yield from the Longyear coal is significantly lower than common marine
source rocks like the type II Kimmeridge clay which generated approximately 765 mg/g
TOC of bitumen plus oil at 350oC for 24 hours (Carr et al., 2009). This is because of the
ability of these source rocks to generate and expel liquid petroleum at lower
temperatures than coals, which is as a result of the source rocks being more reactive
and of higher starting HI than the Longyear coal. However, coals being less reactive
could generate higher volumes of bitumen during higher temperature simulations
(depending on their starting HI). This has been investigated and found to be the case
(Horsfield et al., 1988; Tissot et al., 1987). Snowdon (1991) also noted that coals that
exhibit high resinite (Liptinite) content which is labile in nature would generate high
yields of liquid hydrocarbons at relatively lower temperatures.
Oil generation within the Longyear seam is far from uniform. The coal samples at the
upper portion of the seam (117 – 140 cm) display a more constant and prolific
generating capacity when compared with the basal portions. The increase in bitumen
generation of each portion of the seam coincides with an increase in HI (Fig. 4.12). This
is an indication of higher bitumen generation with improved kerogen quality. The
increasing portions of the bitumen generation curve are also matched with decreases in
TOC content. Simple material balance considerations would indicate that the loss of
carbon (hydrogen and oxygen as well) would lead to the liberation of carbon and
hydrogen rich molecules. Powell et al. (1991) attributed such increased carbon losses to
a greater generating capacity.
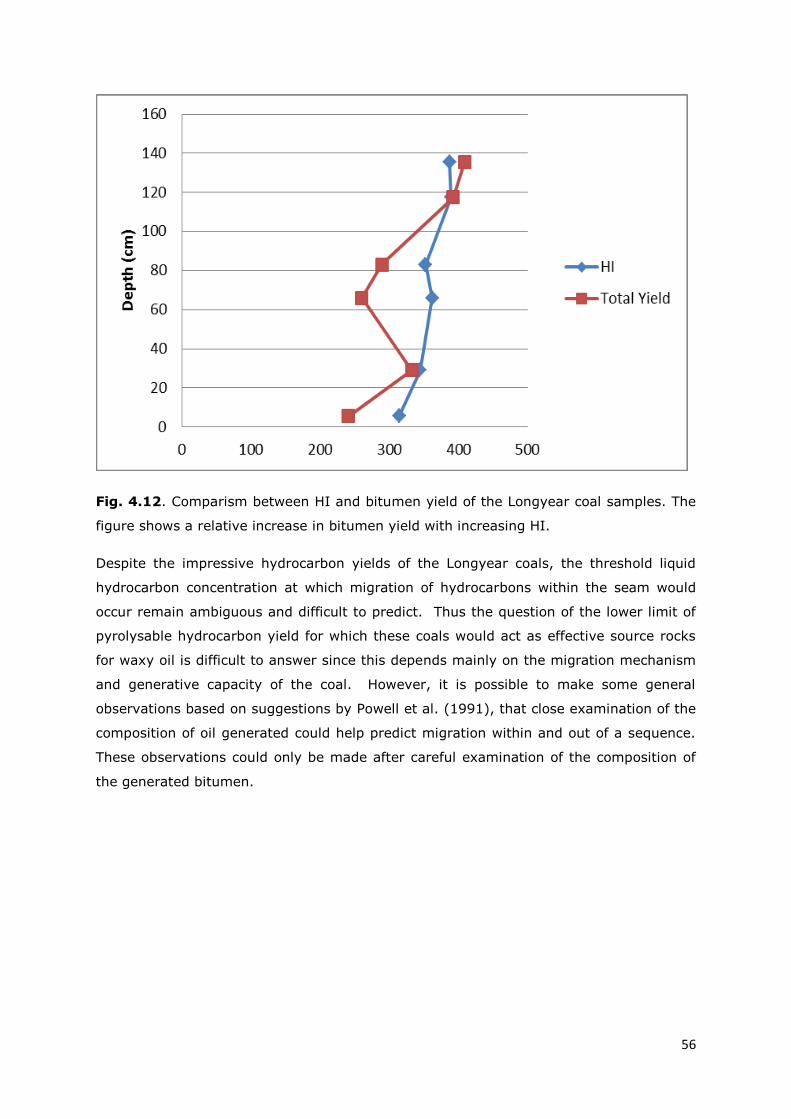
56
Fig. 4.12. Comparism between HI and bitumen yield of the Longyear coal samples. The
figure shows a relative increase in bitumen yield with increasing HI.
Despite the impressive hydrocarbon yields of the Longyear coals, the threshold liquid
hydrocarbon concentration at which migration of hydrocarbons within the seam would
occur remain ambiguous and difficult to predict. Thus the question of the lower limit of
pyrolysable hydrocarbon yield for which these coals would act as effective source rocks
for waxy oil is difficult to answer since this depends mainly on the migration mechanism
and generative capacity of the coal. However, it is possible to make some general
observations based on suggestions by Powell et al. (1991), that close examination of the
composition of oil generated could help predict migration within and out of a sequence.
These observations could only be made after careful examination of the composition of
the generated bitumen.

57
4.4 Bitumen composition
Table 4.3 shows the percentages of the aliphatic, aromatic and polar fractions present in
the bitumen at various depths.
Depth (cm)
Extracted Bitumen composition (%)
5.5 29 66 83 117.5 135.5 Aliphatics 11.42 13.01 11.97 12.36 6.06 6.10 Aromatics 33.46 30.14 25.70 42.18 35.93 24.41 Polar 38.98 52.05 51.06 30.55 42.86 52.20
Table 4.3. Percentage composition of fractions in initial the coal bitumen at various
depths.
A graphical representation of this table (Fig 4.13) shows a clear dominance of polar and
aromatic compounds throughout the seam. This initial polar dominance is truncated at
the middle portion of the seam with the aromatic compounds dominating. This
truncated region coincides with the portion where changes in TOC and hydrogen content
occurred and it supports evidence of paleoenvironmental change.
Fig. 4.13. Percentage composition of each fraction in extracted bitumen at various
depths.

58
The aliphatic fraction of the bitumen is of extreme importance because of its role in
determining the overall quality of the bitumen. This fraction has also been used to
assess oil migration within a sedimentary sequence by virtue of its ability to migrate
more freely than other fractions (Leythaeuser et al., 1988). The Longyear seam has its
highest aliphatic content of 13.01 % occurring at the lower portion of the seam and the
least content of 6.06 % at the upper portion. A plot of the aliphatic composition versus
depth is shown in figure 4.14. The plot shows a reducing aliphatic trend from the bottom
to the top of the seam. The seam base is characterized by approximately twice the
amount of aliphatics as the upper portion of the seam. The loss of lower molecular
weight hydrocarbon fractions from the bottom towards the top of the seam could be a
sign of hydrocarbon migration within the seam. Karlsen et al. (1988) observed this type
of light hydrocarbon redistribution with depth and attributed it to the effect of petroleum
migration within a sequence. Leythaeuser and Schaefer (1984) also noted that that
hydrocarbon migration is associated with compositional fractionation effects. For control
purposes, bitumen from a sample above (142.5 cm) the highest studied sample (135.5
cm) was fractionated. This sample yielded 5.60 % of aliphatics which was lower than
the 135.5 cm sample (Appendix A2).
Fig. 4.14. Change in aliphatic yields from initial coal extracts with depth of the seam.
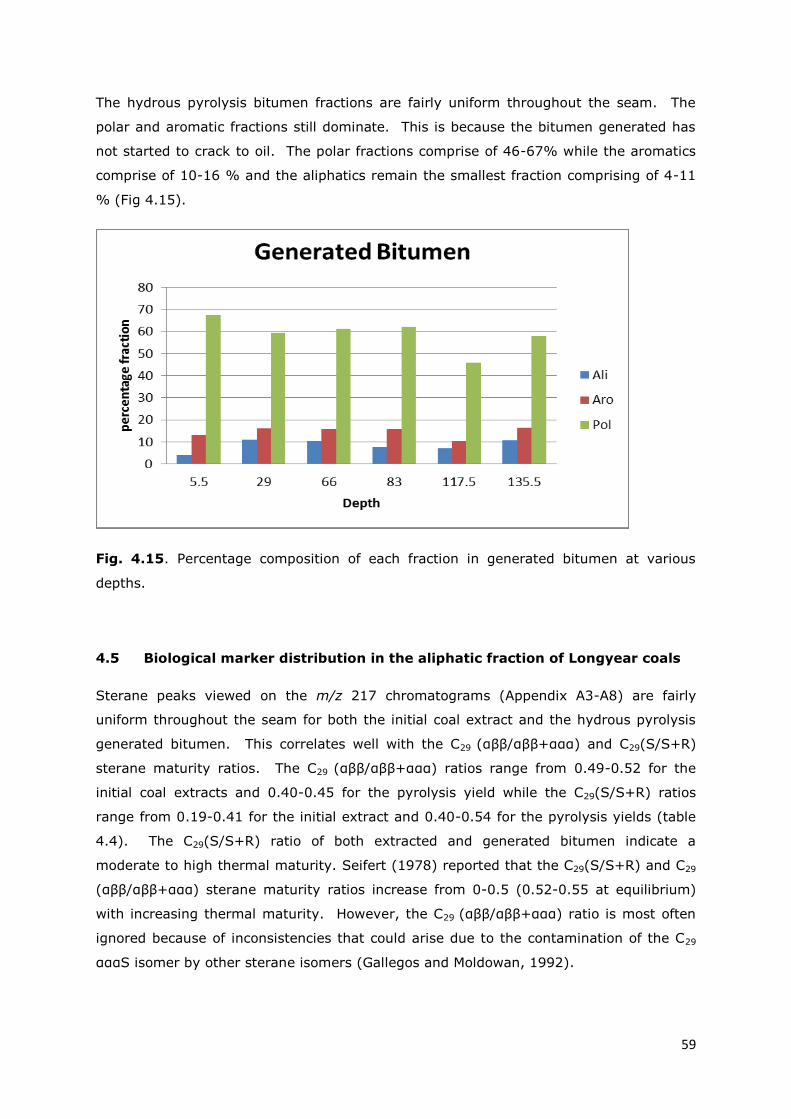
59
The hydrous pyrolysis bitumen fractions are fairly uniform throughout the seam. The
polar and aromatic fractions still dominate. This is because the bitumen generated has
not started to crack to oil. The polar fractions comprise of 46-67% while the aromatics
comprise of 10-16 % and the aliphatics remain the smallest fraction comprising of 4-11
% (Fig 4.15).
Fig. 4.15. Percentage composition of each fraction in generated bitumen at various
depths.
4.5 Biological marker distribution in the aliphatic fraction of Longyear coals
Sterane peaks viewed on the m/z 217 chromatograms (Appendix A3-A8) are fairly
uniform throughout the seam for both the initial coal extract and the hydrous pyrolysis
generated bitumen. This correlates well with the C29 (αββ/αββ+ααα) and C29(S/S+R)
sterane maturity ratios. The C29 (αββ/αββ+ααα) ratios range from 0.49-0.52 for the
initial coal extracts and 0.40-0.45 for the pyrolysis yield while the C29(S/S+R) ratios
range from 0.19-0.41 for the initial extract and 0.40-0.54 for the pyrolysis yields (table
4.4). The C29(S/S+R) ratio of both extracted and generated bitumen indicate a
moderate to high thermal maturity. Seifert (1978) reported that the C29(S/S+R) and C29
(αββ/αββ+ααα) sterane maturity ratios increase from 0-0.5 (0.52-0.55 at equilibrium)
with increasing thermal maturity. However, the C29 (αββ/αββ+ααα) ratio is most often
ignored because of inconsistencies that could arise due to the contamination of the C29
αααS isomer by other sterane isomers (Gallegos and Moldowan, 1992).
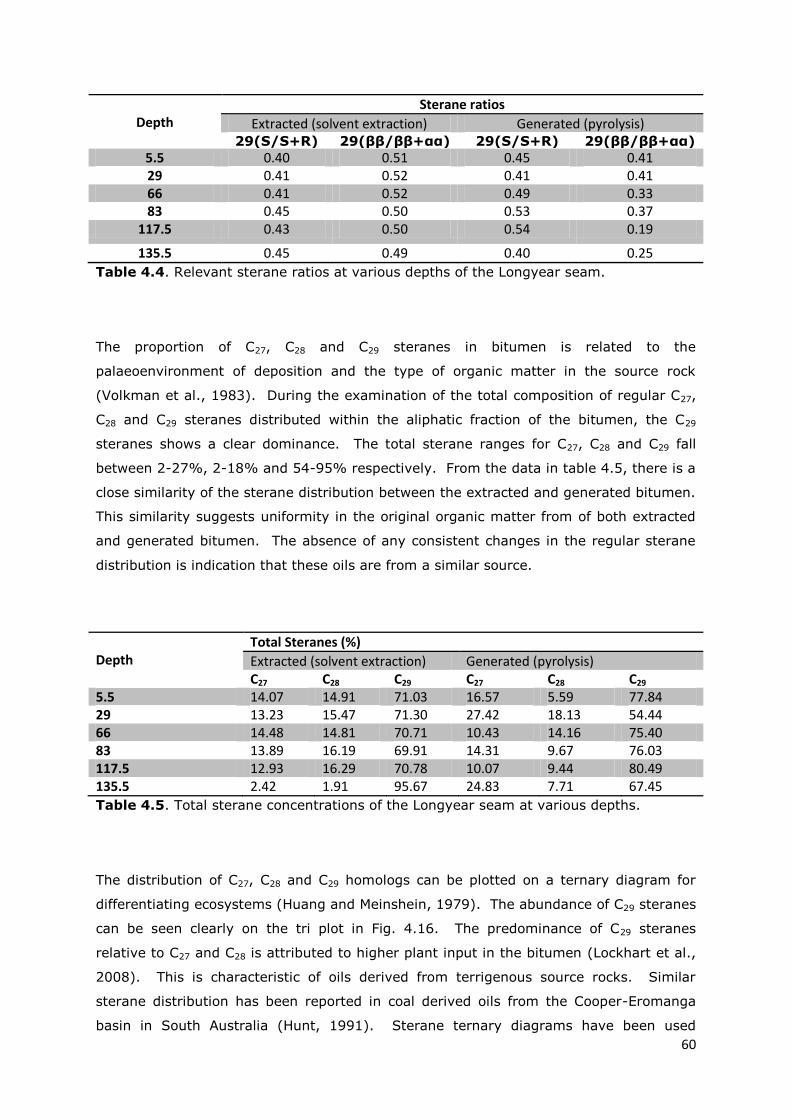
60
Depth
Sterane ratios
Extracted (solvent extraction) Generated (pyrolysis) 29(S/S+R) 29(ββ/ββ+αα) 29(S/S+R) 29(ββ/ββ+αα)
5.5 0.40 0.51 0.45 0.41 29 0.41 0.52 0.41 0.41 66 0.41 0.52 0.49 0.33 83 0.45 0.50 0.53 0.37
117.5 0.43 0.50 0.54 0.19
135.5 0.45 0.49 0.40 0.25
Table 4.4. Relevant sterane ratios at various depths of the Longyear seam.
The proportion of C27, C28 and C29 steranes in bitumen is related to the
palaeoenvironment of deposition and the type of organic matter in the source rock
(Volkman et al., 1983). During the examination of the total composition of regular C27,
C28 and C29 steranes distributed within the aliphatic fraction of the bitumen, the C29
steranes shows a clear dominance. The total sterane ranges for C27, C28 and C29 fall
between 2-27%, 2-18% and 54-95% respectively. From the data in table 4.5, there is a
close similarity of the sterane distribution between the extracted and generated bitumen.
This similarity suggests uniformity in the original organic matter from of both extracted
and generated bitumen. The absence of any consistent changes in the regular sterane
distribution is indication that these oils are from a similar source.
Depth
Total Steranes (%)
Extracted (solvent extraction) Generated (pyrolysis) C27 C28 C29 C27 C28 C29
5.5 14.07 14.91 71.03 16.57 5.59 77.84 29 13.23 15.47 71.30 27.42 18.13 54.44 66 14.48 14.81 70.71 10.43 14.16 75.40 83 13.89 16.19 69.91 14.31 9.67 76.03 117.5 12.93 16.29 70.78 10.07 9.44 80.49 135.5 2.42 1.91 95.67 24.83 7.71 67.45
Table 4.5. Total sterane concentrations of the Longyear seam at various depths.
The distribution of C27, C28 and C29 homologs can be plotted on a ternary diagram for
differentiating ecosystems (Huang and Meinshein, 1979). The abundance of C29 steranes
can be seen clearly on the tri plot in Fig. 4.16. The predominance of C29 steranes
relative to C27 and C28 is attributed to higher plant input in the bitumen (Lockhart et al.,
2008). This is characteristic of oils derived from terrigenous source rocks. Similar
sterane distribution has been reported in coal derived oils from the Cooper-Eromanga
basin in South Australia (Hunt, 1991). Sterane ternary diagrams have been used
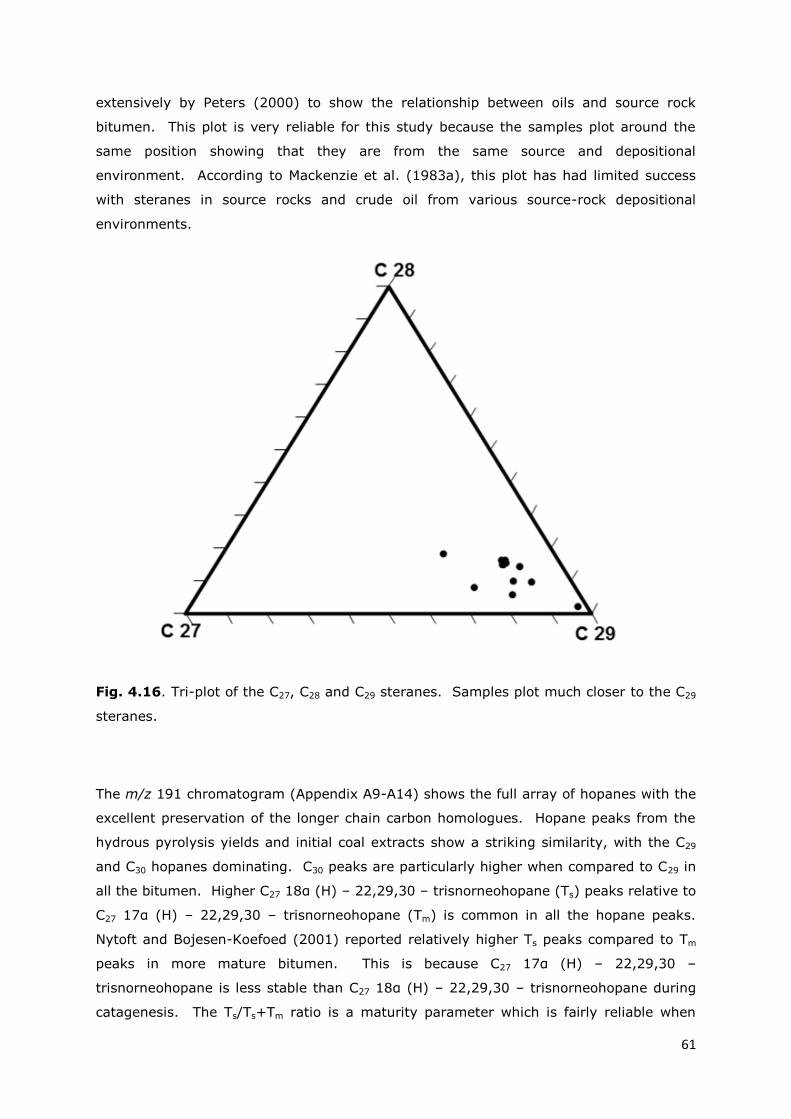
61
extensively by Peters (2000) to show the relationship between oils and source rock
bitumen. This plot is very reliable for this study because the samples plot around the
same position showing that they are from the same source and depositional
environment. According to Mackenzie et al. (1983a), this plot has had limited success
with steranes in source rocks and crude oil from various source-rock depositional
environments.
Fig. 4.16. Tri-plot of the C27, C28 and C29 steranes. Samples plot much closer to the C29
steranes.
The m/z 191 chromatogram (Appendix A9-A14) shows the full array of hopanes with the
excellent preservation of the longer chain carbon homologues. Hopane peaks from the
hydrous pyrolysis yields and initial coal extracts show a striking similarity, with the C29
and C30 hopanes dominating. C30 peaks are particularly higher when compared to C29 in
all the bitumen. Higher C27 18α (H) – 22,29,30 – trisnorneohopane (Ts) peaks relative to
C27 17α (H) – 22,29,30 – trisnorneohopane (Tm) is common in all the hopane peaks.
Nytoft and Bojesen-Koefoed (2001) reported relatively higher Ts peaks compared to Tm
peaks in more mature bitumen. This is because C27 17α (H) – 22,29,30 –
trisnorneohopane is less stable than C27 18α (H) – 22,29,30 – trisnorneohopane during
catagenesis. The Ts/Ts+Tm ratio is a maturity parameter which is fairly reliable when
62
evaluating bitumen from a common source (Philp and Gilbert, 1982). The Ts/Ts+Tm ratio
ranges for both oils are uniform throughout the seam averaging 0.94 and 0.89 for the
extracted and generated bitumen respectively (table 4.6). This ratio increases with
thermal maturity and approaches equilibrium at 0.8 (Seifert et al., 1980). The
uniformity of this maturity ratio in both extracted and generated bitumen is a further
indication that they are of the same source.
The stereoisomer ratios (S and R) can be calculated for any of the C31 to C35 compounds.
Typically, the C31 and C32 homohopane proportions are used to calculate the S/S+R
ratios. The C31 hopane ratios for the initial coal bitumen extracts fall in the range of
0.60-0.61 and 0.58-0.60 for the generated bitumen. The C32 ratio is fairly similar, falling
in the range of 0.57-0.59 and 0.56-0.58 for extracted and generated bitumen
respectively (table 4.6). The S/S+R ratio incerases from 0-0.60 (0.57-0.62 representing
an equilibrium maturity range) during maturation (Seifert et al., 1980). Average values
for C31 homologue is 0.60 for bitumen extracts and 0.59 for the generated bitumen. The
C32 hopanes show averages of 0.58 and 0.57 for the extracted and generated bitumen
respectively. These values are higher than the 0.55 and 0.58 averages reported for low
maturity crude oils (Zumberge, 1987b). Ratios within the 0.57-0.62 range indicate that
the essential phase of petroleum generation has been attained or probably surpassed
(Moldowan et al., 1995). However some sediments have generated liquid hydrocarbons
at S/S+R hopane ratios less than 0.5 by virtue of increased thermal stress. Such
sediments have been observed in the Grippsland basin and have been extensively
discussed by (Philp and Gilbert, 1982). The average S/S+R ratio for the extracted
Longyear coals approach an equilibrium value of 0.59 at a mean vitrinite reflectance of
0.64% Ro. Immediately this equilibrium is reached, these ratios remain constant,
providing no further maturity information. This is observed by the negligible difference
in difference (0.01) in average equilibrium ratios between the extracted and generated
bitumen samples. Hence, these ratios can be calibrated against other maturity
parameters (such as HI and VR) and regarded as the mean entry maturity values for
petroleum generation in the Longyear coals.

63
Depth
Hopane ratios
Extracted (solvent extraction) Generated (pyrolysis) C31(S/S+R
) C32(S/S+R
) Ts/Ts+T
m C31(S/S+R
) C32(S/S+R
) Ts/Ts+T
m 5.5 0.60 0.57 0.94 0.59 0.58 0.89 29 0.61 0.58 0.93 0.59 0.57 0.92 66 0.61 0.58 0.93 0.60 0.56 0.87 83 0.60 0.59 0.95 0.59 0.58 0.89 117.5 0.60 0.57 0.94 0.58 0.57 0.92 135.5 0.60 0.59 0.93 0.58 0.58 0.89
Table 4.6. Relevant hopane ratios at various depths of the Longyear seam.
The effectiveness in which hopanes are used to predict thermal maturity is often affected
by the effects of biodegradation in oils. The destruction of hopanes has been observed
in severely biodegraded oils. Alexander et al. (1981) also reported the relative
susceptibility of αβ hopanes to biodegradation when compared with the βα hopanes.
Hence an enrichment of βα hopanes can serve as an indication of biodegradation.
However, the excellent preservation of hopanes in the oils derived from the Longyear
coals is an indication that these oils have not been biologically degraded at any portion
of the seam. The uniform preservation of the αβ hopanes in the extracted and
generated bitumen reduces any possibility of biodegradation. Hence, hopane ratios
serve as one of the most reliable tools in determining and correlating the maturity of oils
from the Longyear coals.
Isoprenoid and n-alkane distribution were viewed on the m/z 71 chromatograms
(Appendix A15-A20). Bitumen extracts are dominated by long chain n-alkane series
starting around C15 and diminishing on the chromatogram at around C34. This range of
n-alkane is expected from high wax oils which are mainly derived from terrigenous
sources (Hedberg, 1968). Although oils from terrigenous sources have high wax
content, not all waxy oil samples are necessarily terrigenous, hence care should be taken
not to draw early conclusions on this basis. Certain n-alkane ratios can be applied in the
identification the primary source input in bitumen. The amount of land plant input
relative to that of marine organisms in bitumen can be ascertained using the terrigenous
aquatic ratio (TAR) (Peters et al., 2007). The TAR is derived from the equation, TAR =
(nC27+nC29+nC31)/(nC15+nC17+nC19). Higher TAR values indicate greater terrigenous
input relative to aquatic sources (Bourbonniere and Meyers, 1996). TAR values for the
extracted bitumen range between 0.7-2 while those for the generated bitumen range
between 0.4-0.6. The generally low TAR values and the inconsistency of the values are
attributed to the high sensitivity of TAR to maturity and biodegradation (Moldowan et al.,
1995). The relative abundance of odd against even carbon numbered n-alkanes
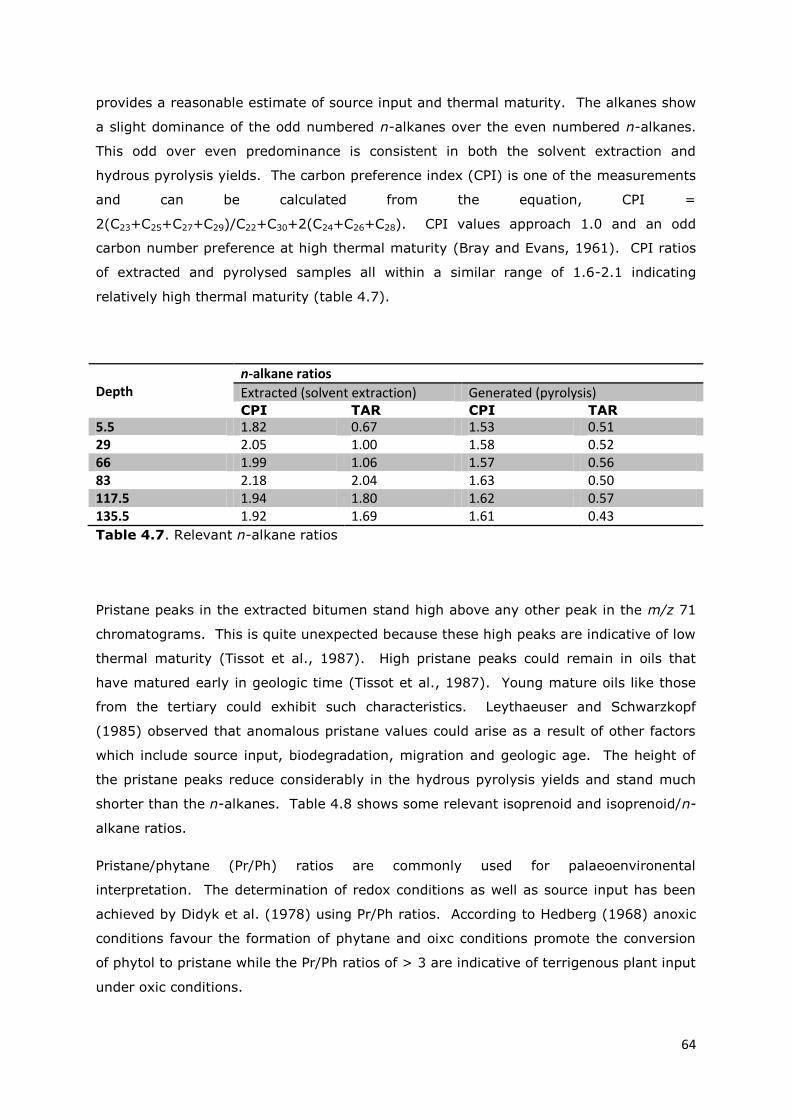
64
provides a reasonable estimate of source input and thermal maturity. The alkanes show
a slight dominance of the odd numbered n-alkanes over the even numbered n-alkanes.
This odd over even predominance is consistent in both the solvent extraction and
hydrous pyrolysis yields. The carbon preference index (CPI) is one of the measurements
and can be calculated from the equation, CPI =
2(C23+C25+C27+C29)/C22+C30+2(C24+C26+C28). CPI values approach 1.0 and an odd
carbon number preference at high thermal maturity (Bray and Evans, 1961). CPI ratios
of extracted and pyrolysed samples all within a similar range of 1.6-2.1 indicating
relatively high thermal maturity (table 4.7).
Depth
n-alkane ratios
Extracted (solvent extraction) Generated (pyrolysis) CPI TAR CPI TAR
5.5 1.82 0.67 1.53 0.51 29 2.05 1.00 1.58 0.52 66 1.99 1.06 1.57 0.56 83 2.18 2.04 1.63 0.50 117.5 1.94 1.80 1.62 0.57 135.5 1.92 1.69 1.61 0.43
Table 4.7. Relevant n-alkane ratios
Pristane peaks in the extracted bitumen stand high above any other peak in the m/z 71
chromatograms. This is quite unexpected because these high peaks are indicative of low
thermal maturity (Tissot et al., 1987). High pristane peaks could remain in oils that
have matured early in geologic time (Tissot et al., 1987). Young mature oils like those
from the tertiary could exhibit such characteristics. Leythaeuser and Schwarzkopf
(1985) observed that anomalous pristane values could arise as a result of other factors
which include source input, biodegradation, migration and geologic age. The height of
the pristane peaks reduce considerably in the hydrous pyrolysis yields and stand much
shorter than the n-alkanes. Table 4.8 shows some relevant isoprenoid and isoprenoid/n-
alkane ratios.
Pristane/phytane (Pr/Ph) ratios are commonly used for palaeoenvironental
interpretation. The determination of redox conditions as well as source input has been
achieved by Didyk et al. (1978) using Pr/Ph ratios. According to Hedberg (1968) anoxic
conditions favour the formation of phytane and oixc conditions promote the conversion
of phytol to pristane while the Pr/Ph ratios of > 3 are indicative of terrigenous plant input
under oxic conditions.
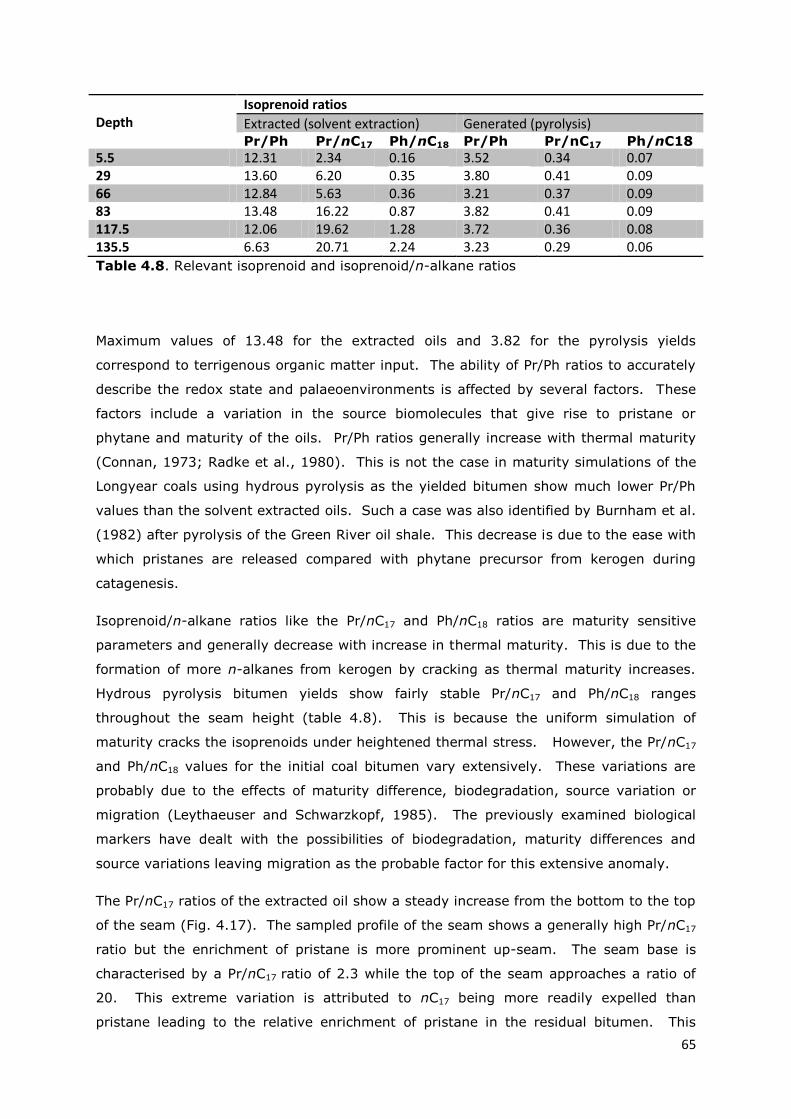
65
Depth
Isoprenoid ratios
Extracted (solvent extraction) Generated (pyrolysis) Pr/Ph Pr/nC17 Ph/nC18 Pr/Ph Pr/nC17 Ph/nC18
5.5 12.31 2.34 0.16 3.52 0.34 0.07 29 13.60 6.20 0.35 3.80 0.41 0.09 66 12.84 5.63 0.36 3.21 0.37 0.09 83 13.48 16.22 0.87 3.82 0.41 0.09 117.5 12.06 19.62 1.28 3.72 0.36 0.08 135.5 6.63 20.71 2.24 3.23 0.29 0.06
Table 4.8. Relevant isoprenoid and isoprenoid/n-alkane ratios
Maximum values of 13.48 for the extracted oils and 3.82 for the pyrolysis yields
correspond to terrigenous organic matter input. The ability of Pr/Ph ratios to accurately
describe the redox state and palaeoenvironments is affected by several factors. These
factors include a variation in the source biomolecules that give rise to pristane or
phytane and maturity of the oils. Pr/Ph ratios generally increase with thermal maturity
(Connan, 1973; Radke et al., 1980). This is not the case in maturity simulations of the
Longyear coals using hydrous pyrolysis as the yielded bitumen show much lower Pr/Ph
values than the solvent extracted oils. Such a case was also identified by Burnham et al.
(1982) after pyrolysis of the Green River oil shale. This decrease is due to the ease with
which pristanes are released compared with phytane precursor from kerogen during
catagenesis.
Isoprenoid/n-alkane ratios like the Pr/nC17 and Ph/nC18 ratios are maturity sensitive
parameters and generally decrease with increase in thermal maturity. This is due to the
formation of more n-alkanes from kerogen by cracking as thermal maturity increases.
Hydrous pyrolysis bitumen yields show fairly stable Pr/nC17 and Ph/nC18 ranges
throughout the seam height (table 4.8). This is because the uniform simulation of
maturity cracks the isoprenoids under heightened thermal stress. However, the Pr/nC17
and Ph/nC18 values for the initial coal bitumen vary extensively. These variations are
probably due to the effects of maturity difference, biodegradation, source variation or
migration (Leythaeuser and Schwarzkopf, 1985). The previously examined biological
markers have dealt with the possibilities of biodegradation, maturity differences and
source variations leaving migration as the probable factor for this extensive anomaly.
The Pr/nC17 ratios of the extracted oil show a steady increase from the bottom to the top
of the seam (Fig. 4.17). The sampled profile of the seam shows a generally high Pr/nC17
ratio but the enrichment of pristane is more prominent up-seam. The seam base is
characterised by a Pr/nC17 ratio of 2.3 while the top of the seam approaches a ratio of
20. This extreme variation is attributed to nC17 being more readily expelled than
pristane leading to the relative enrichment of pristane in the residual bitumen. This
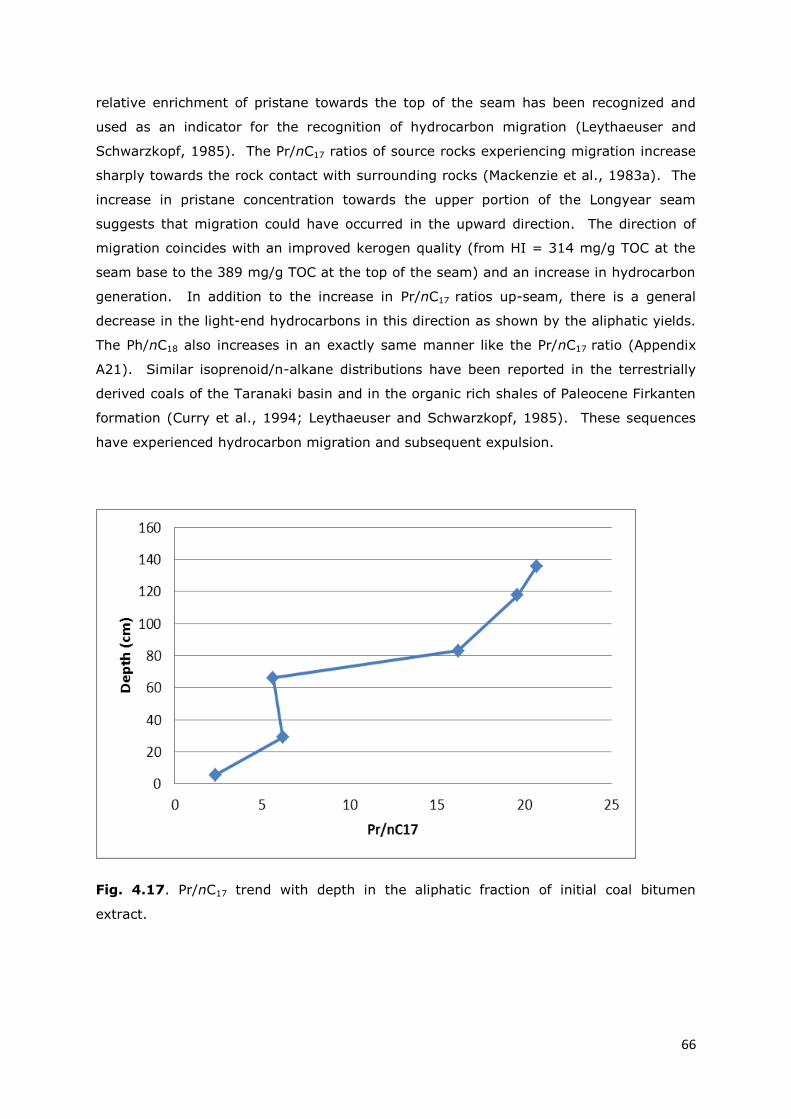
66
relative enrichment of pristane towards the top of the seam has been recognized and
used as an indicator for the recognition of hydrocarbon migration (Leythaeuser and
Schwarzkopf, 1985). The Pr/nC17 ratios of source rocks experiencing migration increase
sharply towards the rock contact with surrounding rocks (Mackenzie et al., 1983a). The
increase in pristane concentration towards the upper portion of the Longyear seam
suggests that migration could have occurred in the upward direction. The direction of
migration coincides with an improved kerogen quality (from HI = 314 mg/g TOC at the
seam base to the 389 mg/g TOC at the top of the seam) and an increase in hydrocarbon
generation. In addition to the increase in Pr/nC17 ratios up-seam, there is a general
decrease in the light-end hydrocarbons in this direction as shown by the aliphatic yields.
The Ph/nC18 also increases in an exactly same manner like the Pr/nC17 ratio (Appendix
A21). Similar isoprenoid/n-alkane distributions have been reported in the terrestrially
derived coals of the Taranaki basin and in the organic rich shales of Paleocene Firkanten
formation (Curry et al., 1994; Leythaeuser and Schwarzkopf, 1985). These sequences
have experienced hydrocarbon migration and subsequent expulsion.
Fig. 4.17. Pr/nC17 trend with depth in the aliphatic fraction of initial coal bitumen
extract.
67
CHAPTER FIVE
CONCLUSIONS AND FUTURE WORK
5.1 Conclusion
This study was aimed at determining the source of the bitumen present in the Longyear
coal and investigating the possibility of oil migration within the coal seam. The potential
of the Longyear coals to serve as a source rock for oil and a source of oil via retorting
has also been examined. Conclusion drawn from the geochemical and biomarker
analyses of these coals are summersied below:
The average hydrous pyrolysis bitumen yields show that approximately 40-60%
of liquid hydrocarbons are yet to be generated. This is a clear indication of the
petroleum generative capacity of the Longyear coal. When subjected to similar
geochemical conditions in-situ, these coals will generate significant liquid
hydrocarbons. The volume of generated bitumen suggests that the Longyear coal
has the potential to produce significant volumes of liquid hydrocarbons retorting
(see appendix B for approximate calculations).
The similarity of the hopane and pristane ratios used to ascertain the source and
maturity of the initial coal extract and that generated from the coal after hydrous
pyrolysis provides sufficient evidence to conclude that the bitumen found in-situ
was generated by the coal.
The loss of lower molecular weight hydrocarbon fractions and the steady increase
of the Pr/nC17 ration towards the upper portion of the seam are signs of the
possibility of upward migration of liquid hydrocarbon in the Longyear seam.
Mean vitrinite reflectance and hydrogen index values can be correlated against
the average biological maturity parameters. This could serve as a rule of thumb
for determining the maturity range for which hydrocarbons will be generated by
the Longyear coals. A good example will be to say that at a mean vitrinite
reflectance of 0.64% Ro, hydrogen index of 358 mg/g TOC and a hopane ratio of
0.62 is the range for which liquid hydrocarbons will be generated from the
Longyear coals.
The change observed in all the applied geochemical data (TOC, gas and bitumen
yield) at the middle portion of the Longyear seam is an indication of a change in
depositional setting and peatland conditions during the formation of the Longyear
seam.

68
5.2 Future work
A more detailed study of generative capacity of the Longyear coal should to be carried
out using a technique that can be scaled up to industrial level.
A more detailed evaluation of the pathway and extent of migration in the Longyear seam
is also necessary. The possibility of nearby hydrocarbon pools being sourced by the
Longyear coal should be examined.
The truncation of several geochemical data observed at the middle portion of the
Longyear seam should be looked into in greater detail. The horizontal extent and the
impact of this truncation on the geological and engineering properties of this seam
should be considered.
A study of the petrographic properties of the Longyear coal as they affect its pore size
and structure with relation to the ease at which hydrocarbons will migrate is necessary.
69
REFERENCES
Alexander, R., et al. (1981) Geochemical correlation of Windalia oil and extracts of
Winning Group (Cretaceous) potential source rocks, Barrow Subbasin, Western
Australia. American Association of Petroleum Geologists Bulletin 65-2, pp 235-
250.
Behar, F., et al. (1995) Experimental simulation of gas generation from coals and a
marine kerogen. Chemical Geology, 126, pp 247-260.
Boreham, C. J. & Powell, T. G. (1991) Variation in pyrolysate composition of sediments
from the Jurassic Walloon Coal Measures, eastern Australia as a function of
thermal maturation. Organic Geochemistry, 17, pp 723-733.
Bourbonniere, R. A. & Meyers, P. A. (1996) Sedimentary geolipid records of historical
changes in the watersheds and productivities of Lake Ontario and Erie. Limnology
and Oceanography, 41, pp 352-359.
Brassell, S. C., et al. (1986) Biological marker compounds as indicators of the
depositions! history of the Maoming oil shale. Organic Geochemistry, 10, pp 927-
941.
Bray, E. E. & Evans, E. D. (1961) Distribution of n-paraffins as a clue to recognition of
source beds. Geochemica et Cosmochimica Acta, 22, pp 2-15.
Burnham, A. K., et al. (1982) Biological markers from Green River kerogen
decomposition. Geochemica et Cosmochimica, 46, pp 1243-1251.
Carr, A. D., et al. (2009) The effect of water pressure on hydrocarbon generation
reactions: Some inferences from laboratory experiments. Petroleum Geoscience,
15, pp 17-26.
Chandru, K., et al. (2008) Characterization of alkanes, hopanes, and polycyclic aromatic
hydrocarbons (PAHs) in tar-balls collected from the East Coast of Peninsular
Malaysia. Marine Pollution Bulletin, 56, pp 950-962.
Cmiel, S. R. & Fabianska, M. J. (2004) Geochemical and petrographic properties of some
Spitsbergen coals and dispersed organic matter. International Journal of Coal
Geology, 57, pp 77-97.
Connan, J. (1973) Diagenese naturalle et diagenese artificielle de la matiere organique a
element vegataux predominants. In: Tissot, B. P. & Bienner, F. (Eds.), Advances
in organic geochemistry. Paris: Editions Technip, pp 73-95.
Cooles, G. P., et al. (1986) Calculation of petroleum masses generated and expelled
from source rocks. Organic Geochemistry, 10, pp 235-245.
Crelling, J. C. 1987. Separation, identification and characterisation of single coal maceral
types. In: Proceedings of the International Conference on Coal Science,
Amsterdam, The Netherlands. Elsevier Science Publishers, pp 119-122.
70
Crelling, J. C. (2008) Coal Carbonization. In: Isabel, S.-R. & John, C. C. (Eds.), Applied
Coal Petrology. Burlington: Elsevier, pp 173-192.
Crelling, J. C., et al. (1988) Reactivity of coal macerals and lithotypes. Fuel, 67, pp 781-
785.
Curry, D. J., et al. (1994) Geochemistry of aliphatic-rich coals in the Cooper basin,
Australia and Taranaki basin, New Zealand: implications for the occurrence of
potentially oil-generative coals. In: Scott, A. C. & Fleet, A. J. (Eds.), Coal and
coal-bearing strata as oil-prone source rocks? London: The Geological Society
Special Publication, pp 149-181.
Curtis, J. B., et al. (2004) Oil/source rock correlations in the Polish Flysch Carpathians
and Mesozoic basement and organic facies of the Oligocene Menilite Shales:
insights from hydrous pyrolysis experiments. Organic Geochemistry, 35, pp 1573-
1596.
Czochanska, Z., et al. (1988) Geochemical application of sterane and triterpane
biomarkers to a description of oils from the Taranaki Basin in New Zealand.
Organic Geochemistry, 12, pp 123-135.
Dallmann, W. K. (1993) Notes on the stratigraphy, extent and tectonic implications of
the Minkinfjellet Basin, Middle Carboniferous of central Spitsbergen. Polar
Research, 12, pp 153-160.
Dallmann, W. K., et al. (1988) Tertiary tectonics of Svalbard. Extended abstracts from
symposium held in Oslo 26 and 27 April 1988. Norsk Polarinstitutt Rapportserie,
46, pp.
Didyk, B. M., et al. (1978) Organic geochemical indicators of palaeoenvironmental
conditions of sedimentation. Nature, 272, pp 216-222.
Diessel, C. F. K. (1983) Carbonization reactions of inertinite macerals in Australian coals.
Fuel, 62, pp 883-892.
Diessel, C. F. K. (1992) Coal-bearing depositional systems, Berlin: Springer-Verlag, pp
4-41.
Diessel, C. F. K. & Gammidge, L. (1998) Isometamorphic variations in the reflectance
and fluorescence of vitrinite--a key to depositional environment. International
Journal of Coal Geology, 36, pp 167-222.
Dietmar Müller, R. & Spielhagen, R. F. (1990) Evolution of the Central Tertiary Basin of
Spitsbergen: towards a synthesis of sediment and plate tectonic history.
Palaeogeography, Palaeoclimatology, Palaeoecology, 80, pp 153-172.
Durand, B., And M. Paratte (1983) Oil potential of coals: a geochemical approach, in
Petroleum geochemistry and exploration of Europe, Boston: Blackwell Scientific
Publications, pp 255-265.
England, W. A. (1993) Migration systems analysis. Marine and Petroleum Geology, 10,
pp 633-633.

71
Fleet, A. J. & Scott, A. S. (Eds.) (1994) Coal and coal-bearing strata as oil-prone source
rocks: an overview, Geological society special publication, pp
Gallegos, E. J. & Moldowan, J. M. (1992) The effect of hold time on GC resolution and
the effect of collision gas on mass spectra in geochemical biomarker research. In:
Moldowan, J. M., Albrecht, P. & Philp, R. P. (Eds.), Biological markers in
sediments and petroleum. Englewood Cliffs, NJ: Prentice-Hall, pp 156-181.
Given, P. H. (1984) Essay on the organic geochemistry of coal. Coal Science, 3, pp 63-
252.
Harland, W. B. (1997) Proto-basement in Svalbard. Polar Research, 16, pp 123-147.
Harland, W. B. (1998) The geology of Svalbard, Bath: Geological Society, pp 3-37.
Hedberg, H. D. (1968) Significance of high-wax oils with respect to genesis of petroleum.
American Association of Petroleum Geologists -- Bulletin, 52, pp 736-750.
Horsfield, B., et al. (1988) Determining the petroleum-generating potential of coal using
organic geochemistry and organic petrology. Organic Geochemistry, 13, pp 121-
129.
Huang, D. (1999) Advances in hydrocarbon generation theory: II. Oils from coal and
their primary migration model. Journal of Petroleum Science and Engineering, 22,
pp 131-139.
Huang, W. Y. & Meinshein, W. G. (1979) Sterols as ecological indicators. Geochimica et
cosmochimica acta, 43, pp 739-745.
Huc, A. Y. & Hunt, J. M. (1980) Generation and migration of hydrocarbons in offshore
South Texas Gulf Coast sediments. Geochimica et Cosmochimica Acta, 44, pp
1081-1089.
Hunt, J. M. (1979) Petroleum geochemistry and geology, San Fransisco: W. H. Freeman,
pp 186-284.
Hunt, J. M. (1991) Generation of gas and oil from coal and other terrestrial organic
matter. Organic Geochemistry, 17, pp 673-680.
Hunt, J. M., et al. (1967) Chapter 7 The Origin of Petroleum in Carbonate Rocksk1.
Developments in Sedimentology. Elsevier, pp 225-251.
Hvoslef, S., et al. (1986) A combined sedimentological and organic geochemical study of
the Jurassic/Cretaceous Janusfjellet formation (Svalbard), Norway. Organic
Geochemistry, 10, pp 101-111.
Iglesias, M. J., et al. (2002) Control of the chemical structure in perhydrous coals by
FTIR and Py-GC/MS. Journal of Analytical and Applied Pyrolysis, 62, pp 1-34.
Isaksen, G. H., et al. (1998) Controls on the oil and gas potential of humic coals. Organic
Geochemistry, 29, pp 23-44.
Issler, D. R. & Snowdon, L. R. (1990) Hydrocarbon generation kinetics and thermal
modelling, Beaufort- Mackenzie Basin. Bulletin of Canadian Petroleum Geology,
38, pp 1-16.
72
Ji-Yang, S., et al. (1982) A biological marker investigation of petroleums and shales from
the Shengli oilfield, The People's Republic of China. Chemical Geology, 35, pp 1-
31.
Jiamo, F., et al. (1990) Application of biological markers in the assessment of
paleoenvironments of Chinese non-marine sediments. Organic Geochemistry, 16,
pp 769-779.
Karlsen, D. A., et al. (1988) Light hydrocarbon redistribution in a shallow core from the
Ravnefjeld formation on the Wegener Halvø, East Greenland. Organic
Geochemistry, 13, pp 393-398.
Kearey, P. (1996) The New Penguin Dictionary of Geology. Dictionary of Geology. 2nd
ed. London, Penguin books.
Killops, S., et al. (2002) Maturity-related variation in the bulk-transformation kinetics of
a suite of compositionally related New Zealand coals. Marine and Petroleum
Geology, 19, pp 1151-1168.
Killops, S. D., et al. (1998) Predicting generation and expulsion of paraffinic oil from
vitrinite-rich coals. Organic Geochemistry, 29, pp 1-21.
Klerk, A. (2009) Beyond Fischer-Tropsch: Coal-to-liquids Production and Refining:
Elsevier Science & Technology, pp 16-145.
Larter, S. (2011). Petroleum composition, petroleum systems, source rocks and
petroleum generation, petroleum generation, migration of petroleum [Online].
Available from: http://science.jrank.org/pages/47993/petroleum.html (last
accessed 07-06-2011).
Larter, S. R. (1995) Coal and coal bearing strata as oil-prone source rocks : Edited by A.
SCOTT and A. FLEET. Geological Society Special Publication No. 77. 1994. Organic
Geochemistry, 23, pp 467-467.
Lewan, M. D. (1997) Experiments on the role of water in petroleum formation.
Geochimica et Cosmochimica Acta, 61, pp 3691-3723.
Leythaeuser, D. & Schaefer, R. G. (1984) Effects of hydrocarbon expulsion from shale
source rocks of high maturity in upper carboniferous strata of the Ruhr area,
Federal Republic of Germany. Organic Geochemistry, 6, pp 671-681.
Leythaeuser, D., et al. (1988) Geochemical effects of primary migration of petroleum in
Kimmeridge source rocks from Brae field area, North Sea. I: Gross composition of
C15+-soluble organic matter and molecular composition of C15+-saturated
hydrocarbons. Geochimica et Cosmochimica Acta, 52, pp 701-713.
Leythaeuser, D. & Schwarzkopf, T. (1985) Pristane/n-haptadecane ratio as an indicator
for recognition of hydrocarbon migration effects. Organic Geochemistry, 10, pp
191-197.
73
Littke, R., et al. (1990) Petroleum generation and migration in coal seams of the
Carboniferous Ruhr Basin, northwest Germany. Organic Geochemistry, 16, pp
247-258.
Lockhart, R. S., et al. (2008) Release of bound aliphatic biomarkers via hydropyrolysis
from Type II kerogen at high maturity. Organic Geochemistry, 39, pp 1119-1124.
Mackenzie, A. S., et al. (1983a) Determination of hydrocarbon distribution in oils and
sediment extracts by gas chromatography-high resolution mass spectrometry.
Organic Geochemistry, 5, pp 57-63.
Marshall, C., et al. 2011. Biomarker and Petrographic Evidence for the Origin and
Maturity of Abundant Palaeocene Oil-Prone Type III Kerogen Deposits,
Spitsbergen. In: 3P Arctic, The Polar Petroleum Potential Conference &
Exhibition, 30 August-2 September, 2011. Halifax. (Abstract).
Melendez, R. B. 2001. The characterisation and combustion of South American coals.
PhD Thesis, University of Nottingham.
Moldowan, J. M., et al. (1991) Rearranged hopanes in sediments and petroleum.
Geochimica et Cosmochimica Acta, 55, pp 3333-3353.
Moldowan, J. M., et al. (1995) Relationship between petroleum composition and
depositional environment of petroleum source rocks. American Association of
Petroleum Geologists -- Bulletin, 69, pp 1255-1268.
Moore, L. R. (1969) Geomicrobiology and geomicrobiological attack on sedimented
organic matter In: Eglinton, G. & Murphy, M. T. J. (Eds.), Organic geochemistry:
methods and results. Berlin-Heidelberg-New York: Springer-Verlag, pp 265-303.
Moore, P. S., et al. (1992) Integrated source, maturation and migration analysis,
Gippsland Basin, Australia. Australian Petroleum Exploration Association Journal,
32, pp 313-324.
Morris, P. J. (1998). Formation of coal [Online]. Available from:
http://www.athro.com/geo/trp/gub/coal.html (last accessed 24/04/2011).
Murchison, D. G. (1991) Petrographic aspects of coal structure: reactivity of macerals in
laboratory and natural environments. Fuel, 70, pp 296-315.
Myhre, A. M. & Eldholm, O. (1988) The western Svalbard margin (74°-80°N). Marine and
Petroleum Geology, 5, pp 134-156.
Nagy, J. (2005) Delta-influenced foraminiferal facies and sequence stratigraphy of
Paleocene deposits in Spitsbergen. Palaeogeography, Palaeoclimatology,
Palaeoecology, 222, pp 161-179.
Nagy, J., et al. (2011) Marine shelf to paralic biofacies of Upper Triassic to Lower
Jurassic deposits in Spitsbergen. Palaeogeography, Palaeoclimatology,
Palaeoecology, 300, pp 138-151.
74
Nytoft, H. P. & Bojesen-Koefoed, J. A. (2001) 17[alpha],21[alpha](H)-hopanes: natural
and synthetic. Organic Geochemistry, 32, pp 841-856.
Orem, W. H. & Finkelman, R. B. (2003) Coal Formation and Geochemistry. In: Heinrich,
D. H. & Karl, K. T. (Eds.), Treatise on Geochemistry. Oxford: Pergamon, pp 191-
222.
Orheim, A., et al. (2007) Petrography and geochemical affinities of Spitsbergen
Paleocene coals, Norway. International Journal of Coal Geology, 70, pp 116-136.
Pepper, A. S. & Corvi, P. J. (1995) Simple kinetic models of petroleum formation. Part I:
oil and gas generation from kerogen. Marine and Petroleum Geology, 12, pp 291-
319.
Peters, K. E. (2000) Petroleum tricyclic terpanes: predicted physiochemical behavior
from molecular mechanics calculations. Organic Geochemistry, 31, pp 497-507.
Peters, K. E., et al. (2007) The Biomarker Guide: Volume 1, Biomarkers and Isotopes in
the Environment and Human History: Cambridge University Press, pp
Petersen, H. I. (2002) A re-consideration of the "oil window" for humic coal and kerogen
type III source rocks. Journal of Petroleum Geology, 25, pp 407-431.
Petersen, H. I. (2006) The petroleum generation potential and effective oil window of
humic coals related to coal composition and age. International Journal of Coal
Geology, 67, pp 221-248.
Petersen, H. I. & Nytoft, H. P. (2006) Oil generation capacity of coals as a function of
coal age and aliphatic structure. Organic Geochemistry, 37, pp 558-583.
Petersen, H. I., et al. (2009) Application of integrated vitrinite reflectance and FAMM
analyses for thermal maturity assessment of the northeastern Malay Basin,
offshore Vietnam: Implications for petroleum prospectivity evaluation. Marine and
Petroleum Geology, 26, pp 319-332.
Philp, R. P. & Gilbert, T. D. (1982) Unusual distribution of biological markers in
Australian crude oil. Nature, 299, pp 245-247.
Powell, T. G. (1986) Petroleum geochemistry and depositional setting of lacustrine
source rocks. Marine and Petroleum Geology, 3, pp 200-219.
Powell, T. G., et al. (1991) Petroleum source rock assessment in non-marine sequences:
pyrolysis and petrographic analysis of Australian coals and carbonaceous shales.
Organic Geochemistry, 17, pp 375-394.
Radke, M., et al. (1984) Relationship between rank and composition of aromatic
hydrocarbons for coals of different origins. Organic Geochemistry, 6, pp 423-430.
Radke, M., et al. (1980) Composition of soluble organic matter in coals: relation to rank
and liptinite fluorescence. Geochimica et Cosmochimica Acta, 44, pp 1787-1800.
Schlumberger (2011). Source rocks [Online]. Available from:
http://oilfieldglossary.com/search.cfm (last accessed 02/08/2011).
75
Scott, A. C. (2002) Coal petrology and the origin of coal macerals: a way ahead?
International Journal of Coal Geology, 50, pp 119-134.
Seifert, W. K. (1978) Steranes and terpanes in kerogen pyrolysis for correlation of oils
and source rocks. Geochimica et Cosmochimica Acta, 42, pp 473-484.
Seifert, W. K., et al. 1980. Application of biological marker chemistry to petroleum
exploration. In: Tenth world petroleum congress, Philadelphia. Heyden & sons,
Inc, pp 425-440.
Snowdon, L. R. (1991) Oil from Type III organic matter: resinite revisited. Organic
Geochemistry, 17, pp 743-747.
Stach, E. (1982) The macerals of coal. In: Stach, E., Mackowsky, M.-T., Teichmüller, M.,
Taylor, G. H., Chandra, D. & Teichmüller, R. (Eds.), Stach's textbook of coal
petrology. 3rd ed. Berlin-Stuttgart: Gebruder Borntraeger, 3, pp 87-144.
Svendsen, H., et al. (2002) The physical environment of Kongsfjorden-Krossfjorden, and
Arctic fjord system in Svalbard. Polar Research, 21, pp 133-166.
Sykes, R. & Snowdon, L. R. (2002) Guidelines for assessing the petroleum potential of
coaly source rocks using Rock-Eval pyrolysis. Organic Geochemistry, 33, pp 1441-
1455.
Tatsch, J. H. (1980) Coal deposits: origin, evolution, and present characteristics, 1980.
Trace Substances in Environmental Health: Proceedings of University of Missouri's
Annual Conference on Trace Substances in Environmental Health, pp 6-14.
Teichmuller, M. (1987) Recent advances in coalification studies and their application to
geology. Coal and Coal-bearing Strata: Recent Advances, pp 127-169.
Teichmüller, M. (1989) The genesis of coal from the viewpoint of coal petrology.
International Journal of Coal Geology, 12, pp 1-87.
Teichmüller, M. & Teichmüller, R. (1967) Diagenesis of Coal (Coalification). In: Gunnar
Larsen & Chilingar, G. V. (Eds.), Diaenesis in sediments. Elsevier, pp 391-415.
Teichmüller, M. & Teichmüller, R. (1979) Chapter 5 Diagenesis of Coal (Coalification). pp
207-246.
Teichmüller, M. & Teichmüller, R. (1982) The geological basis of coal formation. In:
Stach, E., Mackowsky, M. T., Teichmüller, M., Taylor, G. H., Chandra, D. &
Teichmüller, R. (Eds.), Stach's textbook of coal petrology. Berlin: Gebruder
Borntraeger, pp 5-82.
Thomas, L. (1992) Handbook of practical coal geology, Chichester: John Wiley & Sons,
pp 55-60.
Tissot, B. (1969) Preliminary data on mechanics and kinetics of oil formation in
sediments. computer simulation of geochemical reactions. 24, pp 470-501.
Tissot, B. P. (1988) Migration of Hydrocarbons in Sedimentary Basins: Geological and
Geochemical Aspects
76
La migration des hydrocarbures dans les bassins sedimentaires: aspects geologiques et
geochimiques. Revue de l'Institut Francais du Petrole, 43, pp 143-153.
Tissot, B. P., et al. (1987) Thermal history of sedimentary basins, maturation indices,
and kinetics of oil and gas generation. American Association of Petroleum
Geologists Bulletin, 71, pp 1445-1466.
Tissot, B. P. & Welte, D. H. (1984) Petroleum formation and occurrence, Berlin:
Springer, pp 229-253.
Uguna, C. 2007. Effect of water pressure on hydrocarbon generation, maturation and
cracking. PhD Thesis, University of Nottingham.
Van Krevelen, D. W. (1982) Development of coal research-a review. Fuel, 61, pp 786-
790.
Van Krevelen, D. W. (1984) Organic geochemistry--old and new. Organic Geochemistry,
6, pp 1-10.
Vandenbroucke, M. & Largeau, C. (2007) Kerogen origin, evolution and structure.
Organic Geochemistry, 38, pp 719-833.
Verheyen, T. V., et al. (1984) An evaluation of Rock-Eval pyrolysis for the study of
Australian coals including their kerogen and humic acid fractions. Geochimica et
Cosmochimica Acta, 48, pp 63-70.
Vincent, P. W., et al. (1985) Hydrocarbon generation, migration and entrapment in the
Jackson-Naccowlah area, atp 259p, South-Western Queensland. APEA journal, 25,
pp 62-84.
Volkman, J. K., et al. (1983) A geochemical reconstruction of oil generation in the
Barrow Sub-basin of Western Australia. Geochimica et Cosmochimica Acta, 47, pp
2091-2105.
Ward, C. R. (1984) Coal geology and coal technology, Boston: Blackwell Scientific
Publications, pp 1-40.
Wilkins, R. W. T., et al. (2002) Comparison of two petrographic methods for determining
the degree of anomalous vitrinite reflectance. International Journal of Coal
Geology, 52, pp 45-62.
Wilkins, R. W. T. & George, S. C. (2002) Coal as a source rock for oil: a review.
International Journal of Coal Geology, 50, pp 317-361.
Worsley, D. (1986) Evolution of an Arctic archipelago; The Geological History of
Svalbard, Statoil, 121pp. pp.
Zhao, C. & Cheng, K. (1998) Expulsion and primary migration of the oil derived from
coal. Science China Earth Sciences, 41, pp 345-353.
Zumberge, J. E. (1987b) Terpenoid biomarker distribution in low maturity crude oils.
Organic Geochemistry, 11, pp 479-496.
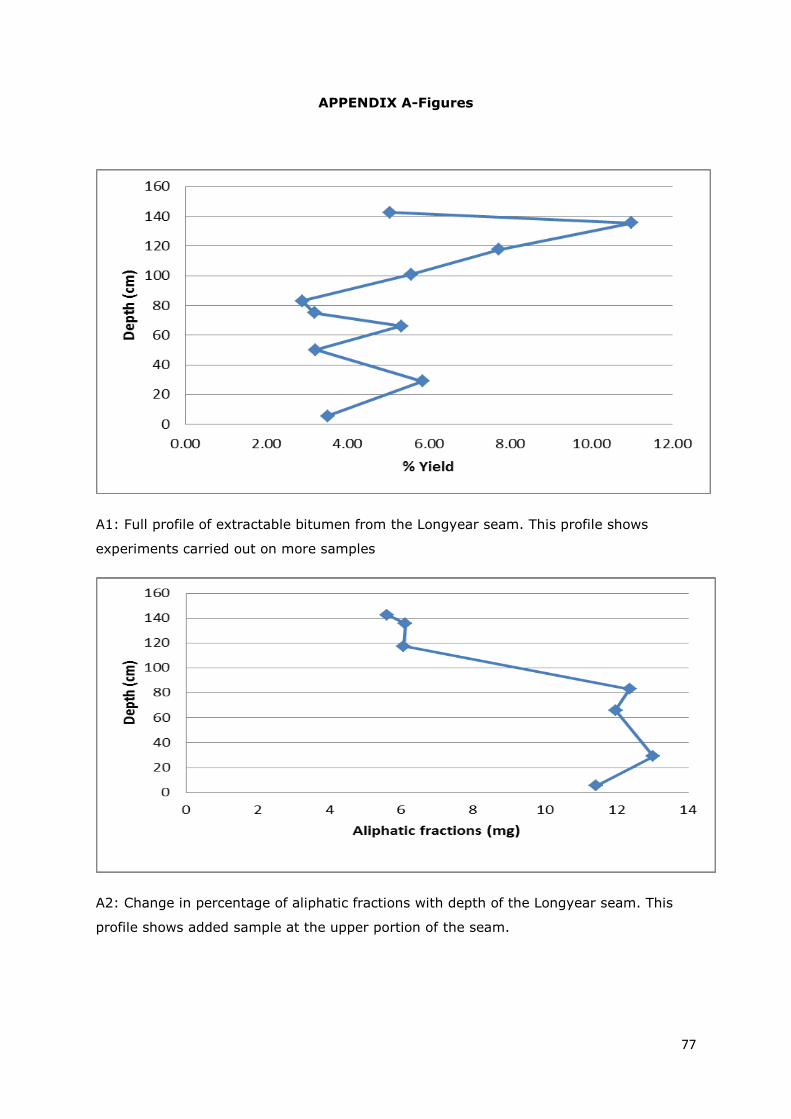
77
APPENDIX A-Figures
A1: Full profile of extractable bitumen from the Longyear seam. This profile shows
experiments carried out on more samples
A2: Change in percentage of aliphatic fractions with depth of the Longyear seam. This
profile shows added sample at the upper portion of the seam.
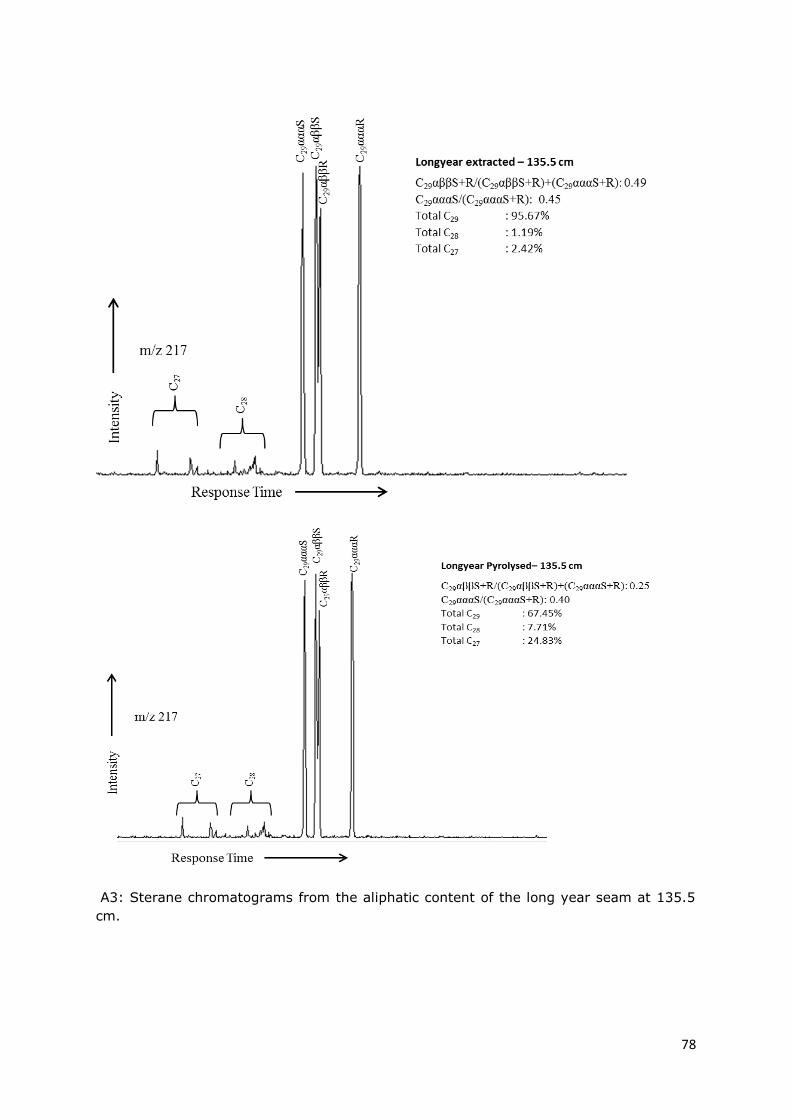
78
A3: Sterane chromatograms from the aliphatic content of the long year seam at 135.5
cm.
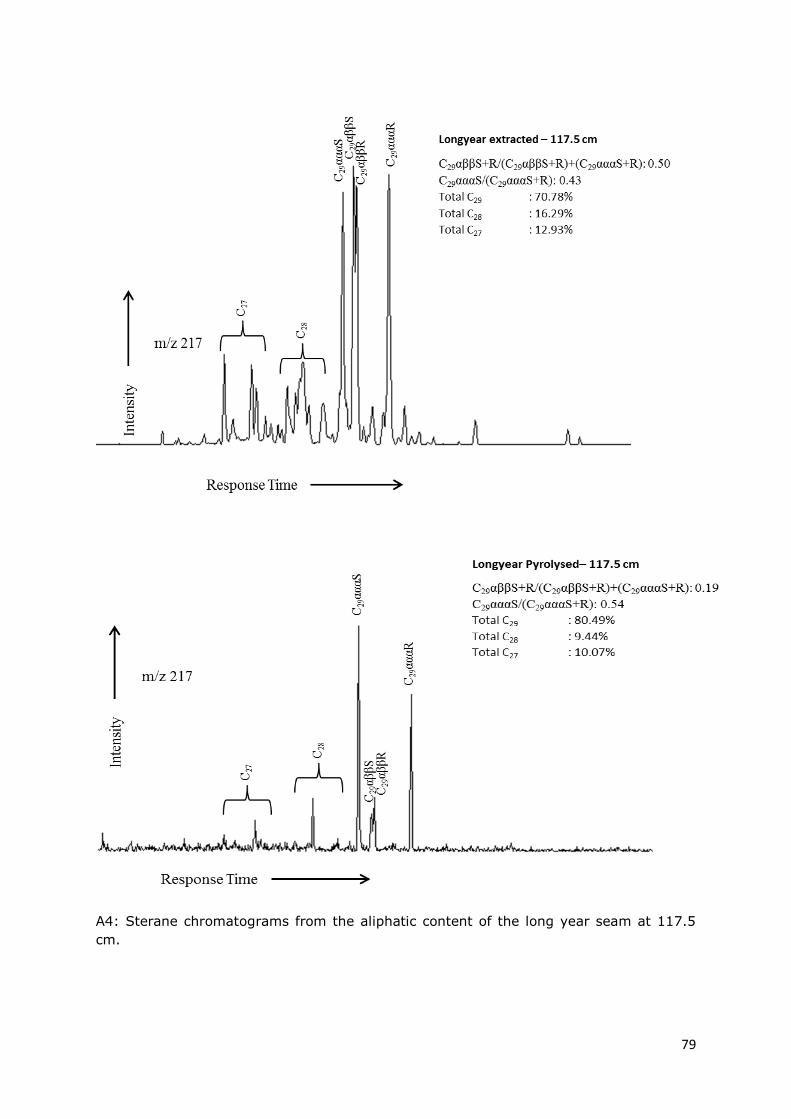
79
A4: Sterane chromatograms from the aliphatic content of the long year seam at 117.5
cm.
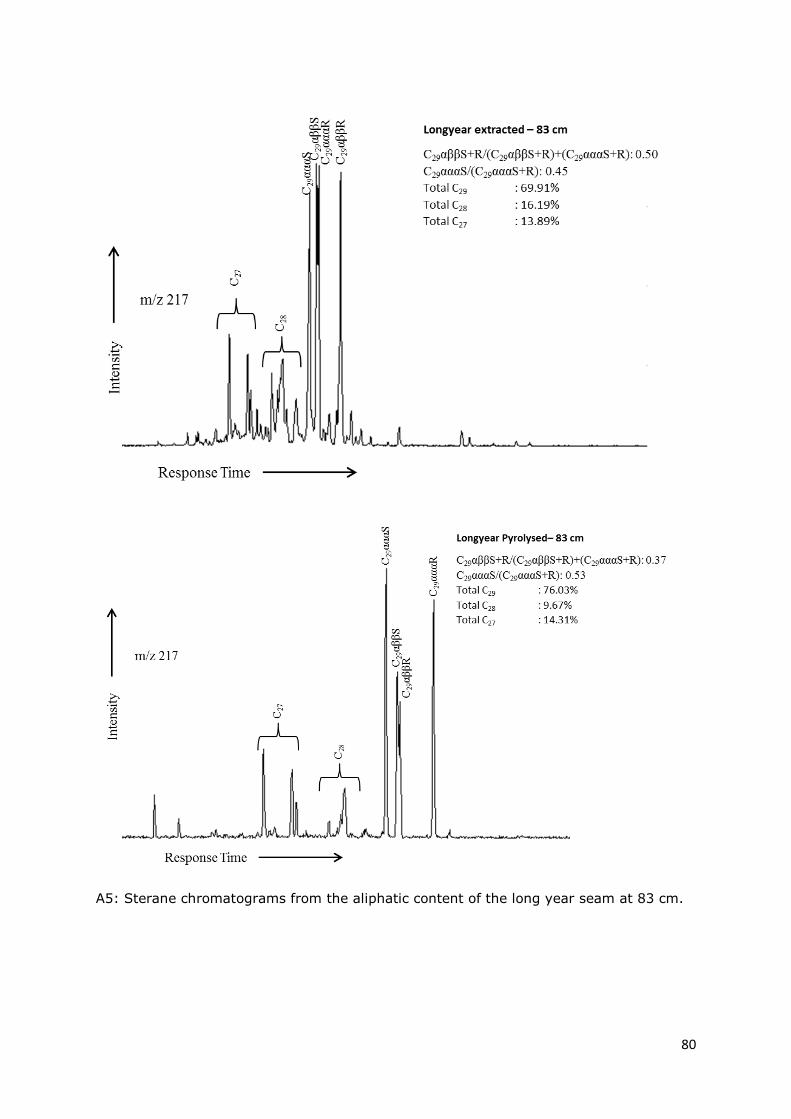
80
A5: Sterane chromatograms from the aliphatic content of the long year seam at 83 cm.

81
A6: Sterane chromatograms from the aliphatic content of the long year seam at 66 cm.
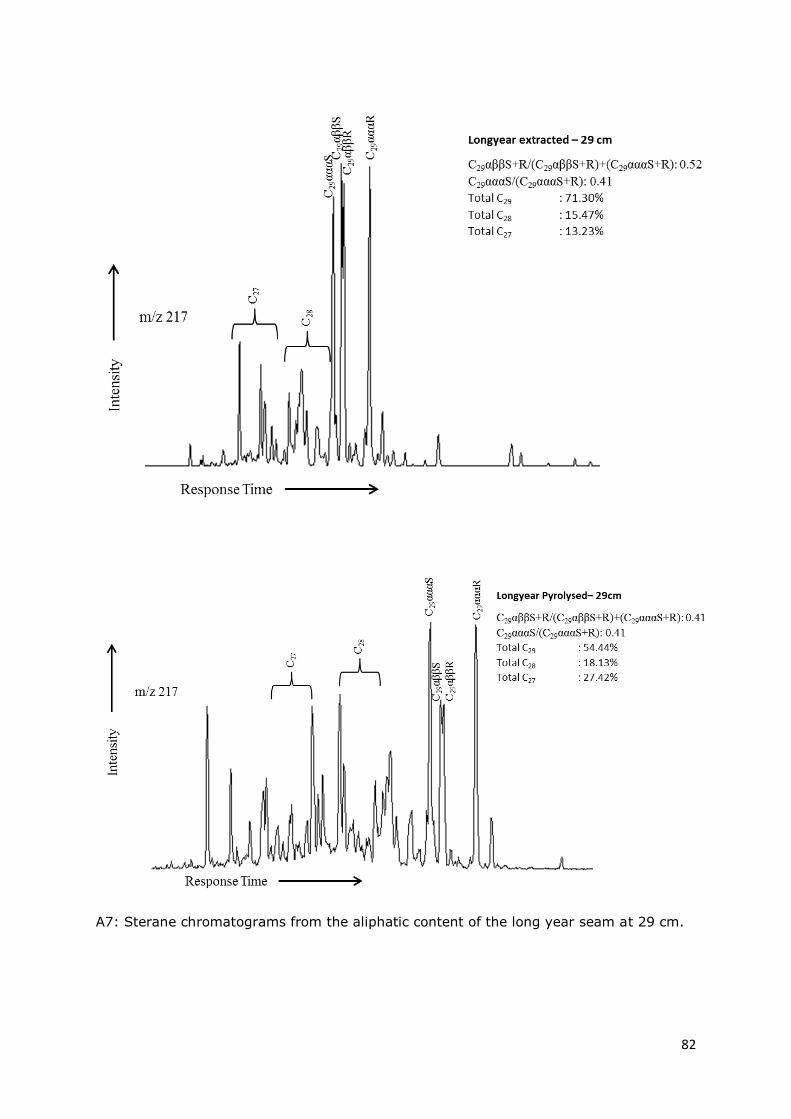
82
A7: Sterane chromatograms from the aliphatic content of the long year seam at 29 cm.
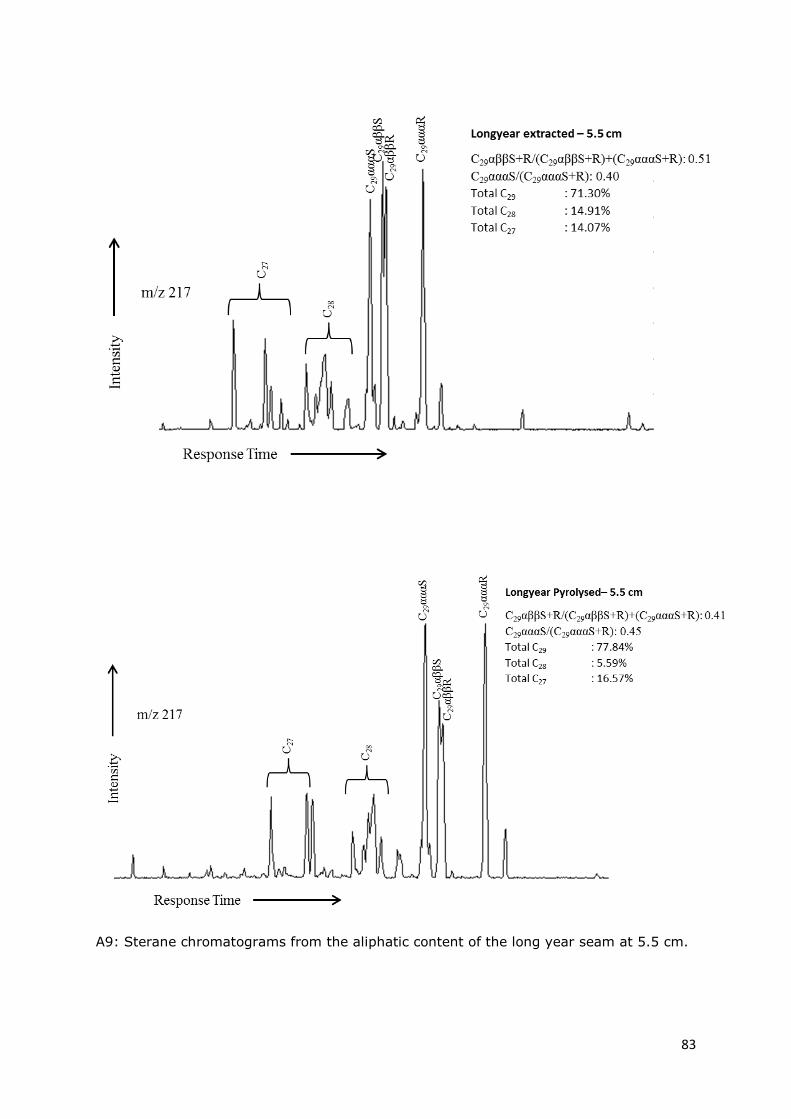
83
A9: Sterane chromatograms from the aliphatic content of the long year seam at 5.5 cm.
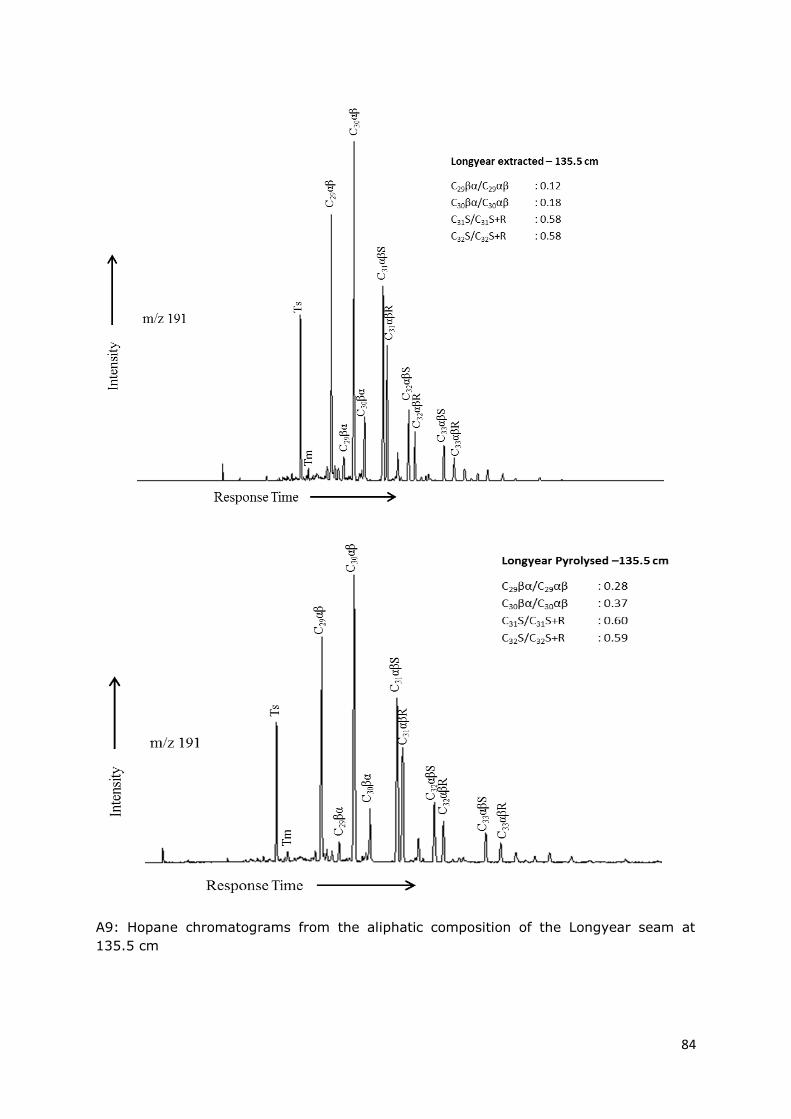
84
A9: Hopane chromatograms from the aliphatic composition of the Longyear seam at
135.5 cm
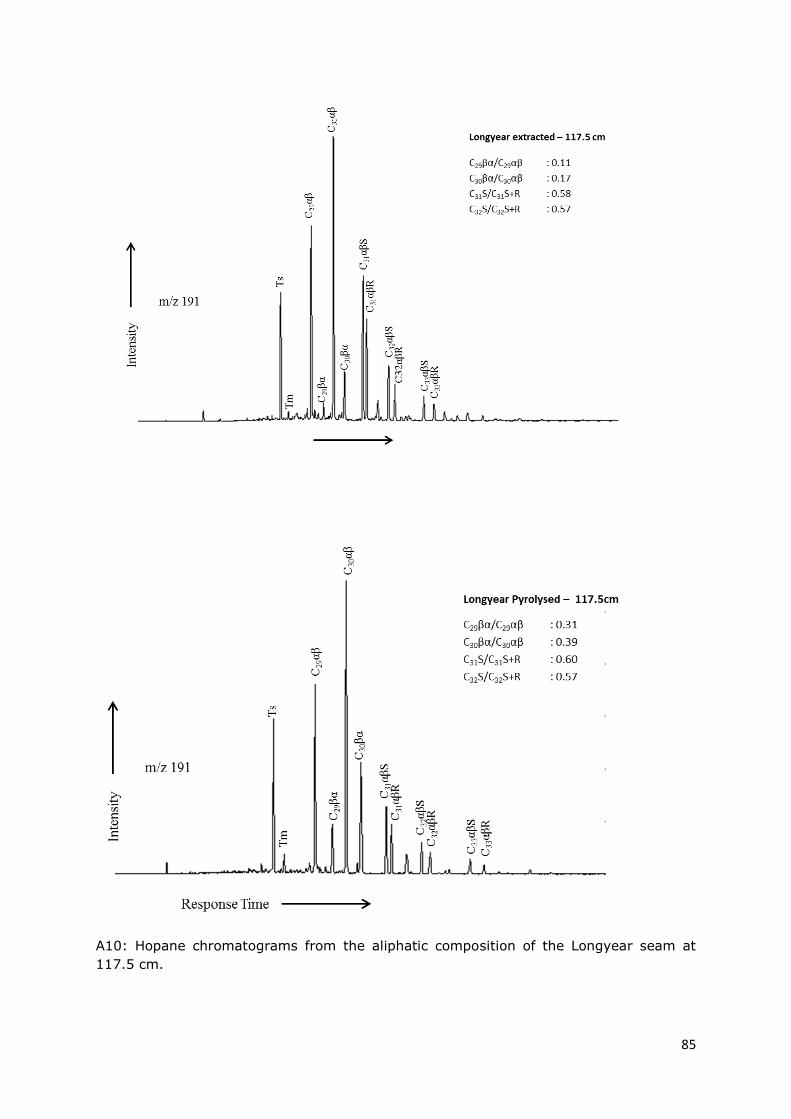
85
A10: Hopane chromatograms from the aliphatic composition of the Longyear seam at
117.5 cm.
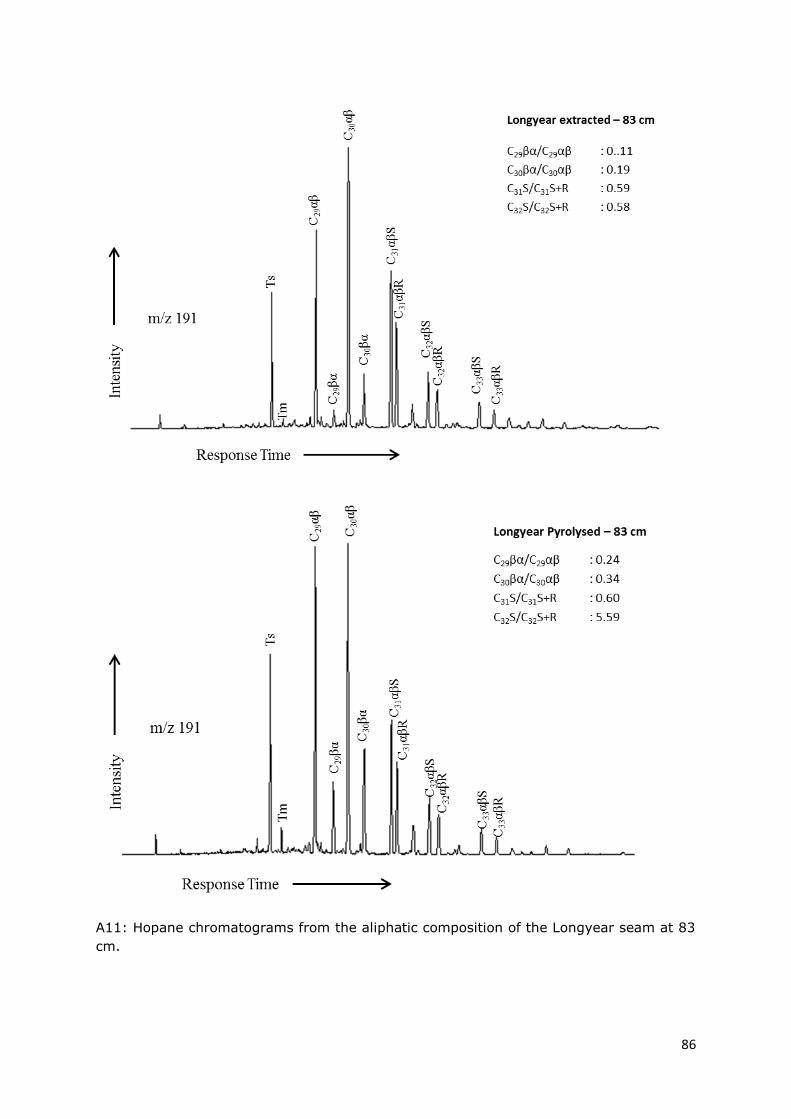
86
A11: Hopane chromatograms from the aliphatic composition of the Longyear seam at 83
cm.
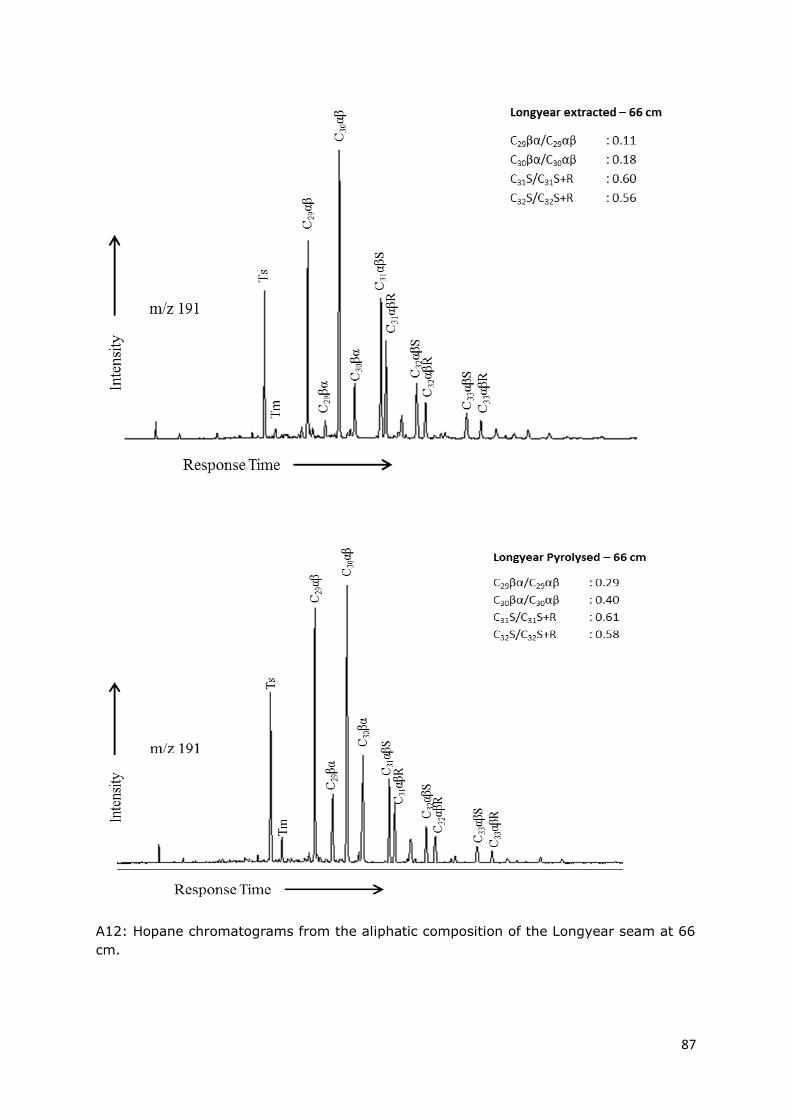
87
A12: Hopane chromatograms from the aliphatic composition of the Longyear seam at 66
cm.
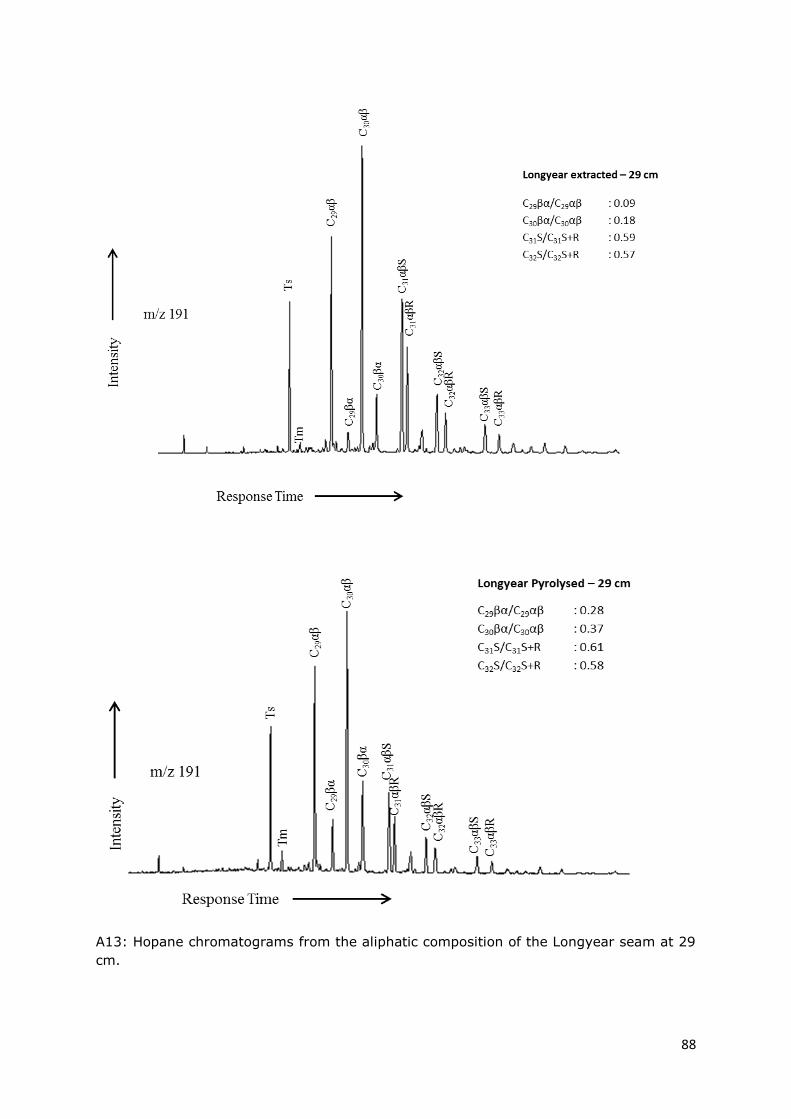
88
A13: Hopane chromatograms from the aliphatic composition of the Longyear seam at 29
cm.
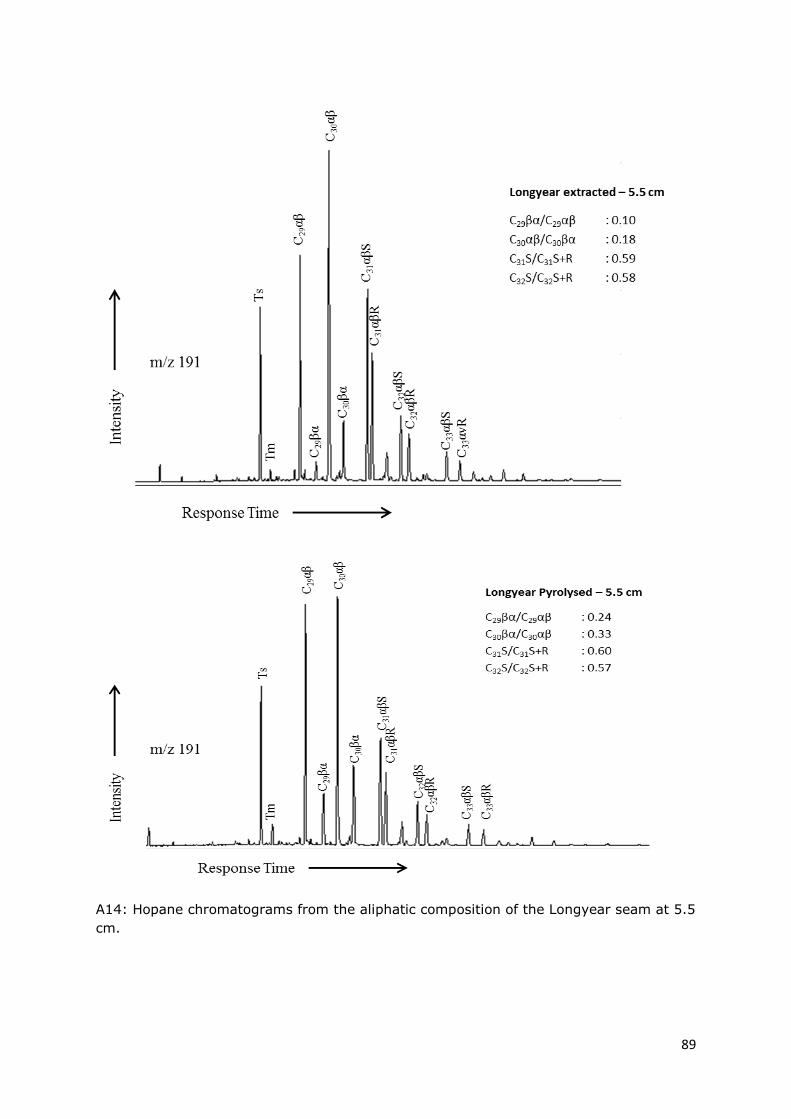
89
A14: Hopane chromatograms from the aliphatic composition of the Longyear seam at 5.5
cm.
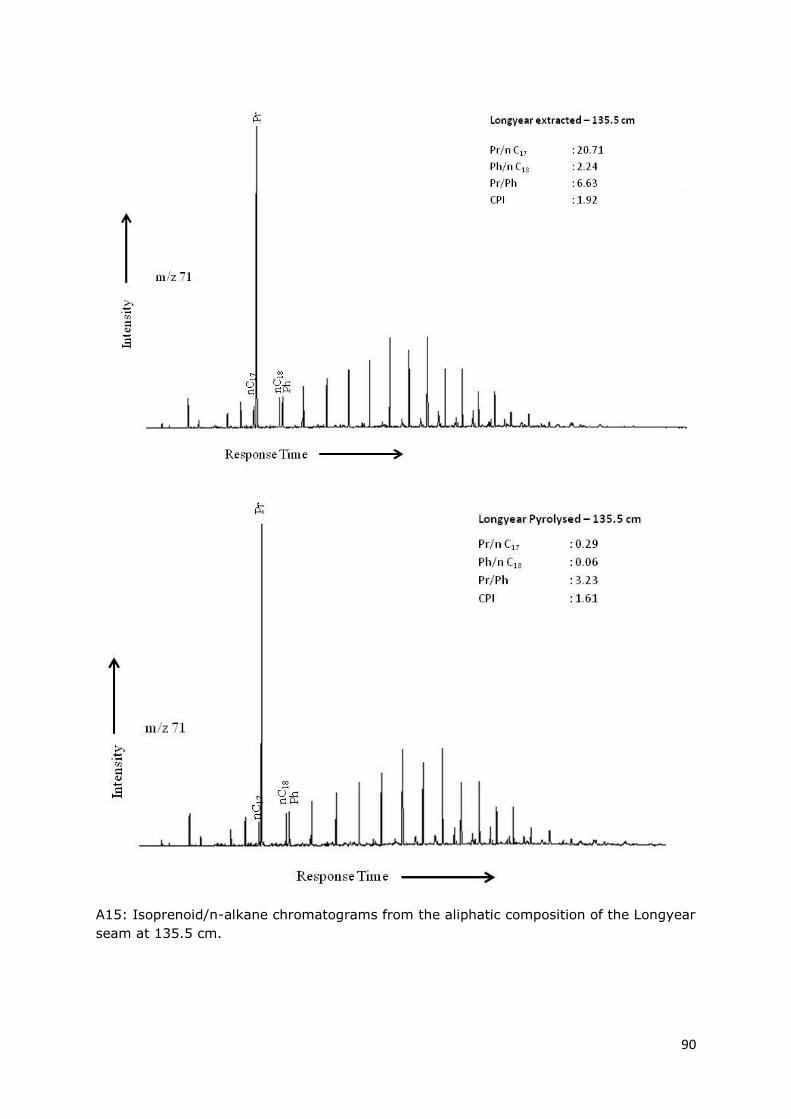
90
A15: Isoprenoid/n-alkane chromatograms from the aliphatic composition of the Longyear
seam at 135.5 cm.
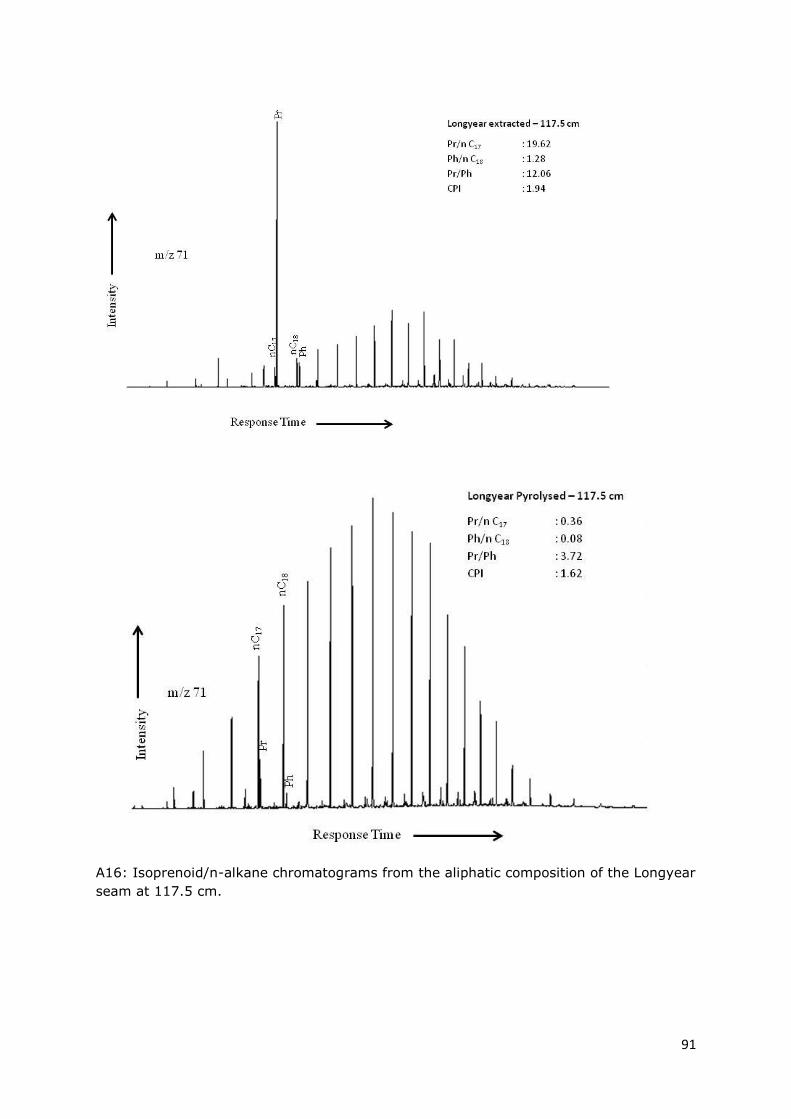
91
A16: Isoprenoid/n-alkane chromatograms from the aliphatic composition of the Longyear
seam at 117.5 cm.
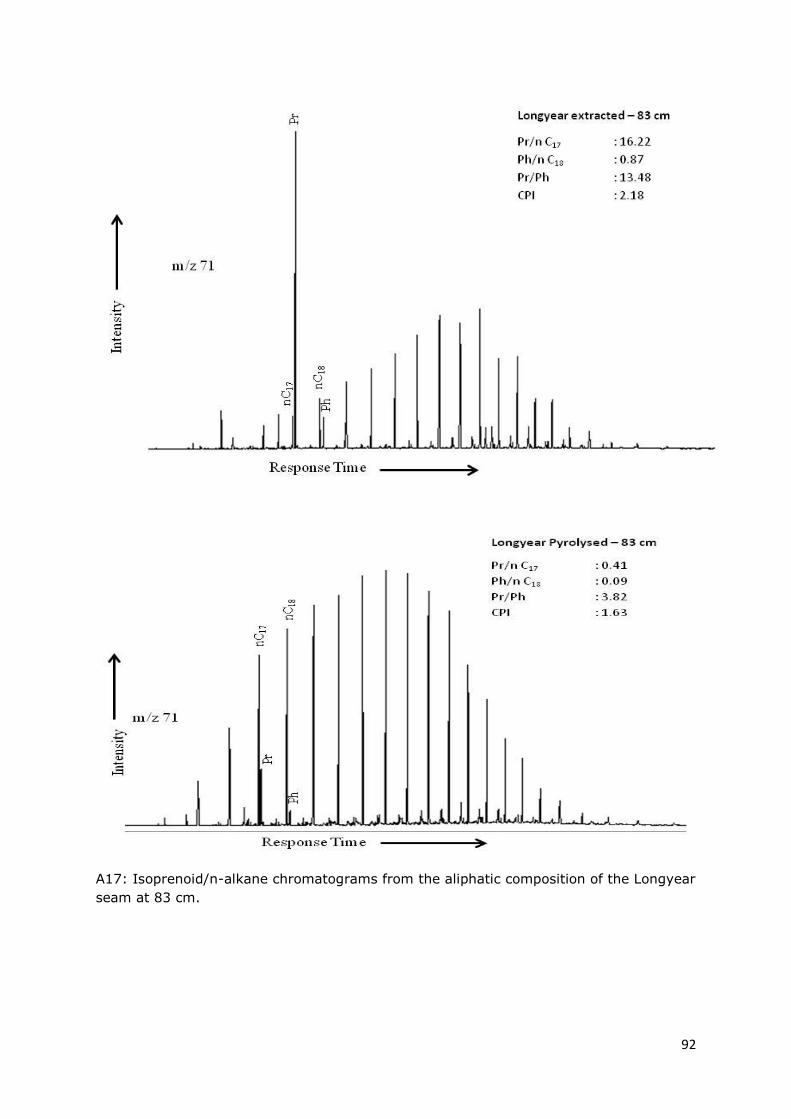
92
A17: Isoprenoid/n-alkane chromatograms from the aliphatic composition of the Longyear
seam at 83 cm.
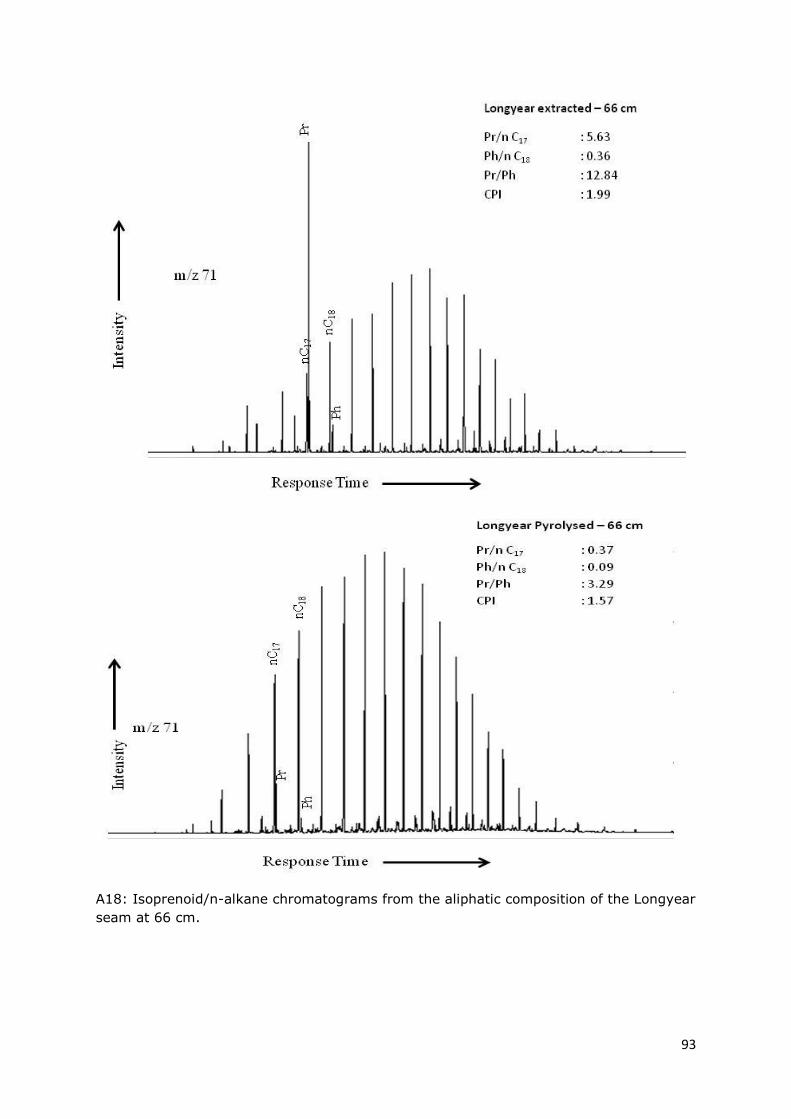
93
A18: Isoprenoid/n-alkane chromatograms from the aliphatic composition of the Longyear
seam at 66 cm.
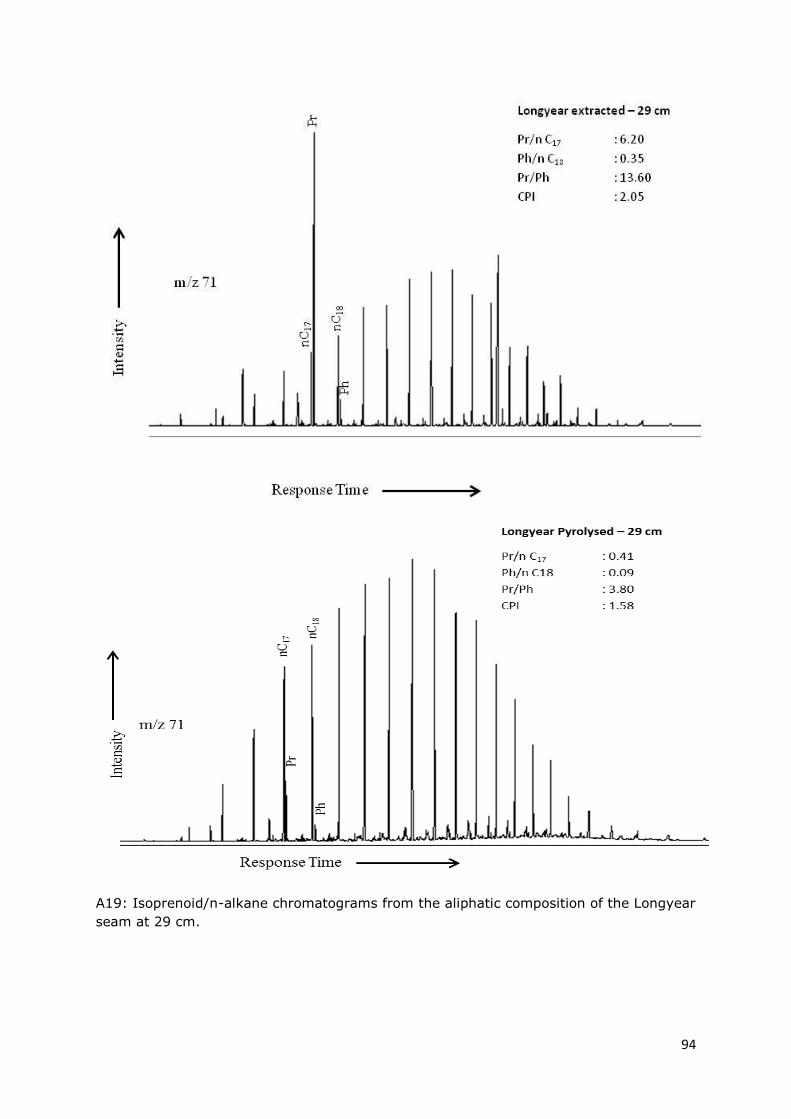
94
A19: Isoprenoid/n-alkane chromatograms from the aliphatic composition of the Longyear
seam at 29 cm.
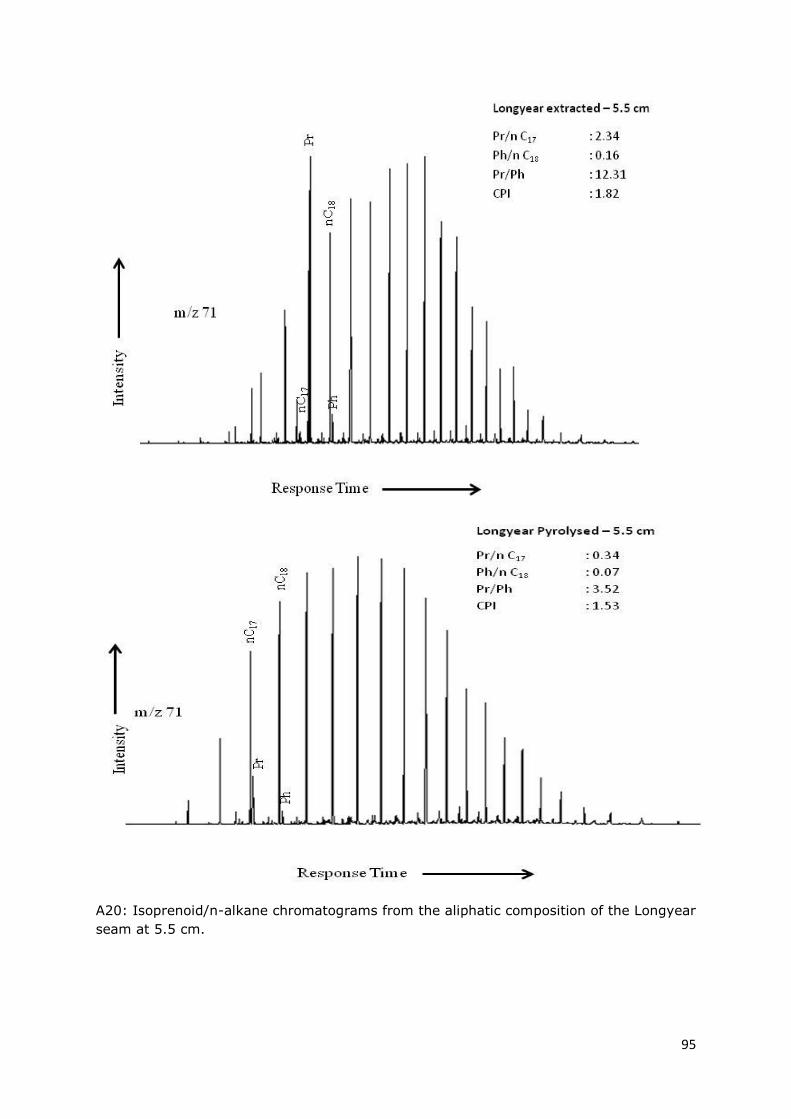
95
A20: Isoprenoid/n-alkane chromatograms from the aliphatic composition of the Longyear
seam at 5.5 cm.
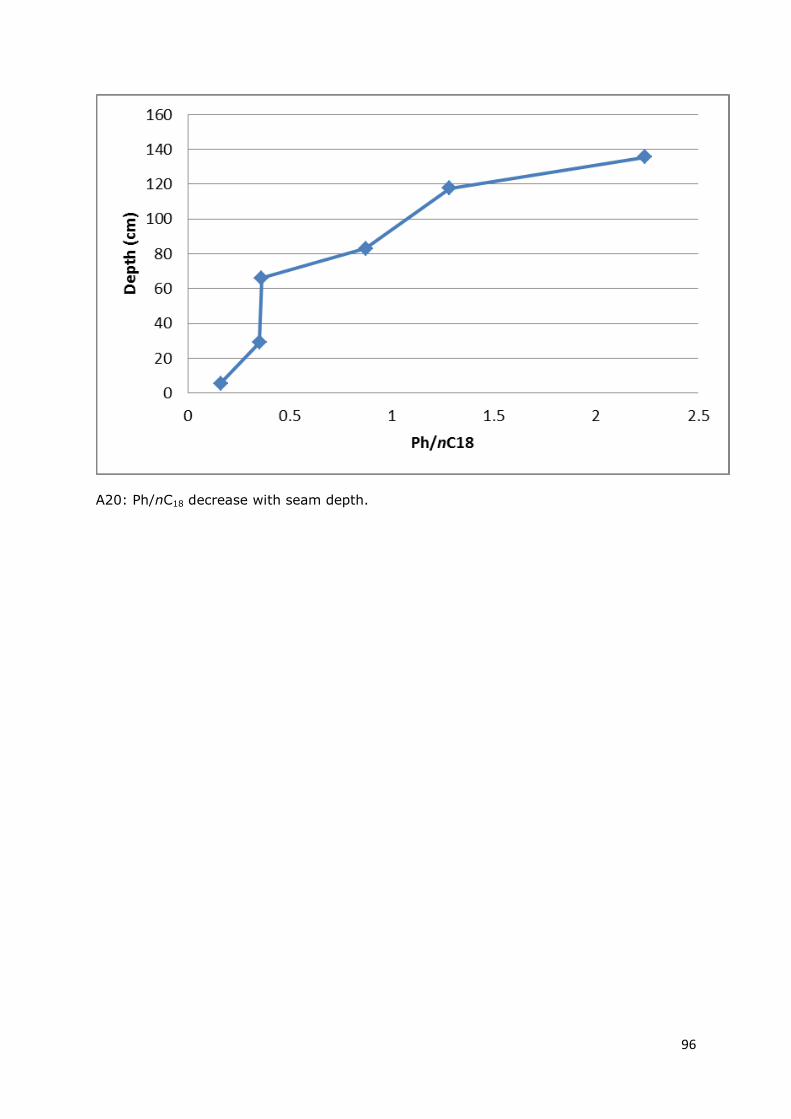
96
A20: Ph/nC18 decrease with seam depth.
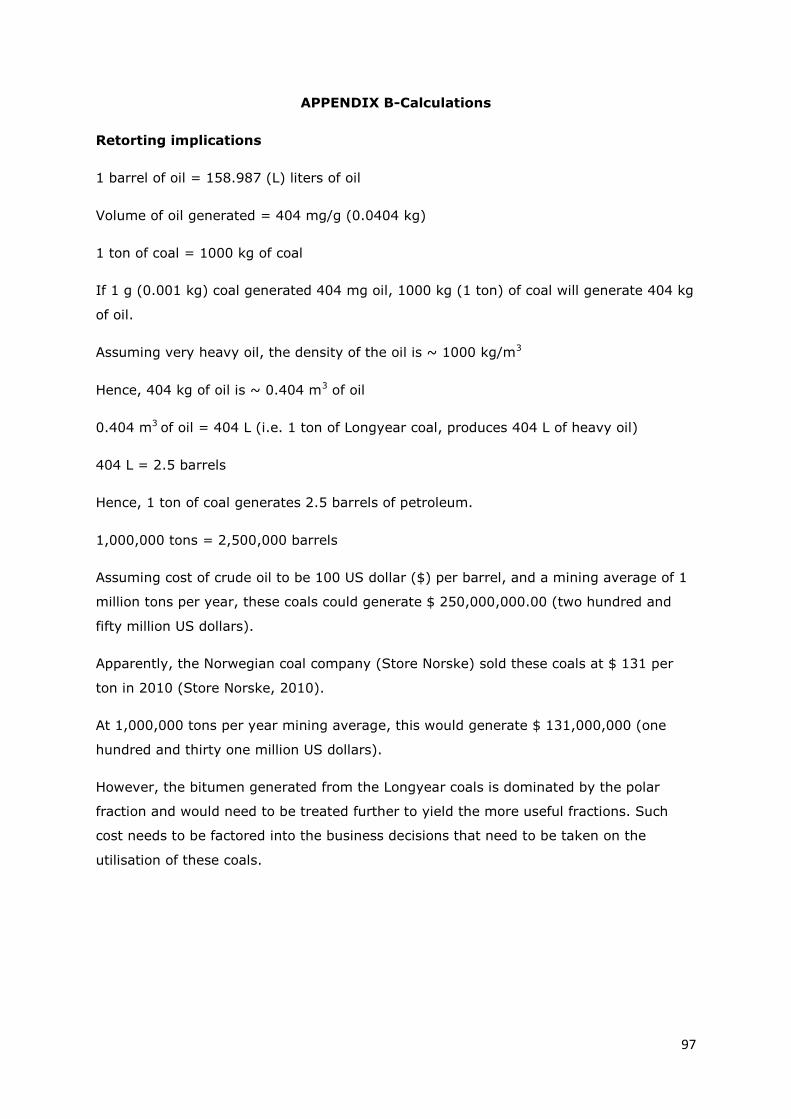
97
APPENDIX B-Calculations
Retorting implications
1 barrel of oil = 158.987 (L) liters of oil
Volume of oil generated = 404 mg/g (0.0404 kg)
1 ton of coal = 1000 kg of coal
If 1 g (0.001 kg) coal generated 404 mg oil, 1000 kg (1 ton) of coal will generate 404 kg
of oil.
Assuming very heavy oil, the density of the oil is ~ 1000 kg/m3
Hence, 404 kg of oil is ~ 0.404 m3 of oil
0.404 m3 of oil = 404 L (i.e. 1 ton of Longyear coal, produces 404 L of heavy oil)
404 L = 2.5 barrels
Hence, 1 ton of coal generates 2.5 barrels of petroleum.
1,000,000 tons = 2,500,000 barrels
Assuming cost of crude oil to be 100 US dollar ($) per barrel, and a mining average of 1
million tons per year, these coals could generate $ 250,000,000.00 (two hundred and
fifty million US dollars).
Apparently, the Norwegian coal company (Store Norske) sold these coals at $ 131 per
ton in 2010 (Store Norske, 2010).
At 1,000,000 tons per year mining average, this would generate $ 131,000,000 (one
hundred and thirty one million US dollars).
However, the bitumen generated from the Longyear coals is dominated by the polar
fraction and would need to be treated further to yield the more useful fractions. Such
cost needs to be factored into the business decisions that need to be taken on the
utilisation of these coals.
Recommended