Ass. Univ. Bull. Environ. Res. Vol. 14 No. 2, October 2011
-69-
Ass. Univ. Bull. Environ. Res. Vol. 14 No. 2, October 2011
AUCES
STATUS OF SOME NUTRIENTS AND HEAVY METALS WITH RELATIONS TO THEIR BEARING MINERALS IN THE SOILS OF
NILE TERRACES AT ASSIUT, EGYPT
Mohamed El-Ameen Abd El-kareem Faragallah
Soil and Water Sci. Dept., Faculty of Agric., Al-Azhar University, Assiut, Egypt
ABSTRACT:
Nine soil profiles were selected from various Nile terraces located south Assiut barrage at Assiut city,
Egypt to a) examine levels and distributions of some available nutrients (P, K, Fe, Mn, Zn and Cu) and
some heavy metals (Ni, Pb and Cd), b) clear up their relations with some physical and chemical soil
properties, and c) evaluate their relations to their bearing minerals in the soils of the most recent and old
Nile terraces.
Results showed soil available phosphorus values are higher in the oldest terraces on both Nile sides
than in the youngest ones. However, most soil layers of the youngest Nile terraces show greater
available potassium levels than the oldest ones. The recent and old Nile terraces soils exhibit very high
level of P and medium amounts of K. In most cases, there are no consistent changes in the levels of either
available phosphorus or potassium with depth.
Highly significant positive correlations were obtained between the available P and K and soil contents
of silt, clay, organic matter and CEC. On the other hand, highly significant negative correlations were
recorded with sand, pH and CaCO3 contents. Significant positive correlations were found between the
phosphorus levels and both monazite and the sum of apatite + monazite minerals. However, insignificant,
positive correlations between available potassium and its bearing minerals were recorded, except the case
of feldspars in the clay fraction was a highly significant, positive correlation.
The highest levels of DTPA-extractable Fe are obtained in the oldest Nile terrace soils. Whereas,
extractable Mn levels are high in the youngest terraces on both Nile sides. Moreover, the soils of the
youngest and oldest terraces are Fe and Mn sufficient. However, most soils of the terrace bench in the
interference zone and the terrace rear suture in desert fringes are considered Fe and Mn deficient. The
levels of soil extractable Cu are quite variable among the youngest and oldest Nile terraces, and all the
investigated soils are Cu-nondeficient. On the other hand, most examined soils are considered Zn-
deficient. No clear pattern of distributions of these investigated micronutrients was observed with depth.
Highly significant positive correlations expressed the relations between fine particles, organic matter
and CEC contents and extractable Fe, Mn and Cu. However, highly significant negative correlations were
observed with amounts of sand, CaCO3 and soil pH. The DTPA-extractable Zn did not show any
significant correlations with all the considered soil properties. The extractable Fe and Cu showed highly
significant positive correlations with epidotes, biotite and feldspars of both sand and clay fractions. Also,
the extractable Mn has significant positive correlations with epidotes, hornblende, smectites and chlorite.
However, low positive correlations occurred between the extractable Zn with both hornblende and

Ass. Univ. Bull. Environ. Res. Vol. 14 No. 2, October 2011
-70-
pyroxene.
Generally, DTPA-extractable Ni and Pb are slightly higher in the youngest Nile terrace soils than in
the oldest ones, without any clear trend of their distributions with depth. Moreover, the youngest and
oldest Nile terraces soils contain similar vey low amounts of extractable Cd. Correlations between
extractable Ni and contents of clay, silt, organic matter and CEC are highly significant and positive,
whereas, they are highly significant and negative with sand, pH, ECe and CaCO3 contents. The extractable
Pb has significant positive correlations with the soil contents of silt, clay, and CEC, but, negative
significant correlations with both sand and CaCO3 contents. Slightly significant positive correlations
between the extractable Ni and Pb and hornblende are recorded. Both biotite and chlorite were highly
significant positive correlated to Ni.

Ass. Univ. Bull. Environ. Res. Vol. 14 No. 2, October 2011
-69-
INTRODUCTION:
Sediment transfer from continents to oceans
or seas via rivers is one of the important
processes regulating river-bank stabilization,
soil formation, biogeochemical cycling of
elements and many other earth-related
processes (Chakrapani, 2005). Aswan High Dam
construction and increased human activities in
the Nile valley have drastically changed the
chemistry and mineralogy of the river flux.
Dissolved transport is a major process for Ca,
K, Sr, Zn, Cu, Ni and V. Manganese, Fe and Cr
are mainly carried by suspended matter. Along
the course of the river, the distribution of
elements in the suspended matter and sediments
is generally controlled by natural processes, the
relative importance of elemental transport
phases, as well as the oxidation, precipitation
and sedimentation of mineral species through
the varying physico-chemical conditions of the
environment. Pollution input in the Nile
particulate load is not major, compared to the
natural ones (Dekov et al., 1997).
Two main sources of heavy metals in the soil
include: (i) the natural background, which
represents the heavy metal concentration that is
derived from parent rocks, and (ii) the
anthropogenic contamination, that represents
the human applications of agrochemicals,
organic amendments, animal manure, mineral
fertilizers, industrial manufacturing wastes,
domestic refuse and waste materials. Generally,
there are more heavy metals in soils originated
from anthropogenic sources than natural
sources (Nriagu and Pacyna, 1988; Stehouwer
et al., 2000; Jjemba, 2004; Wei et al., 2007;
Yadav et al., 2009). Iron, Zn, Cu and Ni in
alluvial deposits are mainly originated from the
terrestrial (rock and soil) weathering that is
considered a natural source. However, Pb, Ni,
Zn, Cu and Cd may come from some
anthropogenic sources (Jakovljevic et al., 1997;
Zhou et al., 2004; Jjemba, 2005; Jinling et al.,
2009).
There is a great diversity of possible
associations of trace elements with the various
substrates. These elements can be adsorbed on
the particle surface of clays or organic matter
and present in the lattice of secondary and
primary minerals (Tessier and Campbell, 1988).
The grain size and heavy minerals control the
distribution of chemical elements in alluvial
soils (Zhou, et al., 2004). The fine sand fraction
in soils is likely to have been derived from the
more easily weathered minerals, which are also
the main source of trace elements (Sillanpaa,
1972). The bioavailability of metals in soils is a
dynamic process that depends upon specific
combinations of chemical, biological, and
environmental parameters (Li and Thornton,
2001; Peijnenburg and Jager, 2003; Panuccio et
al., 2009). Mohamed (1990) found that soil
texture, mineral composition, CaCO3, organic
matter and pH were the most important factors
that affect the total and available micronutrients
in both alluvial and calcareous soils.
Several investigators reported the levels of
various extractable nutrients and their
correlations with some properties of alluvial soils
(Khalil et al., 1990; Amer et al., 1991; El-Shazely
et al., 1991; Farragallah, 1995; Khalifa et al.,

Ass. Univ. Bull. Environ. Res. Vol. 14 No. 2, October 2011
-70-
1996; El-Desoky, and Ghallab, 2000; Ghallab,
2002; Abdel-Mawgoud and Faragallah, 2004;
Faragallah and Essa, 2005; Gomah et al., 2007).
Few researches have been focused on the relations
between various extractable nutrients and heavy
metals and their bearing-minerals in alluvial
soils.
The current work was carried out to
(1) examine levels and distributions of available
some macro- micronutrients (P, K, Fe, Mn, Cu
and Zn) and some heavy metals (Ni, Pb and Cd),
(2) clear up their correlations with some
physical and chemical soils properties, and
(3) evaluate their relations to bearing-minerals
in the soils of the most recent and old Nile
terraces at Assiut, Egypt.
MATERIALS AND METHODS:
Nine profiles were selected to cover various
Nile terraces located south Assiut barrage,
Assiut governorate. Profiles 1 and 5 represented
the most recent Nile terraces in the eastern and
western banks of the Nile stream, respectively.
Profiles 2, 6 and 7 represented the succeeding
terraces; profiles 2 and 7 are scarps of flood
plain in the eastern and western sides of the Nile
River, respectively. Profiles 3 and 8 represented
the terrace bench or plain that located in the
Nile valley-desert interference zone which they
are close to the eastern and western desert,
respectively. Profiles 4 and 9 represented the
terrace rear suture that presented in the fringes
of the eastern and western desert, respectively
(Fig. 1).
Soil samples were taken from the layers of
the profiles that represent the studied Nile
terraces, air-dried, crushed, sieved with a 2 mm
sieve and kept for physical, chemical and
mineralogical analysis. The particle-size
distribution of the soil samples was performed
according to Piper (1950) and Jackson (1973).
Organic matter in the soil samples was
determined using Walkely-Black method
(Jackson 1973). Soil calcium carbonate was
measured by the calcimeter method, according
to Nelson (1982). Soil pH was measured in a 1:1
water suspension of soil to water using a glass
electrode as reported by Mclean (1982). The
electrical conductivity (ECe) was measured in
the saturated soil paste extract using a
conductivity meter. Soluble ions were also
determined in the saturated soil paste extract
using the methods of Jackson (1973). Cation
exchange capacity (CEC) of the soil samples was
determined using NaOAC at pH 8.2 as a
saturating solution and NH4OAC at pH 7.0 as a
displacing solution, and then sodium was
measured by flamephotometer (Jackson, 1973).
These examined physical and chemical
properties of the studied soil samples are
present in Table (1).
Available P and K were extracted and
determined according to Soltanpour and
Schwab (1977). Available iron (Fe), zinc (Zn),
manganese (Mn), copper (Cu), nickel (Ni), lead
(Pb) and cadmium (Cd) were DTPA-extracted
according to the method described by Lindsay
and Norvell (1978) and determined using atomic
absorption (model Perkin-Elmer 1999).

Ass. Univ. Bull. Environ. Res. Vol. 14 No. 2, October 2011
-71-
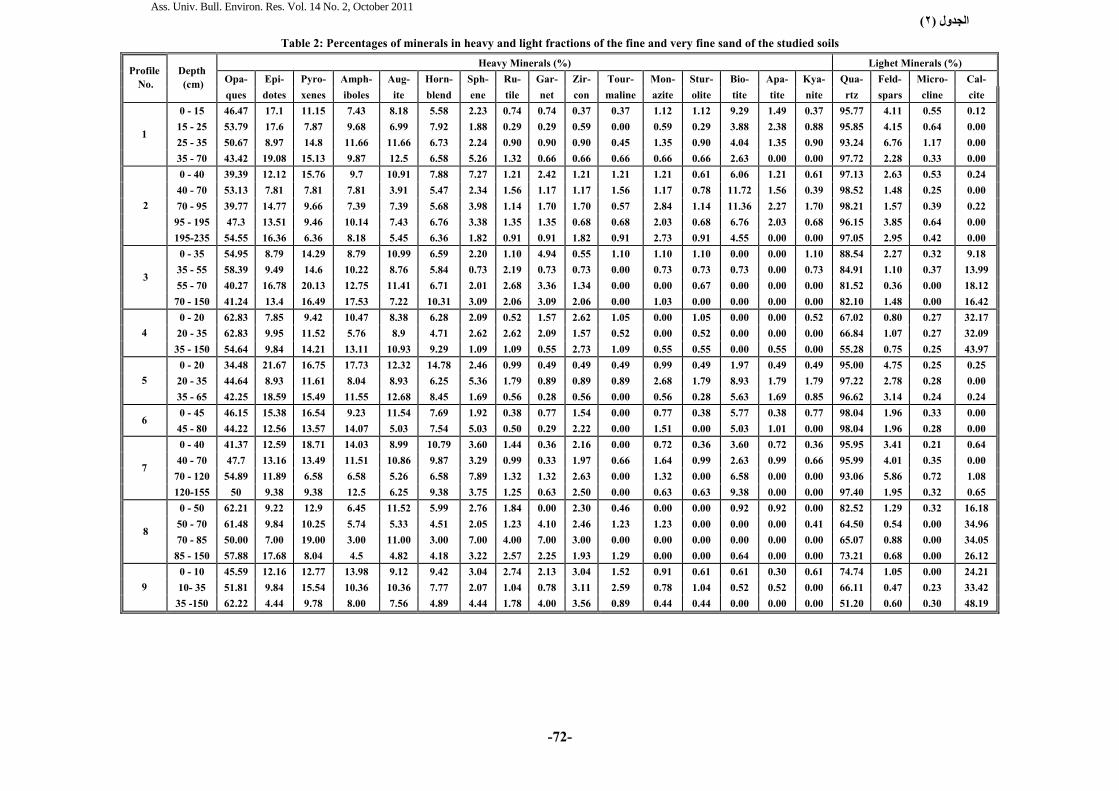
Heavy and light minerals were separated
from fine and very fine sand fractions (0.25 to
0.063 mm) using the procedure of Brewer
(1964). These minerals were identified
according to Milner (1962). Percentages of the
heavy and light minerals in the fine and very
fine sand fractions of the studied soil samples
are given in Table (2).
The clay-size fractions were separated from
the studied soil samples, prepared and
investigated using X-ray diffractometer. The
clay minerals were identified and their relative
proportions were determined according to
Schultz (1964). Relative abundance of the
identified minerals in the clay fraction of the
studied soil samples is present in Table (3).

Ass. Univ. Bull. Environ. Res. Vol. 14 No. 2, October 2011
-69-
Aswan
Cairo
Mediterranean Sea
Red Sea
0 1 2 3 Km
Assiut Barrage
Profile Location
1
56
7
8
9
2
34
Assiut
A ssiut
City
Fig. (1): Location map of the studied Nile terraces south Assiut barrage

Ass. Univ. Bull. Environ. Res. Vol. 14 No. 2, October 2011
-70-

Ass. Univ. Bull. Environ. Res. Vol. 14 No. 2, October 2011
-71-
)١(الجدول
Table 1: Some physical and chemical properties of the investigated soil profiles of the studied Nile terraces
Particle size distribution
Soluble cations ( meq/l) Soluble anions (meq/l) Profile
No. Depth (cm) Sand
(%) Silt (%)
Clay (%)
Texture grade
O.M (%)
CaCO3 (%)
pH (1:1)
ECe dsm-1
Ca++ Mg++ Na+ K+ Cl- HCO3- SO4--
CEC (Cmol+/kg)
0 - 15 41.86 35.23 22.91 Loam 1.90 3.89 8.03 0.91 5.74 2.46 0.28 0.43 3.56 1.80 3.50 34.90
15 - 25 36.35 28.75 34.90 Clay loam 1.52 3.31 8.01 0.85 4.06 3.88 0.18 0.22 2.95 3.60 2.00 40.15
25 - 35 41.29 34.77 23.94 Loam 1.89 2.48 8.12 0.66 4.28 1.83 0.23 0.17 2.66 2.25 1.50 30.86 1
35 - 70 30.88 34.10 35.02 Clay loam 1.62 3.73 8.06 0.52 3.06 1.83 0.13 0.18 1.84 2.25 1.00 36.99
0 - 40 31.96 37.36 30.68 Clay loam 2.78 3.06 8.05 0.82 5.12 2.46 0.23 0.41 3.51 2.66 2.00 34.86
40 - 70 35.91 32.84 31.25 Clay loam 1.79 2.48 8.22 0.98 6.12 3.28 0.30 0.15 2.66 3.60 3.50 42.93
70 - 95 47.22 15.35 37.43 Sandy clay 2.09 4.97 7.83 1.17 8.20 3.06 0.34 0.13 3.81 4.05 4.00 36.56
95 - 195 38.34 32.04 29.62 Clay loam 1.87 4.14 7.99 0.88 6.12 2.46 0.06 0.11 2.95 2.25 3.50 37.10
2 195 - 235 32.40 42.87 24.73 Loam 1.98 3.31 7.95 0.63 4.28 1.64 0.34 0.09 2.66 2.66 1.00 38.40
0 - 35 60.39 20.80 18.81 Sandy loam 1.81 14.90 8.30 0.74 3.06 3.28 0.32 0.53 3.09 2.25 2.00 32.63
35 - 55 68.91 9.85 21.24 Sandy clay loam 0.95 17.40 8.39 0.57 4.10 1.22 0.17 0.25 1.84 2.60 1.50 31.46
55 - 70 86.41 2.68 10.91 Loamy sand 0.63 22.60 8.48 0.48 3.06 1.46 0.15 0.18 1.12 2.25 1.50 38.65 3
70 - 150 87.49 4.11 8.40 Loamy sand 0.73 25.60 8.52 0.52 2.46 2.46 0.16 0.22 1.84 2.25 1.00 26.89
0 - 20 93.23 2.42 4.35 Sand 0.52 25.70 8.57 2.71 13.10 2.95 11.40 0.17 15.40 3.60 8.00 21.11
20 - 35 74.49 10.10 15.41 Sandy loam 0.07 33.10 8.61 5.77 26.40 3.11 27.50 0.36 27.40 6.30 21.00 19.91 4
35 - 150 43.64 51.06 5.30 Silt loam 0.87 29.00 8.17 1.44 10.70 2.64 1.29 0.18 8.82 2.25 3.50 21.16
0 - 20 40.07 37.76 22.17 Loam 2.36 2.48 8.15 0.98 5.88 3.34 0.37 0.37 5.33 2.66 2.00 33.66
20 - 35 34.22 31.20 34.58 Clay loam 1.38 2.07 8.04 0.94 5.74 3.28 0.27 0.22 5.19 2.25 2.00 41.83 5
35 - 65 40.46 34.58 24.96 Loam 1.34 1.66 8.14 0.57 2.44 2.46 0.60 0.12 2.55 1.80 1.50 34.14
0 - 45 40.5 29.77 29.73 Clay loam 2.42 2.07 8.29 0.99 4.28 4.88 0.70 0.09 4.12 3.60 2.00 37.10 6
45 - 80 46.41 25.81 27.78 Sandy clay loam 1.76 2.48 8.24 0.88 4.88 3.28 0.51 0.18 3.09 4.05 1.50 37.35
0 - 40 40.97 28.74 30.29 Clay loam 2.75 3.48 7.81 1.27 7.84 4.10 0.54 0.21 6.39 3.60 3.00 36.25
40 - 70 31.45 39.93 28.63 Clay loam 1.10 2.40 8.39 0.52 2.44 2.44 0.21 0.06 2.66 1.80 1.00 36.16
70 - 120 42.43 34.04 23.53 Loam 1.81 4.97 8.26 0.95 5.56 3.28 0.27 0.08 3.12 4.05 2.00 34.01
7
120 - 155 45.96 32.14 21.91 loam 2.34 1.66 8.30 0.81 6.72 1.22 0.24 0.10 3.09 4.50 1.00 37.12
0 - 50 62.80 6.63 30.57 Sandy clay loam 2.56 15.55 8.24 0.75 4.28 2.44 0.33 0.11 2.55 3.40 1.50 35.27
50 - 70 84.85 2.24 12.91 Loamy sand 0.63 38.20 8.48 0.52 2.46 2.46 0.22 0.06 1.84 2.25 1.00 23.33
70 - 85 91.57 3.25 5.18 Sand 0.42 41.40 8.55 0.91 5.44 2.46 1.02 0.10 3.49 3.45 2.00 23.97 8
85 - 150 94.37 2.62 3.01 Sand 0.70 25.30 8.50 1.14 6.12 4.88 0.27 0.14 6.39 3.60 1.50 30.10
0 - 10 40.53 37.12 22.35 Loam 0.73 33.10 8.17 2.82 20.50 5.74 1.37 1.32 11.00 4.05 13.00 25.80
10 - 35 93.05 2.35 4.61 Sand 0.59 45.60 8.09 3.61 29.50 4.10 1.24 1.47 5.49 3.60 26.00 19.24 9
35 - 150 90.77 5.71 3.52 Sand 0.78 36.40 8.39 1.73 13.10 2.46 0.87 1.01 3.09 2.25 12.00 21.46
Ass. Univ. Bull. Environ. Res. Vol. 14 No. 2, October 2011
-72-
)٢(الجدول
Table 2: Percentages of minerals in heavy and light fractions of the fine and very fine sand of the studied soils
Heavy Minerals (%) Lighet Minerals (%)
Opa- Epi- Pyro- Amph- Aug- Horn- Sph- Ru- Gar- Zir- Tour- Mon- Stur- Bio- Apa- Kya- Qua- Feld- Micro- Cal- Profile
No. Depth (cm)
ques dotes xenes iboles ite blend ene tile net con maline azite olite tite tite nite rtz spars cline cite
0 - 15 46.47 17.1 11.15 7.43 8.18 5.58 2.23 0.74 0.74 0.37 0.37 1.12 1.12 9.29 1.49 0.37 95.77 4.11 0.55 0.12
15 - 25 53.79 17.6 7.87 9.68 6.99 7.92 1.88 0.29 0.29 0.59 0.00 0.59 0.29 3.88 2.38 0.88 95.85 4.15 0.64 0.00
25 - 35 50.67 8.97 14.8 11.66 11.66 6.73 2.24 0.90 0.90 0.90 0.45 1.35 0.90 4.04 1.35 0.90 93.24 6.76 1.17 0.00 1
35 - 70 43.42 19.08 15.13 9.87 12.5 6.58 5.26 1.32 0.66 0.66 0.66 0.66 0.66 2.63 0.00 0.00 97.72 2.28 0.33 0.00
0 - 40 39.39 12.12 15.76 9.7 10.91 7.88 7.27 1.21 2.42 1.21 1.21 1.21 0.61 6.06 1.21 0.61 97.13 2.63 0.53 0.24
40 - 70 53.13 7.81 7.81 7.81 3.91 5.47 2.34 1.56 1.17 1.17 1.56 1.17 0.78 11.72 1.56 0.39 98.52 1.48 0.25 0.00
70 - 95 39.77 14.77 9.66 7.39 7.39 5.68 3.98 1.14 1.70 1.70 0.57 2.84 1.14 11.36 2.27 1.70 98.21 1.57 0.39 0.22
95 - 195 47.3 13.51 9.46 10.14 7.43 6.76 3.38 1.35 1.35 0.68 0.68 2.03 0.68 6.76 2.03 0.68 96.15 3.85 0.64 0.00
2
195-235 54.55 16.36 6.36 8.18 5.45 6.36 1.82 0.91 0.91 1.82 0.91 2.73 0.91 4.55 0.00 0.00 97.05 2.95 0.42 0.00
0 - 35 54.95 8.79 14.29 8.79 10.99 6.59 2.20 1.10 4.94 0.55 1.10 1.10 1.10 0.00 0.00 1.10 88.54 2.27 0.32 9.18
35 - 55 58.39 9.49 14.6 10.22 8.76 5.84 0.73 2.19 0.73 0.73 0.00 0.73 0.73 0.73 0.00 0.73 84.91 1.10 0.37 13.99
55 - 70 40.27 16.78 20.13 12.75 11.41 6.71 2.01 2.68 3.36 1.34 0.00 0.00 0.67 0.00 0.00 0.00 81.52 0.36 0.00 18.12 3
70 - 150 41.24 13.4 16.49 17.53 7.22 10.31 3.09 2.06 3.09 2.06 0.00 1.03 0.00 0.00 0.00 0.00 82.10 1.48 0.00 16.42
0 - 20 62.83 7.85 9.42 10.47 8.38 6.28 2.09 0.52 1.57 2.62 1.05 0.00 1.05 0.00 0.00 0.52 67.02 0.80 0.27 32.17
20 - 35 62.83 9.95 11.52 5.76 8.9 4.71 2.62 2.62 2.09 1.57 0.52 0.00 0.52 0.00 0.00 0.00 66.84 1.07 0.27 32.09 4
35 - 150 54.64 9.84 14.21 13.11 10.93 9.29 1.09 1.09 0.55 2.73 1.09 0.55 0.55 0.00 0.55 0.00 55.28 0.75 0.25 43.97
0 - 20 34.48 21.67 16.75 17.73 12.32 14.78 2.46 0.99 0.49 0.49 0.49 0.99 0.49 1.97 0.49 0.49 95.00 4.75 0.25 0.25
20 - 35 44.64 8.93 11.61 8.04 8.93 6.25 5.36 1.79 0.89 0.89 0.89 2.68 1.79 8.93 1.79 1.79 97.22 2.78 0.28 0.00 5
35 - 65 42.25 18.59 15.49 11.55 12.68 8.45 1.69 0.56 0.28 0.56 0.00 0.56 0.28 5.63 1.69 0.85 96.62 3.14 0.24 0.24
0 - 45 46.15 15.38 16.54 9.23 11.54 7.69 1.92 0.38 0.77 1.54 0.00 0.77 0.38 5.77 0.38 0.77 98.04 1.96 0.33 0.00 6
45 - 80 44.22 12.56 13.57 14.07 5.03 7.54 5.03 0.50 0.29 2.22 0.00 1.51 0.00 5.03 1.01 0.00 98.04 1.96 0.28 0.00
0 - 40 41.37 12.59 18.71 14.03 8.99 10.79 3.60 1.44 0.36 2.16 0.00 0.72 0.36 3.60 0.72 0.36 95.95 3.41 0.21 0.64
40 - 70 47.7 13.16 13.49 11.51 10.86 9.87 3.29 0.99 0.33 1.97 0.66 1.64 0.99 2.63 0.99 0.66 95.99 4.01 0.35 0.00
70 - 120 54.89 11.89 6.58 6.58 5.26 6.58 7.89 1.32 1.32 2.63 0.00 1.32 0.00 6.58 0.00 0.00 93.06 5.86 0.72 1.08 7
120-155 50 9.38 9.38 12.5 6.25 9.38 3.75 1.25 0.63 2.50 0.00 0.63 0.63 9.38 0.00 0.00 97.40 1.95 0.32 0.65
0 - 50 62.21 9.22 12.9 6.45 11.52 5.99 2.76 1.84 0.00 2.30 0.46 0.00 0.00 0.92 0.92 0.00 82.52 1.29 0.32 16.18
50 - 70 61.48 9.84 10.25 5.74 5.33 4.51 2.05 1.23 4.10 2.46 1.23 1.23 0.00 0.00 0.00 0.41 64.50 0.54 0.00 34.96
70 - 85 50.00 7.00 19.00 3.00 11.00 3.00 7.00 4.00 7.00 3.00 0.00 0.00 0.00 0.00 0.00 0.00 65.07 0.88 0.00 34.05 8
85 - 150 57.88 17.68 8.04 4.5 4.82 4.18 3.22 2.57 2.25 1.93 1.29 0.00 0.00 0.64 0.00 0.00 73.21 0.68 0.00 26.12
0 - 10 45.59 12.16 12.77 13.98 9.12 9.42 3.04 2.74 2.13 3.04 1.52 0.91 0.61 0.61 0.30 0.61 74.74 1.05 0.00 24.21
10- 35 51.81 9.84 15.54 10.36 10.36 7.77 2.07 1.04 0.78 3.11 2.59 0.78 1.04 0.52 0.52 0.00 66.11 0.47 0.23 33.42 9
35 -150 62.22 4.44 9.78 8.00 7.56 4.89 4.44 1.78 4.00 3.56 0.89 0.44 0.44 0.00 0.00 0.00 51.20 0.60 0.30 48.19

Ass. Univ. Bull. Environ. Res. Vol. 14 No. 2, October 2011
-73-
الجدول الثالث
Table 3: Relative abundance of the identified minerals in the clay fraction of the studied soils
Profile No.
Depth (cm)
Smectites Kaolinite Mixed
micas-sme Vermiculite Chlorite Sepiolite
Palygo- rskite
Mixed micas-verm.
Micas
Pyroph-yllite
Quartz K-Feldspar Calcite Plagioclase
0 - 15 27.44 6.51 5.66 6.79 6.36 3.11 2.12 2.26 1.41 0.28 20.23 12.16 4.24 1.41 15 - 25 35.28 6.24 2.99 7.46 6.11 2.71 2.04 1.90 0.54 0.41 12.08 15.06 4.48 2.71 25 - 35 40.76 5.37 13.42 0.00 2.58 3.20 3.10 1.55 2.06 0.31 10.94 9.29 4.13 3.30
1
35 - 70 33.76 7.77 12.41 0.00 1.94 2.37 3.45 1.40 3.34 0.65 12.94 11.87 4.31 3.78 0 - 40 25.72 6.24 11.11 4.99 5.87 2.00 3.12 1.87 2.75 1.25 16.48 13.48 3.50 1.62
40 - 70 28.97 4.49 11.90 7.34 6.35 2.48 2.48 1.69 2.78 1.09 10.89 12.80 5.26 1.49 70 - 95 29.74 7.03 12.25 5.72 4.58 2.29 0.98 1.14 1.96 0.65 14.05 13.07 4.90 1.63 95 - 195 33.37 8.58 3.22 4.29 3.97 3.22 3.00 2.36 0.54 0.43 13.95 14.81 6.44 1.82
2
195-235 40.63 8.34 2.94 8.34 3.34 3.93 2.36 2.75 2.06 0.98 10.60 7.75 4.51 1.47 0 - 35 31.50 6.76 2.71 5.31 4.64 2.90 3.86 2.22 0.97 0.48 12.56 5.80 18.36 1.93
35 - 55 21.60 6.00 10.84 3.69 2.92 5.46 4.23 5.38 1.54 0.77 9.45 3.38 20.75 4.00 55 - 70 25.81 5.60 2.55 3.90 4.58 1.70 2.72 1.70 0.85 0.85 9.00 3.40 35.65 1.70
3
70 - 150 16.63 5.65 7.36 3.41 2.67 5.22 3.94 4.80 1.17 0.75 8.00 3.84 33.05 3.52 0 - 20 19.24 10.87 7.90 5.11 4.18 3.72 3.07 2.79 2.51 0.46 10.22 3.90 24.16 1.86
20 - 35 21.61 10.59 14.15 4.83 3.98 3.22 2.54 5.68 0.85 0.68 10.59 3.22 16.53 1.53 4 35 - 150 19.39 11.40 1.18 6.35 5.17 4.00 4.70 2.59 1.18 0.82 10.58 5.05 25.85 1.76 0 - 20 38.17 5.65 3.14 6.27 5.20 2.51 1.61 1.88 1.70 0.45 15.23 11.65 4.75 1.79
20 - 35 36.35 6.04 1.89 5.41 4.15 3.27 2.14 2.52 2.77 0.63 16.35 9.06 7.17 2.26 5 35 - 65 39.05 7.91 4.82 6.27 4.82 2.89 3.86 1.93 0.48 0.48 12.05 7.71 5.30 2.41 0 - 45 22.41 6.11 13.45 7.33 5.70 2.44 1.79 2.77 2.44 0.41 15.16 11.74 6.60 1.63 6
45 - 80 31.62 5.78 8.83 6.42 4.82 2.73 2.89 4.09 2.65 0.64 14.85 8.83 4.25 1.61 0 - 40 30.76 4.66 2.00 5.99 4.79 1.86 1.33 1.60 1.60 0.67 19.44 14.65 7.99 2.66
40 - 70 34.38 4.76 2.72 0.00 3.67 1.36 0.68 0.82 0.68 0.68 22.42 15.90 9.24 2.72 70 - 120 23.51 6.97 11.06 7.71 6.32 3.35 2.23 2.79 3.07 0.56 15.80 10.32 4.37 1.95
7
120-155 34.61 6.92 11.36 0.00 4.55 1.86 1.76 0.00 2.07 0.41 19.32 11.47 3.82 1.86 0 - 50 52.73 7.58 2.96 0.00 1.66 2.37 0.95 0.00 0.83 0.59 12.80 7.70 7.46 2.37
50 - 70 40.86 5.69 3.49 6.50 4.55 3.09 2.27 2.60 2.19 0.41 7.72 3.01 14.46 3.17 70 - 85 34.42 8.82 12.68 0.00 1.68 2.27 3.36 0.00 2.10 0.34 6.80 1.34 23.51 2.69
8
85 - 150 26.47 8.60 10.02 4.73 3.78 1.98 1.89 3.78 0.95 0.38 6.43 1.89 27.41 1.70 0 - 10 24.53 7.95 1.69 3.55 2.88 3.38 2.20 3.05 1.35 0.68 17.94 5.41 22.84 2.54 10 35 21.49 9.06 1.90 2.92 2.34 2.19 1.90 1.90 1.02 0.44 15.64 5.85 31.43 1.90 9
35 - 150 14.79 10.17 9.52 4.16 3.70 2.59 4.34 2.22 1.66 0.74 13.40 4.53 25.97 2.22

Ass. Univ. Bull. Environ. Res. Vol. 14 No. 2, October 2011
-74-
RESULTS AND DISCUSSIONS:
I-Available nutrients:
1-Phosphorus:
The available phosphorus in the soil samples
of the studied profiles is present in Table (4). The
results indicated that the available phosphorus
varies from 14.84 to 54.68 ppm. Most layers of
the soils of recent and old Nile terraces show
greater P concentrations than those of the terrace
bench in the interference zone and those of the
terrace rear suture in desert fringes on both Nile
sides, indicating that Nile sediment-derived soils
are characterized by high contents of
phosphorus. In general, the soils of the oldest
terraces on both Nile sides have higher values of
available phosphorus than those of the youngest
ones, particularly in the surface layers. This could
be due to the surface applications of organic and
inorganic phosphate fertilizers during cultivating
the soils of the oldest terraces on both Nile sides.
In most cases, there are no consistent changes
in the available phosphorus in the studied soils
with depth as shown in Figure (2). This reflects
the nature of sediments forming these soil profiles
and their role in affecting its chemical
composition.
All the studied soils of the recent and old Nile
terraces show a very high level of phosphorus
(>21ppm), according to Cook (1967). However,
most soil layers of the terrace bench in the
interference zone and of the terrace rear suture in
desert fringes on both Nile sides exhibit moderate
to high values of available P (13-20 ppm). For the
oldest Nile terrace soils, the sediment nature as
well as the application of mineral fertilizers and
the organic residues are possibly the cause for the
very high available P values obtained. Phospho-
rus-bearing minerals in desert could be the source
for the obtained P values. These results are in
agreement with those of Farragallah (1995) and
Abdel-Mawgoud and Faragallah (2004).
The relationships between soil available
phosphorus and particle size distribution as well
as some chemical properties have been
statistically studied as correlation coefficients
(r values) (Table 5). The highest positive
correlation coefficient (r=+0.755**) was recorded
between the sum of silt+clay fractions and
available phosphorus. However, the highest
negative correlation coefficient (r=-0.755**)
occurred with sand fraction. Such results are in
accordance with those of Amer et al. (1991), Eden
and Parfitt (1992), Awadalla (1993) and
Faragallah (1995).
Highly significant positive correlations were
recorded between each of clay, silt, organic
matter and CEC and available phosphorus.
However, highly significant negative correlations
were obtained between soil CaCO3 as well as
pH and available P (Table 5). Insignificant
correlation was observed between salinity content
(ECe) of the studied soils and available P with
very low negative correlation (r=-0.130). Most of
these results agree with those reported by
Awadalla (1993) and Faragallah (1995).
Concerning, the relationship between
available phosphorus and its bearing-minerals in
the studied soils, correlation coefficients between
the concentration of available P and the
percentages of apatite, monazite and apatite +
monazite were calculated and are given in Table

Ass. Univ. Bull. Environ. Res. Vol. 14 No. 2, October 2011
-75-
(6). The results showed that significantly positive
correlations are between the available phosphorus
and both monazite (r=+0.319*) and the sum of
apatite+monazite (r=+0.350*). However, low
positive correlation is found between available P
and the percentages of apatite (r=+0.280). These
data suggest that monazite could be the possible
source of available P in the uncultivated soils of
the youngest Nile terraces on river border and the
terrace rear suture in the desert fringes.
Moreover, the phosphorus bearing minerals as
well as the organic and inorganic fertilizers added
through cultivation practices could be the main
source of available P in the cultivated soils of the
oldest Nile terraces.
2-Potassium:
The available potassium in the studied soil
profiles is shown in Table (4) and graphically
presented in Figure (3). The results generally
indicated clear variations in the available K
among various layers and sites. Most soil layers of
the youngest Nile terraces show a greater K
concentration than the oldest ones, but the surface
layers of the oldest terraces have the highest
amounts of available potassium. According to
Metson (1961), most layers of youngest terrace
soils show medium amounts of K (205.04 - 293.50
ppm) on both Nile sides. However, most layers of
oldest terrace soils exhibit low to medium
amounts of K (155.68 -256.50 ppm). The surface
layer of the oldest terraces soils on eastern and
western Nile sides show very high amounts of K
(571.20 and 474.51 ppm, respectively). On the
other hand, most soil layers of the terrace bench
in the interference zone and the terrace rear
suture in desert fringes on both Nile sides have
relatively low values of available K (48.71 - 186.50
ppm). No specific pattern of potassium
distribution with depth is evident (Figure 3). The
nature of sediments and the fertilizer applications
could be the reason for enriching the surface soil
with K+. Similar results were obtained by El-
Hadedy (1976), Faragallah (1995) and Abdel-
Mawgoud and Faragallah (2004).
The correlation coefficients between available
potassium and some physical and chemical
properties of the soils under study are given in
Table (5). Highest positive correlation coefficients
were recorded between clay and organic matter
contents (r=+0.643** and +0.673**, respectively)
and the available potassium concentration. On the
other hand, the available K showed a highest
negative correlation (r=-0.541**) with the sand
fraction.
Highly significant, positive correlations were
obtained between the available K and contents of
silt, clay+silt and CEC (r=+0.400**, +0.565** and
+0.421**, respectively). However, highly
significant, negative correlations were recorded
between the available K and both soil pH and
CaCO3 content (r=-0.599** and -0.510**,
respectively). Insignificant negative correlation
coefficient was found between available K and soil
salinity (Table 5). The same trends reported by
Abou-El-Roos (1972), Kabata-Pendias and
Pendias (1984) and Faghami et al. (1985).
Regarding the relation between the available
potassium and its bearing minerals, correlation
coefficients between levels of available K and the
percentages of microcline, feldspars and biotite in
sand fraction as well as feldspars, smectites, and

Ass. Univ. Bull. Environ. Res. Vol. 14 No. 2, October 2011
-76-
micas in clay fraction were calculated and present
in Table (6). A highly significant, positive
correlation was only obtained between the
available K and the k-feldspar content of the
clay fraction (r=+0.540**). In all cases,
correlation values are positive and insignificant.
Accordingly, the role of microcline and biotite
(sand fraction) as well as smectites, and micas
(clay fraction) in affecting available K is not
clearly expressed. The relatively high K levels in
the cultivated oldest Nile terrace soils could be
attributed to agricultural practices rather than
due to K-bearing minerals. The uncultivated soils
of youngest Nile terraces on river border and the
terrace rear suture in the desert fringes have
relatively high values of available K due to the
total native amounts that have not been yet used
by cropping.

Ass. Univ. Bull. Environ. Res. Vol. 14 No. 2, October 2011
-77-
Table 4: Available phosphorus (P) and potassium (K) in soil samples of the studied Nile terraces
P K P K Profile No.
Depth (cm) (ppm)
Profile No.
Depth (cm) (ppm)
0 - 15 43.22 227.70 0 - 20 48.92 281.15 15 - 25 48.29 256.50 20 - 35 43.6 272.92 25 - 35 39.20 293.50
5 35 - 65 40.99 205.04
1
35 - 70 49.97 412.80 0 - 45 38.25 192.70 0 - 40 54.68 571.20
6 45 - 80 42.57 180.36
40 - 70 37.71 198.90 0 - 40 54.43 474.50 70 - 95 28.04 256.50 40 - 70 51.32 155.68 95 - 195 26.30 190.60 70 - 120 40.24 69.28
2
195- 235 48.79 221.50
7
120- 155 32.65 205.04 0 –35 38.08 366.75 0 –50 25.18 295.55 35 –55 39.83 166.00 50 –70 18.70 75.45 55 –70 20.95 131.00 70 –85 13.84 56.94
3
70 –150 20.20 178.30
8
85 –150 20.93 48.71 0 - 20 35.24 65.17 0 - 10 36.63 279.41
20 - 35 36.94 186.50 10 - 35 20.04 114.54 4 35 - 150 20.93 71.34
9 35 - 150 20.54 126.88

Ass. Univ. Bull. Environ. Res. Vol. 14 No. 2, October 2011
-78-
Fig. 2: Distribution of available phosphorus in the soil profiles with distance from the Nile border to
the desert on both sides Table 5: Correlation coefficients (r values) of available P and K and some soil properties
r value Soil property Phosphorus Potassium
Sand (%) -0.755** -0.565**
Silt (%) +0.655** +0.400**
Clay (%) +0.689** +0.643**
Silt + Clay (%) +0.755** +0.565**
Organic matter (%) +0.555** +0.673**
CaCO3 (%) -0.740** -0.510**
pH (1:1) -0.492** -0.599**
ECe (dsm-1) -0.130 -0.157
CEC (Cmol+/kg) +0.545** +0.436**
Table 6: Correlation coefficients of available phosphorus and potassium and their bearing minerals of the studied soils
Nutrient (ppm) Mineral (%) "r" value
Apatite +0.280
Monazite +0.319* Phosphorus
Apatite + Monazite +0.350*
Microcline +0.278
Biotite +0.255
K-feldspars (clay fraction) +0.540**
Smectites +0.281
Potassium
Micas +0.160
* Significant at the 5% level. ** Significant at the 1% level.

Ass. Univ. Bull. Environ. Res. Vol. 14 No. 2, October 2011
-79-
Fig. 3: Distribution of available potassium in the soil profiles with distance from the Nile border to the desert on both sides

Ass. Univ. Bull. Environ. Res. Vol. 14 No. 2, October 2011
-80-
3-Iron:
The DTPA-extractable Fe of the soil samples
of the studied Nile terraces are present in Table
(7) and graphically illustrated in Figure (4).
Generally, it ranges between 1.33 and 36.72 ppm.
In soil samples representing the youngest and
oldest Nile terraces, the extractable Fe ranges
from 19.91 to 36.72 ppm. The highest levels of
DTPA-extractable Fe are obtained in the oldest
Nile terraces soils. According to the limits of Viets
and Lindsay (1973), all samples of the youngest
and oldest Nile terraces soils and most soil layers
of the terrace bench in the interference zone
contain adequate amounts of available Fe (>4.5
ppm). However, most soil samples of the terrace
rear suture in desert fringes on both Nile sides are
deficient (<2.5 ppm) to marginal (2.5-4.5 ppm)
with respect to the extractable Fe. Similar results
were reported by Abdellah (1984), Amer et al.
(1991), Faragallah (1995), Abdel-Mawgoud and
Faragallah (2004) and Faragallah and Essa
(2005).
No clear distribution pattern of the available
Fe can be observed in all studied sites, especially
in the case of youngest and oldest Nile terraces
soils (Figure 4).
The correlation coefficients (r values)
between the DTPA-extractable Fe and some soil
properties of the studied samples are given in
Table (8). The fine particles (clay and the sum of
clay+ silt) showed the highest positive correlations
with the extractable Fe (r=+0.811** and
+0.833**, respectively). On the other hand, the
sand fraction was negatively correlated to the
extractable Fe (r=-0.833**). Highly significant,
positive correlations showed the relations between
the organic matter content and CEC of the
studied soil samples and the DTPA-extractable
Fe (r=+0.691** and +0.784**, respectively).
However, highly significant negative correlations
between both calcium carbonate content and soil
pH and the DTPA-extractable Fe were obtained
(r=-0.858** and -0.581**, respectively). A
significant negative correlation was recorded
between the soil ECe and the DTPA-extractable
Fe (Table 8). Such trends were also found by
Rabie et al. (1989), Amer et al. (1991), Awadalla
(1993) and Faragallah (1995).
Respecting the relation between the DTPA-
extractable iron and its bearing minerals
(opaques, epidotes, amphiboles, pyroxenes,
biotite and feldspars according to Wedepohl,
1974 and Dress and Wilding, 1978, as well as
smectites, chlorite, sepiolite, palygorskite, micas
and vermiculite according to Duane and Robert,
1989 and Velde, 1992), the correlation
coefficients between them were calculated and
listed in Table (9). The data reveal that highly
significant positive correlations between the
extractable Fe and biotite (r=+0.817**) and
feldspars of the sand fraction (r=+0.615**) as
well as feldspars of the clay fraction and
smectites (r=+0.749** and +0.425**,
respectively). A significantly positive correlation
is found between the extractable Fe and both
epidotes (r=+0.335*) and chlorite (+0.375*), but
low positive correlations were recorded with
amphiboles (r=+0.149), micas (+0.292) and
vermiculite (+0.167), indicating the role of these
minerals as a source for iron in the studied soils.

Ass. Univ. Bull. Environ. Res. Vol. 14 No. 2, October 2011
-81-
Table 7: DTPA-extractable Fe, Mn, Cu and Zn in the soil samples of the studied Nile terraces
Fe Mn Cu Zn Fe Mn Cu Zn Profile No.
Depth (cm) (ppm)
Profile No.
Depth (cm) (ppm)
0 - 15 23.79 7.67 2.41 0.4 0 - 20 24.93 8.78 2.45 0.79 15 - 25 21.71 8.54 2.39 0.39 20 - 35 25.79 8.57 2.89 1.43 25 - 35 28.62 3.43 1.58 0.31
5 35 - 65 26.04 7.08 2.77 0.38
1
35 - 70 23.08 4.16 2.56 0.45 0 - 45 31.10 4.46 2.84 1.69 0 - 40 19.91 4.73 1.96 0.66
6 45 - 80 29.81 6.44 2.45 0.52
40 - 70 36.72 3.56 2.07 0.42 0 - 40 20.52 1.61 2.08 0.31 70 - 95 29.33 3.61 3.20 0.4 40 - 70 26.67 1.74 2.10 0.38
95 - 195 32.70 2.69 2.96 0.37 70 - 120 26.79 1.08 2.40 0.32 2
195-235 33.26 2.23 3.44 0.58
7 120-155 35.32 1.51 2.67 0.67
0 - 35 13.37 5.84 1.44 1.19 0 - 50 12.41 4.25 1.88 0.46 35 - 55 8.24 1.26 0.82 0.75 50 - 70 6.30 0.52 0.68 0.34 55 - 70 8.41 1.16 0.93 1.20 70 - 85 3.76 1.93 0.41 0.18
3 70 - 150 6.37 0.37 0.41 0.22
8 85 - 150 4.24 2.00 0.71 0.39
0 - 20 1.80 0.17 0.23 0.16 0 - 10 20.46 4.78 1.39 1.52 20 - 35 9.01 0.97 0.72 0.47 10 - 35 3.68 3.12 0.21 0.19
4 35 - 150 1.33 4.82 0.27 0.56
9 35 - 150 1.48 0.31 0.20 0.12
Fig. 4: Distribution of DTPA-extractable Fe, Mn, Cu and Zn in the soil profiles with distance from the
Nile border to the desert on both sides

Ass. Univ. Bull. Environ. Res. Vol. 14 No. 2, October 2011
-82-
Table 8: Correlation coefficients (r values) of DTPA-extractable Fe, Mn, Cu and Zn and some soil properties
r value Soil property Fe Mn Cu Zn
Sand (%) -0.833** -0.565** -0.824** -0.289 Silt (%) +0.688** +0.512** +0.636** +0.251 Clay (%) +0.811** +0.486** +0.863** +0.264 Silt + Clay (%) +0.833** +0.565** +0.824** +0.289 Organic matter (%) +0.691** +0.392* +0.743** +0.164 CaCO3 (%) -0.858** -0.463** -0.877** -0.176 pH (1:1) -0.581** -0.522** -0.681** -0.057 ECe (dsm-1) -0.338* -0.190 -0.400** -0.059 CEC (Cmol+/kg) +0.784** +0.424** +0.830** +0.318*
Table 9: Correlation coefficients of DTPA-extractable Fe, Mn, Cu and Zn and their bearing-minerals in the studied soils
Nutrient Mineral R Value Nutrient Mineral R Value Opaques -0.453** Chlorite +0.339* Epidotes +0.335* Smectites +0.357* Amphiboles +0.149 Sepiolite -0.103 Pyroxenes -0.256 Palygorskite -0.103 Biotite +0.817**
Mn
Micas -0.034 Feldspars (Sand Fraction) +0.615** Opaques -0.477** Feldspars (Clay Fraction) +0.749** Epidotes +0.497**Chlorite +0.375* Hornblende +0.224 Smectites +0.425** Augite -0.077 Sepiolite -0.211 Biotite +0.766**Palygorskite -0.401** Garnet -0.517** Micas +0.292 Rutile -0.469**
Fe Vermiculite +0.167 Sphene +0.163
Opaques -0.430** Feldspars (Sand Fraction) +0.574**Epidotes +0.425**
Cu
Feldspars (Clay Fraction) +0.736**Hornblende +0.315* Opaques -0.287 Garnet -0.362* Hornblende +0.190 Rutile -0.394** Pyroxenes +0.233
Mn
Sphene -0.058
Zn
Biotite +0.073
* Significant at the 5% level. ** Significant at the 1% level.

Ass. Univ. Bull. Environ. Res. Vol. 14 No. 2, October 2011
-83-
4-Manganese:
Generally, the DTPA-extractable Mn of the
studied soils ranges between 0.17 and 8.78 ppm
(Table 7). For the soil samples of the youngest and
oldest terraces, it varies between 1.08 and 8.78
ppm. According to DTPA-extractable Mn limits
of Viets and Lindsay (1973), all these soils are
Mn-sufficient. Moreover, the soils of the youngest
terraces on both Nile sides contain higher DTPA-
extractable Mn than those of the oldest ones.
However, several soil samples of the terrace bench
in the interference zone and the terrace rear
suture in desert fringes on both sides have
amounts of DTPA-extractable Mn less than 1.0
ppm. Therefore, these soils are considered Mn
deficient. No specific pattern of extractable Mn
distribution with depth can be shown (Figure 4).
These results are in full accordance with those
reported by Abd El-Razek et al. (1984) and
Faragallah (1995), Abdel-Mawgoud and
Faragallah (2004) and Faragallah and Essa
(2005).
The correlation coefficients calculated to test
the effect of some soil properties on the level of
DTPA-extractable Mn, showed highly significant
positive correlations with contents of silt, clay,
silt+clay and CEC (Table 8). On the other hand,
highly significant negative correlations were
found in cases of sand, CaCO3 and pH of the
studied soils. A significant positive correlation
(r=+0.392*) was obtained between the soil
organic matter content and the extractable Mn.
Insignificant correlation resulted between soil
ECe and DTPA-extractable Mn (r=-0.190).
Similar trends were reported by Attia (1988),
Rabie et al. (1989), El-Shazely et al. (1991) and
Amer et al. (1991).
Manganese is present in magnetite
(opaques), hornblende, epidote, garnet, rutile
and sphene (Gladilovich and Sergeeva, 1971) as
well as smectites, chlorite, sepiolite, palygorskite
and micas (Duane and Robert, 1989 and Velde,
1992). To clear up the relationship between the
DTPA-extractable Mn and its bearing minerals,
the correlation coefficients are recorded in Table
(9). The obtained data clearly show that there are
a highly significant positive correlation value
between extractable Mn with epidotes
(r=+0.425**) and slightly significant positive
correlations with hornblende (r=+0.315*),
smectites (r=+0.357*) and chlorite (r=+0.339*).
These suggest that epidote, hornblende,
smectites and chlorite minerals are considered a
source of manganese in the studied soils.
However, there are highly significant negative
correlation values between the extractable Mn
and both opaques (r=-0.430**) and rutile
(r=-0.394**). Moreover, a slightly significant
negative correlation for the extractable Mn with
garnet (r=-0.362*). These relations are logic
where rutile, opaques and garnet are considered
the most stable minerals.
5-Copper:
Table (6) reveals that the DTPA-extractable
Cu of the investigated soils falls in the range
between 0.20 and 3.44 ppm. It can be stated that
all these soils are considered Cu nondeficient
according to the limits of Viets and Lindsay
(1973), where they contain more than 0.2ppm.
The youngest and oldest Nile terraces soil samples

Ass. Univ. Bull. Environ. Res. Vol. 14 No. 2, October 2011
-84-
have high levels of extractable Cu., Moreover,
these levels were quite variable among these
terraces. This suggests that metal content may be
controlled by similar soil components. From the
results in Table (7) and Figure (4), there is no
clear trend in distribution of DTPA-extractable
Cu with depth of the studied soils.
Highly significant correlations were found
between the examined soil properties and the
DTPA-extractable Cu (Table 8). The highest
positive correlation coefficient (+0.863**) was
obtained between the clay fraction and the
DTPA-extractable Cu. On the other hand, the
highest negative correlation coefficient (-0.877**)
was recorded with the CaCO3 content. These
results well coincide with those obtained by Attia
(1988), Rabie et al. (1989), Amer et al. (1991),
Faragallah (1995) and Marto-Anez and Motto
(2000).
With regard to the relation between the
DTPA-extractable Cu and its bearing minerals,
correlation coefficients were calculated between
them, where copper occurs in hornblende,
augite, biotite, feldspars, opaques (ilmenite &
magnetite), epidotes, garnet, rutile and sphene
(Mitchell, 1964; Gladilovich and Sergeeva, 1971).
Data in Table (9) indicate that highly significant
positive correlations were obtained between the
extractable Cu and biotite (r=+0.766**),
feldspars of the clay fraction (r=+0.736**), the
feldspars of sand fraction (r=+0.574**) and
epidotes (r=+0.497**). Moreover, low positive
correlation with hornblende (r=+0.224). On the
other hand, highly significant negative
correlations were recorded between the
extractable Cu and garnet (r=-0.517**), rutile
(r=-0.469**) and opaques (r=-0.477**). The
minerals of biotite, feldspars, hornblende and
epidotes are considered as a source of Cu in the
investigated soils. Theses results are reliable
since these minerals are unstable but the others
i.e., rutile and garnet are ultrastable.
6-Zinc:
The DTPA-extractable Zn in the studied soils
ranges from 0.12 to 1.69 ppm (Table 7). Soil
samples representing the youngest Nile terraces
show variable zinc concentrations, ranging from
0.31 to 1.69 ppm. According to the limits of Viets
and Lindsay (1973), most of these soils are
considered Zn deficient since they contain less
than 0.5 ppm. Two samples (the surface sample of
profiles 5 and the subsurface of profile 6 are Zn
marginal. The surface layer of profile 6 and the
subsurface one of profile 5 are only Zn
nondeficient since they have more than 1.0 ppm.
The DTPA-extractable Zn of the oldest Nile
terraces soils falls between 0.31 and 0.67 ppm.
Only, three samples (the surface and lower layers
of profile 2 and the lower one of profile 7) are Zn
marginal but the rest are Zn deficient. For soils of
the terrace bench in the interference zone and the
terrace rear suture in the desert fringes on both
sides, most samples are considered Zn deficient.
No regular distribution pattern is noticed for the
extractable Zn throughout the studied profiles
(Table 7 and Figure 4).
The results in Table (8) indicate that no
significant correlations occurred between all the
considered soil properties and the DTPA-
extractable Zn, except of soil CEC (r=+0.318*).
Fine soil particle i.e., silt, clay and clay+silt
showed low positive correlations with the
Ass. Univ. Bull. Environ. Res. Vol. 14 No. 2, October 2011
-85-
extractable Zn (r=+0.251, +0.264 and +0.289,
respectively). However, a low negative correlation
(r=-0.289) was recoded with the sand fraction.
Very low negative correlations were found with
both soil pH and ECe (r=-0.057 and -0.059,
respectively). Similar relations were obtained by
Khetawat and Vashishtha (1977), Ghoneim et al.
(1984), Attia (1988) and Marto-Anez and Motto
(2000).
Zinc is found mainly in pyroxenes, biotite,
magnetite (opaques) and hornblende minerals
(White, 1957 and Wiklander, 1958). Based on
such information, correlation coefficients were
calculated between these minerals and the DTPA-
extractable Zn of the studied soils (Table 9). The
obtained data clearly illustrate that there are low
positive correlations between the extractable Zn
and hornblende (r=+0.190) and pyroxenes
(r=+0.233). Moreover, a very low positive
correlation with biotite (r=+0.073). The only
exception appears with opaques, which show a
low negative correlation (r=-0.287). These data
indicate that the role played by these suggested
minerals in affecting the level of available Zn is
not clearly expressed.
II-Heavy metals:
1-Nickel:
The DTPA-extractable Ni of the
investigated soils is shown in Table (10).
Generally, the extractable Ni is slightly higher in
the youngest Nile terrace soils than in the oldest
ones with a rang of 0.38 to 1.52 ppm, without any
clear trend of its distribution with depth (Table 10
and Figure 5). The lower values of the DTPA-
extractable Ni are recorded in the terrace bench
in the interference zone and the terrace rear
suture in desert fringes on both sides, where they
range from nil to 0.39 ppm. These soils do not
have also any specific pattern of distribution with
depth (Figure 5). These results agree with those of
Abdel-Mawgoud and Faragallah (2004),
Faragallah and Essa (2005) and Roshdy (2009).
Correlation coefficients calculated to test the
relation between some soil properties and the
DTPA-extractable Ni, are listed in Table (11). The
results show highly positive significant
correlations between the DTPA-extractable Ni
and the soil contents of fine fractions (clay, silt
and sum of silt + clay), organic matter, and CEC.
On the other hand, the highest negative
correlation coefficient (r=-0.801**) was calculated
for the CaCO3 content, followed by the sand
content (r=-0.741**), soil pH (r=-0.535**) and
then soil ECe (r=-0.343*).These relations are in
agreement with those obtained by Roshdy (2009).

Ass. Univ. Bull. Environ. Res. Vol. 14 No. 2, October 2011
-86-
Table 10: DTPA-extractable Ni, Pb and Cd in the soil samples of the studied Nile terraces
Ni Pb Cd Ni Pb Cd Profile No.
Depth (cm) (ppm)
Profile No.
Depth (cm) (ppm)
0 - 15 0.62 0.34 0.01 0 - 20 1.36 0.71 0.02 15 - 25 0.78 0.36 0.02 20 - 35 1.04 0.74 0.02 25 - 35 0.47 0.34 0.02
5 35 - 65 0.96 0.24 0.00
1
35 - 70 0.67 0.44 0.02 0 - 45 1.52 0.75 0.02 0 - 40 0.72 0.43 0.02
6 45 - 80 1.07 0.24 0.00
40 - 70 0.86 0.21 0.01 0 - 40 0.39 0.20 0.00 70 - 95 0.75 0.30 0.01 40 - 70 0.52 0.27 0.02 95 - 195 0.82 0.33 0.02 70 - 120 0.38 0.02 0.00
2
195-235 0.95 0.37 0.03
7
120-155 0.55 0.37 0.02 0 - 35 0.39 0.63 0.01 0 - 50 0.27 0.00 0.00
35 - 55 0.06 0.64 0.00 50 - 70 0.05 0.21 0.01 55 - 70 0.11 0.61 0.04 70 - 85 0.00 0.04 0.00
3
70 - 150 0.07 0.38 0.05
8
85 - 150 0.00 0.09 0.00 0 - 20 0.00 0.00 0.00 0 - 10 0.21 0.58 0.00
20 - 35 0.07 0.37 0.02 10 -35 0.00 0.11 0.00 4 35 - 150 0.00 0.24 0.01
9 35 - 150 0.03 0.00 0.00

Ass. Univ. Bull. Environ. Res. Vol. 14 No. 2, October 2011
-87-
Profile 1
0
0.2
0.4
0.6
0.8
1
1 2 3 4
Layer No
Co
nce
ntr
atio
n (
pp
m)
Ni
Pb
Cd
Profile 5
00.20.40.60.8
11.21.41.6
1 2 3
Layer No
Co
nce
ntr
atio
n (
pp
m)
Ni
Pb
Cd
Profile 2
0
0.2
0.4
0.6
0.8
1
1 2 3 4 5
Layer No
Co
nce
ntr
atio
n (
pp
m)
Ni
Pb
Cd
Profile 6
00.20.40.60.8
11.21.41.6
1 2 3
Layer No
Co
nce
ntr
atio
n (
pp
m)
Ni
Pb
Cd
Profile 7
0
0.1
0.2
0.3
0.4
0.5
0.6
1 2 3 4
Layer No
Co
nce
ntr
atio
n (
pp
m)
Ni
Pb
Cd
Profile 3
0
0.1
0.2
0.3
0.4
0.5
0.6
0.7
1 2 3 4
Layer No
Co
nce
ntr
atio
n (
pp
m)
Ni
Pb
Cd
Profile 8
0
0.05
0.1
0.15
0.2
0.25
0.3
1 2 3 4
Layer No
Co
nce
ntr
atio
n (
pp
m)
Ni
Pb
Cd
Profile 4
00.050.1
0.150.2
0.250.3
0.350.4
1 2 3
Layer No
Co
nce
ntr
atio
n (
pp
m)
Ni
Pb
Cd
Profile 9
0
0.1
0.2
0.3
0.4
0.5
0.6
0.7
1 2 3
Layer No
Co
nce
ntr
atio
n (
pp
m)
Ni
Pb
Cd
Fig. 5: Distribution of extractable Ni, Pb and Cd with depth in the soil profiles of the studied Nile terraces

Ass. Univ. Bull. Environ. Res. Vol. 14 No. 2, October 2011
-88-
Table 11: Correlation coefficients of DTPA-extractable Ni, Pb and Cd and some physical and chemical properties of the studied soils
r value Soil property Ni Pb Cd
Sand (%) -0.741** -0.381* -0.143 Silt (%) +0.605** +0.321* +0.132 Clay (%) +0.729** +0.362* +0.120 Silt + Clay (%) +0.741** +0.381* +0.143 Organic matter (%) +0.675** +0.199 +0.052 CaCO3 (%) -0.801** -0.332* -0.229 pH (1:1) -0.535** -0.165 +0.029 ECe (dsm-1) -0.343* -0.146 -0.212 CEC (Cmol+/kg) +0.720** +0.381* +0.289
Table 12: Correlation coefficients between Ni and Pb and their bearing-minerals
Element Mineral r value Element Mineral r value Hornblende +0.351* Opaques -0.484** Pyroxenes -0.047 Amphiboles +0.375* Botite +0.648** Botite +0.117 Grnet -0.467** Fldspars (sand fraction) +0.131 Clorite +0.453** Fldspars (clay fraction) +0.172
Ni
Spiolite -0.193
Pb
* Significant at the 5% level. ** Significant at the 1% level.
Ass. Univ. Bull. Environ. Res. Vol. 14 No. 2, October 2011
-89-
2-Lead:
Table (10) reveals that the DTPA-
extractable Pb of the studied soils varies from
0.0 to 0.75 ppm. The youngest Nile terraces soils
contain a higher concentration of the extractable
Pb than the oldest ones, with a range of 0.24 to
0.75 ppm and 0.02 to 0.43 ppm, respectively.
Although most soil samples of the terrace bench
in the interference zone and the terrace rear
suture in desert fringes on both sides have levels
of the extractable Pb ranging from 0.0 to 0.38
ppm, the first three layers of profile 3 and the
surface layer of profile 9 display values between
0.58 and 0.64 ppm. Like extractable Ni,
extractable Pb concentrations show no trend of
change with depth (Figure 5). Similar results were
reported by Abdel-Mawgoud and Faragallah
(2004), Faragallah and Essa (2005) and Roshdy
(2009).
The correlation coefficients in Table (11)
clearly indicate positive significant correlations
between the DTPA-extractable Pb and the soil
contents of silt (r=+0.321*), clay (r=+0.362*) and
sum of silt+clay (r=+0.381*) as well as CEC
(r=+0.381*). On the other hand, negative
significant correlations were obtained between the
DTPA-extractable Pb and both sand (r=-0.381*)
and CaCO3 (r=-0.332*) contents. The data also
show low correlations between the extractable Pb
and organic matter content (r=+0.199), soil pH
(r=-0.165) and soil ECe (-0.146). Similar relations
were found by Marto-Anez and Motto (2000) and
Roshdy (2009).
Lead occurs in feldspars, biotite,
amphiboles, quartz and magnetite (Wedepohl,
1974). Accordingly, correlation coefficients were
calculated between these minerals and the DTPA-
extractable Pb (Table 12) to verify the source of
lead in the investigated soil. The obtained results
reveal a significant positive correlation between
the extractable Pb and amphiboles (r=+0.375*)
as well as low positive correlations with biotite
(r=+0.117), feldspars of the sand fraction
(r=+0.131) and feldspars of the clay fraction
(r=+0.172), suggesting these minerals are
considered a source of the extractable Pb in the
studied soils. A highly significant negative
correlation between the extractable Pb and
opaques (r=-0.484**) was observed (Table 12).
3-Cadmium:
Compared to the above mentioned heavy
metals, the DTPA-extractable Cd concentration
is very much lower in all studied soils and
ranges from 0.0 to 0.05 ppm (Table 10). The
youngest and oldest Nile terrace soils contain
similar amounts of the extractable Cd with a
range of 0.0 to 0.03 ppm. Most soil samples of the
terrace bench in the interference zone and
the terrace rear suture in desert fringes on both
sides do not have extractable Cd. Like
extractable Ni and Pb, the distribution of Cd in
all location under study with depth is
unsystematic (Figure 5).
Table (11) shows that, in all cases, the
correlation values between the concentration of
the DTPA-extractable Cd and the considered
soil properties are low and insignificant. The
correlation coefficient values are positive with
soil contents of silt, clay, silt + clay, organic

Ass. Univ. Bull. Environ. Res. Vol. 14 No. 2, October 2011
-90-
matter, pH and CEC. However, they are
negative with soil contents of sand, CaCO3 and
ECe. Most of these findings coincide with those
obtained by Ghallab and Usman (2007) and
Roshdy (2009).
Cadmium occurs in salirite mineral which is
extremely rare in soils. Therefore very much
lower of cadmium amounts that is detected in
the studied Nile terraces due to anthropogenic
contamination. This finding is in full agreement
with those found by Zhou et al. (2004), Jjemba
(2005) and Jinling et al (2009).

Ass. Univ. Bull. Environ. Res. Vol. 14 No. 2, October 2011
-91-

Ass. Univ. Bull. Environ. Res. Vol. 14 No. 2, October 2011
-92-

Ass. Univ. Bull. Environ. Res. Vol. 14 No. 2, October 2011
-93-
REFERENCES:
Abdellah, K. (1984): The status of certain
micronutrients in soil representative soils
of Upper Egypt. M.S. Thesis, Faculty of
Agric., Assiut Univ., Egypt.
Abdel-Mawgoud, A.S.A. and M.A. Faragallah
(2004): Characterization of Some Nile
Alluvial Soils at Assiut, Egypt. J. Agric.
Sci. Mansoura Univ., 29 (9): 5335-5345.
Abd El-Razek, M., M.F. Ghoneim, G.S. El-
Gharably and K. Abdellah (1984):
Micronutrient status in soils of Upper
Egypt: 4- Manganese. Assiut J. Agric. Sci.
15: 51-62.
Abou El-Roos, S.A. (1972): Status of some
macronutrient elements in Egyptian soils.
Ph.D. Thesis, College of Agric., Cairo
Univ., Egypt.
Amer, A.H., F.E. Abu-Agwa, and A.S. Awaga
(1991): Distribution of nutrients and their
relations to some properties of selected
Egyptian soils. Minufiya J. Agric. Res. 16:
1015-1027.
Attia, K.K. (1988): Studies on certain
micronutrients in the soils of Aswan and
El-Minia governorates. M.Sc. Thesis,
College of Agric., Assiut Univ., Egypt.
Awadalla, A.A. (1993): Mineralogical and
physical properties of some soils at El-
Fayoum governorate and their relation to
soil fertility. M.Sc. Thesis, Faculty of
Agric., Cairo Univ., Egypt.
Brewer, R. (1964): Fabric and Mineral Analysis
of Soils. John Willey & Sons Inc, New
York, London, Sydney.
Chakrapani, G. J. (2005): Factors controlling
variations in river sediment loads.
Current Sci., 88 (4): 569-575.
Cooke, G.W. (1967): The control of soil fertility.
Crosby Lockwood, London.
Dekov, V.M., Z. Komyb, F. Arahjo’, A. Van
Putd and R. Van Griekend (1997):
Chemical composition of sediments,
suspended matter, river water and
ground water of the Nile (Aswan-Sohag
traverse). The Science of the Total
Environment 201: 195-210.
Dress, L.R. and L.P. Wilding (1978): Elemental
distribution in the light mineral isolate of
soil seperates. Soil Sci. Am. J. 42: 976-978.
Duane, M. and C. R. Robert (1989): X-ray
diffraction and the identification and
analysis of clay minerals. Oxford Univ.
Press, Inc. Madison Avenue, New York,
USA.
Eden, D.N. and R.L. Parfitt (1992): Amounts and
sources of phosphate in hill country rocks,
south-eastern North Island, New Zealand.
Australian J. Soil Res. 30: 357-370.
El-Desoky, M.A. and A. Ghallab (2000):
Pollution impact on soil and plants in an
industrial area near Assiut city. Ass.
Univ. Environ. Res. 3 (1): 1-19.
El-Hadedy, E.M. (1976): Effect of irrigation on
fertility level of Upper Egypt Soils after the
construction of the High Dam. M.Sc.
Thesis, Faculty of Agric., Assiut Univ.,
Egypt.
El-Shazly, M.M., E.A.A. Hamid, A.A. Moussa
and M.A. Metwally (1991): Iron and
manganese status in some Torrerts and

Ass. Univ. Bull. Environ. Res. Vol. 14 No. 2, October 2011
-94-
Fluvents, Egypt. Egyptian J. Soil Sci. 31:
115-130.
Faghami, A., S.O. Ajayi and E.A. Ali (1985):
Nutrient distribution in the basement
complex south western Nigeria: 1-
Macronutrients - calcium, magnesium and
potassium. Soil Sci. 139: 431-438.
Farragallah, M. A. (1995): Relative distribution
of certain nutrients in soils of the Nile
valley-desert interference zone east of
Assiut city. M.Sc. Thesis, College of
Agric. Assiut Univ., Egypt.
Faragallah, M.A. and M.A. Essa. (2005):
Physical, chemical and macro-
micromorphological characteristics of
some alluvial soils irrigated with different
water resources. Assiut, Univ. Bull.
Environ. Res. 8(1): 51-65.
Ghallab, A. (2002): Pollution status of soils and
plants around the factory of ferrosilicon
alloys, Edfo, Aswan. Ass. Univ. Environ.
Res. 5 (1): 33-54.
Ghallab, A. and A. R. Usman (2007): Effect of
sodium chloride-induced salinity on
phyto-availability and speciation of Cd in
soil solution. Water air soil Pollut, 185:
43-51.
Ghoneim, M.F., M. Abd El-Razek, G.S. El-
Gharably and K. Abdellah (1984):
Micronutrients status in soil of upper
Egypt:1- Zinc. Assiut J. Agric. Sci. 15:15-
26.
Gladilovich, B.R. and Zh.V. Sergeeva (1971):
Effect of mineralogical composition on
the level of trace elements in some soil-
forming rock of the Leningrad district.
Zapiski Leningrado Shogosel
Skokhozaistvennogo Instuta 160: 10-15.
(C.F. Soils and Fert. 35:645).
Gomah, H. H., M. AbdElRazek, M. A. El-
Desoky and A. A. Amin (2007): Status of
iron and forms in soils of Assiut. J. Agric.
Sci. Mansoura Univ., 32 (5): 4107-4119.
Jackson, M. L. (1973): Soil Chemical Analysis.
Prentice Hall Inc., New Delhi.
Jakovljevic, M. D., N. M. Kostic, D. Stevanovic ,
S. Blagojevic, M. J. Wilson and Lj.
Martinovic. (1997): Factors influencing
the distribution of heavy metals in the
alluvial soils of the Velika Morava River
valley, Serbia. Applied Geochemistry. 12:
637-642.
Jinling, L., H. Ming, H. Wei and G. Yifan
(2009): Analysis and assessment on heavy
metal sources in the coastal soils
developed from alluvial deposits using
multivariate statistical methods. J.
Hazardous Materials 164: 976–981
Jjemba, P.K. (2004): Environmental
microbiology: Principles and
Applications. Science Publishers, Inc.,
Enfield New Hampshire, USA.
Jjemba, P. K. (2005): Bioavailability of metals
and metalloids in terrestrial
environments p 25-41. In Ahmed, I., S.
Hayat and J. Pichtel (eds) Heavy metal
contamination of soil. Problems and
remedies. Sci. Pub., Inc., Enfield, NH,
USA.
Kabata-Pendias, A. and H. Pendias (1984): Trace
elements in soils and plants. CRC Press,
Inc., Boca, Florida, USA.

Ass. Univ. Bull. Environ. Res. Vol. 14 No. 2, October 2011
-95-
Khalifa, E.M., M. A. El-Desoky, M. A. Gameh
and M. A. Faragallah (1996): Status of
some micronutrients and their relations to
mineral composition of the Nile valley-
desert interference zone east of Assiut
city. Assiut J. Agric. Sci. 27(3):107-127.
Khalil, I.K., M. M. Gundy, A.S. Metwally and
M.M. Fahim (1990): Manganese status in
some soils of Sinai. Zagazig J. Agric. Res.
17: 31-40.
Khetawat, G.K. and K.S. Vashishtha (1977):
Distribution of micronutrients and their
relationship with some soil properties in
the vineyards of Rajathan. J. Indian Soc.
Soil Sci. 25: 81-83.
Li, X. and I. Thornton (2001): Chemical
partitioning of trace and major elements in
soils contaminated by mining and smelting
activities. Appl. Geochem. 16: 1693–1706.
Lindsay, W.L. and W.A. Norvell. (1978):
Development of DTPA soil test for zinc,
iron, manganese and copper. Soil Sci. Soc.
Am. J. 42: 421-428.
Marto-Anez, C. E. and H. L. Motto (2000):.
Solubility of lead, zinc and copper added
to mineral soils. Environmental Pollution
107: 153-158.
McLean, E.O. (1982): Soil pH and lime
requirement. P. 199-224 In A.L. Page,
R.H. Miller and D.R. Keeney (eds).
Methods of soil analysis, part 2. Chemical
and microbiological properties, 2nd
edition. Soil Sci. Soc. Am. Inc., Madison,
WI, USA.
Metson, A.J. (1961): Methods of chemical
analysis for soil survey samples. New
Zealand Dept. Sci., Ind. Res. Soil. Bur.
bull., 12 Govt. Printer, Wellington, Zew
Zealand. (C.F. Booker Tropical Soil
Manual by London, J.R., 1984, p. 126-
138).
Milner, H. B. (1962): Sedimentology
petrography. II& I. George Allen &
Unwin, LTD. London.
Mitchell, R.L. (1964): Trace elements in soils p.
320-368. In F.E. Bear (ed.) Chemistry of
the soils. Reinhold publishing cooperation,
New York, USA.
Mohamed, N.A. 1990. Nutrient status in some
soils as related to mineralogical
composition. M.Sc. Thesis, Faculty of
Agric., Ain Shams Univ., Egypt.
Nelson, R. E. (1982): Carbonate and gypsum. P.
181-198 In A. L. Page, R.H. Miller and D.
R. Keeney (eds). Methods of soil analysis.
Part 2, Chemical and microbiological
properties, 2nd edition. ASA and Soil Sci.
Soc. Am. Inc., Madison, WI, USA
Nriagu, J.O. and J.M. Pacyna (1988):
Quantitative assessment of worldwide
contamination of air, water and soils by
trace metals, Nature 333: 134–139.
Panuccio, M.R., A. Sorgonà, M. Rizzo and G.
Cacco (2009): Cadmium adsorption on
vermiculite, zeolite and pumice: batch
experimental studies. J. Environ. Manage
90 (1): 364–374.
Peijnenburg, W.J.G.M. and T. Jager, (2003):
Monitoring approaches to assess
bioaccessibility and bioavailability of
metals: matrix issues. Ecotoxicol.
Environ. Saf. 56 (1), 63–77.

Ass. Univ. Bull. Environ. Res. Vol. 14 No. 2, October 2011
-96-
Piper, C.S. (1950): Soil and plants analysis.
Inter. Science, Inc., New York.
Rabie, F., A. El-Araby and M. El-Shazly. 1989.
Micronutrients status as related to soil
constituents in soils of Eastern Desert,
Egypt. Egyptian J. Soil Sci. 29: 331-343.
Roshdy, N. M. K. (2009): Distribution and
forms of some heavy metals in a
contaminated soil at Assiut. Ph.D. Thesis,
Fac. of Agric., Assiut Univ., Egypt.
Sillanpaa, M. (1972): Trace elements in soils
and agriculture. FAO Soils Bull. 17,
Rome, Italy.
Schultz, L.G. (1964): Quantitative
interpretation of mineralogical
composition from X-ray and chemical
data for the Pierre shale. U.S.Geol.Surv.,
Prof. Paper, No.391-C, pp.C1-C31,
Washington.
Soltanpour, P.N. and A.R. Schwab (1977): A
new soil test for simultaneous extraction
of macro- and micro-nutrients in alkaline
soils. Comm. in Soil Sci. and Plant Anal.
8, 195
Stehouwer, R. C., A. M.Wolf and W. T. Doty
(2000): Chemical monitoring of sewage
sludge in Pennsylvania: Variability and
application uncertainty. J. Environ.
Quality 29: 1686-1695.
Tessier, A. and P. G. C. Campbell (1988):
Partitioning of trace metals in sediments.
P. 183–199. In Kramer J. R and H. E.
Allen (eds). Theory, analysis and
application. Chelsea7 Lewis Publishers.
Viets, F.G. and W.L. Lindsay (1973): Testing soil
for Zn, Cu, Mn and Fe. p. 153-172. In.
L.M. Walsh, and J.D. Beaton. Soil Testing
and Plant analysis. Soil Sci. Soc. Am. Inc.,
Madison, WI, USA.
Velde, B. (1992): Introduction to clay minerals.
Chapman & Hall, London, Glasgow, New
York, Tokyo, Melbourne, Madras.
Wedepohl, K. H. (1974): Handbook of
Geochemistry. Springer-Verlag, Berlin,
Heidelberg, New York, 839 P.
Wei, Z., B. Xi, Y. Zhao, S. Wang, H. Liu and Y.
Jiang (2007): Effect of inoculating
microbes in municipal solid waste
composting on characteristics of humic
acid. Chemosphere 68, 368–374.
White, M. L. (1957): The occurrence of zinc in
soil. Econ. Geol. 52: 645-651.
Wiklander, L. (1958): General occurrence of
plant nutrients. In Encyclopedia of plant
physiology: V. Mineral nutrition of plants.
Springer Verlage, Berlin.
Yadav, S.K., A. A. Juwarkar, G.P. Kumar, P.R.,
Thawale, S.K. Singh and T. Chakrabarti
(2009): Bioaccumulation and phyto-
translocation of arsenic, chromium and
zinc by Jatropha curcas L.: Impact of
dairy sludge and biofertilizer. Bioresour.
Technol. 100 (20): 4616–4622.
Zhou, H. Y., X. T. Penga and J.M. Panb. (2004):
Distribution, source and enrichment of
some chemical elements in sediments of
the Pearl River Estuary, China.
Continental Shelf Research 24: 1857–
1875

Ass. Univ. Bull. Environ. Res. Vol. 14 No. 2, October 2011
-97-

Ass. Univ. Bull. Environ. Res. Vol. 14 No. 2, October 2011
-98-
حالة بعض العناصر الغذائية والعناصر الثقيلة و عالقاتها بالمعادن الحاملة لها مصر- فى أراضى المدرجات النهرية بأسيوط
محمد األمين عبد الكريم فرج اهللا
.أسيوط – جامعة األزهر– كلية الزراعة– قسم علوم األراضى و المياه
وذلـك هرية الحديثة و القديمة المتكونة فى منطقة جنوب قناطر أسـيوط قطاعات تمثل أراضى المدرجات النتسعتم اختيار و )Ni ،Pb ،Cd (و بعــض العناصــر الثقيلــة )P، K، Fe ،Mn، Zn، Cu( و توزيــع بعــض العناصــر الغذائيــة ياتلدراســة مــستو
الحاملـة لهـا فـى هـذه مع المعـادن العناصرارتباط هذه، و كذلك لتقييم لهذه األراضىعالقاتها ببعض الخواص الطبيعية و الكيميائية . األراضى
أعلــى فــى أراضــى المــدرجات النهريــة القديمــة منــه فــى كــان الفوســفور الميــسرقــيمو قــد أظهــرت النتــائج المتحــصل عليهــا أن الحديثة و وقد احتوت أراضى المدرجات النهرية. المدرجات الحديثة على جانبى النيل، بينما محتوى البوتاسيوم الميسر أظهر العكس
كــل مــن توزيــع و لــم يوجــد تغيــر ثابــت فــى . يات متوســطة مــن البوتاســيوم مــستو عاليــة مــن الفوســفور و مــستوياتالقديمــة علــى تركيـزات كـل مـن الفوسـفور و ارتباطـات موجبـة معنويـة جـدًا بـينو قد ُوجـد . فى معظم القطاعاتالفوسفور و البوتاسيوم مع العمق
اً كـان االرتبـاط سـالب ، و لكـناألراضى من السلت و الطين و المادة العضوية و السعة التبادلية الكاتيونيةالبوتاسيوم مع محتوى هذه محتــوى الفوســفور ارتباطــات موجبــة معنويــة بــين وجــود كمــا اتــضح .pH الـــمــع محتــوى التربــة مــن الرمــل و كربونــات الكالــسيوم ومعـادن و البوتاسـيومكما يوجد ارتباط موجب عـالي بـين. باتيت و المونازيتالميسر مع كميات معدن المونازيت و مجموع معدنى األ
.هذه األراضىل الفلسبار التى فى حجم الطينأوضـحت النتــائج أيـضا أن المــستويات األعلـى مــن الحديـد الميــسر كانــت فـى أراضــى المـدرجات النهريــة القديمـة، بينمــا محتــوى
الميسر كان أعلى فى أراضى المدرجات الحديثة، و لم ُيظهر عنصر النحاس تغيرات كبيرة بين أراضـى المـدرجات القديمـة و المنجنيز كافية من الحديد و المنجنيز و النحـاس، بينمـا أظهـرت كـل األراضـى مستوياتو احتوت أراضى كل المدرجات النهرية على . الحديثةارتباطات موجبة عالية بين الحديد و المنجنيز و النحاس مع النـسبة المئويـة للحبيبـات الناعمـة كما ظهرت. فى الزنك الميسراً نقص
، و أخرى سالبة مع محتوى التربة من الرمل و كربونـات خاصة الطين و نسبة المادة العضوية و السعة التبادلية الكاتيونية لألراضىكمــا توجــد ارتباطــات .ةدروســبــين عنــصر الزنــك و أى مــن خــواص التربــة الم، بينمــا ال توجــد ارتباطــات معنويــة pH الـــالكالــسيوم و
مـن قليلة الثبـات مثـل االبيـدوت و البيوتيـت و الفلـسبار المعادن الحاملة لهاو من جهةالحديد و النحاسكل من موجبة عالية بين بـينارتباطـات موجبـة منخفـضة وجـد بينمـا ت. ت و الـسمكتيت و الكلوريـاالبيدوت و الهورنبلند دناالمنجنيز و مع و بين ،جهة أخرى
. و البيروكسنالهورنبلندو كل من عنصر الزنكلمـدرجات بّينت النتائج أن مستوى عنصرى النيكل و الرصاص كان أعلى قليًال فـى أراضـى المـدرجات النهريـة القديمـة منـه فـى ا
كـل مـنفـىو مـنخفض جـدًا مستوى عنصر الكادميوم متشابه ان كعمق ، بينماالو بدون تغير واضح مع الحديثة على جانبى النيل مـع النـسبة المئويـة ى عالى بين كمية النيكل المستخلص و قد وجد ارتباط موجب معنو . القديمةأراضى المدرجات النهرية الحديثة و
موجـب معنـوى بـين كميـة الرصـاص ارتبـاطظهـرو . للسلت و الطين و نسبة المادة العضوية و السعة التبادليـة الكاتيونيـة لألراضـىين و السعة التبادلية الكاتيونية، و آخر سالب مع محتوى التربـة مـن الرمـل و كربونـات المستخلص مع النسبة المئوية للسلت و الط
معـدن الهورنبلنـدو نيكـلعنـصرى الرصـاص و الكـل مـن بدرجـة منخفـضة بـين وقد أتضح وجود ارتباطات موجبة معنوية. الكالسيوم . و الكلوريت البيوتيتىمعدنكل من و ارتباط موجب عالى بين عنصر النيكل ينماب
Recommended