+
Agriculture Risk Management TeamAgricultural and Rural DevelopmentThe World Bank
January 10-14 2011
Mombasa, Kenya
Module 3: Selecting Weather Data
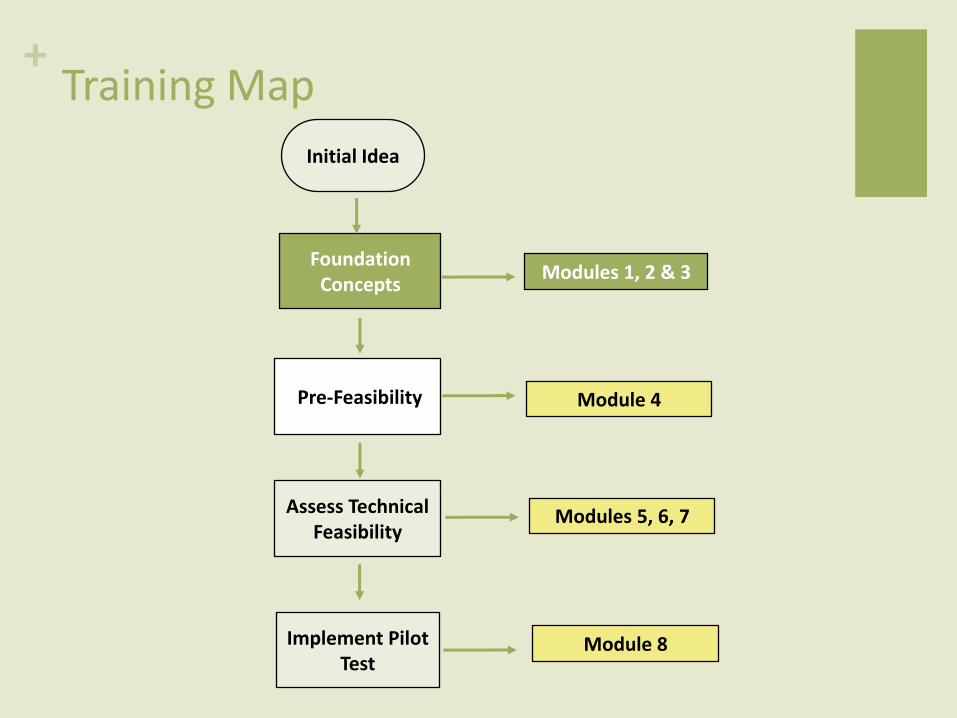
+Training Map
Foundation Concepts
Assess Technical Feasibility
Pre-Feasibility
Initial Idea
Implement Pilot Test
Modules 1, 2 & 3
Module 4
Modules 5, 6, 7
Module 8
+
Agriculture Risk Management TeamAgricultural and Rural DevelopmentThe World Bank
January 10-14 2011
Mombasa, Kenya
Module 3 Book A: Weather,
Weather Observing System and Data
+Module 3 – Selecting Weather Data
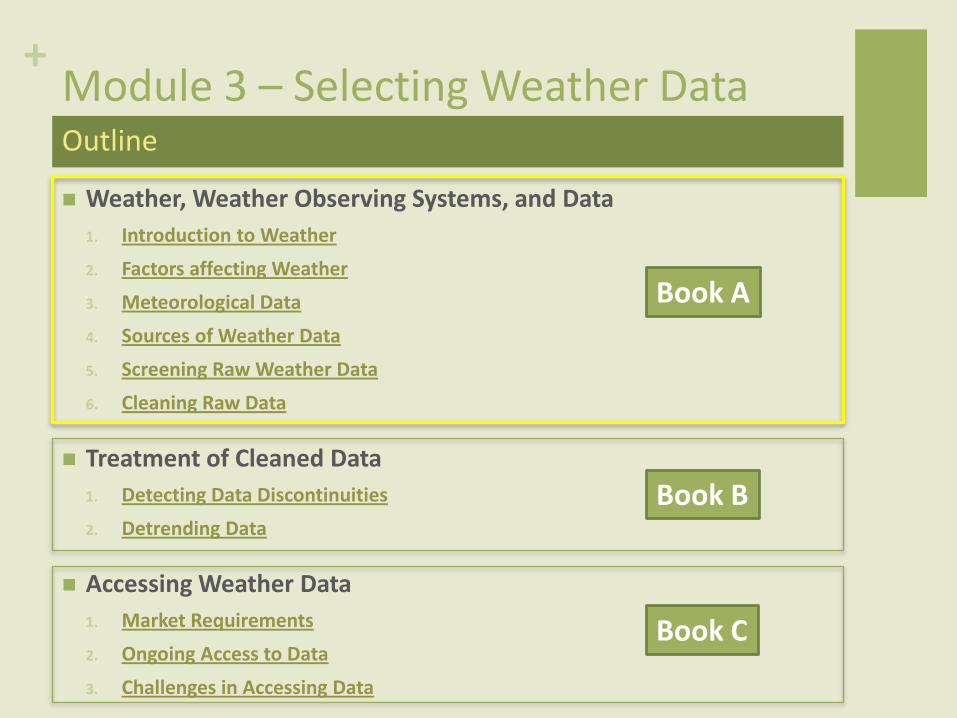
Weather, Weather Observing Systems, and Data
1. Introduction to Weather
2. Factors affecting Weather
3. Meteorological Data
4. Sources of Weather Data
5. Screening Raw Weather Data
6. Cleaning Raw Data
Treatment of Cleaned Data
1. Detecting Data Discontinuities
2. Detrending Data
Accessing Weather Data
1. Market Requirements
2. Ongoing Access to Data
3. Challenges in Accessing Data
Outline
Book A
Book B
Book C
+
Introduction to Weather
+Introduction to Weather
Weather perils represent an important source of risk for farmers and, more broadly, for agricultural production systems
Weather can impinge on agricultural activities directly and indirectly
Directly
Causing direct physical damages to crops (e.g., wind, severe flooding)
Influencing key crop growth-driver variables, such as soil moisture and temperature.
Indirectly
Favoring plant pests and diseases (e.g. at high soil temp. and humidity)
Affecting product quality (e.g. low temperature at grain filling)
Commodity transportation and, therefore, commodity prices.
+Introduction to Weather
The distribution of agricultural systems on the globe is largely a function of climate (i.e., the long-term average meteorological conditions that favor one kind of farming system over another). Agriculture (including the choice of crop varieties) is adapted to climate.
At the same time farming at a given location is subject to the impact of year-to-year (inter-annual) variability in climate: the outcome of agriculture at a given site is affected by weather.
Climate variability can occur at different temporal and spatial scales
Short-term variability in rainfall onset may impact planting
Long-term protracted episodes of drought may impact the general water balance in a region (e.g. water for irrigation systems)
Climate and Weather
+Introduction to Weather
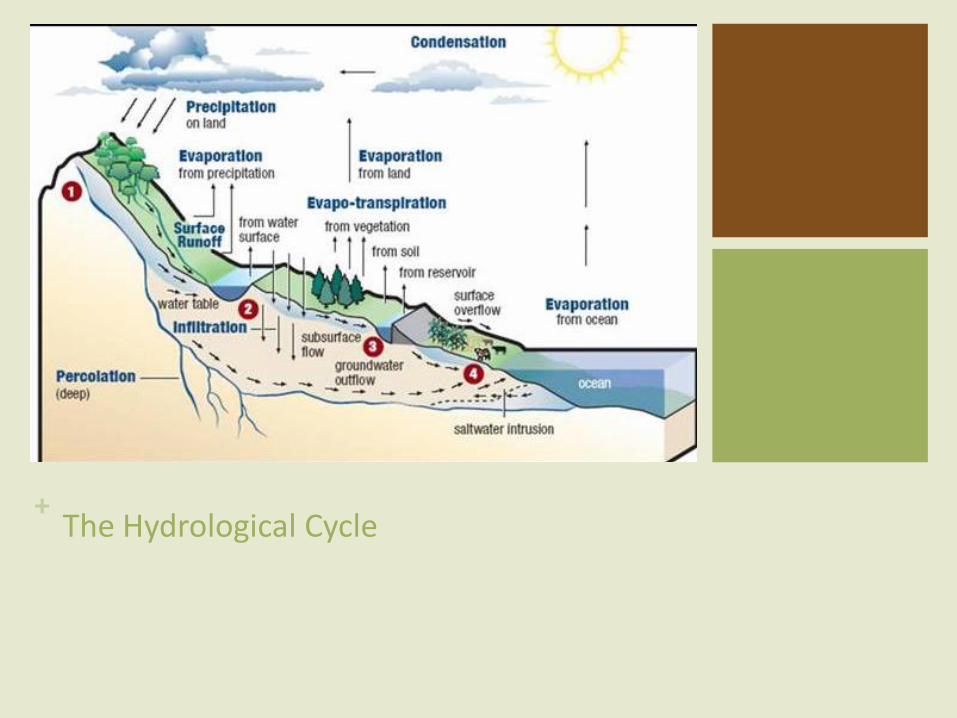
A key aspect of the climate system when considering its impact on agriculture is the hydrological cycle
The Hydrological Cycle includes all processes of interaction and exchange of water between the atmosphere, surface and sub-surface layers of the soil, natural and man made reservoirs that include dams as well as glacier and ice-caps:
evaporation;
evapo-transpiration;
condensation;
precipitation;
runoff;
infiltration;
The Hydrological Cycle
+ The Hydrological Cycle
+
Factors Affecting Weather
+Factors Affecting Weather
The distribution and availability of water is heavily modulated by the characteristics of the land surface, including the management of agricultural systems.
Year-to-year fluctuations in seasonal climate are largely linked to perturbations in atmospheric circulation that govern the seasonal distribution of precipitation and temperature.
The primary mechanisms that determine seasonal climate variability in the tropics and sub-tropics are:
Perturbations in the Inter-Tropical Convergence Zone
Perturbations linked to changes in sea surface temperatures
Land-atmosphere interactions
+Factors Affecting Weather
The dominant pattern of seasonal atmospheric circulation is characterized by :
ascending air in tropical latitudes ;
poleward flux in high altitudes;
descending air in the subtropics.
An area of wind convergence is created in the tropics: the Inter-Tropical Convergence Zone (ITCZ)
The Inter-Tropical Convergence Zone
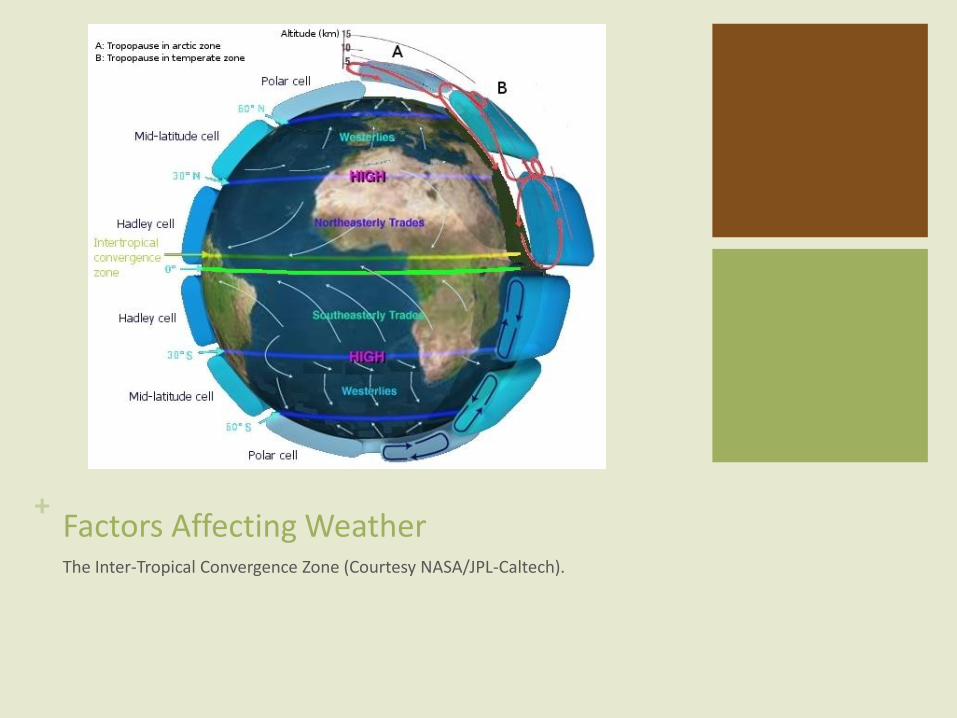
+ Factors Affecting WeatherThe Inter-Tropical Convergence Zone (Courtesy NASA/JPL-Caltech).
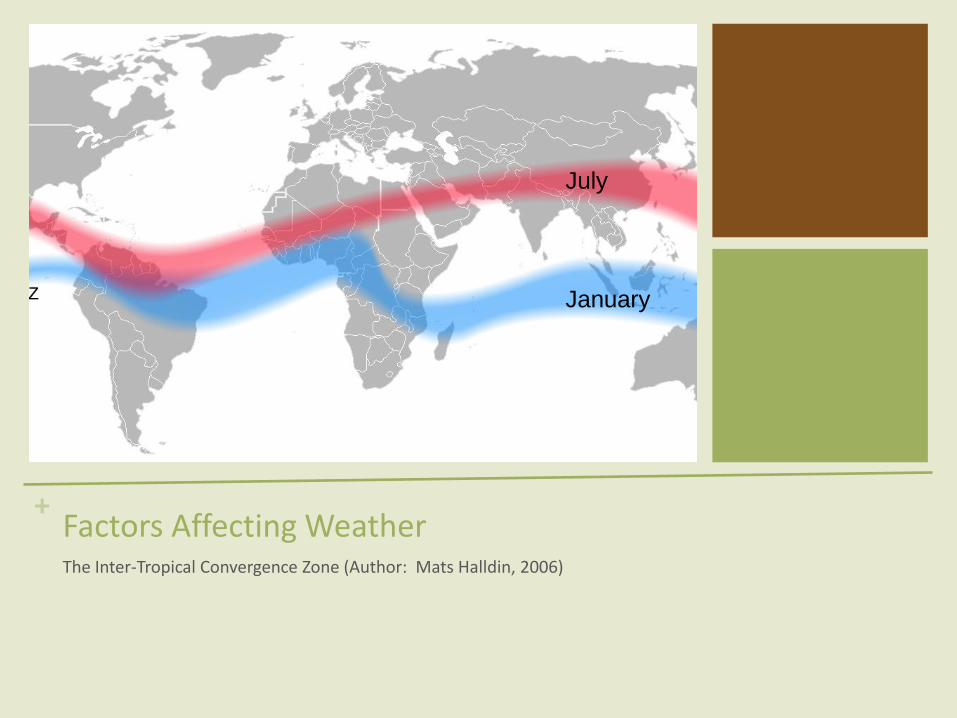
+ Factors Affecting WeatherThe Inter-Tropical Convergence Zone (Author: Mats Halldin, 2006)
July
January
+Factors Affecting Weather
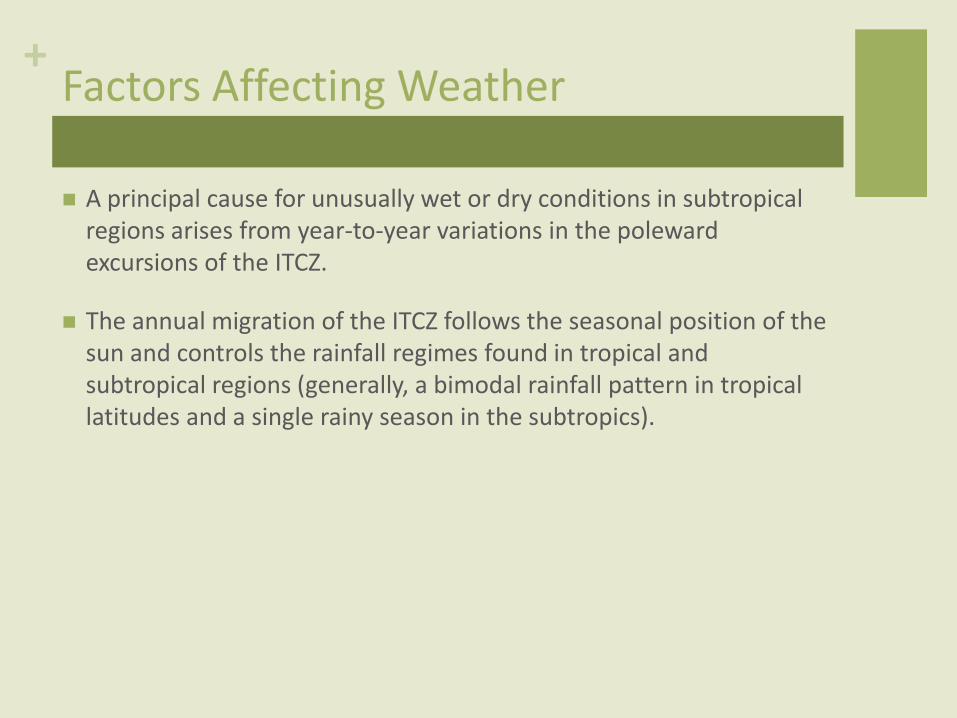
A principal cause for unusually wet or dry conditions in subtropical regions arises from year-to-year variations in the poleward excursions of the ITCZ.
The annual migration of the ITCZ follows the seasonal position of the sun and controls the rainfall regimes found in tropical and subtropical regions (generally, a bimodal rainfall pattern in tropical latitudes and a single rainy season in the subtropics).
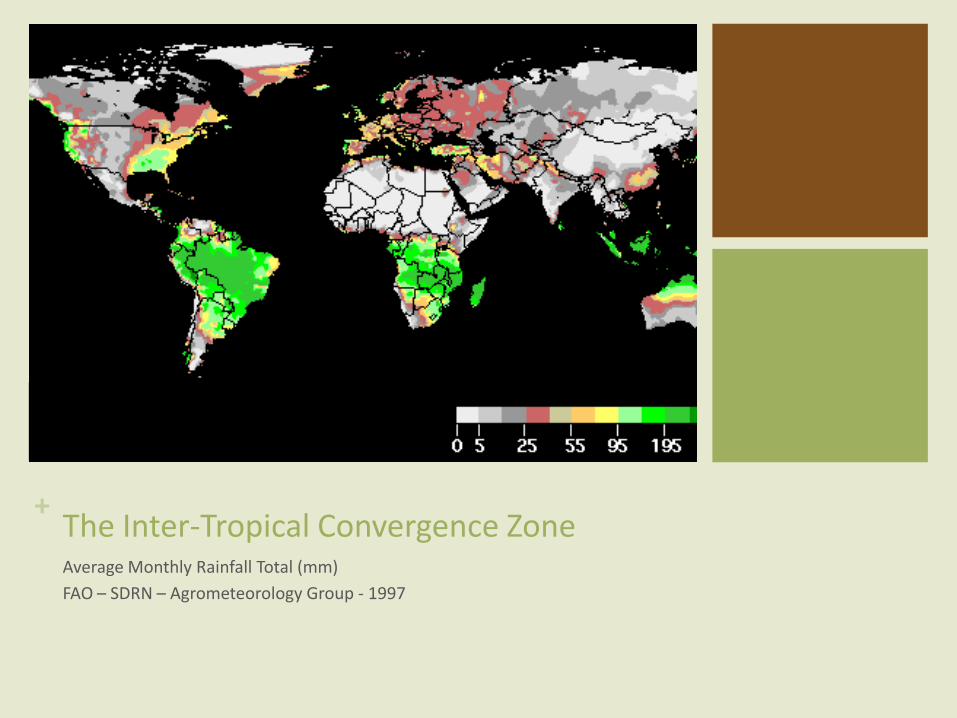
+ The Inter-Tropical Convergence ZoneAverage Monthly Rainfall Total (mm)
FAO – SDRN – Agrometeorology Group - 1997
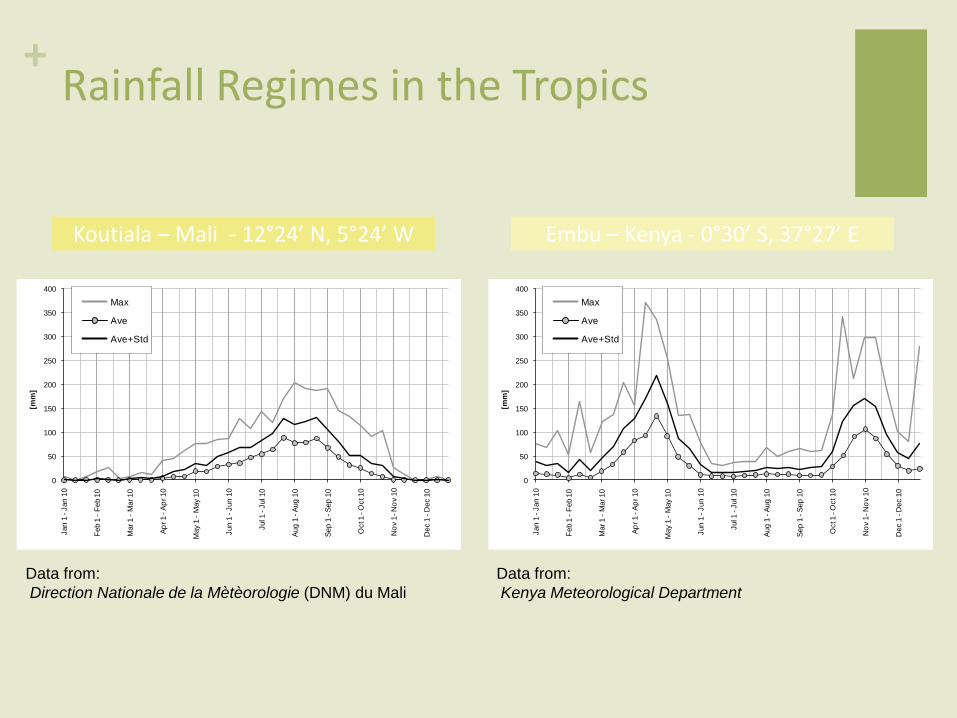
+Rainfall Regimes in the Tropics
Koutiala – Mali - 12°24’ N, 5°24’ W Embu – Kenya - 0°30’ S, 37°27’ E
0
50
100
150
200
250
300
350
400
Jan
1 -
Jan
10
Feb 1
-F
eb 1
0
Mar 1 -
Mar 10
Ap
r 1 -
Ap
r 10
May 1
-M
ay 1
0
Jun
1 -
Jun
10
Jul 1
-Jul 1
0
Aug
1 -
Aug
10
Sep
1 -
Sep
10
Oct 1
-O
ct 1
0
No
v 1
-N
ov 1
0
Dec 1
-D
ec 1
0
[mm
]
Embu - 9037202
Max
Ave
Ave+Std
0
50
100
150
200
250
300
350
400
Jan
1 -
Jan
10
Feb 1
-F
eb 1
0
Mar 1 -
Mar 10
Ap
r 1 -
Ap
r 10
May 1
-M
ay 1
0
Jun
1 -
Jun
10
Jul 1
-Jul 1
0
Aug
1 -
Aug
10
Sep
1 -
Sep
10
Oct 1
-O
ct 1
0
No
v 1
-N
ov 1
0
Dec 1
-D
ec 1
0
[mm
]
Koutiala - 270144
Max
Ave
Ave+Std
Data from:
Direction Nationale de la Mètèorologie (DNM) du Mali
Data from:
Kenya Meteorological Department
0
50
100
150
200
250
300
350
400
Jan
1 -
Jan
10
Feb 1
-F
eb 1
0
Mar 1 -
Mar 10
Ap
r 1 -
Ap
r 10
May 1
-M
ay 1
0
Jun
1 -
Jun
10
Jul 1
-Jul 1
0
Aug
1 -
Aug
10
Sep
1 -
Sep
10
Oct 1
-O
ct 1
0
No
v 1
-N
ov 1
0
Dec 1
-D
ec 1
0
[mm
]
Embu - 9037202
Max
Ave
Ave+Std
0
50
100
150
200
250
300
350
400
Jan
1 -
Jan
10
Feb 1
-F
eb 1
0
Mar 1 -
Mar 10
Ap
r 1 -
Ap
r 10
May 1
-M
ay 1
0
Jun
1 -
Jun
10
Jul 1
-Jul 1
0
Aug
1 -
Aug
10
Sep
1 -
Sep
10
Oct 1
-O
ct 1
0
No
v 1
-N
ov 1
0
Dec 1
-D
ec 1
0
[mm
]
Embu - 9037202
Max
Ave
Ave+Std
+Factors Affecting Weather
Circulation patterns, such as the ITCZ and the associated monsoons, are strongly influenced by
variation in sea surface temperatures in adjacent ocean basins (e.g., Atlantic and Indian Ocean for Africa)
remote connections with ocean circulation in more distant basins (so-called tele-connections).
Changes in ocean temperatures induce changes in atmosphericcirculation that can alter the seasonal distribution of precipitationand temperature in nearby and distant regions.
Ocean Circulation
+Factors Affecting Weather
In Africa, the Atlantic Ocean plays an important role in influencing rainfall in West Africa and the Sahel.
Circulation anomalies associated with the El Niño Southern Oscillation (ENSO) in the tropical Pacific Ocean have a measurable influence on regions in East Africa, the Horn of Africa, and southern Africa.
Deviations of rainfall and temperature associated with ENSO generally exhibit an opposing pattern across these two regions (i.e., dry spells in East Africa tend to go with wet spells in Southern Africa and vice versa). Similar inter-annual patterns of climate variability associated with ENSO are observed in other parts of the world.
Ocean Circulation Examples
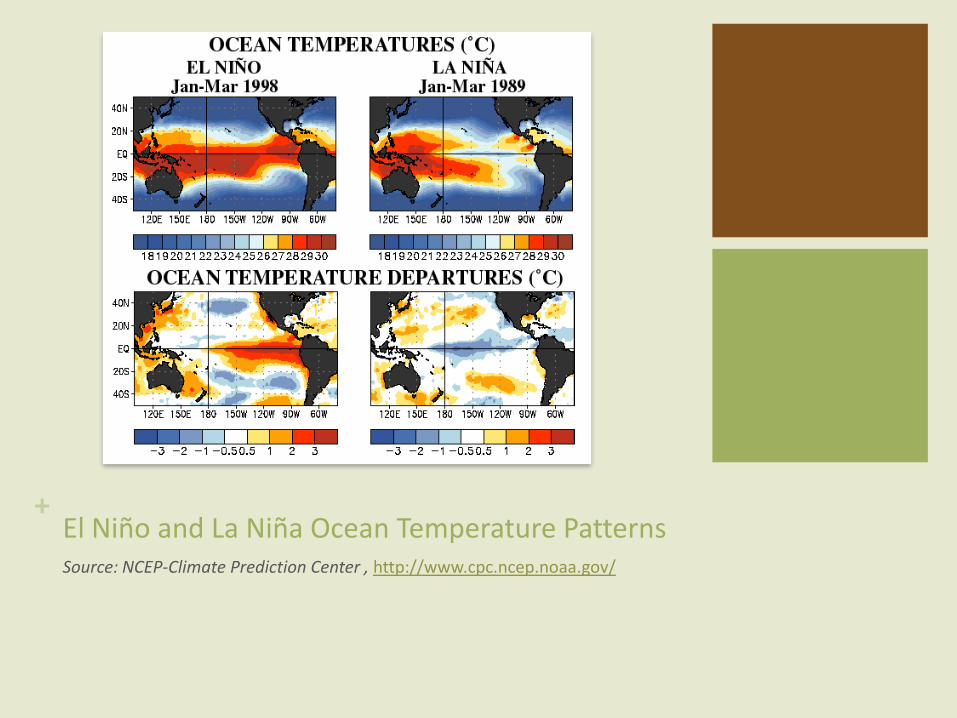
+ El Niño and La Niña Ocean Temperature PatternsSource: NCEP-Climate Prediction Center , http://www.cpc.ncep.noaa.gov/
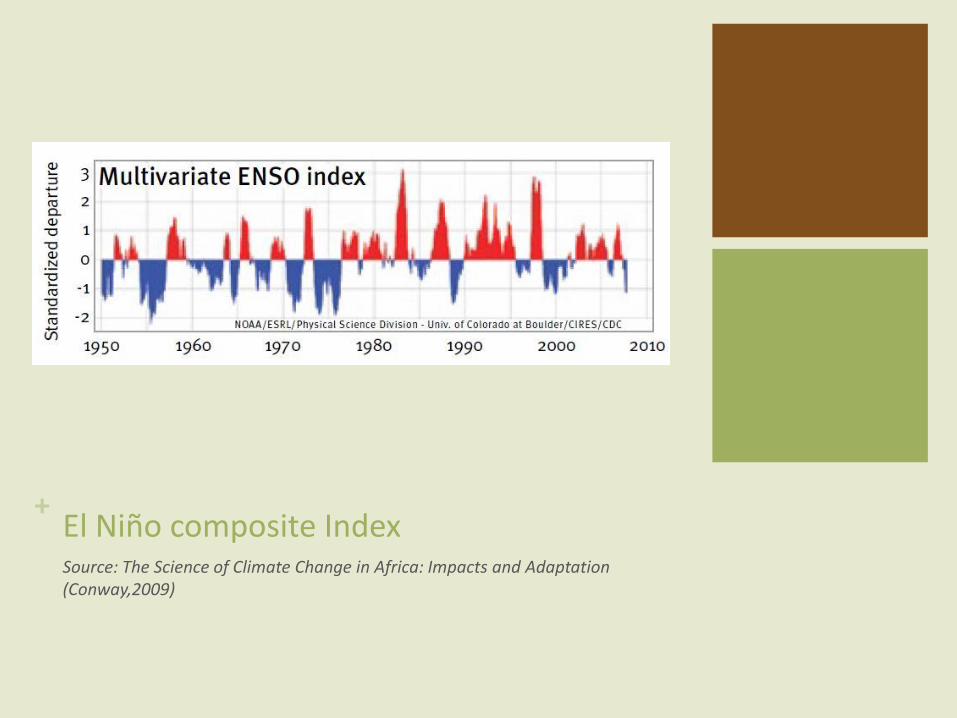
+ El Niño composite IndexSource: The Science of Climate Change in Africa: Impacts and Adaptation (Conway,2009)
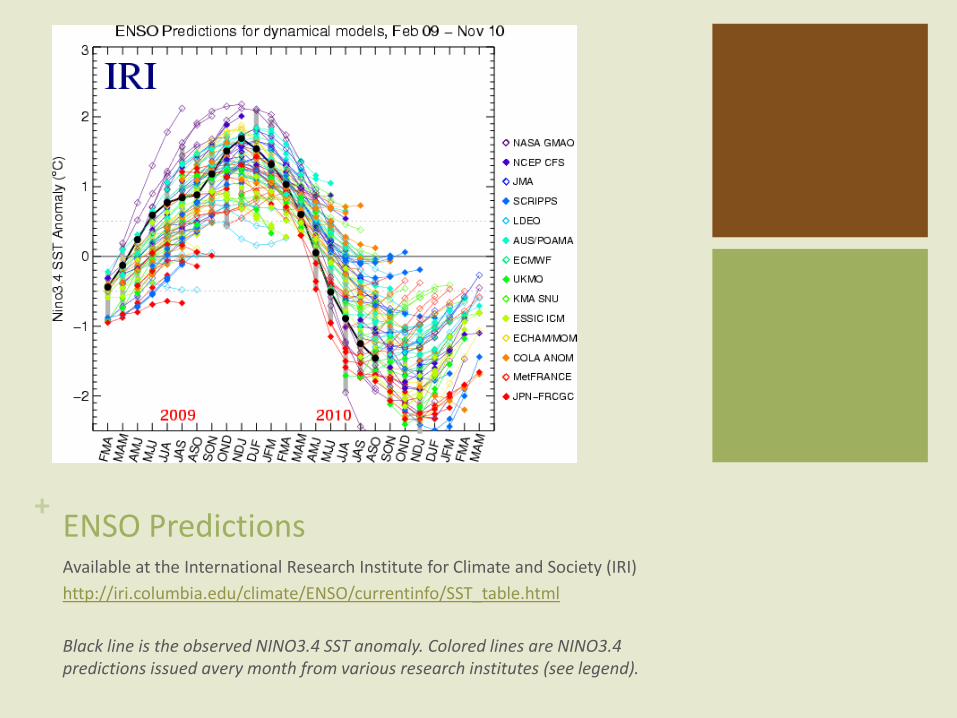
+ ENSO PredictionsAvailable at the International Research Institute for Climate and Society (IRI)
http://iri.columbia.edu/climate/ENSO/currentinfo/SST_table.html
Black line is the observed NINO3.4 SST anomaly. Colored lines are NINO3.4 predictions issued avery month from various research institutes (see legend).
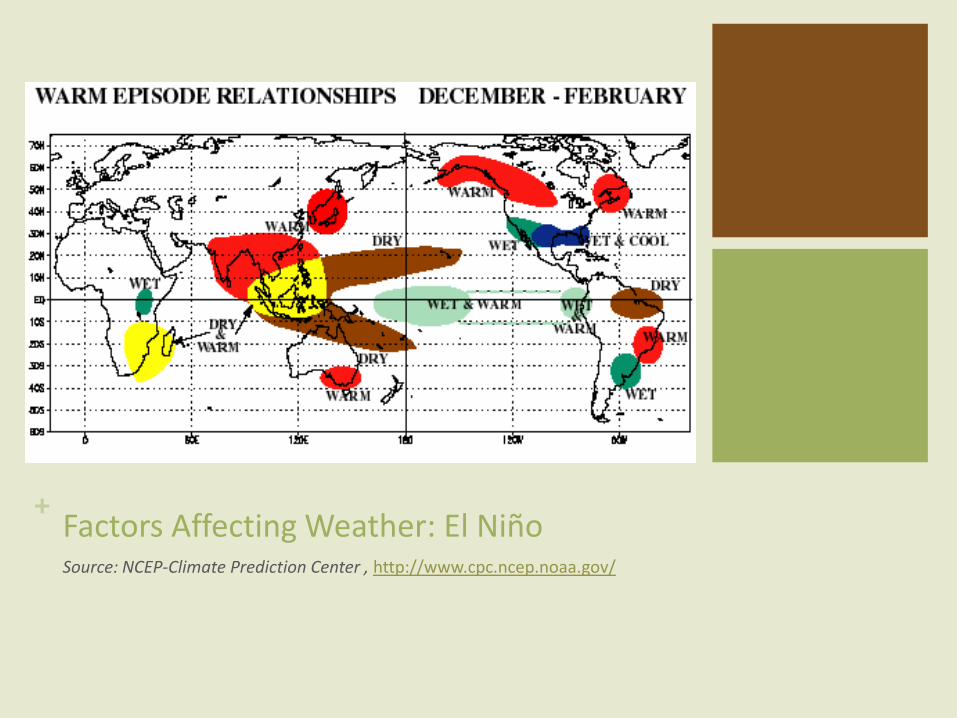
+ Factors Affecting Weather: El NiñoSource: NCEP-Climate Prediction Center , http://www.cpc.ncep.noaa.gov/
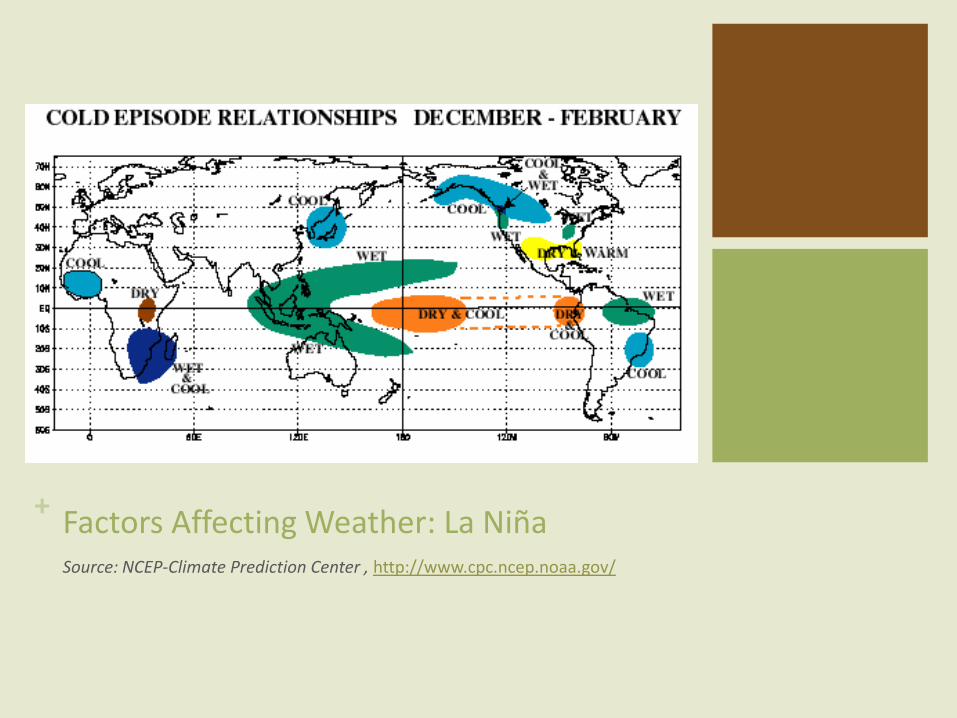
+ Factors Affecting Weather: La NiñaSource: NCEP-Climate Prediction Center , http://www.cpc.ncep.noaa.gov/
+Factors Affecting Weather
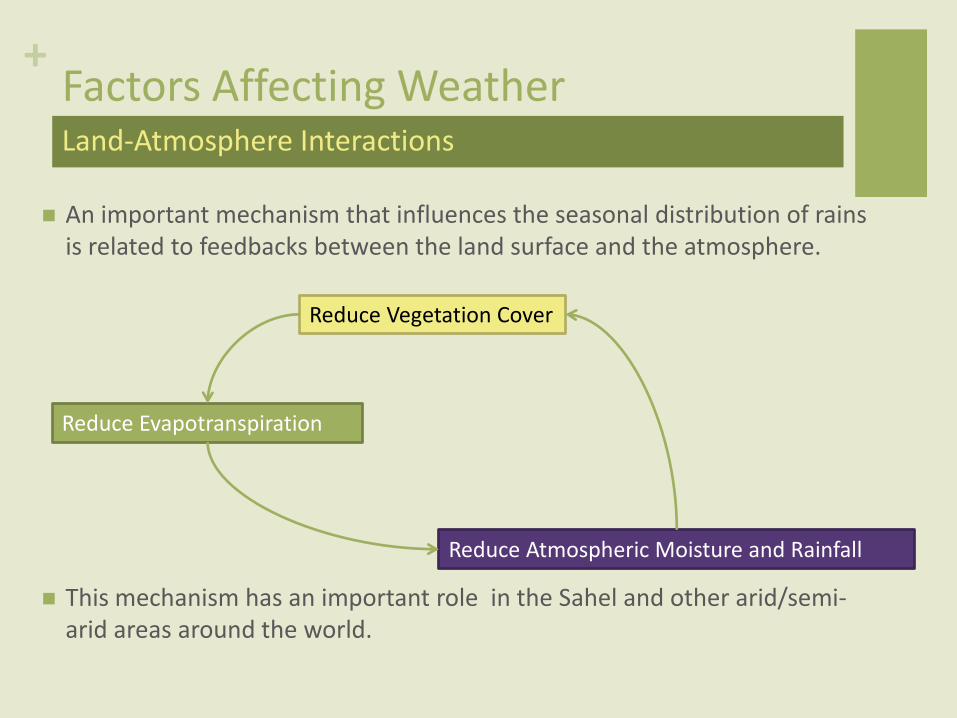
An important mechanism that influences the seasonal distribution of rains is related to feedbacks between the land surface and the atmosphere.
This mechanism has an important role in the Sahel and other arid/semi-arid areas around the world.
Land-Atmosphere Interactions
Reduce Vegetation Cover
Reduce Evapotranspiration
Reduce Atmospheric Moisture and Rainfall
+Factors Affecting WeatherMonsoonal Systems
The change of direction of monsoonal winds affecting East Africa
(as well as West Africa) is the second strong seasonal change
linked to tropical convection.
Monsoonal winds are generated by the higher pace of
temperature change over the Indian sub-continent. The winds
directions result from the interaction of surface temperature
gradients fluctuations and Inter-tropical Convergence Zone
North/South migration.
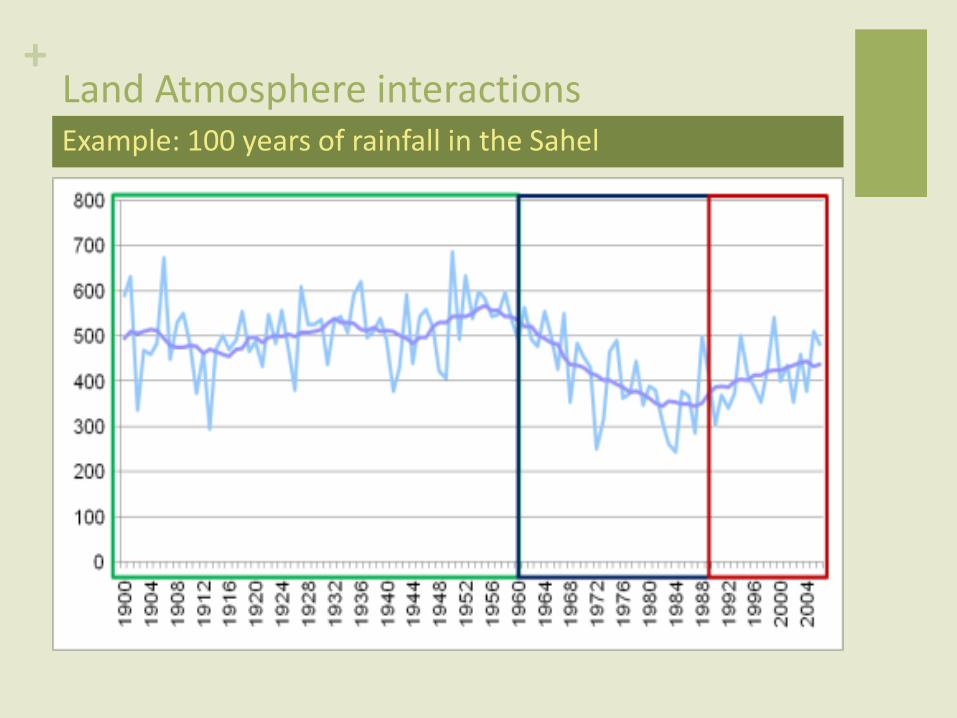
+Land Atmosphere interactionsExample: 100 years of rainfall in the Sahel
+Climate Change in AfricaKnown Unknowns and Unknown Unknowns
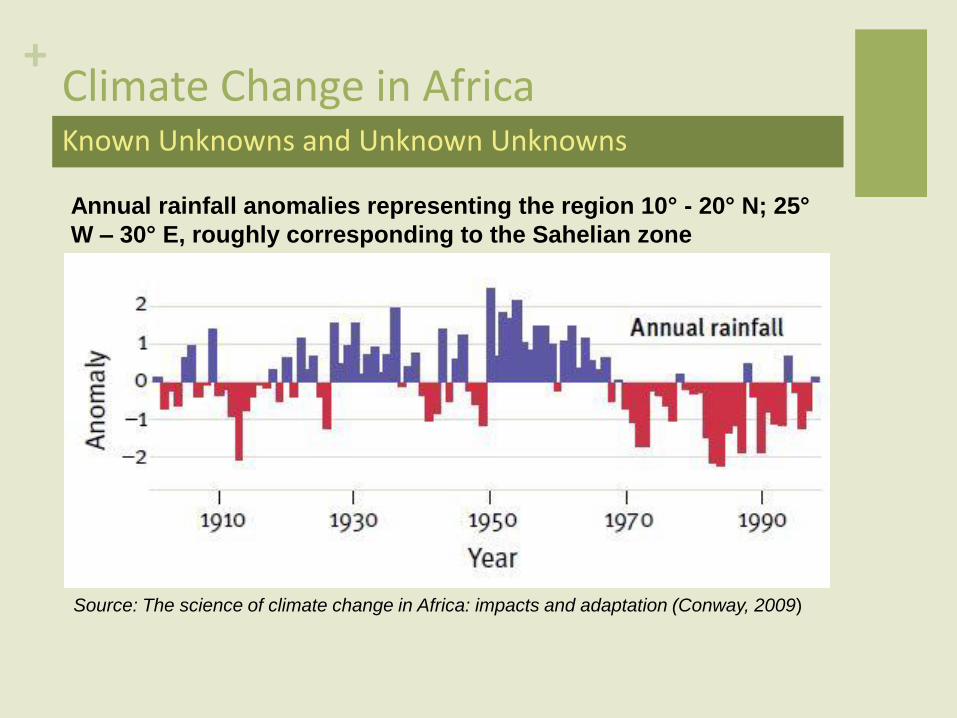
Annual rainfall anomalies representing the region 10° - 20° N; 25°
W – 30° E, roughly corresponding to the Sahelian zone
Source: The science of climate change in Africa: impacts and adaptation (Conway, 2009)
+Climate Change in AfricaKnown Unknowns and Unknown Unknowns
+
Meteorological Data
+Meteorological Data
An appropriate premium for a weather risk management product is based on the probability and severity of specific events.
Weather parameters commonly observed at weather stations need to be transformed to produce meaningful indicators for crop growth.
Examples:
Temperature requirements are frequently expressed in Growing Degree Days (GDD), which is a cumulative measure capturing the days permitting plant growth.
Precipitation indices can approximate soil moisture conditions and, therefore, capture whether or not the crop’s water requirements have been satisfied.
+Historical Data
Historical meteorological observations are needed to capture a region’s climate (seasonal climate variability and longer-term climate cycles).
Ideally, a long, clean, and internally consistent historical record of at least 25–30 years of daily data with less than 3–5 percent missing would be available for developing an index-based weather insurance program.
In many cases, this length of historical data is not available. Other options exist for historical data, such as rainfall estimations and satellite information, but, in most cases, these options are less ideal (for example satellite data may have shorter time series).
+Quality of Data
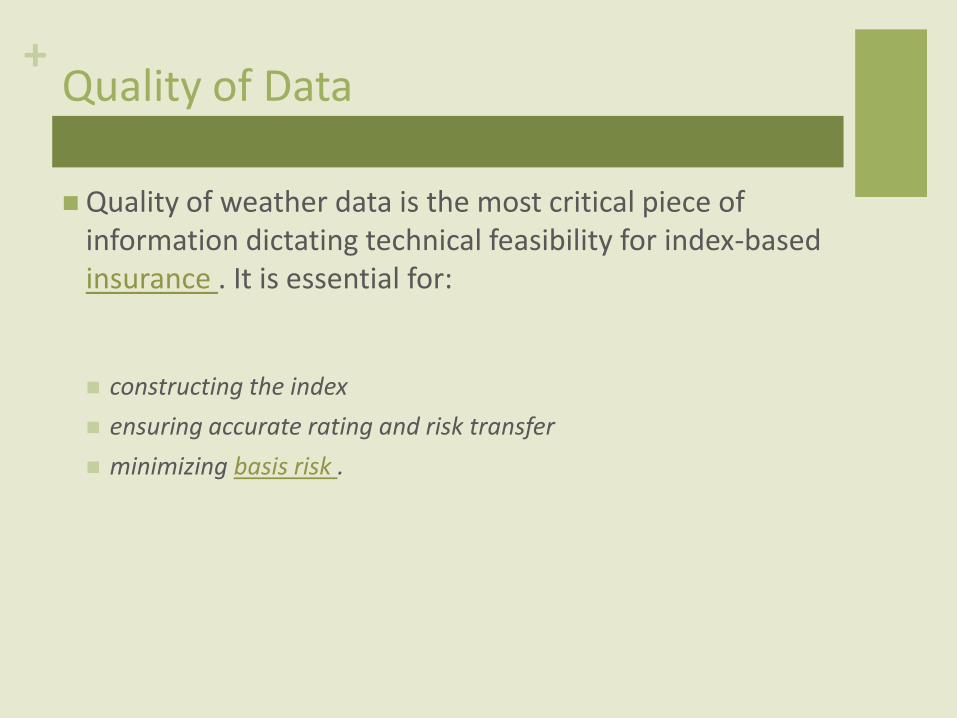
Quality of weather data is the most critical piece of information dictating technical feasibility for index-based insurance . It is essential for:
constructing the index
ensuring accurate rating and risk transfer
minimizing basis risk .
+Quality of Data
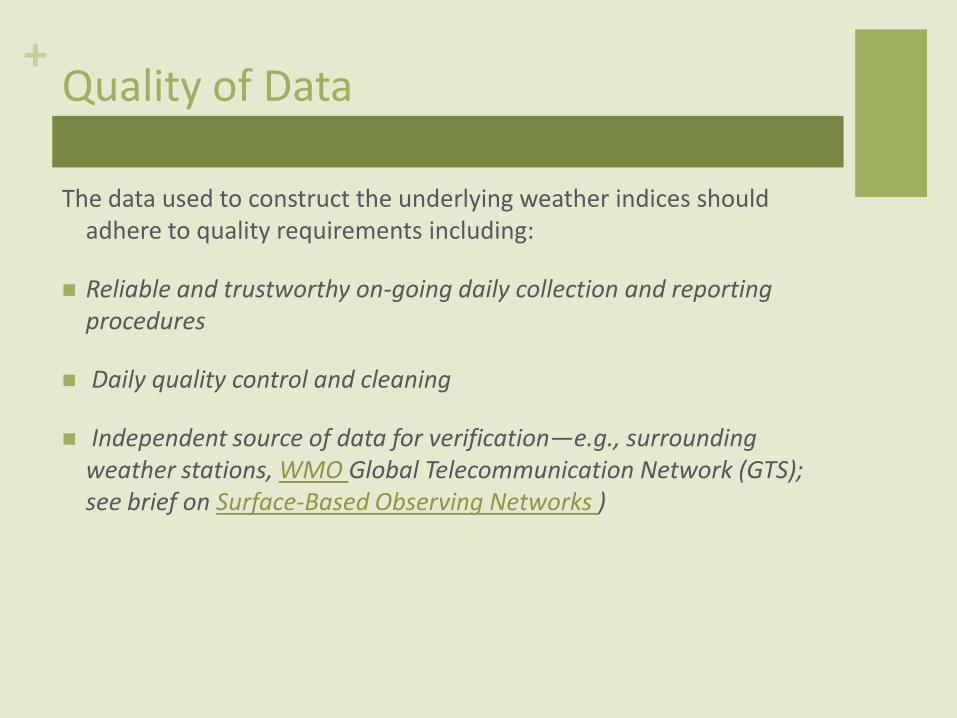
The data used to construct the underlying weather indices should adhere to quality requirements including:
Reliable and trustworthy on-going daily collection and reporting procedures
Daily quality control and cleaning
Independent source of data for verification—e.g., surrounding weather stations, WMO Global Telecommunication Network (GTS); see brief on Surface-Based Observing Networks )
+Weather Data
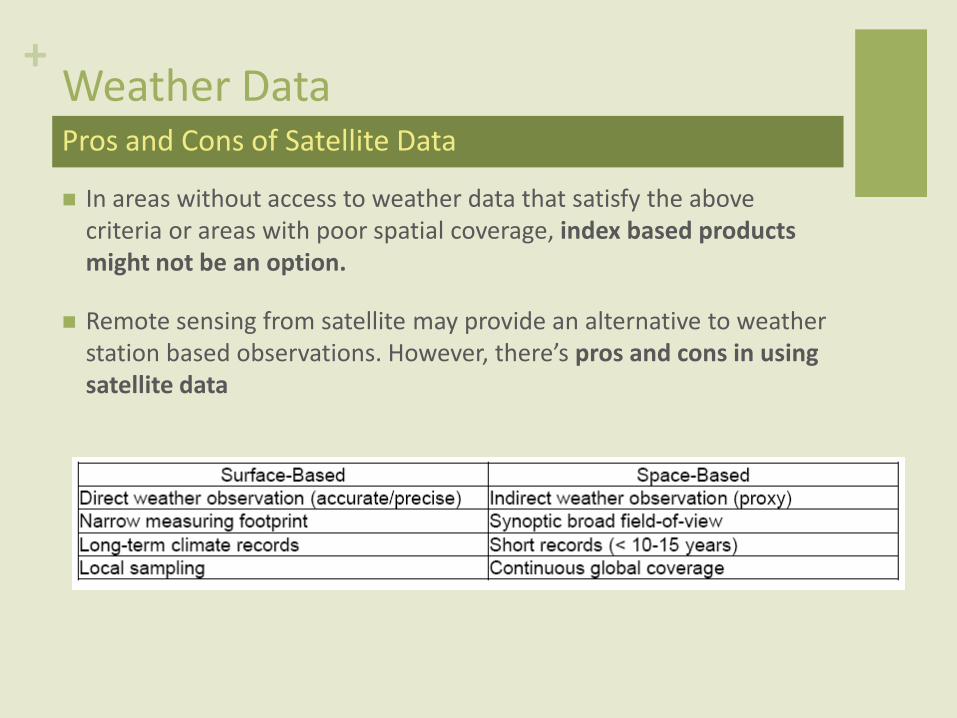
In areas without access to weather data that satisfy the above criteria or areas with poor spatial coverage, index based products might not be an option.
Remote sensing from satellite may provide an alternative to weather station based observations. However, there’s pros and cons in using satellite data
Pros and Cons of Satellite Data
+
Sources of Weather Data
+Sources of Weather Data
The United Nations World Meteorological Organization ( WMO ) and several consortia coordinate the design and management of observation
The global meteorological observation network is designed to observe global weather and its driving processes. The system is divided into two main sub-systems:
Surface based Observation Systems
Space-based Sub-system Networks
+Surface-based Observation Networks
Land-based surface stations can be of the following kind
Synoptic stations (observe full range of weather parameters at standard times).
Climatological stations (observe selected parameters at fixed times – not standard).
Agro-meteorological stations (as climatological stations but records observations of the physical and biological environment pertinent for agricultural systems).
Research stations (are generally installed for the purpose of a specific research activity )
Rain gauges (manual rain gauges operated by volunteers or part-time observers that hold other jobs).
+Space-based Observing Networks
Since the 1980s operational satellites have been providing global meteorological observations. Sensors are mounted on satellites of the following kind:
Geostationary satellites: maintain the same relative position to the Earth close to 36,000 km above the Equator. Observations are quasi-continuous but not high spatial resolution
Sun-synchronous polar satellites: orbit around the Earth at 800 km to 1000 km altitude. Observations are high resolution but satellites need to pass over a target area to retrieve observations.
+Sources of Weather Data
Nearly all executed weather contracts are written on data collected from official National Meteorological Service (NMS) weather stations.
NMS weather stations produce SYNOP reports, which are observations made at internationally agreed times by all meteorological observers.
The regulations and practices are set by the WMO and adhered to by all NMSs.
NMS communicates data to the Global Telecommunication System (GTS) for dissemination
There are well over 8000 SYNOP stations around the world.
+Sources of Weather Data
SYNOP reports are made at three hours interval and include:
Temperature
Wind speed
Rainfall
Sunshine hours
Humidity
Atmospheric pressure
+Sources of Weather Data
The WMO helps to standardize observing practices
The standardized nature of the global observing system means weather data becomes a common language that parties from different parts of the world can use to communicate and, therefore, transfer risk.
+Sources of Weather Data
The primary services of the global observing system are:
Weather forecasts on different timescales
Climate information such as provision and management of long-term meteorological record
Hydrological services such as flood warnings and drought monitoring
Uses of the Weather Observations System
+Sources of Weather Data
The frequency and spacing of observations needs to match the temporal and spatial changes of the meteorological phenomena.
o For example, precipitation can occur in solid, liquid, and vapor form.
o Rainfall can result from very different meteorological processes resultingin very different spatial and temporal properties. Stratiform precipitation,convective systems.
Rainfall requires a denser network of observations thantemperature
Similarly, floods come in many forms, such as flash floods, seasonal inundations, or storm surges. While inundation floods can be captured by flood and river gauges, flash floods are more difficult to observe due to their localized extent and rapid onset.
Sampling frequency/density
+Sources of Weather Data
It is important to note that varying spatial and temporal scales ofmeteorological phenomena coexist in the atmosphere.
One cell of a thunderstorm is only several kilometers on ahorizontal scale and has a lifetime of several hours
A tropical cyclone is about 1000 kilometers on a horizontal scaleand has a lifetime of 10 days or more.
The frequency and spacing of observations needs to match thetemporal and spatial changes of the meteorological phenomena.
Uses of the Weather Observation System
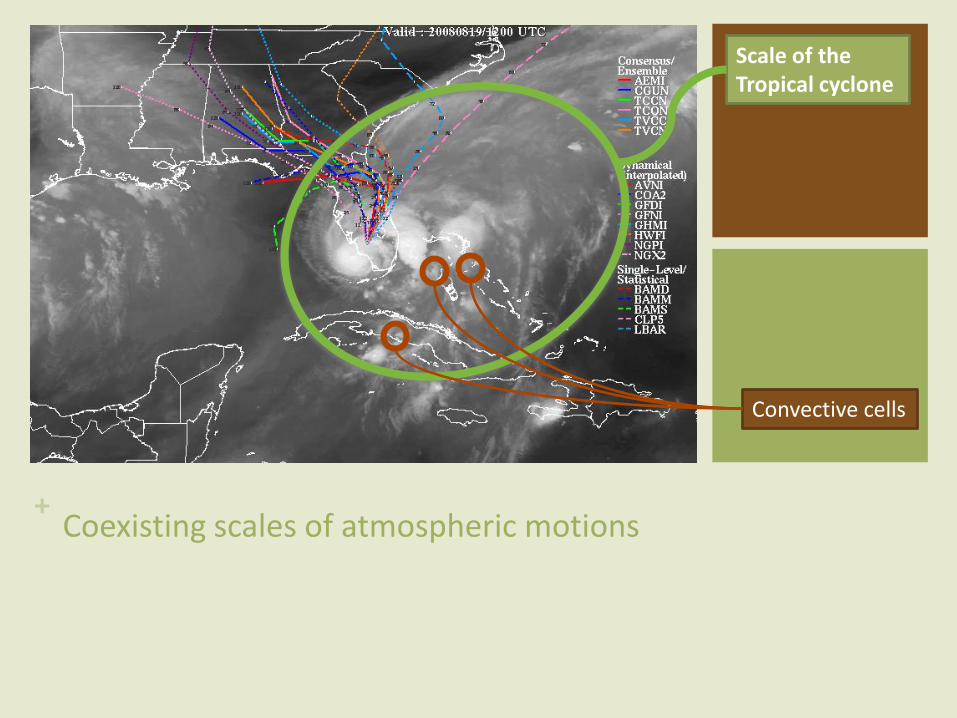
+ Coexisting scales of atmospheric motions
Scale of the Tropical cyclone
Convective cells
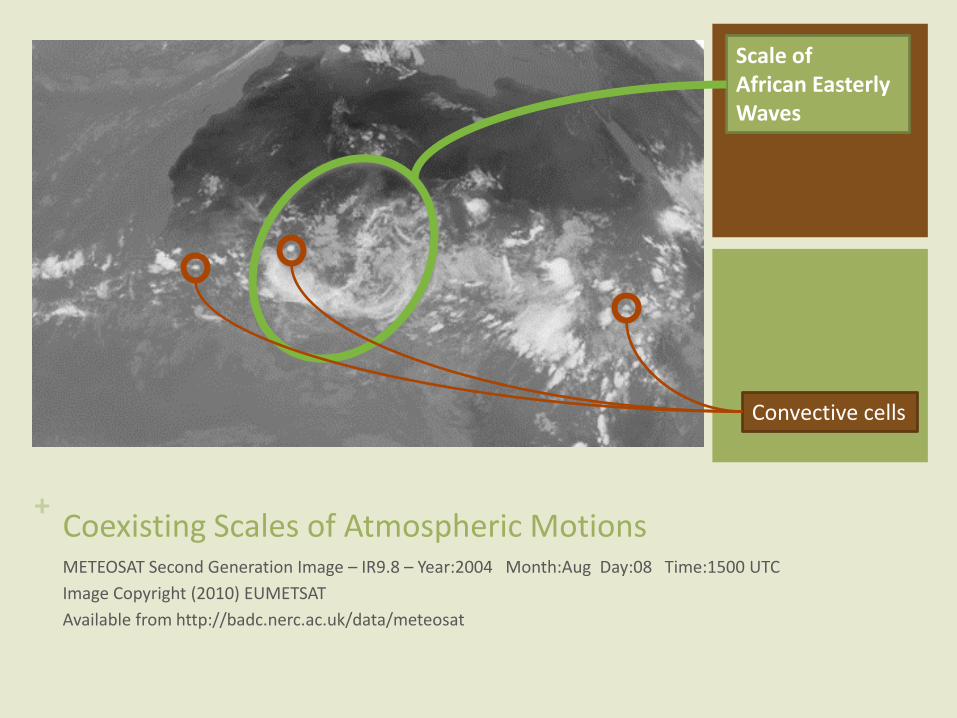
+ Coexisting Scales of Atmospheric MotionsMETEOSAT Second Generation Image – IR9.8 – Year:2004 Month:Aug Day:08 Time:1500 UTC
Image Copyright (2010) EUMETSAT
Available from http://badc.nerc.ac.uk/data/meteosat
Scale ofAfrican EasterlyWaves
Convective cells
+Sources of Weather Data
Expanding and improving the network of weather stations and weather data available to users can expand the opportunity for index-based weather risk management programs.
This can be accomplished through both upgrading and improving of existing infrastructure and data and the installation of new equipment.
Examples: case of a private company in India and of the Meteotrological Dept. in Kenya and Malawi for index insurance applications; Malawi and Ethiopia for drought early warning and food security.
Installing New Weather Stations
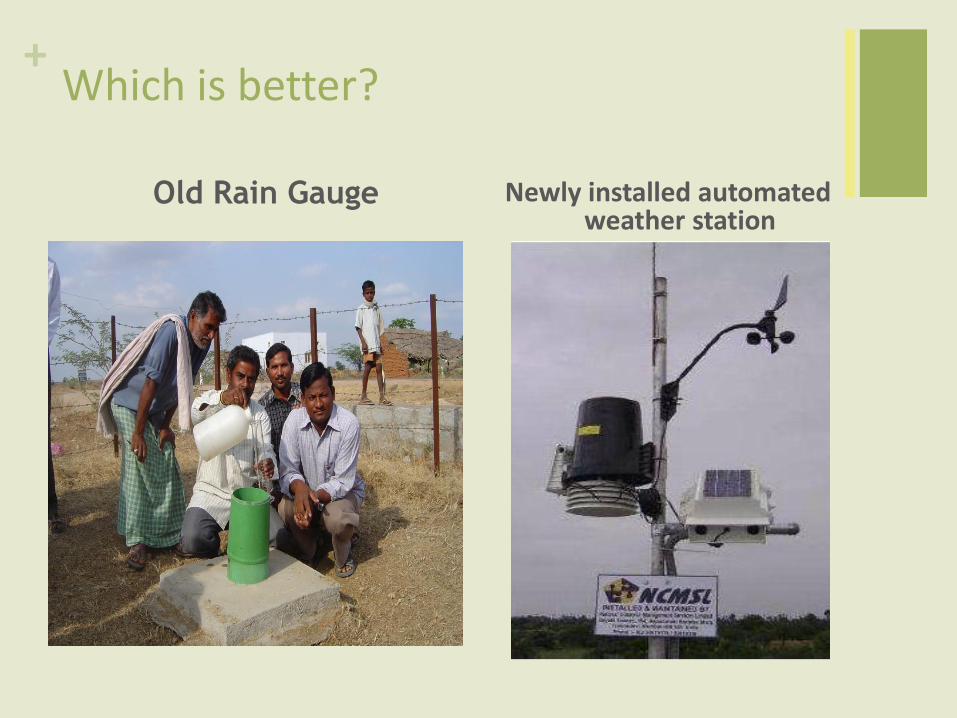
+Which is better?
Newly installed automated weather station
Old Rain Gauge
+Sources of Weather Data
There are thousands of rain gauges with historical data around the world, particularly in the continent of Africa, that can be leveraged and upgraded, and their historical data cleaned.
Example: Malawi 2006.
Automatic weather stations under a World Bank project were installed to support an index-based weather risk management program.
Two rain gauges that had historical data, but were insecure for the purposes of insurance , were upgraded to become real-time reporting, GSM-enabled, automated weather stations.
500 groundnut farmers benefited from the groundnut loan-weather insurance package that was available in Malawi at the time.
Installing New Weather Stations
+Sources of Weather Data
Station distribution depends on a number of different factors including:
the variables that are being recorded
the topography of the station location
the purpose of the station.
Guidelines for Determining Station Network Density
+Guidelines for Station Density
5-10 kilometers required for accurate monitoring flash floods or localized rain-storm events (particularly in the tropics)
15-25 kilometers required to monitor drought and prolonged periods of deficit rainfall,
100 kilometers for variables such as atmospheric pressure and upper winds.
Station density can decrease in a fairly homogenous topography.
When topography and other factors increase spatial variation in weather, weather station density must also increase.
Examples
+Sources of Weather Data
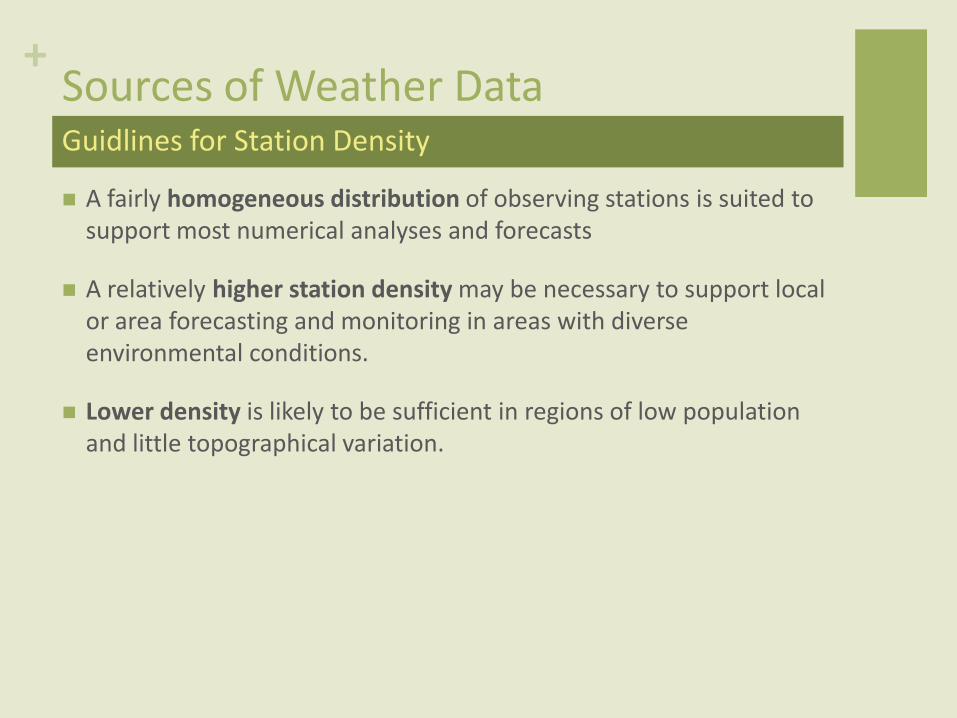
A fairly homogeneous distribution of observing stations is suited to support most numerical analyses and forecasts
A relatively higher station density may be necessary to support local or area forecasting and monitoring in areas with diverse environmental conditions.
Lower density is likely to be sufficient in regions of low population and little topographical variation.
Guidlines for Station Density
+
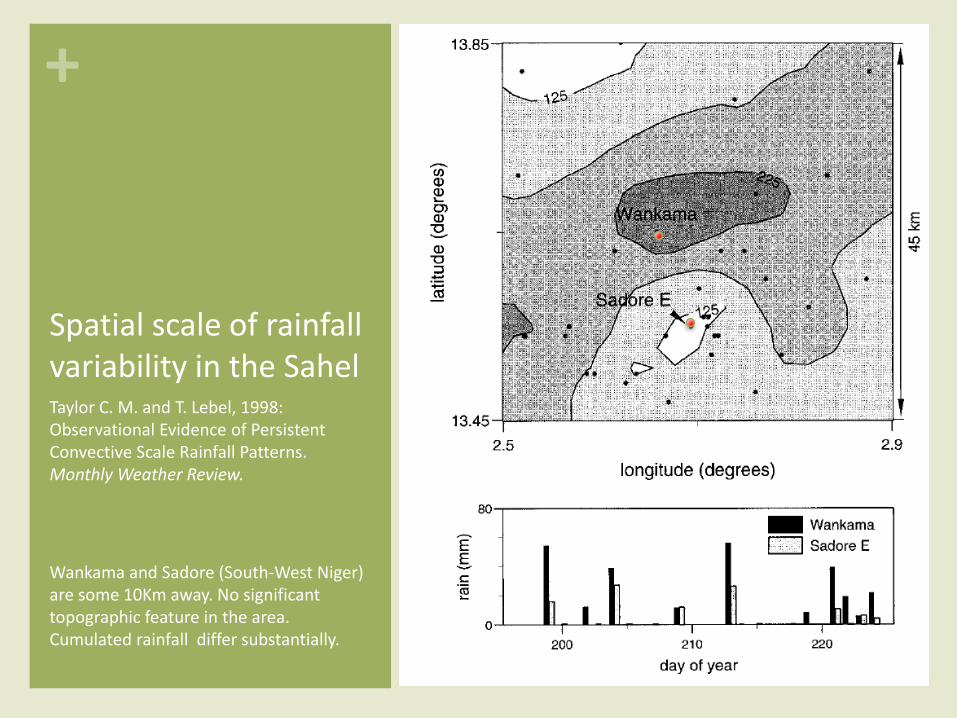
Spatial scale of rainfall variability in the SahelTaylor C. M. and T. Lebel, 1998: Observational Evidence of Persistent Convective Scale Rainfall Patterns. Monthly Weather Review.
Wankama and Sadore (South-West Niger) are some 10Km away. No significant topographic feature in the area. Cumulated rainfall differ substantially.
+
Screening Raw Weather Data
+Screening Raw Weather Data
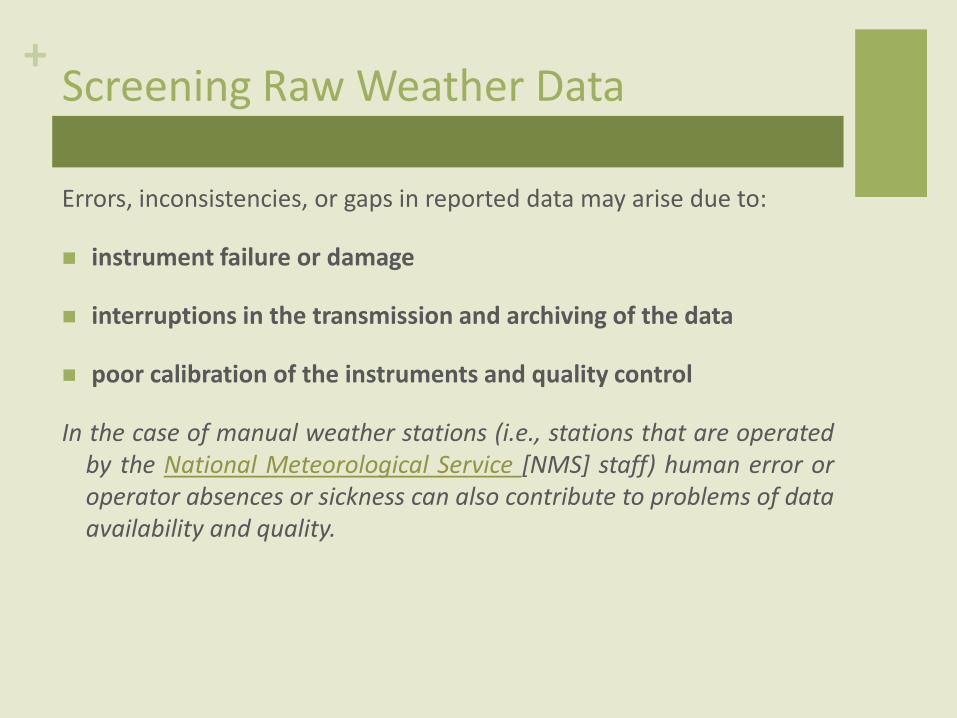
Errors, inconsistencies, or gaps in reported data may arise due to:
instrument failure or damage
interruptions in the transmission and archiving of the data
poor calibration of the instruments and quality control
In the case of manual weather stations (i.e., stations that are operatedby the National Meteorological Service [NMS] staff) human error oroperator absences or sickness can also contribute to problems of dataavailability and quality.
+Screening Raw Weather Data
Daily weather data sent to an NMS undergoes an internal quality control process before it is stored as climate data. Such control, based on WMO standrards, include:
o screening for physical inconsistencies
o Screening for erroneous values by comparing the data against itself and against alternative data sources
The screening for physical inconsistencies include:
o the minimum temperature being greater than the maximum temperature
o negative values for precipitation
o inconsistencies within a series of consecutive daily observations or neighboring stations
o inconsistencies with other meteorological parameters reported at the same station
+Screening Raw Weather Data
Climate data obtained from NMS should always be checked before being used for weather-based insurance products.
For example, it is always important to be aware of how many missing data points there are in a dataset before using for any analysis.
If erroneous or missing data is identified, techniques do exist for the user to fill the erroneous or missing data point with an estimated value.
The process of identifying and correcting erroneous values in historical weather datasets and infilling missing data with realistic values, is called cleaning.
Data Cleaning
+Screening Raw Weather Data
There are limitations to the data cleaning process
If gaps exist within a historical record and no other sources of information are available, these gaps cannot be filled.
The remaining gaps should be clearly identified to users of the cleaned dataset and can be either filled with climatological values, or removed from the dataset by the user so that they do not cause errors when using the underlying dataset for pricing.
Missing Data
+
Cleaning Raw Weather Data
+Cleaning Raw Data
Definition of cleaned data: Creating cleaned datasets involves
o identifying and correcting erroneous values in historical weather datasets
o infilling missing data with realistic values where necessary.
While data cleanig is standard for NMSs to quality control data, data may still have missing and erroneous values.
For instance, if a station was moved from a rural to an urban location it may be several degrees warmer in the new location. In order for data to be used for pricing weather insurance contracts, they should first be cleaned to correct for non-climatic in-homogeneities that could make the historical data unrepresentative of current values.
Definition of Cleaned Dataset
+Cleaning Weather Data
For the international weather market, cleaned and adjusted weather station datasets can be purchased from private vendors with proprietary data estimation models, for example:
San Francisco-based Risk Management Solutions
o http://www.rms.com
UK-based Speedwell.
o http://www.speedwellweather.com/
Local National Meteorological Services can and should be encouraged to offer such value-added products to local insurance customers to aid the growth of nascent weather markets outside of the US and Europe.
+Cleaning Raw Data
Depending on the amount of missing values, these can be replaced by:
Temporal interpolation
when the gap in values is relatively short and only isolated values are missing. The approach relies on the assumption of persistence of weather conditions over a short time period
Spatial interpolation
when consecutive values are missing for a longer time period. Based on two assumptions:
1. Surface variable is continuous
2. Surface variable is spatially dependent
Replacing Missing and Erroneous Values
+Cleaning Raw Data
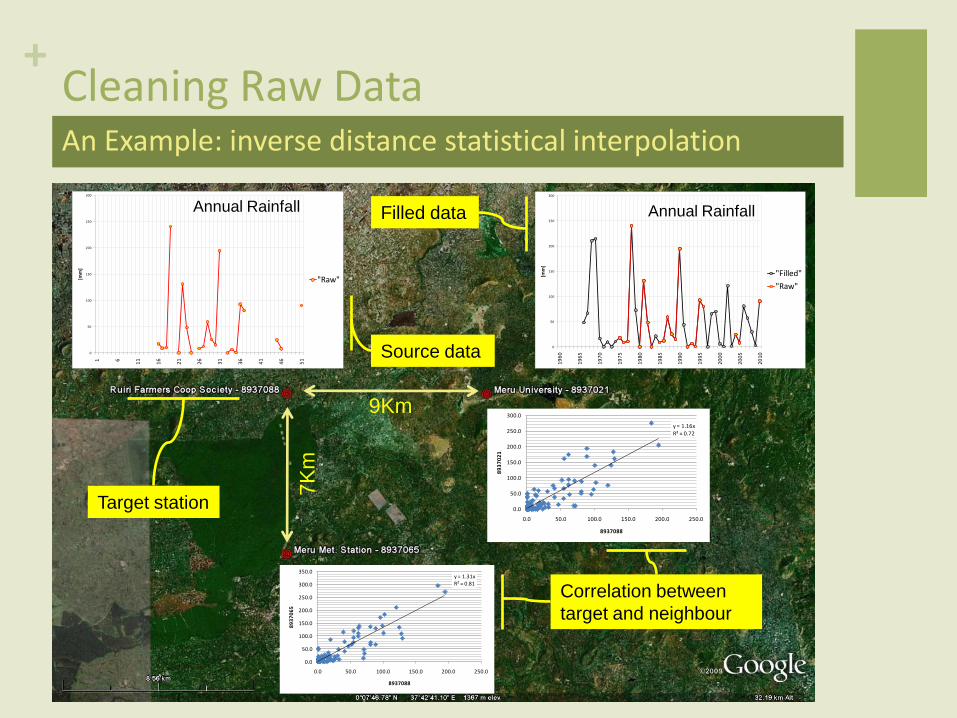
The two most common methods that can be used to clean data are:
Inverse distance statistical interpolation (use surronding data)
Regression equations calculated from periods of overlapping data with the best-correlated neighbor stations are used to estimate a missing value or correct an erroneous value.
Example of Techinques
+Cleaning Raw Data
More advanced methods for spatial and temporal interpolation include:
Non-linear, non-parametric methods such as artificial neural networks
Spline functions
Fourier transformations, which decompose a time series into its constituent frequencies
Kriging Method
Examples of Advanced Techinques
+Cleaning Raw DataAn Example: inverse distance statistical interpolation
y = 1.31xR² = 0.81
0.0
50.0
100.0
150.0
200.0
250.0
300.0
350.0
0.0 50.0 100.0 150.0 200.0 250.0
89
37
06
5
8937088
y = 1.16xR² = 0.72
0.0
50.0
100.0
150.0
200.0
250.0
300.0
0.0 50.0 100.0 150.0 200.0 250.0
89
37
02
1
8937088
9Km
7K
m
Target station
Correlation between
target and neighbour
0
50
100
150
200
250
300
19
60
19
65
19
70
19
75
19
80
19
85
19
90
19
95
20
00
20
05
20
10
[mm
]
"Filled"
"Raw"
Annual RainfallFilled data
0
50
100
150
200
250
300
1 6 11
16
21
26
31
36
41
46
51
[mm
]
"Raw"
Annual Rainfall
Source data
+Gridded datasets
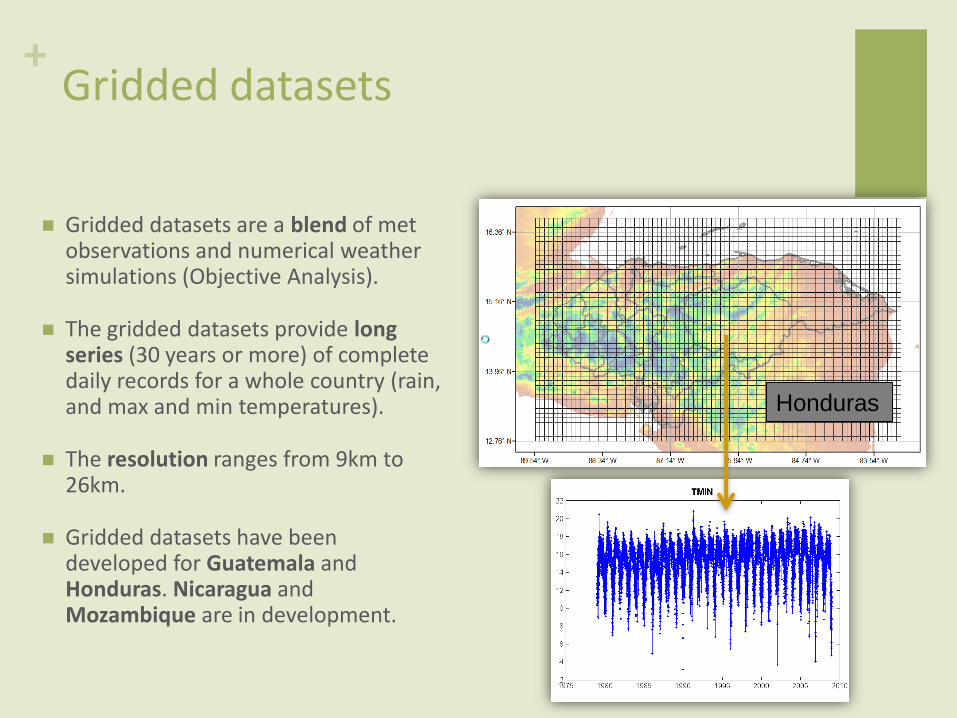
Gridded datasets are a blend of met observations and numerical weather simulations (Objective Analysis).
The gridded datasets provide long series (30 years or more) of complete daily records for a whole country (rain, and max and min temperatures).
The resolution ranges from 9km to 26km.
Gridded datasets have been developed for Guatemala and Honduras. Nicaragua and Mozambique are in development.
Honduras
+Cleaning Raw Data
Some common complications in weather data cleaning include:
a) Inconsistent time of observation
It is not uncommon that different countries and even different weather stations within a country, report observations for different times of the day. Also, the reporting time may be different for different parameters.
b) Micro-climates and spatial interpolation
Assumptions about the spatial correlation in weather data are often not valid for micro-climates where weather variables exhibit very heterogeneous patterns across space.
c) Spatial correlation patterns
Spatial correlation patterns are specific to a specific weather variable and aspect of the weather variable that is being investigated (e.g., the spatial pattern of drought is very different to the spatial patterns of high or excessive rainfall events).
Complications
+
Agriculture Risk Management TeamAgricultural and Rural DevelopmentThe World Bank
January 10-14 2011
Mombasa, Kenya
Module 3 Book B: Treatment of
Cleaned Weather Data
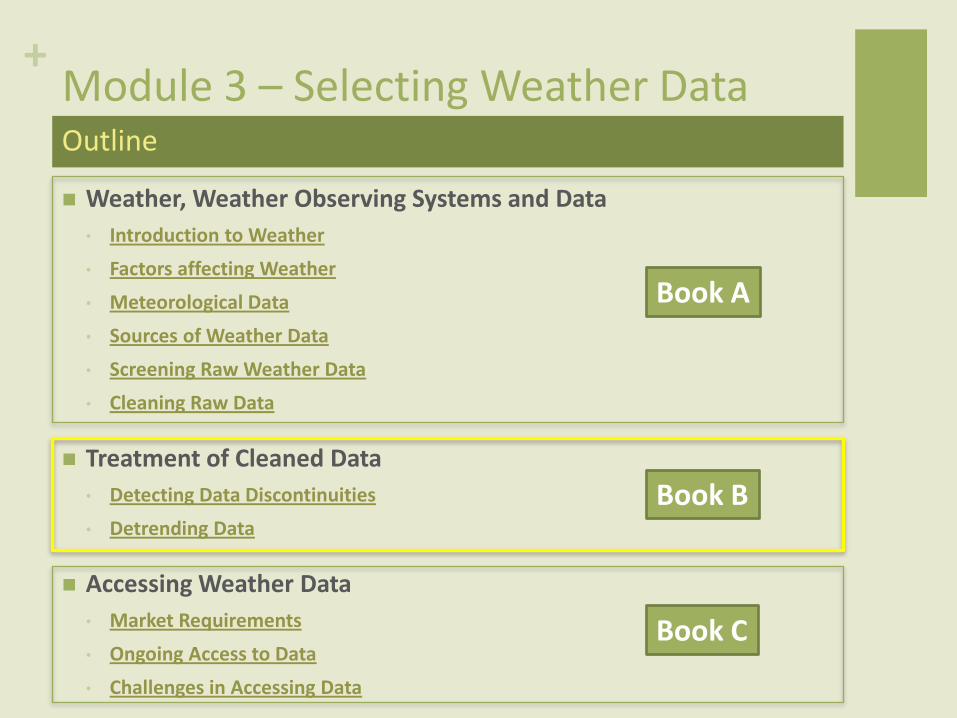
+Module 3 – Selecting Weather Data
Weather, Weather Observing Systems and Data
• Introduction to Weather
• Factors affecting Weather
• Meteorological Data
• Sources of Weather Data
• Screening Raw Weather Data
• Cleaning Raw Data
Treatment of Cleaned Data
• Detecting Data Discontinuities
• Detrending Data
Accessing Weather Data
• Market Requirements
• Ongoing Access to Data
• Challenges in Accessing Data
Outline
Book A
Book B
Book C
+
Treatment of Cleaned Data
+Treatment of Cleaned DataData Discontinuities
Raw meteorological observations and datasets that have been cleaned can sometimes exhibit non-climatic jumps in the historical record.
Statistical procedures based on neighboring stations exist to identify significant discontinuities and account for these changes in cleaned meteorological data records.
The challenge in these methods is to correct for the artificial discontinuity without altering the natural weather variability measured by the station.
+Treatment of Cleaned Data
Some common causes of discontinuities can arise from:
Changes in instrumentation
Relocation of weather stations
Changes in the immediate surroundings of the weather station
Changes in operating procedures or operators
Deterioration and malfunction of instruments (e.g., caused by dirt or excessive physical stress)
For weather-based transactions, it is fundamental to identify, quantify, and treat these data discontinuities.
Data Discontinuities
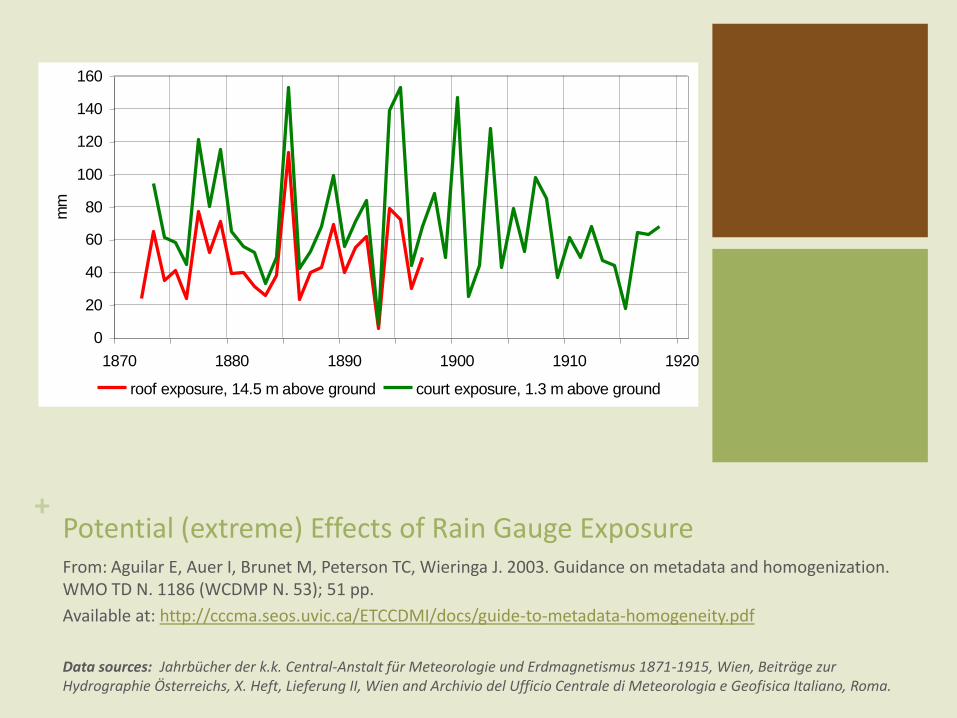
+ Potential (extreme) Effects of Rain Gauge ExposureFrom: Aguilar E, Auer I, Brunet M, Peterson TC, Wieringa J. 2003. Guidance on metadata and homogenization. WMO TD N. 1186 (WCDMP N. 53); 51 pp.
Available at: http://cccma.seos.uvic.ca/ETCCDMI/docs/guide-to-metadata-homogeneity.pdf
Data sources: Jahrbücher der k.k. Central-Anstalt für Meteorologie und Erdmagnetismus 1871-1915, Wien, Beiträge zur Hydrographie Österreichs, X. Heft, Lieferung II, Wien and Archivio del Ufficio Centrale di Meteorologia e Geofisica Italiano, Roma.
0
20
40
60
80
100
120
140
160
1870 1880 1890 1900 1910 1920
mm
roof exposure, 14.5 m above ground court exposure, 1.3 m above ground
+Treatment of Cleaned Data
Metadata can play an important role in identifying potential data discontinuities (e.g., the relocation of a station or changes in instrumentation or procedures).
If an actual event is reported, continuity checks need to be performed before and after the respective date.
While discontinuities can frequently be explained by actual events, not all events are reported and further tests need to be performed to detect discontinuities.
Detecting techniques can either be based on a single station or using reference data from one, or several, nearby stations.
Detecting Data Discontinuities
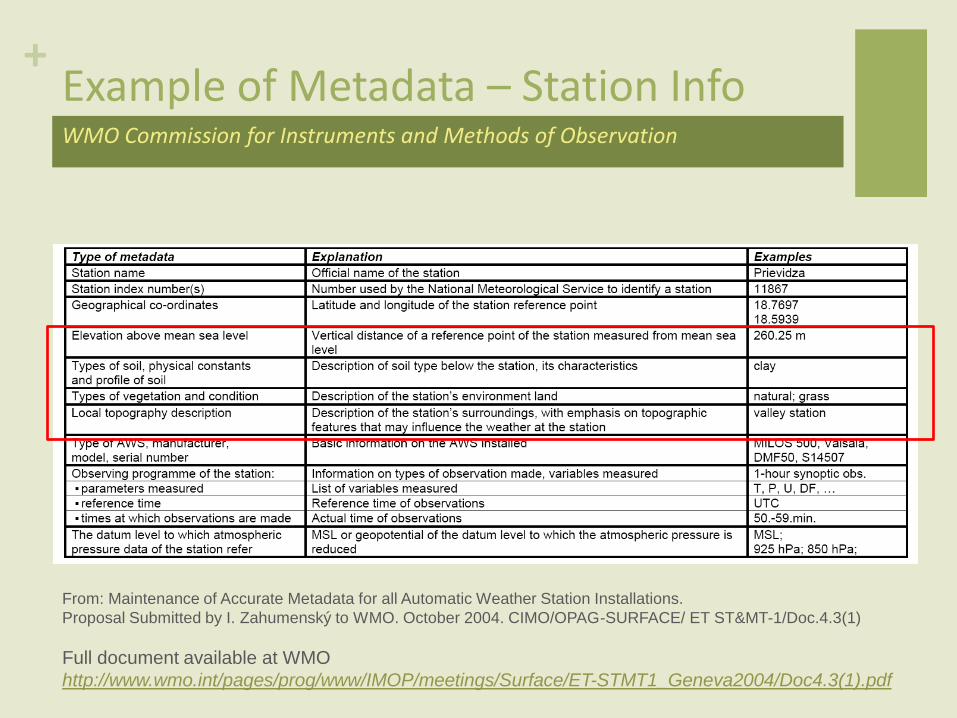
+Example of Metadata – Station InfoWMO Commission for Instruments and Methods of Observation
From: Maintenance of Accurate Metadata for all Automatic Weather Station Installations.
Proposal Submitted by I. Zahumenský to WMO. October 2004. CIMO/OPAG-SURFACE/ ET ST&MT-1/Doc.4.3(1)
Full document available at WMO
http://www.wmo.int/pages/prog/www/IMOP/meetings/Surface/ET-STMT1_Geneva2004/Doc4.3(1).pdf
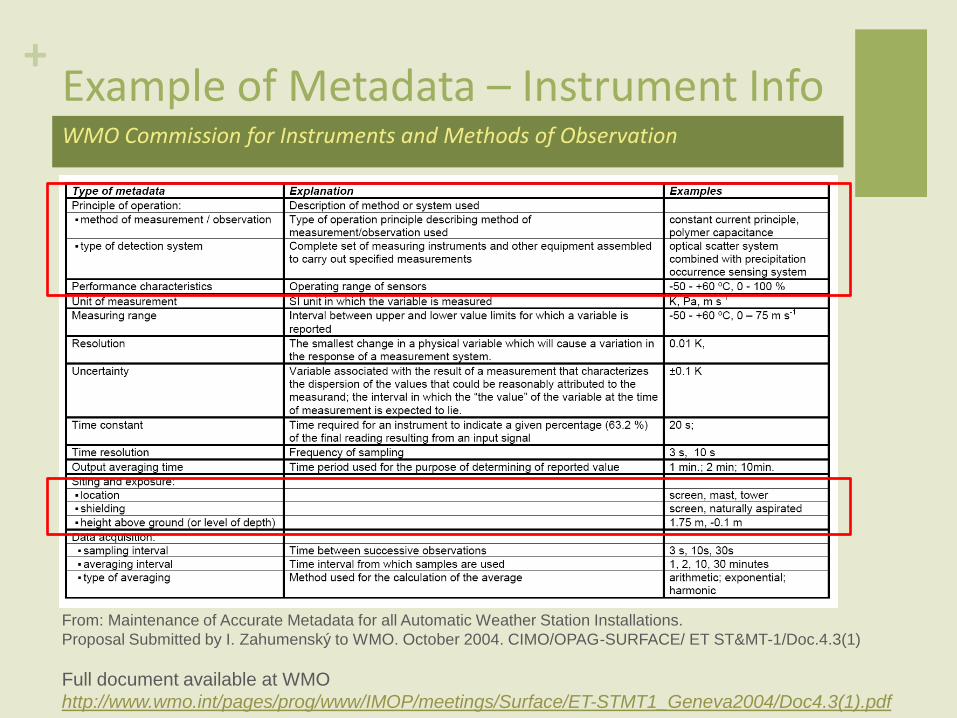
+Example of Metadata – Instrument InfoWMO Commission for Instruments and Methods of Observation
From: Maintenance of Accurate Metadata for all Automatic Weather Station Installations.
Proposal Submitted by I. Zahumenský to WMO. October 2004. CIMO/OPAG-SURFACE/ ET ST&MT-1/Doc.4.3(1)
Full document available at WMO
http://www.wmo.int/pages/prog/www/IMOP/meetings/Surface/ET-STMT1_Geneva2004/Doc4.3(1).pdf
+Treatment of Cleaned Data
Using data from a single station, discontinuities are commonly detected using temporal filtering techniques, for example:
moving averages
the estimation of data distributions (e.g., quintiles) for different time periods.
Detecting Discontinuities
+Treatment of Cleaned Data
Using multiple stations, the following procedure may be adopted:
1. Aggregate time series of nearby stations to construct a reference time series and identify the climatological signal in the data.
2. Compute the difference (for temperature) or ratio (for precipitation) to the reference to identify discontinuities the targeted time series.
Detecting Discontinuities
+Treatment of Cleaned Data
To detect discontinuities in data time series, assessments by experienced analysts are very important to:
o determine model parameters used for the detection;
o quantifying and correcting, of discontinuities;
o perform visual inspection of the time series;
o conduct simple manipulation of the data ;
o analysis of the residuals obtained from a regression model fit to the data series .
Detecting Discontinuities
+
Detrending Data
+Detrenting Data
Cleaned data must always be checked for significant trends as meteorological data often contain trends that may arise from
from natural climate variability
urban heat-island effect
the impact of anthropogenic climate change
Irrespective of the cause trends must be identified and removed when needed
+Detrending Data
The aim of detrending data for pricing weather risk is to obtain better estimates or forecasts of the
expected loss
standard deviation
or Probable Maximum Likelihood (PML) for different return periods
By not accounting for warming or drying trends the expected losses and variability may be significantly underestimated. This can lead to mispricing of contracts.
+Detrending Data
Reinsurers will always check for trends.
Many different mathematical methods exist for detrending data, for example:
o Linear detrending
o LOESS or LOWESS (Locally Weighted Scatterplot Smoothing) http://www.itl.nist.gov/div898/handbook/pmd/section1/pmd144.htm
Practitioners will look at all methods and their impact on premium when pricing weather risk management contracts.
Chosing the appropriate techinque for detrending
+Detrending Data
Two points to consider when detrending data are:
The underlying data must be prepared in a selected format: daily, monthly, or annual averages of a meteorological parameter.
The number of years of historical data or index values in the detrending process must be selected. Detrending data using the same method, but a different number of years (e.g., 30 years versus 40 years), can lead to significantly different results.
Level of Aggregation of the Data
+Detrending Data
The difficulty of detrending daily rainfall is that it is a discrete zero-to-one process. If a significant trend is observed in the rainfall data, it is recommended that the detrending is done at the index level
The detrending of temperature data can be performed at the daily, monthly, or index level.
In summary, if non-linear trends exist in the data, the choice of method and data aggregation can result in different output.
Examples
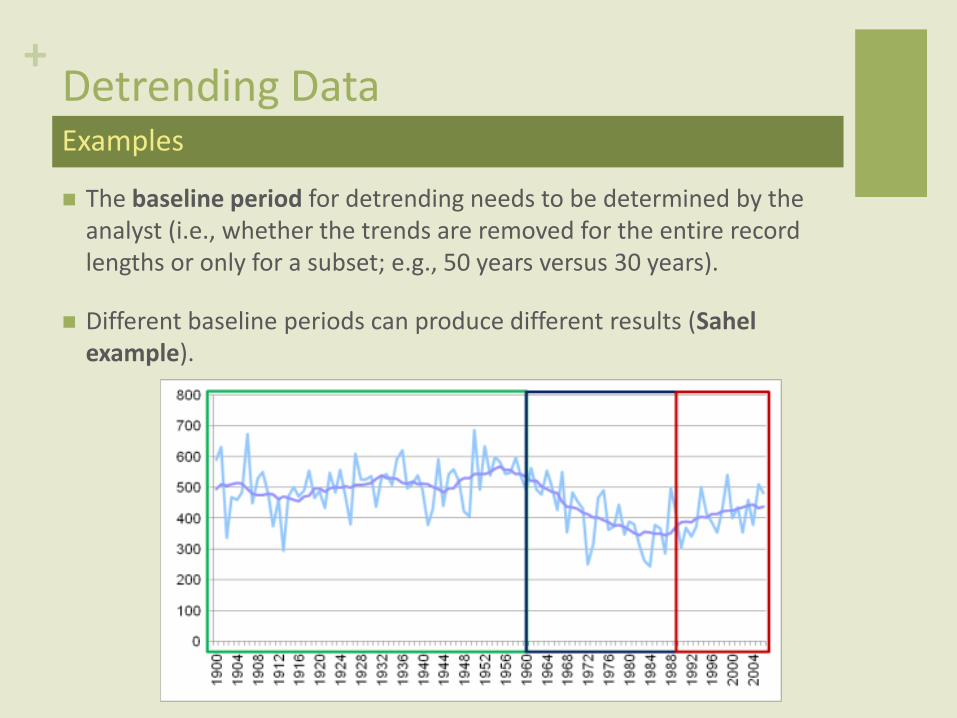
+Detrending Data
The baseline period for detrending needs to be determined by the analyst (i.e., whether the trends are removed for the entire record lengths or only for a subset; e.g., 50 years versus 30 years).
Different baseline periods can produce different results (Sahel example).
Examples
+
Approaches to Detrending Data
+Approaches to Detrending Data
The aim of detrending is to statistically model the underlying process by decomposing a dataset into a deterministic trend and a stochastic noise term around the trend:
o D(t) = Y(t) + ε (t), ε (t) ~N(0, σ 2 ) where:
o D(t) is the process represented by the dataset
o Y(t) is the deterministic and therefore predictable component
o ε(t) is a normally distributed noise component with a mean of zero and standard deviation σ
o t is unit time
+Approaches to Detrending Data
Determining how much of the historical data variability is attributed to Y(t) gives an indication of how well a particular model represents the underlying data.
Care should always be taken to check the sensitivity of detrending results to the underlying method used.
Crosschecking several detrending methods and approaches and visually checking the data are always recommended.
+Approaches to Detrending Data
The weather market often uses the 10-year average of an index as a quick first-guess estimate for E(I).
The simplest and most commonly used method for detrending data is
o polynomial detrending
o principal components analysis
o filtering
o non-parametric techniques
+Approaches to Detrending Data
It should be stressed that there is no correct approach to detrending meteorological data
Making assumptions about the data can be dangerous and applying a detrending methodology often increases the uncertainty of the final statistics derived from the data.
Identifying trends and their cause is itself a subjective process and care should always be taken to check the sensitivity of detrending results to the underlying method used.
Crosschecking several detrending methods and approaches and visually checking the data are always recommended.
+Approaches to Detrending Data
Insurers must develop an intuition for the weather data they underwrite and its variability and trends. To do this they should be able to
Visualize data
Identify significant trends
Detrend meteorological data under a number of assumptions and uncertainty criteria.
+
Agriculture Risk Management TeamAgricultural and Rural DevelopmentThe World Bank
January 10-14 2011
Mombasa, Kenya
Module 3 Book C: Considerations
When Accessing Weather Data
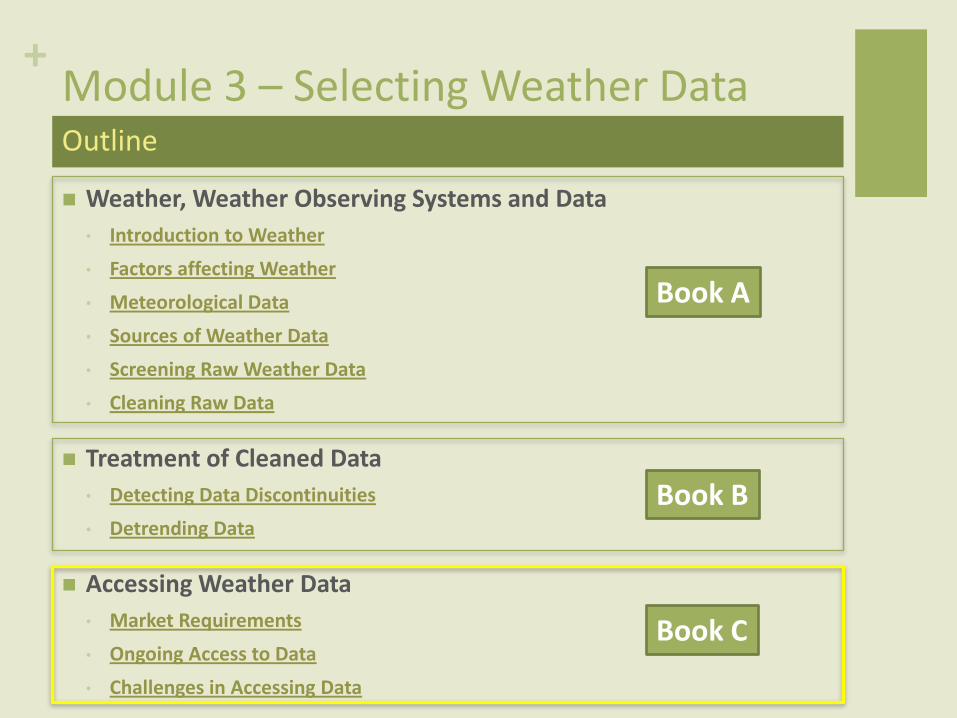
+Module 3 – Selecting Weather Data
Weather, Weather Observing Systems and Data
• Introduction to Weather
• Factors affecting Weather
• Meteorological Data
• Sources of Weather Data
• Screening Raw Weather Data
• Cleaning Raw Data
Treatment of Cleaned Data
• Detecting Data Discontinuities
• Detrending Data
Accessing Weather Data
• Market Requirements
• Ongoing Access to Data
• Challenges in Accessing Data
Outline
Book A
Book B
Book C
+
Market Requirements
+Market Requirements
Weather data for index insurance provides the basis for both underwriting and settling claim s on these weather insurance contracts.
The companies (both local and international) who act as risk takers for these contracts have specific requirements for the contracts that they will underwrite.
+Market Requirements
Basic standards required by risk takers:
30+ years of data, especially to cover extreme risk
Limited missing values and out-of-range values
Prefer less than one percent missing observations
Data integrity
Availability of a nearby station for a “buddy check”
Consistency of observation techniques: manual versus automated
Limited changes of instrumentation / orientation / configuration
Reliable settlement mechanism
Integrity of recording procedure
Little potential for measurement tampering
+
Ongoing Access to Data
+Ongoing Access to Data
The availability of historical weather data is paramount to designing and issuing a contract.
The ongoing availability of that data during the contract period is equally as important in operating the contract.
Data should be transmitted from the Meteorological Department or the data provider to participating parties on a predefined basis (daily to 10-day frequency).
This type of regular transmission will allow all parties to
o monitor the performance of the insurance policy
o promptly identify problems with data transmission or availability.
Parties must agree on data sharing policies
+
Challenges in Accessing Data
+Challenges in Accessing Data
The challenges associated with accessing both historical and real time data should not be underestimated.
The agency or institution responsible for managing weather data varies by country.
National Meteorological Services (NMS) or its equivalent
Other government.
Weather data, in general, is considered a public good but this does not guarantee that this data will be either publically available or free, particularly, on a daily basis.
+Challenges in Accessing Data
Getting agreement from the NMS to provide data to clients can prove challenging
In many cases, state institutions are either unwilling or unable to share it
Use of data for commercial purposes has not been done to a great extent and, therefore, the precedent regarding how to do this often has not been established.
In previous pilot experiences, programs have been delayed by months simply because access to data (even though it existed) could not be gained.
+Challenges in Accessing Data
Publically available does not mean free. Price can vary significantly. Scale-up to additional stations should be considered
Purchased data may not be sharable. Data should instead be available to all stakeholders (reinsurers, insurance companies, insured parties)
Daily data should be available. Often NMSs are willing to share weekly or dekadal data.
Missing data may not be missing (need to be digitized)
Ongoing access to data is just as important as access to historical data. For example an early identification of data gaps may allow recovery
Automated stations are preferred. Manual stations are acceptable for insurance as long as they have the appropriate security
Why accessing data can be so complicated
Recommended