Module 23
Segment Reporting and
Transfer Pricing
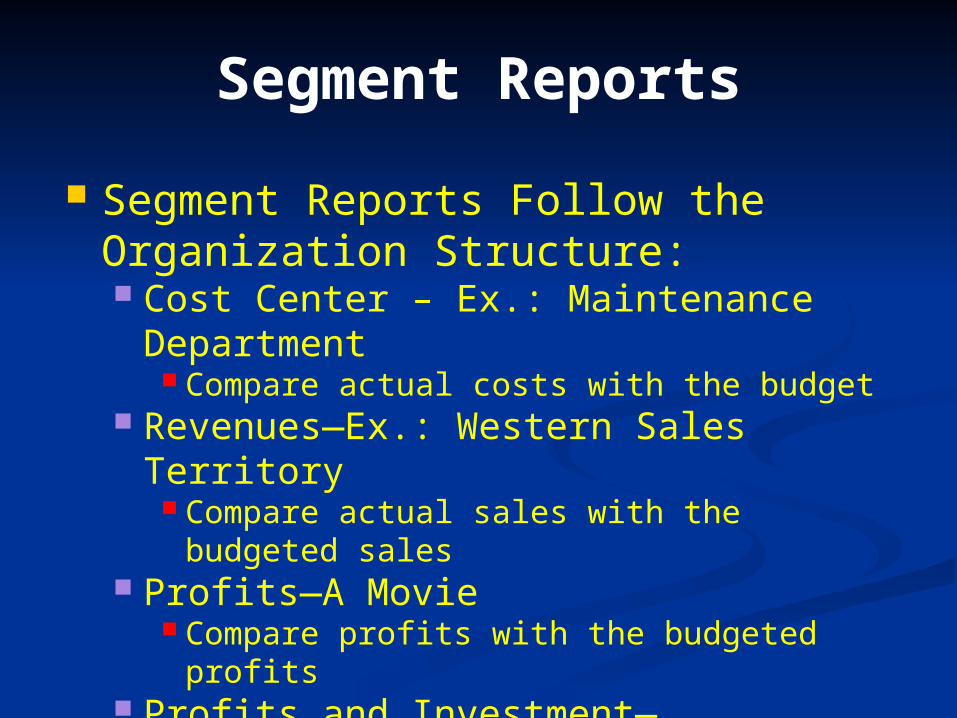
Segment Reports
Segment Reports Follow the Organization Structure: Cost Center – Ex.: Maintenance
Department Compare actual costs with the budget
Revenues—Ex.: Western Sales Territory Compare actual sales with the budgeted
sales Profits—A Movie
Compare profits with the budgeted profits Profits and Investment—Electronics,
Inc. (Sub.) Compare Ret. on Investment to required
ROI
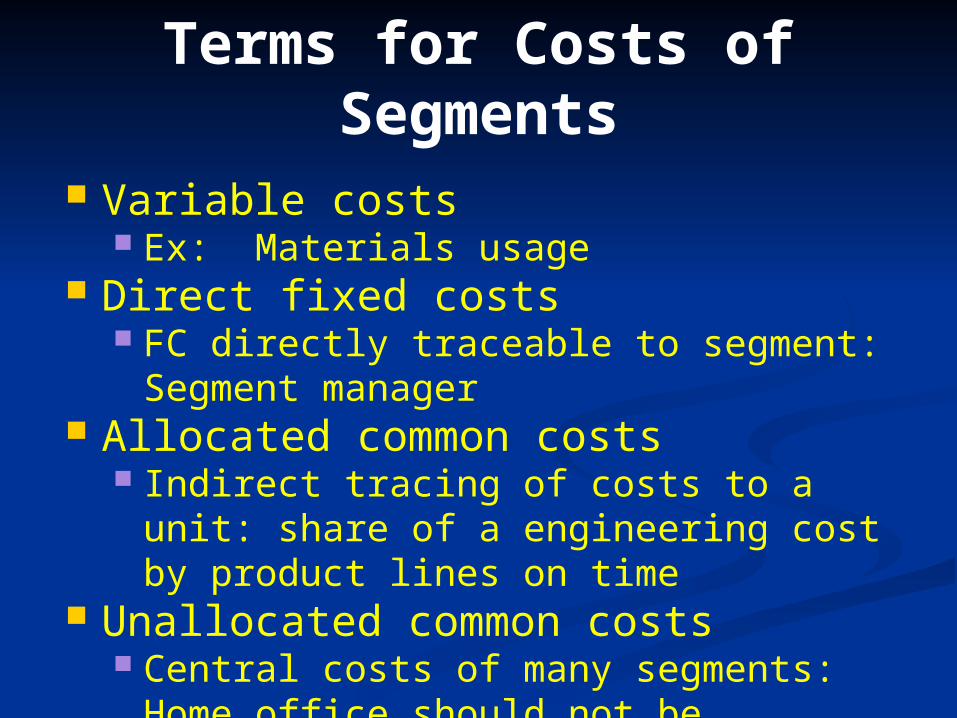
Terms for Costs of Segments
Variable costs Ex: Materials usage
Direct fixed costs FC directly traceable to segment:
Segment manager Allocated common costs
Indirect tracing of costs to a unit: share of a engineering cost by product lines on time
Unallocated common costs Central costs of many segments: Home
office should not be allocated, but some companies do…
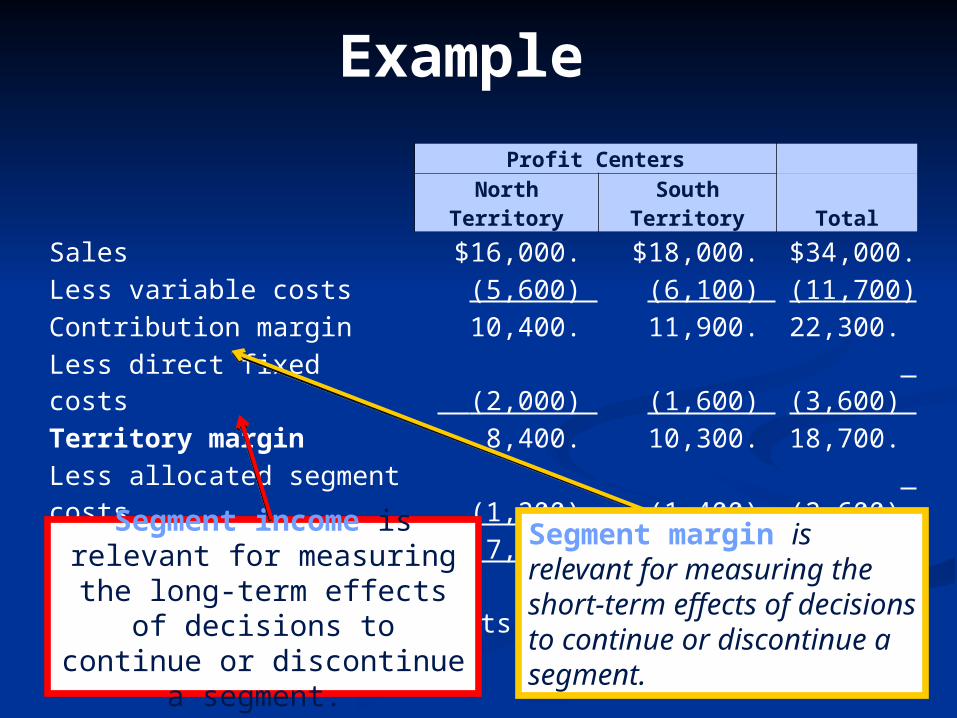
Example
Profit CentersNorth Territory South Territory Total
Sales $16,000. $18,000. $34,000. Less variable costs (5,600) (6,100) (11,700) Contribution margin 10,400. 11,900. 22,300. Less direct fixed costs (2,000) (1,600) (3,600) Territory margin 8,400. 10,300. 18,700. Less allocated segment costs (1,200) (1,400) (2,600) Territory income $ 7,200. $ 8,900. 16,100. Less unallocated common costs (1,500) Net income $14,600.
Segment income is relevant for measuring the long-term
effects of decisions to continue or discontinue a segment.
Segment margin is relevant for measuring the short-term effects of decisions to continue or discontinue a segment.
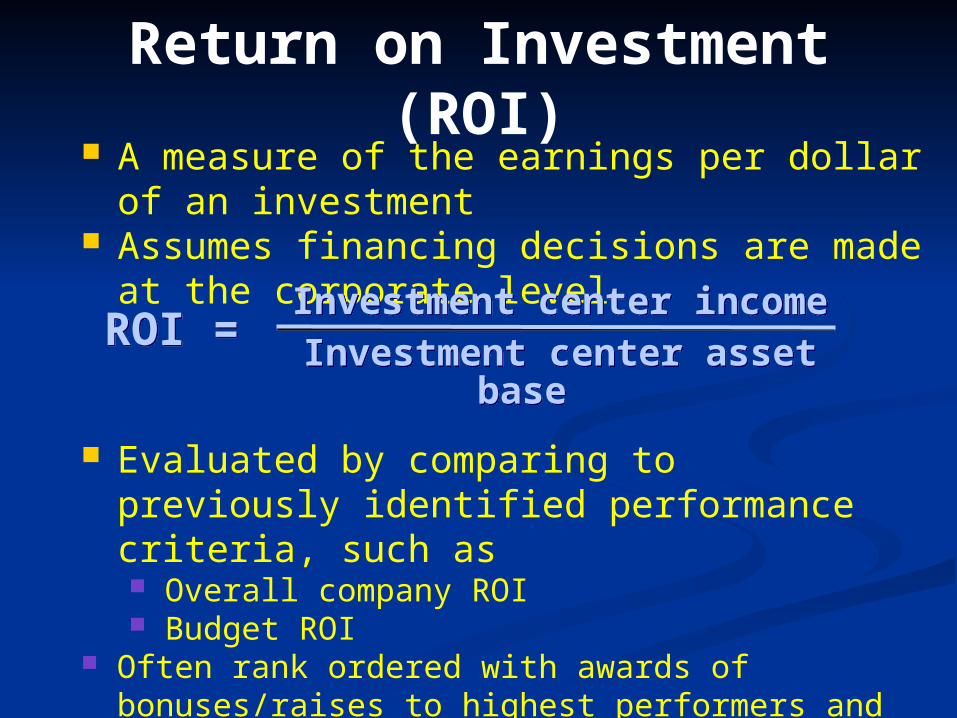
Return on Investment (ROI)
A measure of the earnings per dollar of an investment
Assumes financing decisions are made at the corporate levelInvestment center income
Investment center asset base
Investment center incomeInvestment center asset base ROI = ROI =
Evaluated by comparing to previously identified performance criteria, such as Overall company ROI Budget ROI
Often rank ordered with awards of bonuses/raises to highest performers and bottom performers warned or dumped.
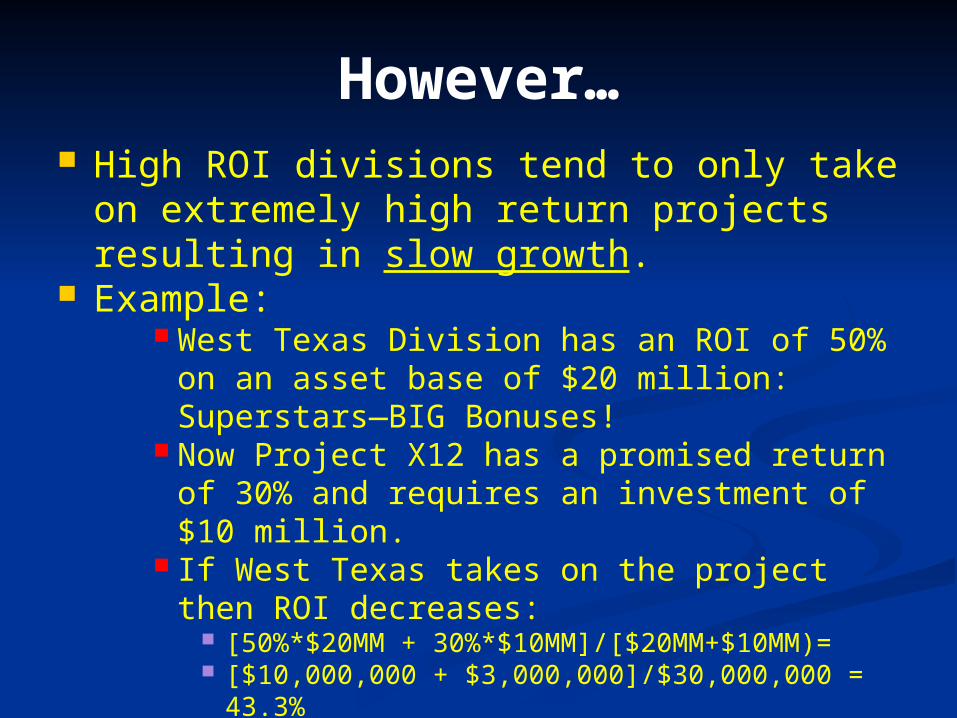
However… High ROI divisions tend to only take on
extremely high return projects resulting in slow growth.
Example: West Texas Division has an ROI of 50% on
an asset base of $20 million: Superstars—BIG Bonuses!
Now Project X12 has a promised return of 30% and requires an investment of $10 million.
If West Texas takes on the project then ROI decreases:
[50%*$20MM + 30%*$10MM]/[$20MM+$10MM)=
[$10,000,000 + $3,000,000]/$30,000,000 = 43.3%
Superstars would be less shiny! Will West Texas Division take on this
project? (Never…) Also, West Texas would be better off to
shrink any part of their organization that earns less than 50%!
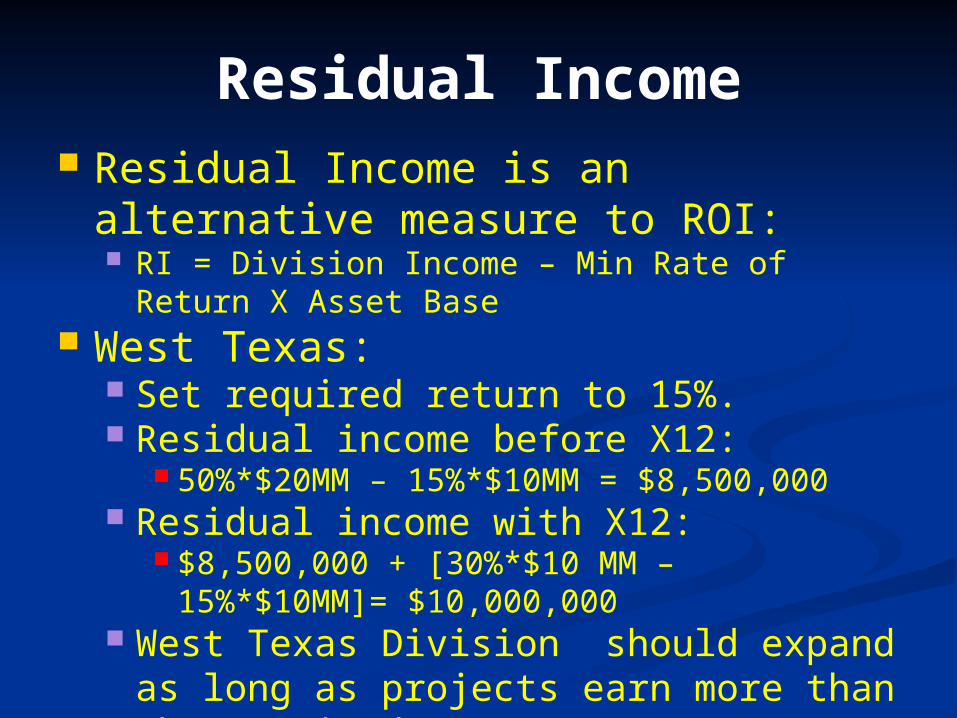
Residual Income Residual Income is an alternative
measure to ROI: RI = Division Income – Min Rate of Return X
Asset Base West Texas:
Set required return to 15%. Residual income before X12:
50%*$20MM – 15%*$10MM = $8,500,000 Residual income with X12:
$8,500,000 + [30%*$10 MM – 15%*$10MM]= $10,000,000
West Texas Division should expand as long as projects earn more than the required return.
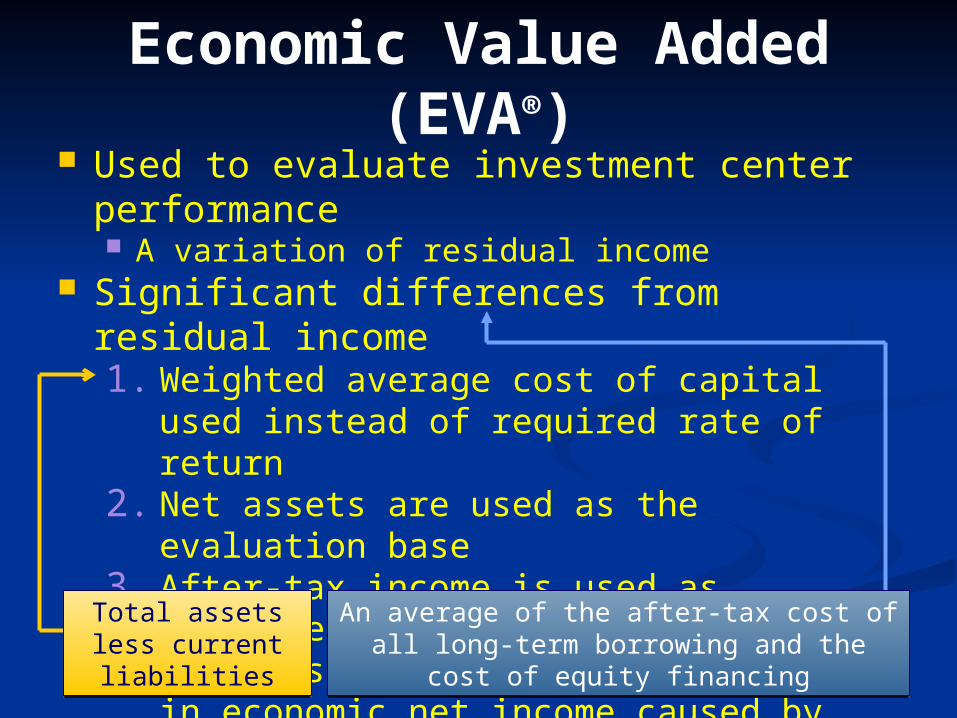
Economic Value Added (EVA®)
Used to evaluate investment center performance A variation of residual income
Significant differences from residual income1. Weighted average cost of capital used
instead of required rate of return2. Net assets are used as the evaluation
base3. After-tax income is used as investment
center income4. Corrects for potential distortions in
economic net income caused by GAAP
Total assets less current liabilitiesTotal assets less current liabilities
An average of the after-tax cost of all long-term borrowing and the cost of equity financing
An average of the after-tax cost of all long-term borrowing and the cost of equity financing
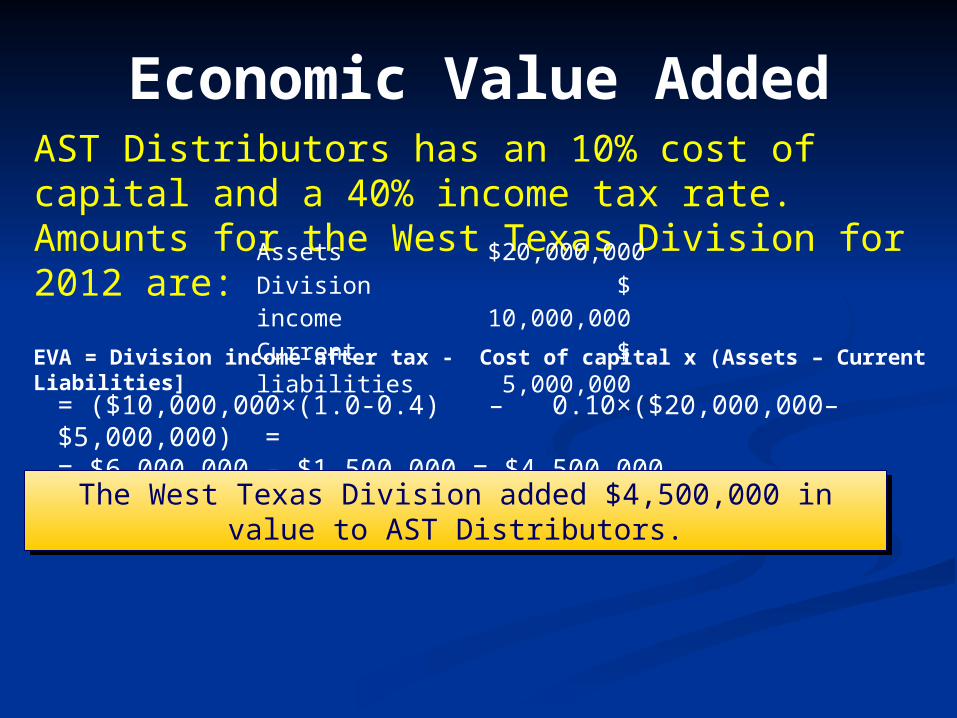
Economic Value AddedAST Distributors has an 10% cost of capital and a 40% income tax rate. Amounts for the West Texas Division for 2012 are: Assets $20,000,000
Division income $ 10,000,000 Current liabilities $ 5,000,000
EVA = Division income after tax - Cost of capital x (Assets – Current Liabilities]
= ($10,000,000×(1.0-0.4) – 0.10×($20,000,000–$5,000,000) == $6,000,000 - $1,500,000 = $4,500,000
The West Texas Division added $4,500,000 in value to AST Distributors.
The West Texas Division added $4,500,000 in value to AST Distributors.
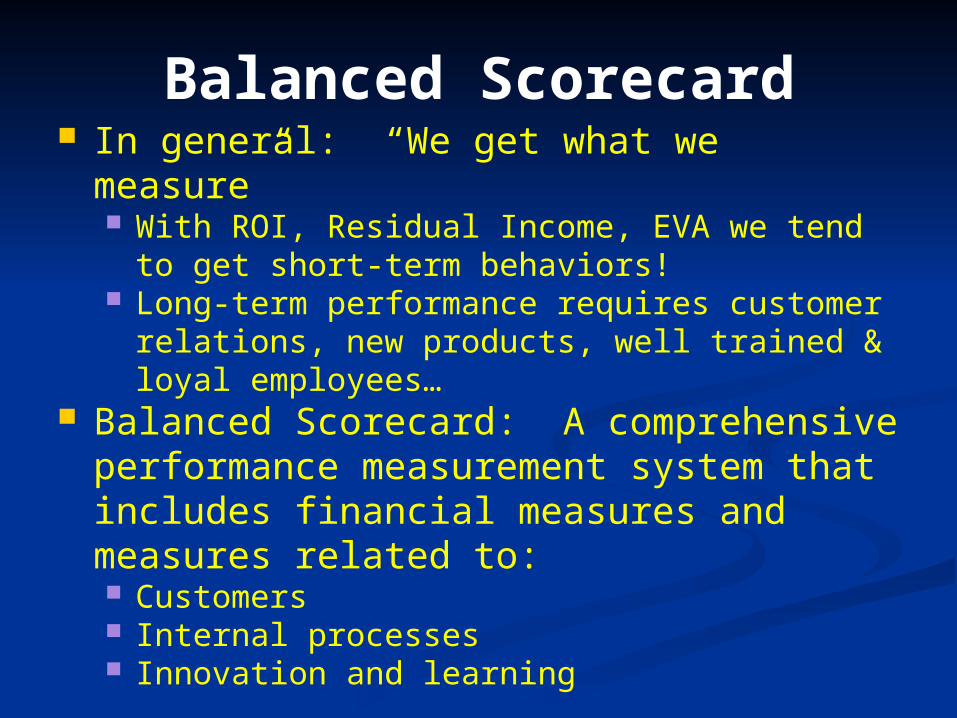
Balanced Scorecard In general: “We get what we measure”
With ROI, Residual Income, EVA we tend to get short-term behaviors!
Long-term performance requires customer relations, new products, well trained & loyal employees…
Balanced Scorecard: A comprehensive performance measurement system that includes financial measures and measures related to: Customers Internal processes Innovation and learning
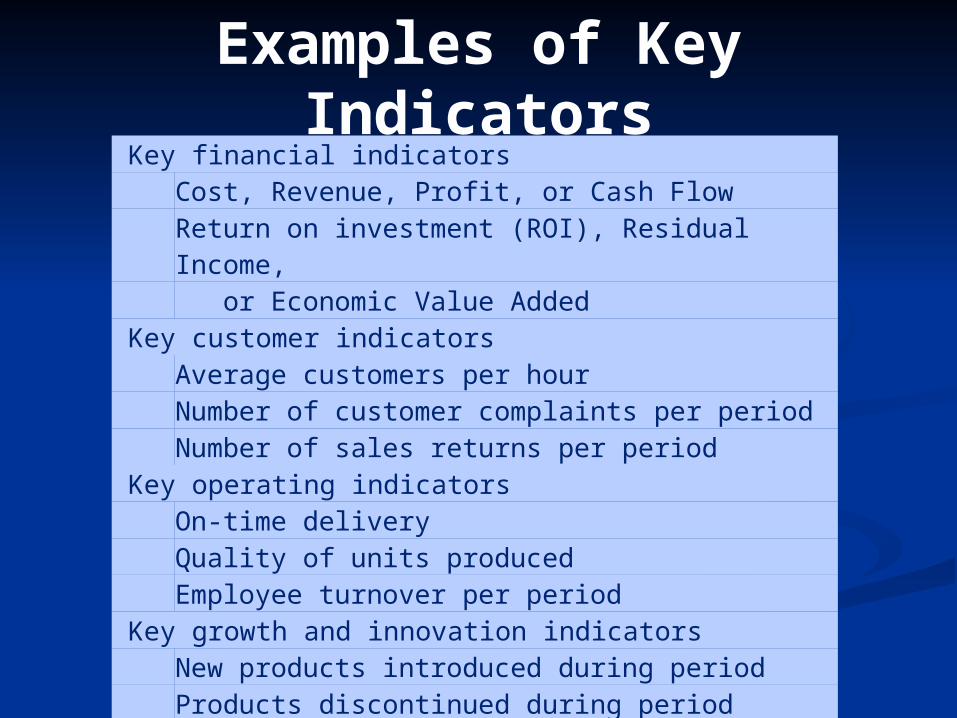
Examples of Key Indicators
Key financial indicatorsCost, Revenue, Profit, or Cash FlowReturn on investment (ROI), Residual Income, or Economic Value Added
Key customer indicatorsAverage customers per hourNumber of customer complaints per periodNumber of sales returns per period
Key operating indicatorsOn-time deliveryQuality of units producedEmployee turnover per period
Key growth and innovation indicatorsNew products introduced during periodProducts discontinued during periodNumber of sales promotionsSpecial offers, discounts, etc.
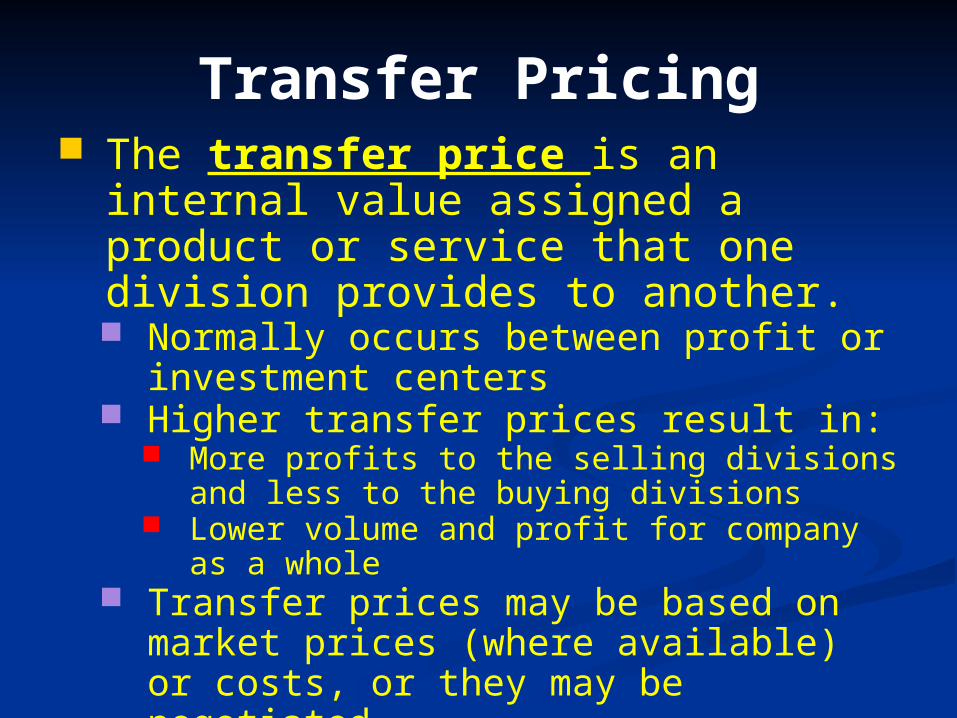
Transfer Pricing The transfer price is an internal
value assigned a product or service that one division provides to another. Normally occurs between profit or
investment centers Higher transfer prices result in:
More profits to the selling divisions and less to the buying divisions
Lower volume and profit for company as a whole
Transfer prices may be based on market prices (where available) or costs, or they may be negotiated.
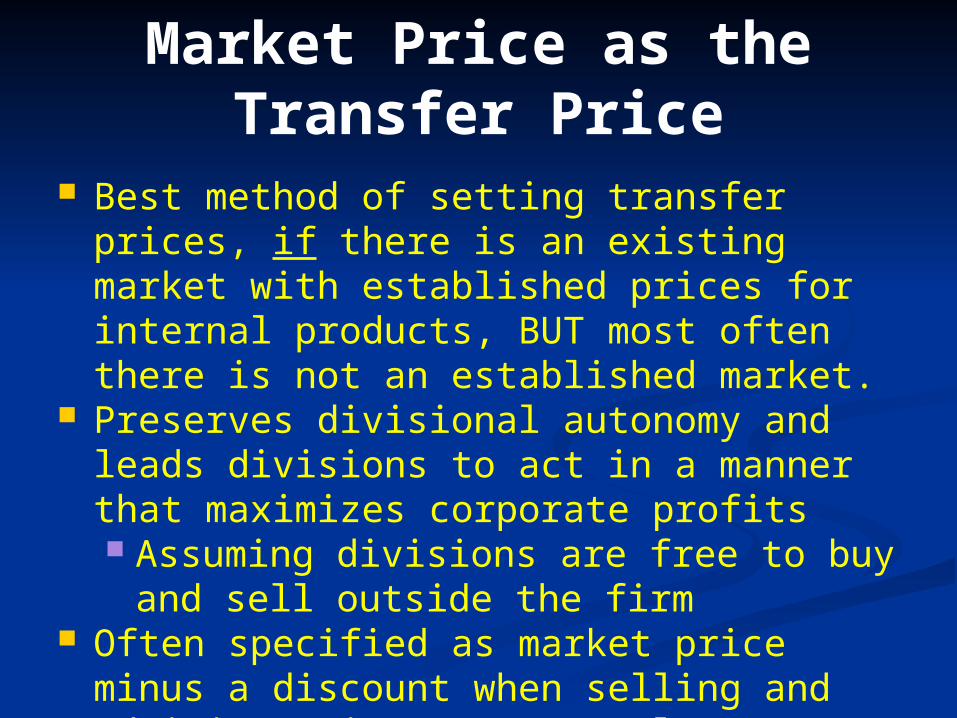
Market Price as the Transfer Price
Best method of setting transfer prices, if there is an existing market with established prices for internal products, BUT most often there is not an established market.
Preserves divisional autonomy and leads divisions to act in a manner that maximizes corporate profits Assuming divisions are free to buy and
sell outside the firm Often specified as market price minus a
discount when selling and administrative costs are lower on transfers.
Cost Plus Markup as Transfer Price
Allows supplying divisions to increase earnings
May result in some undesired behavior: Passing along inefficiencies, no penalty for
inefficiency Stifle buyers’ demand and profits in low
volume periods Supplying divisions tend to have higher
ROI than buying divisions… Variations on “cost” and “markup”:
variable only, standardized, total costs including administration, dual transfer price (e.g. VC and FC+MU%), opportunity costs, fixed fees versus % markup
Negotiated Price as the Transfer Price
Supplying and buying divisions agree on a price through negotiation
Use for relatively few transfers with similar powered negotiators
Divisions should be free to withdraw and go elsewhere
Recommended