Journal of Advanced Research (2014) 5, 19–25
Cairo University
Journal of Advanced Research
ORIGINAL ARTICLE
Modification of the photocatalytic activity of TiO2
by b-Cyclodextrin in decoloration of ethyl violet dye
* Corresponding authors. Tel.: +91 9443572149; fax: +91 04562
254970.
E-mail address: [email protected] (P. Velusamy).
Peer review under responsibility of Cairo University.
2090-1232 ª 2014 Cairo University. Production and hosting by Elsevier B.V. All rights reserved.
http://dx.doi.org/10.1016/j.jare.2012.10.001
Ponnusamy Velusamy *, Sakthivel Pitchaimuthu, Subramanian Rajalakshmi,
Nagarathinam Kannan *
Centre for Research and Post-Graduate Studies in Chemistry, Ayya Nadar Janaki Ammal College, Sivakasi 626 124,Tamil nadu, India
A R T I C L E I N F O A B S T R A C T
Article history:
Received 14 July 2012
Received in revised form 5 October
2012
Accepted 11 October 2012
Available online 6 December 2012
Keywords:
Ethyl violet dye
b-CyclodextrinTiO2
Photocatalytic decoloration
COD
The photocatalytic decoloration of an organic dye, ethyl violet (EV), has been studied in the
presence of TiO2 and the addition of b-Cyclodextrin (b-CD) with TiO2 (TiO2-b-CD) under
UV-A light irradiation. The different operating parameters like initial concentration of dye, illu-
mination time, pH and amount of catalyst used have also been investigated. The photocatalytic
decoloration efficiency is more in the TiO2-b-CD/UV-A light system than TiO2/UV-A light sys-
tem. The mineralization of EV has been confirmed by Chemical Oxygen Demand (COD) mea-
surements. The complexation patterns have been confirmed with UV–Visible and FT-IR
spectral data and the interaction between TiO2 and b-CD have been characterized by powder
XRD analysis and UV–Visible diffuse reflectance spectroscopy.
ª 2014 Cairo University. Production and hosting by Elsevier B.V. All rights reserved.
Introduction
Decoloration of organic dyes in wastewater from the industriesis some what necessary to have pollution free environment. Be-cause these dyes affect the growth of plants as well as ecosys-
tems by producing aesthetically unpleasant odour and non-biodegradable wastes. It is estimated that from 1% to 15%of the dye is lost during dyeing processes and is released into
wastewater [1–3]. There are many processes extensively used
to remove the dye molecules from wastewater such as inciner-ation, biological treatment, ozonation, adsorption on solidphases, coagulation, foam floatation, electrochemical oxida-
tion, Fenton or Photofenton oxidation, and membranes, [3–12]. However, the above processes have some kind of limita-tions, viz. the incineration can produce toxic volatiles; biolog-ical treatment methods demand long period of treatment and
bad smells; ozonation presents a short half-life. In ozonationthe stability of ozone is affected by the presence of salts, pHand temperature, adsorption results in phase transference of
contaminant, not degrading the contaminant and producingsludge. Most of these methods are non-destructive, but theygenerate secondary pollution, because in these techniques the
dyes are transferred into another phase and not degradingthe pollutants and this phase has to be regenerated. All the
20 P. Velusamy et al.
above effects dictate us the necessity to find an alternate meth-od for treatment of wastewater contaminated by organic dyes.
A number of remarkable progresses have been made in the
heterogeneous photocatalytic decoloration of pollutants underdifferent light sources. These techniques have more advantagesover the conventional technologies, say decoloration of the
dyes into innocuous final products. Many semiconductor phot-ocatalysts (such as TiO2, ZnO, Fe2O3, CdS, CeO2 and ZnS)have been used to degrade organic pollutants. These semicon-
ductors can act as sensitizers for light induced redox processesdue to their electronic structure, which is characterized by afilled valence band and an empty conduction band [13–19].Among them TiO2 has been extensively applied as a photocat-
alyst due to its strong photocatalytic activity, nontoxic, lowcost and high stability. However its band gap (3.0–3.2 eV)can capture maximum light energy by the region of ultra violet
radiation. To extend the response of TiO2 to UV-A light, themodified TiO2 systems with various methods have also been re-ported [20–25].
Cyclodextrins (CDs) are non-reducing cyclic maltooligosac-charides produced from starch by cyclodextrin glycosyltrans-ferase and are composed of a hydrophilic outer surface and
a hydrophobic inner cavity. CDs can form inclusion complexeswith organic pollutants and organic pesticides to reduce theenvironmental impact of the chemical pollutants [26–28]. Inthis study, the activity of TiO2 and the effect of addition of
b-CD with TiO2 on photocatalytic decoloration of EV dyesolution under UV-A light radiation have been studied andthe results are well documented.
Experimental
The commercial organic basic dye EV (80% of dye,
kmax = 595 nm) received from Loba Chemie was used as such.The semiconductor photocatalyst TiO2 was purchased fromSD’s Fine Chemicals. b-Cyclodextrin was received from Hime-
dia chemicals. AnalaR grade reagents, HgSO4, Ag2SO4,
H2SO4, K2Cr2O7, HCl, NaOH and Ferroin indicator were re-ceived from Merck. Double distilled water was used to prepare
the experimental solutions. The physical properties of b-CDand EV dye are shown Table 1.
Characterization
X-ray diffraction patterns of powder samples were recordedwith a high resolution powder X-ray diffractometer modelRICH SIERT & Co with Cu as the X-ray source
(k = 1.5406 · 10�10 m). UV–Visible spectra were recorded bya UV–Visible spectrophotometer (Shimadzu UV-1700) andthe scan range was from 400 to 700 nm. FT-IR spectra were
recorded using ‘‘Shimadzu’’ (model 8400S) in the region
Table 1 Physical properties of ethyl violet dye and b-Cyclodextrin.
Name Ethyl violet b-Cyclodextrin
Molecular formula C31H42N3Cl C42H70O35
Molar weight 492.2 1135
Appearance Dark violet powder White powder
pH 8.3 (Basic dye) –
kmax 595 nm –
4000–400 cm�1 as KBr pellets. UV–Vis diffuse reflectancespectra were recorded on a Shimadzu 2550 UV–Vis spectro-photometer with BaSO4 as the background between 200 and
700 nm.
Photocatalytic decoloration experiment
Photocatalytic decoloration experiments under UV-A lightirradiation were carried out in an Annular type Photoreactor,with a high pressure mercury vapor lamp (k P 365 nm,
160 W B22 200–250 V Philips, India). It was used as light en-ergy source in the central axis. EV dye solutions containingthe photocatalysts of either TiO2 or TiO2-b-CD were prepared.
The pH values of EV dye solutions were adjusted using digitalpen pH meter (Hanna instruments, Portugal) depending on de-sired values with HCl and NaOH solution as their effect on theadsorption surface properties of TiO2 is negligible [2]. The dis-
tance from the light source to the photocell containing EV dyesolutions is about 12 cm. Prior to irradiation, TiO2 suspensionswere kept in dark for 10 min. to attain adsorption–desorption
equilibrium between dye and TiO2 system. During irradiationthe reactant solutions were continuously stirred with magneticstirrer. The tubes were taken out at different intervals of time
and the solutions were centrifuged well. The supernatant liquidwas collected and labeled for the determination of concentra-tions for the remained dye by measuring its absorbance (atkmax = 595 nm) with visible spectrophotometer (Elico, Model
No. SL207). In all the cases, exactly 20 mL of reactant solutionwas irradiated with required amount of photocatalysts. The pHof the EV dye solutions was adjusted before irradiation process
and it was not controlled during the course of the reaction.By keeping the concentrations of EV dye-b-CD as constant
with the molar ratio of 1:1, the effect of all other experimental
parameters on the rate of photocatalytic decoloration of EVdye solutions was investigated. The experimental pH of EVdye solution was fixed as 8.3 and the irradiation time was fixed
as 120 min.
Determination of Chemical Oxygen Demand (COD)
Exactly 50 mL of the sample was taken in a 500 mL round bot-
tom flask with 1 g of mercuric sulfate. Slowly, 5 mL of silversulfate reagent (prepared from 5.5 g silver sulfate per kg inconcentrated sulfuric acid) was added to the solution. Cooling
of the mixture is necessary to avoid possible loss of volatilematters if any, while stirring. Exactly 25 mL of 0.041 M potas-sium dichromate solution was added to the mixture slowly.
The flask was attached to the condenser and 70 mL of silversulfate reagent was added and allowed to reflux for 2 h. Afterrefluxion, the solution was cooled at room temperature. Five
drops of Ferroin indicator was added and titrated against astandard solution of Ferrous Ammonium Sulfate (FAS) untilthe appearance of the first sharp color change from bluishgreen to reddish brown. The COD values can be calculated
in terms of oxygen per liter in milligram (mg O2/l) using thefollowing equation [29].
COD mg O2=l ¼ ðB� AÞ N 8000=S
where B is the milliliter of FAS consumed by K2Cr2O7, A is the
milliliters of FAS consumed by K2Cr2O7 and EV dye mixture,N is the normality of FAS and S the volume of the EV dye.
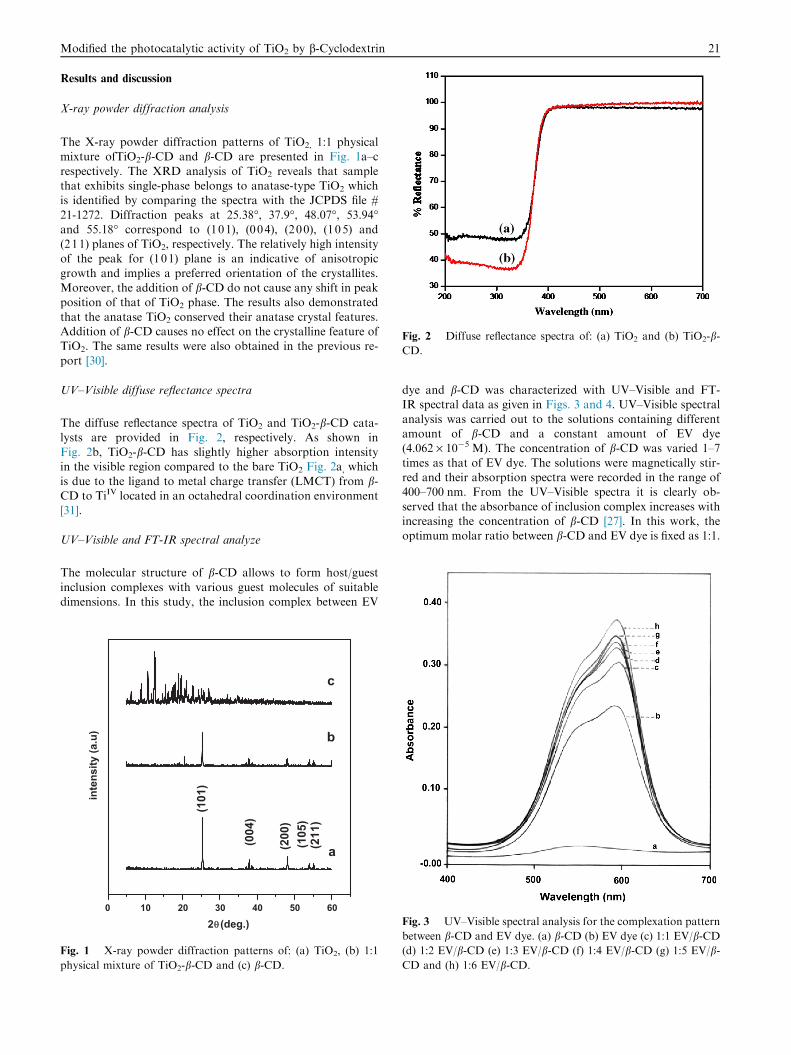
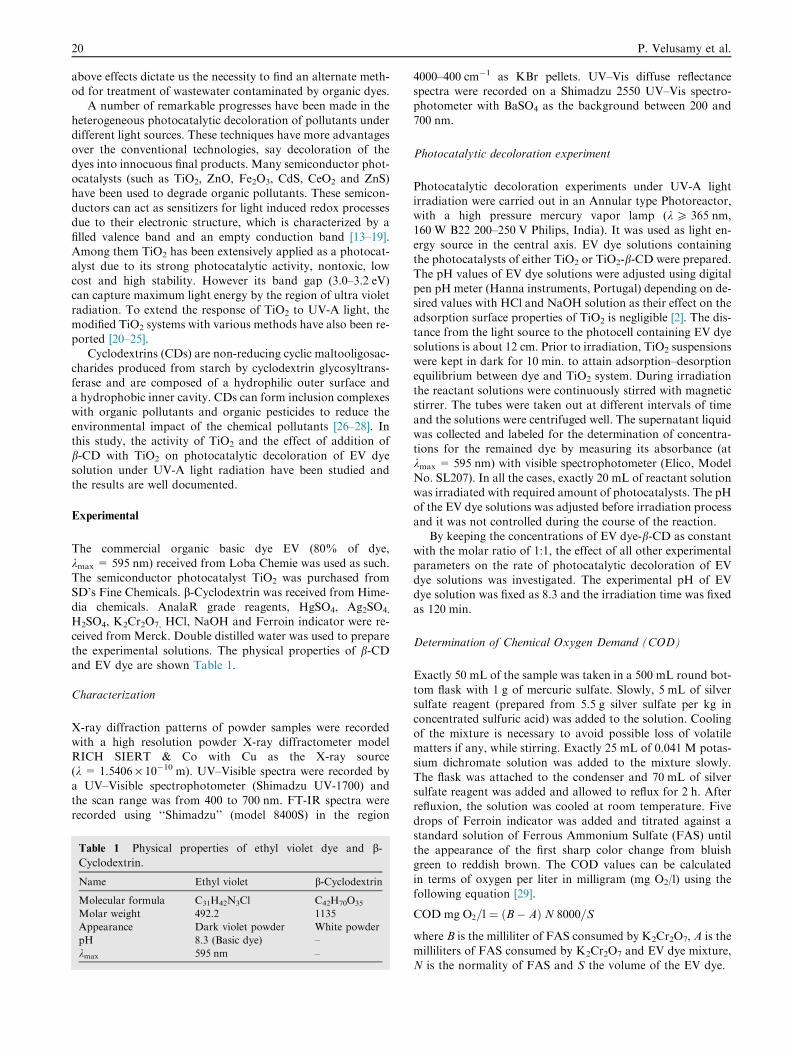
Fig. 2 Diffuse reflectance spectra of: (a) TiO2 and (b) TiO2-b-CD.
Modified the photocatalytic activity of TiO2 by b-Cyclodextrin 21
Results and discussion
X-ray powder diffraction analysis
The X-ray powder diffraction patterns of TiO2, 1:1 physicalmixture ofTiO2-b-CD and b-CD are presented in Fig. 1a–c
respectively. The XRD analysis of TiO2 reveals that samplethat exhibits single-phase belongs to anatase-type TiO2 whichis identified by comparing the spectra with the JCPDS file #
21-1272. Diffraction peaks at 25.38�, 37.9�, 48.07�, 53.94�and 55.18� correspond to (101), (004), (200), (105) and(211) planes of TiO2, respectively. The relatively high intensityof the peak for (101) plane is an indicative of anisotropic
growth and implies a preferred orientation of the crystallites.Moreover, the addition of b-CD do not cause any shift in peakposition of that of TiO2 phase. The results also demonstrated
that the anatase TiO2 conserved their anatase crystal features.Addition of b-CD causes no effect on the crystalline feature ofTiO2. The same results were also obtained in the previous re-
port [30].
UV–Visible diffuse reflectance spectra
The diffuse reflectance spectra of TiO2 and TiO2-b-CD cata-lysts are provided in Fig. 2, respectively. As shown inFig. 2b, TiO2-b-CD has slightly higher absorption intensityin the visible region compared to the bare TiO2 Fig. 2a, which
is due to the ligand to metal charge transfer (LMCT) from b-CD to TiIV located in an octahedral coordination environment[31].
UV–Visible and FT-IR spectral analyze
The molecular structure of b-CD allows to form host/guest
inclusion complexes with various guest molecules of suitabledimensions. In this study, the inclusion complex between EV
0 10 20 30 40 50 60
(211
)(1
05)
(200
)
(004
)
(101
)
inte
nsity
(a.u
)
2θ (deg.)
a
b
c
Fig. 1 X-ray powder diffraction patterns of: (a) TiO2, (b) 1:1
physical mixture of TiO2-b-CD and (c) b-CD.
dye and b-CD was characterized with UV–Visible and FT-IR spectral data as given in Figs. 3 and 4. UV–Visible spectral
analysis was carried out to the solutions containing differentamount of b-CD and a constant amount of EV dye(4.062 · 10�5 M). The concentration of b-CD was varied 1–7
times as that of EV dye. The solutions were magnetically stir-red and their absorption spectra were recorded in the range of400–700 nm. From the UV–Visible spectra it is clearly ob-
served that the absorbance of inclusion complex increases withincreasing the concentration of b-CD [27]. In this work, theoptimum molar ratio between b-CD and EV dye is fixed as 1:1.
Fig. 3 UV–Visible spectral analysis for the complexation pattern
between b-CD and EV dye. (a) b-CD (b) EV dye (c) 1:1 EV/b-CD(d) 1:2 EV/b-CD (e) 1:3 EV/b-CD (f) 1:4 EV/b-CD (g) 1:5 EV/b-CD and (h) 1:6 EV/b-CD.
4000 3500 3000 2500 2000 1500 1000 500
d
c
b
a%
Tra
nsm
itta
nce
Wavenumber (cm-1)
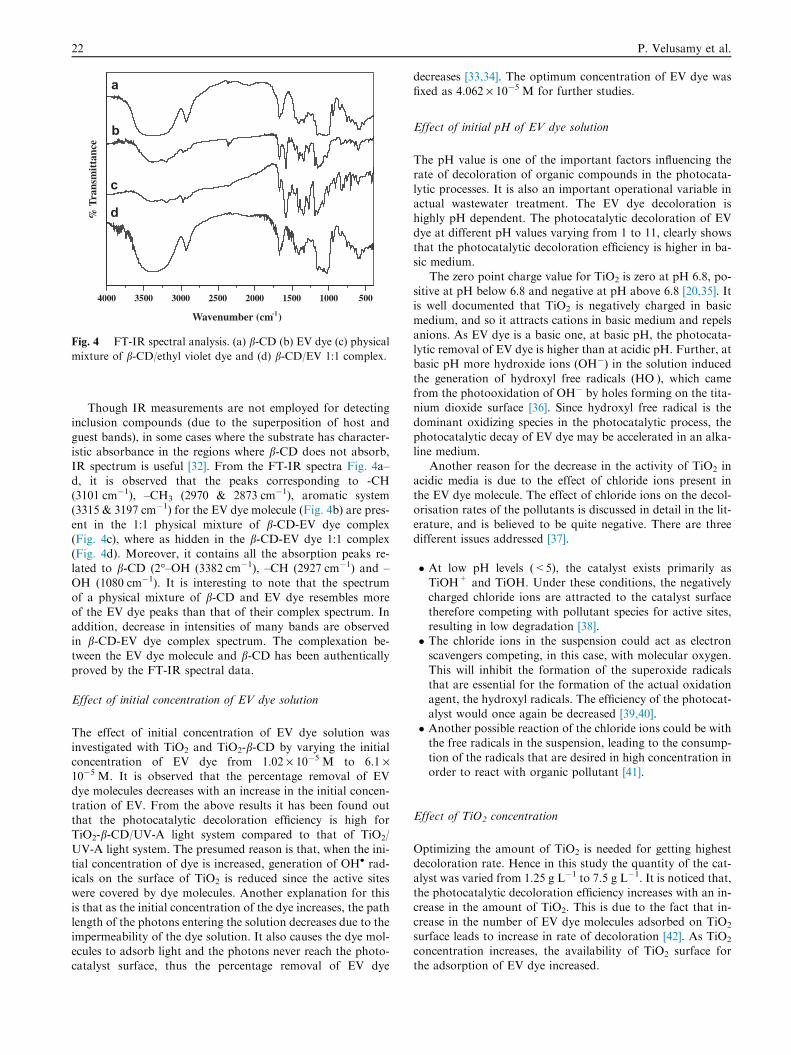
Fig. 4 FT-IR spectral analysis. (a) b-CD (b) EV dye (c) physical
mixture of b-CD/ethyl violet dye and (d) b-CD/EV 1:1 complex.
22 P. Velusamy et al.
Though IR measurements are not employed for detectinginclusion compounds (due to the superposition of host and
guest bands), in some cases where the substrate has character-istic absorbance in the regions where b-CD does not absorb,IR spectrum is useful [32]. From the FT-IR spectra Fig. 4a–
d, it is observed that the peaks corresponding to -CH(3101 cm�1), –CH3 (2970 & 2873 cm�1), aromatic system(3315 & 3197 cm�1) for the EV dye molecule (Fig. 4b) are pres-
ent in the 1:1 physical mixture of b-CD-EV dye complex(Fig. 4c), where as hidden in the b-CD-EV dye 1:1 complex(Fig. 4d). Moreover, it contains all the absorption peaks re-lated to b-CD (2�–OH (3382 cm�1), –CH (2927 cm�1) and –
OH (1080 cm�1). It is interesting to note that the spectrumof a physical mixture of b-CD and EV dye resembles moreof the EV dye peaks than that of their complex spectrum. In
addition, decrease in intensities of many bands are observedin b-CD-EV dye complex spectrum. The complexation be-tween the EV dye molecule and b-CD has been authentically
proved by the FT-IR spectral data.
Effect of initial concentration of EV dye solution
The effect of initial concentration of EV dye solution wasinvestigated with TiO2 and TiO2-b-CD by varying the initialconcentration of EV dye from 1.02 · 10�5 M to 6.1 ·10�5 M. It is observed that the percentage removal of EV
dye molecules decreases with an increase in the initial concen-tration of EV. From the above results it has been found outthat the photocatalytic decoloration efficiency is high for
TiO2-b-CD/UV-A light system compared to that of TiO2/UV-A light system. The presumed reason is that, when the ini-tial concentration of dye is increased, generation of OH� rad-
icals on the surface of TiO2 is reduced since the active siteswere covered by dye molecules. Another explanation for thisis that as the initial concentration of the dye increases, the path
length of the photons entering the solution decreases due to theimpermeability of the dye solution. It also causes the dye mol-ecules to adsorb light and the photons never reach the photo-catalyst surface, thus the percentage removal of EV dye
decreases [33,34]. The optimum concentration of EV dye wasfixed as 4.062 · 10�5 M for further studies.
Effect of initial pH of EV dye solution
The pH value is one of the important factors influencing therate of decoloration of organic compounds in the photocata-
lytic processes. It is also an important operational variable inactual wastewater treatment. The EV dye decoloration ishighly pH dependent. The photocatalytic decoloration of EV
dye at different pH values varying from 1 to 11, clearly showsthat the photocatalytic decoloration efficiency is higher in ba-sic medium.
The zero point charge value for TiO2 is zero at pH 6.8, po-sitive at pH below 6.8 and negative at pH above 6.8 [20,35]. Itis well documented that TiO2 is negatively charged in basicmedium, and so it attracts cations in basic medium and repels
anions. As EV dye is a basic one, at basic pH, the photocata-lytic removal of EV dye is higher than at acidic pH. Further, atbasic pH more hydroxide ions (OH�) in the solution induced
the generation of hydroxyl free radicals (HO�), which camefrom the photooxidation of OH� by holes forming on the tita-nium dioxide surface [36]. Since hydroxyl free radical is the
dominant oxidizing species in the photocatalytic process, thephotocatalytic decay of EV dye may be accelerated in an alka-line medium.
Another reason for the decrease in the activity of TiO2 in
acidic media is due to the effect of chloride ions present inthe EV dye molecule. The effect of chloride ions on the decol-orisation rates of the pollutants is discussed in detail in the lit-
erature, and is believed to be quite negative. There are threedifferent issues addressed [37].
� At low pH levels (<5), the catalyst exists primarily asTiOH+ and TiOH. Under these conditions, the negativelycharged chloride ions are attracted to the catalyst surface
therefore competing with pollutant species for active sites,resulting in low degradation [38].� The chloride ions in the suspension could act as electronscavengers competing, in this case, with molecular oxygen.
This will inhibit the formation of the superoxide radicalsthat are essential for the formation of the actual oxidationagent, the hydroxyl radicals. The efficiency of the photocat-
alyst would once again be decreased [39,40].� Another possible reaction of the chloride ions could be withthe free radicals in the suspension, leading to the consump-
tion of the radicals that are desired in high concentration inorder to react with organic pollutant [41].
Effect of TiO2 concentration
Optimizing the amount of TiO2 is needed for getting highestdecoloration rate. Hence in this study the quantity of the cat-
alyst was varied from 1.25 g L�1 to 7.5 g L�1. It is noticed that,the photocatalytic decoloration efficiency increases with an in-crease in the amount of TiO2. This is due to the fact that in-
crease in the number of EV dye molecules adsorbed on TiO2
surface leads to increase in rate of decoloration [42]. As TiO2
concentration increases, the availability of TiO2 surface for
the adsorption of EV dye increased.
Modified the photocatalytic activity of TiO2 by b-Cyclodextrin 23
Effect of illumination time
Illumination time plays an important role in the decolorationprocess of the pollutants from wastewater. The illuminationtime was varied from 30 min to 180 min. It is interesting to
note here that the remaining EV dye concentration is de-creased with an increase in illumination time. It is observedthat nearly 96.5% decoloration of EV dye solution is achievedwithin 180 min.
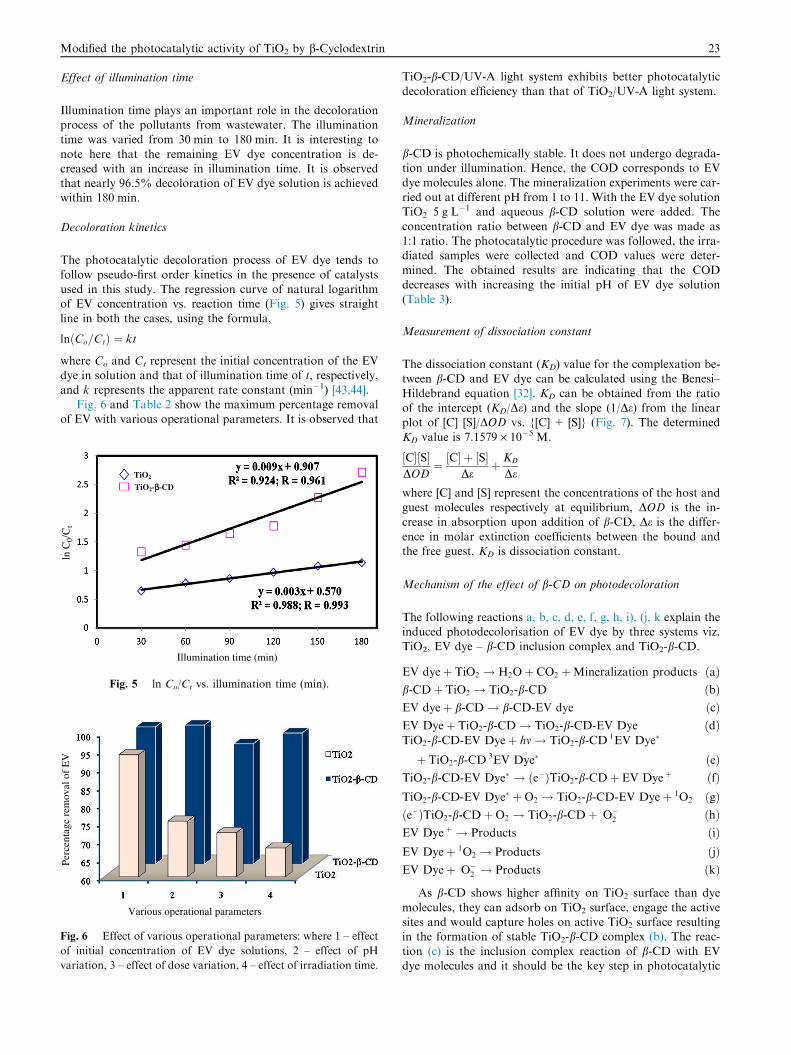
Decoloration kinetics
The photocatalytic decoloration process of EV dye tends to
follow pseudo-first order kinetics in the presence of catalystsused in this study. The regression curve of natural logarithmof EV concentration vs. reaction time (Fig. 5) gives straight
line in both the cases, using the formula,
lnðCo=CtÞ ¼ kt
where Co and Ct represent the initial concentration of the EVdye in solution and that of illumination time of t, respectively,
and k represents the apparent rate constant (min�1) [43,44].Fig. 6 and Table 2 show the maximum percentage removal
of EV with various operational parameters. It is observed that
Illumination time (min)
ln C
0/C
t
TiO2
TiO2-ββ-CD
Fig. 5 ln Co/Ct vs. illumination time (min).
Various operational parameters
Perc
enta
ge r
emov
al o
f E
V
Fig. 6 Effect of various operational parameters: where 1 – effect
of initial concentration of EV dye solutions, 2 – effect of pH
variation, 3 – effect of dose variation, 4 – effect of irradiation time.
TiO2-b-CD/UV-A light system exhibits better photocatalyticdecoloration efficiency than that of TiO2/UV-A light system.
Mineralization
b-CD is photochemically stable. It does not undergo degrada-tion under illumination. Hence, the COD corresponds to EV
dye molecules alone. The mineralization experiments were car-ried out at different pH from 1 to 11. With the EV dye solutionTiO2 5 g L�1 and aqueous b-CD solution were added. The
concentration ratio between b-CD and EV dye was made as1:1 ratio. The photocatalytic procedure was followed, the irra-diated samples were collected and COD values were deter-
mined. The obtained results are indicating that the CODdecreases with increasing the initial pH of EV dye solution(Table 3).
Measurement of dissociation constant
The dissociation constant (KD) value for the complexation be-tween b-CD and EV dye can be calculated using the Benesi–
Hildebrand equation [32]. KD can be obtained from the ratioof the intercept (KD/De) and the slope (1/De) from the linearplot of [C] [S]/DOD vs. {[C] + [S]} (Fig. 7). The determined
KD value is 7.1579 · 10�5 M.
½C�½S�DOD
¼ ½C� þ ½S�De
þ KD
De
where [C] and [S] represent the concentrations of the host andguest molecules respectively at equilibrium, DOD is the in-crease in absorption upon addition of b-CD, De is the differ-
ence in molar extinction coefficients between the bound andthe free guest, KD is dissociation constant.
Mechanism of the effect of b-CD on photodecoloration
The following reactions a, b, c, d, e, f, g, h, i), (j, k explain theinduced photodecolorisation of EV dye by three systems viz.
TiO2, EV dye – b-CD inclusion complex and TiO2-b-CD.
EV dyeþ TiO2 ! H2Oþ CO2 þMineralization products ðaÞb-CDþ TiO2 ! TiO2-b-CD ðbÞEV dyeþ b-CD! b-CD-EV dye ðcÞEV Dyeþ TiO2-b-CD! TiO2-b-CD-EV Dye ðdÞTiO2-b-CD-EV Dyeþ hm! TiO2-b-CD
�1EV Dye�
þ TiO2-b-CD�3EV Dye� ðeÞ
TiO2-b-CD-EV Dye� ! ðe�ÞTiO2-b-CDþ EV Dye�þ ðfÞTiO2-b-CD-EV Dye� þO2 ! TiO2-b-CD-EV Dyeþ 1O2 ðgÞðe�ÞTiO2-b-CDþO2 ! TiO2-b-CDþ �O�2 ðhÞEV Dye�þ ! Products ðiÞEV Dyeþ 1O2 ! Products ðjÞEV Dyeþ �O�2 ! Products ðkÞ
As b-CD shows higher affinity on TiO2 surface than dye
molecules, they can adsorb on TiO2 surface, engage the activesites and would capture holes on active TiO2 surface resultingin the formation of stable TiO2-b-CD complex (b). The reac-
tion (c) is the inclusion complex reaction of b-CD with EVdye molecules and it should be the key step in photocatalytic
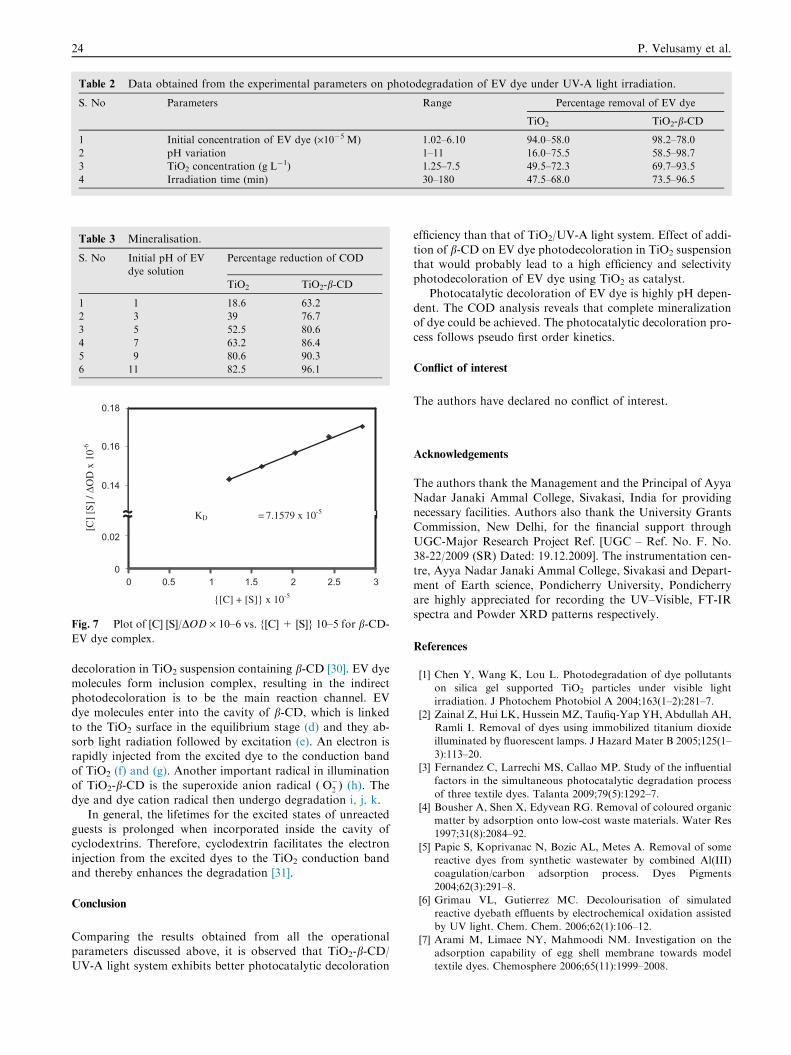
Table 2 Data obtained from the experimental parameters on photodegradation of EV dye under UV-A light irradiation.
S. No Parameters Range Percentage removal of EV dye
TiO2 TiO2-b-CD
1 Initial concentration of EV dye (·10�5 M) 1.02–6.10 94.0–58.0 98.2–78.0
2 pH variation 1–11 16.0–75.5 58.5–98.7
3 TiO2 concentration (g L�1) 1.25–7.5 49.5–72.3 69.7–93.5
4 Irradiation time (min) 30–180 47.5–68.0 73.5–96.5
Table 3 Mineralisation.
S. No Initial pH of EV
dye solution
Percentage reduction of COD
TiO2 TiO2-b-CD
1 1 18.6 63.2
2 3 39 76.7
3 5 52.5 80.6
4 7 63.2 86.4
5 9 80.6 90.3
6 11 82.5 96.1
{[C] + [S]} x 10-5
[C]
[S]
/ ΔO
D x
10-6
0.14
0.16
0.18
0
0.02
0 0.5 1 1.5 2 2.5 3
KD = 7.1579 x 10⁻⁵
Fig. 7 Plot of [C] [S]/DOD · 10–6 vs. {[C] + [S]} 10–5 for b-CD-
EV dye complex.
24 P. Velusamy et al.
decoloration in TiO2 suspension containing b-CD [30]. EV dyemolecules form inclusion complex, resulting in the indirectphotodecoloration is to be the main reaction channel. EVdye molecules enter into the cavity of b-CD, which is linked
to the TiO2 surface in the equilibrium stage (d) and they ab-sorb light radiation followed by excitation (e). An electron israpidly injected from the excited dye to the conduction band
of TiO2 (f) and (g). Another important radical in illuminationof TiO2-b-CD is the superoxide anion radical (�O�2 ) (h). Thedye and dye cation radical then undergo degradation i, j, k.
In general, the lifetimes for the excited states of unreactedguests is prolonged when incorporated inside the cavity ofcyclodextrins. Therefore, cyclodextrin facilitates the electron
injection from the excited dyes to the TiO2 conduction bandand thereby enhances the degradation [31].
Conclusion
Comparing the results obtained from all the operationalparameters discussed above, it is observed that TiO2-b-CD/UV-A light system exhibits better photocatalytic decoloration
efficiency than that of TiO2/UV-A light system. Effect of addi-
tion of b-CD on EV dye photodecoloration in TiO2 suspensionthat would probably lead to a high efficiency and selectivityphotodecoloration of EV dye using TiO2 as catalyst.
Photocatalytic decoloration of EV dye is highly pH depen-dent. The COD analysis reveals that complete mineralizationof dye could be achieved. The photocatalytic decoloration pro-
cess follows pseudo first order kinetics.
Conflict of interest
The authors have declared no conflict of interest.
Acknowledgements
The authors thank the Management and the Principal of Ayya
Nadar Janaki Ammal College, Sivakasi, India for providingnecessary facilities. Authors also thank the University GrantsCommission, New Delhi, for the financial support through
UGC-Major Research Project Ref. [UGC – Ref. No. F. No.38-22/2009 (SR) Dated: 19.12.2009]. The instrumentation cen-tre, Ayya Nadar Janaki Ammal College, Sivakasi and Depart-
ment of Earth science, Pondicherry University, Pondicherryare highly appreciated for recording the UV–Visible, FT-IRspectra and Powder XRD patterns respectively.
References
[1] Chen Y, Wang K, Lou L. Photodegradation of dye pollutants
on silica gel supported TiO2 particles under visible light
irradiation. J Photochem Photobiol A 2004;163(1–2):281–7.
[2] Zainal Z, Hui LK, Hussein MZ, Taufiq-Yap YH, Abdullah AH,
Ramli I. Removal of dyes using immobilized titanium dioxide
illuminated by fluorescent lamps. J Hazard Mater B 2005;125(1–
3):113–20.
[3] Fernandez C, Larrechi MS, Callao MP. Study of the influential
factors in the simultaneous photocatalytic degradation process
of three textile dyes. Talanta 2009;79(5):1292–7.
[4] Bousher A, Shen X, Edyvean RG. Removal of coloured organic
matter by adsorption onto low-cost waste materials. Water Res
1997;31(8):2084–92.
[5] Papic S, Koprivanac N, Bozic AL, Metes A. Removal of some
reactive dyes from synthetic wastewater by combined Al(III)
coagulation/carbon adsorption process. Dyes Pigments
2004;62(3):291–8.
[6] Grimau VL, Gutierrez MC. Decolourisation of simulated
reactive dyebath effluents by electrochemical oxidation assisted
by UV light. Chem. Chem. 2006;62(1):106–12.
[7] Arami M, Limaee NY, Mahmoodi NM. Investigation on the
adsorption capability of egg shell membrane towards model
textile dyes. Chemosphere 2006;65(11):1999–2008.
Modified the photocatalytic activity of TiO2 by b-Cyclodextrin 25
[8] Nunez L, Hortal JAG, Torrades F. Study of kinetic parameters
related to the decolourization and mineralization of reactive
dyes from textile dyeing using Fenton and photo-Fenton
processes. Dyes Pigments 2007;75(3):647–52.
[9] Monteagudo JM, Duran A, Almodovar CL. Homogeneous
ferrioxalate-assisted solar photo-Fenton degradation of Orange
II aqueous solutions. Appl Catal B: Environ 2008;83(1–2):46–55.
[10] Gomez V, Larrechi MS, Callao MP. Kinetic and adsorption
study of acid dye removal using activated carbon. Chemosphere
2007;69(7):1151–8.
[11] Prado AGS, Costa LL. Photocatalytic decouloration of
malachite green dye by application of TiO2 nanotubes. J
Hazard Mater 2009;169(1–3):297–301.
[12] Mozia S, Morawski AW, Toyoda M, Tsumura T. Integration of
photocatalysis and membrane distillation for removal of mono-
and poly-azo dyes from water. Desalination 2010;250(2):
666–72.
[13] Sakthivel S, Geissen SU, Bahnemann DW, Murugesan V,
Vogelpohl A. Enhancement of photocatalytic activity by semi-
conductor heterojunctions: a-Fe2O3, WO3 and CdS deposited on
ZnO. J Photochem Photobiol A 2002;148(1–3):283–93.
[14] Ji P, Zhang J, Chen F, Anpo M. Study of adsorption and
degradation of acid orange 7 on the surface of CeO2 under
visible light irradiation. Appl Catal B 2009;85(3–4):148–54.
[15] Arana J, Alonso AP, Rodriguez JMD, Colon G, Navio JA,
Pena JP. FTIR study of photocatalytic degradation of 2-
propanol in gas phase with different TiO2 catalysts. Appl
Catal B 2009;89(1–2):204–13.
[16] Rego E, Marto J, Marcos PS, Labrincha JA. Decolouration of
Orange II solutions by TiO2 and ZnO active layers screen-
printed on ceramic tiles under sunlight irradiation. Appl Catal A
2009;355(1–2):109–14.
[17] He T, Ma H, Zhou Z, Xu W, Ren F, Shi Z, et al. Preparation of
ZnS–Fluoropolymer nanocomposites and its photocatalytic
degradation of methylene blue. J Polym Degrad Stability
2009;94(12):2251–6.
[18] Li J, Ni Y, Liu J, Hong J. Preparation, conversion, and
comparison of the photocatalytic property of Cd(OH)2, CdO,
CdS and CdSe. J Phys Chem Solids 2009;70(9):1285–9.
[19] Krishnakumar B, Swaminathan M. Solar photocatalytic
degradation of Acid Black 1 with ZnO. Indian J Chem
2010;49A(8):1035–40.
[20] Sobana N, Selvam K, Swaminathan M. Optimization of
photocatalytic degradation conditions of Direct Red 23
using nano-Ag doped TiO2. Sep Purif Technol 2008;62(3):
648–53.
[21] Song S, Tu J, Xu L, Xu X, He Z, Qiu J, et al. Preparation of a
titanium dioxide photocatalyst codoped with cerium and iodine
and its performance in the degradation of oxalic acid.
Chemosphere 2008;73(9):1401–6.
[22] Silva AMT, Silva CG, Drazic G, Faria JL. Ce-doped TiO2 for
photocatalytic degradation of chlorophenol. Catal Today
2009;144(1–2):13–8.
[23] Mahyar A, Behnajady MA, Modirshahla N. Characterization
and photocatalytic activity of SiO2–TiO2 mixed oxide
nanoparticles prepared by sol–gel method. Indian J Chem
2010;49A(12):1593–600.
[24] Batista APL, Carvalho HWP, Luz GHP, Martins PFQ,
Goncalves M, Oliveira LCA. Preparation of CuO/SiO2 and
photocatalytic activity by degradation of methylene blue.
Environ Chem Lett 2010;8(1):63–7.
[25] Bansal P, Dhir A, Prakash NT, Sud D. Environmental
remediation of wastewater containing azo dyes with a hetero-
structured nanophotocatalyst. Indian J Chem
2011;50A(7):991–5.
[26] Lu P, Wu F, Deng N. Enhancement of TiO2 photocatalytic
redox ability by b-cyclodextrin in suspended solutions. Appl
Catal B 2004;53(2):87–93.
[27] Wang G, Wu F, Zhang X, Luo M, Deng N. Enhanced TiO2
photocatalytic degradation of bisphenol A by b-Cyclodextrin in
suspended solutions. J Photochem Photobiol A 2006;179(1–
2):49–56.
[28] Velusamy P, Rajalakshmi S, Pitchaimuthu S, Kannan N.
Photodecolouration of organic dyes on b-Cyclodextrin modified
ZnO as catalyst. Indian J Environ Protect 2011;31(10):801–10.
[29] Alhakimi G, Studnicki LH, Al-Ghazali M. Photocatalytic
destruction of potassium hydrogen phthalate using TiO2 and
sunlight: application for the treatment of industrial wastewater.
J Photochem Photobiol A 2003;154(2–3):219–28.
[30] Zhang X, Wu F, Wang Z, Guo Y, Deng N. Photocatalytic
degradation of 4,40-biphenol in TiO2 suspension in the presence
of cyclodextrins: a trinity integrated mechanism. J Mol Catal A
2009;301(1–2):134–9.
[31] Zhang X, Wu F, Deng N. Efficient photodegradation of dyes
using light-induced self assembly TiO2/b-Cyclodextrin hybrid
nanoparticles under visible light irradiation. J Hazard Mater
2011;185:117–23.
[32] Pitchumani K, Velusamy P, Srinivasan C. Selectivity in sodium
borohydride reduction of coumarin encapsulated in b-Cyclodextrin. Tetrahedron 1994;50(45):12979–88.
[33] Daneshvar N, Salari D, Khataee AR. Photocatalytic
degradation of azo dye acid red 14 in water: investigation of
the effect of operational parameters. J Photochem Photobiol A
2003;157(1):111–6.
[34] Song YL, Li JT, Bai B. TiO2-assisted photodegradation of direct
blue 78 in Aqueous solution in sunlight. Water Air Soil Pollut
2010;213(1–4):311–7.
[35] Poulios I, Tsachpinis I. Photodegradation of the textile dye
reactive Black 5 in the presence of semiconducting oxides. J
Chem Technol Biotechnol 1999;74:349–57.
[36] Kaneco S, Rahman MA, Suzuki T, Katsumata H, Ohta K.
Optimization of solar photocatalytic degradation conditions of
bisphenol A in water using titanium dioxide. J Photochem
Photobiol A 2004;163(3):419–24.
[37] Alhakimi G, Gebril S, Studnicki LH. Comparative
photocatalytic degradation using natural and artificial UV-
light of 4-chlorophenol as a representative compound in refinery
wastewater. J Photochem Photobiol A 2003;157(1):103–9.
[38] Wang K, Hsieh YH, Chou MY, Chang CY. Photocatalytic
degradation of 2-chloro and 2-nitrophenol by titanium dioxide
suspensions in aqueous solution. Appl Catal B 1999;21(1):1–8.
[39] Auguliaro V, Plamisano L, Schiavello M, Scalafani A.
Photocatalytic degradation of nitrophenols in aqueous
titanium dioxide dispersion. Appl Catal 1991;69(1):323–40.
[40] Tseng JM, Huang CP. Removal of chlorophenols from water by
photocatalytic oxidation. Water Sci Technol 1991;
23(1–3):377–87.
[41] Abdulah M, Low GK, Matthews RW. Effects of common
inorganic anions on rates of photocatalytic oxidation of organic
carbon over illuminated titanium dioxide. J Phys Chem
1990;94(17):6820–5.
[42] Chen CY. Photocatalytic Degradation of Azo Dye Reactive
Orange 16 by TiO2. Water Air Soil Pollut 2009;202(1–4):335–42.
[43] Chun H, Yizhong W, Hongxiao T. Preparation and
characterization of surface bond-conjugated TiO2/SiO2 and
photocatalysis for azo dyes. Appl Catal B 2001;30(3–4):277–85.
[44] Zertal A, Gabor DM, Malouki MA, Sehili T, Boule P.
Photocatalytic transformation of 4-chloro-2-
methylphenoxyacetic acid (MCPA) on several kinds of TiO2.
Appl Catal B 2004;49(2):83–9.
Recommended


![ECOSYS M2530dn ECOSYS M2535dn - Kyoceradownloads.kyoceradocumentsolutions.com.au/Documentation... · ECOSYS M2530dn ECOSYS M2535dn. i ... Print all at once [Batch Print] ... 2 Eviter](https://img.pdfslide.us/doc/110x75/5adf88647f8b9afd1a8cd1d4/ecosys-m2530dn-ecosys-m2535dn-m2530dn-ecosys-m2535dn-i-print-all-at-once.jpg)