Wat. Res. Vol. 35, No. 17, pp. 4111–4125, 2001r 2001 Elsevier Science Ltd. All rights reserved
Printed in Great Britain0043-1354/01/$ - see front matterPII: S0043-1354(01)00156-7
MODELING DESCRIPTION AND SPECTROSCOPIC
EVIDENCE OF SURFACE ACID–BASE PROPERTIES OF
NATURAL ILLITES
WENXIN LIU*
SKLEAC, Research Center for Eco-Environmental Sciences, Academy Sinica, Beijing 100085, China
(First received 3 August 2000; accepted in revised form 21 March 2001)
AbstractFThe acid–base properties of natural illites from different areas were studied by potentiometrictitrations. The acidimetric supernatant was regarded as the system blank to calculate the surface siteconcentration due to consideration of substrate dissolution during the prolonged acidic titration. Thefollowing surface complexation model could give a good interpretation of the surface acid–base reactionsof the aqueous illites:
> SOH2 > SO@þHþ; pK inta ¼ 3:73B4:06;
Al3þþH4SiO4þ2H2O2AlðOHÞ2ðOSiðOHÞ3Þ þ 3Hþ; pKf2¼ 9:85B10:71;
> SOHþAl3þþH4SiO42> SOAlðOSiðOHÞ3Þþþ2Hþ;pKSC¼ 3:31B3:40:
Both experimental and optimized data revealed some similarities in the acid–base behaviors of the differentillites. Based on matching results with the standard XRD patterns, the changes in intensities of thediagnostic 0 0 l diffraction lines indicated that the formation of surface Al–Si complexes or precipitatesappeared preferable to the bulk deposition of Al(OH)3 solid. Similar features were also reflected in themicroscopic Raman spectra, where the vibrational peaks of Si–O and Al–O bonds diminished followingacid attack, then rose again after hydroxide back titration. The varied ratio of signal intensity betweenIVAl and VIAl species present in 27Al MAS NMR spectra, together with the nearly stable BET surfaceareas after acidic titration, showed that the basal planes in the layer structure of natural illite contributedto the dissociation of structural components as well as the edge faces. The combined spectroscopicevidence plus the acid–base titration results suggested that the interactions of illite surface sites with silicicacid and aluminum species, released from illite substrate, should be considered in the modelingdescription. r 2001 Elsevier Science Ltd. All rights reserved
Key wordsFnatural illites, acid–base titration, surface complexation model, spectroscopic evidence
INTRODUCTION
Dissolution, complexation and precipitation arefundamental processes for governing weathering
and (neo)formation of clay minerals, and alsodramatically affect the reactivity and mobility ofvarious contaminants through the geosphere (Nagy,1995). Acid treatment is a common means to modify
the surface/catalytic properties of clay minerals viaactivation of surface sites, and therefore has mis-cellaneous applications in industry (Komadel et al.,
1990, 1996; Tkac et al., 1994). Since the aforemen-tioned reactions generally occur in the region of thesolid/aqueous interface, numerous studies have been
performed in the relevant aspects, e.g., mechanisticinterpretation, model refinement and simulationstrategy (Katz and Hayes, 1995; Hiemstra and Van
Riemsdijk, 1996; Borkovec, 1997; Lutzenkirchen,
1998). The corresponding techniques for identifyingthe reaction products have been greatly developed aswell (McGuire et al., 1999).
Key components, present during liberation andformation of natural aluminosilicates in aquaticenvironments, usually include various hydrolyzedaluminum species, silicic acid, as well as their
productFhydrous aluminosilicates (HAS). SolubleAl–Si complexes may be intermediates to activatedcomplexes generated on the surface of minerals, and
control the formation of metastable and new, stableminerals (Browne and Driscoll, 1992). Therefore, thepresence of silicic acid can evidently influence the
distribution of aluminum species in acidic environ-ments, in terms of low-order soluble Al–Si complexes(Browne and Driscoll, 1992), multinuclear HAS
(Farmer and Lumsdon, 1994), and colloidal pre-cipitates (Fitzgerald et al., 1992).*E-mail: [email protected]
4111
As to the formation mechanism of soluble HAS
species, investigators have proposed several plausiblepathways: (1) Al species could combine with (ortho)silicic acids via condensation reactions between thealuminol and silanol groups; (2) silicic acid could
inhibit the nucleation of solid Al(OH)3 at growthsites on Al(OH)3 lattices (Exley and Birchall, 1993);(3) substitution of silicic acid for the water molecule
mass in the inner-coordination sphere of the hexa-aqua aluminum species (Browne and Driscoll, 1992);and (4) aluminates, converted from hexa-aqua Al by
addition of hydroxide, were inserted into oligomericor low molecular weight silicates to generate poly-meric aluminosilicates (Fitzgerald et al., 1997). In
addition, the structural and interfacial properties ofsynthetic amorphous aluminosilicates in electrolytesolution seemed to be similar to those of (hydrous)feldspathoids and poorly ordered aluminosilicate
catalysts with Si–O–Al@ groups and hydroxylatedsurface groups (Avena and De Pauli, 1996). By using29Si/27Al NMR as well as differential thermal analysis
and thermogravimetry (DTA–TG), a recent reporthas shown that the coexisting anions, such as sulfate,chloride and nitrate, influenced the interaction
between silicic acid and aluminum ions, andsuggested a montmorillonite-like structure for thesynthetic amorphous aluminosilicates (Miyazaki and
Yokoyama, 1999). These results are in agreementwith the fact that reconstitution of acid-leached clayminerals by treating with basic solutions results in amica-like structure (Nagy, 1995).
Since the natural particles, present as a matrix or acomponent, usually participate in various surfacereactions in aquatic medium, their effects on species
distribution should be taken into account in therelevant process. Bouallou et al. (1998) demonstratedthat the presence of highly charged Al13 polymeric
cations within pH 5.5B6.0 could trigger a series ofreactions: (1) inclusion of IVAl into the silica frame-work; (2) production of surface-coordinated octahe-dral VIAl; and (3) polymerization of some
heterogeneous complexes, leading to the formationof a metastable or amorphous Al–Si dispersed solidphase.
To date, potentiometric titration is still a mainapproach to study the surface acid–base chemistry ofclay minerals. Some papers have shown that dissolu-
tion of solid substrate, as well as the subsequentsurface complexation or precipitation, exerted aneffect upon the surface acid–base behaviors of clay
minerals, especially on the quantitative evaluation ofproton consumption using the back titration data(Lu and Smith, 1996). Consequently, the criticalinteractions between soluble aluminum species and
silicic acid, originated from substrate dissolution,should not be neglected.Natural illite with petrologic significance is a major
constituent of clay minerals in the Earth’s crust, andhas been the subject of a variety of investigations (Duet al., 1997; Sinitsyn et al., 2000; Kulik et al., 2000).
However, due to the distinctions in sample impurity,
pretreatment, experimental condition and modelassumption, reported data and conclusions on sur-face reactions may differ from case to case. It isunclear whether or not the minor impurities fre-
quently occurred in natural samples sufficientlyinfluence the surface charge nature of the multi-phase natural illites (Sinitsyn et al., 2000). Thus,
current knowledge is still deficient with respect to thecomplexity in crystal structure and chemical compo-sition of these naturally occurring particles in the
form of isomorphic replacement, mixed-layereddisorder. Furthermore, direct observations on thecorresponding alterations of illite surface character-
istics caused by acid–base titration as well asidentification of the produced surface complexes orprecipitates is also desirable. Use of combinedspectroscopic techniques may provide consistent
and complementary evidence not only for yieldinginsights into microscopic aspects of surface com-plexation reactions, but also for resolving some
ambiguities in spectral signal assignments, whichare usually encountered when using a single method.In the present paper, the main objectives are to
further extend the understanding of the surface acid–base chemistry of illitic materials, by comparison ofnatural samples collected from different sources, and
to validate the presumed reactions, which wereincorporated into the surface complexation model(SCM) for describing the acid–base behaviors, by thedirect spectroscopic evidence at the molecular level.
EXPERIMENTAL
Materials
The natural illites were obtained from: (1) WeiChang(WC) in northern China; and (2) LiuPanShui (LPS) insouthern China. Both initial samples were ground andsieved to less than 53 mm fractions. For other chemicals inour experiments, diluted HNO3 was standardized againsttris(hydroxymethyl) aminomethane (THAM). NaOH solu-tion was made by dissolving pure solid sodium hydroxide inboiled de-ionized water, and standardized using an acidsolution of known concentration. No further specificpretreatment, such as removal of carbonates, organic matterand iron oxides coatings (Sinitsyn et al., 2000), wereconducted in the present study. Thereafter, the followingsolid samples were individually prepared:
Hydrated samples. A 20 g l@1 stock suspension withoutbackground electrolyte was equilibrated in a refrigerator(41C) for at least 2 weeks prior to the titration experiments.Then, for each illite, an aliquot of 10 g l@1 suspension(diluted from the stock solution with de-ionized water) wascentrifuged at 20,000 rpm, 101C for 30min. Afterwards, theseparated solid phase was dried at 601C for 12 h and groundto a powder.
Titrated samples. The back titration procedure includedtwo sequential steps, i.e., acidimetric and alkalimetrictitrations. The sample suspension was firstly acidified toaround pH 3, then back titrated with hydroxide to thealkaline region (Du et al., 1997; Sinitsyn et al., 2000). Thepotentiometric titration was implemented at 25.070.51C(oil thermostat) by an automatic system for precise
Wenxin Liu4112
electromotive force (e.m.f., potential in mV), equipped witha standard glass electrode connected with a double junctionAg/AgCl reference electrode. For each illite, 50ml of10 g l@1 suspension was prepared in a fixed 0.1mol l@1
NaNO3 ionic strength. N2 was purged continuously through10% NaOH, 10% H2SO4, de-ionized water and 0.1mol l
@1
NaNO3, then into the suspension to eliminate CO2 until theelectrode potential was stable.(a) Acidimetric samples. Each 10 g l@1 suspension in
0.1M NaNO3 medium was forward titrated in 0.1-mlincrements, using a standard 0.1M HNO3 solution untilthe system pH was below 3. Then, centrifugation anddesiccation were identical to the foregoing hydratedsamples. The supernatants, after acidic titration, wereregarded as the acidimetric supernatants for solubilitydeterminations. The equilibrium concentration of H+ wasderived from the output of the glass electrode, based on theNernst equation.(b) Alkalimetric samples. Based on the prior acidimetric
titration, a successive back titration was performed bydropwise addition in increments of 0.1ml, of a 0.05Mstandard NaOH solution until the pH exceeded 10.Note: this end-point was different from the one adopted inpreparing the alkalimetric samples for spectroscopic in-vestigation (i.e., up to about pH 5.5–6.0, and the final statuswas maintained for 24 h). Subsequently, the solid powderswere prepared according to the same procedure mentionedabove. For acidimetric and alkalimetric samples, no furtherwashing or rinsing step was utilized to avoid possibledisturbance.The time required for equilibrium would usually vary
from system to system, depending on the system conditions.During the whole potentiometric procedure, the definedequilibrium tolerance at solid–water interface after eachaddition of the titrant was that the drift of the measuredpotential should be lower than 1mVh@1 at 251C, andconsecutive purging with pure N2 and magnetic stirringwere employed.Main elemental compositions of the initial solids
(o53 mm) and the acidimetric supernatants were determinedusing inductively coupled plasma-optical emission spectro-metry (ICP-OES, ARL Model 3580). Moreover, thecharacteristic layer spacing in crystal structure and theexternal surface area were measured by X-ray powderdiffraction (Siemens D5000 diffractometer, CuKa radiation)and by the N2/BET method (Micrometrics, ASAP Model2000), respectively. The micrographs of illite samples wereexamined by scanning electron microscope (SEM) (Philips,XL 30).
Spectroscopic measurements
FT-IR. 1mg solid sample was mixed with 100mg KBr(spectroscopic grade, oven-dried at 1101C overnight). Usingthe diffuse reflectance infrared Fourier transform (DRIFT)technique, all spectra were recorded on a Perkin-Elmer FT-IR 2000X spectrometer with a spectral resolution of4 cm@1. 200 scans acquired at a rate of 0.2 cm@1 s@1
were averaged in the wavenumber range 370–4000 cm@1.
Microscopic Raman. A Renishaw 1000 microprobesystem with a CCD detector was used to detect theRaman spectra excited, at room temperature, by aSpectra-Physics Model 127 He–Ne laser (633 nm). Thesample was fixed on the stage of a microscope equipped witha 50� objective lens (Olympus BHSM). Twenty-fiveacquisitions, with a detection time of 8–10 s, were summedat maximum magnification to improve the signal/noiseratio. All spectra, between 100 and 2000 cm@1 at aresolution of 2 cm@1, were calibrated using the 520 cm@1
line of a silicon wafer. For each sample, the spectra obtainedfrom different detection area of the powders werereproducible. Since the spectrometer eliminates the
Rayleigh line close to 150 cm@1, the interpretation ofbands below 200 cm@1 was disregarded due to poorreliability. All spectral manipulation was performed by theGRAMS software package.
X-ray powder diffraction. The illite samples were analyzedon a powder diffractometer operated in the reflection modewith CuKa radiation. Diffraction traces were reproduciblein the region of 51 and 8512y at a scanning rate of [email protected] precision of d-spacing measurement was 0.01 A.
Solid state nuclear magnetic resonance (NMR). Theresonance signals of solid state NMR were obtained atroom temperature by a CMX360 spectrometer (8.45T,Chemagnetics). All samples were separately packed into7mm magic angle spinning (MAS) rotors sealed with endcaps. The resonant frequencies of 29Si and 27Al were 71.508and 93.795MHz, respectively. The p=2 pulse width andinterval for 29Si were 4.5ms and 2 s, respectively, thecorresponding values being 2.4 ms and 2 s for 27Al. Theacquisition time was 68 ms with 25ms delay for 29Si (900–3000 accumulations), and 41ms with 20 ms delay for 27Al(128–1024 accumulations). The spinning rates were 6.0 and7.0 kHz for 29Si and 27Al NMR spectra, respectively.Tetramethylsilane (TMS) was selected as the externalreference for the chemical shift values of 29Si, and 1.0MAl(H2O)6Cl3 solution for that of
27Al. In addition, since thepreliminary test for cross-polarization (CP) with 1H showedno apparent improvement on the signal resolution for 29SiNMR, the CP technique was not adopted for the actualmeasurements.
MODEL HYPOTHESIS AND DATA PROCESSING
Equivalent points (Ve) and standard potential of glasselectrode (E 0)
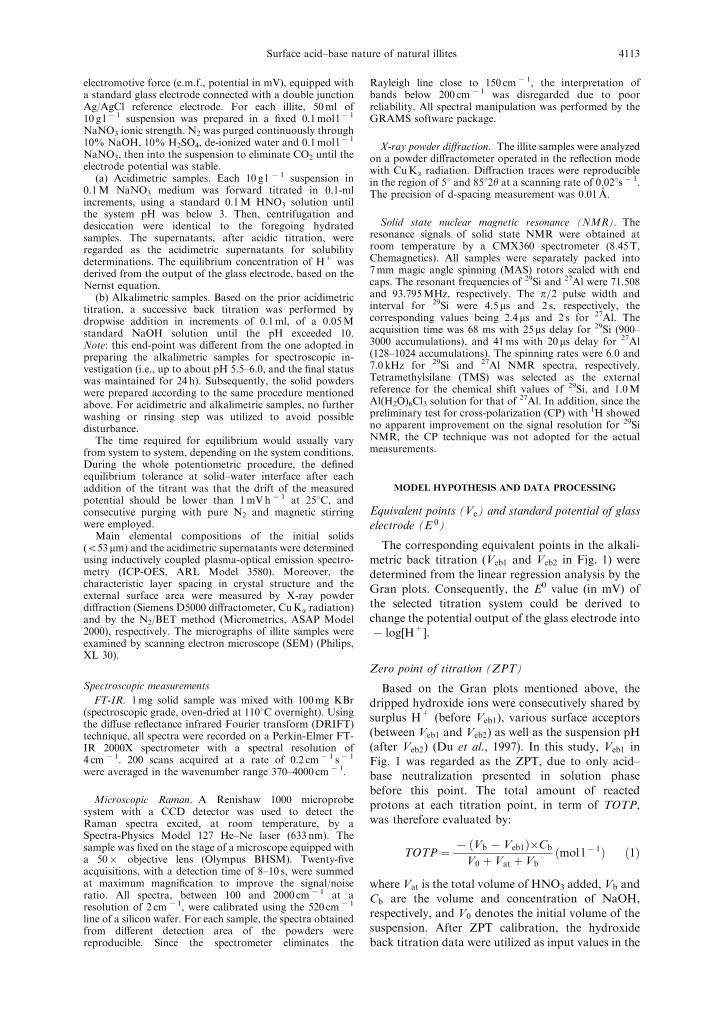
The corresponding equivalent points in the alkali-metric back titration (Veb1 and Veb2 in Fig. 1) were
determined from the linear regression analysis by theGran plots. Consequently, the E0 value (in mV) ofthe selected titration system could be derived to
change the potential output of the glass electrode into@log[H+].
Zero point of titration (ZPT)
Based on the Gran plots mentioned above, thedripped hydroxide ions were consecutively shared bysurplus H+ (before Veb1), various surface acceptors
(between Veb1 and Veb2) as well as the suspension pH(after Veb2) (Du et al., 1997). In this study, Veb1 inFig. 1 was regarded as the ZPT, due to only acid–base neutralization presented in solution phase
before this point. The total amount of reactedprotons at each titration point, in term of TOTP,was therefore evaluated by:
TOTP ¼ @ Vb@Veb1ð Þ�CbV0 þ Vat þ Vb
ðmol l@1Þ ð1Þ
where Vat is the total volume of HNO3 added, Vb andCb are the volume and concentration of NaOH,
respectively, and V0 denotes the initial volume of thesuspension. After ZPT calibration, the hydroxideback titration data were utilized as input values in the
Surface acid–base nature of natural illites 4113
stoichiometric matrix for optimization by the FI-
TEQL program (Westall, 1982).
Model hypothesis
A general description of interfacial reactions
should include ion-exchange and surface complexa-tion occurred at weakly acidic surface sites (>XH)and amphoteric surface sites (>SOH), respectively.
However, a recent report has indicated that, a highand constant ionic strength (I) makes the constantcapacitance model (CCM) as a physically realistic
choice of an interfacial model for surface acid–base
characters (Lutzenkirchen, 1998). The manipulationof multiple ionic strength data with one comprehen-sive parameter set as well as some inconsistencies are
thus avoided (Lutzenkirchen, 1999a, b). This succinctmethod with fewer adjustable parameters allows datatreatment on the concentration scale, and in principleinvolves strictly conditional parameters. In our case,
the dominant background electrolyte (0.1mol l@1
NaNO3) actually kept the ionic strength of titrationsystems stable, the ion-exchange reactions could be
neglected. More recently, a comprehensive triple
Fig. 1. In situ Gran plots of hydroxide back titration. (a) The sample suspension; (b) the acidimetricsupernatant. Here, the solid and open squares denote the acidic side of titration data of WC and LPSsamples, respectively, the solid and open up-triangles are the alkaline side of titration data of WC and LPS
supernatants, respectively.
Wenxin Liu4114
layer model (TLM) based on Gibbs linear free energy
minimization other than mass balance was applied tothe description of a standard reference illitic mineralafter purification (Sinitsyn et al., 2000). Although thesensitivity analysis was performed, the possibility of
potential uncertainties would increase, attributable tomore adjustable or pseudo-fixed parameters in-volved. As a result, the constant capacitance model
(CCM) was employed in the current paper.
Surface site type and density
According to crystallographic analysis, the illite
surface sites located in 2 : 1 layer structures should beconsidered as heterogeneous with different bindingaffinities of protons and other ions. The typicalmorphology of illite may lead to a variety of potential
surface site types, including weakly acidic basalplanar surfaces formed by the planes of tetrahedralsiloxane sheet, amphoteric silanol and aluminol
surface sites on the edge surfaces, frayed edges andinterlayer sites (Kulik et al., 2000). It has beenemphasized that the total number of surface sites
should be determined experimentally or a valueshould be assigned on the basis of other studies(Davis et al., 1998). However, unlike pure (hydr)o-
xides or standard reference clay minerals where thesurface site density can be calculated based on theideal morphological structure (Pivovarov, 1997), anaccurate estimation of the crystallographic presenta-
tion for the naturally occurring illites and the ratio(or relative proportion) between different site groupsis virtually impossible, due to various interstratifica-
tion manners of constituent layers as well ascompositional impurity and structural defects onsurfaces caused by local environments of origins. In
addition, the resulting SCM with fewer optimizedparameters, which are restricted or preset a priori,may reduce the uncertainties in the model andincrease the predictive potential (Sinitsyn et al.,
2000). In view of simplicity and practicality, the sitedistribution on illite surfaces is therefore regarded ashomogeneous in this study.
In contrast to the values presumed according to theclassical particle morphology or optimized by thefitting programs in some papers, the surface site
concentration (SSC) was estimated as follows andfixed during optimization:
SSC¼Veb2@Veb1ð Þsample�Cb@Veb2@Veb1ð Þblank�Cb
V0
ðmol l@1Þ ð2Þ
At each titration point, the quantity of protons
reacted with all surface sites (PR) was computedusing
PR ¼ TOTP@10@pH þ 10@ðpKw@pHÞh i
�
ðV0 þ Vat þ VbÞ ðmolÞð3Þ
here, pH and Kw stand for the@log[H+] and ionic
product of water in 0.1mol l@1 medium, respec-tively.
RESULTS AND DISCUSSION
Surface proton-reaction model
Titration blank. In this paper, the proton reactions
in the system blank were interpreted by those ofSi(OH)4 and Al
3+ in aqueous solution (see Table 1),since natural illite is mainly constituted by hydrous
aluminosilicates.The acidimetric supernatant as the system blank is
more accurate, due to consideration of structural
elements released from matrix. Therefore, the actualmeasurements of total Si and Al in the acidimetricsupernatant by ICP-OES were imported into the
chemical equilibrium stoichiometric tableau ofFITEQL. Because the hydrolyzed aluminum speciesand the coexisting silicic acids, arising from acidicdissociation of the illite matrix, will generate a variety
of HAS complexes as mentioned before, theirinfluence on illite surface properties should be takeninto account as well. For simplicity, only the low-
order monomeric form was considered:
Al3þþH4SiO42AlðOSiðOHÞ3Þ2þþHþ pKf1
In this study, 2.7470.023 was adopted for pKf1,
which was estimated based on potentiometric titra-tion (Sjoberg, 1998).Meanwhile, since the used FITEQL cannot fit the
bulk deposition observed in the acidic supernatantduring the hydroxide titration, a supposed reactionto simulate the interactions between aluminumspecies and silicic acid during the hydroxide titration
was further introduced,
Al3þþH4SiO4þ2H2O2AlðOHÞ2ðOSiðOHÞ3Þ
þ3Hþ pKf2
where Kf2 represents the formation constant for the
produced complex.
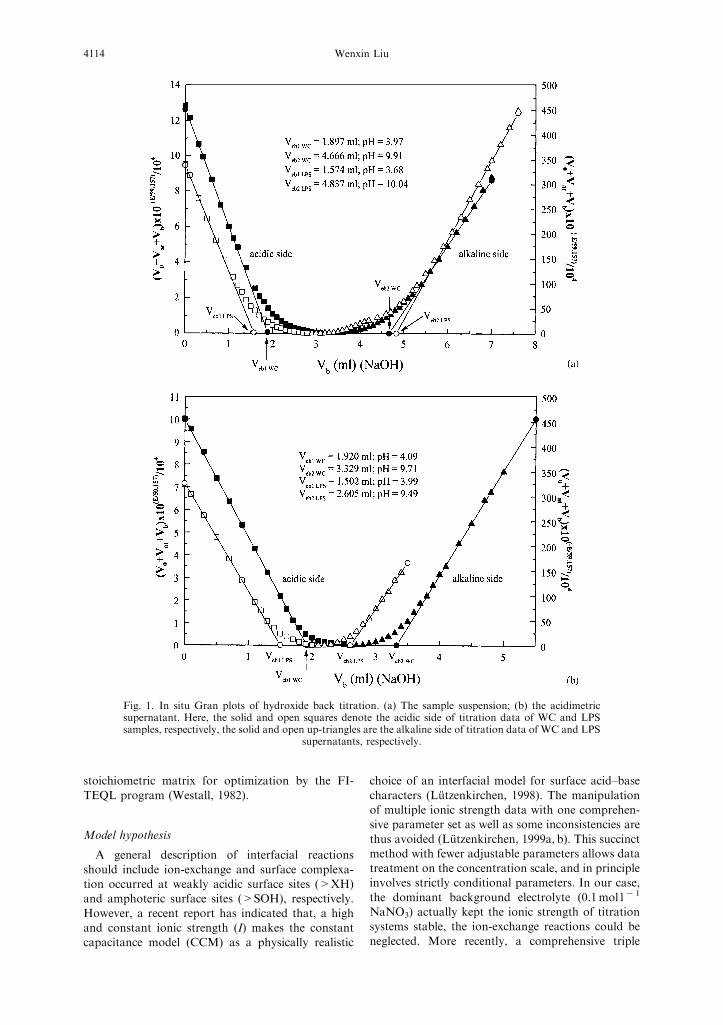
Sample suspensions. The surface acid–base prop-erties of the different illites are quite similar, as shownby the titration curves in Fig. 2.
In addition to the relevant procedures consideredin the acidimetric supernatants (titration blank), theinteractions between HAS species and illite surface
sites in particle suspension were further proposed forthe model description to derive the surface acidityconstants (see Table 1). After input of other fixedparameters, namely, surface site concentrations
(SSC) and BET surface areas (ABET), the optimiza-tion and adequacy testing were accomplished bytuning the electrical capacitance (C) value in the
FITEQL, until the best fit was attained (Westall,1982). The concerned details are listed in Table 1 anddepicted by Fig. 2.
Surface acid–base nature of natural illites 4115
In this model, the homogeneous surface groupswere only subject to deprotonation. The supporting
evidence includes: (1) the specific distribution patternin the Gran plot (Fig. 1) implies no apparent surfacereaction before Veb1; (2) the negative PR values (see
Fig. 2) show that deprotonation is predominantwithin the studied pH range (pH 3–10); and (3) aprevious study of Zeta potential determination hasindicated that the surface of WC illite carried
negative charge even in the acidic surroundings (Duet al., 1997). Since the model supposes that depro-tonation dominated the illite surface behavior, the
contribution of the >SiOH sites appears to be moresignificant than that of the >AlOH sites. It is notsurprising if we consider high proportion of SiO2existed in the chemical compositions (the weightpercentages of SiO2 and Al2O3 were 72.5 and 14.9 forWC, and 64.7 and 15.6 for LPS samples, respec-
tively). The influence of acidimetric titration on thespecific external surface areas of the illite samples wasnot strong (see Table 1). To some extent, the lattercase also implies that, in the layer structure of natural
illites, the surface sites on basal tetrahedral sheetsmay contribute to the reactivity of illite as well as thesurface sites on edge faces, which is confirmed by the
ensuing spectroscopic information.
From Fig. 2, the surface acid–base properties ofaqueous illites from different locations could be well
delineated by the CCM involved surface complexa-tion or precipitation of HAS. The formation constant(KSC) of the assumed surface HAS species is
relatively stable. After comparison, the approximatepK int
a values for the two illites exhibited somesimilarities in their acid–base properties. The corre-sponding results are in accordance with those in a
former study as well (Du et al., 1997).As indicated by Lu and Smith (1996), the titration
behavior of complex minerals may not be simply
represented by an oxide mixture with compositionalequivalence. In fact, surface complexation modelparameters acquired during a particular fitting
procedure are not necessarily unique. In many cases,the situation of real samples in their pristine statusmay deviate, to different extent, from the typical one
reflected by the standard reference materials. In asense, the results of such studies are difficult orinvalid to compare simply and directly, owing tointrinsic differences in sample preparation, experi-
mental techniques, data interpretation and thecontrasting mineralogical purity of the samples(Sinitsyn et al., 2000). Obviously, discriminations in
experimental protocol as well as the complexity
Fig. 2. Model illustrations of the potentiometric back titrations for different illite suspensions and theconcerned experimental data. The solid and open squares denote 10 g l@1 suspension of WC and LPS in0.1mol l@1 NaNO3; the solid and open circles are acidimetric supernatants of WC and LPS, respectively.The dotted lines are simulation results of the acidimetric supernatant using Si(OH)4 and Al
3+ protonreactions as well as complex formation between Al and Si(OH)4 in aqueous solutions. The solid anddashed lines represent model description of the titration data of WC and LPS illites, respectively. Theembedded figure shows the titration curves for two illite samples (all 10 g l@1, 0.1mol l@1 NaNO3) andtheir corresponding supernatants. The solid and open up-triangles are acidimetric titration of WC andLPS illites, respectively. The solid and open squares denote alkalimetric titration of WC and LPS illites,respectively. The solid and open circles stand for alkalimetic titration of WC and LPS acidimetric
supernatants, respectively.
Wenxin Liu4116
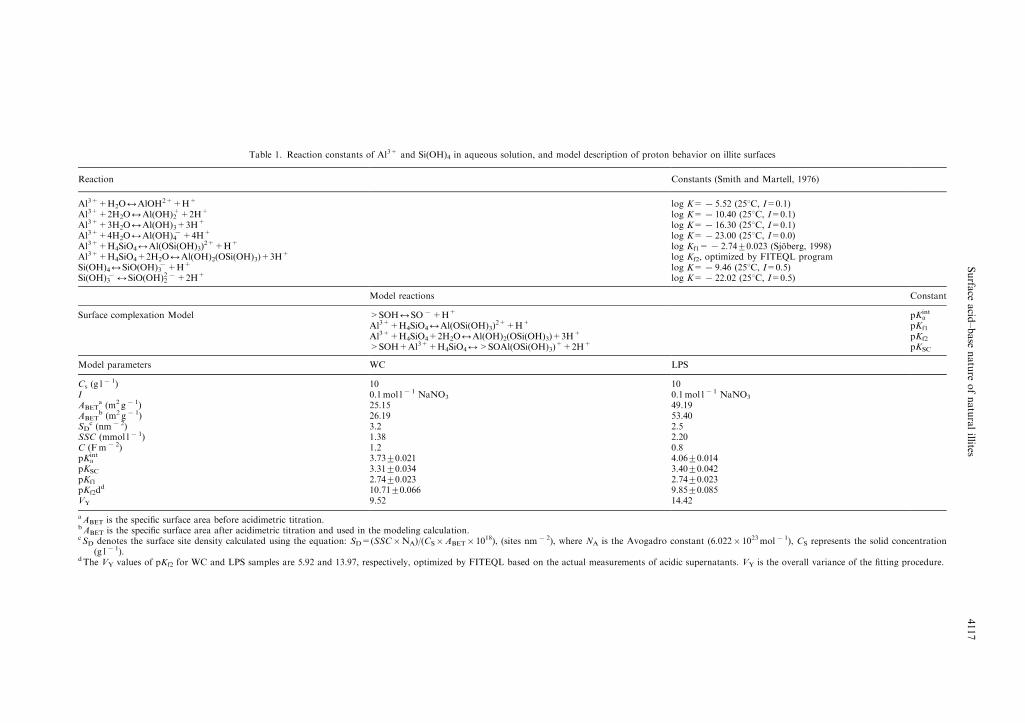
Table 1. Reaction constants of Al3+ and Si(OH)4 in aqueous solution, and model description of proton behavior on illite surfaces
Reaction Constants (Smith and Martell, 1976)
Al3++H2O2AlOH2++H+ log [email protected] (251C, I=0.1)Al3++2H2O2Al(OH)2
++2H+ log [email protected] (251C, I=0.1)Al3++3H2O2Al(OH)3+3H
+ log [email protected] (251C, I=0.1)Al3++4H2O2Al(OH)4
@+4H+ log [email protected] (251C, I=0.0)Al3++H4SiO42Al(OSi(OH)3)
2++H+ log [email protected] (Sjoberg, 1998)Al3++H4SiO4+2H2O2Al(OH)2(OSi(OH)3)+3H
+ log Kf2, optimized by FITEQL programSi(OH)42SiO(OH)3
@+H+ log [email protected] (251C, I=0.5)Si(OH)3
@2SiO(OH)22@+2H+ log [email protected] (251C, I=0.5)
Model reactions Constant
Surface complexation Model >SOH2SO@+H+ pKaint
Al3++H4SiO42Al(OSi(OH)3)2++H+ pKf1
Al3++H4SiO4+2H2O2Al(OH)2(OSi(OH)3)+3H+ pKf2
>SOH+Al3++H4SiO42>SOAl(OSi(OH)3)++2H+ pKSC
Model parameters WC LPS
Cs (g l@1) 10 10
I 0.1mol l@1 NaNO3 0.1mol l@1 NaNO3ABET
a (m2 g@1) 25.15 49.19ABET
b (m2 g@1) 26.19 53.40SDc (nm@2) 3.2 2.5
SSC (mmol l@1) 1.38 2.20C (Fm@2) 1.2 0.8pKa
int 3.7370.021 4.0670.014pKSC 3.3170.034 3.4070.042pKf1 2.7470.023 2.7470.023pKf2d
d 10.7170.066 9.8570.085VY 9.52 14.42
aABET is the specific surface area before acidimetric titration.bABET is the specific surface area after acidimetric titration and used in the modeling calculation.cSD denotes the surface site density calculated using the equation: SD=(SSC�NA)/(CS�ABET� 1018), (sites nm@2), where NA is the Avogadro constant (6.022� 1023mol@1), CS represents the solid concentration
(g l@1).dThe VY values of pKf2 for WC and LPS samples are 5.92 and 13.97, respectively, optimized by FITEQL based on the actual measurements of acidic supernatants. VY is the overall variance of the fitting procedure.
Surfaceacid–basenatureofnaturalillites
4117
inherent in the structure and chemistry of 2 : 1 layerclay minerals may partly elucidate the varied range ofsurface electrochemistry reported. Undoubtedly, it is
significant for the future study to standardize theprotocols adopted in the experimental investigationof the surface charge, considering the complexity of
this group of clay minerals.In the following, some spectroscopic techniques
are employed to offer some direct evidence for
the formation of surface Al–Si complexes or pre-cipitates during acid–base titration. Combination ofmultiple spectroscopic techniques can providethe comprehensive information for validating the
corresponding model assumptions of surfacereaction equilibria aforementioned and for resolvingsome ambiguities in spectral signal assignment,
which are often encountered when using a singlemethod.
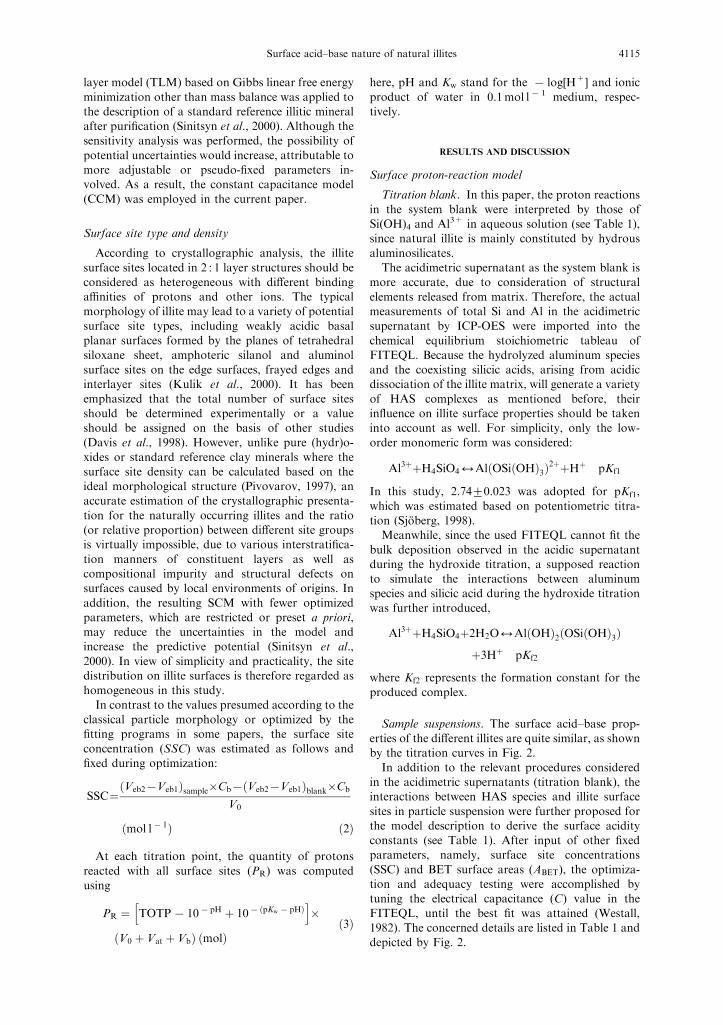
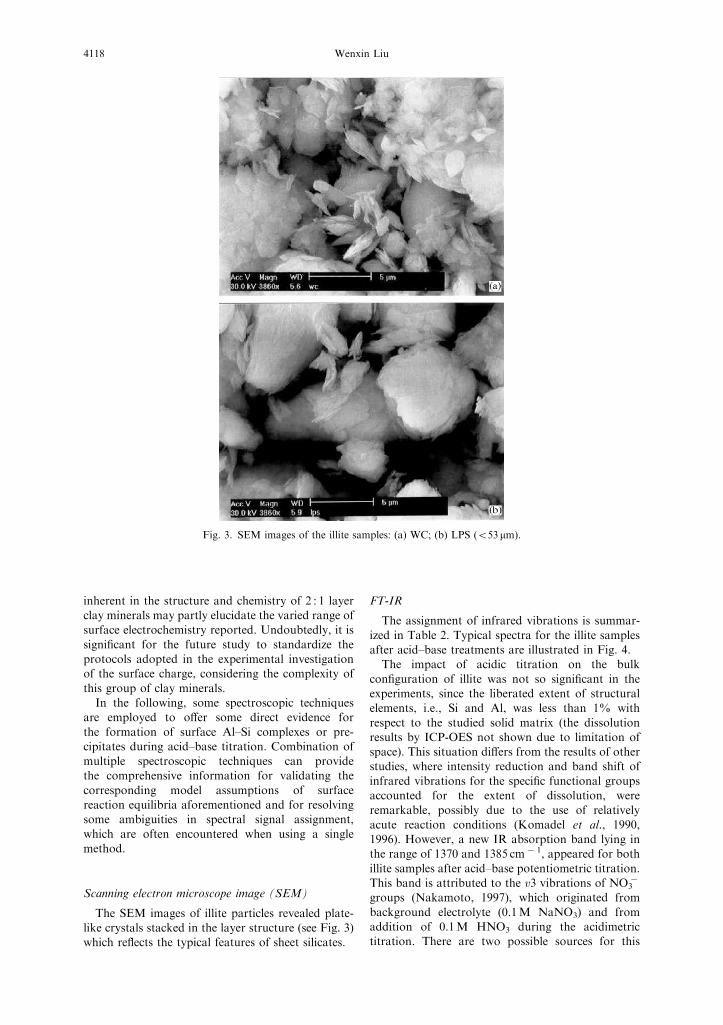
Scanning electron microscope image (SEM)
The SEM images of illite particles revealed plate-like crystals stacked in the layer structure (see Fig. 3)which reflects the typical features of sheet silicates.
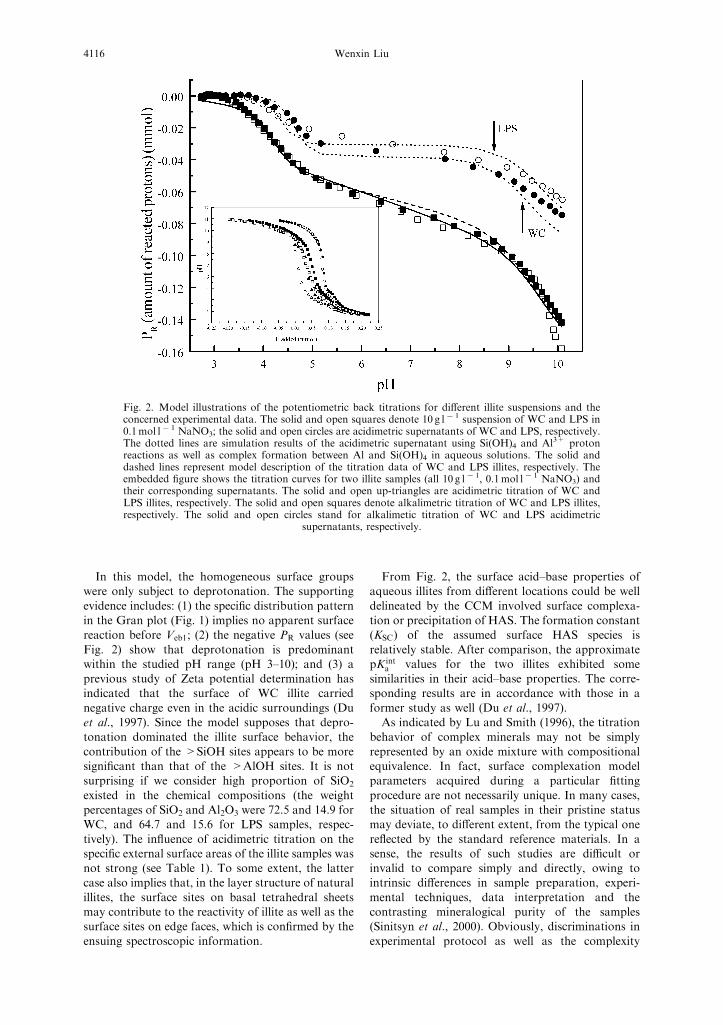
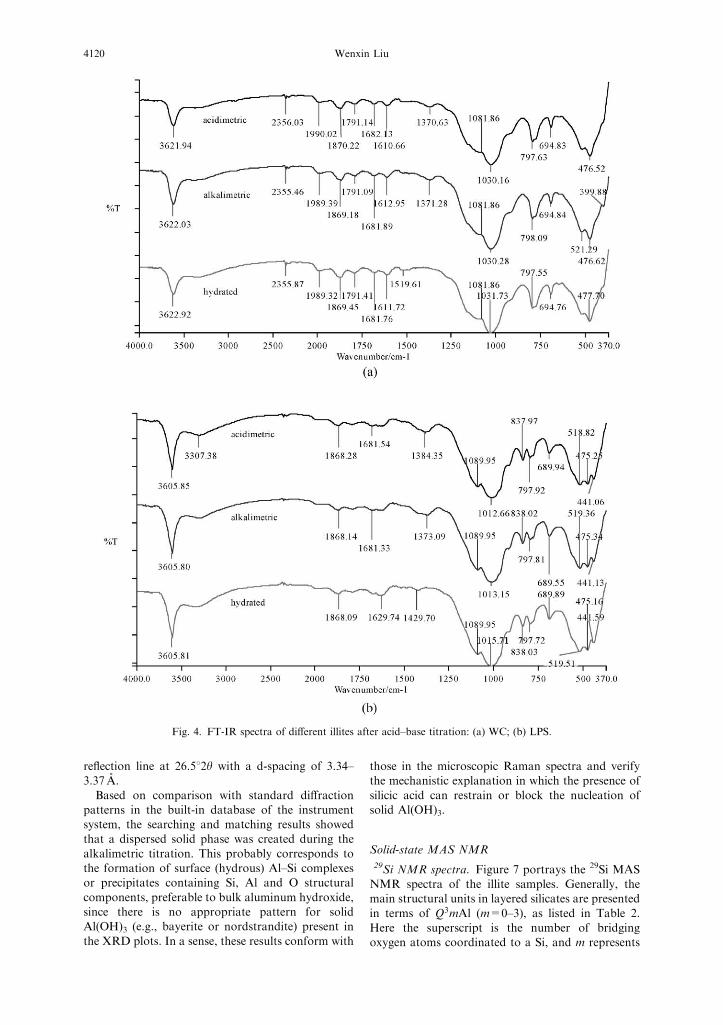
FT-IR
The assignment of infrared vibrations is summar-
ized in Table 2. Typical spectra for the illite samplesafter acid–base treatments are illustrated in Fig. 4.The impact of acidic titration on the bulk
configuration of illite was not so significant in theexperiments, since the liberated extent of structuralelements, i.e., Si and Al, was less than 1% with
respect to the studied solid matrix (the dissolutionresults by ICP-OES not shown due to limitation ofspace). This situation differs from the results of otherstudies, where intensity reduction and band shift of
infrared vibrations for the specific functional groupsaccounted for the extent of dissolution, wereremarkable, possibly due to the use of relatively
acute reaction conditions (Komadel et al., 1990,1996). However, a new IR absorption band lying inthe range of 1370 and 1385 cm@1, appeared for both
illite samples after acid–base potentiometric titration.This band is attributed to the v3 vibrations of NO3
@
groups (Nakamoto, 1997), which originated from
background electrolyte (0.1M NaNO3) and fromaddition of 0.1M HNO3 during the acidimetrictitration. There are two possible sources for this
Fig. 3. SEM images of the illite samples: (a) WC; (b) LPS (o53 mm).
Wenxin Liu4118
nitrate absorption band. One is the residual fractionof NO3
@ after solid–solution separation, and for the
hydrated samples, the missing absorption band isprobably caused by no addition of support electro-lyte in the course of preparation. The other is theformation of surface Al–Si nitrate complex, where
the nitrate groups may locate in the outer sphere asthe counter ions for charge balance, e.g., in the formof >SOAl(OSi(OH)3)NO3. Another report also
demonstrated that the presence of some anions, suchas nitrate, could affect the local structure of Al and Siin synthetic amorphous aluminosilicates, and alter
the surface properties, for example, surface chargeand adsorption capacity (Miyazaki and Yokoyama,1999).
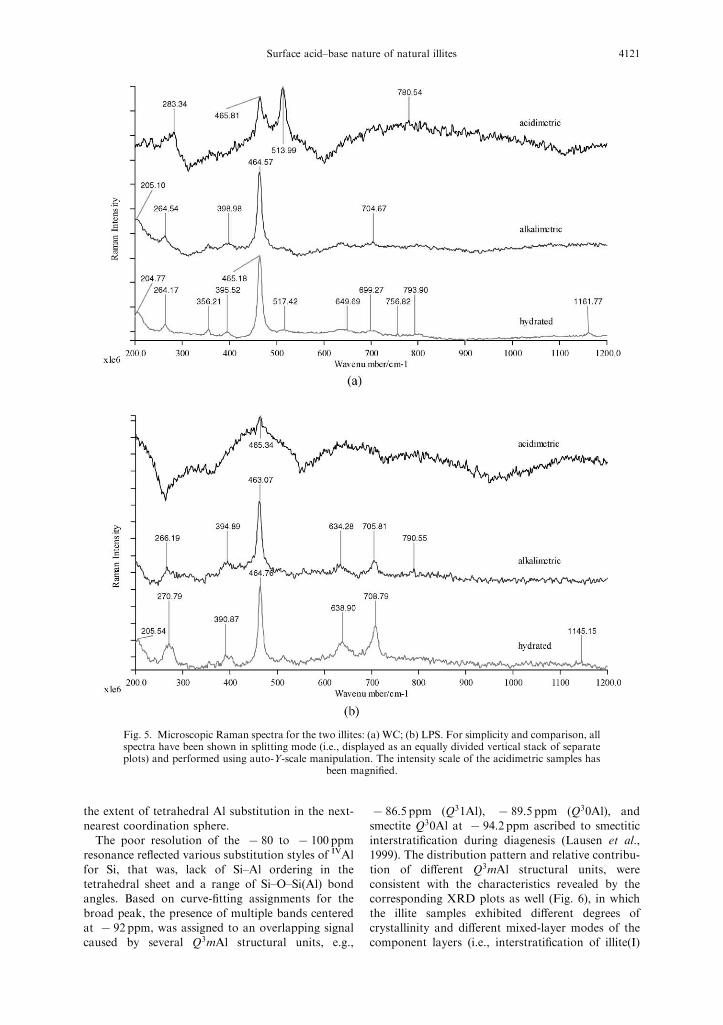
Raman spectroscopy
The assignment of Raman bands is listed in Table2. Figure 5 depicts the microscopic Raman spectra ofthe illite samples prior to, and after each stage of the
acid–base titration. The most prominent variation ofthe illite surfaces is illustrated by the change inscattered intensity of symmetric Si–O bending vibra-tions near 465 cm@1. The acidimetric titration
induced not only diminishment of the peak height,but also significantly broadening of the peak widthwith respect to that of the hydrated illite. Then this
signal, to a certain degree, rose again as a result ofhydroxide back titration. As for the bands corre-sponding to Al–O vibrations in the region of 650–
750 cm@1 (Nakamoto, 1997), similar results couldalso be found in our study.
Consequently, the Raman spectroscopic informa-tion suggests that some products containing Al–O–Sibond structure were generated on the illite surfacesduring the hydroxide back titration. This phenom-
enon results from the interactions between soluble Alspecies and silicic acid, originated from acid-leachingreaction of the illite substrate during the potentio-
metric titration.
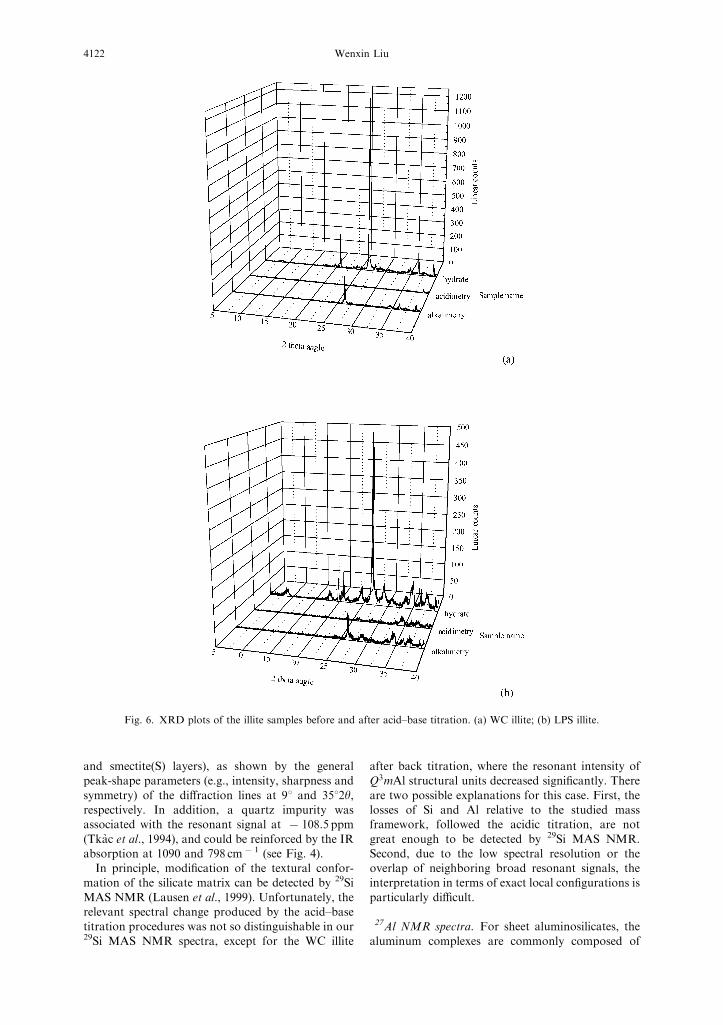
XRD profiles
The related alterations by acid–base titration aredescribed, on an identical scale, by linear counts
versus 2y angle in Fig. 6. The characteristic d(0 0 1)spacing values for WC and LPS illites are 9.99 and9.90 A, respectively.
According to Fig. 6, the heights of several 0 0 ldiffraction lines, such as basal reflection d(0 0 1) at912y, d(0 0 2) at 1812y and d(0 0 3) at 26.512y, whichare usually regarded as the diagnostic reflections fornatural illites (Sroden, 1984), sharply decreasedrelative to those of hydrated samples during theacidic titration procedure. This situation is in accord
with that in other reports (Komadel et al., 1990),though stronger experimental conditions were ap-plied in their cases, such as concentrated acid and
heating. To some extent, the intensities of certaindiffraction peaks resumed after hydroxide backtitration up to around pH 5.5–6, especially for the
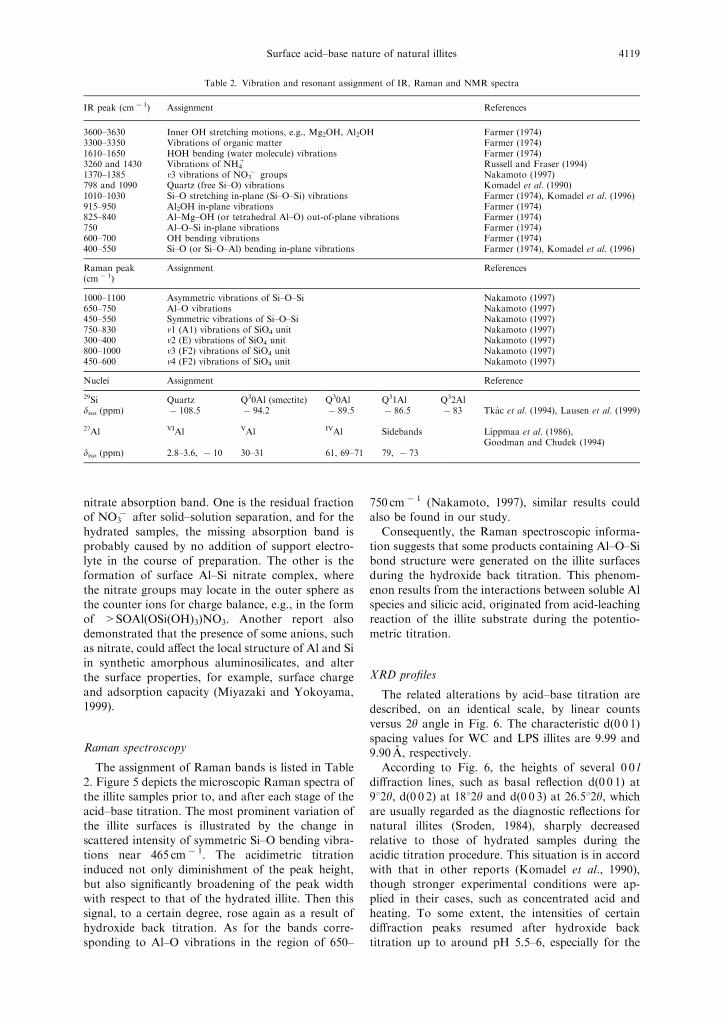
Table 2. Vibration and resonant assignment of IR, Raman and NMR spectra
IR peak (cm@1) Assignment References
3600–3630 Inner OH stretching motions, e.g., Mg2OH, Al2OH Farmer (1974)3300–3350 Vibrations of organic matter Farmer (1974)1610–1650 HOH bending (water molecule) vibrations Farmer (1974)3260 and 1430 Vibrations of NH4
+ Russell and Fraser (1994)1370–1385 v3 vibrations of NO3
@ groups Nakamoto (1997)798 and 1090 Quartz (free Si–O) vibrations Komadel et al. (1990)1010–1030 Si–O stretching in-plane (Si–O–Si) vibrations Farmer (1974), Komadel et al. (1996)915–950 Al2OH in-plane vibrations Farmer (1974)825–840 Al–Mg–OH (or tetrahedral Al–O) out-of-plane vibrations Farmer (1974)750 Al–O–Si in-plane vibrations Farmer (1974)600–700 OH bending vibrations Farmer (1974)400–550 Si–O (or Si–O–Al) bending in-plane vibrations Farmer (1974), Komadel et al. (1996)
Raman peak(cm@1)
Assignment References
1000–1100 Asymmetric vibrations of Si–O–Si Nakamoto (1997)650–750 Al–O vibrations Nakamoto (1997)450–550 Symmetric vibrations of Si–O–Si Nakamoto (1997)750–830 v1 (A1) vibrations of SiO4 unit Nakamoto (1997)300–400 v2 (E) vibrations of SiO4 unit Nakamoto (1997)800–1000 v3 (F2) vibrations of SiO4 unit Nakamoto (1997)450–600 v4 (F2) vibrations of SiO4 unit Nakamoto (1997)
Nuclei Assignment Reference
29Si Quartz Q30Al (smectite) Q30Al Q31Al Q32Aldiso (ppm) @108.5 @94.2 @89.5 @86.5 @83 Tkac et al. (1994), Lausen et al. (1999)
27Al VIAl VAl IVAl Sidebands Lippmaa et al. (1986),Goodman and Chudek (1994)
diso (ppm) 2.8–3.6, @10 30–31 61, 69–71 79, @73
Surface acid–base nature of natural illites 4119
reflection line at 26.512y with a d-spacing of 3.34–3.37 A.
Based on comparison with standard diffractionpatterns in the built-in database of the instrumentsystem, the searching and matching results showedthat a dispersed solid phase was created during the
alkalimetric titration. This probably corresponds tothe formation of surface (hydrous) Al–Si complexesor precipitates containing Si, Al and O structural
components, preferable to bulk aluminum hydroxide,since there is no appropriate pattern for solidAl(OH)3 (e.g., bayerite or nordstrandite) present in
the XRD plots. In a sense, these results conform with
those in the microscopic Raman spectra and verifythe mechanistic explanation in which the presence of
silicic acid can restrain or block the nucleation ofsolid Al(OH)3.
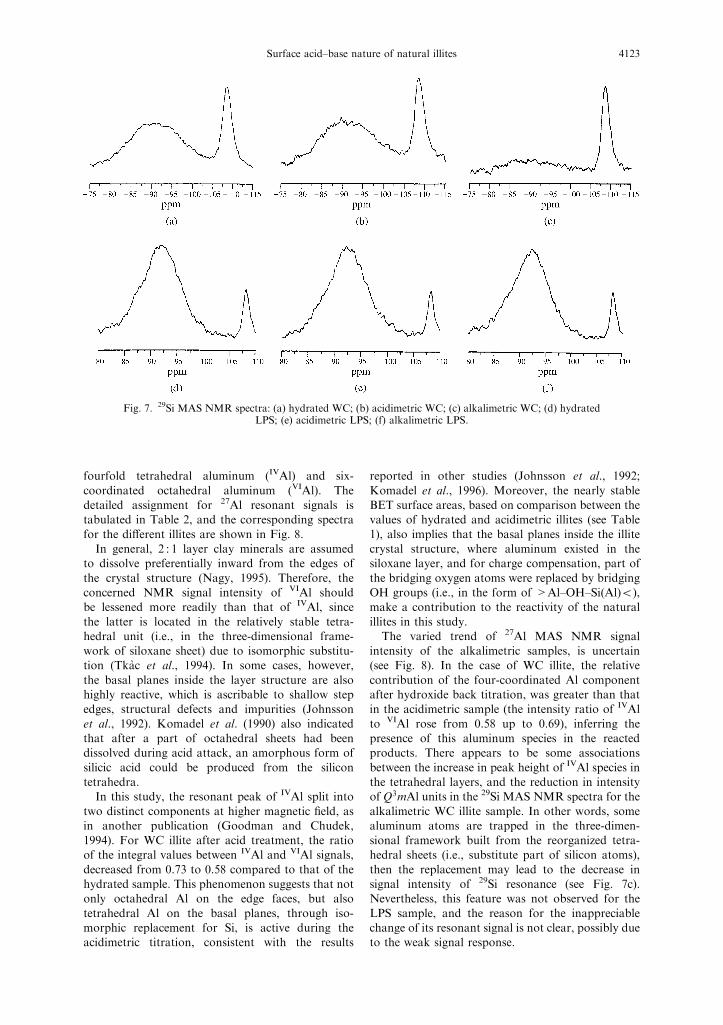
Solid-state MAS NMR29Si NMR spectra. Figure 7 portrays the 29Si MASNMR spectra of the illite samples. Generally, themain structural units in layered silicates are presented
in terms of Q3mAl (m=0–3), as listed in Table 2.Here the superscript is the number of bridgingoxygen atoms coordinated to a Si, and m represents
Fig. 4. FT-IR spectra of different illites after acid–base titration: (a) WC; (b) LPS.
Wenxin Liu4120
the extent of tetrahedral Al substitution in the next-nearest coordination sphere.The poor resolution of the @80 to @100 ppm
resonance reflected various substitution styles of IVAl
for Si, that was, lack of Si–Al ordering in thetetrahedral sheet and a range of Si–O–Si(Al) bondangles. Based on curve-fitting assignments for the
broad peak, the presence of multiple bands centeredat @92 ppm, was assigned to an overlapping signalcaused by several Q3mAl structural units, e.g.,
@86.5 ppm (Q31Al), @89.5 ppm (Q30Al), andsmectite Q30Al at @94.2 ppm ascribed to smectiticinterstratification during diagenesis (Lausen et al.,1999). The distribution pattern and relative contribu-
tion of different Q3mAl structural units, wereconsistent with the characteristics revealed by thecorresponding XRD plots as well (Fig. 6), in which
the illite samples exhibited different degrees ofcrystallinity and different mixed-layer modes of thecomponent layers (i.e., interstratification of illite(I)
Fig. 5. Microscopic Raman spectra for the two illites: (a) WC; (b) LPS. For simplicity and comparison, allspectra have been shown in splitting mode (i.e., displayed as an equally divided vertical stack of separateplots) and performed using auto-Y-scale manipulation. The intensity scale of the acidimetric samples has
been magnified.
Surface acid–base nature of natural illites 4121
and smectite(S) layers), as shown by the generalpeak-shape parameters (e.g., intensity, sharpness and
symmetry) of the diffraction lines at 91 and 3512y,respectively. In addition, a quartz impurity wasassociated with the resonant signal at @108.5 ppm
(Tkac et al., 1994), and could be reinforced by the IRabsorption at 1090 and 798 cm@1 (see Fig. 4).In principle, modification of the textural confor-
mation of the silicate matrix can be detected by 29Si
MAS NMR (Lausen et al., 1999). Unfortunately, therelevant spectral change produced by the acid–basetitration procedures was not so distinguishable in our29Si MAS NMR spectra, except for the WC illite
after back titration, where the resonant intensity ofQ3mAl structural units decreased significantly. There
are two possible explanations for this case. First, thelosses of Si and Al relative to the studied massframework, followed the acidic titration, are not
great enough to be detected by 29Si MAS NMR.Second, due to the low spectral resolution or theoverlap of neighboring broad resonant signals, theinterpretation in terms of exact local configurations is
particularly difficult.
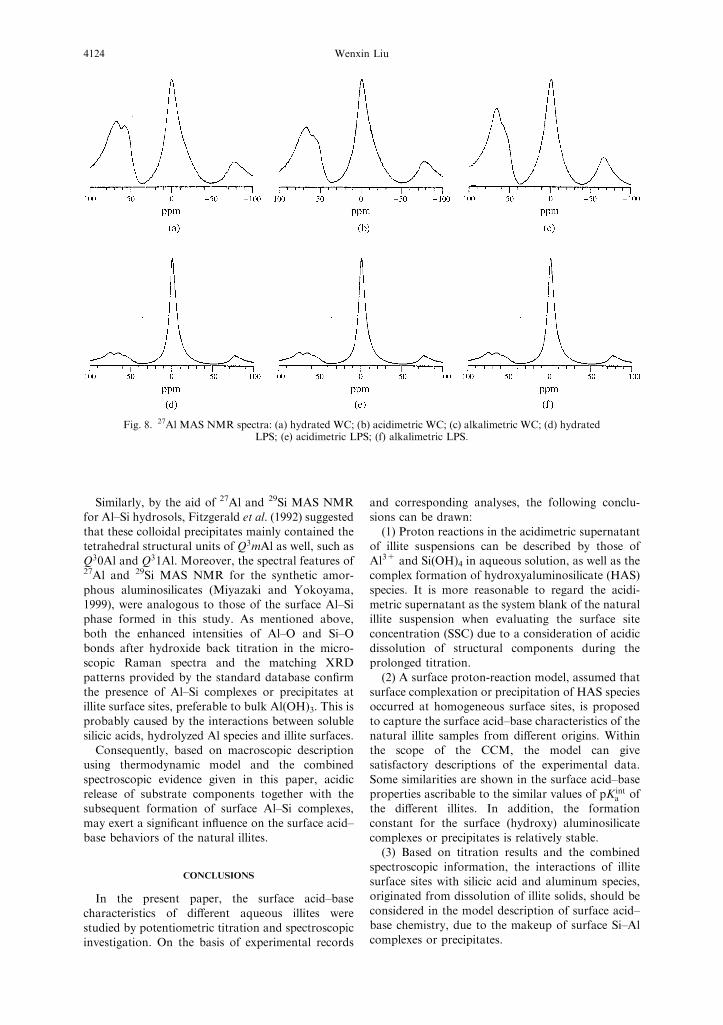
27Al NMR spectra. For sheet aluminosilicates, the
aluminum complexes are commonly composed of
Fig. 6. XRD plots of the illite samples before and after acid–base titration. (a) WC illite; (b) LPS illite.
Wenxin Liu4122
fourfold tetrahedral aluminum (IVAl) and six-
coordinated octahedral aluminum (VIAl). Thedetailed assignment for 27Al resonant signals istabulated in Table 2, and the corresponding spectra
for the different illites are shown in Fig. 8.In general, 2 : 1 layer clay minerals are assumed
to dissolve preferentially inward from the edges of
the crystal structure (Nagy, 1995). Therefore, theconcerned NMR signal intensity of VIAl shouldbe lessened more readily than that of IVAl, since
the latter is located in the relatively stable tetra-hedral unit (i.e., in the three-dimensional frame-work of siloxane sheet) due to isomorphic substitu-tion (Tkac et al., 1994). In some cases, however,
the basal planes inside the layer structure are alsohighly reactive, which is ascribable to shallow stepedges, structural defects and impurities (Johnsson
et al., 1992). Komadel et al. (1990) also indicatedthat after a part of octahedral sheets had beendissolved during acid attack, an amorphous form of
silicic acid could be produced from the silicontetrahedra.In this study, the resonant peak of IVAl split into
two distinct components at higher magnetic field, asin another publication (Goodman and Chudek,1994). For WC illite after acid treatment, the ratioof the integral values between IVAl and VIAl signals,
decreased from 0.73 to 0.58 compared to that of thehydrated sample. This phenomenon suggests that notonly octahedral Al on the edge faces, but also
tetrahedral Al on the basal planes, through iso-morphic replacement for Si, is active during theacidimetric titration, consistent with the results
reported in other studies (Johnsson et al., 1992;
Komadel et al., 1996). Moreover, the nearly stableBET surface areas, based on comparison between thevalues of hydrated and acidimetric illites (see Table
1), also implies that the basal planes inside the illitecrystal structure, where aluminum existed in thesiloxane layer, and for charge compensation, part of
the bridging oxygen atoms were replaced by bridgingOH groups (i.e., in the form of >Al–OH–Si(Al)o),make a contribution to the reactivity of the natural
illites in this study.The varied trend of 27Al MAS NMR signal
intensity of the alkalimetric samples, is uncertain(see Fig. 8). In the case of WC illite, the relative
contribution of the four-coordinated Al componentafter hydroxide back titration, was greater than thatin the acidimetric sample (the intensity ratio of IVAl
to VIAl rose from 0.58 up to 0.69), inferring thepresence of this aluminum species in the reactedproducts. There appears to be some associations
between the increase in peak height of IVAl species inthe tetrahedral layers, and the reduction in intensityof Q3mAl units in the 29Si MAS NMR spectra for the
alkalimetric WC illite sample. In other words, somealuminum atoms are trapped in the three-dimen-sional framework built from the reorganized tetra-hedral sheets (i.e., substitute part of silicon atoms),
then the replacement may lead to the decrease insignal intensity of 29Si resonance (see Fig. 7c).Nevertheless, this feature was not observed for the
LPS sample, and the reason for the inappreciablechange of its resonant signal is not clear, possibly dueto the weak signal response.
Fig. 7. 29Si MAS NMR spectra: (a) hydrated WC; (b) acidimetric WC; (c) alkalimetric WC; (d) hydratedLPS; (e) acidimetric LPS; (f) alkalimetric LPS.
Surface acid–base nature of natural illites 4123
Similarly, by the aid of 27Al and 29Si MAS NMRfor Al–Si hydrosols, Fitzgerald et al. (1992) suggested
that these colloidal precipitates mainly contained thetetrahedral structural units of Q3mAl as well, such asQ30Al and Q31Al. Moreover, the spectral features of27Al and 29Si MAS NMR for the synthetic amor-
phous aluminosilicates (Miyazaki and Yokoyama,1999), were analogous to those of the surface Al–Siphase formed in this study. As mentioned above,
both the enhanced intensities of Al–O and Si–Obonds after hydroxide back titration in the micro-scopic Raman spectra and the matching XRD
patterns provided by the standard database confirmthe presence of Al–Si complexes or precipitates atillite surface sites, preferable to bulk Al(OH)3. This is
probably caused by the interactions between solublesilicic acids, hydrolyzed Al species and illite surfaces.Consequently, based on macroscopic description
using thermodynamic model and the combined
spectroscopic evidence given in this paper, acidicrelease of substrate components together with thesubsequent formation of surface Al–Si complexes,
may exert a significant influence on the surface acid–base behaviors of the natural illites.
CONCLUSIONS
In the present paper, the surface acid–base
characteristics of different aqueous illites werestudied by potentiometric titration and spectroscopicinvestigation. On the basis of experimental records
and corresponding analyses, the following conclu-sions can be drawn:
(1) Proton reactions in the acidimetric supernatantof illite suspensions can be described by those ofAl3+ and Si(OH)4 in aqueous solution, as well as thecomplex formation of hydroxyaluminosilicate (HAS)
species. It is more reasonable to regard the acidi-metric supernatant as the system blank of the naturalillite suspension when evaluating the surface site
concentration (SSC) due to a consideration of acidicdissolution of structural components during theprolonged titration.
(2) A surface proton-reaction model, assumed thatsurface complexation or precipitation of HAS speciesoccurred at homogeneous surface sites, is proposed
to capture the surface acid–base characteristics of thenatural illite samples from different origins. Withinthe scope of the CCM, the model can givesatisfactory descriptions of the experimental data.
Some similarities are shown in the surface acid–baseproperties ascribable to the similar values of pK int
a ofthe different illites. In addition, the formation
constant for the surface (hydroxy) aluminosilicatecomplexes or precipitates is relatively stable.(3) Based on titration results and the combined
spectroscopic information, the interactions of illitesurface sites with silicic acid and aluminum species,originated from dissolution of illite solids, should be
considered in the model description of surface acid–base chemistry, due to the makeup of surface Si–Alcomplexes or precipitates.
Fig. 8. 27Al MAS NMR spectra: (a) hydrated WC; (b) acidimetric WC; (c) alkalimetric WC; (d) hydratedLPS; (e) acidimetric LPS; (f) alkalimetric LPS.
Wenxin Liu4124
AcknowledgementsFThis study was under the auspices ofLulea University of Technology (LTU), Sweden. Theauthor would express sincere gratitude to Prof. W. Forslingand Doc. Z. X. Sun of LTU for their beneficial instructionand suggestion, and be also grateful to Drs. O. N.Antzutkin, M. Lindberg, L. M. Wu, and Q. Du, and toMrs. M. Renheimer of LTU for their kind assistance onexperimental operation.
REFERENCES
Avena M. J. and De Pauli C. P. (1996) Modeling theinterfacial properties of an amorphous aluminosilicatedispersed in aqueous NaCl solutions. Colloids Surf. A:Physicochem. Eng. Aspects 118, 75–87.
Borkovec M. (1997) Origin of 1-pK and 2-pK models forionizable water–solid interface. Langmuir 13, 2608–2613.
Bouallou M., Vielvoye L., El Shafei G. M. S. and Stone W.E. E. (1998) Dissolution of silica and formation of adispersed phase induced at low pH by the association ofsoluble aluminum ionic species with solid silica gel.Langmuir 14, 1072–1080.
Browne B. A. and Driscoll C. T. (1992) Soluble aluminumsilicates: stoichiometry, stability, and implication forenvironmental geochemistry. Science 256, 1667–1670.
Davis J. A., Coston J. A., Kent D. B. and Fuller C. C.(1998) Application of the surface complexation conceptto complex mineral assemblages. Environ. Sci. Technol.32, 2820–2828.
Du Q., Sun Z. X., Forsling W. and Tang H. X. (1997) Acid–base properties of aqueous illite surfaces. J. ColloidInterface Sci. 187, 221–231.
Exley C. and Birchall J. D. (1993) A mechanism ofhydroxyaluminosilicate formation. Polyhedron 12,1007–1017.
Farmer V. C. (1974) The layer silicates. In Infrared Spectraof Minerals, ed. V. C. Farmer, pp. 331–362. The MineralSociety, London.
Farmer V. C. and Lumsdon D. G. (1994) An assessment ofcomplex formation between aluminum and silicic acid inacidic solution.Geochim. Cosmochim. Acta 58, 3331–3334.
Fitzgerald J. J., Murali C., Nebo C. O. and Fuerstenau M.C. (1992) Synthesis, chemical analyses, and solid-stateNMR studies of aluminum silicate hydrosols. J. ColloidInterface Sci. 151, 298–316.
Fitzgerald J. J., Hamza A. I., Bronnimann C. E. and DecS . F. (1997) Studies of the solid solution interfacial’dealumination of kaolinite in HCl (aq) using solid-stateH-1 CRAMPS and SP/MAS Si-29 NMR spectroscopy. J.Am. Chem. Soc. 30, 7105–7113.
Goodman B. A. and Chudek J. A. (1994) Nuclear magneticresonance spectroscopy. In Clay Mineralogy: Spectro-scopic and Chemical Determinative Methods, ed. M. J.Wilson, pp. 142–167. Chapman a Hall Publisher,London.
Hiemstra T. and Van Riemsdijk W. H. (1996) A surfacestructural approach to ion adsorption: the chargedistribution (CD) model. J. Colloid Interface Sci. 179,488–508.
Johnsson P. A., Hochella M. F., Parks G. A., Blum A. E.and Sposito G. (1992) Direct observation of muscovitebasal-plane dissolution and secondary phase formation:An XPS, LEED, and SFM study. In Water RockInteraction, eds Y. K. Kharaka and A. S. Maest, pp.159–162. Balkema, Rotterdam.
Katz L. E. and Hayes K. F. (1995) Surface complexationmodeling. J. Colloid Interface Sci. 17, 477–501.
Komadel P., Schmidt D., Madejova J. and Cicel B. (1990)Alteration of smectites by treatments with hydrochloricacid and sodium carbonate solutions. Appl. Clay Sci. 5,113–122.
Komadel P., Madejova J., Janek M., Gates W. P.,Kirkpatrick R. J. and Stucki J. W. (1996) Dissolutionof hectorite in inorganic acids. Clays Clay Miner. 44,228–236.
Kulik D. A., Aja S. U., Sinitsyn V. A. and Wood S. A.(2000) Acid–base chemistry and sorption of somelanthanide on K+-saturated Marblehead illite: II. Amultisite-surface complexation modeling. Geochim. Cos-mochim. Acta 64, 195–213.
Lausen S. K., Lindgreen H., Jakobsen H. J. and Nielsen N.C. (1999) Solid-state 29Si MAS NMR studies of illite andillite-smectite from shale. Am. Mineral. 84, 1438–1443.
Lippmaa E., Samoson A. and Magi M. (1986) High-resolution 27Al NMR of aluminosilicate. J. Am. Chem.Soc. 108, 1730–1735.
Lu W. P. and Smith E. H. (1996) Modeling potentiometrictitration behavior of glauconite. Geochim. Cosmochim.Acta 60, 3363–3373.
Lutzenkirchen J. (1998) Comparison of 1-pK and 2-pKversions of surface complexation theory by the goodnessof fit in describing surface charge data of (hydr)oxides.Environ. Sci. Technol. 32, 3149–3154.
Lutzenkirchen J. (1999a) Parameter estimation for theconstant capacitance surface complexation model: analy-sis of parameter interdependencies. J. Colloid InterfaceSci. 210, 384–390.
Lutzenkirchen J. (1999b) The constant capacitance modeland variable ionic strength: an evaluation of possibleapplications and applicability. J. Colloid Interface Sci.217, 8–18.
McGuire G. E., Fuchs J., Han P., Kushmerick J. G., WeissP. S., Simko S. J., Nemanich R. J. and Chopra D. R.(1999) Surface characterization. Anal. Chem. 71, 373R–383R.
Miyazaki A. and Yokoyama T. (1999) Effects of anions onlocal structure of Al and Si in aluminosilicates. J. ColloidInterface Sci. 214, 395–399.
Nagy K. L. (1995) Dissolution and precipitation kinetics ofsheet silicates, Chapter 5. In Chemical Weathering rates ofsilicate minerals, Reviews in Mineralogy, Vol. 31, eds A. F.White and S. L. Brantley, pp. 173–233. MineralogicalSociety of America, Washington, DC.
Nakamoto K. (1997) Infrared and Raman Spectra ofInorganic and Coordination Compounds, Part A: Theoryand Applications in Inorganic Chemistry. 5th ed. Wiley,New York, pp. 257–261.
Pivovarov S. (1997) Surface structure and site density of theoxide-solution interface. J. Colloid Interface Sci. 196,321–323.
Russell J. D. and Fraser A. R. (1994) In Infrared Methods inClay Mineralogy: Spectroscopic and Chemical Determina-tive Methods, ed. M. J. Wilson, pp. 21–61. Chapman aHall Publisher, London.
Sinitsyn V. A., Aja S. U., Kulik D. A. and Wood S. A.(2000) Acid–base surface chemistry and sorption of somelanthanides on K+-saturated Marblehead illit: I. Resultsof an experimental investigation. Geochim. Cosmochim.Acta 64, 185–194.
Sjoberg S. (1998) Personal communication.Smith R. M. and Martell A. E. (1976) Critical Stability
Constants, Volume 4: Inorganic Complexes. PlenumPress, New York.
Srodon J. (1984) X-ray powder diffraction identification ofillite materials. Clays Clay Miner. 32, 337–349.
Tkac I., Komadel P. and Muller D. (1994) Acid-treatedmontmorillonitesFa study by 29Si and 27Al MAS NMR.Clay Miner. 29, 11–19.
Westall J. C. (1982) FITEQL: a program for the determina-tion of chemical equilibrium constants from experimentaldata. Rep. 82-01. Department of Chemistry, Oregon StateUniversity, Corvallis, OR, USA.
Surface acid–base nature of natural illites 4125
Recommended