TechnicalInformation
Contents1. Overview..................................................................................................22. MeasurementPrincipleofZirconiaOxygenAnalyzers......................33. System Configuration............................................................................5
3.1 System Configuration Using a General-purpose Detector..........................53.2 System Configuration Using a High-temperature Detector.........................7
4. ZR22G Detector Construction and Features.......................................94.1 General-purpose Detector Construction......................................................104.2 High-temperature Detector Construction.....................................................114.3 Pressure Compensation Method...................................................................12
5. ZR402G Converter Functions and Features......................................135.1 Human Machine Interface (HMI)....................................................................13
5.1.1 BasicPanelandTouchPanelSwitch.............................................................. 135.1.2 DisplayConfiguration(forOxygenAnalyzer).................................................. 155.1.3 TrendGraphDisplay....................................................................................... 165.1.4 Detailed-dataDisplay...................................................................................... 175.1.5 Execution/SetupDisplay................................................................................. 21
5.2 Output Functions............................................................................................245.2.1 CurrentOutput................................................................................................. 245.2.2 ContactOutput................................................................................................ 25
5.3 OxygenConcentrationAlarms......................................................................275.3.1 AlarmOutputActions....................................................................................... 275.3.2 SettingAlarms................................................................................................. 28
6. Calibration.............................................................................................296.1 CalibrationOverview.......................................................................................296.2 Calibration Gas................................................................................................296.3 Two-point Calibration......................................................................................306.4 One-point Calibration......................................................................................306.5 Calibration Modes...........................................................................................316.6 SettingtheCalibrationTime...........................................................................31
7. Blow Back Function.............................................................................327.1 Blow Back Modes............................................................................................327.2 BlowBackOperations....................................................................................32
8. Directions for Use.................................................................................338.1 Effect of Coexisting Combustible Gases.....................................................338.2 Effect of Humidity in Reference Gas (Air).....................................................338.3 Precautions When Shutting Down a Furnace or Boiler..............................338.4 Dry Gas Base and Wet Gas Base...................................................................348.5 In Case Equipment is Turned On and Off Frequently..................................34
Revision History............................................................................................35
Model ZR22G, ZR402GDirect in-situSeparateTypeZirconiaOxygenAnalyzers(Hardware Edition)
TI11M12A01-03E1stEdition:Dec.2010(YK)
TI 11M12A01-03E
YokogawaElectricCorporation2-9-32,Nakacho,Musashino-shi,Tokyo,180-8750JapanTel.:81-422-52-5617 Fax.:81-422-52-6792
TI11M12A01-03E
22 1.Overview
2010.12.3-00
1. OverviewOxygenconcentrationiswidelymeasuredforthesakeofconservingenergy,preventingairpollution,controllingquality,andsoforth.Therearemanytypesofoxygenanalyzerswhichusevariousprinciplesofmeasurement.Zirconiaoxygenanalyzers,whichcanmeasuretheoxygenconcentrationinhigh-temperaturegasesdirectly,areoptimalforcombustionmanagementandcontrol,etc.incombustionequipmentandareusedinmanyindustriessuchasiron-andsteelmaking,electricpower,oilandpetrochemicals,chemicals,ceramic,paperandpulp,andtextiles.TheZR22G/ZR402GSeparateTypeZirconiaOxygenAnalyzershavethefollowingfeatures:• Ageneral-purposedetectorcandirectlymeasuregasofupto700ºC.Moreover,when
combinedwiththehigh-temperatureprobeadapter,itcanmeasuregasofupto1400ºC.• FortheZirconiacell,whichisakeycomponentofzirconiaoxygenanalyzers,azirconia
elementandplatinumelectrodesaremolecularlybondedbyamethoddevelopedbyYokogawa.Therefore,thezirconiasensorcandeliverconsistentmeasurementsforalongperiodwithouttheelectrodebeingpeeledoff.
• Theheaterassemblyusedtoheatupthezirconiacellisconstructedsothatitcanbereplacedinthefield.Evenifawireintheheaterbreaks,theheatercanbeeasilyreplacedinthefield.
• Theconverterfeaturesalargeliquid-crystaldisplaythatiseasytoseeandread.• Ahigh-resolutiongraphicdisplayisavailable,andtrendgraphdisplayofupto150minis
possible.• Atouchpanelisusedforoperations,allowinginformationtobeeasilyreadoutandsetup.• Operationsareperformedinteractivelywiththeoperationdisplay,sotheInstructionManual
isnotneededindailyoperations.• Duringcalibration,thesensor(cell)responsetime,internalresistancevalue,zerocalibration
factor,spancollectionfactor,etc.arecheckedandthedataareevaluatedcomprehensively.Thisallowstheremaininglifeofthecelltobepredicted.
• Twocurrentoutputs(4–20mA)andfourSPDTrelaycontactoutputsareavailable.Measurementdata,alarms,errors,etc.canbeoutput.
Thistechnicalinformationdocument(TI11M12A01-03E)isintendedtohelpusersunderstandandmakethebestuseofthesefeaturesoftheZR22G/ZR402GSeparateTypeZirconiaOxygenAnalyzers.Fordescriptionsoftypicalapplications,seethefollowingapplicationeditionofthistechnicalinformationdocument:ZR22G,ZR402GSeparateTypeZirconiaOxygenAnalyzers(ApplicationEdition)(TI11M12A01-01E)
TI11M12A01-03E
32.MeasurementPrincipleofZirconiaOxygenAnalyzers 3
2010.12.3-00
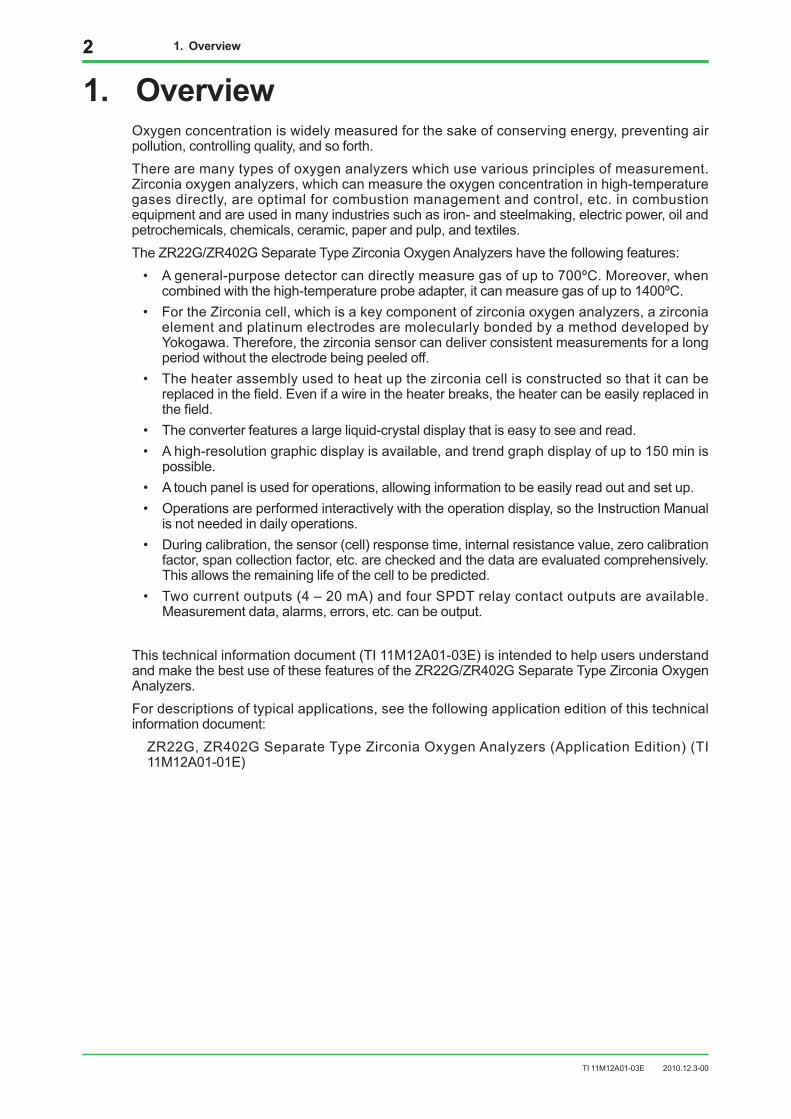
2. MeasurementPrincipleofZirconiaOxygenAnalyzersAsolidelectrolytesuchaszirconiacanconductoxygenionsathightemperature.AsshowninFigure2.1,whenazirconiaelementwithplatinumelectrodesbondedtobothsidesofitisheatedupincontactwithgaseshavingdifferentpartial-oxygenpressuresoneitherside,theelementactsasaconcentrationcell.Inotherwords,theelectrodeincontactwiththegaswithahigherpartial-oxygenpressureactsasanegativeelectrode.Asthegascomesincontactwiththezirconiaelementinthisnegativeelectrode,oxygenmoleculesinthegasacquireelectronsandbecomeoxygenions.Movinginthezirconiaelement,theyeventuallyarriveatthepositiveelectrodeontheoppositeside.There,theelectronsarereleasedandtheionsreturntooxygenmoleculesbythefollowingprocess: Negativeelectrode:O2+4e→2O2-
Positiveelectrode:2O2-→O2+4eBythisreaction,anelectromotiveforceisgeneratedbetweenthetwoelectrodesgovernedbyNernst’sequation:
nF PA
E = - ln ···················· (1)RT PX
where,R: Gasconstant n: 4 F: Faraday’sconstant T: Absolutetemperature Px: Oxygenconcentrationinagas(measurementgas)incontactwiththe
positiveelectrode(%) PA: Oxygenconcentrationinagas(referenceair)incontactwiththenegative
electrode(%)Becausethesensor(zirconiaelement)oftheZR22GDetectorisheatedupto750ºC,equation(1)becomes:
PA
E = -50.74 log ······················ (2)PX
F0201.ai
Reference airPA Electrode(negative)
Zirconia element
Electrode (positive)PX
Measurement gas
Figure 2.1 Schematic diagram of measurement principle
TI11M12A01-03E
44 2.MeasurementPrincipleofZirconiaOxygenAnalyzers
2010.12.3-00
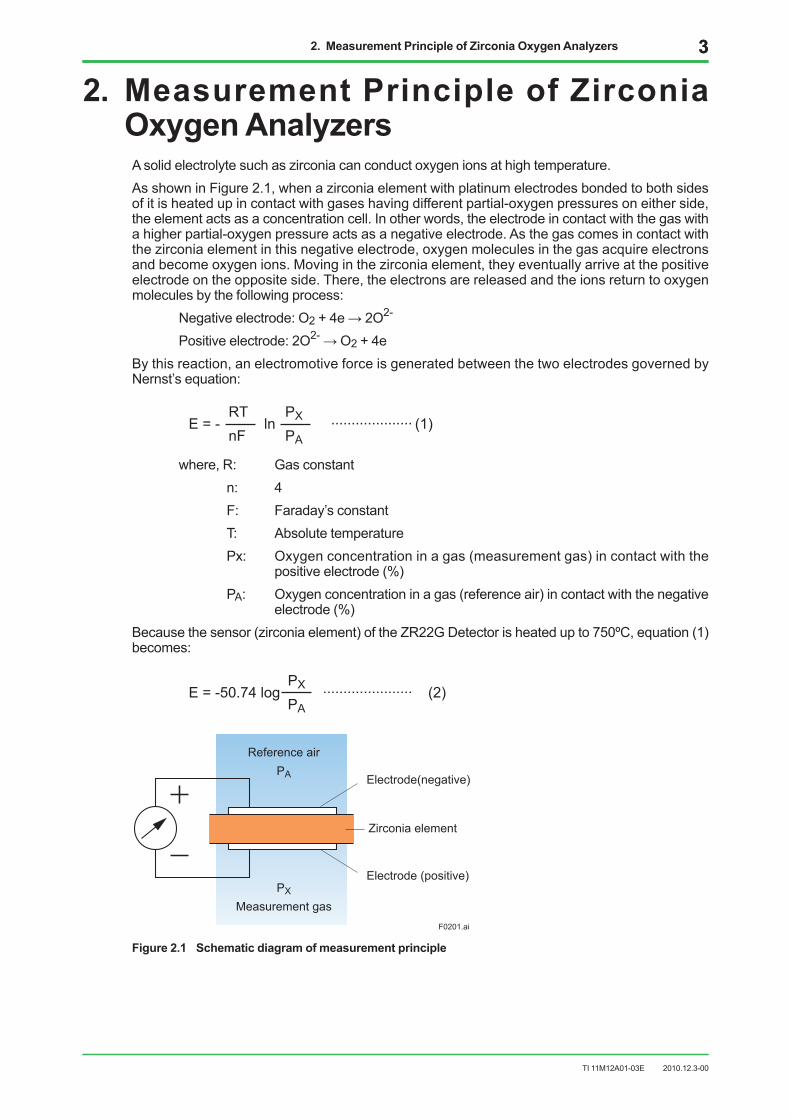
Figure2.2showstheprincipleconstructionoftheZR22GDetector.
F0202.ai
Zirconia element
Measurementgas
Probe
Electrodes
Reference gas
VoltmeterE
Figure 2.2 Principle construction of the ZR22G Detector
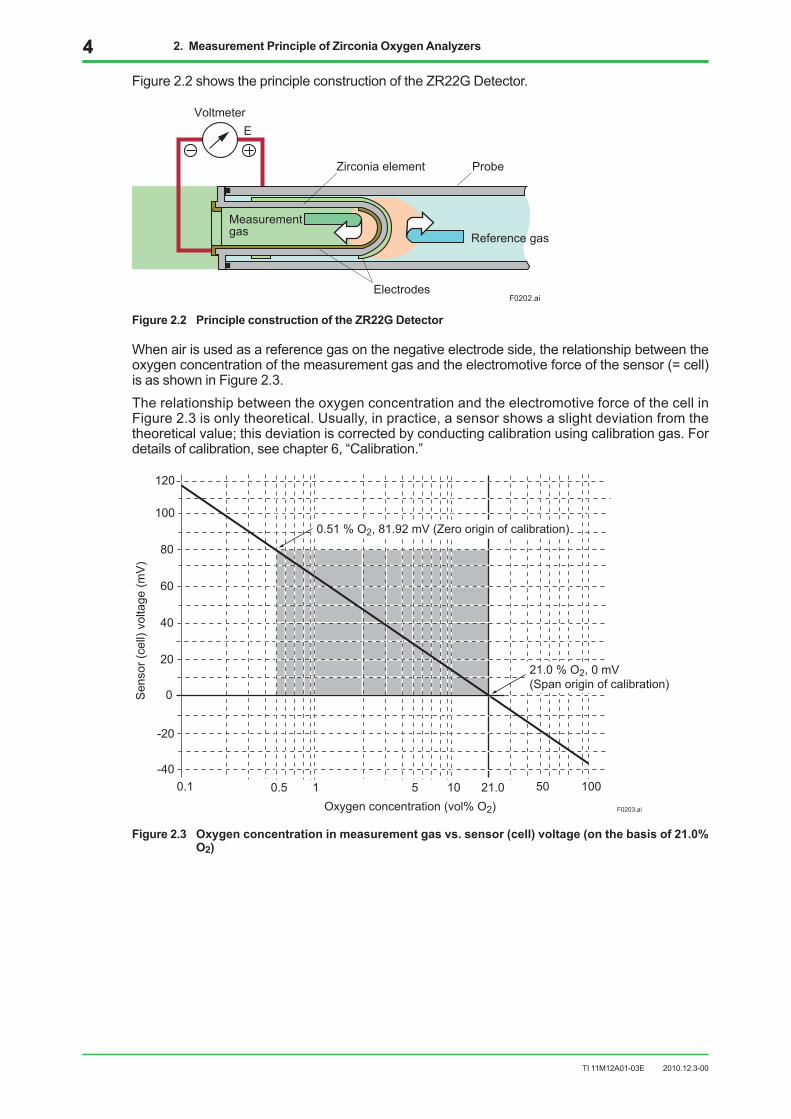
Whenairisusedasareferencegasonthenegativeelectrodeside,therelationshipbetweentheoxygenconcentrationofthemeasurementgasandtheelectromotiveforceofthesensor(=cell)isasshowninFigure2.3.TherelationshipbetweentheoxygenconcentrationandtheelectromotiveforceofthecellinFigure2.3isonlytheoretical.Usually,inpractice,asensorshowsaslightdeviationfromthetheoreticalvalue;thisdeviationiscorrectedbyconductingcalibrationusingcalibrationgas.Fordetailsofcalibration,seechapter6,“Calibration.”
0.1 0.5 1 5 10 21.0 50 100
120
100
80
60
40
20
0
-20
-40
0.51 % O2, 81.92 mV (Zero origin of calibration)
21.0 % O2, 0 mV(Span origin of calibration)
Oxygen concentration (vol% O2) F0203.ai
Sen
sor (
cell)
vol
tage
(mV
)
Figure 2.3 Oxygen concentration in measurement gas vs. sensor (cell) voltage (on the basis of 21.0% O2)
TI11M12A01-03E
53. System Configuration 5
2010.12.3-00
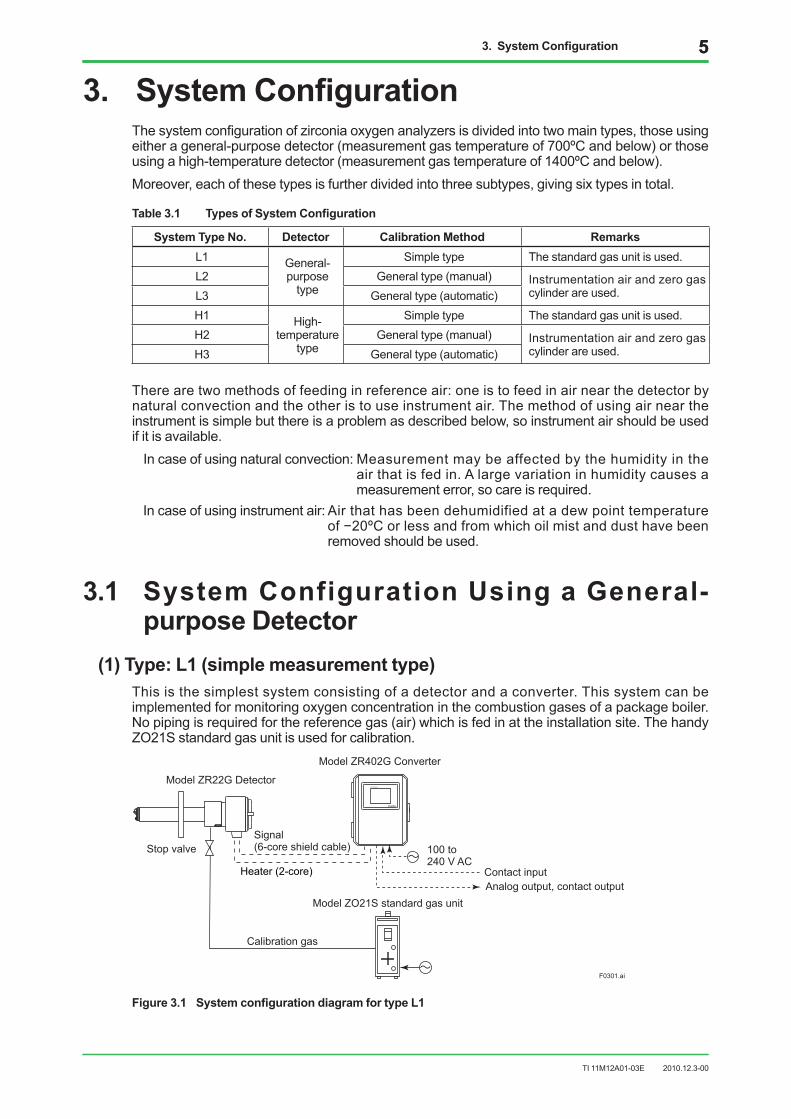
3. System ConfigurationThesystemconfigurationofzirconiaoxygenanalyzersisdividedintotwomaintypes,thoseusingeitherageneral-purposedetector(measurementgastemperatureof700ºCandbelow)orthoseusingahigh-temperaturedetector(measurementgastemperatureof1400ºCandbelow).Moreover,eachofthesetypesisfurtherdividedintothreesubtypes,givingsixtypesintotal.
Table 3.1 Types of System Configuration
SystemTypeNo. Detector Calibration Method RemarksL1 General-
purposetype
Simpletype Thestandardgasunitisused.L2 Generaltype(manual) Instrumentationairandzerogas
cylinderareused.L3 Generaltype(automatic)H1 High-
temperaturetype
Simpletype Thestandardgasunitisused.H2 Generaltype(manual) Instrumentationairandzerogas
cylinderareused.H3 Generaltype(automatic)
Therearetwomethodsoffeedinginreferenceair:oneistofeedinairnearthedetectorbynaturalconvectionandtheotheristouseinstrumentair.Themethodofusingairneartheinstrumentissimplebutthereisaproblemasdescribedbelow,soinstrumentairshouldbeusedifitisavailable.Incaseofusingnaturalconvection:Measurementmaybeaffectedbythehumidityinthe
airthatisfedin.Alargevariationinhumiditycausesameasurementerror,socareisrequired.
Incaseofusinginstrumentair:Airthathasbeendehumidifiedatadewpointtemperatureof−20ºCorlessandfromwhichoilmistanddusthavebeenremovedshouldbeused.
3.1 System Configuration Using a General-purpose Detector
(1) Type: L1 (simple measurement type)Thisisthesimplestsystemconsistingofadetectorandaconverter.Thissystemcanbeimplementedformonitoringoxygenconcentrationinthecombustiongasesofapackageboiler.Nopipingisrequiredforthereferencegas(air)whichisfedinattheinstallationsite.ThehandyZO21Sstandardgasunitisusedforcalibration.
EXA ZR402G
F0301.ai
Model ZR22G Detector
Model ZR402G Converter
Stop valve
Calibration gas
Model ZO21S standard gas unit
100 to240 V AC
Contact inputAnalog output, contact output
Signal(6-core shield cable)
Heater (2-core)
Figure 3.1 System configuration diagram for type L1
TI11M12A01-03E
66 3. System Configuration
2010.12.3-00
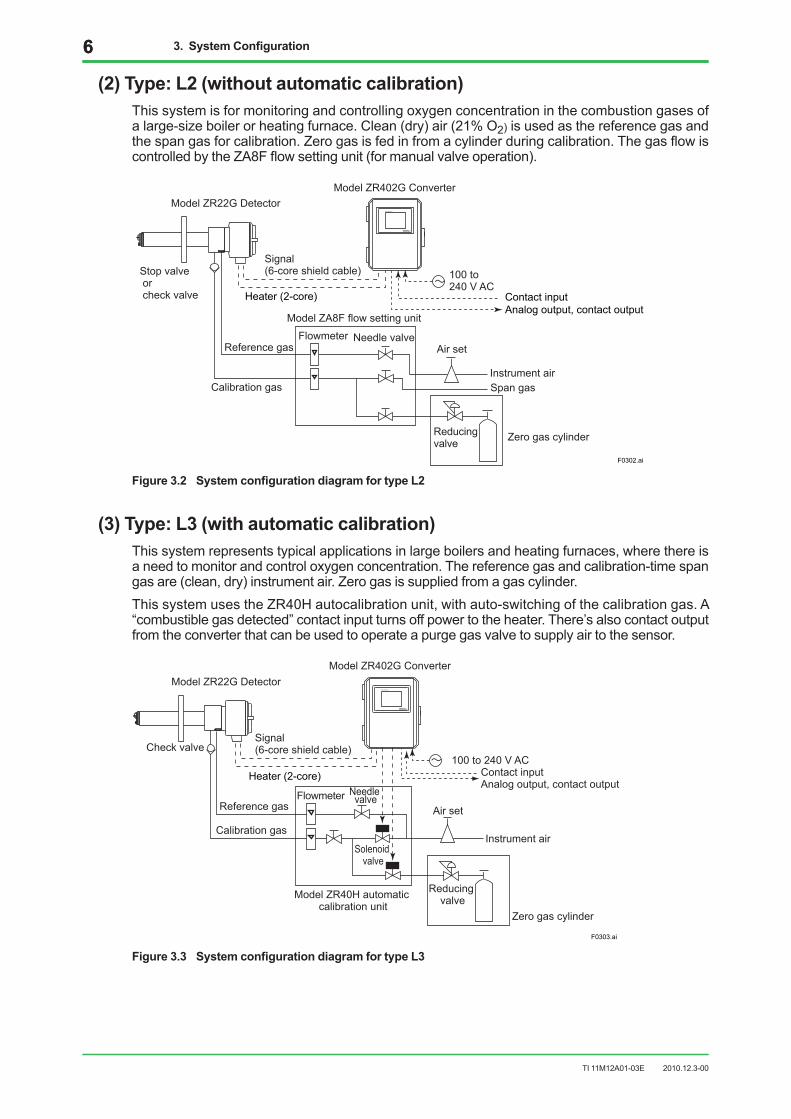
(2) Type: L2 (without automatic calibration)Thissystemisformonitoringandcontrollingoxygenconcentrationinthecombustiongasesofalarge-sizeboilerorheatingfurnace.Clean(dry)air(21%O2)isusedasthereferencegasandthespangasforcalibration.Zerogasisfedinfromacylinderduringcalibration.ThegasflowiscontrolledbytheZA8Fflowsettingunit(formanualvalveoperation).
EXA ZR402G
Model ZR402G Converter
Stop valve or check valve
Model ZA8F flow setting unit
Model ZR22G Detector
100 to240 V AC
Air set
Instrument airCalibration gas
Reference gasFlowmeter Needle valve
Zero gas cylinder
Span gas
Contact inputAnalog output, contact output
Signal(6-core shield cable)
Heater (2-core)
Reducing valve
F0302.ai
Figure 3.2 System configuration diagram for type L2
(3) Type: L3 (with automatic calibration)Thissystemrepresentstypicalapplicationsinlargeboilersandheatingfurnaces,wherethereisaneedtomonitorandcontroloxygenconcentration.Thereferencegasandcalibration-timespangasare(clean,dry)instrumentair.Zerogasissuppliedfromagascylinder.ThissystemusestheZR40Hautocalibrationunit,withauto-switchingofthecalibrationgas.A“combustiblegasdetected”contactinputturnsoffpowertotheheater.There’salsocontactoutputfromtheconverterthatcanbeusedtooperateapurgegasvalvetosupplyairtothesensor.
F0303.ai
EXA ZR402G
Model ZR22G DetectorModel ZR402G Converter
Signal(6-core shield cable)
Heater (2-core)
Reference gas
Calibration gas
Flowmeter Needlevalve
Zero gas cylinder
100 to 240 V ACCheck valve
Model ZR40H automatic calibration unit
Contact inputAnalog output, contact output
Instrument air
Reducingvalve
Solenoidvalve
Air set
Figure 3.3 System configuration diagram for type L3
TI11M12A01-03E
73. System Configuration 7
2010.12.3-00
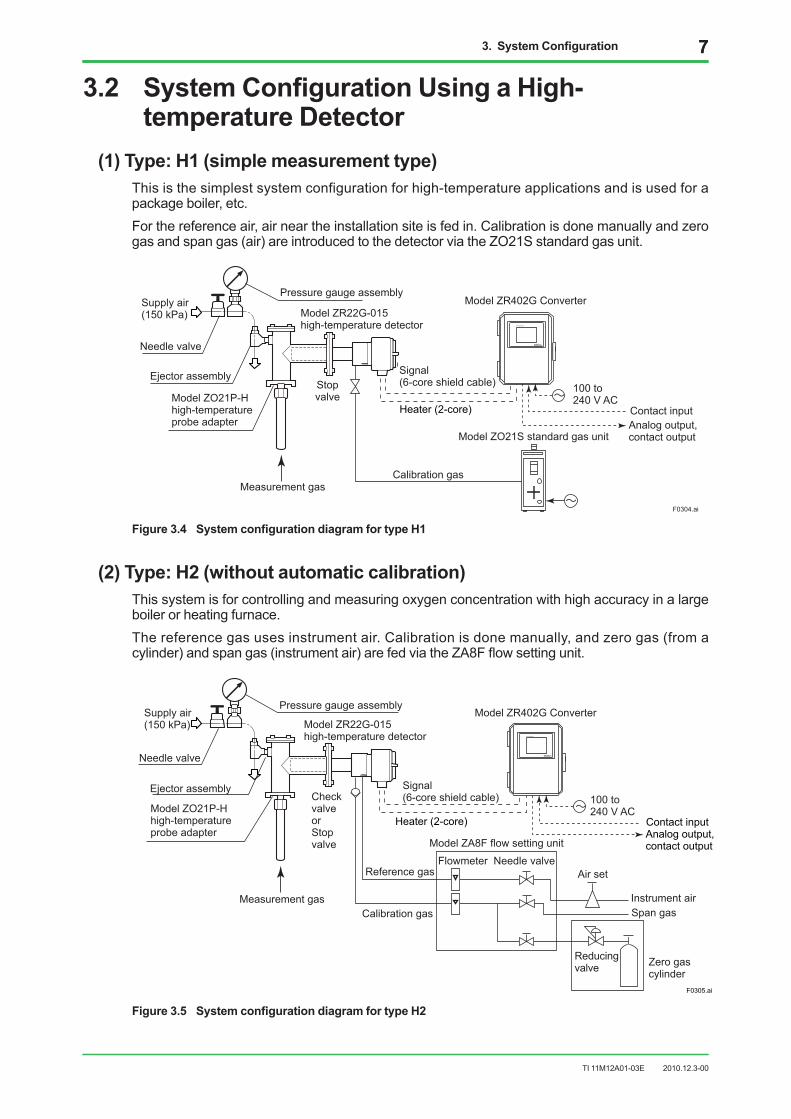
3.2 System Configuration Using a High-temperature Detector
(1) Type: H1 (simple measurement type)Thisisthesimplestsystemconfigurationforhigh-temperatureapplicationsandisusedforapackageboiler,etc.Forthereferenceair,airneartheinstallationsiteisfedin.Calibrationisdonemanuallyandzerogasandspangas(air)areintroducedtothedetectorviatheZO21Sstandardgasunit.
EXA ZR402G
F0304.ai
Model ZR402G Converter
Calibration gas
Stopvalve
Model ZO21S standard gas unit
100 to240 V AC
Contact inputAnalog output,contact output
Signal(6-core shield cable)
Supply air (150 kPa)
Needle valve
Ejector assembly
Pressure gauge assembly
Heater (2-core)
Model ZR22G-015 high-temperature detector
Model ZO21P-H high-temperatureprobe adapter
Measurement gas
Figure 3.4 System configuration diagram for type H1
(2) Type: H2 (without automatic calibration)Thissystemisforcontrollingandmeasuringoxygenconcentrationwithhighaccuracyinalargeboilerorheatingfurnace.Thereferencegasusesinstrumentair.Calibrationisdonemanually,andzerogas(fromacylinder)andspangas(instrumentair)arefedviatheZA8Fflowsettingunit.
F0305.ai
EXA ZR402G
Model ZR402G Converter
Model ZA8F flow setting unit
100 to240 V AC
Air set
Instrument airCalibration gas
CheckvalveorStopvalve
Reducing valve
Reference gasFlowmeter Needle valve
Zero gas cylinder
Span gas
Contact inputAnalog output, contact output
Signal(6-core shield cable)
Heater (2-core)
Supply air (150 kPa)
Needle valve
Ejector assembly
Pressure gauge assembly
Model ZR22G-015 high-temperature detector
Model ZO21P-H high-temperatureprobe adapter
Measurement gas
Figure 3.5 System configuration diagram for type H2
TI11M12A01-03E
3. System Configuration
2010.12.3-00
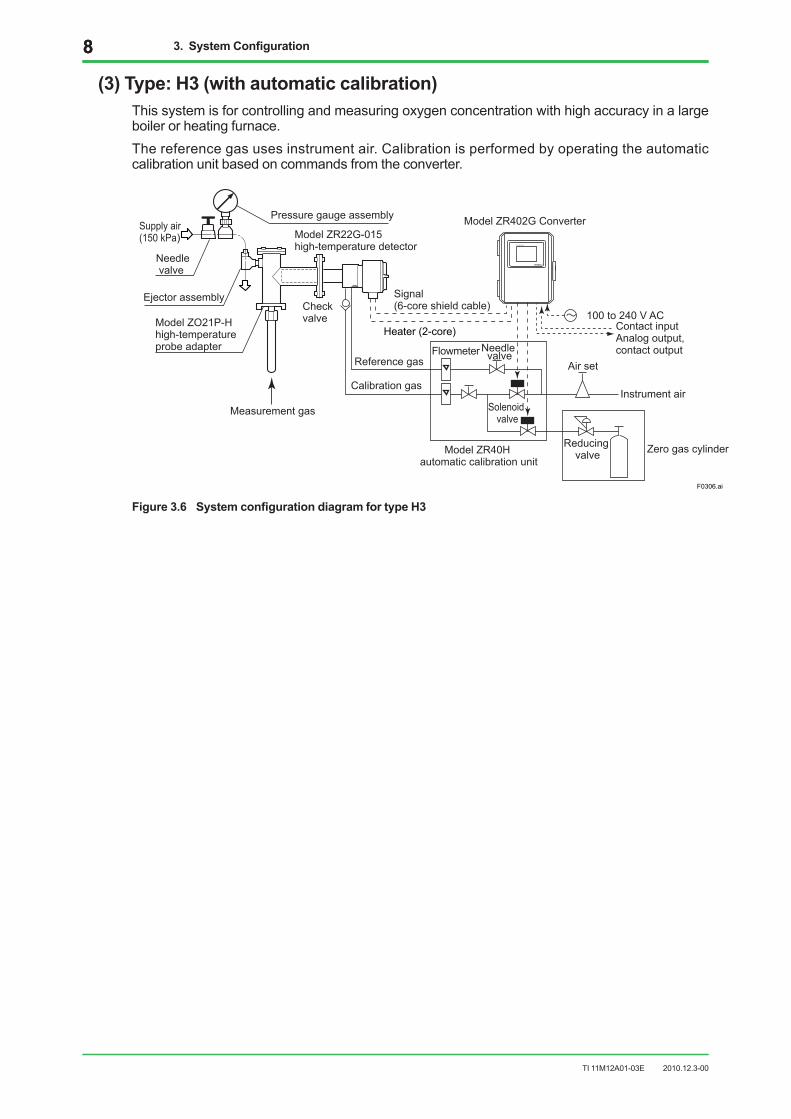
(3) Type: H3 (with automatic calibration)Thissystemisforcontrollingandmeasuringoxygenconcentrationwithhighaccuracyinalargeboilerorheatingfurnace.Thereferencegasusesinstrumentair.Calibrationisperformedbyoperatingtheautomaticcalibrationunitbasedoncommandsfromtheconverter.
F0306.ai
EXA ZR402G
Model ZR22G-015 high-temperature detector
Supply air (150 kPa)
Needle valve
Ejector assembly
Pressure gauge assembly
Model ZO21P-H high-temperatureprobe adapter
Model ZR402G Converter
Signal(6-core shield cable)
Heater (2-core)
Reference gas
Calibration gas
Flowmeter Needlevalve
Zero gas cylinder
100 to 240 V ACCheckvalve
Model ZR40H automatic calibration unit
Contact inputAnalog output, contact output
Instrument air
Reducingvalve
Air set
Solenoid valve
Measurement gas
Figure 3.6 System configuration diagram for type H3
TI11M12A01-03E
94. ZR22G Detector Construction and Features 9
2010.12.3-00
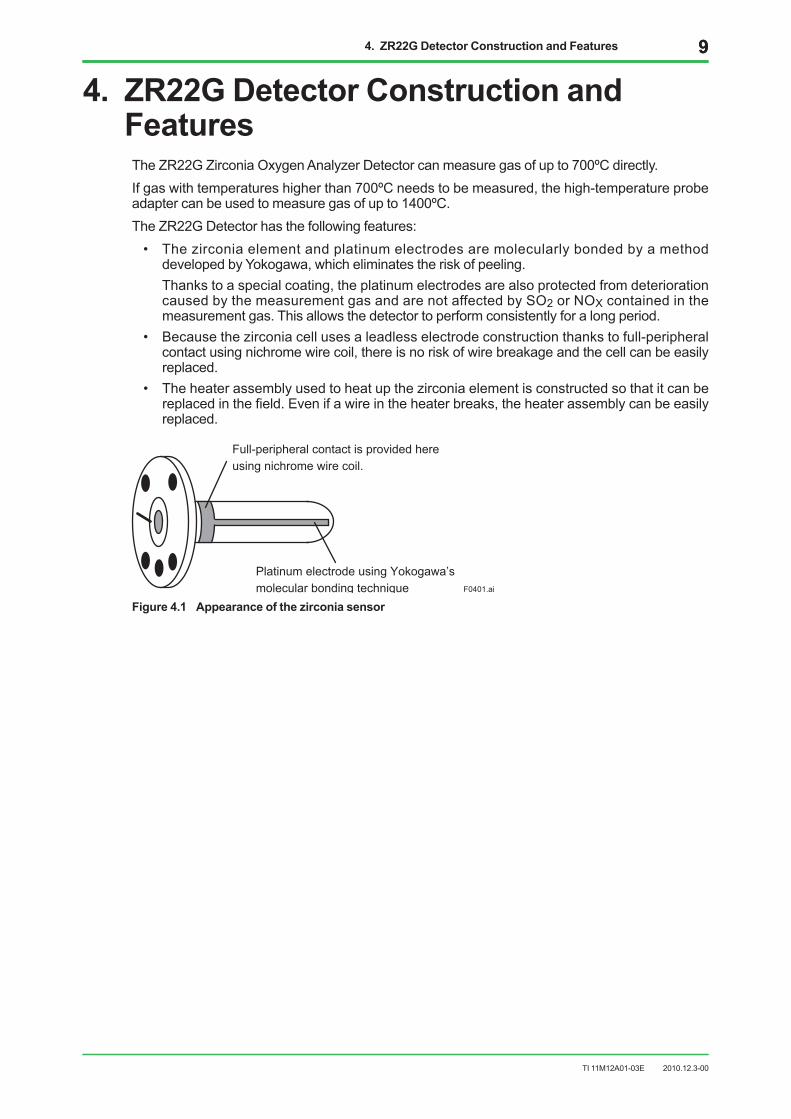
4. ZR22G Detector Construction and FeaturesTheZR22GZirconiaOxygenAnalyzerDetectorcanmeasuregasofupto700ºCdirectly.Ifgaswithtemperatureshigherthan700ºCneedstobemeasured,thehigh-temperatureprobeadaptercanbeusedtomeasuregasofupto1400ºC.TheZR22GDetectorhasthefollowingfeatures:• Thezirconiaelementandplatinumelectrodesaremolecularlybondedbyamethod
developedbyYokogawa,whicheliminatestheriskofpeeling. Thankstoaspecialcoating,theplatinumelectrodesarealsoprotectedfromdeterioration
causedbythemeasurementgasandarenotaffectedbySO2orNOXcontainedinthemeasurementgas.Thisallowsthedetectortoperformconsistentlyforalongperiod.
• Becausethezirconiacellusesaleadlesselectrodeconstructionthankstofull-peripheralcontactusingnichromewirecoil,thereisnoriskofwirebreakageandthecellcanbeeasilyreplaced.
• Theheaterassemblyusedtoheatupthezirconiaelementisconstructedsothatitcanbereplacedinthefield.Evenifawireintheheaterbreaks,theheaterassemblycanbeeasilyreplaced.
Full-peripheral contact is provided here using nichrome wire coil.
Platinum electrode using Yokogawa’smolecular bonding technique F0401.ai
Figure 4.1 Appearance of the zirconia sensor
TI11M12A01-03E
1010 4. ZR22G Detector Construction and Features
2010.12.3-00
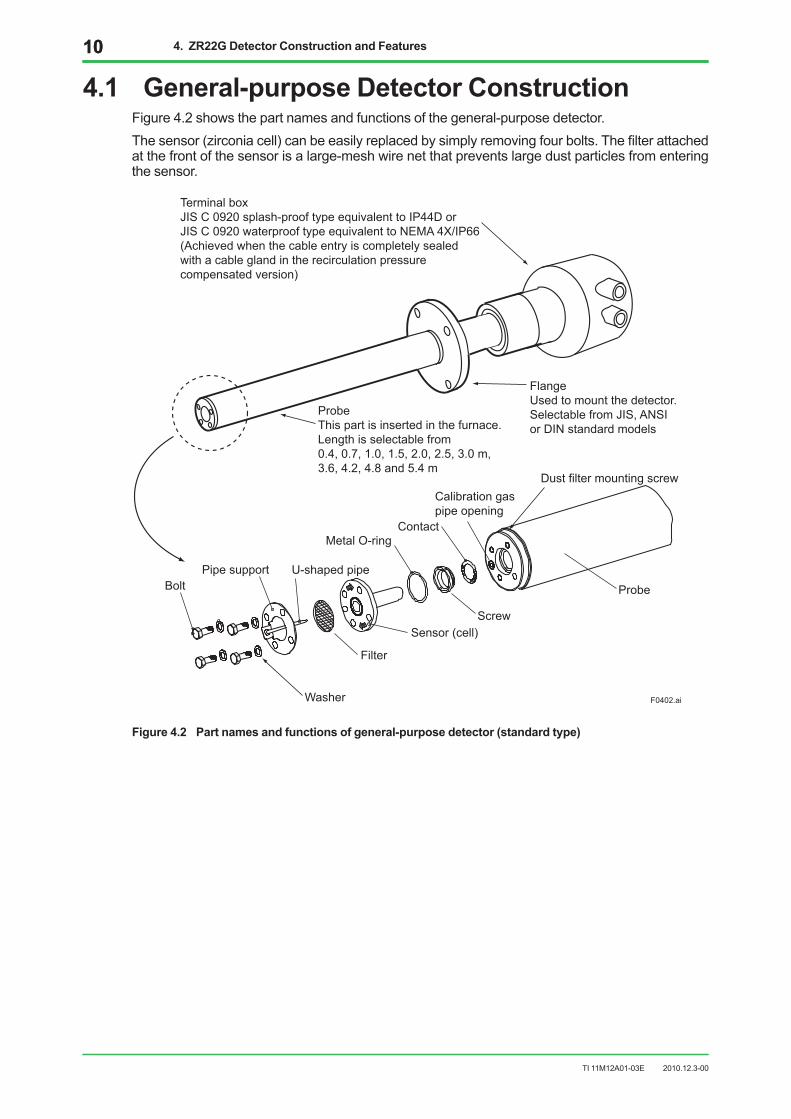
4.1 General-purpose Detector ConstructionFigure4.2showsthepartnamesandfunctionsofthegeneral-purposedetector.Thesensor(zirconiacell)canbeeasilyreplacedbysimplyremovingfourbolts.Thefilterattachedatthefrontofthesensorisalarge-meshwirenetthatpreventslargedustparticlesfromenteringthesensor.
Terminal boxJIS C 0920 splash-proof type equivalent to IP44D orJIS C 0920 waterproof type equivalent to NEMA 4X/IP66(Achieved when the cable entry is completely sealed with a cable gland in the recirculation pressure compensated version)
ProbeThis part is inserted in the furnace.Length is selectable from 0.4, 0.7, 1.0, 1.5, 2.0, 2.5, 3.0 m,3.6, 4.2, 4.8 and 5.4 m
FlangeUsed to mount the detector.Selectable from JIS, ANSI or DIN standard models
F0402.ai
Bolt
Washer
Pipe support U-shaped pipe
Metal O-ring
Dust filter mounting screw
Sensor (cell)
Filter
Contact
Screw
Probe
Calibration gas pipe opening
Figure 4.2 Part names and functions of general-purpose detector (standard type)
TI11M12A01-03E
114. ZR22G Detector Construction and Features 11
2010.12.3-00
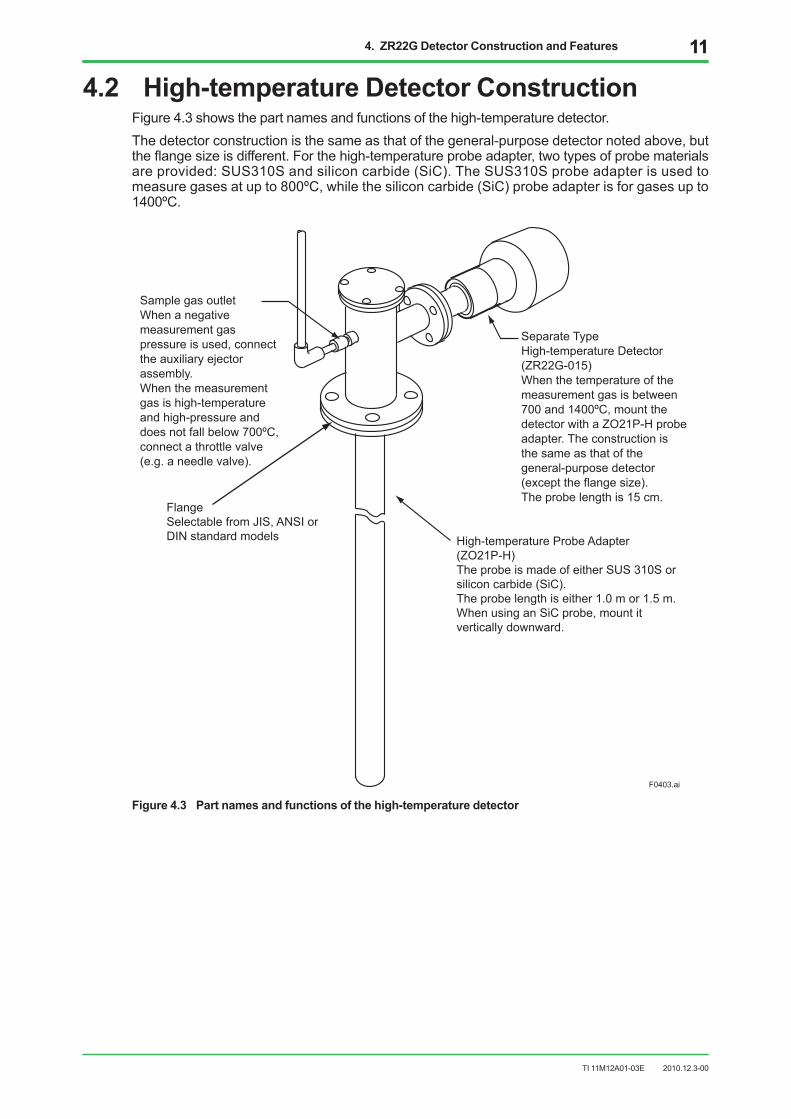
4.2 High-temperature Detector ConstructionFigure4.3showsthepartnamesandfunctionsofthehigh-temperaturedetector.Thedetectorconstructionisthesameasthatofthegeneral-purposedetectornotedabove,buttheflangesizeisdifferent.Forthehigh-temperatureprobeadapter,twotypesofprobematerialsareprovided:SUS310Sandsiliconcarbide(SiC).TheSUS310Sprobeadapterisusedtomeasuregasesatupto800ºC,whilethesiliconcarbide(SiC)probeadapterisforgasesupto1400ºC.
F0403.ai
Sample gas outletWhen a negative measurement gas pressure is used, connect the auxiliary ejector assembly.When the measurement gas is high-temperature and high-pressure and does not fall below 700ºC, connect a throttle valve (e.g. a needle valve).
FlangeSelectable from JIS, ANSI or DIN standard models
Separate Type High-temperature Detector (ZR22G-015)When the temperature of the measurement gas is between 700 and 1400ºC, mount the detector with a ZO21P-H probe adapter. The construction is the same as that of the general-purpose detector (except the flange size).The probe length is 15 cm.
High-temperature Probe Adapter (ZO21P-H)The probe is made of either SUS 310S or silicon carbide (SiC).The probe length is either 1.0 m or 1.5 m.When using an SiC probe, mount it vertically downward.
Figure 4.3 Part names and functions of the high-temperature detector
TI11M12A01-03E
1212 4. ZR22G Detector Construction and Features
2010.12.3-00
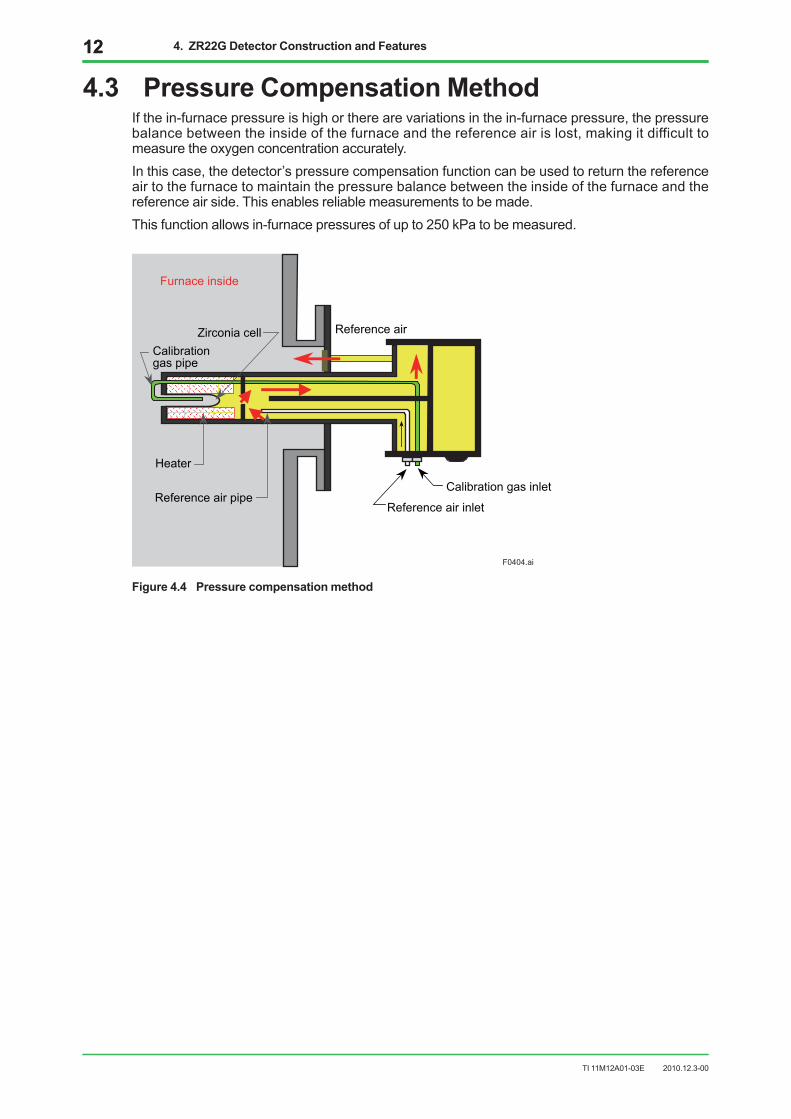
4.3 Pressure Compensation MethodIfthein-furnacepressureishighortherearevariationsinthein-furnacepressure,thepressurebalancebetweentheinsideofthefurnaceandthereferenceairislost,makingitdifficulttomeasuretheoxygenconcentrationaccurately.Inthiscase,thedetector’spressurecompensationfunctioncanbeusedtoreturnthereferenceairtothefurnacetomaintainthepressurebalancebetweentheinsideofthefurnaceandthereferenceairside.Thisenablesreliablemeasurementstobemade.Thisfunctionallowsin-furnacepressuresofupto250kPatobemeasured.
Furnace inside
Calibrationgas pipe
Zirconia cell
Heater
Reference air pipeReference air inlet
Calibration gas inlet
Reference air
F0404.ai
Figure 4.4 Pressure compensation method
TI11M12A01-03E
135. ZR402G Converter Functions and Features 13
2010.12.3-00
5. ZR402G Converter Functions and Features
5.1 Human Machine Interface (HMI)• Equippedwithaback-litlargedisplayunitthatiseasytoseeandread.• High-resolutiongraphicdisplay.Upto150minutesoftrendgraphcanbedisplayed.• Thetouchpanelallowsinformationtobeeasilyreadandsetup.• Interactiveoperationsalongwithoperationdisplay,eliminatingtheneedforanInstruction
Manual.
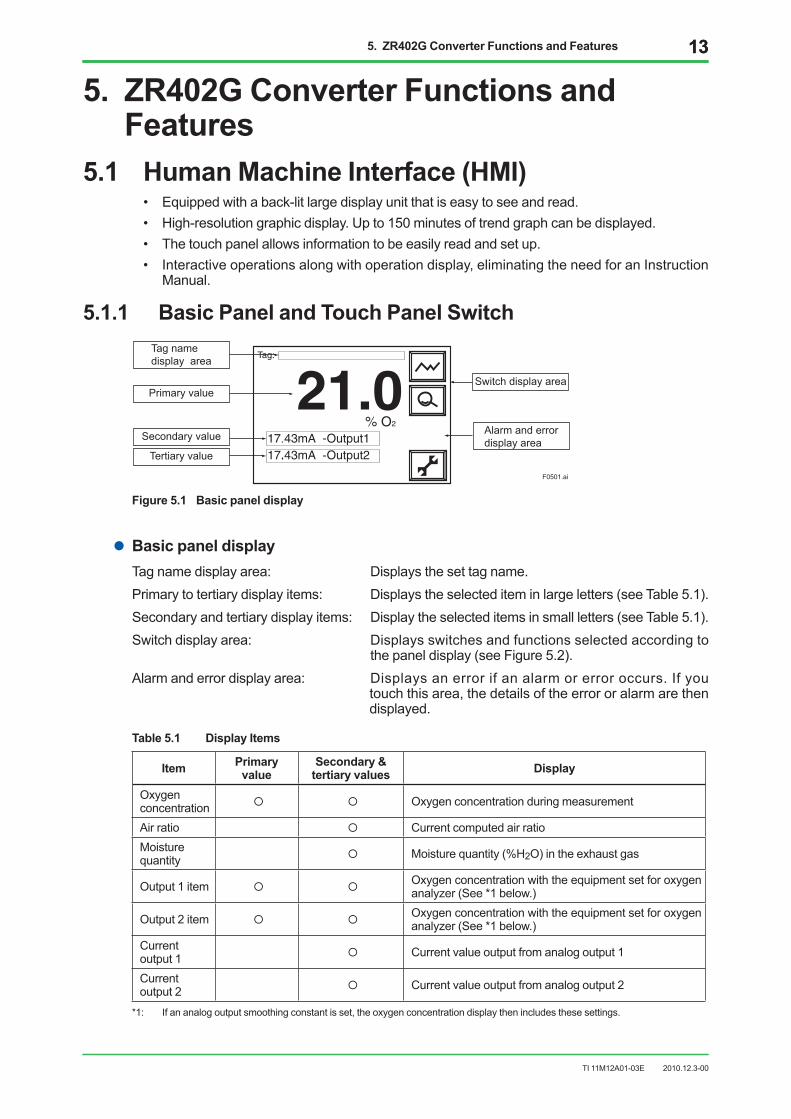
5.1.1 Basic Panel and Touch Panel Switch
F0501.ai
Tag name display area
Primary value
Secondary value
Tertiary value
Switch display area
Alarm and error display area
Figure 5.1 Basic panel display
l Basic panel displayTagnamedisplayarea: Displaysthesettagname.Primarytotertiarydisplayitems: Displaystheselectediteminlargeletters(seeTable5.1).Secondaryandtertiarydisplayitems: Displaytheselecteditemsinsmallletters(seeTable5.1).Switchdisplayarea: Displaysswitchesandfunctionsselectedaccordingto
thepaneldisplay(seeFigure5.2).Alarmanderrordisplayarea: Displaysanerrorifanalarmorerroroccurs.Ifyou
touchthisarea,thedetailsoftheerrororalarmarethendisplayed.
Table 5.1 Display Items
Item Primaryvalue
Secondary & tertiaryvalues Display
Oxygenconcentration Oxygenconcentrationduringmeasurement
Airratio CurrentcomputedairratioMoisturequantity Moisturequantity(%H2O)intheexhaustgas
Output1item Oxygenconcentrationwiththeequipmentsetforoxygenanalyzer(See*1below.)
Output2item Oxygenconcentrationwiththeequipmentsetforoxygenanalyzer(See*1below.)
Currentoutput1 Currentvalueoutputfromanalogoutput1
Currentoutput2 Currentvalueoutputfromanalogoutput2
*1: Ifananalogoutputsmoothingconstantisset,theoxygenconcentrationdisplaythenincludesthesesettings.
TI11M12A01-03E
1414 5. ZR402G Converter Functions and Features
2010.12.3-00
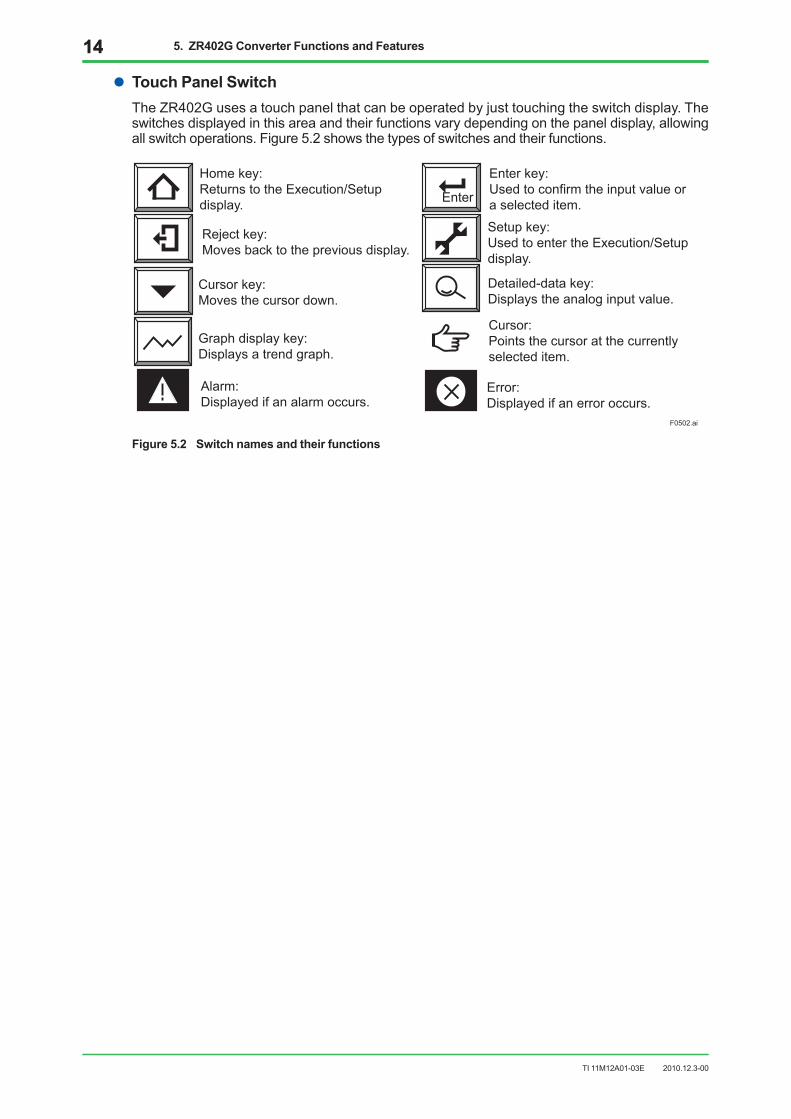
l TouchPanelSwitchTheZR402Gusesatouchpanelthatcanbeoperatedbyjusttouchingtheswitchdisplay.Theswitchesdisplayedinthisareaandtheirfunctionsvarydependingonthepaneldisplay,allowingallswitchoperations.Figure5.2showsthetypesofswitchesandtheirfunctions.
Enter
Home key:Returns to the Execution/Setup display.
Reject key:Moves back to the previous display.
Cursor key:Moves the cursor down.
Graph display key:Displays a trend graph.
Alarm:Displayed if an alarm occurs.
Enter key:Used to confirm the input value or a selected item.
Setup key:Used to enter the Execution/Setup display.
Detailed-data key:Displays the analog input value.
Cursor:Points the cursor at the currently selected item.
Error:Displayed if an error occurs.
F0502.ai
Figure 5.2 Switch names and their functions
TI11M12A01-03E
155. ZR402G Converter Functions and Features 15
2010.12.3-00
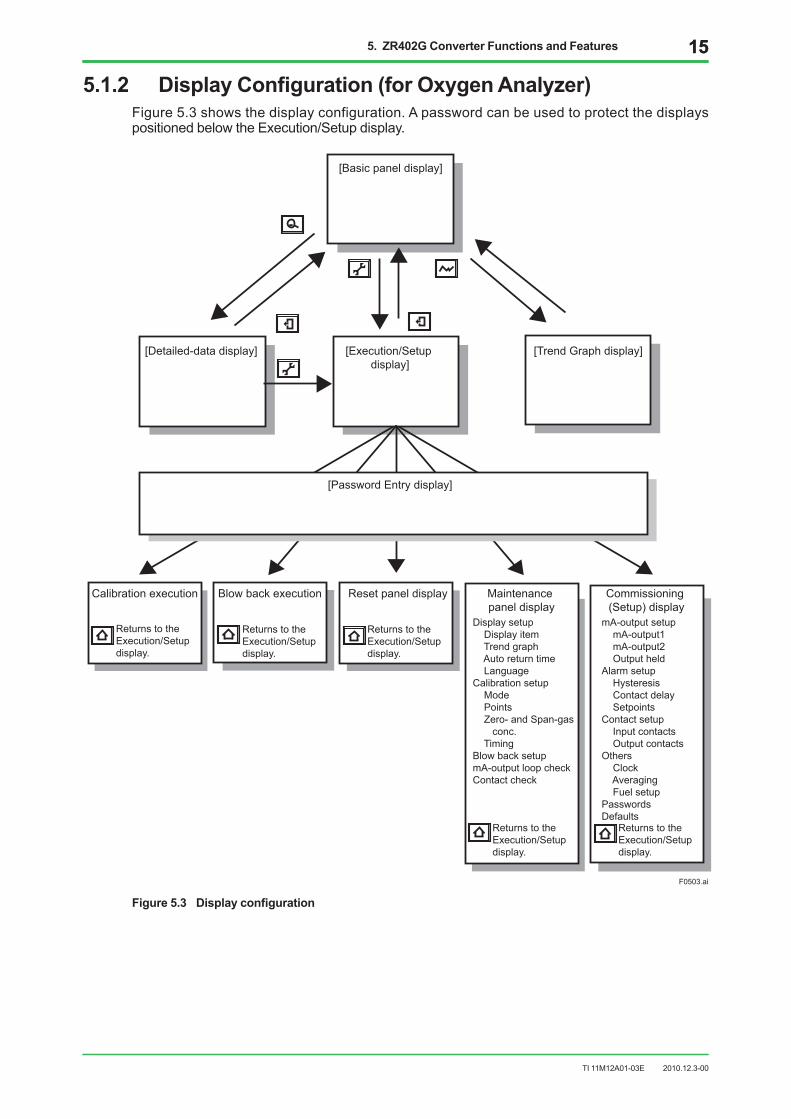
5.1.2 Display Configuration (for Oxygen Analyzer)Figure5.3showsthedisplayconfiguration.ApasswordcanbeusedtoprotectthedisplayspositionedbelowtheExecution/Setupdisplay.
[Basic panel display]
[Detailed-data display] [Execution/Setupdisplay]
[Trend Graph display]
[Password Entry display]
Calibration execution
Returns to the Execution/Setupdisplay.
Blow back execution
Returns to the Execution/Setupdisplay.
Reset panel display
Returns to the Execution/Setupdisplay.
F0503.ai
Maintenancepanel display
Returns to the Execution/Setupdisplay.
Commissioning(Setup) display
Returns to the Execution/Setupdisplay.
Display setup Display item Trend graph Auto return time LanguageCalibration setup Mode Points Zero- and Span-gas conc. TimingBlow back setupmA-output loop checkContact check
mA-output setup mA-output1 mA-output2 Output heldAlarm setup Hysteresis Contact delay SetpointsContact setup Input contacts Output contactsOthers Clock Averaging Fuel setupPasswordsDefaults
Figure 5.3 Display configuration
TI11M12A01-03E
1616 5. ZR402G Converter Functions and Features
2010.12.3-00
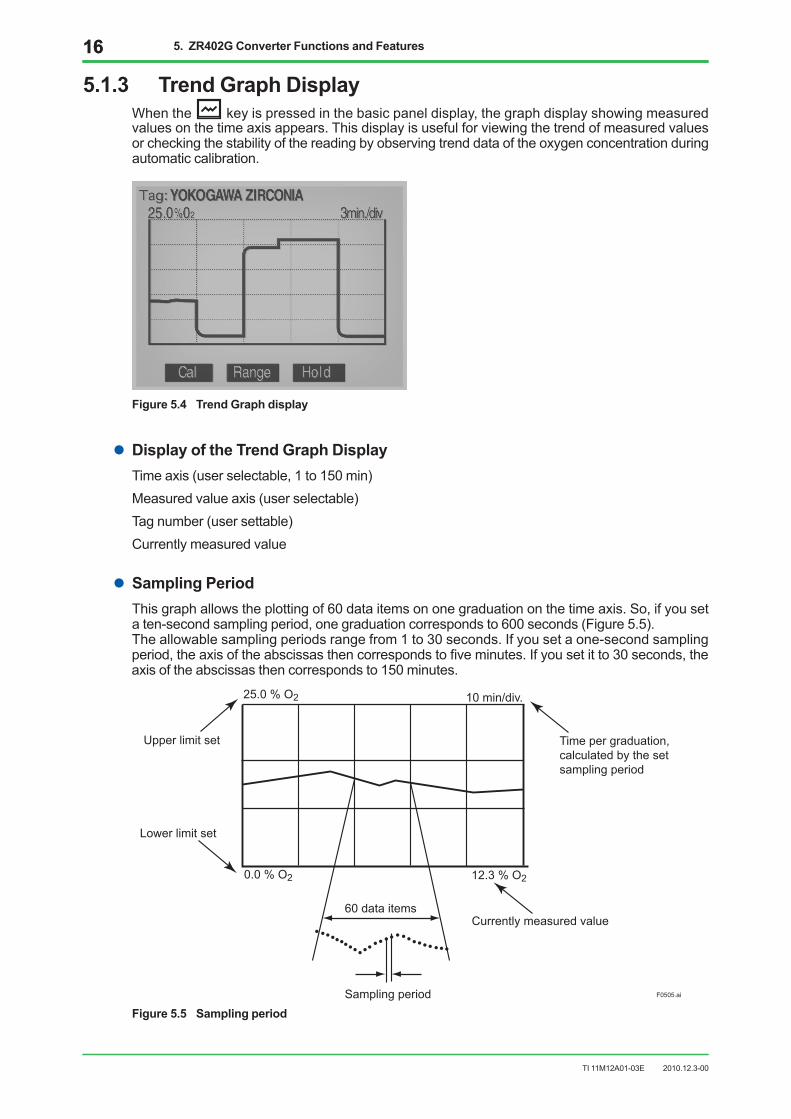
5.1.3 Trend Graph DisplayWhenthe keyispressedinthebasicpaneldisplay,thegraphdisplayshowingmeasuredvaluesonthetimeaxisappears.Thisdisplayisusefulforviewingthetrendofmeasuredvaluesorcheckingthestabilityofthereadingbyobservingtrenddataoftheoxygenconcentrationduringautomaticcalibration.
Figure 5.4 Trend Graph display
l Display of the Trend Graph DisplayTimeaxis(userselectable,1to150min)Measuredvalueaxis(userselectable)Tagnumber(usersettable)Currentlymeasuredvalue
l Sampling PeriodThisgraphallowstheplottingof60dataitemsononegraduationonthetimeaxis.So,ifyousetaten-secondsamplingperiod,onegraduationcorrespondsto600seconds(Figure5.5).Theallowablesamplingperiodsrangefrom1to30seconds.Ifyousetaone-secondsamplingperiod,theaxisoftheabscissasthencorrespondstofiveminutes.Ifyousetitto30seconds,theaxisoftheabscissasthencorrespondsto150minutes.
0.0 % O2
25.0 % O2
Upper limit set
Lower limit set
10 min/div.
Sampling period
60 data items
12.3 % O2
Currently measured value
Time per graduation, calculated by the set sampling period
F0505.ai
Figure 5.5 Sampling period
TI11M12A01-03E
175. ZR402G Converter Functions and Features 17
2010.12.3-00
l Measured Value AxisSettheupperandlowerlimitsofmeasuredvaluesonthey-axisofthegraph.Theallowablesettingsforbothupper-limitandlower-limitvaluesrangefrom0to100%O2.
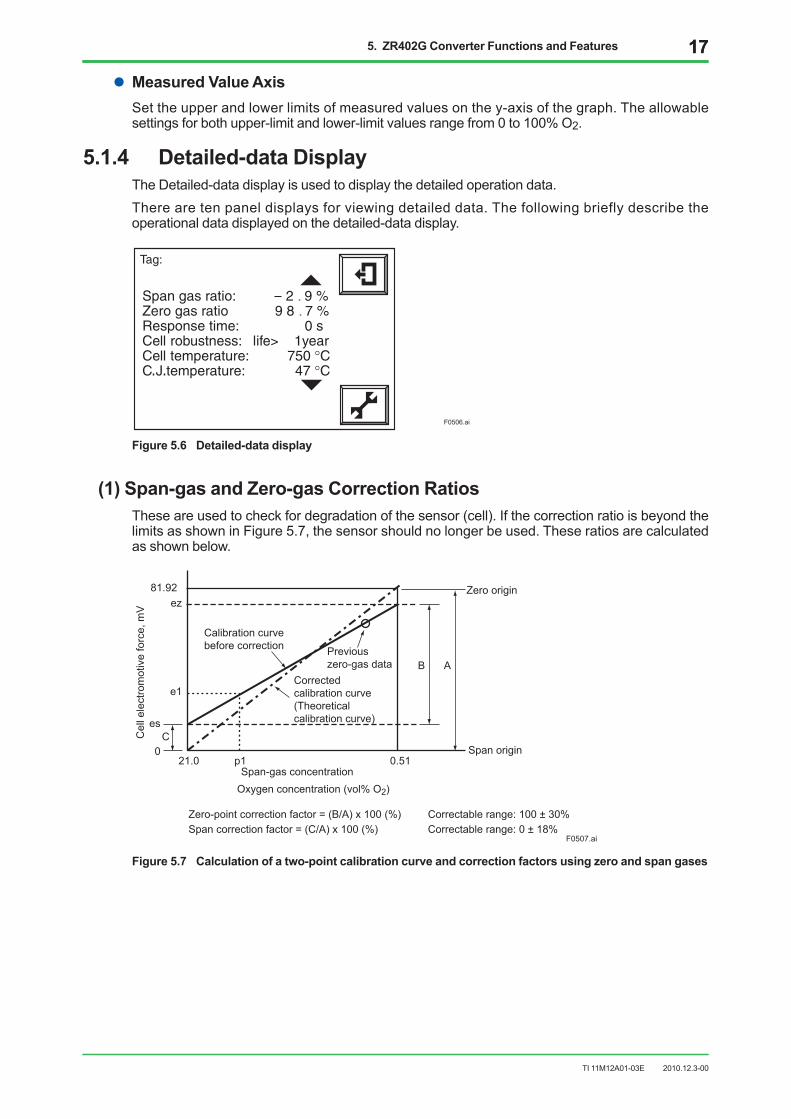
5.1.4 Detailed-data DisplayTheDetailed-datadisplayisusedtodisplaythedetailedoperationdata.Therearetenpaneldisplaysforviewingdetaileddata.Thefollowingbrieflydescribetheoperationaldatadisplayedonthedetailed-datadisplay.
F0506.ai
Figure 5.6 Detailed-data display
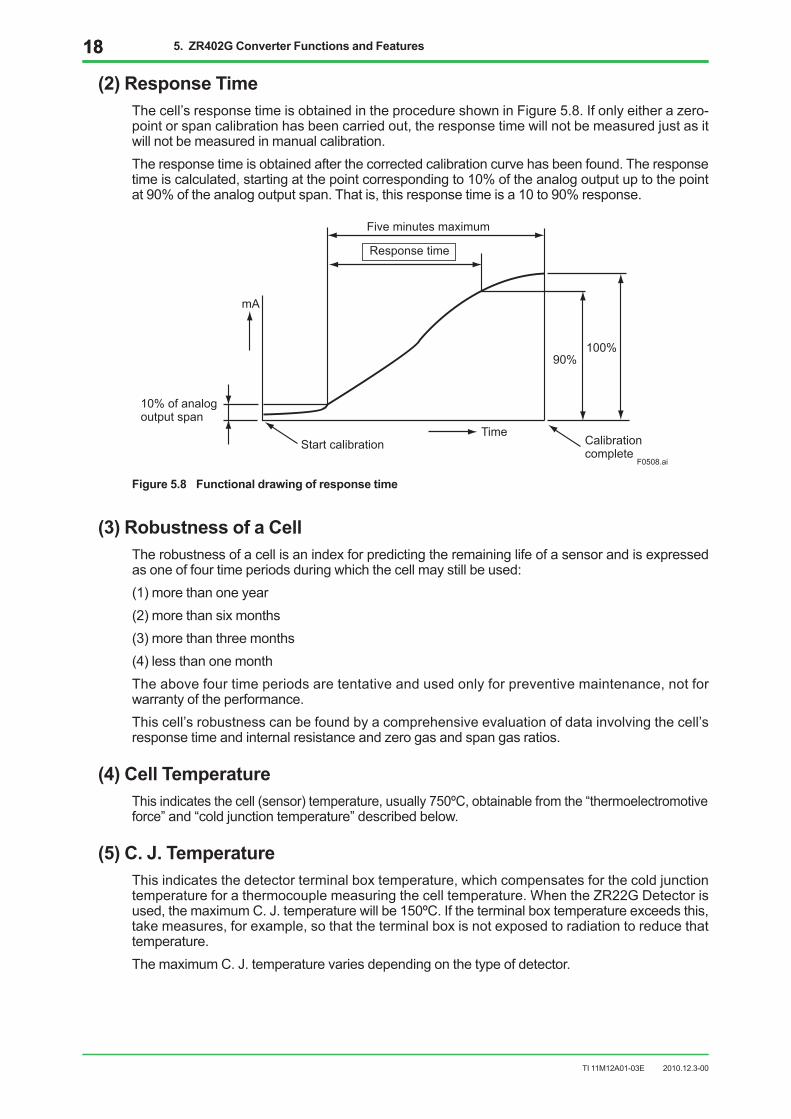
(1) Span-gas and Zero-gas Correction RatiosTheseareusedtocheckfordegradationofthesensor(cell).IfthecorrectionratioisbeyondthelimitsasshowninFigure5.7,thesensorshouldnolongerbeused.Theseratiosarecalculatedasshownbelow.
21.0 p1 0.51
81.92ez
e1
es
0C
AB
F0507.ai
Cel
l ele
ctro
mot
ive
forc
e, m
V
Calibration curve before correction
Correctedcalibration curve(Theoreticalcalibration curve)
Previouszero-gas data
Zero origin
Span origin
Span-gas concentrationOxygen concentration (vol% O2)
Span correction factor = (C/A) x 100 (%) Correctable range: 0 ± 18%Zero-point correction factor = (B/A) x 100 (%) Correctable range: 100 ± 30%
Figure 5.7 Calculation of a two-point calibration curve and correction factors using zero and span gases
TI11M12A01-03E
11 5. ZR402G Converter Functions and Features
2010.12.3-00
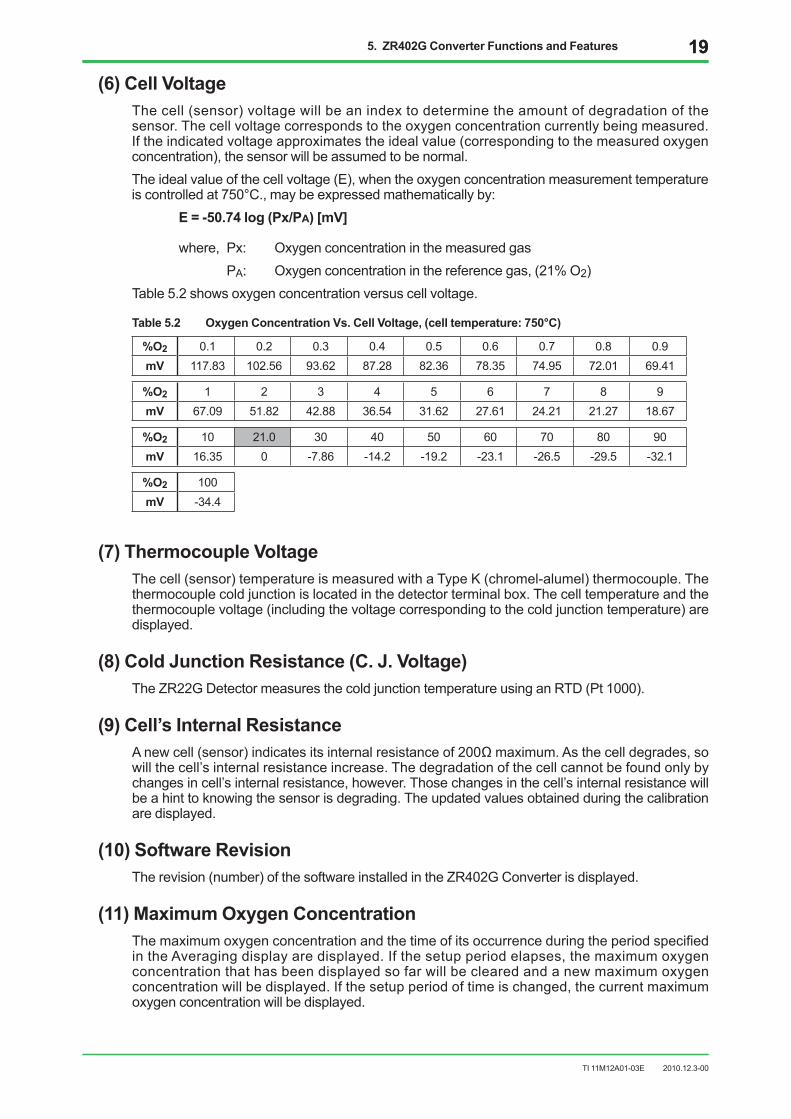
(2) Response TimeThecell’sresponsetimeisobtainedintheprocedureshowninFigure5.8.Ifonlyeitherazero-pointorspancalibrationhasbeencarriedout,theresponsetimewillnotbemeasuredjustasitwillnotbemeasuredinmanualcalibration.Theresponsetimeisobtainedafterthecorrectedcalibrationcurvehasbeenfound.Theresponsetimeiscalculated,startingatthepointcorrespondingto10%oftheanalogoutputuptothepointat90%oftheanalogoutputspan.Thatis,thisresponsetimeisa10to90%response.
10% of analog output span
Five minutes maximum
mA
90%100%
Start calibrationTime
Calibrationcomplete
F0508.ai
Response time
Figure 5.8 Functional drawing of response time
(3) Robustness of a CellTherobustnessofacellisanindexforpredictingtheremaininglifeofasensorandisexpressedasoneoffourtimeperiodsduringwhichthecellmaystillbeused:(1)morethanoneyear(2)morethansixmonths(3)morethanthreemonths(4)lessthanonemonthTheabovefourtimeperiodsaretentativeandusedonlyforpreventivemaintenance,notforwarrantyoftheperformance.Thiscell’srobustnesscanbefoundbyacomprehensiveevaluationofdatainvolvingthecell’sresponsetimeandinternalresistanceandzerogasandspangasratios.
(4) Cell TemperatureThisindicatesthecell(sensor)temperature,usually750ºC,obtainablefromthe“thermoelectromotiveforce”and“coldjunctiontemperature”describedbelow.
(5) C. J. TemperatureThisindicatesthedetectorterminalboxtemperature,whichcompensatesforthecoldjunctiontemperatureforathermocouplemeasuringthecelltemperature.WhentheZR22GDetectorisused,themaximumC.J.temperaturewillbe150ºC.Iftheterminalboxtemperatureexceedsthis,takemeasures,forexample,sothattheterminalboxisnotexposedtoradiationtoreducethattemperature.ThemaximumC.J.temperaturevariesdependingonthetypeofdetector.
TI11M12A01-03E
195. ZR402G Converter Functions and Features 19
2010.12.3-00
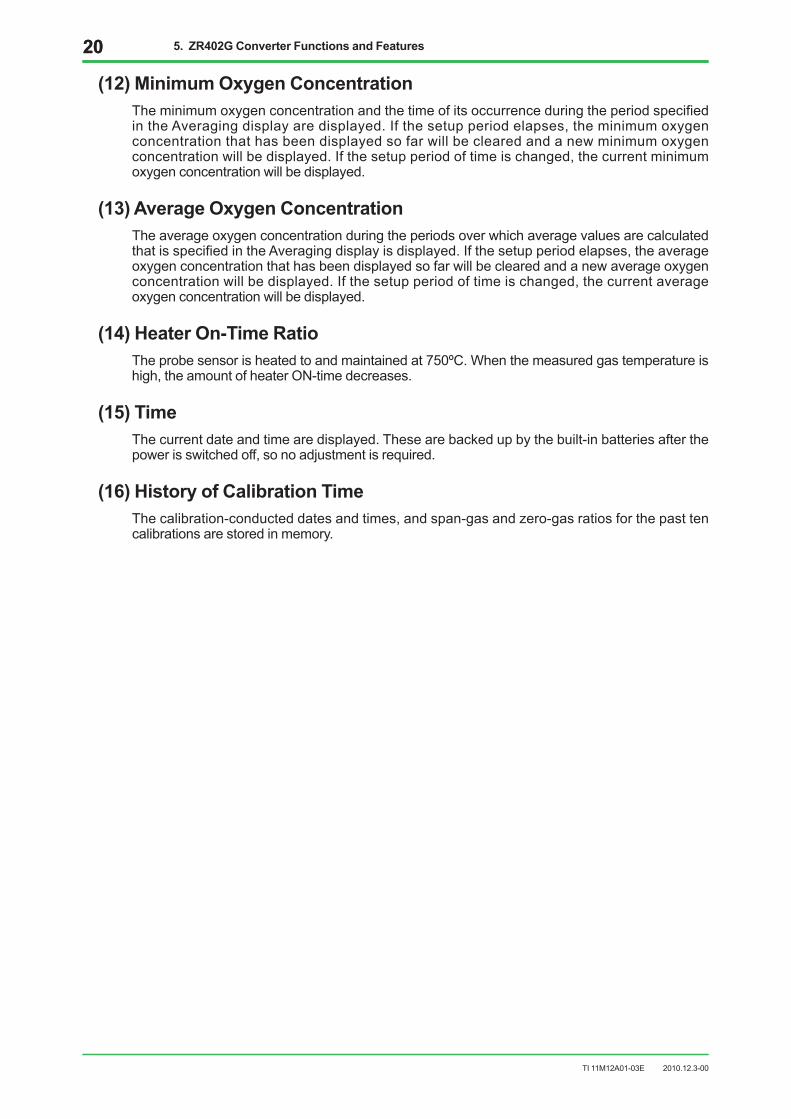
(6) Cell VoltageThecell(sensor)voltagewillbeanindextodeterminetheamountofdegradationofthesensor.Thecellvoltagecorrespondstotheoxygenconcentrationcurrentlybeingmeasured.Iftheindicatedvoltageapproximatestheidealvalue(correspondingtothemeasuredoxygenconcentration),thesensorwillbeassumedtobenormal.Theidealvalueofthecellvoltage(E),whentheoxygenconcentrationmeasurementtemperatureiscontrolledat750°C.,maybeexpressedmathematicallyby: E = -50.74 log (Px/PA) [mV]
where,Px: Oxygenconcentrationinthemeasuredgas PA: Oxygenconcentrationinthereferencegas,(21%O2)Table5.2showsoxygenconcentrationversuscellvoltage.
Table 5.2 Oxygen Concentration Vs. Cell Voltage, (cell temperature: 750°C)
%O2 0.1 0.2 0.3 0.4 0.5 0.6 0.7 0.8 0.9mV 117.83 102.56 93.62 87.28 82.36 78.35 74.95 72.01 69.41
%O2 1 2 3 4 5 6 7 8 9mV 67.09 51.82 42.88 36.54 31.62 27.61 24.21 21.27 18.67
%O2 10 21.0 30 40 50 60 70 80 90mV 16.35 0 -7.86 -14.2 -19.2 -23.1 -26.5 -29.5 -32.1
%O2 100mV -34.4
(7) Thermocouple VoltageThecell(sensor)temperatureismeasuredwithaTypeK(chromel-alumel)thermocouple.Thethermocouplecoldjunctionislocatedinthedetectorterminalbox.Thecelltemperatureandthethermocouplevoltage(includingthevoltagecorrespondingtothecoldjunctiontemperature)aredisplayed.
(8) Cold Junction Resistance (C. J. Voltage)TheZR22GDetectormeasuresthecoldjunctiontemperatureusinganRTD(Pt1000).
(9) Cell’s Internal ResistanceAnewcell(sensor)indicatesitsinternalresistanceof200Ωmaximum.Asthecelldegrades,sowillthecell’sinternalresistanceincrease.Thedegradationofthecellcannotbefoundonlybychangesincell’sinternalresistance,however.Thosechangesinthecell’sinternalresistancewillbeahinttoknowingthesensorisdegrading.Theupdatedvaluesobtainedduringthecalibrationaredisplayed.
(10) Software RevisionTherevision(number)ofthesoftwareinstalledintheZR402GConverterisdisplayed.
(11) Maximum Oxygen ConcentrationThemaximumoxygenconcentrationandthetimeofitsoccurrenceduringtheperiodspecifiedintheAveragingdisplayaredisplayed.Ifthesetupperiodelapses,themaximumoxygenconcentrationthathasbeendisplayedsofarwillbeclearedandanewmaximumoxygenconcentrationwillbedisplayed.Ifthesetupperiodoftimeischanged,thecurrentmaximumoxygenconcentrationwillbedisplayed.
TI11M12A01-03E
2020 5. ZR402G Converter Functions and Features
2010.12.3-00
(12) Minimum Oxygen ConcentrationTheminimumoxygenconcentrationandthetimeofitsoccurrenceduringtheperiodspecifiedintheAveragingdisplayaredisplayed.Ifthesetupperiodelapses,theminimumoxygenconcentrationthathasbeendisplayedsofarwillbeclearedandanewminimumoxygenconcentrationwillbedisplayed.Ifthesetupperiodoftimeischanged,thecurrentminimumoxygenconcentrationwillbedisplayed.
(13) Average Oxygen ConcentrationTheaverageoxygenconcentrationduringtheperiodsoverwhichaveragevaluesarecalculatedthatisspecifiedintheAveragingdisplayisdisplayed.Ifthesetupperiodelapses,theaverageoxygenconcentrationthathasbeendisplayedsofarwillbeclearedandanewaverageoxygenconcentrationwillbedisplayed.Ifthesetupperiodoftimeischanged,thecurrentaverageoxygenconcentrationwillbedisplayed.
(14) Heater On-Time RatioTheprobesensorisheatedtoandmaintainedat750ºC.Whenthemeasuredgastemperatureishigh,theamountofheaterON-timedecreases.
(15) TimeThecurrentdateandtimearedisplayed.Thesearebackedupbythebuilt-inbatteriesafterthepowerisswitchedoff,sonoadjustmentisrequired.
(16) History of Calibration TimeThecalibration-conducteddatesandtimes,andspan-gasandzero-gasratiosforthepasttencalibrationsarestoredinmemory.
TI11M12A01-03E
215. ZR402G Converter Functions and Features 21
2010.12.3-00
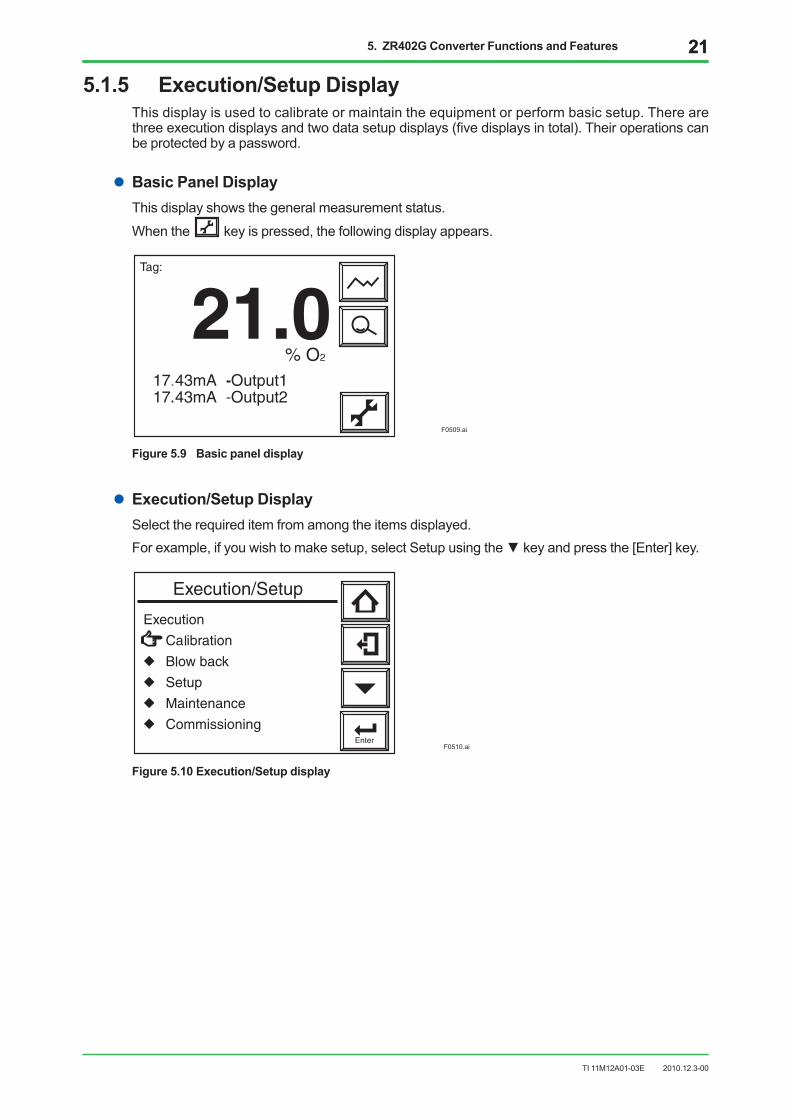
5.1.5 Execution/Setup DisplayThisdisplayisusedtocalibrateormaintaintheequipmentorperformbasicsetup.Therearethreeexecutiondisplaysandtwodatasetupdisplays(fivedisplaysintotal).Theiroperationscanbeprotectedbyapassword.
l Basic Panel DisplayThisdisplayshowsthegeneralmeasurementstatus.
Whenthe keyispressed,thefollowingdisplayappears.
F0509.ai
Figure 5.9 Basic panel display
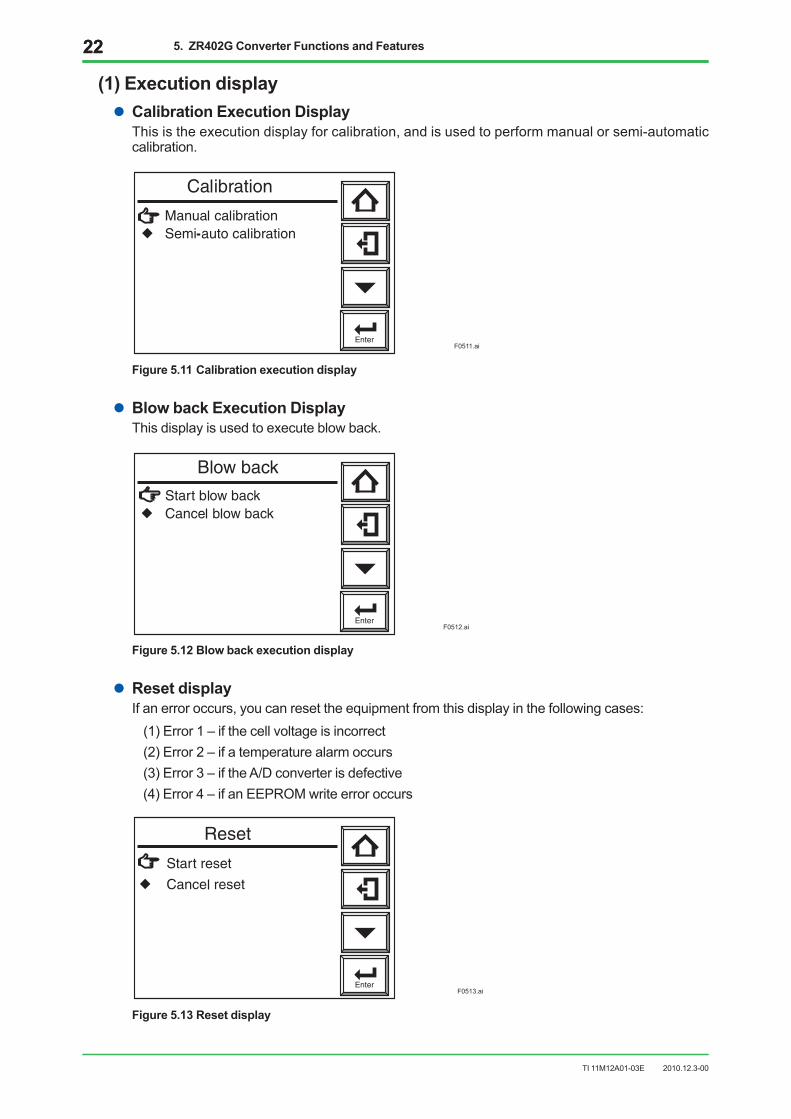
l Execution/Setup DisplaySelecttherequireditemfromamongtheitemsdisplayed.Forexample,ifyouwishtomakesetup,selectSetupusingthekeyandpressthe[Enter]key.
F0510.ai
Figure 5.10 Execution/Setup display
TI11M12A01-03E
2222 5. ZR402G Converter Functions and Features
2010.12.3-00
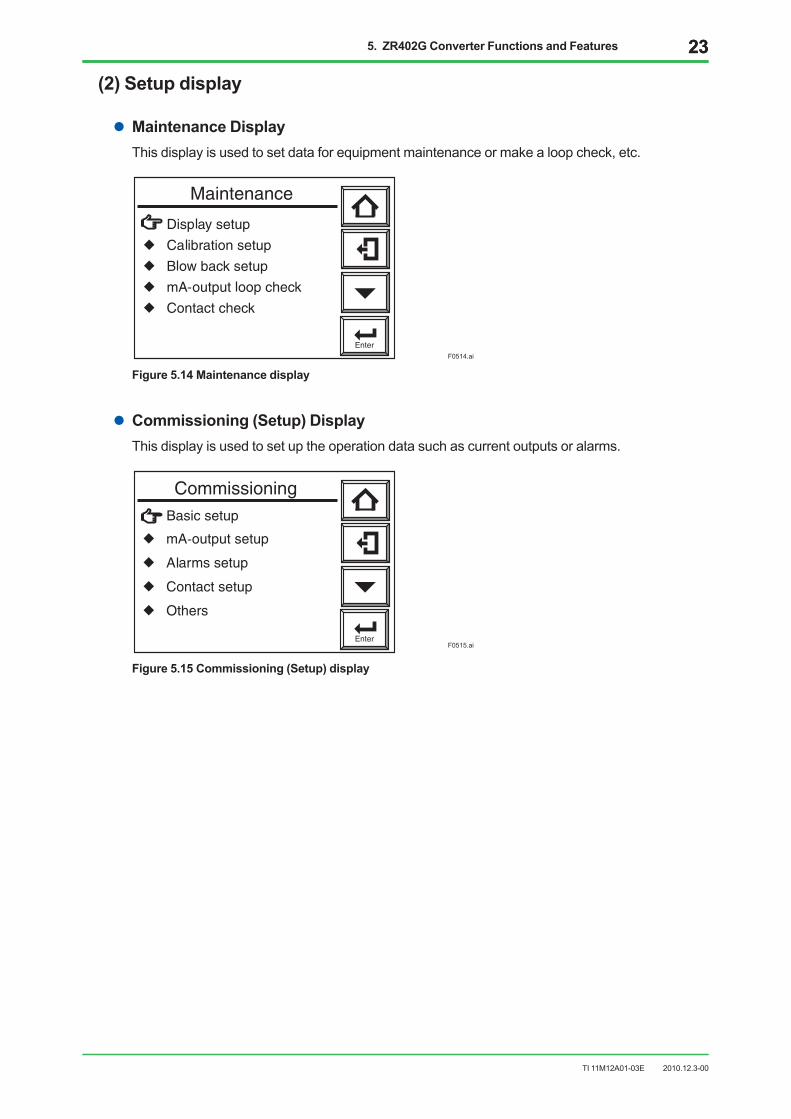
(1) Execution displayl Calibration Execution Display
Thisistheexecutiondisplayforcalibration,andisusedtoperformmanualorsemi-automaticcalibration.
F0511.ai
Figure 5.11 Calibration execution display
l Blow back Execution DisplayThisdisplayisusedtoexecuteblowback.
F0512.ai
Figure 5.12 Blow back execution display
l Reset displayIfanerroroccurs,youcanresettheequipmentfromthisdisplayinthefollowingcases:(1)Error1–ifthecellvoltageisincorrect(2)Error2–ifatemperaturealarmoccurs(3)Error3–iftheA/Dconverterisdefective(4)Error4–ifanEEPROMwriteerroroccurs
F0513.ai
Figure 5.13 Reset display
TI11M12A01-03E
235. ZR402G Converter Functions and Features 23
2010.12.3-00
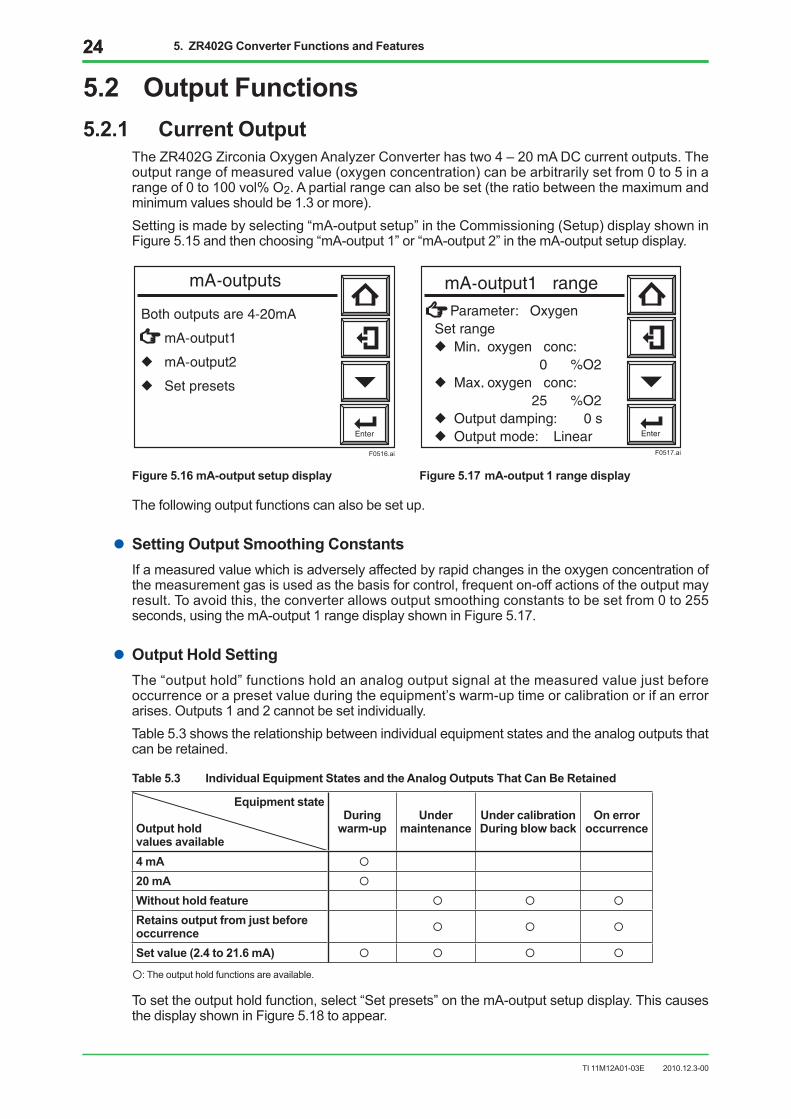
(2) Setup display
l Maintenance DisplayThisdisplayisusedtosetdataforequipmentmaintenanceormakealoopcheck,etc.
F0514.ai
Figure 5.14 Maintenance display
l Commissioning (Setup) DisplayThisdisplayisusedtosetuptheoperationdatasuchascurrentoutputsoralarms.
F0515.ai
Figure 5.15 Commissioning (Setup) display
TI11M12A01-03E
2424 5. ZR402G Converter Functions and Features
2010.12.3-00
5.2 Output Functions5.2.1 CurrentOutput
TheZR402GZirconiaOxygenAnalyzerConverterhastwo4–20mADCcurrentoutputs.Theoutputrangeofmeasuredvalue(oxygenconcentration)canbearbitrarilysetfrom0to5inarangeof0to100vol%O2.Apartialrangecanalsobeset(theratiobetweenthemaximumandminimumvaluesshouldbe1.3ormore).Settingismadebyselecting“mA-outputsetup”intheCommissioning(Setup)displayshowninFigure5.15andthenchoosing“mA-output1”or“mA-output2”inthemA-outputsetupdisplay.
F0516.ai
F0517.ai
Figure 5.16 mA-output setup display Figure 5.17 mA-output 1 range display
Thefollowingoutputfunctionscanalsobesetup.
l SettingOutputSmoothingConstantsIfameasuredvaluewhichisadverselyaffectedbyrapidchangesintheoxygenconcentrationofthemeasurementgasisusedasthebasisforcontrol,frequenton-offactionsoftheoutputmayresult.Toavoidthis,theconverterallowsoutputsmoothingconstantstobesetfrom0to255seconds,usingthemA-output1rangedisplayshowninFigure5.17.
l Output Hold SettingThe“outputhold”functionsholdananalogoutputsignalatthemeasuredvaluejustbeforeoccurrenceorapresetvalueduringtheequipment’swarm-uptimeorcalibrationorifanerrorarises.Outputs1and2cannotbesetindividually.Table5.3showstherelationshipbetweenindividualequipmentstatesandtheanalogoutputsthatcanberetained.
Table 5.3 Individual Equipment States and the Analog Outputs That Can Be Retained
Equipmentstate
Output holdvaluesavailable
During warm-up
Under maintenance
Under calibrationDuring blow back
Onerroroccurrence
4mA
20mA
Without hold feature
Retainsoutputfromjustbeforeoccurrence
Set value (2.4 to 21.6 mA)
:Theoutputholdfunctionsareavailable.
Tosettheoutputholdfunction,select“Setpresets”onthemA-outputsetupdisplay.ThiscausesthedisplayshowninFigure5.18toappear.
TI11M12A01-03E
255. ZR402G Converter Functions and Features 25
2010.12.3-00
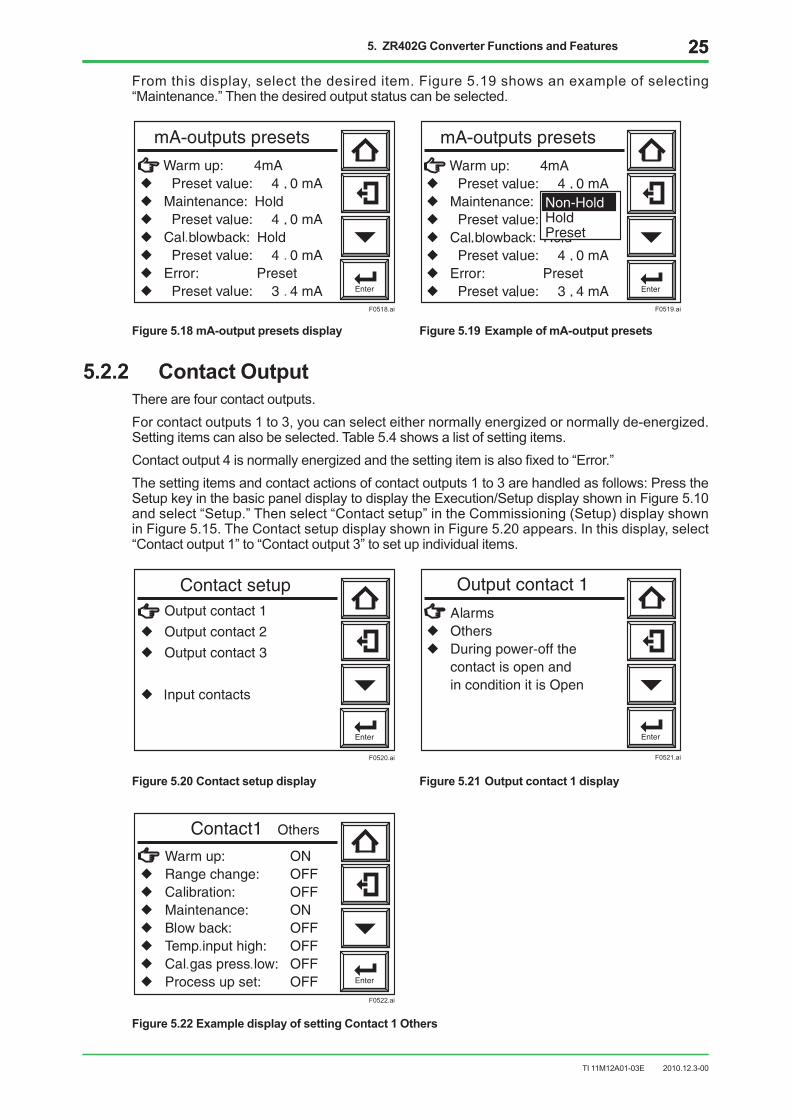
Fromthisdisplay,selectthedesireditem.Figure5.19showsanexampleofselecting“Maintenance.”Thenthedesiredoutputstatuscanbeselected.
F0518.ai
F0519.ai
Figure 5.18 mA-output presets display Figure 5.19 Example of mA-output presets
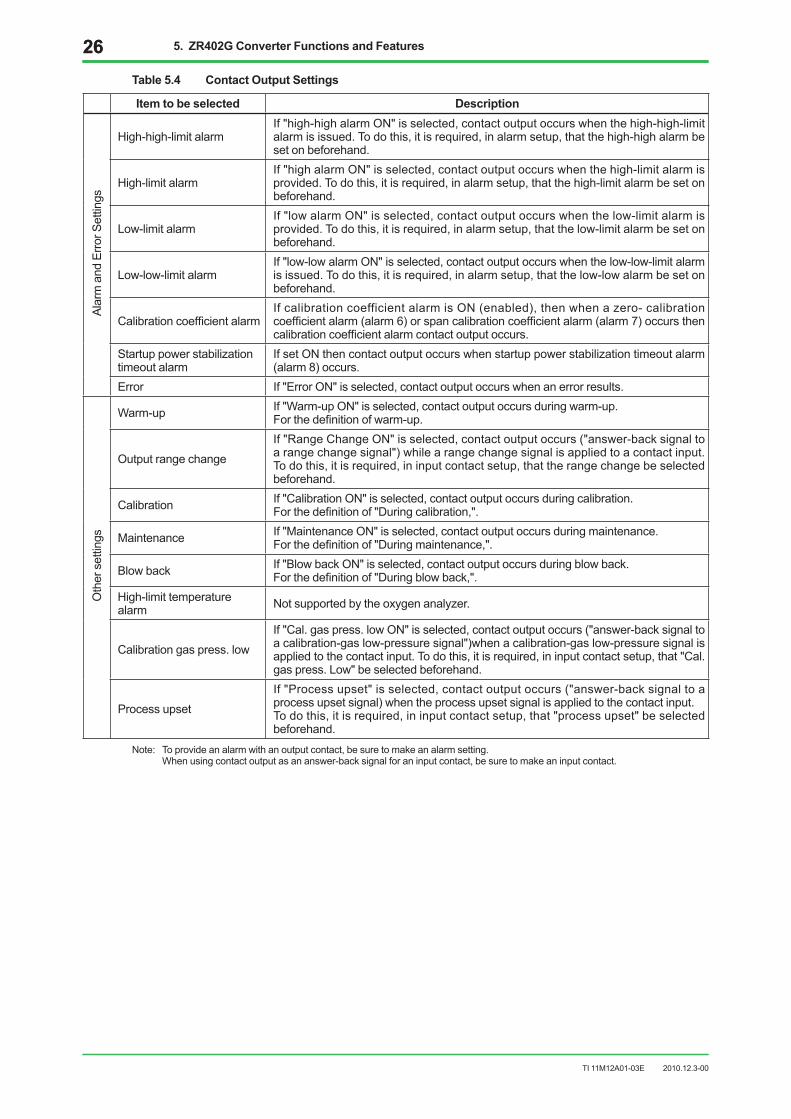
5.2.2 ContactOutputTherearefourcontactoutputs.Forcontactoutputs1to3,youcanselecteithernormallyenergizedornormallyde-energized.Settingitemscanalsobeselected.Table5.4showsalistofsettingitems.Contactoutput4isnormallyenergizedandthesettingitemisalsofixedto“Error.”Thesettingitemsandcontactactionsofcontactoutputs1to3arehandledasfollows:PresstheSetupkeyinthebasicpaneldisplaytodisplaytheExecution/SetupdisplayshowninFigure5.10andselect“Setup.”Thenselect“Contactsetup”intheCommissioning(Setup)displayshowninFigure5.15.TheContactsetupdisplayshowninFigure5.20appears.Inthisdisplay,select“Contactoutput1”to“Contactoutput3”tosetupindividualitems.
F0520.ai
F0521.ai
Figure 5.20 Contact setup display Figure 5.21 Output contact 1 display
F0522.ai
Figure 5.22 Example display of setting Contact 1 Others
TI11M12A01-03E
2626 5. ZR402G Converter Functions and Features
2010.12.3-00
Table5.4 ContactOutputSettings
Item to be selected DescriptionAlarmandErro
rSettings
High-high-limitalarmIf"high-highalarmON"isselected,contactoutputoccurswhenthehigh-high-limitalarmisissued.Todothis,itisrequired,inalarmsetup,thatthehigh-highalarmbesetonbeforehand.
High-limitalarmIf"highalarmON"isselected,contactoutputoccurswhenthehigh-limitalarmisprovided.Todothis,itisrequired,inalarmsetup,thatthehigh-limitalarmbesetonbeforehand.
Low-limitalarmIf"lowalarmON"isselected,contactoutputoccurswhenthelow-limitalarmisprovided.Todothis,itisrequired,inalarmsetup,thatthelow-limitalarmbesetonbeforehand.
Low-low-limitalarmIf"low-lowalarmON"isselected,contactoutputoccurswhenthelow-low-limitalarmisissued.Todothis,itisrequired,inalarmsetup,thatthelow-lowalarmbesetonbeforehand.
CalibrationcoefficientalarmIfcalibrationcoefficientalarmisON(enabled),thenwhenazero-calibrationcoefficientalarm(alarm6)orspancalibrationcoefficientalarm(alarm7)occursthencalibrationcoefficientalarmcontactoutputoccurs.
Startuppowerstabilizationtimeoutalarm
IfsetONthencontactoutputoccurswhenstartuppowerstabilizationtimeoutalarm(alarm8)occurs.
Error If"ErrorON"isselected,contactoutputoccurswhenanerrorresults.
Othersettings
Warm-up If"Warm-upON"isselected,contactoutputoccursduringwarm-up.Forthedefinitionofwarm-up.
Outputrangechange
If"RangeChangeON"isselected,contactoutputoccurs("answer-backsignaltoarangechangesignal")whilearangechangesignalisappliedtoacontactinput.Todothis,itisrequired,ininputcontactsetup,thattherangechangebeselectedbeforehand.
Calibration If"CalibrationON"isselected,contactoutputoccursduringcalibration.Forthedefinitionof"Duringcalibration,".
Maintenance If"MaintenanceON"isselected,contactoutputoccursduringmaintenance.Forthedefinitionof"Duringmaintenance,".
Blowback If"BlowbackON"isselected,contactoutputoccursduringblowback.Forthedefinitionof"Duringblowback,".
High-limittemperaturealarm Notsupportedbytheoxygenanalyzer.
Calibrationgaspress.low
If"Cal.gaspress.lowON"isselected,contactoutputoccurs("answer-backsignaltoacalibration-gaslow-pressuresignal")whenacalibration-gaslow-pressuresignalisappliedtothecontactinput.Todothis,itisrequired,ininputcontactsetup,that"Cal.gaspress.Low"beselectedbeforehand.
Processupset
If"Processupset"isselected,contactoutputoccurs("answer-backsignaltoaprocessupsetsignal)whentheprocessupsetsignalisappliedtothecontactinput.Todothis,itisrequired,ininputcontactsetup,that"processupset"beselectedbeforehand.
Note: Toprovideanalarmwithanoutputcontact,besuretomakeanalarmsetting. Whenusingcontactoutputasananswer-backsignalforaninputcontact,besuretomakeaninputcontact.
TI11M12A01-03E
275. ZR402G Converter Functions and Features 27
2010.12.3-00
5.3 OxygenConcentrationAlarmsTheanalyzerenablesfouralarms—high-high,high,low,andlow-lowalarms—tobesetfortheoxygenconcentration.Thesettingrangeis0to100%O2foranyalarm.
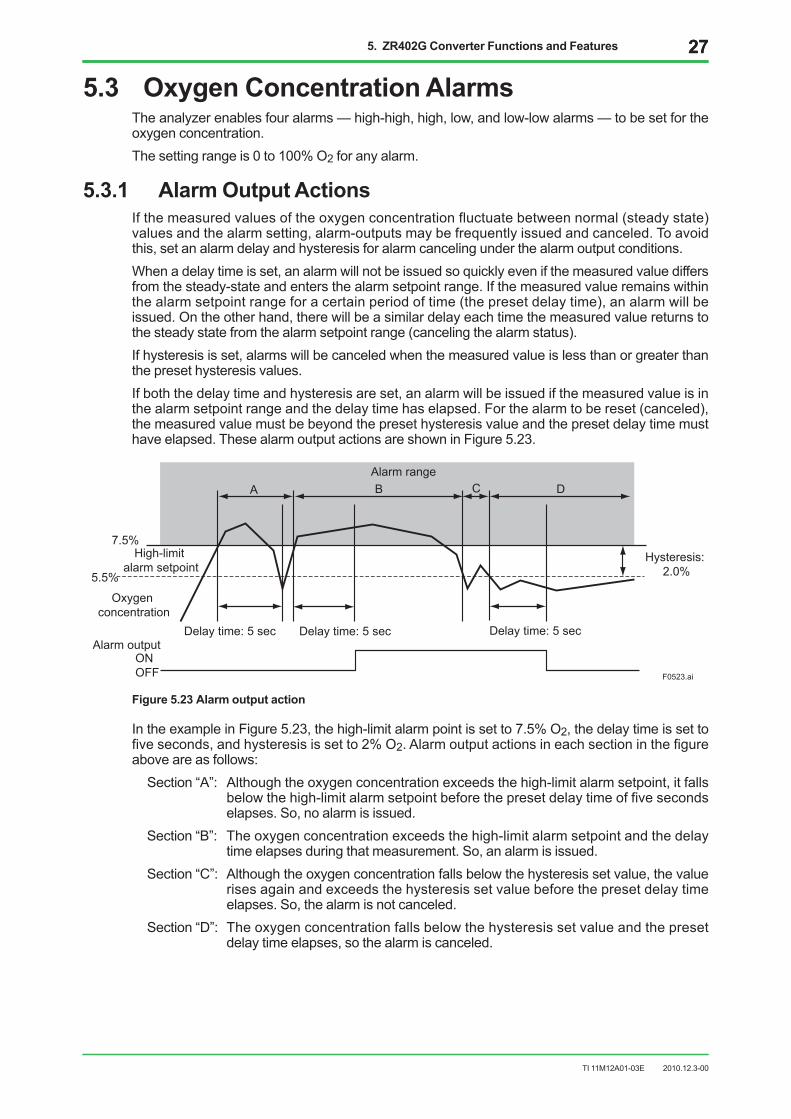
5.3.1 AlarmOutputActionsIfthemeasuredvaluesoftheoxygenconcentrationfluctuatebetweennormal(steadystate)valuesandthealarmsetting,alarm-outputsmaybefrequentlyissuedandcanceled.Toavoidthis,setanalarmdelayandhysteresisforalarmcancelingunderthealarmoutputconditions.Whenadelaytimeisset,analarmwillnotbeissuedsoquicklyevenifthemeasuredvaluediffersfromthesteady-stateandentersthealarmsetpointrange.Ifthemeasuredvalueremainswithinthealarmsetpointrangeforacertainperiodoftime(thepresetdelaytime),analarmwillbeissued.Ontheotherhand,therewillbeasimilardelayeachtimethemeasuredvaluereturnstothesteadystatefromthealarmsetpointrange(cancelingthealarmstatus).Ifhysteresisisset,alarmswillbecanceledwhenthemeasuredvalueislessthanorgreaterthanthepresethysteresisvalues.Ifboththedelaytimeandhysteresisareset,analarmwillbeissuedifthemeasuredvalueisinthealarmsetpointrangeandthedelaytimehaselapsed.Forthealarmtobereset(canceled),themeasuredvaluemustbebeyondthepresethysteresisvalueandthepresetdelaytimemusthaveelapsed.ThesealarmoutputactionsareshowninFigure5.23.
Delay time: 5 sec Delay time: 5 sec Delay time: 5 sec
7.5%High-limit
alarm setpoint5.5%
Oxygenconcentration
Alarm outputONOFF
Hysteresis: 2.0%
A B C DAlarm range
F0523.ai
Figure 5.23 Alarm output action
IntheexampleinFigure5.23,thehigh-limitalarmpointissetto7.5%O2,thedelaytimeissettofiveseconds,andhysteresisissetto2%O2.Alarmoutputactionsineachsectioninthefigureaboveareasfollows:Section“A”: Althoughtheoxygenconcentrationexceedsthehigh-limitalarmsetpoint,itfalls
belowthehigh-limitalarmsetpointbeforethepresetdelaytimeoffivesecondselapses.So,noalarmisissued.
Section“B”: Theoxygenconcentrationexceedsthehigh-limitalarmsetpointandthedelaytimeelapsesduringthatmeasurement.So,analarmisissued.
Section“C”: Althoughtheoxygenconcentrationfallsbelowthehysteresissetvalue,thevaluerisesagainandexceedsthehysteresissetvaluebeforethepresetdelaytimeelapses.So,thealarmisnotcanceled.
Section“D”: Theoxygenconcentrationfallsbelowthehysteresissetvalueandthepresetdelaytimeelapses,sothealarmiscanceled.
TI11M12A01-03E
22 6.Calibration
2010.12.3-00
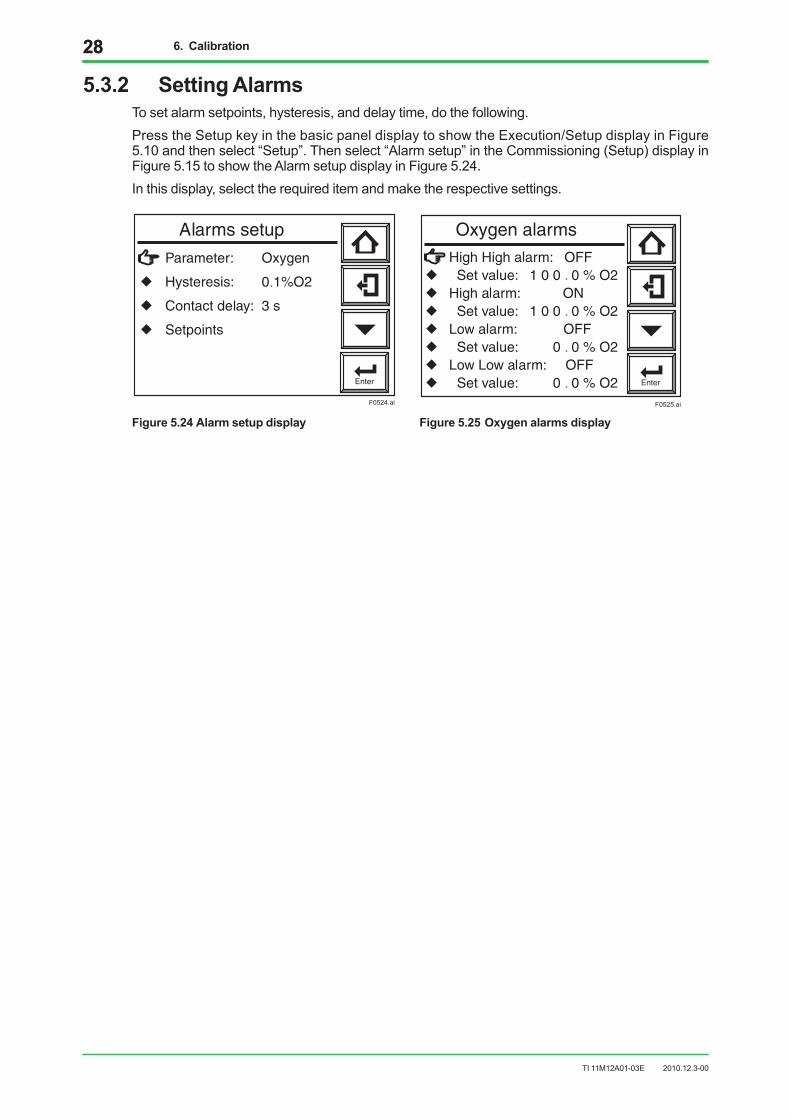
5.3.2 SettingAlarmsTosetalarmsetpoints,hysteresis,anddelaytime,dothefollowing.PresstheSetupkeyinthebasicpaneldisplaytoshowtheExecution/SetupdisplayinFigure5.10andthenselect“Setup”.Thenselect“Alarmsetup”intheCommissioning(Setup)displayinFigure5.15toshowtheAlarmsetupdisplayinFigure5.24.Inthisdisplay,selecttherequireditemandmaketherespectivesettings.
F0524.ai
F0525.ai
Figure 5.24 Alarm setup display Figure 5.25 Oxygen alarms display
TI11M12A01-03E
296.Calibration 29
2010.12.3-00
6. Calibration6.1 CalibrationOverview
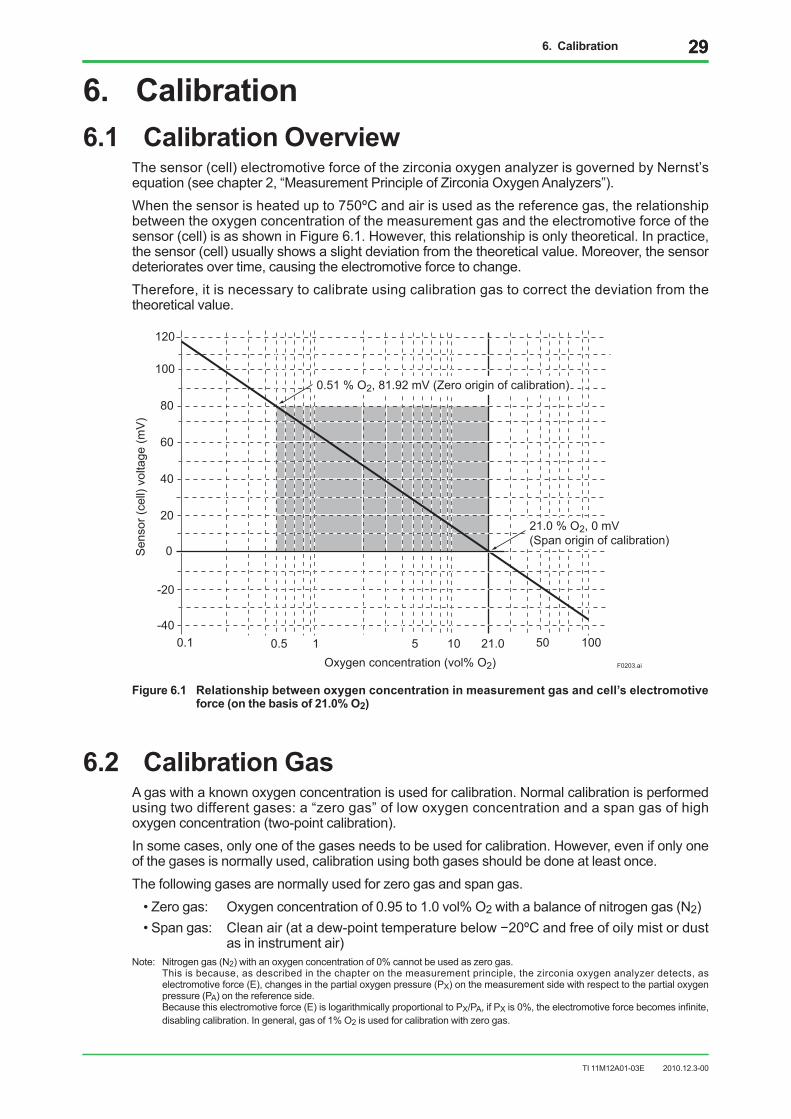
Thesensor(cell)electromotiveforceofthezirconiaoxygenanalyzerisgovernedbyNernst’sequation(seechapter2,“MeasurementPrincipleofZirconiaOxygenAnalyzers”).Whenthesensorisheatedupto750ºCandairisusedasthereferencegas,therelationshipbetweentheoxygenconcentrationofthemeasurementgasandtheelectromotiveforceofthesensor(cell)isasshowninFigure6.1.However,thisrelationshipisonlytheoretical.Inpractice,thesensor(cell)usuallyshowsaslightdeviationfromthetheoreticalvalue.Moreover,thesensordeterioratesovertime,causingtheelectromotiveforcetochange.Therefore,itisnecessarytocalibrateusingcalibrationgastocorrectthedeviationfromthetheoreticalvalue.
0.1 0.5 1 5 10 21.0 50 100
120
100
80
60
40
20
0
-20
-40
0.51 % O2, 81.92 mV (Zero origin of calibration)
21.0 % O2, 0 mV(Span origin of calibration)
Oxygen concentration (vol% O2) F0203.ai
Sen
sor (
cell)
vol
tage
(mV
)
Figure 6.1 Relationship between oxygen concentration in measurement gas and cell’s electromotive force (on the basis of 21.0% O2)
6.2 Calibration GasAgaswithaknownoxygenconcentrationisusedforcalibration.Normalcalibrationisperformedusingtwodifferentgases:a“zerogas”oflowoxygenconcentrationandaspangasofhighoxygenconcentration(two-pointcalibration).Insomecases,onlyoneofthegasesneedstobeusedforcalibration.However,evenifonlyoneofthegasesisnormallyused,calibrationusingbothgasesshouldbedoneatleastonce.Thefollowinggases arenormallyusedforzerogasandspangas.•Zerogas: Oxygenconcentrationof0.95to1.0vol%O2withabalanceofnitrogengas(N2)•Spangas: Cleanair(atadew-pointtemperaturebelow−20ºCandfreeofoilymistordust
asininstrumentair)Note: Nitrogengas(N2)withanoxygenconcentrationof0%cannotbeusedaszerogas. Thisisbecause,asdescribedinthechapteronthemeasurementprinciple,thezirconiaoxygenanalyzerdetects,as
electromotiveforce(E),changesinthepartialoxygenpressure(PX)onthemeasurementsidewithrespecttothepartialoxygenpressure(PA)onthereferenceside.
Becausethiselectromotiveforce(E)islogarithmicallyproportionaltoPX/PA,ifPXis0%,theelectromotiveforcebecomesinfinite,disablingcalibration.Ingeneral,gasof1%O2isusedforcalibrationwithzerogas.
TI11M12A01-03E
3030 6.Calibration
2010.12.3-00
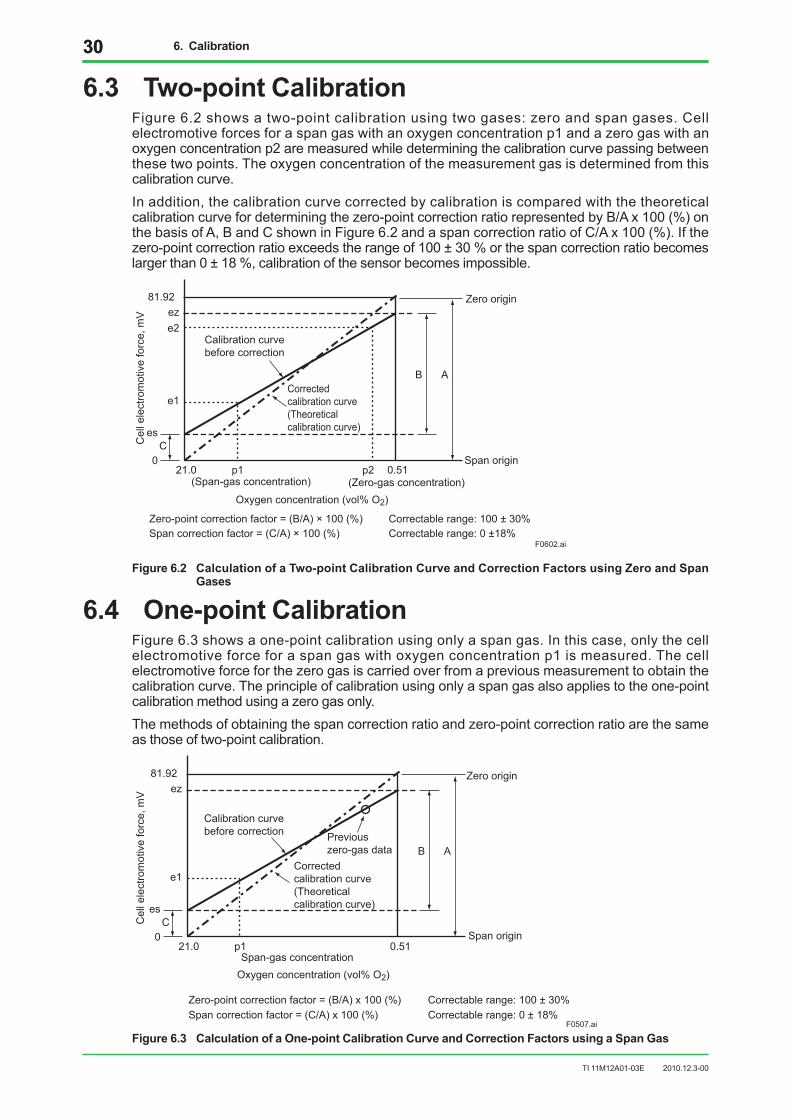
6.3 Two-point CalibrationFigure6.2showsatwo-pointcalibrationusingtwogases:zeroandspangases.Cellelectromotiveforcesforaspangaswithanoxygenconcentrationp1andazerogaswithanoxygenconcentrationp2aremeasuredwhiledeterminingthecalibrationcurvepassingbetweenthesetwopoints.Theoxygenconcentrationofthemeasurementgasisdeterminedfromthiscalibrationcurve.Inaddition,thecalibrationcurvecorrectedbycalibrationiscomparedwiththetheoreticalcalibrationcurvefordeterminingthezero-pointcorrectionratiorepresentedbyB/Ax100(%)onthebasisofA,BandCshowninFigure6.2andaspancorrectionratioofC/Ax100(%).Ifthezero-pointcorrectionratioexceedstherangeof100±30%orthespancorrectionratiobecomeslargerthan0±18%,calibrationofthesensorbecomesimpossible.
21.0 p1 0.51
81.92ez
e1
e2
es
0C
AB
p2
F0602.ai
Cel
l ele
ctro
mot
ive
forc
e, m
V
Calibration curve before correction
Correctedcalibration curve(Theoreticalcalibration curve)
(Span-gas concentration)
Oxygen concentration (vol% O2)(Zero-gas concentration)
Zero origin
Span origin
Zero-point correction factor = (B/A) × 100 (%) Correctable range: 100 ± 30%Span correction factor = (C/A) × 100 (%) Correctable range: 0 ±18%
Figure 6.2 Calculation of a Two-point Calibration Curve and Correction Factors using Zero and Span Gases
6.4 One-point CalibrationFigure6.3showsaone-pointcalibrationusingonlyaspangas.Inthiscase,onlythecellelectromotiveforceforaspangaswithoxygenconcentrationp1ismeasured.Thecellelectromotiveforceforthezerogasiscarriedoverfromapreviousmeasurementtoobtainthecalibrationcurve.Theprincipleofcalibrationusingonlyaspangasalsoappliestotheone-pointcalibrationmethodusingazerogasonly.Themethodsofobtainingthespancorrectionratioandzero-pointcorrectionratioarethesameasthoseoftwo-pointcalibration.
21.0 p1 0.51
81.92ez
e1
es
0C
AB
F0507.ai
Cel
l ele
ctro
mot
ive
forc
e, m
V
Calibration curve before correction
Correctedcalibration curve(Theoreticalcalibration curve)
Previouszero-gas data
Zero origin
Span origin
Span-gas concentrationOxygen concentration (vol% O2)
Span correction factor = (C/A) x 100 (%) Correctable range: 0 ± 18%Zero-point correction factor = (B/A) x 100 (%) Correctable range: 100 ± 30%
Figure 6.3 Calculation of a One-point Calibration Curve and Correction Factors using a Span Gas
TI11M12A01-03E
316.Calibration 31
2010.12.3-00
6.5 Calibration ModesZirconiaoxygenanalyzersemploythefollowingthreeoperationmodesforcalibration.•Manualcalibration: Allowszeroandspancalibrations,oreitheronemanuallyinturn.•Semi-automaticcalibration: Letscalibrationstartwiththetouchpaneloracontactinput,and
undergoesaseriesofcalibrationoperationsfollowingpresetcalibrationperiodsandstabilizationtime.
•Automaticcalibration: Performscalibrationautomaticallyfollowingpresetcalibrationperiods.
6.6 SettingtheCalibrationTime(1) For manual calibration
Firstsettheoutputstabilizationtime.Thisindicatesthetimerequiredfromtheendofcalibrationtoenteringameasurementagain.Thistime,aftercalibration,themeasurementgasentersthesensortosetthetimeuntiltheoutputreturnstonormal.Theoutputremainsheldaftercompletingthecalibrationoperationuntiltheoutputstabilizationtimeelapses.Thecalibrationtimesetrangesfrom00minutes,00secondsto60minutes,59seconds.
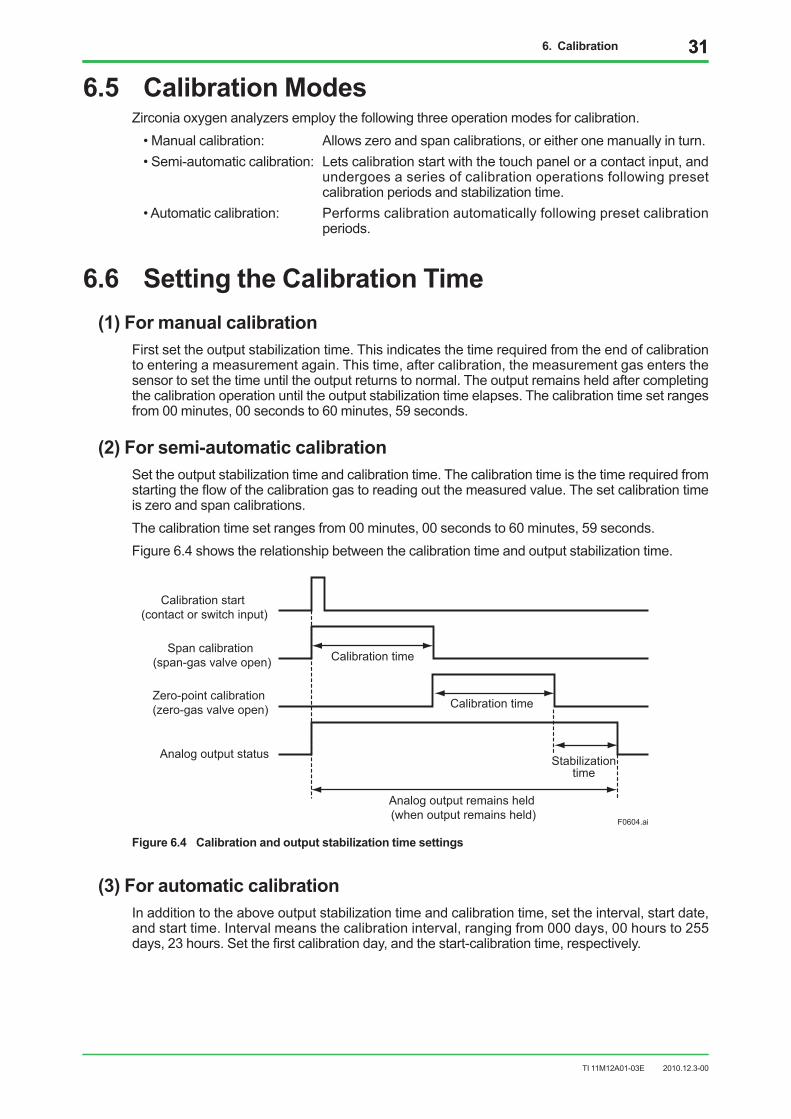
(2) For semi-automatic calibrationSettheoutputstabilizationtimeandcalibrationtime.Thecalibrationtimeisthetimerequiredfromstartingtheflowofthecalibrationgastoreadingoutthemeasuredvalue.Thesetcalibrationtimeiszeroandspancalibrations.Thecalibrationtimesetrangesfrom00minutes,00secondsto60minutes,59seconds.Figure6.4showstherelationshipbetweenthecalibrationtimeandoutputstabilizationtime.
Calibration start (contact or switch input)
Span calibration (span-gas valve open)
Zero-point calibration (zero-gas valve open)
Analog output status
Calibration time
Calibration time
Stabilizationtime
Analog output remains held (when output remains held)
F0604.ai
Figure 6.4 Calibration and output stabilization time settings
(3) For automatic calibrationInadditiontotheaboveoutputstabilizationtimeandcalibrationtime,settheinterval,startdate,andstarttime.Intervalmeansthecalibrationinterval,rangingfrom000days,00hoursto255days,23hours.Setthefirstcalibrationday,andthestart-calibrationtime,respectively.
TI11M12A01-03E
3232 7. Blow Back Function
2010.12.3-00
7. Blow Back FunctionTheprobeeasilybecomescloggedifthesamplegascontainstoomuchdustsuchasinarecoveryboilerorcementkiln.Theblowbackfunctionisusedtoremovesuchdustwithairpressure.
7.1 Blow Back ModesThezirconiaoxygenanalyzeroffersthefollowingtwoblowbackmodes:
l Semi-automatic blow backInthismode,touchpaneloperationsorcontactinputsignalswillstartandperformblowbackoperationsaccordingtoapresetblowbacktimeandoutputstabilizationtime.
l AutomaticblowbackPerformsblowbackoperationsautomaticallyaccordingtoapresetinterval,blowbacktime,andoutputstabilizationtime.
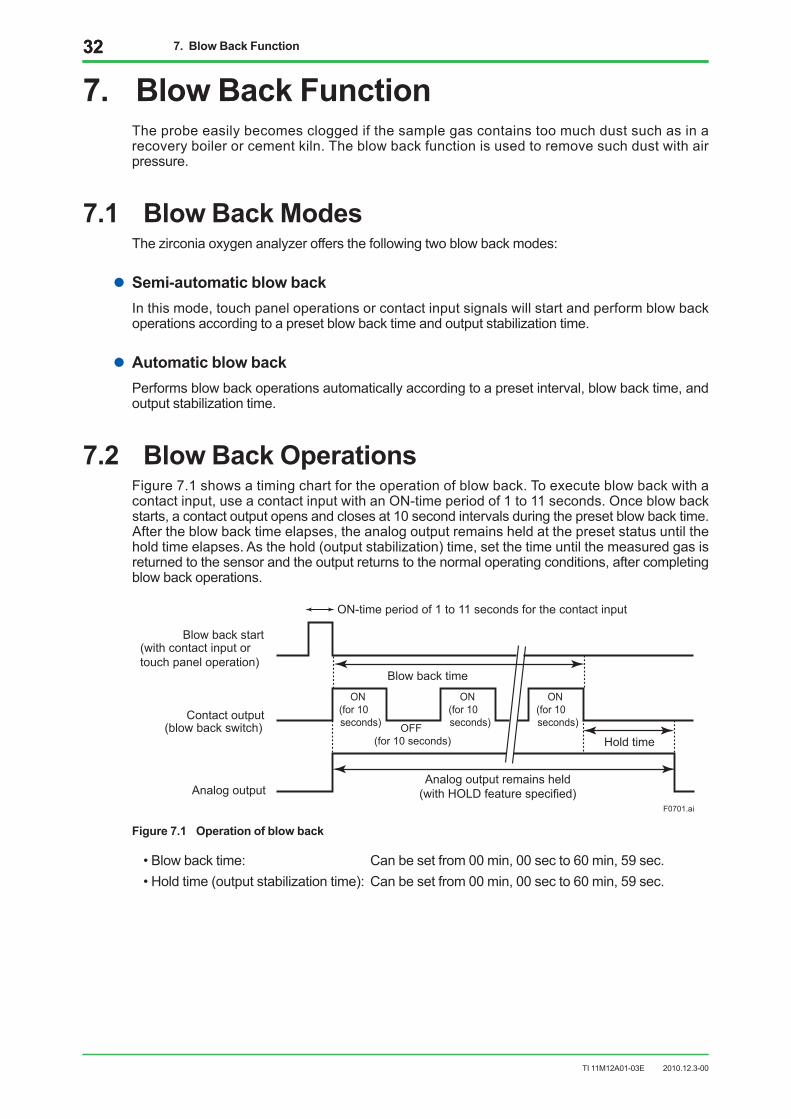
7.2 BlowBackOperationsFigure7.1showsatimingchartfortheoperationofblowback.Toexecuteblowbackwithacontactinput,useacontactinputwithanON-timeperiodof1to11seconds.Onceblowbackstarts,acontactoutputopensandclosesat10secondintervalsduringthepresetblowbacktime.Aftertheblowbacktimeelapses,theanalogoutputremainsheldatthepresetstatusuntiltheholdtimeelapses.Asthehold(outputstabilization)time,setthetimeuntilthemeasuredgasisreturnedtothesensorandtheoutputreturnstothenormaloperatingconditions,aftercompletingblowbackoperations.
ON-time period of 1 to 11 seconds for the contact input
Blow back start(with contact input or touch panel operation)
Contact output(blow back switch)
Analog output
ON(for 10 seconds)
ON(for 10 seconds)
ON(for 10 seconds)OFF
(for 10 seconds) Hold time
Analog output remains held(with HOLD feature specified)
Blow back time
F0701.ai
Figure 7.1 Operation of blow back
•Blowbacktime: Canbesetfrom00min,00secto60min,59sec.•Holdtime(outputstabilizationtime):Canbesetfrom00min,00secto60min,59sec.
TI11M12A01-03E
338. Directions for Use 33
2010.12.3-00
8. Directions for UseToachieveaccuratemeasurementswithazirconiaoxygenanalyzer,thefollowingmustbeconsidered.
8.1 Effect of Coexisting Combustible GasesThesensor(zirconiaelement)isheatedto750ºCduringmeasurements.Iftheprocessgascontainscombustiblegasessuchascarbonmonoxide,hydrogen,andmethane,thesegasesburninthedetectorandconsumeoxygen,causingtheoxygenconcentrationmeasuredbytheoxygenanalyzertobesmallerthantheactualvalue.Therefore,zirconiaoxygenanalyzersshouldbeusedonlywhentheeffectofcoexistingcombustiblegasescanbeignoredorwhentheireffectonoxygenconcentrationcanbecorrected.Generally,exhaustgasesaftercombustionthatareemittedfromcombustionequipmentsuchasboilersandindustrialfurnaceshavebeencompletelyburned;thevolumeofcombustiblegasessuchascarbonmonoxideisverysmallincomparisonwithoxygen,andsotheirinfluencecanbeignored.However,iftheexcessairratioisextremelysmallorifcombustionisnon-uniform,causingcarbonmonoxidetobeproduced,careisrequired.
8.2 Effect of Humidity in Reference Gas (Air)Zirconiaoxygenanalyzersuseagaswhoseoxygenconcentrationisknownandalwaysconsistent,asthereferencegas.Ingeneral,airisusedasthereferencegas.Theoxygenconcentrationofdryairisconstantat20.95%;however,airgenerallycontainswatervapor,inwhichcasetheoxygenconcentrationvarieswithtemperatureandhumidity.Inzirconiaoxygenanalyzers,ameasurementerroriscausedifthetemperatureorhumidityofthereferencegas(air)variessignificantlybetweencalibrationandmeasurement.Wheninstrumentairisusedasthereferencegas,thiserrorcanbeignored,butifitcannotbeused,careisrequired.
8.3 Precautions When Shutting Down a Furnace orBoiler
Whenoperatinganinstrumentsuchasboilerorindustrialfurnaceisstoppedwiththezirconiaoxygenanalyzeroperation,moisturecancondensateonthesensorportionanddustsmaysticktoit.Ifoperationisrestartedinthiscondition,thesensorwhichisheatedupto750°Cfirmlyfixthedustsonitself.Consequently,thedustscanmakethesensorperformanceverylower.Ifalargeamountofwateriscondensed,thesensorcanbebrokenandneverreuseful.Topreventtheabovenonconformity,takethefollowingactionwhenstoppingoperation.(1)Ifpossible,keeponsupplyingthepowertoconverterandflowingreferenceairtothesensor.
Ifimpossibletodotheabove,removethedetector.(2)Ifunavoidablyimpossibletosupplythepowerandremovingthedetector,keeponfollowing
airat600ml/minintothecalibrationgaspipe.
TI11M12A01-03E
3434 8. Directions for Use
2010.12.3-00
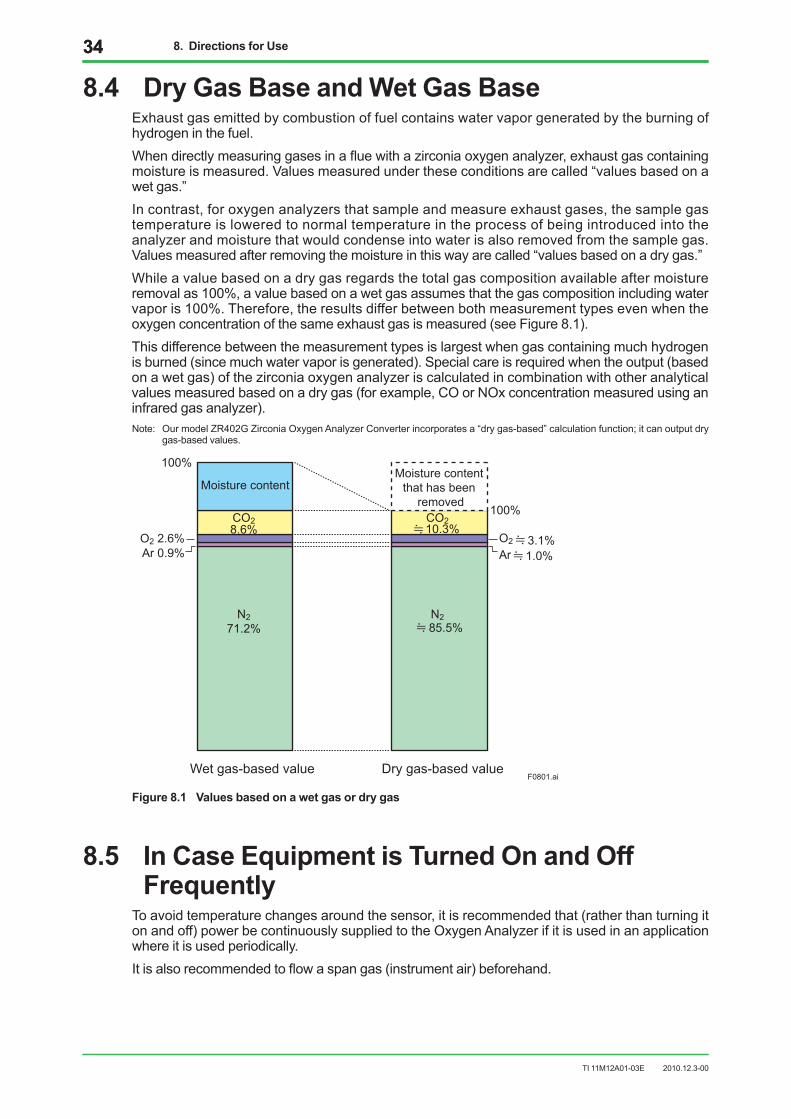
8.4 Dry Gas Base and Wet Gas BaseExhaustgasemittedbycombustionoffuelcontainswatervaporgeneratedbytheburningofhydrogeninthefuel.Whendirectlymeasuringgasesinafluewithazirconiaoxygenanalyzer,exhaustgascontainingmoistureismeasured.Valuesmeasuredundertheseconditionsarecalled“valuesbasedonawetgas.”Incontrast,foroxygenanalyzersthatsampleandmeasureexhaustgases,thesamplegastemperatureisloweredtonormaltemperatureintheprocessofbeingintroducedintotheanalyzerandmoisturethatwouldcondenseintowaterisalsoremovedfromthesamplegas.Valuesmeasuredafterremovingthemoistureinthiswayarecalled“valuesbasedonadrygas.”Whileavaluebasedonadrygasregardsthetotalgascompositionavailableaftermoistureremovalas100%,avaluebasedonawetgasassumesthatthegascompositionincludingwatervaporis100%.Therefore,theresultsdifferbetweenbothmeasurementtypesevenwhentheoxygenconcentrationofthesameexhaustgasismeasured(seeFigure8.1).Thisdifferencebetweenthemeasurementtypesislargestwhengascontainingmuchhydrogenisburned(sincemuchwatervaporisgenerated).Specialcareisrequiredwhentheoutput(basedonawetgas)ofthezirconiaoxygenanalyzeriscalculatedincombinationwithotheranalyticalvaluesmeasuredbasedonadrygas(forexample,COorNOxconcentrationmeasuredusinganinfraredgasanalyzer).Note: OurmodelZR402GZirconiaOxygenAnalyzerConverterincorporatesa“drygas-based”calculationfunction;itcanoutputdry
gas-basedvalues.
F0801.aiWet gas-based value Dry gas-based value
N271.2%
CO28.6%
Moisture content
O2 2.6%Ar 0.9%
100%
N2
CO2
Moisture content that has been
removed
O2
Ar
100%10.3%
85.5%
3.1%1.0%
Figure 8.1 Values based on a wet gas or dry gas
8.5 In Case Equipment is Turned On and Off Frequently
Toavoidtemperaturechangesaroundthesensor,itisrecommendedthat(ratherthanturningitonandoff)powerbecontinuouslysuppliedtotheOxygenAnalyzerifitisusedinanapplicationwhereitisusedperiodically.Itisalsorecommendedtoflowaspangas(instrumentair)beforehand.

TI11M12A01-03E
35
2010.12.3-00
Revision HistoryManualTitle:ModelZR22G,ZR402G
DirectIn-siteSeparatetypeZirconiaOxygenAnalyzers(HardwareEdition)
ManualNumber:TI11M12A01-03E
December 2010/1st Edition Newlypublished
Recommended