February, 2012
9th CLSA Japan Forum 2012
Mitsubishi UFJ Financial Group
1
This document contains forward-looking statements in regard to forecasts, targets and plans of Mitsubishi UFJ Financial Group, Inc. (“MUFG”) and its group companies (collectively, “the group”). These forward-looking statements are based on information currently available to the group and are stated here on the basis of the outlook at the time that this document was produced. In addition, in producing these statements certain assumptions (premises) have been utilized. These statements and assumptions (premises) are subjective and may prove to be incorrect and may not be realized in the future. Underlying such circumstances are a large number of risks and uncertainties. Please see other disclosure and public filings made or will be made by MUFG and the other companies comprising the group, including the latest kessantanshin, financial reports, Japanese securities reports and annual reports, for additional information regarding such risks and uncertainties. The group has no obligation or intent to update any forward-looking statements contained in this document.
In addition, information on companies and other entities outside the group that is recorded in this document has been obtained from publicly available information and other sources. The accuracy and appropriateness of that information has not been verified by the group and cannot be guaranteed.
The financial information used in this document was prepared in accordance with accounting standards generally accepted in Japan, or Japanese GAAP.
Definitions of figures used in this document
Consolidated Mitsubishi UFJ Financial Group (consolidated)
Non- Bank of Tokyo-Mitsubishi UFJ (non-consolidated) + Mitsubishi UFJ Trust and Bankingconsolidated Corporation (non-consolidated) (without any adjustments)
Commercial bank Bank of Tokyo-Mitsubishi UFJ (consolidated) consolidated
2
Contents
FY2011 Q3 key points Income statement summary Outline of results by business segmentBalance sheet summaryLoans / depositsDomestic deposit / lending ratesLoan assetsHoldings of investment securitiesFY2011 financial targets
456789
101112
Outline of FY2011 Q3 Results
Future Growth
Promoting a growth strategyGlobal Americas strategyAsia strategy (1)~(3)Transaction banking businessProject financeGlobal strategic alliance withMorgan StanleyInvestment product salesGlobal asset management strategyAddressing key issuesMaintain and improve operationalefficiency / Reduce equity holdingsMaintain and enhance capital baseCapital policyAims of MUFG
20212223262728
29303132
333435
Management policyKey points Domestic and overseas lendingExposures in European peripheralcountriesConsumer financeMitsubishi UFJ Securities Holdings
14151617
1819
Appendix
3
Outline of FY2011 Q3 Results
Future growth
4
FY2011 Q3 key points
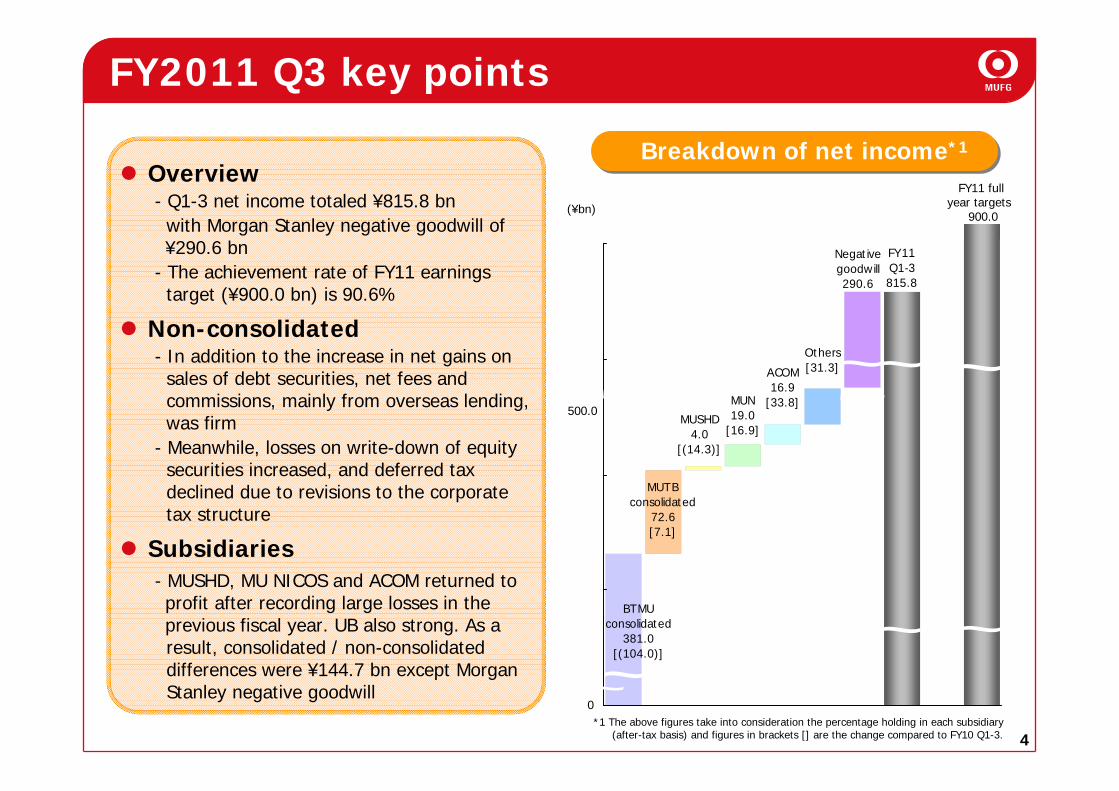
Overview- Q1-3 net income totaled ¥815.8 bn
with Morgan Stanley negative goodwill of ¥290.6 bn
- The achievement rate of FY11 earningstarget (¥900.0 bn) is 90.6%
Non-consolidated- In addition to the increase in net gains on sales of debt securities, net fees and commissions, mainly from overseas lending, was firm
- Meanwhile, losses on write-down of equity securities increased, and deferred tax declined due to revisions to the corporate tax structure
Subsidiaries- MUSHD, MU NICOS and ACOM returned toprofit after recording large losses in theprevious fiscal year. UB also strong. As a result, consolidated / non-consolidated differences were ¥144.7 bn except Morgan Stanley negative goodwill
MUSHD4.0
[(14.3)]
MUTBconsolidated
72.6[7.1]
BTMUconsolidated
381.0[(104.0)]
MUN19.0
[16.9]
ACOM16.9
[33.8]
Others[31.3]
Negativegoodwill290.6
FY11Q1-3815.8
500.0
0
(¥bn)
Breakdown of net income*1
*1 The above figures take into consideration the percentage holding in each subsidiary(after-tax basis) and figures in brackets [] are the change compared to FY10 Q1-3.
FY11 full year targets
900.0
5
(Consolidated)Income statement summaryNet business profits
Net income
Total credit costs
Net losses on equity securities
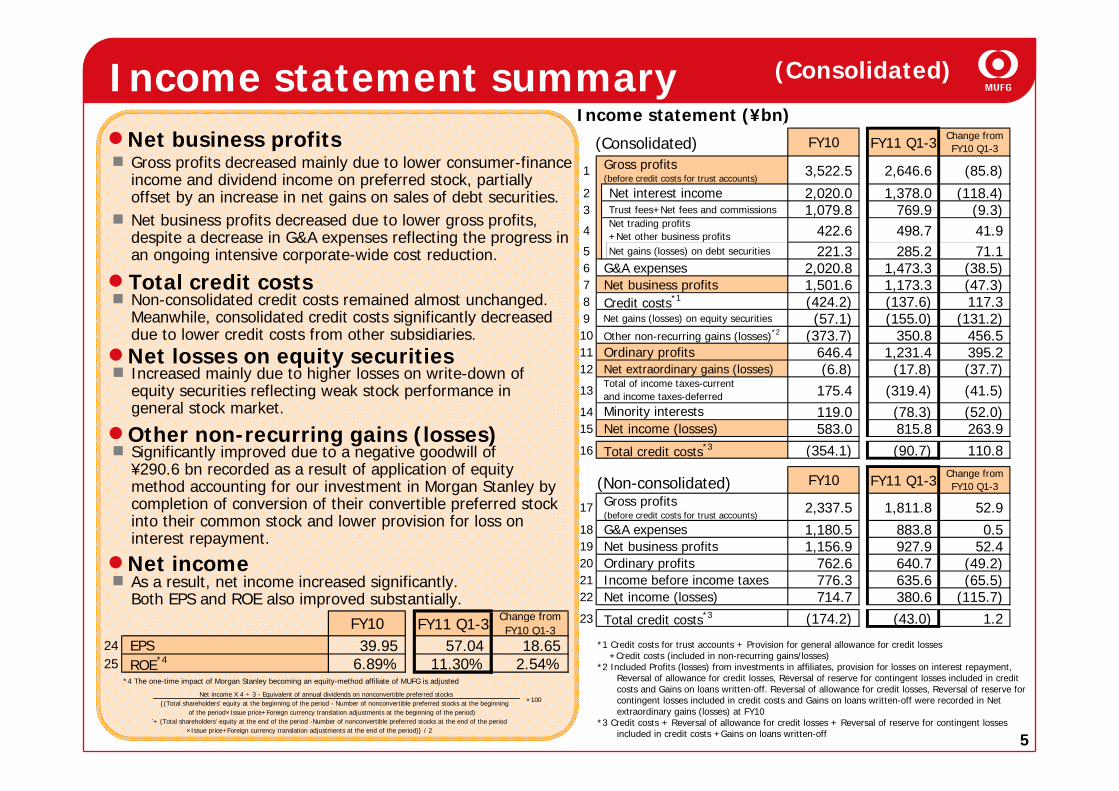
Gross profits decreased mainly due to lower consumer-finance income and dividend income on preferred stock, partially offset by an increase in net gains on sales of debt securities.Net business profits decreased due to lower gross profits, despite a decrease in G&A expenses reflecting the progress in an ongoing intensive corporate-wide cost reduction.
Increased mainly due to higher losses on write-down of equity securities reflecting weak stock performance in general stock market.
As a result, net income increased significantly.Both EPS and ROE also improved substantially.
Other non-recurring gains (losses)Significantly improved due to a negative goodwill of ¥290.6 bn recorded as a result of application of equity method accounting for our investment in Morgan Stanley by completion of conversion of their convertible preferred stock into their common stock and lower provision for loss on interest repayment.
Non-consolidated credit costs remained almost unchanged.Meanwhile, consolidated credit costs significantly decreased due to lower credit costs from other subsidiaries.
Income statement (¥bn)
(Consolidated)
(Non-consolidated)
*1 Credit costs for trust accounts + Provision for general allowance for credit losses+Credit costs (included in non-recurring gains/losses)
*2 Included Profits (losses) from investments in affiliates, provision for losses on interest repayment, Reversal of allowance for credit losses, Reversal of reserve for contingent losses included in credit costs and Gains on loans written-off. Reversal of allowance for credit losses, Reversal of reserve for contingent losses included in credit costs and Gains on loans written-off were recorded in Net extraordinary gains (losses) at FY10
*3 Credit costs + Reversal of allowance for credit losses + Reversal of reserve for contingent losses included in credit costs +Gains on loans written-off
1 3,522.5 2,646.6 (85.8) 2 Net interest income 2,020.0 1,378.0 (118.4) 3 Trust fees+Net fees and commissions 1,079.8 769.9 (9.3) 4 422.6 498.7 41.9 5 Net gains (losses) on debt securities 221.3 285.2 71.1 6 G&A expenses 2,020.8 1,473.3 (38.5) 7 Net business profits 1,501.6 1,173.3 (47.3) 8 Credit costs*1 (424.2) (137.6) 117.3 9 Net gains (losses) on equity securities (57.1) (155.0) (131.2) 10 Other non-recurring gains (losses)*2 (373.7) 350.8 456.5 11 Ordinary profits 646.4 1,231.4 395.2 12 Net extraordinary gains (losses) (6.8) (17.8) (37.7) 13 175.4 (319.4) (41.5) 14 119.0 (78.3) (52.0) 15 Net income (losses) 583.0 815.8 263.9 16 Total credit costs*3 (354.1) (90.7) 110.8
17 2,337.5 1,811.8 52.9 18 G&A expenses 1,180.5 883.8 0.5 19 Net business profits 1,156.9 927.9 52.4 20 Ordinary profits 762.6 640.7 (49.2) 21 Income before income taxes 776.3 635.6 (65.5) 22 Net income (losses) 714.7 380.6 (115.7) 23 Total credit costs*3 (174.2) (43.0) 1.2
Minority interests
Change fromFY10 Q1-3
Total of income taxes-currentand income taxes-deferred
FY10 FY11 Q1-3Gross profits(before credit costs for trust accounts)
Net trading profits+Net other business profits
FY11 Q1-3FY10 Change fromFY10 Q1-3
Gross profits(before credit costs for trust accounts)
24 EPS 39.95 57.04 18.65 25 ROE*4 6.89% 11.30% 2.54%
*4 The one-time impact of Morgan Stanley becoming an equity-method affiliate of MUFG is adjusted
Net income X 4 ÷ 3 - Equivalent of annual dividends on nonconvertible preferred stocks {(Total shareholders' equity at the beginning of the period - Number of nonconvertible preferred stocks at the beginning of the period×Issue price+Foreign currency translation adjustments at the beginning of the period) '+ (Total shareholders' equity at the end of the period -Number of nonconvertible preferred stocks at the end of the period ×Issue price+Foreign currency translation adjustments at the end of the period)} / 2
FY11 Q1-3FY10 Change fromFY10 Q1-3
×100
6
(¥bn)
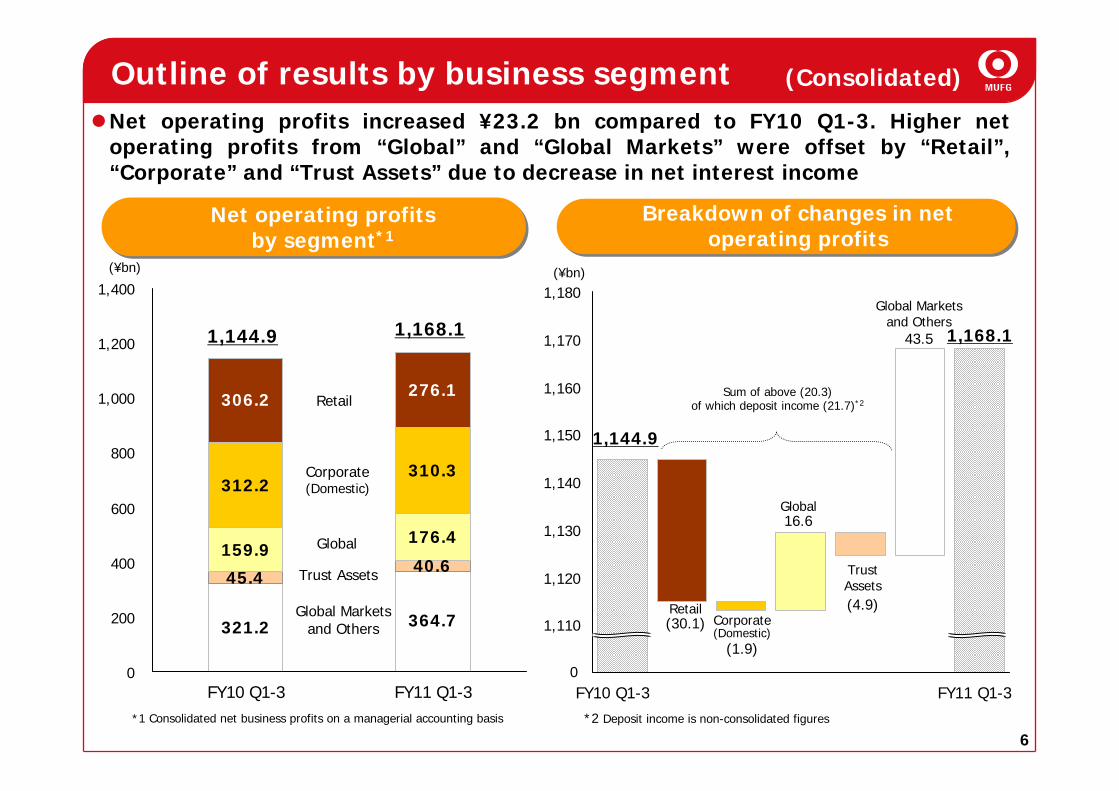
45.440.6
159.9176.4
312.2310.3
306.2 276.1
364.7321.2
0
200
400
600
800
1,000
1,200
1,400
FY10 Q1-3 FY11 Q1-3
Corporate (Domestic)
Retail
Global Markets and Others
Trust Assets
Global
1,168.11,144.9
Net operating profits increased ¥23.2 bn compared to FY10 Q1-3. Higher net operating profits from “Global” and “Global Markets” were offset by “Retail”, “Corporate” and “Trust Assets” due to decrease in net interest income
Outline of results by business segment
Net operating profits by segment*1
Breakdown of changes in net operating profits
(Consolidated)
*1 Consolidated net business profits on a managerial accounting basis
1,100
1,110
1,120
1,130
1,140
1,150
1,160
1,170
1,180
0FY10 Q1-3 FY11 Q1-3
1,168.1
(¥bn)
Corporate (Domestic)
(1.9)
Trust Assets(4.9)
Global 16.6
Global Markets and Others
43.5
Retail(30.1)
1,144.9
Sum of above (20.3)of which deposit income (21.7)*2
*2 Deposit income is non-consolidated figures
7
(Consolidated)
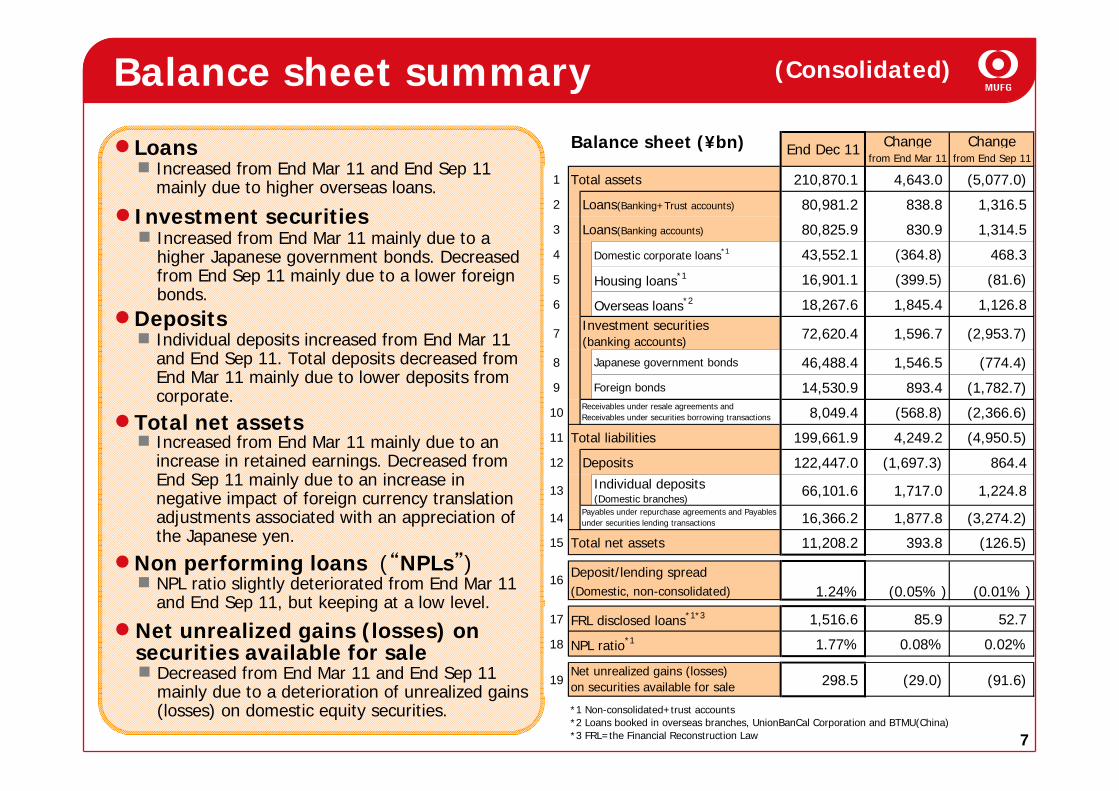
LoansIncreased from End Mar 11 and End Sep 11 mainly due to higher overseas loans.
DepositsIndividual deposits increased from End Mar 11 and End Sep 11. Total deposits decreased from End Mar 11 mainly due to lower deposits from corporate.
Non performing loans (“NPLs”)
Net unrealized gains (losses) on securities available for sale
NPL ratio slightly deteriorated from End Mar 11 and End Sep 11, but keeping at a low level.
Decreased from End Mar 11 and End Sep 11 mainly due to a deterioration of unrealized gains (losses) on domestic equity securities.
Investment securitiesIncreased from End Mar 11 mainly due to a higher Japanese government bonds. Decreased from End Sep 11 mainly due to a lower foreign bonds.
Total net assetsIncreased from End Mar 11 mainly due to an increase in retained earnings. Decreased from End Sep 11 mainly due to an increase in negative impact of foreign currency translation adjustments associated with an appreciation of the Japanese yen.
Balance sheet summaryChange Change
from End Mar 11 from End Sep 11
1 Total assets 210,870.1 4,643.0 (5,077.0)
2 Loans(Banking+Trust accounts) 80,981.2 838.8 1,316.5
3 Loans(Banking accounts) 80,825.9 830.9 1,314.5
4 Domestic corporate loans*1 43,552.1 (364.8) 468.3
5 Housing loans*1 16,901.1 (399.5) (81.6)
6 Overseas loans*2 18,267.6 1,845.4 1,126.8
7 72,620.4 1,596.7 (2,953.7)
8 Japanese government bonds 46,488.4 1,546.5 (774.4)
9 Foreign bonds 14,530.9 893.4 (1,782.7)
10 8,049.4 (568.8) (2,366.6)
11 Total liabilities 199,661.9 4,249.2 (4,950.5)
12 Deposits 122,447.0 (1,697.3) 864.4
13 Individual deposits(Domestic branches)
66,101.6 1,717.0 1,224.8
14 16,366.2 1,877.8 (3,274.2)
15 Total net assets 11,208.2 393.8 (126.5)
Deposit/lending spread(Domestic, non-consolidated) 1.24% (0.05% ) (0.01% )
17 FRL disclosed loans*1*3 1,516.6 85.9 52.7
18 NPL ratio*1 1.77% 0.08% 0.02%
19 298.5 (29.0) (91.6)
*1 Non-consolidated+trust accounts*2 Loans booked in overseas branches, UnionBanCal Corporation and BTMU(China)*3 FRL=the Financial Reconstruction Law
Net unrealized gains (losses)on securities available for sale
16
End Dec 11
Investment securities(banking accounts)
Receivables under resale agreements andReceivables under securities borrowing transactions
Payables under repurchase agreements and Payablesunder securities lending transactions
Balance sheet (¥bn)
8
62.8 63.0 63.2 64.3 66.1
40.0 44.5 42.8 44.5 40.1
19.1 16.2 16.1 15.2 15.8 16.2
64.8
40.8
0
50
100
End Sep.09
End Mar.10
End Sep.10
End Mar.11
End Sep.11
End Dec.11
Individual Corporate, etc Overseas branches & subsidiaries, etc
16.9
18.2
43.5 43.5
5.2 3.12.8 2.5 2.4 2.2
16.917.417.3 17.317.4
16.415.616.617.5 17.1
43.043.947.748.1
0
50
100
End Sep.09
End Mar.10
End Sep.10
End Mar.11
End Sep.11
End Dec.11
Housing loan Overseas*1 Domestic corporate Others
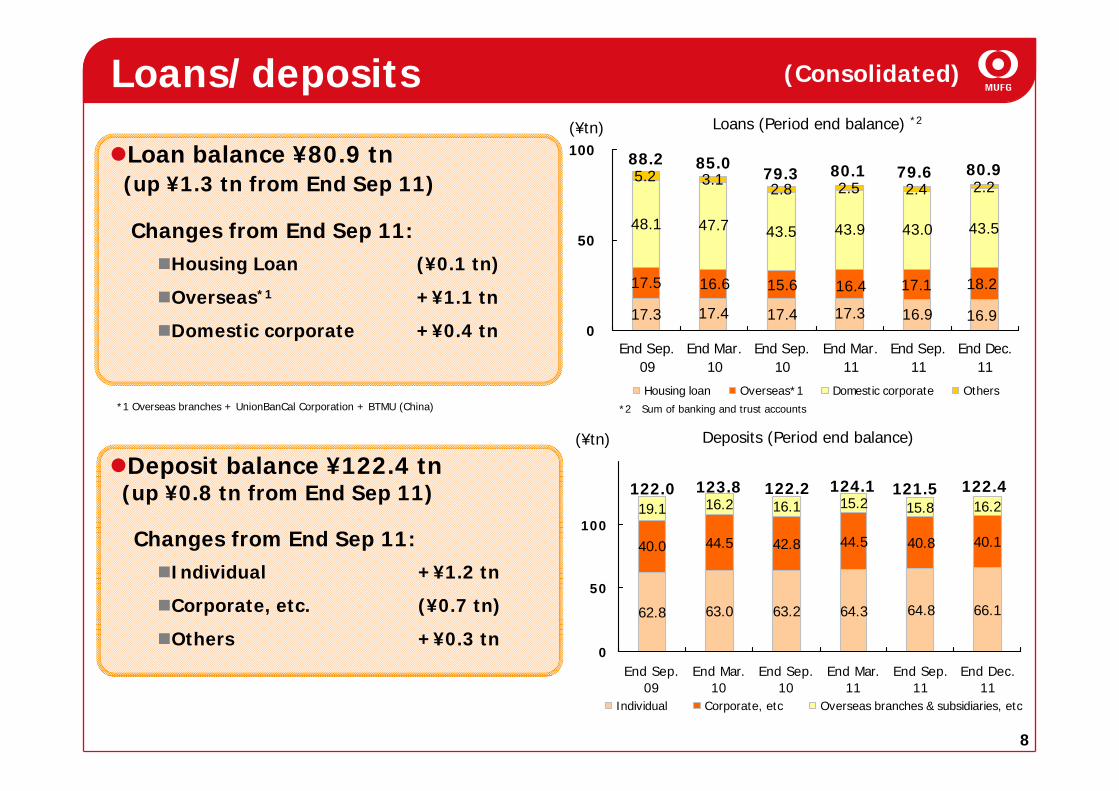
Loans (Period end balance) *2(¥tn)
Deposits (Period end balance) (¥tn)
123.8
88.2
122.0
80.1
124.1
Loans/deposits
85.079.3
122.2
(Consolidated)
*2 Sum of banking and trust accounts*1 Overseas branches + UnionBanCal Corporation + BTMU (China)
80.9
122.4
Loan balance ¥80.9 tn(up ¥1.3 tn from End Sep 11)
Changes from End Sep 11:Housing Loan
Overseas*1
Domestic corporate
(¥0.1 tn)
+¥1.1 tn
+¥0.4 tn
Deposit balance ¥122.4 tn(up ¥0.8 tn from End Sep 11)
Changes from End Sep 11:Individual
Corporate, etc.
Others
+¥1.2 tn
(¥0.7 tn)
+¥0.3 tn
79.6
121.5
9
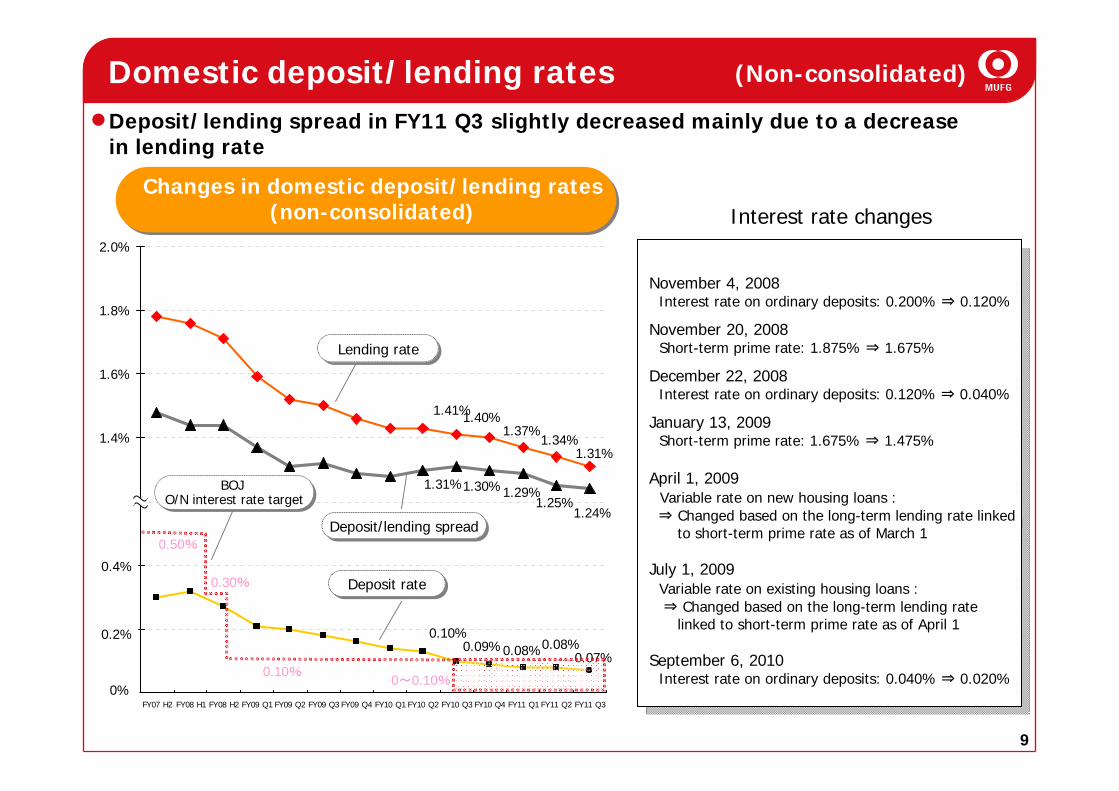
1.34%1.37%
1.40%1.41%
1.31%
1.25%1.29%1.30%1.31%
1.24%
0.08%0.08%0.09%0.10%
0.07%
0.6%
0.8%
1.0%
1.2%
1.4%
1.6%
1.8%
2.0%
FY07 H2 FY08 H1 FY08 H2 FY09 Q1 FY09 Q2 FY09 Q3 FY09 Q4 FY10 Q1 FY10 Q2 FY10 Q3 FY10 Q4 FY11 Q1 FY11 Q2 FY11 Q3
Domestic deposit/lending rates (Non-consolidated)
Interest rate changesChanges in domestic deposit/lending rates
(non-consolidated)
Lending rateLending rate
Deposit rateDeposit rate
Deposit/lending spreadDeposit/lending spread
Deposit/lending spread in FY11 Q3 slightly decreased mainly due to a decrease in lending rate
0.50%
0.30%
0.10%
0%
0.2%
0.4%
BOJ O/N interest rate target
BOJ O/N interest rate target
November 4, 2008Interest rate on ordinary deposits: 0.200% ⇒ 0.120%
November 20, 2008Short-term prime rate: 1.875% ⇒ 1.675%
December 22, 2008Interest rate on ordinary deposits: 0.120% ⇒ 0.040%
January 13, 2009Short-term prime rate: 1.675% ⇒ 1.475%
April 1, 2009Variable rate on new housing loans :⇒ Changed based on the long-term lending rate linked
to short-term prime rate as of March 1
July 1, 2009Variable rate on existing housing loans :⇒ Changed based on the long-term lending rate
linked to short-term prime rate as of April 1
September 6, 2010Interest rate on ordinary deposits: 0.040% ⇒ 0.020%
November 4, 2008Interest rate on ordinary deposits: 0.200% ⇒ 0.120%
November 20, 2008Short-term prime rate: 1.875% ⇒ 1.675%
December 22, 2008Interest rate on ordinary deposits: 0.120% ⇒ 0.040%
January 13, 2009Short-term prime rate: 1.675% ⇒ 1.475%
April 1, 2009Variable rate on new housing loans :⇒ Changed based on the long-term lending rate linked
to short-term prime rate as of March 1
July 1, 2009Variable rate on existing housing loans :⇒ Changed based on the long-term lending rate
linked to short-term prime rate as of April 1
September 6, 2010Interest rate on ordinary deposits: 0.040% ⇒ 0.020%0~0.10%
10
(760.1)
(354.1)
(201.5)
(587.1)
(90.7)
(850)
(750)
(650)
(550)
(450)
(350)
(250)
(150)
(50)
50
FY09 FY10 FY11
(282.8)
(43.0)(44.2)
(174.2)
(361.6)
1.320.92
0.56 0.38 0.290.55 0.54 0.55
0.840.74 0.80 0.84
0.27
0.15
0.11
0.11 0.240.19
0.13 0.11 0.11
0.30
0.65
1.40
0.74
0.640.55
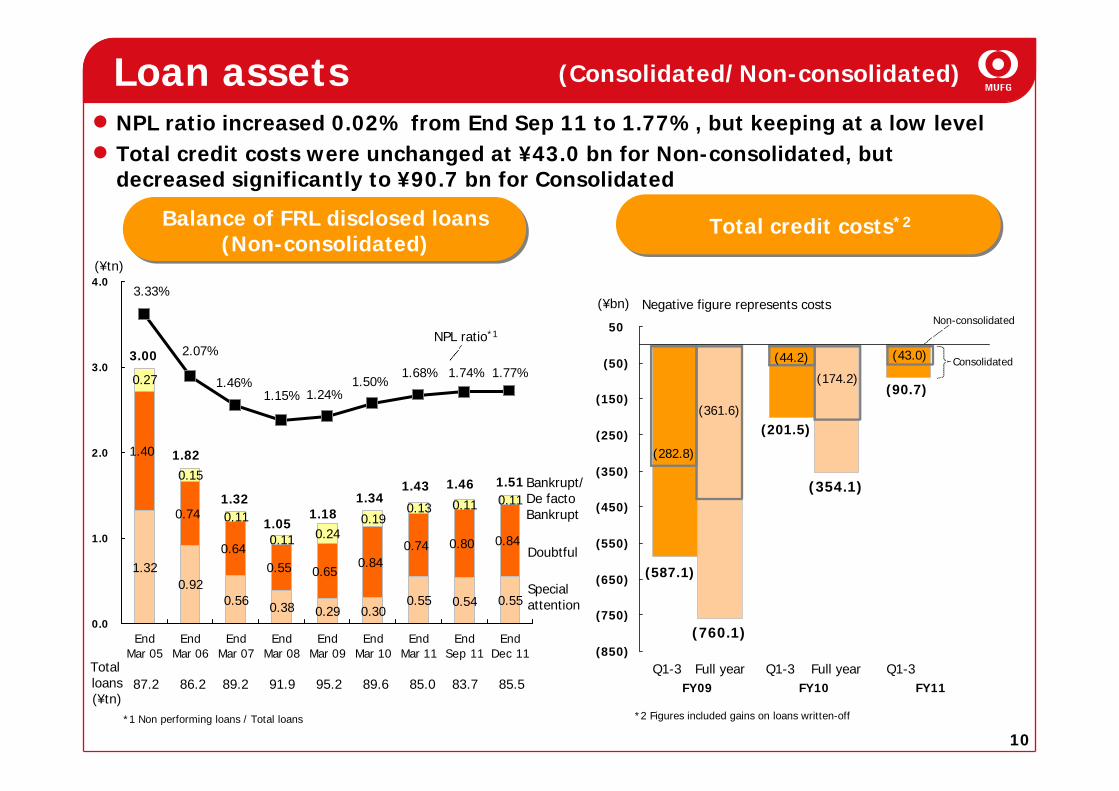
1.77%1.74%1.68%
3.33%
2.07%
1.46%1.15% 1.24%
1.50%
1.511.461.431.34
3.00
1.82
1.32
1.051.18
0.0
1.0
2.0
3.0
4.0
EndMar 05
EndMar 06
EndMar 07
EndMar 08
EndMar 09
EndMar 10
EndMar 11
EndSep 11
EndDec 11
Loan assets
Balance of FRL disclosed loans(Non-consolidated)
Total credit costs*2
Bankrupt/De facto Bankrupt
Doubtful
Special attention
NPL ratio*1
(Consolidated/Non-consolidated)
NPL ratio increased 0.02% from End Sep 11 to 1.77%, but keeping at a low levelTotal credit costs were unchanged at ¥43.0 bn for Non-consolidated, but decreased significantly to ¥90.7 bn for Consolidated
Negative figure represents costs
*2 Figures included gains on loans written-off
Non-consolidated
Consolidated
Q1-3 Full year Q1-3 Full year Q1-387.2 86.2 89.2 91.9 95.2 89.6 85.0 83.7 85.5
Total loans(¥tn)
*1 Non performing loans / Total loans
(¥bn)
(¥tn)
11
End Dec 11Change fromEnd Sep 11
End Dec 11Change fromEnd Sep 11
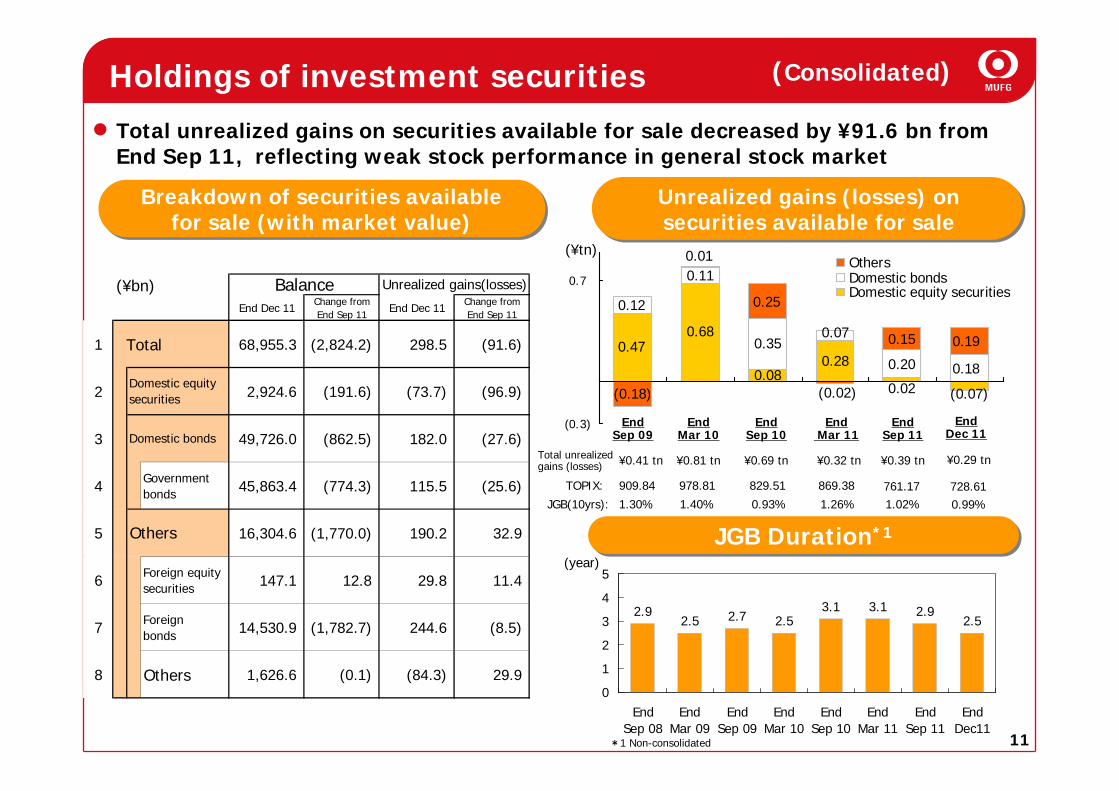
1 Total 68,955.3 (2,824.2) 298.5 (91.6)
2 2,924.6 (191.6) (73.7) (96.9)
3 49,726.0 (862.5) 182.0 (27.6)
4 Governmentbonds 45,863.4 (774.3) 115.5 (25.6)
5 16,304.6 (1,770.0) 190.2 32.9
6 Foreign equitysecurities 147.1 12.8 29.8 11.4
7 Foreignbonds 14,530.9 (1,782.7) 244.6 (8.5)
8 Others 1,626.6 (0.1) (84.3) 29.9
Others
Balance Unrealized gains(losses)
Domestic equitysecurities
Domestic bonds
(Consolidated)
Breakdown of securities availablefor sale (with market value)
Total unrealized gains on securities available for sale decreased by ¥91.6 bn from End Sep 11, reflecting weak stock performance in general stock market
Unrealized gains (losses) on securities available for sale
Holdings of investment securities
(¥bn)
0.18
0.19
(0.07)
0.680.47
0.080.28
0.02
0.20
0.070.35
0.11
0.12
0.15
(0.18) (0.02)
0.25
0.01
(0.3)
0.7OthersDomestic bondsDomestic equity securities
2.92.5 2.7 2.5
3.1 3.1 2.92.5
0
1
2
3
4
5
EndSep 08
EndMar 09
EndSep 09
EndMar 10
EndSep 10
EndMar 11
EndSep 11
EndDec11
JGB Duration*1JGB Duration*1
JGB(10yrs):
TOPIX:
Total unrealized gains (losses)
1.02%1.26%0.93%1.40%1.30%761.17869.38829.51978.81909.84
¥0.39 tn¥0.32 tn¥0.69 tn¥0.81 tn¥0.41 tn
End Sep 11
EndMar 11
End Sep 10
EndMar 10
End Sep 09
(year)
*1 Non-consolidated
(¥tn)
End Dec 11
¥0.29 tn
728.610.99%
12
(Consolidated/Non-consolidated)
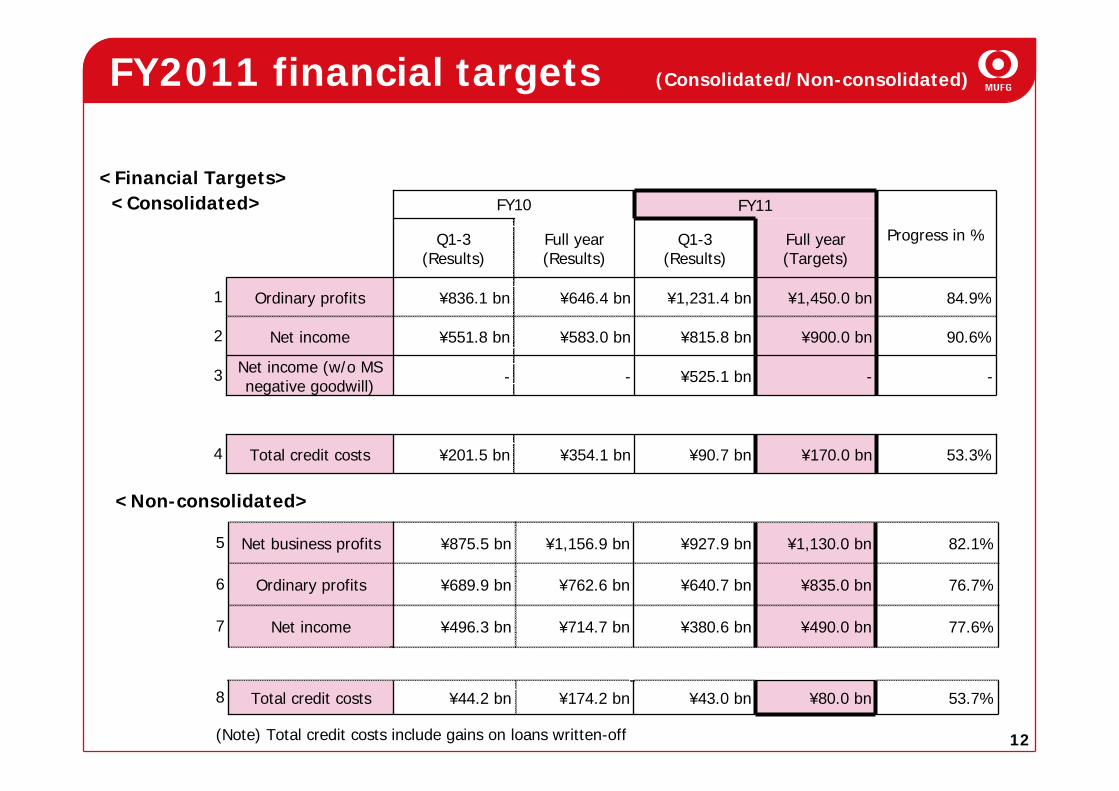
<Financial Targets><Consolidated>
53.3%
-
90.6%
84.9%
Progress in %
¥170.0 bn¥90.7 bn¥354.1 bn¥201.5 bnTotal credit costs4
-¥525.1 bn--Net income (w/o MSnegative goodwill)
3
Full year(Targets)
Q1-3(Results)
Full year(Results)
¥583.0 bn
¥646.4 bn
FY10
¥815.8 bn
¥1,231.4 bn
¥900.0 bn¥551.8 bnNet income2
Q1-3(Results)
1 ¥1,450.0 bn¥836.1 bnOrdinary profits
FY11
53.7%
77.6%
76.7%
82.1%
8
7
¥80.0 bn¥43.0 bn¥174.2 bn¥44.2 bnTotal credit costs
¥490.0 bn¥380.6 bn¥714.7 bn¥496.3 bnNet income
¥762.6 bn
¥1,156.9 bn
¥640.7 bn
¥927.9 bn
¥835.0 bn¥689.9 bnOrdinary profits6
5 ¥1,130.0 bn¥875.5 bnNet business profits
<Non-consolidated>
FY2011 financial targets
(Note) Total credit costs include gains on loans written-off
13
Outline of FY2011 Q3 Results
Future growth
14
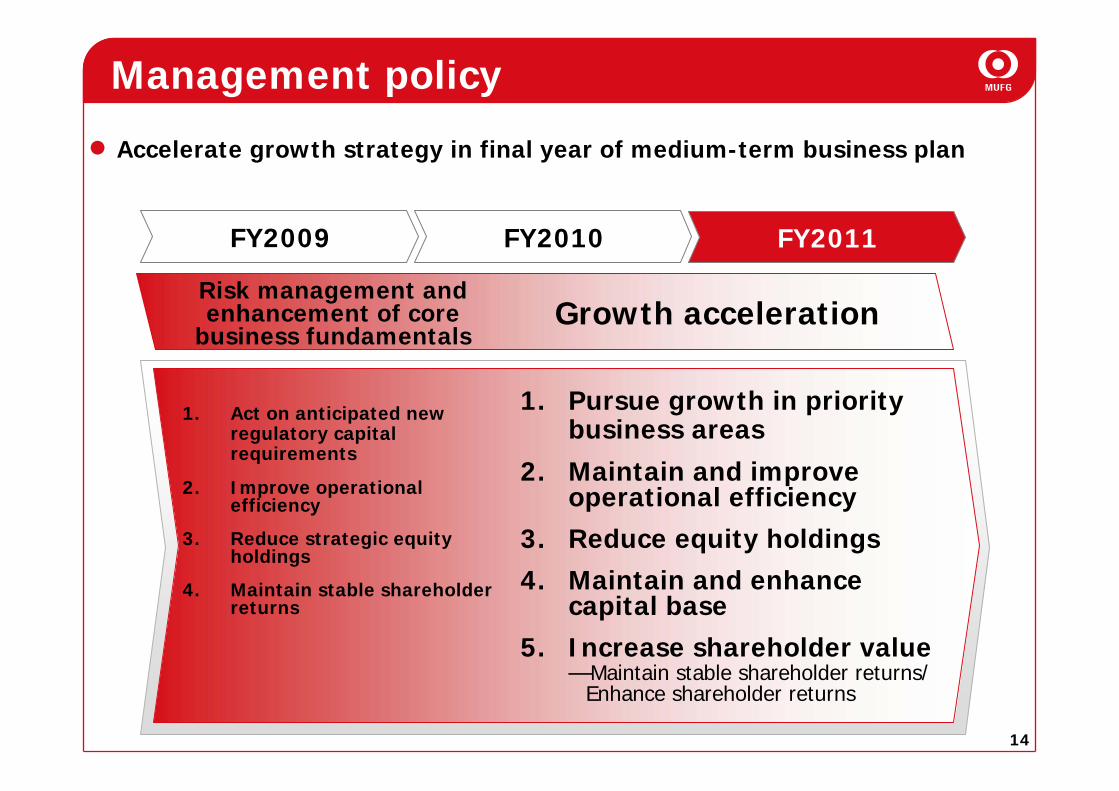
Risk management and enhancement of core
business fundamentalsGrowth acceleration
FY2009 FY2010 FY2011
1. Act on anticipated new regulatory capital requirements
2. Improve operationalefficiency
3. Reduce strategic equity holdings
4. Maintain stable shareholder returns
Management policy
1. Pursue growth in priority business areas
2. Maintain and improve operational efficiency
3. Reduce equity holdings4. Maintain and enhance
capital base5. Increase shareholder value
—Maintain stable shareholder returns/Enhance shareholder returns
Accelerate growth strategy in final year of medium-term business plan
15
Key points
Domestic and overseas lending
Exposures in European peripheralcountries
Improvement in major subsidiaries
Promoting a growth strategy
Addressing key issues
16
30
31
32
33
34
35
36
37
38
39
40
41
42
43
0.6%
0.7%
0.8%
0.9%
1.0%
Average loan balance
Lending spread
12.0
12.5
13.0
13.5
14.0
14.5
15.0
15.5
16.0
16.5
17.0
17.5
18.0
0.6%
0.7%
0.8%
0.9%
1.0%
1.1%
1.2%
Average loan balance
Lending spread
(¥tn)
2011Apr Dec
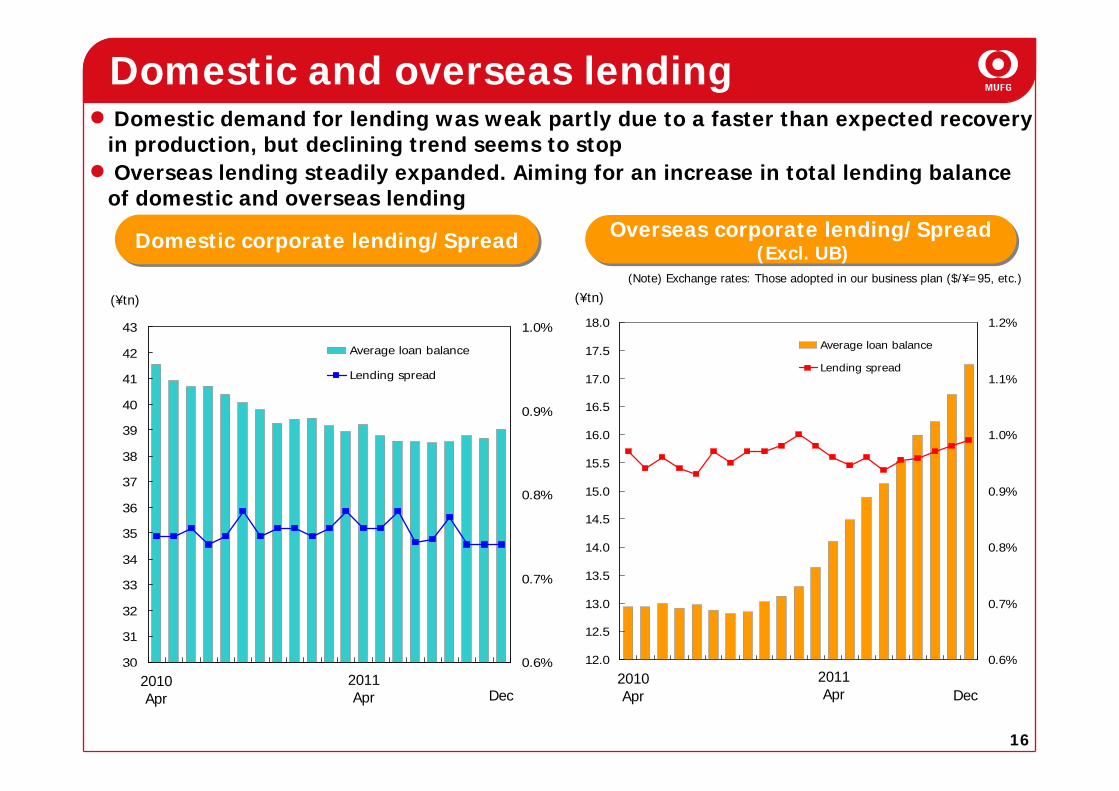
Domestic and overseas lendingDomestic demand for lending was weak partly due to a faster than expected recovery in production, but declining trend seems to stopOverseas lending steadily expanded. Aiming for an increase in total lending balance of domestic and overseas lending
2011Apr
2010Apr
2010AprDec
Domestic corporate lending/SpreadDomestic corporate lending/Spread
(¥tn)(Note) Exchange rates: Those adopted in our business plan ($/¥=95, etc.)
Overseas corporate lending/Spread(Excl. UB)
Overseas corporate lending/Spread(Excl. UB)
17
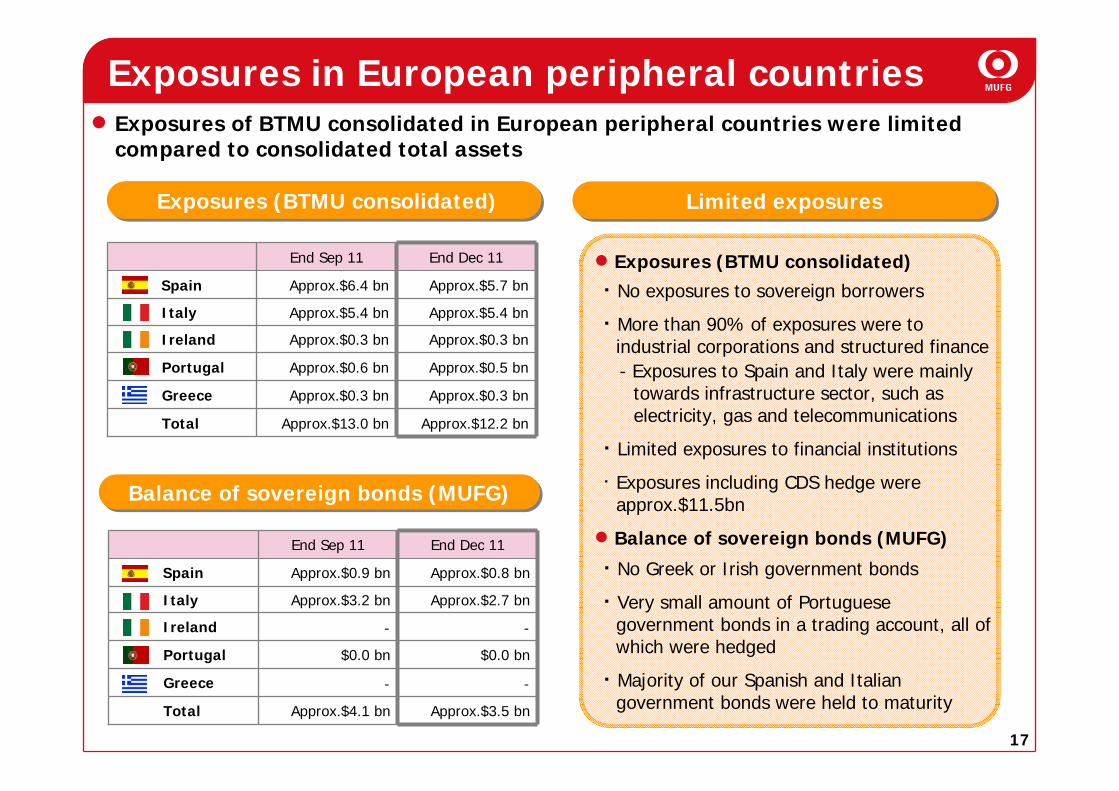
Exposures in European peripheral countries
・ No exposures to sovereign borrowers
・ More than 90% of exposures were to industrial corporations and structured finance- Exposures to Spain and Italy were mainly
towards infrastructure sector, such as electricity, gas and telecommunications
・ Limited exposures to financial institutions
・ Exposures including CDS hedge were approx.$11.5bn
・ No Greek or Irish government bonds
・ Very small amount of Portuguese government bonds in a trading account, all of which were hedged
・ Majority of our Spanish and Italian government bonds were held to maturity
Approx.$12.2 bn
Approx.$0.3 bn
Approx.$0.5 bn
Approx.$0.3 bn
Approx.$5.4 bn
Approx.$5.7 bn
End Dec 11
Approx.$13.0 bn
Approx.$0.3 bn
Approx.$0.6 bn
Approx.$0.3 bn
Approx.$5.4 bn
Approx.$6.4 bn
End Sep 11
Total
Ireland
Portugal
Greece
Italy
Spain
Approx.$3.5 bn
‐
$0.0 bn
‐
Approx.$2.7 bn
Approx.$0.8 bn
End Dec 11
Approx.$4.1 bn
‐
$0.0 bn
‐
Approx.$3.2 bn
Approx.$0.9 bn
End Sep 11
Total
Ireland
Portugal
Greece
Italy
Spain
Exposures of BTMU consolidated in European peripheral countries were limited compared to consolidated total assets
Exposures (BTMU consolidated)Exposures (BTMU consolidated)
Balance of sovereign bonds (MUFG)Balance of sovereign bonds (MUFG)
Limited exposuresLimited exposures
Exposures (BTMU consolidated)
Balance of sovereign bonds (MUFG)
18
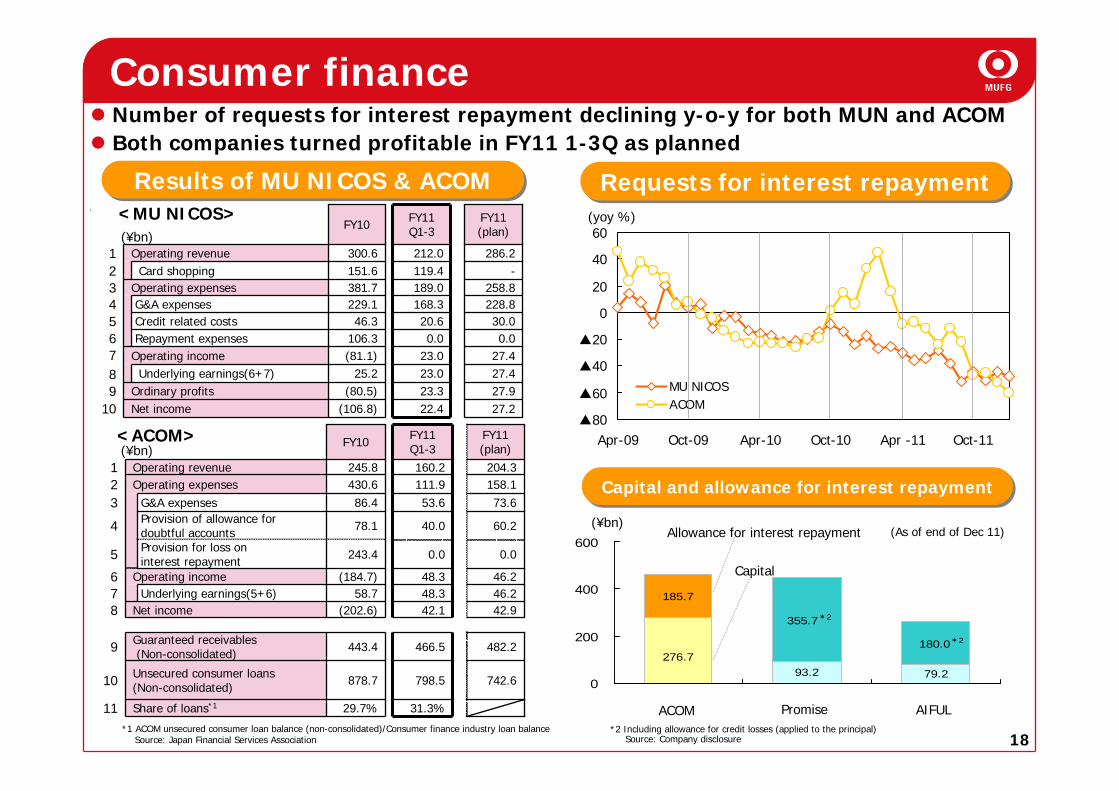
Consumer financeNumber of requests for interest repayment declining y-o-y for both MUN and ACOMBoth companies turned profitable in FY11 1-3Q as planned
(¥bn)
(¥bn)
▲80
▲60
▲40
▲20
0
20
40
60
Apr-09 Oct-09 Apr-10 Oct-10 Apr -11 Oct-11
MU NICOSACOM
(¥bn)
(yoy %)
79.293.2276.7
185.7
355.7*2
180.0*2
0
200
400
600
27.923.3(80.5)Ordinary profits9Underlying earnings(6+7)
30.020.646.3Credit related costs5
27.2
27.427.40.0
228.8258.8
-286.2
FY11(plan)
23.025.2
22.4
23.00.0
168.3189.0119.4212.0
FY11Q1-3
229.1G&A expenses4
Card shopping 151.62
(106.8)
(81.1)106.3
381.7
300.6
FY10
Operating income78
Net income10
Repayment expenses6
Operating expenses
Operating revenue
3
1
s
742.6
60.240.078.1Provision of allowance fordoubtful accounts4
Underlying earnings(5+6)
29.7%
878.7
443.4
(202.6)58.7
(184.7)
243.4
86.4430.6245.8
FY10
46.248.3
482.2466.5Guaranteed receivables(Non-consolidated)9
798.5Unsecured consumer loans(Non-consolidated)10
742.9
46.2
0.0
73.6158.1204.3
FY11(plan)
31.3%
42.1
48.3
0.0
53.6111.9160.2
FY11Q1-3
Operating income6
Net income8
G&A expenses3
Provision for loss oninterest repayment5
Share of loans*111
Operating expensesOperating revenue
21
<ACOM>
<MU NICOS>
Results of MU NICOS & ACOMResults of MU NICOS & ACOM
*1 ACOM unsecured consumer loan balance (non-consolidated)/Consumer finance industry loan balanceSource: Japan Financial Services Association
Requests for interest repaymentRequests for interest repayment
Capital and allowance for interest repaymentCapital and allowance for interest repayment
Allowance for interest repayment
Capital
*2 Including allowance for credit losses (applied to the principal)Source: Company disclosure
ACOM Promise AIFUL
(As of end of Dec 11)
19
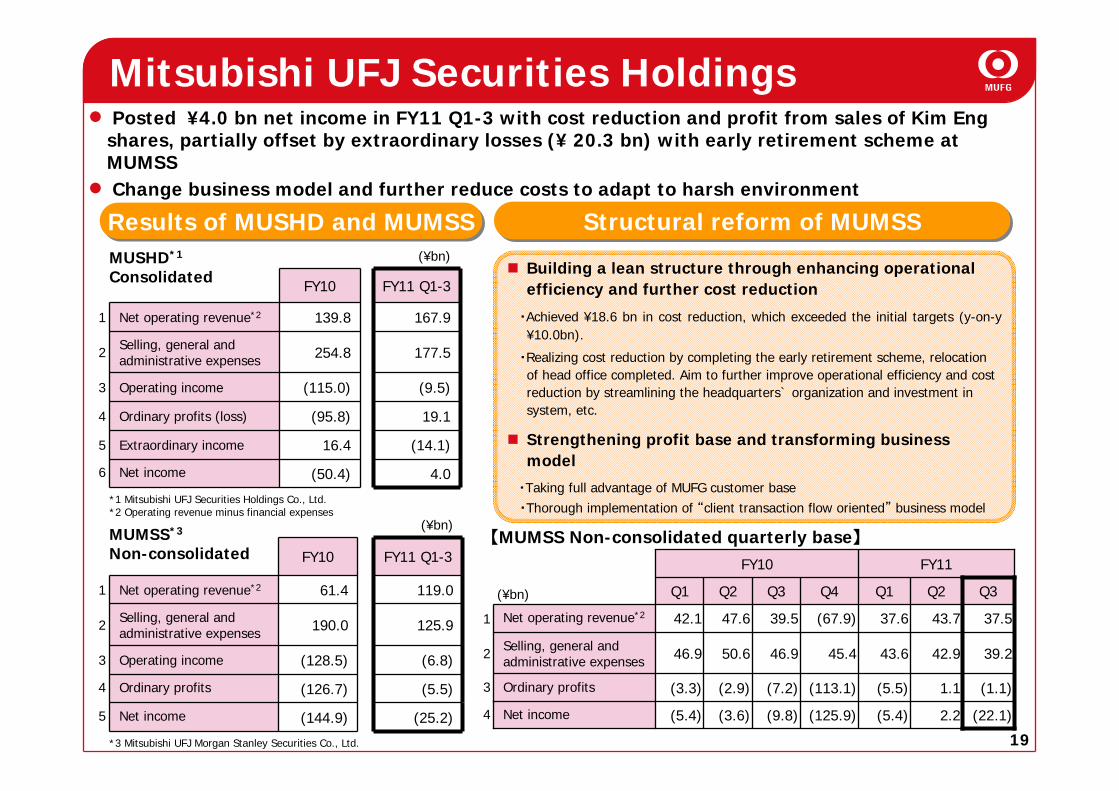
Posted ¥4.0 bn net income in FY11 Q1-3 with cost reduction and profit from sales of Kim Eng shares, partially offset by extraordinary losses (¥ 20.3 bn) with early retirement scheme at MUMSSChange business model and further reduce costs to adapt to harsh environment
Building a lean structure through enhancing operational efficiency and further cost reduction
・Achieved ¥18.6 bn in cost reduction, which exceeded the initial targets (y-on-y¥10.0bn).
・Realizing cost reduction by completing the early retirement scheme, relocation of head office completed. Aim to further improve operational efficiency and cost reduction by streamlining the headquarters` organization and investment in system, etc.
Strengthening profit base and transforming business model
・Taking full advantage of MUFG customer base・Thorough implementation of “client transaction flow oriented” business model
Structural reform of MUMSSStructural reform of MUMSS
Mitsubishi UFJ Securities Holdings
2.2
1.1
42.9
43.7
Q2 Q3Q1Q4Q3Q2Q1
Net income
Ordinary profits
Selling, general and administrative expenses
Net operating revenue*2
(22.1)(5.4)(125.9)(9.8)(3.6)(5.4)4
(1.1)(5.5)(113.1)(7.2)(2.9)(3.3)3
39.243.645.446.950.646.92
37.537.6(67.9)39.547.642.11
FY11FY10
(¥bn)
【MUMSS Non-consolidated quarterly base】
Results of MUSHD and MUMSSResults of MUSHD and MUMSS
19.1(95.8)Ordinary profits (loss)4
(¥bn)MUSHD*1
Consolidated FY10 FY11 Q1-3
1 Net operating revenue*2 139.8 167.9
2 Selling, general and administrative expenses 254.8 177.5
3 Operating income (115.0) (9.5)
5 Extraordinary income 16.4 (14.1)
6 Net income (50.4) 4.0
*1 Mitsubishi UFJ Securities Holdings Co., Ltd.*2 Operating revenue minus financial expenses
(5.5)(126.7)Ordinary profits4
(¥bn)MUMSS*3
Non-consolidated FY10 FY11 Q1-3
1 Net operating revenue*2 61.4 119.0
2 Selling, general and administrative expenses 190.0 125.9
3 Operating income (128.5) (6.8)
5 Net income (144.9) (25.2)
*3 Mitsubishi UFJ Morgan Stanley Securities Co., Ltd.
20
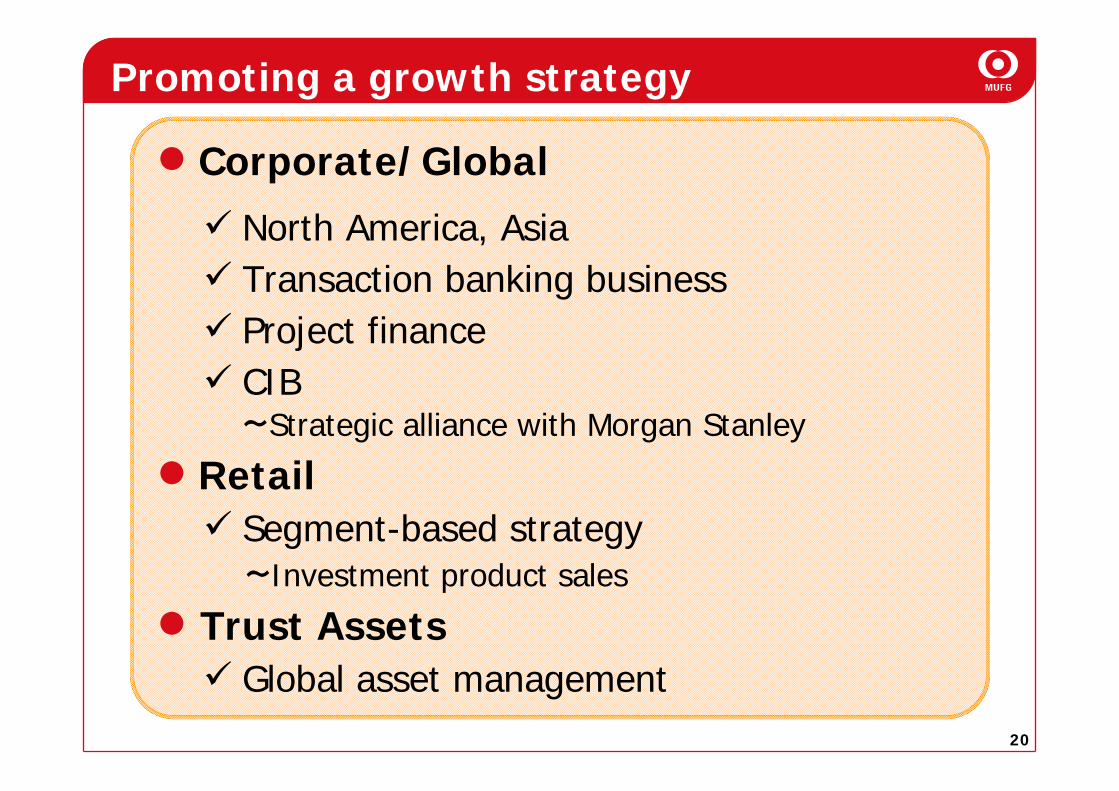
Corporate/Global
North America, AsiaTransaction banking business Project financeCIB~Strategic alliance with Morgan Stanley
RetailSegment-based strategy~Investment product sales
Trust AssetsGlobal asset management
Promoting a growth strategy
21
44.7 43.2 49.4 52.554.8 50.6 56.4 59.0
139.6 151.6159.9 159.6
12.3
126.2
58.585.575.868.164.2
159.6
0
100
200
300
400
4.4 4.1 3.9 4.5
3.7 3.2 3.2 3.6
6.9
4.6 4.5 4.64.6
6.05.75.2
0.0
5.0
10.0
15.0
20.0
Gross profits by regions*1 Average loan balance by regions
Average loan balance by segments
8.7 8.4 8.5 9.9
4.6 4.5 4.65.1
4.64.64.54.6
0.0
5.0
10.0
15.0
20.0
(¥tn)
17.7
17.717.517.9
17.9
(¥bn)
Asia
Americas
Europe
313.6
Global
*1 Excl. CDS *2 Excl. expense of head office in Japan
UB
17.5
Americas
Asia
UB
303.2341.5 19.6
19.6
Europe
356.7
160.8 154.2176.4 177.9
FY09 H2 FY10 H1 FY10 H2 FY11 H1
Others
UB
Japanese
Non-Japanese
Net operating profits by regions*1*2
(¥bn)
FY09 H2 FY10 H1 FY10 H2 FY11 H1
FY09 H2 FY10 H1 FY10 H2 FY11 H1
FY09 H2 FY10 H1 FY10 H2 FY11 H1
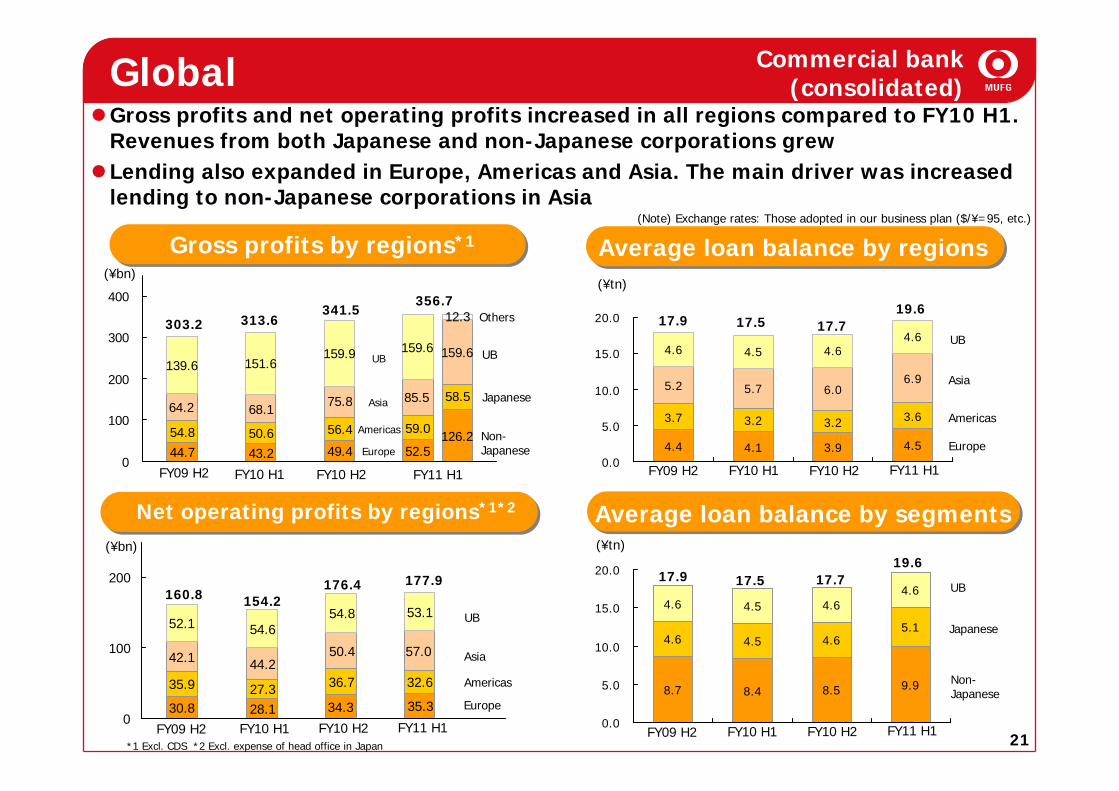
Gross profits and net operating profits increased in all regions compared to FY10 H1. Revenues from both Japanese and non-Japanese corporations grewLending also expanded in Europe, Americas and Asia. The main driver was increased lending to non-Japanese corporations in Asia
Commercial bank (consolidated)
30.8 28.1 34.3 35.3
35.9 27.3 36.7 32.644.2
50.4 57.0
52.1 54.654.8 53.1
42.1
0
100
200
Non-Japanese
Japanese
UB
Europe
Americas
Asia
UB
(¥tn)
(Note) Exchange rates: Those adopted in our business plan ($/¥=95, etc.)
22
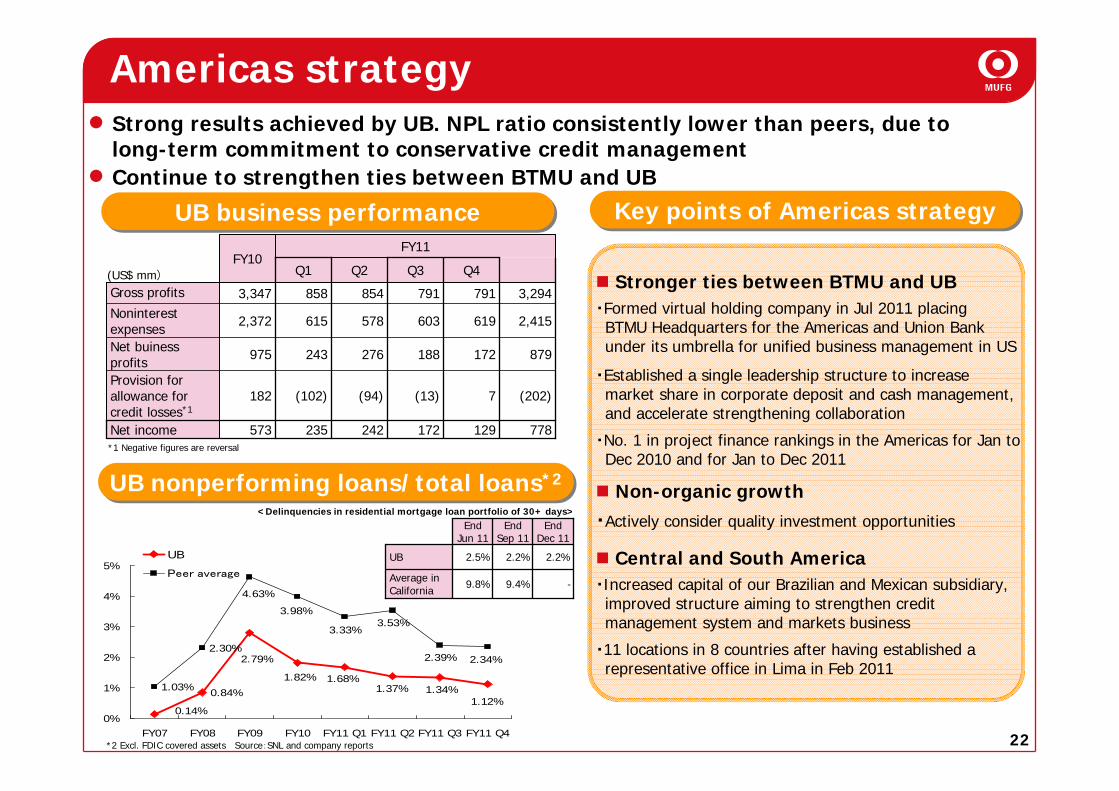
Stronger ties between BTMU and UB ・Formed virtual holding company in Jul 2011 placing BTMU Headquarters for the Americas and Union Bankunder its umbrella for unified business management in US
・Established a single leadership structure to increase market share in corporate deposit and cash management, and accelerate strengthening collaboration
・No. 1 in project finance rankings in the Americas for Jan to Dec 2010 and for Jan to Dec 2011
Non-organic growth・Actively consider quality investment opportunities
Central and South America・Increased capital of our Brazilian and Mexican subsidiary, improved structure aiming to strengthen credit management system and markets business
・11 locations in 8 countries after having established a representative office in Lima in Feb 2011
Americas strategy
0.84%1.03%
2.30%
1.12%
2.79%
1.34%1.37%1.82% 1.68%
0.14%
2.34%
3.53%
2.39%
4.63%
3.98%
3.33%
0%
1%
2%
3%
4%
5%
FY07 FY08 FY09 FY10 FY11 Q1 FY11 Q2 FY11 Q3 FY11 Q4
UB
Peer average
129
7
172
619
791
Q4
778
(202)
879
2,415
3,294
172
(13)
188
603
791
Q3
235
(102)
243
615
858
Q1
FY11
Q2
573
182
975
2,372
3,347
FY10
242Net income
Provision for allowance for credit losses*1
(94)
276Net buinessprofits
578Noninterestexpenses
Gross profits 854
Strong results achieved by UB. NPL ratio consistently lower than peers, due to long-term commitment to conservative credit managementContinue to strengthen ties between BTMU and UB
Key points of Americas strategyKey points of Americas strategyUB business performanceUB business performance
UB nonperforming loans/total loans*2UB nonperforming loans/total loans*2
(US$ mm)
*2 Excl. FDIC covered assets Source:SNL and company reports
<Delinquencies in residential mortgage loan portfolio of 30+ days>
-9.4%9.8%Average in California
2.2%2.2%2.5%UB
End Dec 11
End Sep 11
End Jun 11
*1 Negative figures are reversal
23
0
20
40
60
80
100
120
140
FY07 FY08 FY09 FY10 FY11
Full YearQ1-3
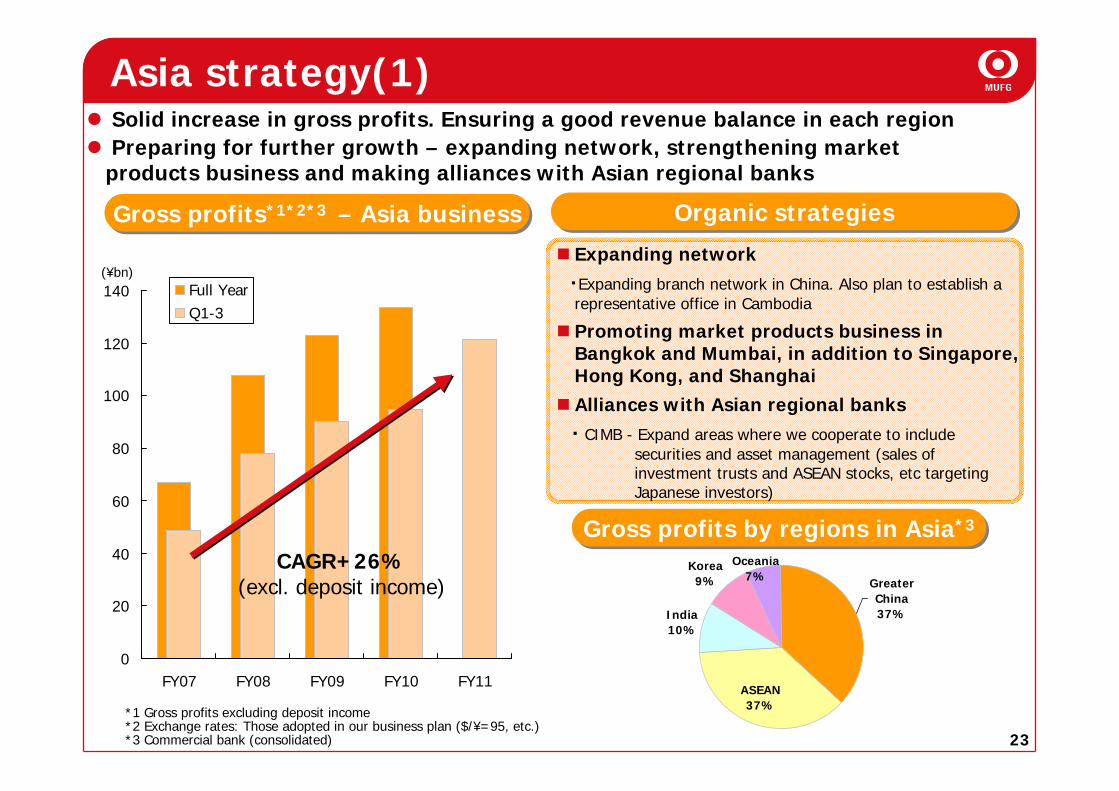
Expanding network・Expanding branch network in China. Also plan to establish a representative office in Cambodia
Promoting market products business in Bangkok and Mumbai, in addition to Singapore,Hong Kong, and ShanghaiAlliances with Asian regional banks・CIMB - Expand areas where we cooperate to include
securities and asset management (sales ofinvestment trusts and ASEAN stocks, etc targetingJapanese investors)
Asia strategy(1)Solid increase in gross profits. Ensuring a good revenue balance in each regionPreparing for further growth – expanding network, strengthening market products business and making alliances with Asian regional banks
Korea9%
India10%
GreaterChina37%
ASEAN37%
Oceania7%
Organic strategiesOrganic strategies
Gross profits by regions in Asia*3Gross profits by regions in Asia*3
Gross profits*1*2*3 – Asia businessGross profits*1*2*3 – Asia business
CAGR+26%(excl. deposit income)
(¥bn)
*1 Gross profits excluding deposit income*2 Exchange rates: Those adopted in our business plan ($/¥=95, etc.)*3 Commercial bank (consolidated)
24
Thailand Indonesia Malaysia Korea
0
2
4
6
8
10
12
End Mar10
End Sep10
End Mar11
End Sep11
(US$ bn)
0
2
4
6
8
10
12
End Mar10
End Sep10
End Mar11
End Sep11
(US$ bn)
0
2
4
6
8
10
12
End Mar10
End Sep10
End Mar11
End Sep11
(US$ bn)
0
2
4
6
8
10
12
End Mar10
End Sep10
End Mar11
End Sep11
(US$ bn)
China Hong Kong Singapore India
7.16.5
0
2
4
6
8
10
12
End Mar 10 End Mar 11
(US$ bn)
Loansoutstanding
11.5
8.1
0
2
4
6
8
10
12
End Mar 10 End Mar 11
(US$ bn)
Loansoutstanding
7.2
4.1
0
2
4
6
8
10
12
End Mar 10 End Mar 11
(US$ bn)
Loansoutstanding
6.56.0
0
2
4
6
8
10
12
End Mar 10 End Mar 11
(US$ bn)
Loansoutstanding
0
2
4
6
8
10
12
End Mar10
End Sep10
End Mar11
End Sep11
(US$ bn)
0
2
4
6
8
10
12
End Mar10
End Sep10
End Mar11
End Sep11
(US$ bn)
0
2
4
6
8
10
12
End Mar10
End Sep10
End Mar11
End Sep11
(US$ bn)
0
2
4
6
8
10
12
End Mar10
End Sep10
End Mar11
End Sep11
(US$ bn)
Asia strategy(2)
6.1 6.5 6.8
JapaneseNon-Japanese
8.0
10.3
7.56.26.0
11.3
2.94.3
6.0
5.1 4.8 5.5
3.2 3.6 4.0 4.12.93.0 2.6 2.6 2.9
6.9
12.7
6.5 6.7
5.94.7
4.0 3.3
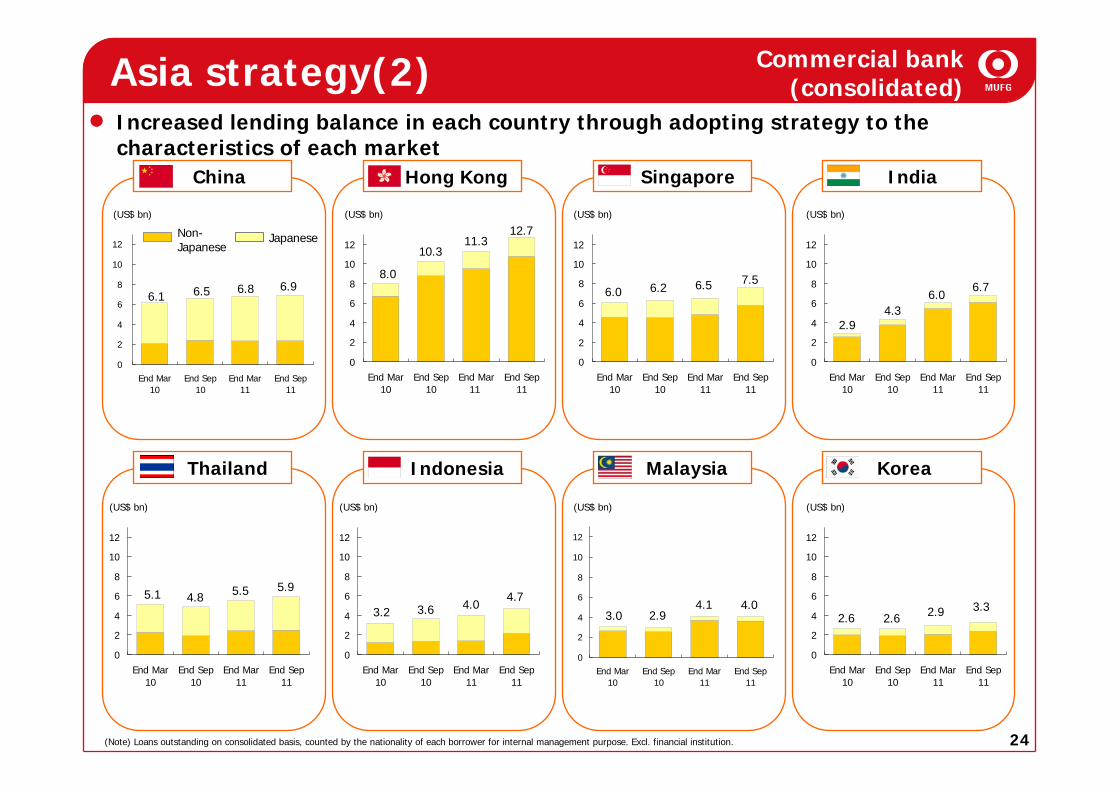
Commercial bank (consolidated)
Increased lending balance in each country through adopting strategy to the characteristics of each market
(Note) Loans outstanding on consolidated basis, counted by the nationality of each borrower for internal management purpose. Excl. financial institution.
25
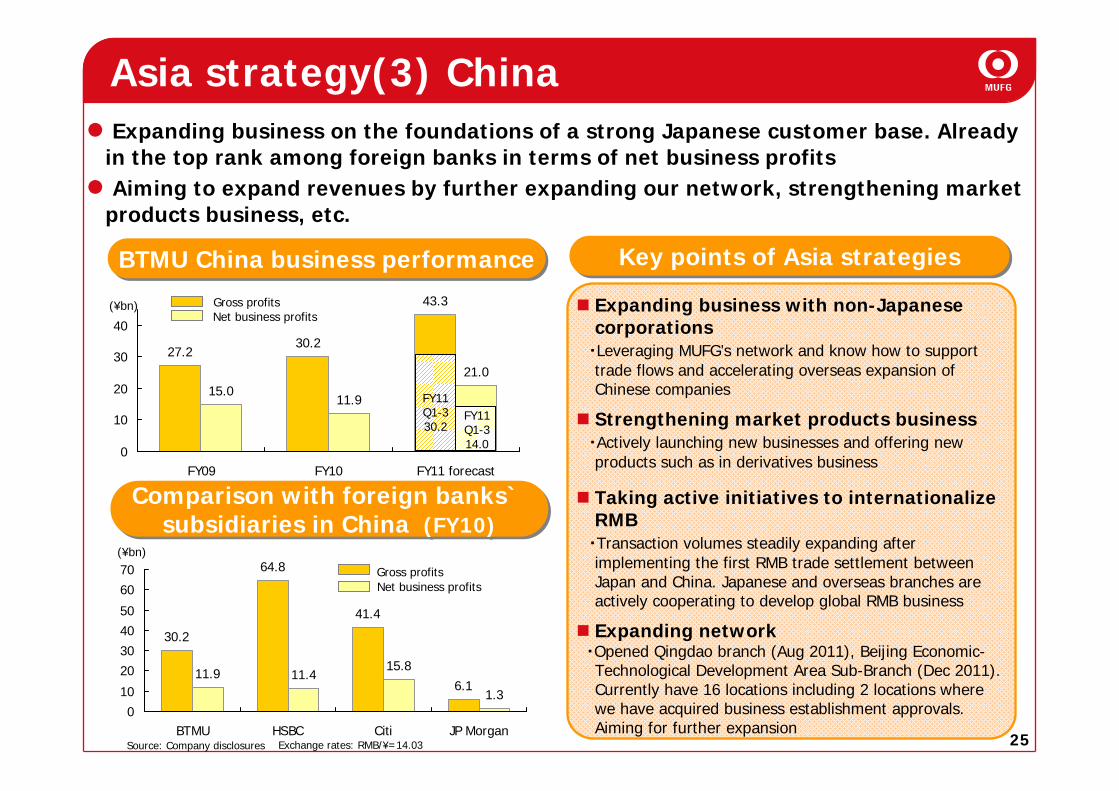
27.230.2
43.3
15.011.9
21.0
0
10
20
30
40
FY09 FY10 FY11 forecast
Asia strategy(3) China
Comparison with foreign banks` subsidiaries in China (FY10)
Comparison with foreign banks` subsidiaries in China (FY10)
BTMU China business performanceBTMU China business performance Key points of Asia strategiesKey points of Asia strategies
(¥bn)
Expanding business on the foundations of a strong Japanese customer base. Already in the top rank among foreign banks in terms of net business profitsAiming to expand revenues by further expanding our network, strengthening market
products business, etc.
30.2
64.8
41.4
6.111.9 11.4
15.8
1.30
10
20304050
6070
BTMU HSBC Citi JP Morgan
(¥bn)
Source: Company disclosures
Net business profitsGross profits
Expanding business with non-Japanese corporations
・Leveraging MUFG’s network and know how to support trade flows and accelerating overseas expansion of Chinese companies
Strengthening market products business・Actively launching new businesses and offering new products such as in derivatives business
Taking active initiatives to internationalize RMB
・Transaction volumes steadily expanding afterimplementing the first RMB trade settlement between Japan and China. Japanese and overseas branches are actively cooperating to develop global RMB business
Expanding network・Opened Qingdao branch (Aug 2011), Beijing Economic-Technological Development Area Sub-Branch (Dec 2011). Currently have 16 locations including 2 locations where we have acquired business establishment approvals. Aiming for further expansion
FY11 Q1-330.2
Gross profitsNet business profits
Exchange rates: RMB/¥=14.03
FY11 Q1-314.0
26
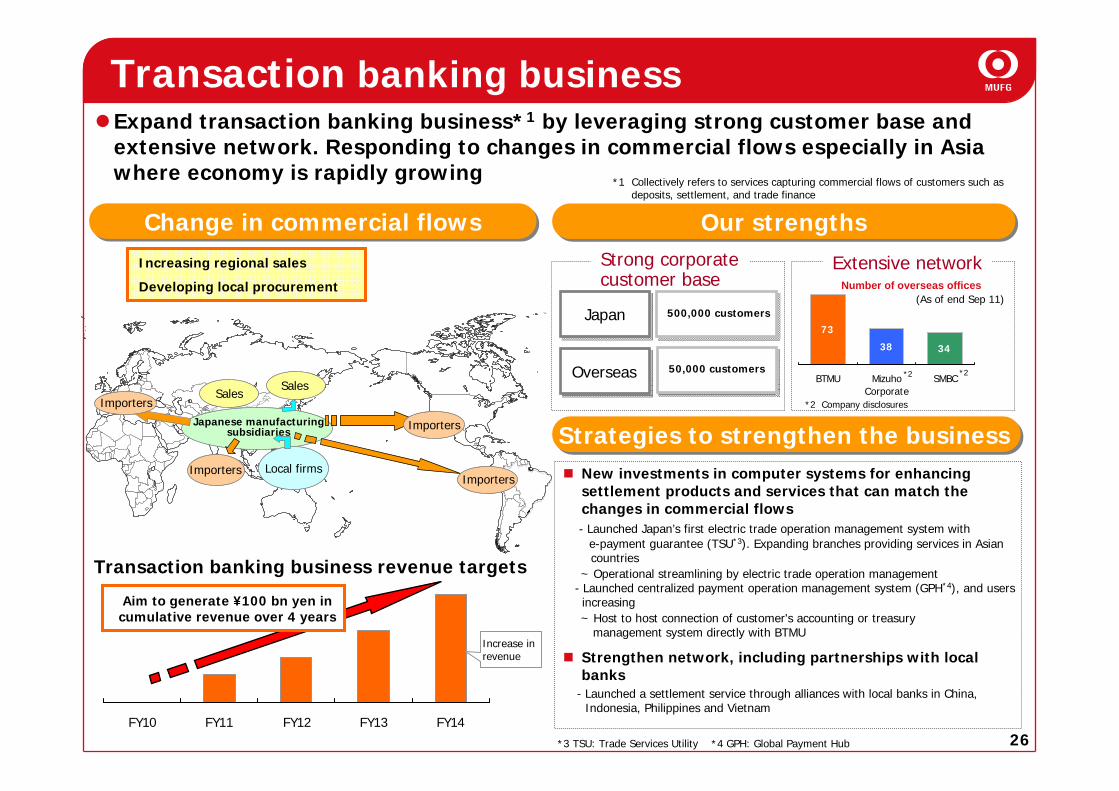
Expand transaction banking business*1 by leveraging strong customer base and extensive network. Responding to changes in commercial flows especially in Asia where economy is rapidly growing
Change in commercial flowsChange in commercial flows Our strengthsOur strengthsStrong corporate customer base
JapanJapan 500,000 customers500,000 customers
OverseasOverseas 50,000 customers50,000 customers
Strategies to strengthen the businessStrategies to strengthen the business
*1 Collectively refers to services capturing commercial flows of customers such as deposits, settlement, and trade finance
3438
73
BTMU MizuhoCorporate
SMBC
Number of overseas offices
Extensive network
*2 Company disclosures
Transaction banking business
FY10 FY11 FY12 FY13 FY14
Transaction banking business revenue targets
Aim to generate ¥100 bn yen in cumulative revenue over 4 years
Increase in revenue
*2 *2
Increasing regional sales
Developing local procurement
Importers Local firms
Importers
Importers
ImportersSales
Sales
Japanese manufacturing subsidiaries
(As of end Sep 11)
New investments in computer systems for enhancing settlement products and services that can match the changes in commercial flows- Launched Japan’s first electric trade operation management system with
e-payment guarantee (TSU*3). Expanding branches providing services in Asian countries
~ Operational streamlining by electric trade operation management- Launched centralized payment operation management system (GPH*4), and users increasing~ Host to host connection of customer's accounting or treasury
management system directly with BTMU
Strengthen network, including partnerships with local banks
- Launched a settlement service through alliances with local banks in China, Indonesia, Philippines and Vietnam
*3 TSU: Trade Services Utility *4 GPH: Global Payment Hub
27
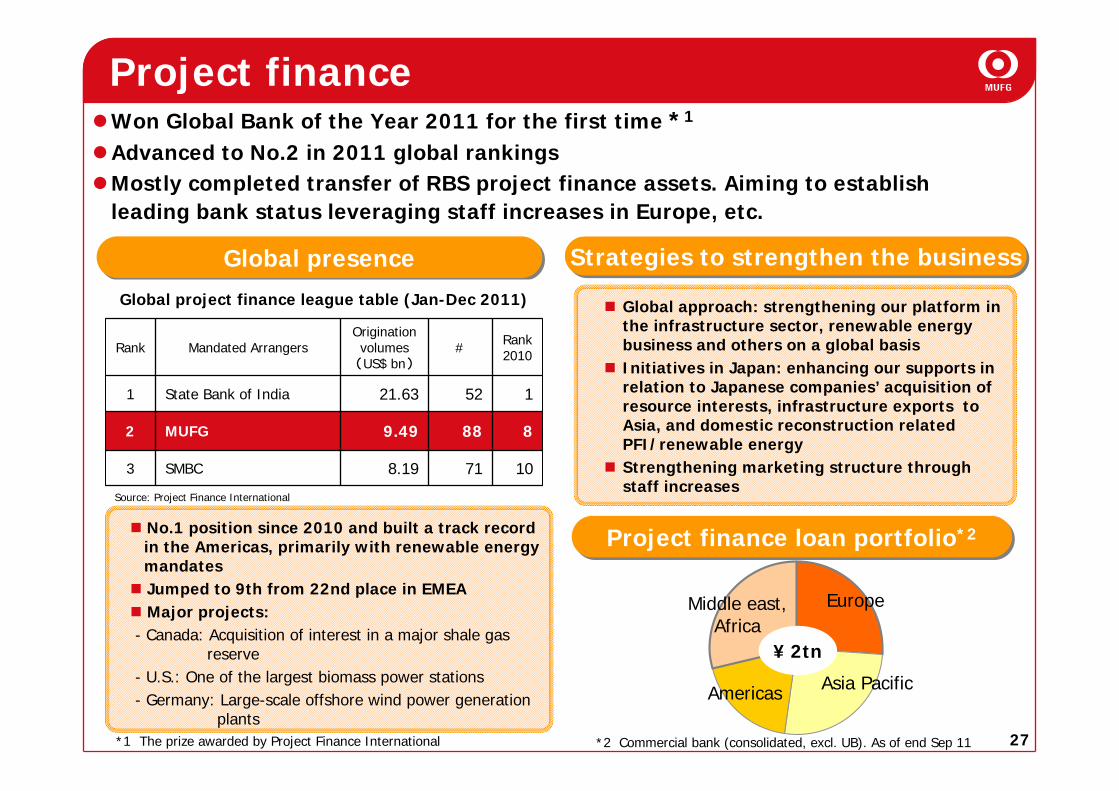
Won Global Bank of the Year 2011 for the first time *1
Advanced to No.2 in 2011 global rankingsMostly completed transfer of RBS project finance assets. Aiming to establish leading bank status leveraging staff increases in Europe, etc.
Global presenceGlobal presence
Project finance
Europe
Asia PacificAmericas
Middle east, Africa
¥ 2tn
Project finance loan portfolio*2Project finance loan portfolio*2
Strategies to strengthen the businessStrategies to strengthen the business
Global approach: strengthening our platform in the infrastructure sector, renewable energy business and others on a global basisInitiatives in Japan: enhancing our supports in relation to Japanese companies’ acquisition of resource interests, infrastructure exports to Asia, and domestic reconstruction related PFI/renewable energyStrengthening marketing structure through staff increases
71
88
52
#
Global project finance league table (Jan-Dec 2011)
Source: Project Finance International
108.19SMBC3
89.49MUFG2
121.63State Bank of India1
Rank2010
Origination volumes(US$ bn)
Mandated ArrangersRank
No.1 position since 2010 and built a track recordin the Americas, primarily with renewable energymandatesJumped to 9th from 22nd place in EMEAMajor projects:
- Canada: Acquisition of interest in a major shale gasreserve
- U.S.: One of the largest biomass power stations- Germany: Large-scale offshore wind power generation
plants *2 Commercial bank (consolidated, excl. UB). As of end Sep 11*1 The prize awarded by Project Finance International
28
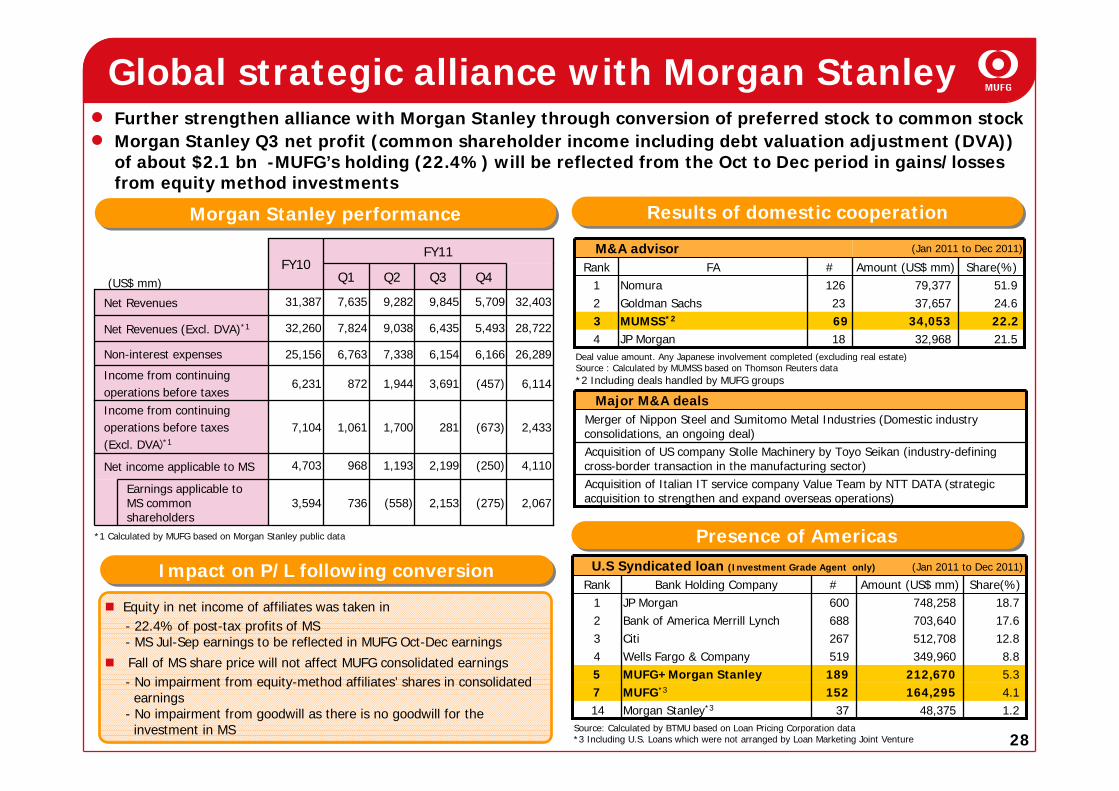
Global strategic alliance with Morgan StanleyFurther strengthen alliance with Morgan Stanley through conversion of preferred stock to common stockMorgan Stanley Q3 net profit (common shareholder income including debt valuation adjustment (DVA)) of about $2.1 bn -MUFG’s holding (22.4%) will be reflected from the Oct to Dec period in gains/losses from equity method investments
5.3212,670189MUFG+Morgan Stanley54.1164,295152MUFG*37
17.6703,640688Bank of America Merrill Lynch212.8512,708267Citi3
1.248,37537Morgan Stanley*314
8.8349,960519Wells Fargo & Company4
18.7748,258600JP Morgan1Share(%)Amount (US$ mm)#Bank Holding CompanyRank
U.S Syndicated loan (Investment Grade Agent only) (Jan 2011 to Dec 2011)
Morgan Stanley performanceMorgan Stanley performance
Presence of AmericasPresence of Americas
Results of domestic cooperationResults of domestic cooperation
(275)
(250)
(673)
(457)
6,166
5,493
5,709
Q4
2,153
2,199
281
3,691
6,154
6,435
9,845
Q3
28,7229,0387,82432,260Net Revenues (Excl. DVA)*1
2,4331,7001,0617,104Income from continuing operations before taxes(Excl. DVA)*1
Earnings applicable to MS common shareholders
3,594
4,703
6,231
25,156
31,387
FY10
736
968
872
6,763
7,635
Q1
FY11
(558)
1,193
1,944
7,338
9,282
Q2
2,067
4,110
6,114
26,289
32,403
Non-interest expenses
Net Revenues
Net income applicable to MS
Income from continuing operations before taxes
Impact on P/L following conversionImpact on P/L following conversion
22.234,05369MUMSS*2321.532,96818JP Morgan4
24.637,65723Goldman Sachs251.979,377126Nomura1
Share(%)Amount (US$ mm)#FARank
(Jan 2011 to Dec 2011)M&A advisor
Acquisition of Italian IT service company Value Team by NTT DATA (strategic acquisition to strengthen and expand overseas operations)
Acquisition of US company Stolle Machinery by Toyo Seikan (industry-defining cross-border transaction in the manufacturing sector)
Merger of Nippon Steel and Sumitomo Metal Industries (Domestic industry consolidations, an ongoing deal)
Major M&A deals
(US$ mm)
*2 Including deals handled by MUFG groups
*1 Calculated by MUFG based on Morgan Stanley public data
Equity in net income of affiliates was taken in- 22.4% of post-tax profits of MS- MS Jul-Sep earnings to be reflected in MUFG Oct-Dec earnings
Fall of MS share price will not affect MUFG consolidated earnings- No impairment from equity-method affiliates’ shares in consolidated earnings
- No impairment from goodwill as there is no goodwill for the investment in MS
Deal value amount. Any Japanese involvement completed (excluding real estate)Source : Calculated by MUMSS based on Thomson Reuters data
Source: Calculated by BTMU based on Loan Pricing Corporation data*3 Including U.S. Loans which were not arranged by Loan Marketing Joint Venture
29
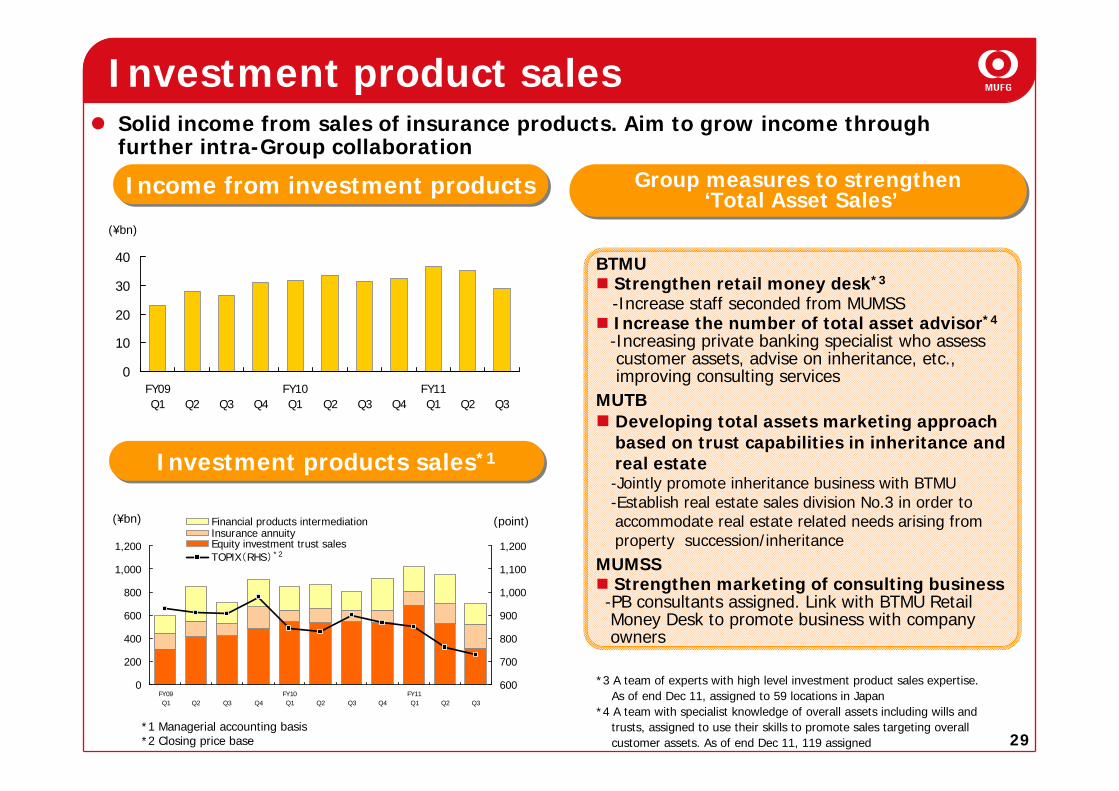
Investment product salesSolid income from sales of insurance products. Aim to grow income through further intra-Group collaboration
Income from investment productsIncome from investment products
(¥bn)
Investment products sales*1Investment products sales*1
(¥bn)
*1 Managerial accounting basis *2 Closing price base
Group measures to strengthen‘Total Asset Sales’
Group measures to strengthen‘Total Asset Sales’
BTMUStrengthen retail money desk*3
-Increase staff seconded from MUMSSIncrease the number of total asset advisor*4
-Increasing private banking specialist who assess customer assets, advise on inheritance, etc.,improving consulting services
MUTBDeveloping total assets marketing approachbased on trust capabilities in inheritance andreal estate-Jointly promote inheritance business with BTMU-Establish real estate sales division No.3 in order toaccommodate real estate related needs arising from property succession/inheritance
MUMSSStrengthen marketing of consulting business
-PB consultants assigned. Link with BTMU RetailMoney Desk to promote business with companyowners
*3 A team of experts with high level investment product sales expertise. As of end Dec 11, assigned to 59 locations in Japan
*4 A team with specialist knowledge of overall assets including wills andtrusts, assigned to use their skills to promote sales targeting overall customer assets. As of end Dec 11, 119 assigned
0
10
20
30
40
FY09Q1 Q2 Q3 Q4
FY10Q1 Q2 Q3 Q4
FY11Q1 Q2 Q3
0
200
400
600
800
1,000
1,200
FY09Q1 Q2 Q3 Q4
FY10Q1 Q2 Q3 Q4
FY11Q1 Q2 Q3
600
700
800
900
1,000
1,100
1,200
Financial products intermediationInsurance annuityEquity investment trust salesTOPIX(RHS) *2
(point)
30
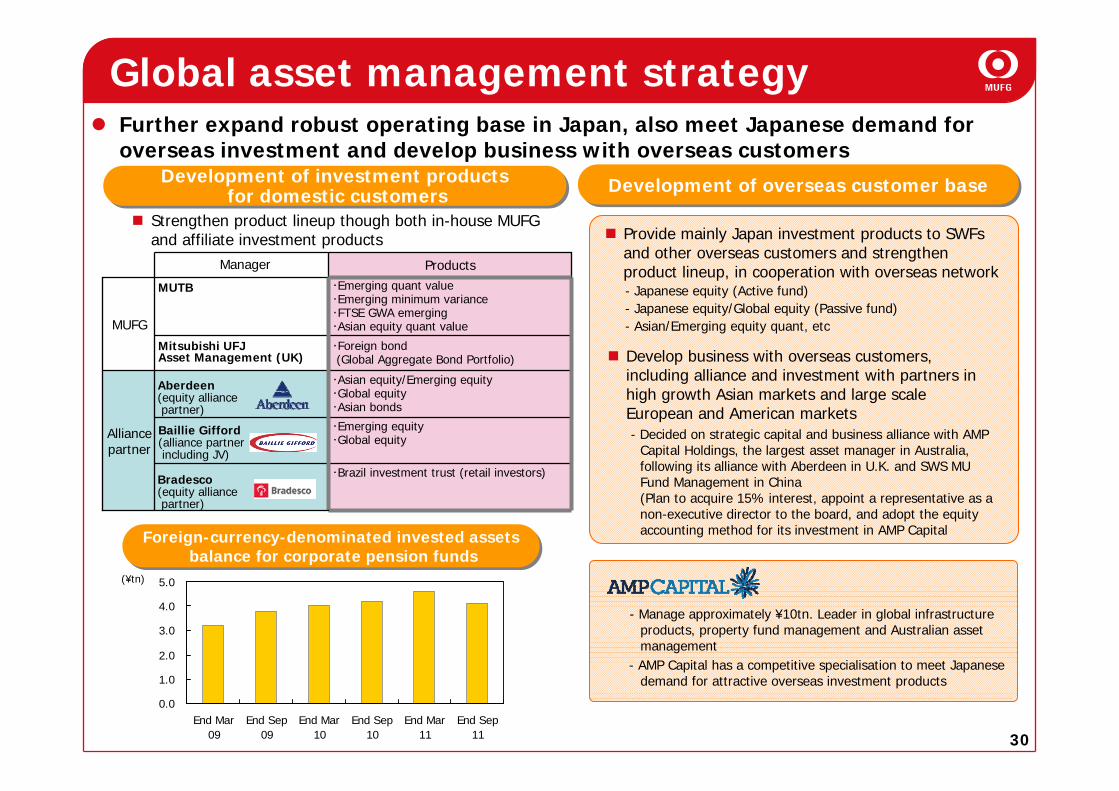
・Brazil investment trust (retail investors)
・Emerging equity・Global equity
・Foreign bond(Global Aggregate Bond Portfolio)
Mitsubishi UFJ Asset Management (UK)
・Asian equity/Emerging equity・Global equity・Asian bonds
・Emerging quant value・Emerging minimum variance・FTSE GWA emerging・Asian equity quant value
Products
Alliance partner
MUTB
Manager
MUFG
0.0
1.0
2.0
3.0
4.0
5.0
End Mar09
End Sep09
End Mar10
End Sep10
End Mar11
End Sep11
Strengthen product lineup though both in-house MUFG and affiliate investment products Provide mainly Japan investment products to SWFs
and other overseas customers and strengthen product lineup, in cooperation with overseas network
Develop business with overseas customers, including alliance and investment with partners in high growth Asian markets and large scale European and American markets
- Japanese equity (Active fund)- Japanese equity/Global equity (Passive fund)- Asian/Emerging equity quant, etc
Foreign-currency-denominated invested assetsbalance for corporate pension funds
Foreign-currency-denominated invested assetsbalance for corporate pension funds
(¥tn)
Global asset management strategyFurther expand robust operating base in Japan, also meet Japanese demand for overseas investment and develop business with overseas customers
Development of investment productsfor domestic customers
Development of investment productsfor domestic customers Development of overseas customer baseDevelopment of overseas customer base
Aberdeen(equity alliance partner)
Baillie Gifford(alliance partner including JV)
Bradesco(equity alliance partner)
- Decided on strategic capital and business alliance with AMP Capital Holdings, the largest asset manager in Australia, following its alliance with Aberdeen in U.K. and SWS MU Fund Management in China (Plan to acquire 15% interest, appoint a representative as a non-executive director to the board, and adopt the equity accounting method for its investment in AMP Capital
- Manage approximately ¥10tn. Leader in global infrastructure products, property fund management and Australian asset management
- AMP Capital has a competitive specialisation to meet Japanese demand for attractive overseas investment products
31
Addressing key issues
Maintain and improve operational
efficiency/ Reduce equity holdings
Maintain and enhance capital base
Capital policy
32
1.471.511.561.571.57
0.00%
1.00%
2.00%
3.00%
0.880.900.970.96 0.88
0
1
2
3
07年度 08年度 09年度 10年度 11年度FY07 Q1-3 FY08 Q1-3 FY09 Q1-3 FY10 Q1-3 FY11 Q1-3
(¥tn)
61.5%
58.5%60.4%
55.9%
55.3%
50.2%
58.1%
63.0%
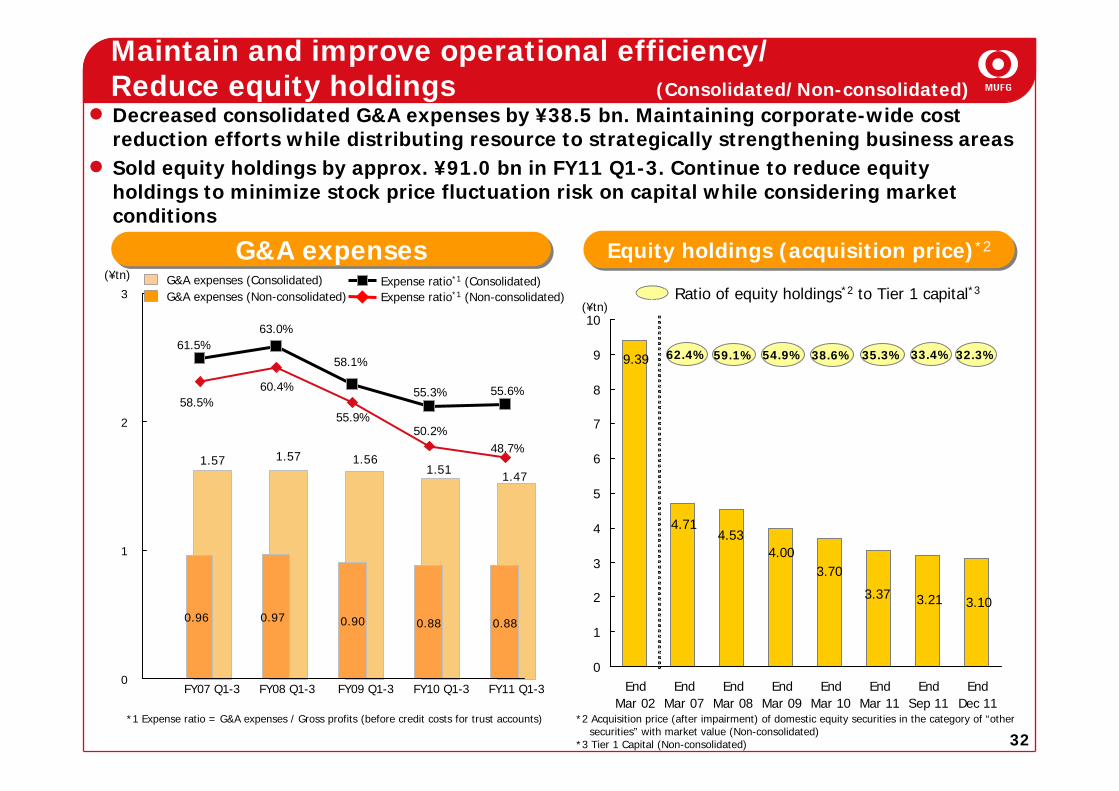
Maintain and improve operational efficiency/Reduce equity holdings (Consolidated/Non-consolidated)Decreased consolidated G&A expenses by ¥38.5 bn. Maintaining corporate-wide cost reduction efforts while distributing resource to strategically strengthening business areas Sold equity holdings by approx. ¥91.0 bn in FY11 Q1-3. Continue to reduce equity holdings to minimize stock price fluctuation risk on capital while considering market conditions
55.6%
48.7%
0
1
2
3
4
5
6
7
8
9
10
EndMar 02
EndMar 07
EndMar 08
EndMar 09
EndMar 10
EndMar 11
EndSep 11
EndDec 11
9.39
4.714.53
4.003.70
3.37
62.4% 59.1% 54.9% 38.6% 35.3% 33.4%
3.21
G&A expensesG&A expensesG&A expenses (Consolidated)G&A expenses (Non-consolidated) Expense ratio*1 (Non-consolidated)
Expense ratio*1 (Consolidated)
*1 Expense ratio = G&A expenses / Gross profits (before credit costs for trust accounts)
(¥tn)
Equity holdings (acquisition price)*2Equity holdings (acquisition price)*2
*2 Acquisition price (after impairment) of domestic equity securities in the category of “othersecurities” with market value (Non-consolidated)
*3 Tier 1 Capital (Non-consolidated)
Ratio of equity holdings*2 to Tier 1 capital*3
3.10
32.3%
33
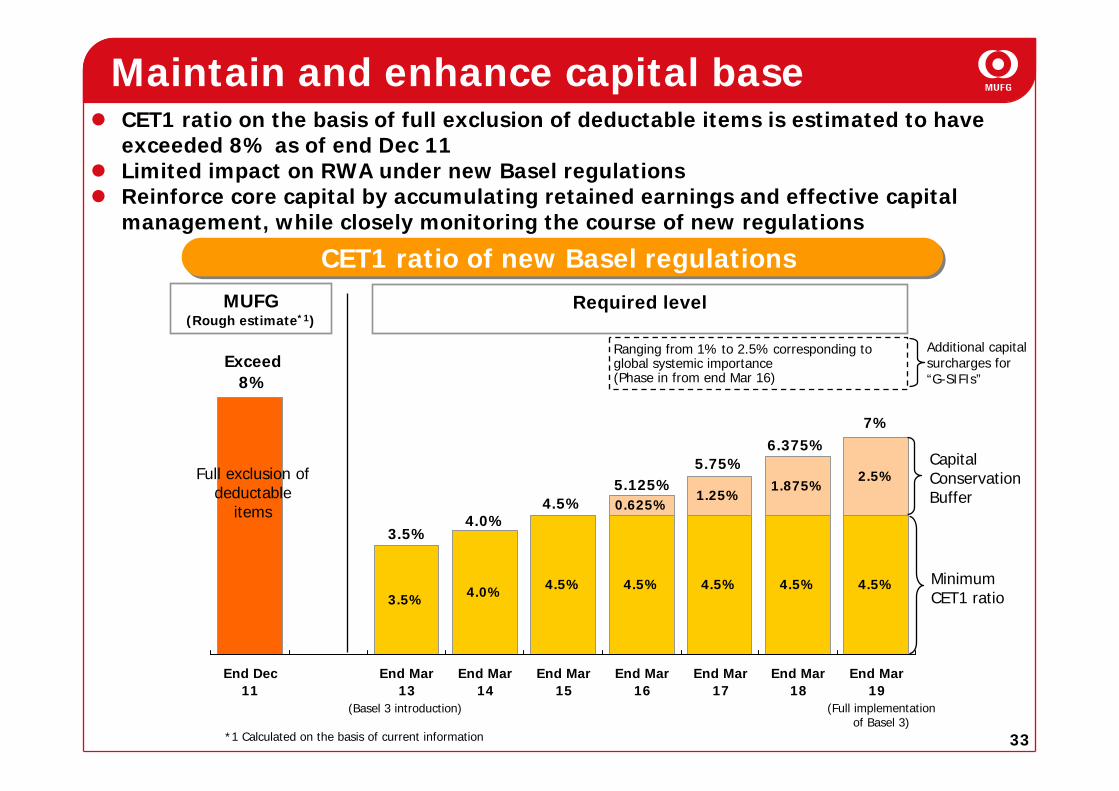
3.5% 4.0% 4.5% 4.5% 4.5% 4.5% 4.5%
0.625%1.25%
1.875%2.5%
Exceed8%
End Dec11
End Mar13
End Mar14
End Mar15
End Mar16
End Mar17
End Mar18
End Mar19
(Basel 3 introduction)
CET1 ratio of new Basel regulations CET1 ratio of new Basel regulations
Full exclusion of deductable
items
MUFG(Rough estimate*1)
(Full implementation of Basel 3)
Required level
MinimumCET1 ratio
Capital Conservation Buffer
*1 Calculated on the basis of current information
3.5%4.0%
4.5%5.125%
5.75%6.375%
7%
Maintain and enhance capital baseCET1 ratio on the basis of full exclusion of deductable items is estimated to have exceeded 8% as of end Dec 11Limited impact on RWA under new Basel regulationsReinforce core capital by accumulating retained earnings and effective capital management, while closely monitoring the course of new regulations
Additional capital surcharges for “G-SIFIs”
Ranging from 1% to 2.5% corresponding to global systemic importance (Phase in from end Mar 16)
34
Strengthen equity capital
Strategic investments
for sustainable growth
Enhance shareholder
returns
MUFG’s Corporate Value
MUFG’s Corporate Value
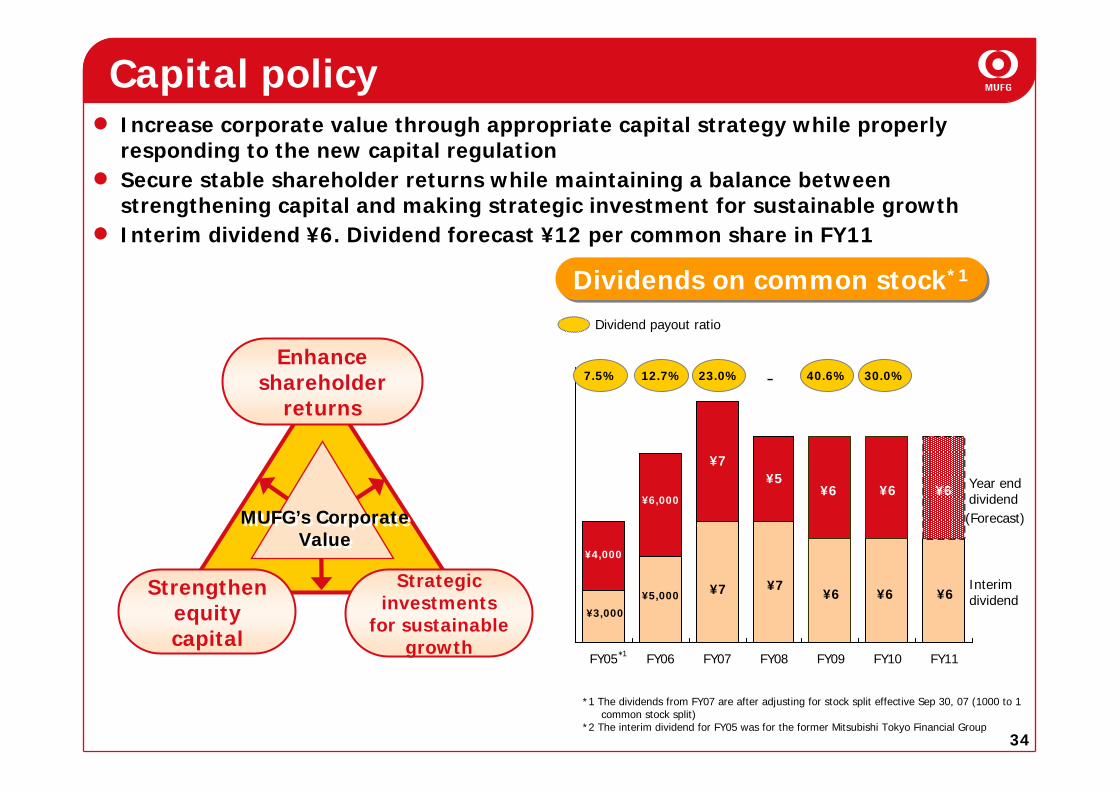
FY05 FY06 FY07 FY08 FY09 FY10 FY11
7.5%
Dividend payout ratio
12.7% 23.0% 40.6% 30.0%-
¥3,000
¥4,000
¥5,000
¥6,000
¥7
¥7 ¥7
¥5
¥6
¥6
Interim dividend
Year end dividend
¥6
¥6
*1
Dividends on common stock*1Dividends on common stock*1
¥6
¥6
Increase corporate value through appropriate capital strategy while properly responding to the new capital regulationSecure stable shareholder returns while maintaining a balance between strengthening capital and making strategic investment for sustainable growthInterim dividend ¥6. Dividend forecast ¥12 per common share in FY11
Capital policy
*1 The dividends from FY07 are after adjusting for stock split effective Sep 30, 07 (1000 to 1 common stock split)
*2 The interim dividend for FY05 was for the former Mitsubishi Tokyo Financial Group
(Forecast)
35
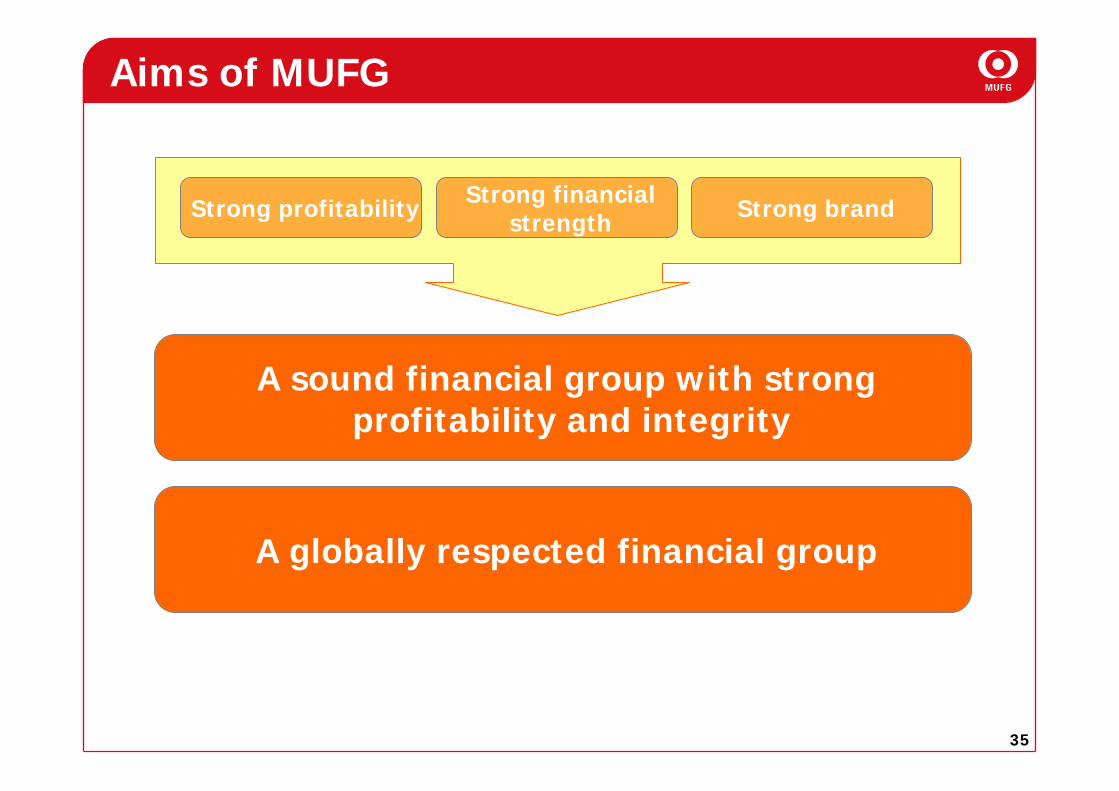
Aims of MUFG
Strong profitability Strong financial strength Strong brand
A sound financial group with strongprofitability and integrity
A globally respected financial group
36
Appendix
37
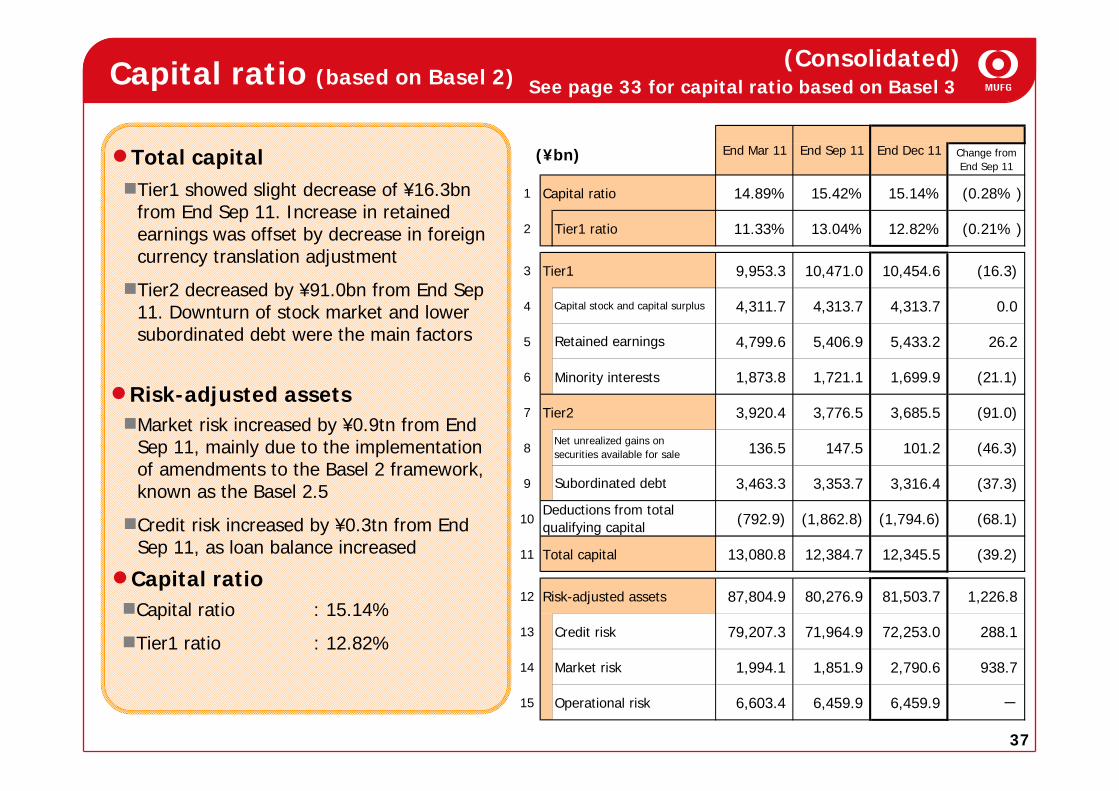
Capital ratio (based on Basel 2) (Consolidated)
Risk-adjusted assetsMarket risk increased by ¥0.9tn from End Sep 11, mainly due to the implementation of amendments to the Basel 2 framework, known as the Basel 2.5
Credit risk increased by ¥0.3tn from End Sep 11, as loan balance increased
Capital ratio
Total capitalTier1 showed slight decrease of ¥16.3bn from End Sep 11. Increase in retained earnings was offset by decrease in foreign currency translation adjustment
Tier2 decreased by ¥91.0bn from End Sep 11. Downturn of stock market and lower subordinated debt were the main factors
(¥bn)
See page 33 for capital ratio based on Basel 3
Capital ratio : 15.14%
Tier1 ratio : 12.82%
Change fromEnd Sep 11
1 Capital ratio 14.89% 15.42% 15.14% (0.28% )
2 Tier1 ratio 11.33% 13.04% 12.82% (0.21% )
3 Tier1 9,953.3 10,471.0 10,454.6 (16.3)
4 4,311.7 4,313.7 4,313.7 0.0
5 4,799.6 5,406.9 5,433.2 26.2
6 Minority interests 1,873.8 1,721.1 1,699.9 (21.1)
7 Tier2 3,920.4 3,776.5 3,685.5 (91.0)
8 136.5 147.5 101.2 (46.3)
9 3,463.3 3,353.7 3,316.4 (37.3)
10 (792.9) (1,862.8) (1,794.6) (68.1)
11 Total capital 13,080.8 12,384.7 12,345.5 (39.2)
12 Risk-adjusted assets 87,804.9 80,276.9 81,503.7 1,226.8
13 Credit risk 79,207.3 71,964.9 72,253.0 288.1
14 Market risk 1,994.1 1,851.9 2,790.6 938.7
15 Operational risk 6,603.4 6,459.9 6,459.9 -
Deductions from totalqualifying capital
End Mar 11 End Sep 11 End Dec 11
Capital stock and capital surplus
Retained earnings
Net unrealized gains onsecurities available for sale
Subordinated debt
Recommended