8/13/2019 Mit Fullreport11 12
http://slidepdf.com/reader/full/mit-fullreport11-12 1/12
O f f i c e
C a r e e r D e v e l o p m e n t
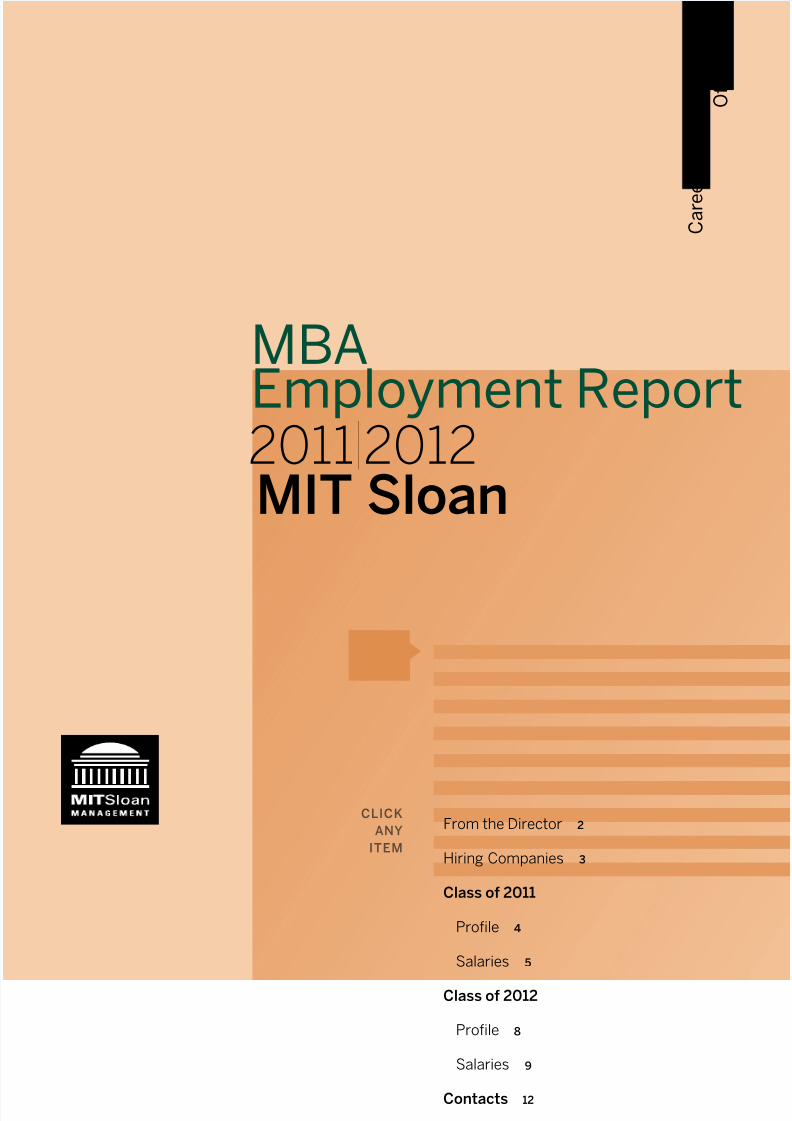
From the Director 2
Hiring Companies 3
Class of 2011
Profile 4
Salaries 5
Class of 2012
Profile 8
Salaries 9
Contacts 12
CLICK
ANY
ITEM
MBA
Employment Report2011|2012
MIT Sloan

8/13/2019 Mit Fullreport11 12
http://slidepdf.com/reader/full/mit-fullreport11-12 2/12
From the Director
With your support our graduates and students secured interesting, diverse,
and rewarding opportunities this past year. We remain grateful to our
recruiting partners, alumni, faculty, and friends, for your ongoing support of
the School, especially during these challenging economic times. We are
extremely pleased that the number and diversity of opportunities available to
our graduates and students remain strong.
We are committed to connecting students with a diversity of opportunities —
resulting in approximately 75% of graduates finding full-time work through
the School. Our personalized approach to meeting the needs of the wide
variety of firms that recruit MIT Sloan students and graduates ensures you
will receive the attention you desire from MIT Sloan. Our goal is to be the
school of choice for MBA hirers, and we are committed to making your
recruiting experience both positive and productive. Whether you are looking
to hire one summer intern or ten full-time employees, hiring an MIT Sloan
MBA for your organization is always a great investment.
Thank you for your support of the MIT Sloan School of Management.
Sincerely,
Sue Kline
Acting Director
Career Development Office
Accuracy in Reporting Employment Statistics
The MIT Sloan School of Management adheres to the MBA Career Services Council (MBA CSC) Standards for Reporting MBA Employment Statistics (mbacsc.org). Conformance to this
business school industry standard ensures accurate and comparable employment data.
Currently, the majority of the leading MBA programs adhere to these accepted reporting standards. MIT Sloan takes a leadership role to promote the importance of accurate and
comparable employment and salary statistics to prospective students and employers.

8/13/2019 Mit Fullreport11 12
http://slidepdf.com/reader/full/mit-fullreport11-12 3/12
360Chestnut
3M*
A.T. Kearney
Accel Partners
Accenture
Acciona Energy
Adobe Systems
Advent InternationalAetnaAIG (American International
Group, Inc.)
Altman Vilandrie & Company
Amazon*
American Airlines
American Express Company
Amgen*Analysis GroupAOL
Apple
Arcadia SolutionsArthur D. Little
Asian Development Bank
athenahealthAudible
B Lab
Bain & CompanyBain Capital
Banco Santander
Bank of America Merrill LynchBank of Tokyo- Mitsubishi UFJ
Barclays CapitalBarclays Capital Asia Ltd.
Baring Private Equity Asia
Bayer
Bechtel Enterprises
Bessemer Venture Partners
Biogen Idec
Black Coral Capital
The Blackstone Group
BNP Paribas
Boeing*
Booz & CompanyBoston Company
Boston Consulting GroupBP
Brattle Group
Bridgewater Associates
Burger King
CA Technologies
Capital One
Carbon Recycling International
Celfin CapitalCenseo Consulting Group
Charles River AssociatesChartis Group
Cisco Systems*Citi
Coach
Cornerstone Research
Corning
Credit SuisseCSMG Global
Cummins
Dalberg — Global DevelopmentAdvisors
Dell*
Deloitte Consulting
Deutsche BankDiageo
Duff & Phelps, LLC
DuPontEaton Vance Investment Managers
eBay
EDF Climate Corps
Education PioneersEli Lilly and Company
EnerNOC
Ermenegildo Zegna
ExxonMobilFacebookFar East Organization
Fidelity International Limited
Fidelity InvestmentsFSG Social Impact Advisors
General ElectricGeneral Motors*
Genzyme*
Goldman Sachs
GoogleGroupon
GSR Ventures
Gucci
Harris Williams
Helion Venture PartnersHSBC
HubSpotIBM
IDEO
IDEXX Laboratories
Infosys Consulting
Infosys Technologies Limited
Infotrieve
Innosight
Innovation Center for U.S. Dairy
InsightSquared
Intel*
International Finance Corporation
ITA Software
Jefferies & Company
Johnson & Johnson
JPMorgan Chase
Kettle Cuisine
Koch Industries
L.E.K. ConsultingLAN Airlines
Lark Technologies
Liberty MutualMacquarie Group
MasterCard Worldwide
McKinsey & Company
MedImmune
Medtronic
Merck & Co.
MicrosoftMillennium Pharmaceuticals
MocoSpace
Monitor Group
Morgan StanleyMovoto, LLC
Mubadala Development Company
National Basketball Association
National Hockey League
Navigant Consulting
NikeNokia*
Oak Investment Partners
OC&C Strategy ConsultantsOCP Group
OmniGuide
PA Consulting Group
Parametric Technology
Parthenon Group
PhilipsPHOTON Consulting
PIMCOPricewaterhouseCoopersPutnam Associates
QGEN
Qiming Venture Partners
Raytheon*
RealNetworks
Rhythmia Medical
Robert W. Baird & Co.
Roland Berger Strategy Consultants
Salesforce.com
Sambreel Holdings LLC
Samsung Global StrategyGroup
Samsung MobileSealed Air
Sears HoldingsSiemens AG
Smith & Nephew
Sovereign Bank/Banco Santander
Synthetic Genomics
T. Rowe Price
Telsey Advisory Group
Tencent Technology
Thomson Reuters
TIAX LLC
Transparent Language
Travelers
TripAdvisor
UBS
Union Pacific Railroad Company
United States Department of Energy
UPS Supply Chain Solutions
Vale
Visa
VMWareWalt Disney Company
Wellington ManagementCompany
Women’s World Banking
The World Bank
XL Hybrids
Zynga
Employers Hiring Members of the Classes of 2011 and 2012
*LGO Partner during 2010–11 academic yearBold red = Employers hiring three or more MIT Sloan MBA students for full-time and/or summer positions

8/13/2019 Mit Fullreport11 12
http://slidepdf.com/reader/full/mit-fullreport11-12 4/12
MIT Sloan MBA2011–2012 Employment Report
Page 4
Top Hirers of Class of 2011
McKinsey & Company 27 graduates
BCG 16
Bain & Company 12
Google 10
Microsoft 7
Deloitte Consulting 6
Amgen 5
Barclays Capital 5
Cisco Systems 5
1. Class profile (as of matriculation) and employment statistics (as of graduation) include
information for MBAs and students in the joint MBA/Leaders for Global Operations program.
2. All information based on data reported by students.3. Full-time employment statistics based on job acceptances. 85.7% of reported acceptances
included usable salary information
MIT Sloan MBA
Class of 20111
Class ProfileNumber of Candidates 390
U.S. Citizens 61%
Non-U.S. Citizens 39%
Women 38%
Median GMAT Score 710
Median Undergraduate GPA (out of 4.0) 3.6
Average Age at Entry to MIT Sloan 28
Average Years of Full-Time
Work Experience Prior to MIT Sloan 5
Class of 2011 Employment Profile2
Number %
Seeking Employment 291 74.6
Not Seeking Employment 81 20.8
Continuing education 9 2.3
Company sponsored or have
been employed as student 36 9.2
Starting own business 32 8.2
Other reason(s) for not seeking 4 1.0
No Information Available 18 4.6
Total Graduates 390 100.0
Full-Time Employment Overview3
Mean Base Salary $115,355
Median Base Salary $119,000
Range of Base Salary $26,250 – 215,000
8/13/2019 Mit Fullreport11 12
http://slidepdf.com/reader/full/mit-fullreport11-12 5/12
MIT Sloan MBA2011–2012 Employment Report
Page 5
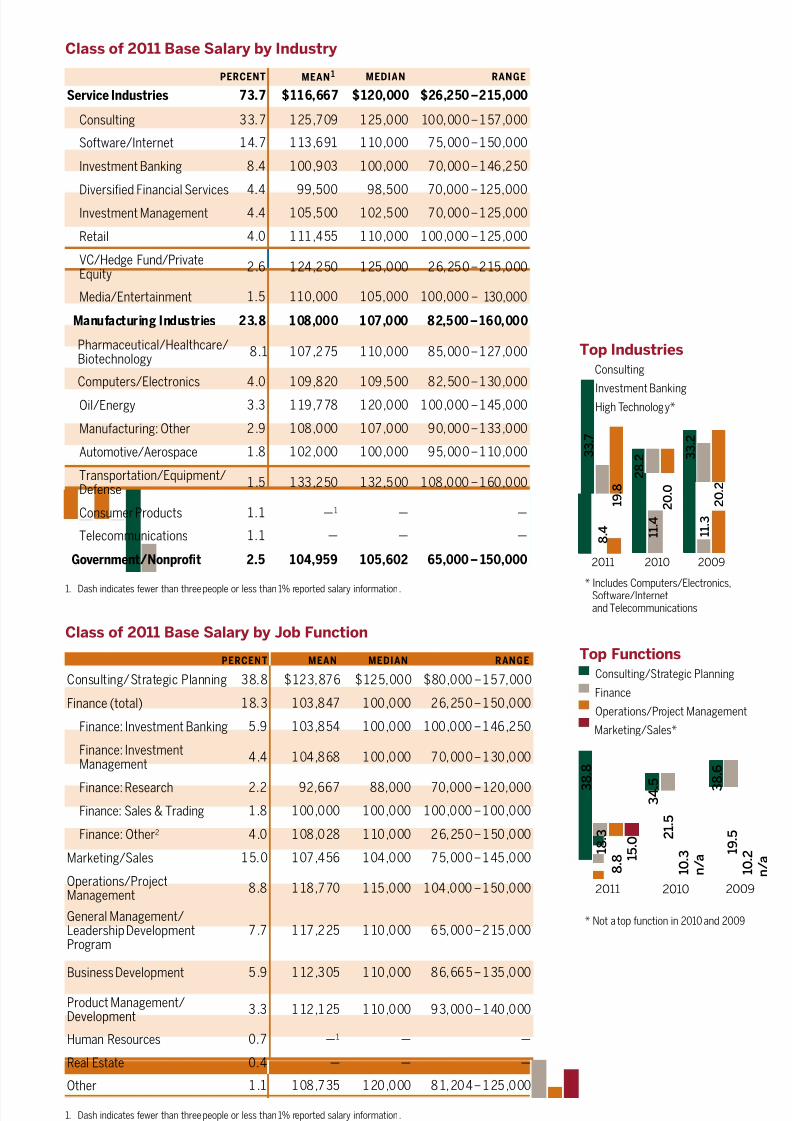
Top Industries
Consulting
Investment Banking High Technology*
* Includes Computers/Electronics,Software/Internetand Telecommunications
200920102011
2 8 . 2
1 1 . 4
2 0 . 0
3 3 . 2
1 1 . 3
2 0 . 2
3 3 . 7
8 . 4
1 9 . 8
Top Functions
Consulting/Strategic Planning
Finance
Operations/Project Management
Marketing/Sales*
* Not a top function in 2010 and 2009
200920102011
3 4 . 5
2 1 . 5
1 0 . 3
n / a
3
8 . 8
1 8 . 3
8 . 8
1 5 . 0
3
8 . 6
1 9 . 5
1 0 . 2
n / a
Class of 2011 Base Salary by Industry
PERCENT MEAN1 MEDIAN RANGE
Service Industries 73.7 $116,667 $120,000 $26,250 –215,000
Consulting 33.7 125,709 125,000 100,000 –157,000
Software/Internet 14.7 113,691 110,000 75,000 –150,000
Investment Banking 8.4 100,903 100,000 70,000 –146,250
Diversified Financial Services 4.4 99,500 98,500 70,000 –125,000Investment Management 4.4 105,500 102,500 70,000 –125,000
Retail 4.0 111,455 110,000 100,000 –125,000
VC/Hedge Fund/PrivateEquity
2.6 124,250 125,000 26,250 –215,000
Media/Entertainment 1.5 110,000 105,000 100,000 – 130,000
Manufacturing Industries 23.8 108,000 107,000 82,500 –160,000
Pharmaceutical/Healthcare/Biotechnology
8.1 107,275 110,000 85,000 –127,000
Computers/Electronics 4.0 109,820 109,500 82,500 –130,000
Oil/Energy 3.3 119,778 120,000 100,000 –145,000
Manufacturing: Other 2.9 108,000 107,000 90,000 –133,000
Automotive/Aerospace 1.8 102,000 100,000 95,000 –110,000
Transportation/Equipment/Defense
1.5 133,250 132,500 108,000 –160,000
Consumer Products 1.1 —1 — —
Telecommunications 1.1 — — —
Government/Nonprofit 2.5 104,959 105,602 65,000 –150,000
1. Dash indicates fewer than three people or less than 1% reported salary information.
Class of 2011 Base Salary by Job Function
PERCENT MEAN MEDIAN RANGE
Consulting/Strategic Planning 38.8 $123,876 $125,000 $80,000 –157,000
Finance (total) 18.3 103,847 100,000 26,250 –150,000
Finance: Investment Banking 5.9 103,854 100,000 100,000 –146,250
Finance: InvestmentManagement
4.4 104,868 100,000 70,000 –130,000
Finance: Research 2.2 92,667 88,000 70,000–120,000
Finance: Sales & Trading 1.8 100,000 100,000 100,000 –100,000
Finance: Other2 4.0 108,028 110,000 26,250 –150,000
Marketing/Sales 15.0 107,456 104,000 75,000 –145,000
Operations/ProjectManagement
8.8 118,770 115,000 104,000 –150,000
General Management/Leadership DevelopmentProgram
7.7 117,225 110,000 65,000 –215,000
Business Development 5.9 112,305 110,000 86,665 –135,000
Product Management/Development
3.3 112,125 110,000 93,000 –140,000
Human Resources 0.7 —1 — —
Real Estate 0.4 — — —
Other 1.1 108,735 120,000 81,204 –125,000
1. Dash indicates fewer than three people or less than 1% reported salary information.
2. Finance: Other includes corporate finance, venture capital and private equity.

8/13/2019 Mit Fullreport11 12
http://slidepdf.com/reader/full/mit-fullreport11-12 6/12
MIT Sloan MBA2011–2012 Employment Report
Page 6
Class of 2011 Base Salary by Geographic Location
PERCENT MEAN MEDIAN RANGE
North America 82.4 $115,819 $120,000 $65,000 – 160,000
Northeast1 45.4 114,668 120,000 65,000 –150,000
Metro Boston 22.7 119,880 125,000 70,000 –150,000
Metro NY 16.1 107,865 100,000 65,000 –150,000
West 14.7 113,894 110,000 93,000 –150,000
Midwest 6.2 119,313 122,500 103,000 –135,000
Southwest 5.5 120,933 125,000 95,000 –135,000
South 4.8 120,727 120,000 100,000 –160,000
Mid-Atlantic 4.0 112,920 115,000 81,204 –135,000
U.S. Possessions and
Territories0.7 —2 — —
Canada 0.7 — — —
Mexico 0.4 — — —
Rest of World 17.6 112,717 111,000 26,250 –215,000Asia 9.9 105,439 105,000 70,000 –146,250
Europe including UK 4.4 121,762 120,000 90,000 –157,000
United Kingdom 0.7 — — —
Latin America and the
Caribbean2.9 116,375 116,500 26,250 – 215,000
Africa 0.4 — — —
1. Northeast includes states/cities beyond Metro Boston and Metro NYC.
2. Dash indicates fewer than three people or less than 1% reported salary information.
Class of 2011 Base Salary by Undergraduate Major
MAJOR PERCENT MEAN MEDIAN RANGE
Business 18.4 115,857 $120,000 $88,000–150,000
Social Science & Humanities 27.6 109,154 112,000 26,250–154,000
Engineering 44.6 118,181 120,000 70,000–215,000
Sciences & Mathematics 9.4 111,333 115,000 70,000–135,000
Class of 2011 Base Salary by Professional ExperienceY EA RS O F E XP ER IE NC E P ER CE NT M EA N M ED IA N R AN GE
One year or less 0.4 —1 — —
More than one year, up to 3 years 15.0 $116,044 $120,000 $65,000 –157,000
More than 3 years, up to 5 years 40.3 115,489 111,000 70,000 –215,000
More than 5 years 44.3 114,914 118,000 26,250 –154,000
1. Dash indicates fewer than three people or less than 1% reported salary information.

8/13/2019 Mit Fullreport11 12
http://slidepdf.com/reader/full/mit-fullreport11-12 7/12
MIT Sloan MBA2011–2012 Employment Report
Page 7
Signing Bonus Received by Job Function 1
PERCENT REPORTING MEAN MEDIAN RANGE
Consulting 72.6 $22,304 $20,000 $8,000 – 50,000
General Management 71.4 $24,200 $20,000 $10,000 – 43,000
Operations/Project Management 70.8 $22,529 $20,000 $9,000 – 60,000
Finance: Investment Management 66.7 $35,250 $40,000 $10,000 – 55,000
Other 66.7 $15,000 $15,000 $15,000 – 15,000
Finance: Other2
62.5 $17,800 $15,000 $4,000 – 30,000Marketing/Sales 58.5 $14,438 $10,500 $5,000 – 35,000
Finance: Investment Banking 56.3 $43,333 $40,000 $40,000 – 50,000
Business Development 50.0 $23,250 $27,500 $5,000 – 33,000
Human Resources 50.0 —3 — —
Product Management/Development 44.4 $27,500 $25,000 $10,000 – 50,000
Finance: Sales & Trading 40.0 $45,000 $45,000 $40,000 – 50,000
Finance: Analyst / Research 25.0 $25,000 $25,000 $25,000 – 25,000
1. 73.9% of the students reporting usable salary data reported receiving a signing bonus. Percentage represents the
number of students who received a signing bonus in the function.
2. Finance: Other includes corporate finance.
3. Dash indicates fewer than three people or less than 1% reported bonus information.
Other Guaranteed Compensation
P ERCE NT R EPO RTIN G M EAN ME DI AN RAN GE
28.3 $26,650 $20,000 $2,500–250,000
Class of 2011 Timing of Job Offers (percent of students)
At Graduation 88.7% Three Months after Graduation 95.9%
Class of 2011 Timing of Job Acceptances (percent of students)
At Graduation 80.8% Three Months after Graduation 93.5%
Class of 2011 Reason for Accepting Position
Growth Potential 27.8%
Job Function 19.4%
Job Content 19.0%
Industry 11.4%
People/Corporate Culture 8.4%
Location 6.6%
Prestige of Firm 2.9%
Compensation 1.8% Commitment to Sustainability 1.5%
Other 1.1%
Class of 2011 Source of Job
School-Facilitated Activities 77.3%
Scheduled Interviews On or Off Campus 32.2%
Summer Internship 26.7%
MIT/MIT Sloan Job Posting 4.8%
MIT/MIT Sloan Sponsored Event 3.7%
Alumni 3.3%
Faculty/CDO/Student Referral 3.3%
Resume Database, Resume Referral 1.8%
Club Event 1.5%
Student-Facilitated Activities 20.9%
Personal Network 10.3%
Contacted Directly 6.6%
Previous Employer 2.6%
Newspaper, Magazine, Job Board 1.5%
Other 1.8

8/13/2019 Mit Fullreport11 12
http://slidepdf.com/reader/full/mit-fullreport11-12 8/12
MIT Sloan MBA2011–2012 Employment Report
Page 8
1. Class profile includes information for MBA students and students in the joint MBA/Leaders for
Global Operations program.
2. All information based on data reported by students.3. Summer employment statistics based on job acceptances.
76.0% of reported acceptances included usable salary information.
MIT Sloan MBA
Class of 20121
Class ProfileNumber of Candidates 410
U.S. Citizens 65%
Non-U.S. Citizens 35%
Women 35%
Median GMAT Score 717
Median Undergraduate GPA (out of 4.0) 3.5
Average Age at Entry to MIT Sloan 28
Average Years of Full-Time
Work Experience Prior to MIT Sloan 5
Summer Employment Profile2
Number %
Seeking Employment 313 76.3
Not Seeking Employment 67 16.4
Leaders for Global Operations 48 11.7
Company sponsored or have
been employed as student 8 2.0
Starting own business 8 2.0
Other reason(s) for not seeking 3 0.7
No Information Available 30 7.3
Total Graduates 410 100.0
Summer Employment Overview3
Mean Monthly Base Salary $7,255
Median Monthly Base Salary $8,000
Range of Monthly Base Salary $1,000–$12,000
Top Intern Hirers
McKinsey & Company 15 interns
Bain & Company 12
BCG 12
Google 12
Goldman Sachs 10Credit Suisse 7
Amazon.com 6
Apple 6
Citi 6

8/13/2019 Mit Fullreport11 12
http://slidepdf.com/reader/full/mit-fullreport11-12 9/12
MIT Sloan MBA2011–2012 Employment Report
Page 9
Top Industries
Consulting
Investment Banking
High Technology*
* Includes Computers/Electronics,
Software/Internet and Telecommunications
200920102011
1 7 . 2
8 . 4
1 8 . 9
8
2 1 . 5
1 7 . 1
1 6 . 8
1 8 . 9
1 0 . 7
1 4 . 5
1 1 . 0
Top Functions
Finance
Consulting/Strategic Planning
Marketing/Sales
200920102011
2 2 . 0
2 9 . 6
1 4 . 2
2 5 . 9
2 8 . 0
1 2 . 7
3 2 . 7
2 9 . 9
1 4 . 4
Class of 2012 Monthly Salary by Industry
PERCENT MEAN1 MEDIAN RANGE
Service Industries 77.9 $7,690 $8,300 $1,000 –12,000
Consulting 21.5 9,633 10,400 2,500 –12,000
Investment Banking /Brokerage
17.1 7,981 8,333 1,950 –11,000
Software/Internet 13.7 6,565 7,000 1,000 –11,000
Retail 6.9 7,208 8,000 2,000 – 9,834
Investment Management 5.0 8,591 8,000 8,000 –11,153
Diversified Financial Services 3.1 5,858 6,500 2,100 – 8,333
VC/Hedge Fund/PrivateEquity
6.6 4,347 3,000 1,000 –10,000
Media/Entertainment 2.8 3,895 3,450 2,000 – 6,400
Real Estate 1.2 6,000 6,000 6,000 – 6,000
Manufacturing Industries 16.8 6,201 6,900 1,000 – 9,200
Pharmaceutical/Healthcare/
Biotechnology 5.0 6,334 6,900 1,665 – 8,000
Manufacturing: Other 3.1 6,841 7,200 5,140 – 8,000
Oil/Energy 2.8 4,550 3,100 1,000 – 9,200
Computers/Electronics 2.8 7,362 7,097 6,400 – 8,800
Consumer Products 1.6 5,700 5,500 4,800 – 7,000
Transportation/Equipment/Defense
0.9 —1 — —
Automotive/Aerospace 0.3 — — —
Telecommunications 0.3 — — —
Government/Nonprofit 4.6 3,809 3,583 2,800 – 5,200
Other 0.7 — — —
1. Dash indicates fewer than three people or less than 1% reported salary information.
Class of 2012 Monthly Salary by Job Function
PERCENT MEAN MEDIAN RANGE
Finance (total) 32.7 $7,290 $8,300 $1,000 –11,153
Finance: Investment Banking 13.1 8,160 8,333 1,950– 11,000
Finance: InvestmentManagement 5.9 6,626 8,000 2,000 – 9,500
Finance: Research 4.7 5,850 5,000 1,000 –11,153
Finance: Sales & Trading 1.6 8,833 8,667 8,000 –10,000
Finance: Other1 7.4 5,537 6,000 1,000 –10,000
Consulting/Strategic Planning 29.9 8,666 10,000 2,000– 12,000
Marketing/Sales 14.4 5,962 6,666 1,000 –11,000
Business Development 7.5 6,064 6,800 1,500 –10,000
General Management/Leadership Development
Program
5.6 5,576 6,400 1,665 – 9,833
Operations/ProjectManagement
4.7 6,625 7,250 2,500 – 8,000
Product Management/Development
3.4 7,212 7,900 3,400 – 10,000
Information Technology 0.3 —2 — —
Real Estate 0.3 — — —
Other 1.2 — — —
1. Finance: Other includes corporate finance, venture capital and private equity.
2. Dash indicates fewer than three people or less than 1% reported salary information.

8/13/2019 Mit Fullreport11 12
http://slidepdf.com/reader/full/mit-fullreport11-12 10/12
MIT Sloan MBA2011–2012 Employment Report
Page 10
Class of 2012 Monthly Salary by Geographic Location
PERCENT MEAN MEDIAN RANGE
North America 75.7 $7,900 $7,850 $1,500 –11,267
Northeast1 44.6 7,058 7,750 1,950 –11,267
Metro Boston 22.6 7,195 7,500 2,000 –11,267
Metro NY 16.7 6,920 8,000 1,950 –10,800
West 17.6 7,434 7,600 1,500 –11,000
Midwest 4.6 7,206 7,300 3,000 – 9,834
Mid-Atlantic 4.0 7,198 8,000 3,200 –10,500
Southwest 2.5 9,129 9,200 7,800 –10,500
South 0.6 —2 — —
Canada 0.3 — — —
Mexico 1.5 7,660 10,500 2,800 –11,000
Rest of the World 24.3 7,305 8,600 1,000 12,000
Asia 12.9 7,120 8,657 1,000 –11,000
Europe including UK 4.4 7,573 9,000 1,000 – 12,000
United Kingdom 0.9 — — —
Latin America & the
Caribbean4.1 9,756 10,500 8,000 –11,000
Middle East 1.3 — — —
Africa 1.2 — — —
Oceania 0.4 — — —
1. Northeast includes states/cities beyond Metro Boston and Metro NYC.
2. Dash indicates fewer than three people or less than 1% reported salary information.
Class of 2012 Monthly Salary by Undergraduate Major
MAJOR PERCENT MEAN MEDIAN RANGE
Engineering 35.4 7,735 8,000 1,000 – 12,000
Social Science & Humanities 31.5 6,976 7,500 1,000 – 11,000
Business 23.4 6,933 $7,000 1,000 – 11,153
Sciences & Mathematics 9.7 7,322 7,750 2,000 – 11,250
Class of 2012 Monthly Salary by Professional Experience
YEARS EXPERIENCE PERCENT MEAN MEDIAN RANGE
One year or less 1.3 $4,000 $4,000 $1,000 – 7,000
More than one year, up to 3 years 8.6 7,595 8,000 2,000 – 11,267
More than 3 years, up to 5 years 47.6 7,034 8,000 1,000 – 12,000
More than 5 years 42.5 7,528 8,000 1,000 – 11,153
8/13/2019 Mit Fullreport11 12
http://slidepdf.com/reader/full/mit-fullreport11-12 11/12
MIT Sloan MBA2011–2012 Employment Report
Page 11
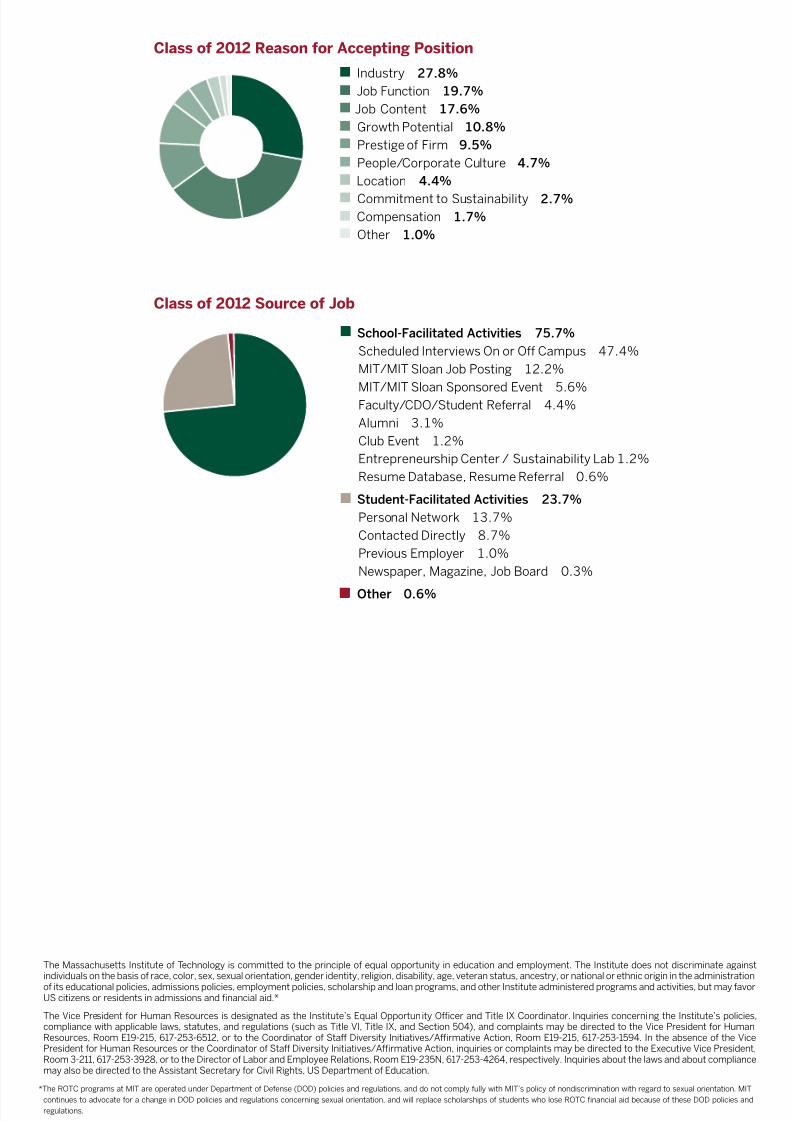
Class of 2012 Reason for Accepting Position
Industry 27.8%
Job Function 19.7%
Job Content 17.6%
Growth Potential 10.8%
Prestige of Firm 9.5%
People/Corporate Culture 4.7%
Location 4.4%
Commitment to Sustainability 2.7% Compensation 1.7%
Other 1.0%
Class of 2012 Source of Job
School-Facilitated Activities 75.7%
Scheduled Interviews On or Off Campus 47.4%
MIT/MIT Sloan Job Posting 12.2%
MIT/MIT Sloan Sponsored Event 5.6%Faculty/CDO/Student Referral 4.4%
Alumni 3.1%
Club Event 1.2%
Entrepreneurship Center / Sustainability Lab 1.2%
Resume Database, Resume Referral 0.6%
Student-Facilitated Activities 23.7%
Personal Network 13.7%
Contacted Directly 8.7%
Previous Employer 1.0%
Newspaper, Magazine, Job Board 0.3%
Other 0.6%
The Massachusetts Institute of Technology is committed to the principle of equal opportunity in education and employment. The Institute does not discriminate againstindividuals on the basis of race, color, sex, sexual orientation, gender identity, religion, disability, age, veteran status, ancestry, or national or ethnic origin in the administrationof its educational policies, admissions policies, employment policies, scholarship and loan programs, and other Institute administered programs and activities, but may favorUS citizens or residents in admissions and financial aid.*
The Vice President for Human Resources is designated as the Institute’s Equal Opportunity Officer and Title IX Coordinator. Inquiries concerning the Institute’s policies,compliance with applicable laws, statutes, and regulations (such as Title VI, Title IX, and Section 504), and complaints may be directed to the Vice President for HumanResources, Room E19-215, 617-253-6512, or to the Coordinator of Staff Diversity Initiatives/Affirmative Action, Room E19-215, 617-253-1594. In the absence of the VicePresident for Human Resources or the Coordinator of Staff Diversity Initiatives/Affirmative Action, inquiries or complaints may be directed to the Executive Vice President,Room 3-211, 617-253-3928, or to the Director of Labor and Employee Relations, Room E19-235N, 617-253-4264, respectively. Inquiries about the laws and about compliancemay also be directed to the Assistant Secretary for Civil Rights, US Department of Education.
*The ROTC programs at MIT are operated under Department of Defense (DOD) policies and regulations, and do not comply fully with MIT’s policy of nondiscrimination with regard to sexual orientation. MIT
continues to advocate for a change in DOD policies and regulations concerning sexual orientation, and will replace scholarships of students who lose ROTC financial aid because of these DOD policies and
regulations.

8/13/2019 Mit Fullreport11 12
http://slidepdf.com/reader/full/mit-fullreport11-12 12/12
1-617-253-6149
http://mitsloan.mit.edu/cdo
Tang Center for Management Education
70 Memorial Drive, E51-203Cambridge, MA 02142-1347
Fax: 1-617-253-0226
Administration
Sue Kline
Acting Director
1-617-253-3946
Employer Relations
Tiffany Hogan
Associate Director
1-617-253-0529
Susan Kenney
Assistant Director
1-617-258-6493
Works with consulting,
consumer products,
nonprofit, retail, real estate,
transportation/defense,
automotive/aerospace,
and entertainment/media
organizations
Kerri Tierney
Assistant Director
1-617-253-8944
Works with banks/
diversified financial firms,
high technology and
biotechnology, pharma/
healthcare, oil/energy,
and telecommunicationsorganizations
Danielle Grassia
Recruiting Coordinator
1-617-324-1017
Manages job postings and
recruiting event logistics
Career Education
Workshops
Sue Kline
Director
1-617-253-3946
Masters’ Programs
Jackie Wilbur
Executive Director
1-617-258-6492
Corporate Relations
Dave Weber
Director
1-617-253-7161
Leaders for
Global Operations
Don Rosenfield
Director
1-617-253-1064
MIT Sloan School of Management Career Development Office
Contact Information
Recommended


![Research | MIT CSAIL · 2004. 11. 12. · e$ >$ #] \ »[[: ` ` ~ < %$ %$](https://img.pdfslide.us/doc/110x75/613010501ecc51586943daad/research-mit-csail-2004-11-12-e-.jpg)