Mine Restoration Using Municipal BioSolids
Mine Restoration Using Municipal BioSolids
Vegetation – “Hello” !
Mine Restoration Using Municipal BioSolids
Vegetation – “Hello” !Or
Vegetation - Hell ?????
Mine Restoration Using Municipal BioSolids
Finding a way out?Or
Getting in deep doo-doo?
Vegetative Community Analysisof Biosolids Test Plots
After Five to Ten Years of Growth
Rick Black (ENVIRON International)Richard K. Borden (Rio Tinto)
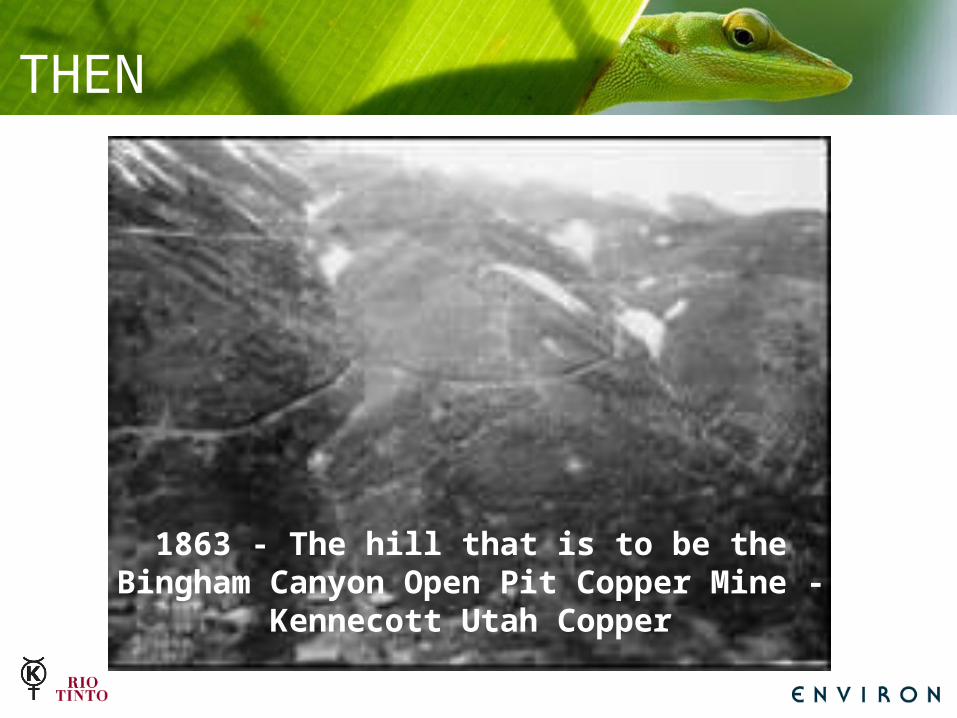
1863 - The hill that is to be the Bingham Canyon Open Pit Copper Mine -
Kennecott Utah Copper
THEN

2012
The Bingham Canyon Open Pit Copper Mine
Kennecott Utah Copper
NOW
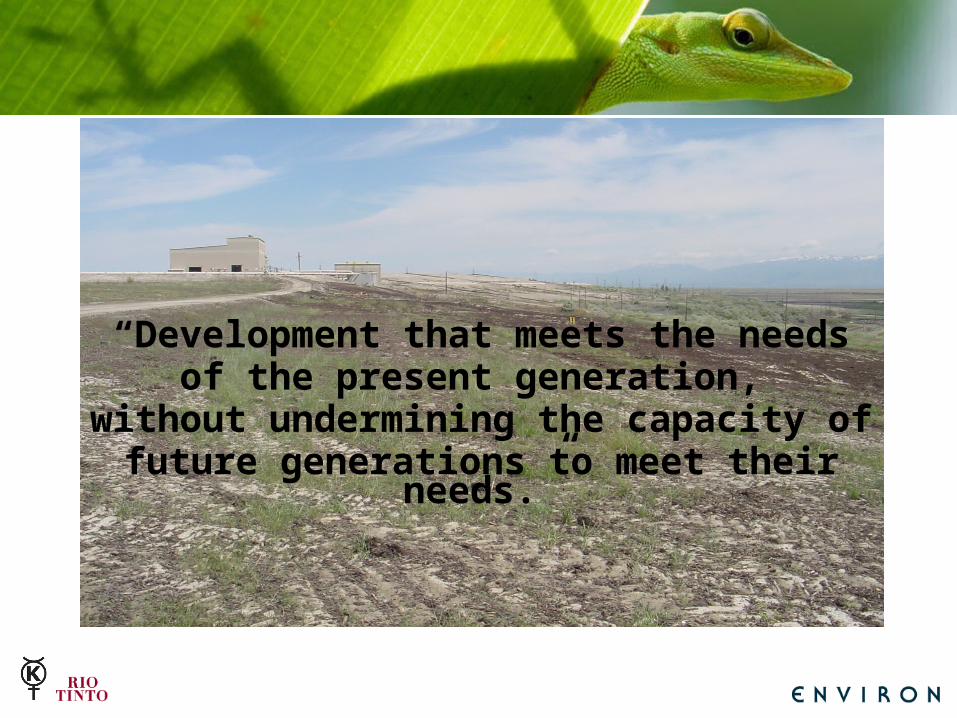
“Development that meets the needsof the present generation,
without undermining the capacity offuture generations to meet their
needs.”
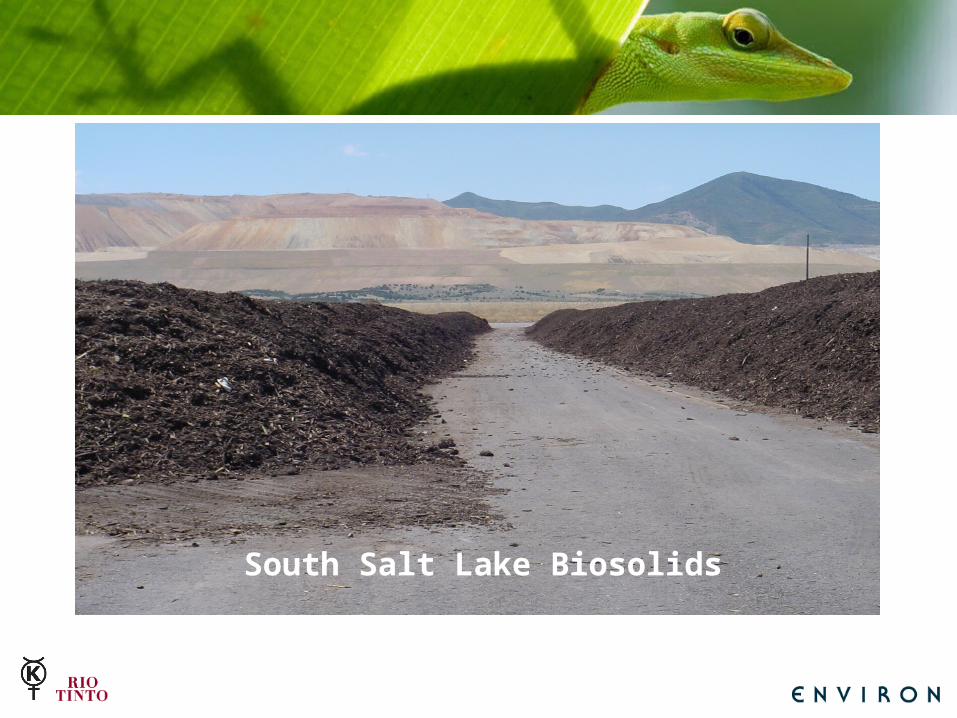
South Salt Lake Biosolids
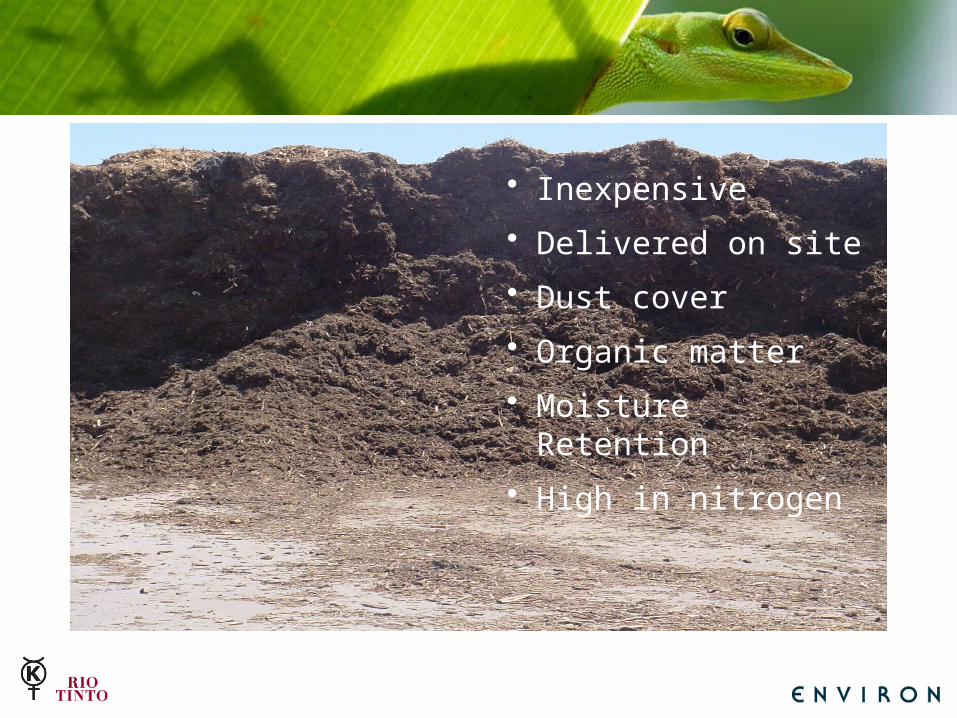
• Inexpensive
• Delivered on site
• Dust cover
• Organic matter
• Moisture Retention
• High in nitrogen
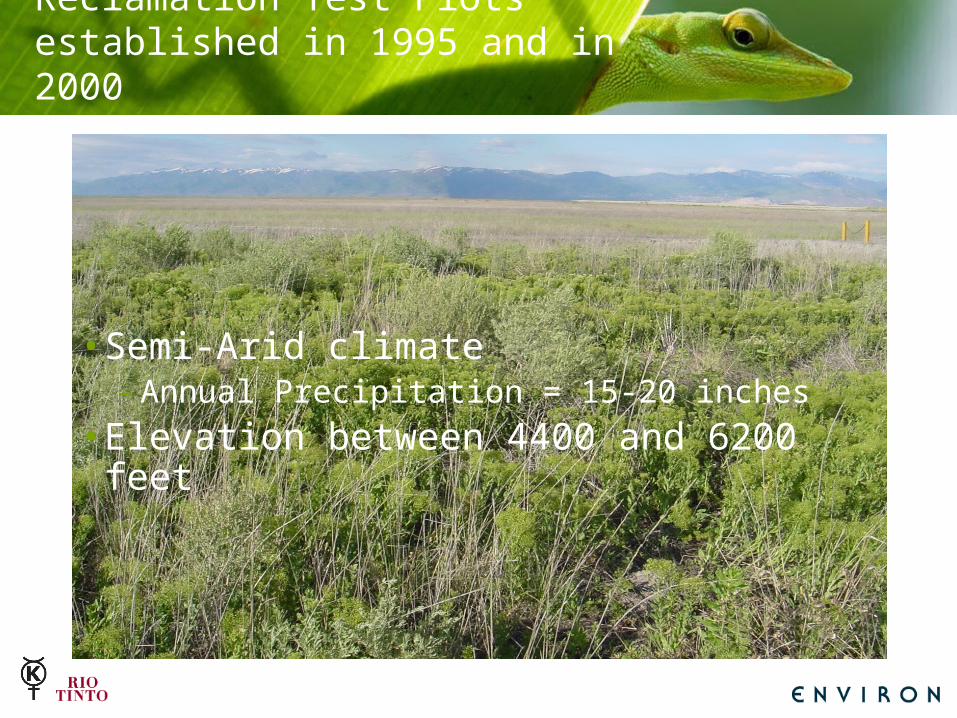
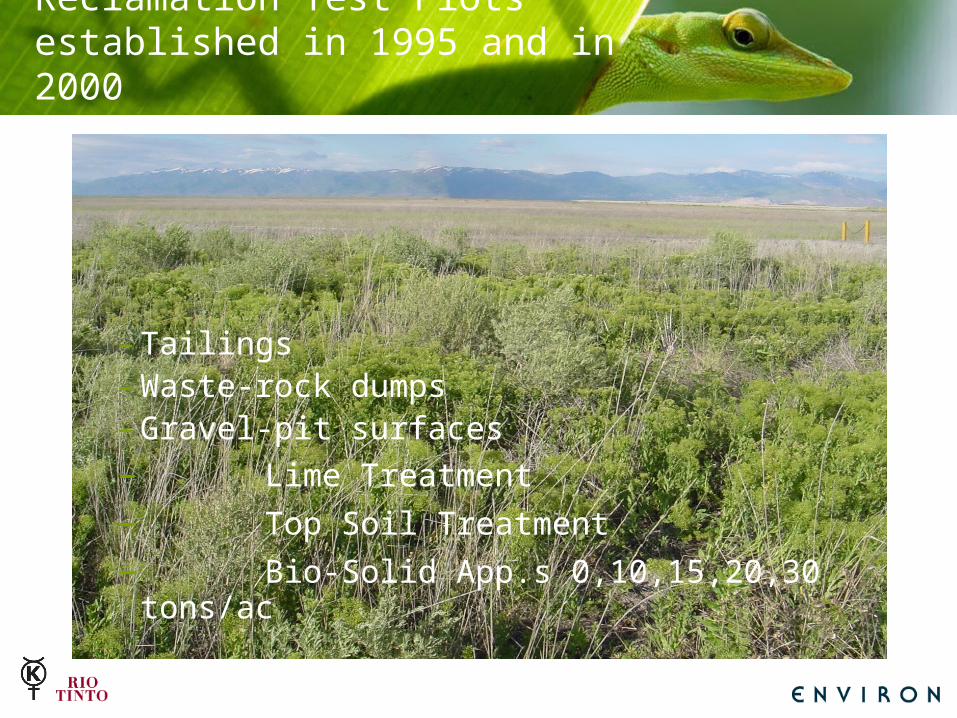
Reclamation Test Plots established in 1995 and in 2000
• Semi-Arid climate– Annual Precipitation = 15-20 inches
• Elevation between 4400 and 6200 feet
Reclamation Test Plots established in 1995 and in 2000
– Tailings– Waste-rock dumps– Gravel-pit surfaces– Lime Treatment
– Top Soil Treatment
– Bio-Solid App.s 0,10,15,20,30 tons/ac
Methodology
Test Plot Selection– Detailed documentation available on establishment date and
treatment received
– Plots were older than 5 years (7-10 in some cases)
– Plots had not been disturbed since establishment
– Location and borders of plots identifiable in the field
Methodology
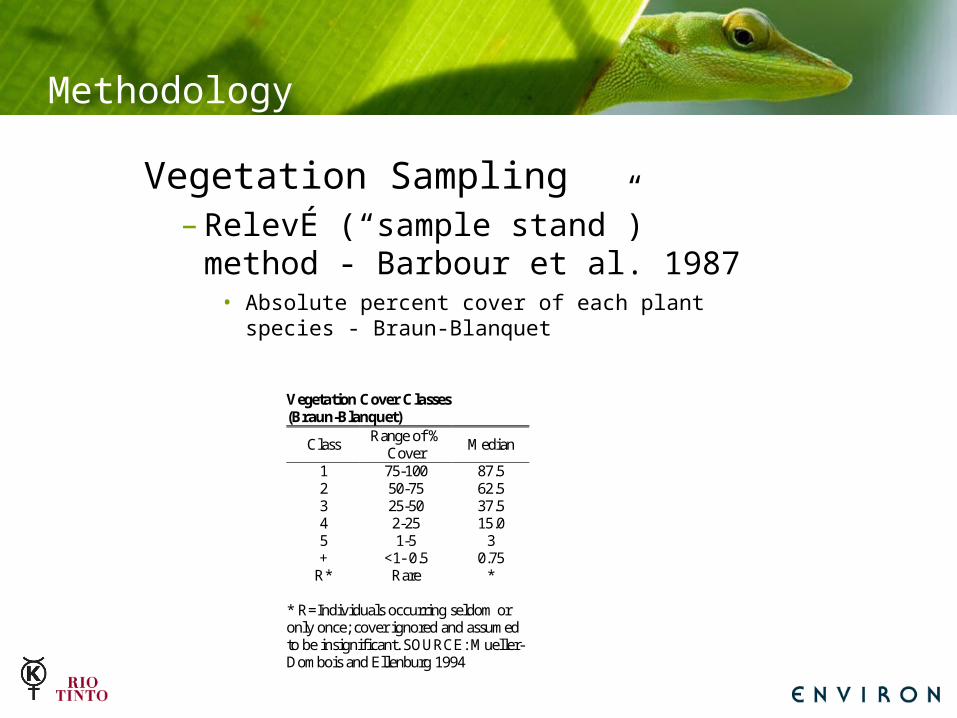
Vegetation Sampling– RelevÉ (“sample stand”) method
- Barbour et al. 1987• Absolute percent cover of each plant species -
Braun-Blanquet
Vegetation Cover Classes (Braun-Blanquet)
Class Range of %
Cover Median
1 75-100 87.5 2 50-75 62.5 3 25-50 37.5 4 2-25 15.0 5 1-5 3 + <1- 0.5 0.75
R* Rare * * R=Individuals occurring seldom or only once; cover ignored and assumed to be insignificant. SOURCE: Mueller-Dombois and Ellenburg 1994
Methodology
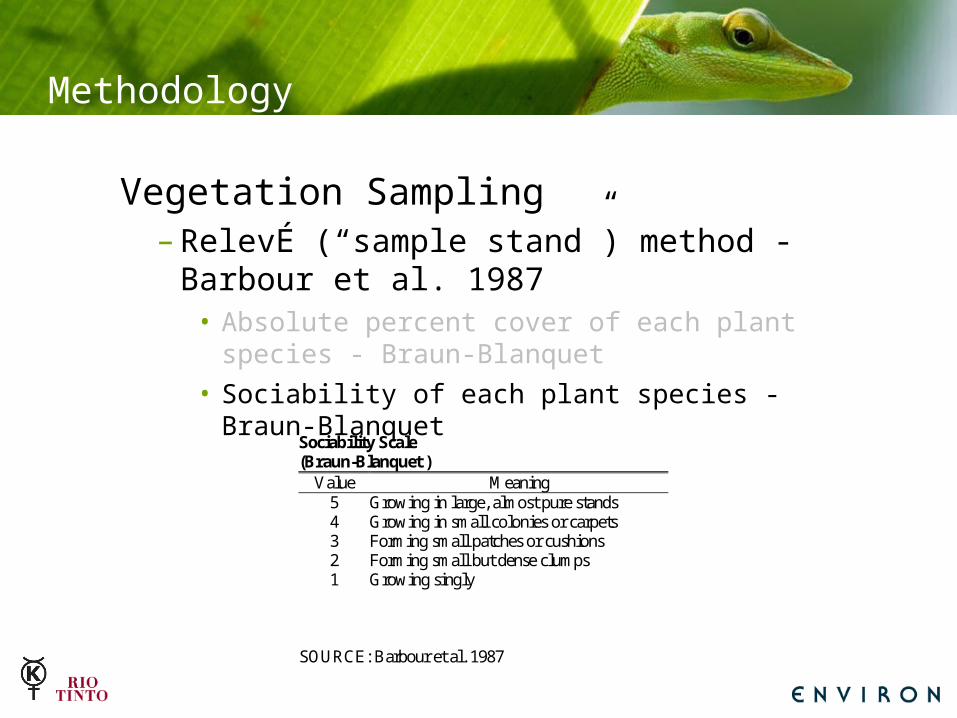
Vegetation Sampling– RelevÉ (“sample stand”) method - Barbour
et al. 1987• Absolute percent cover of each plant species -
Braun-Blanquet• Sociability of each plant species - Braun-
BlanquetSociability Scale (Braun-Blanquet )
Value Meaning 5 Growing in large, almost pure stands 4 Growing in small colonies or carpets 3 Forming small patches or cushions 2 Forming small but dense clumps 1 Growing singly
SOURCE: Barbour et al. 1987
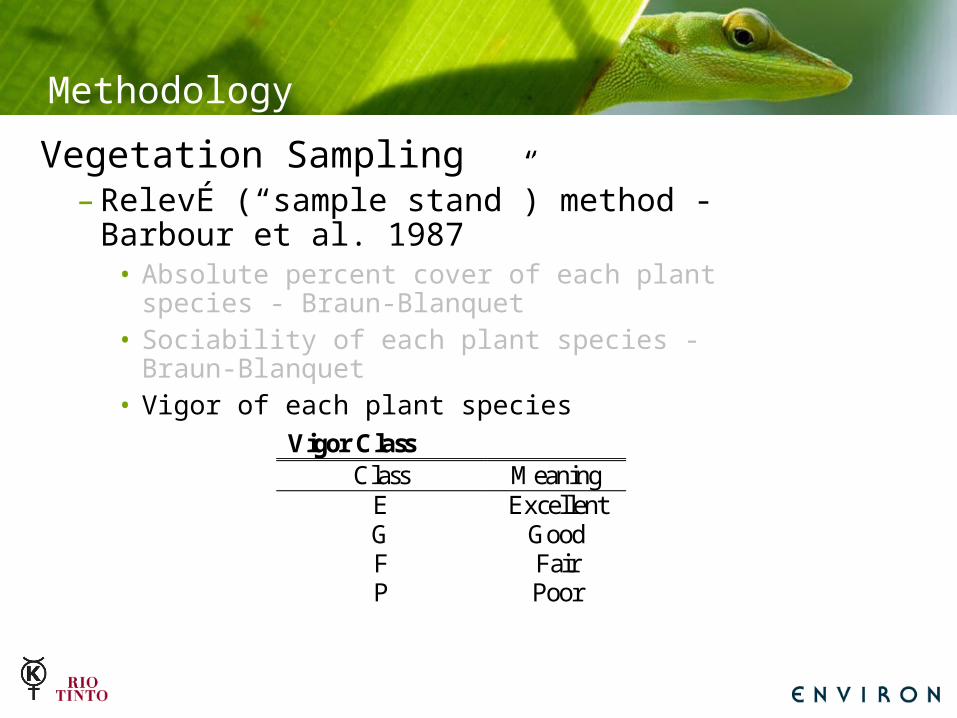
Vigor Class Class Meaning
E Excellent G Good F Fair P Poor
Vegetation Sampling– RelevÉ (“sample stand”) method - Barbour
et al. 1987• Absolute percent cover of each plant species -
Braun-Blanquet• Sociability of each plant species - Braun-
Blanquet• Vigor of each plant species
Methodology
Methodology
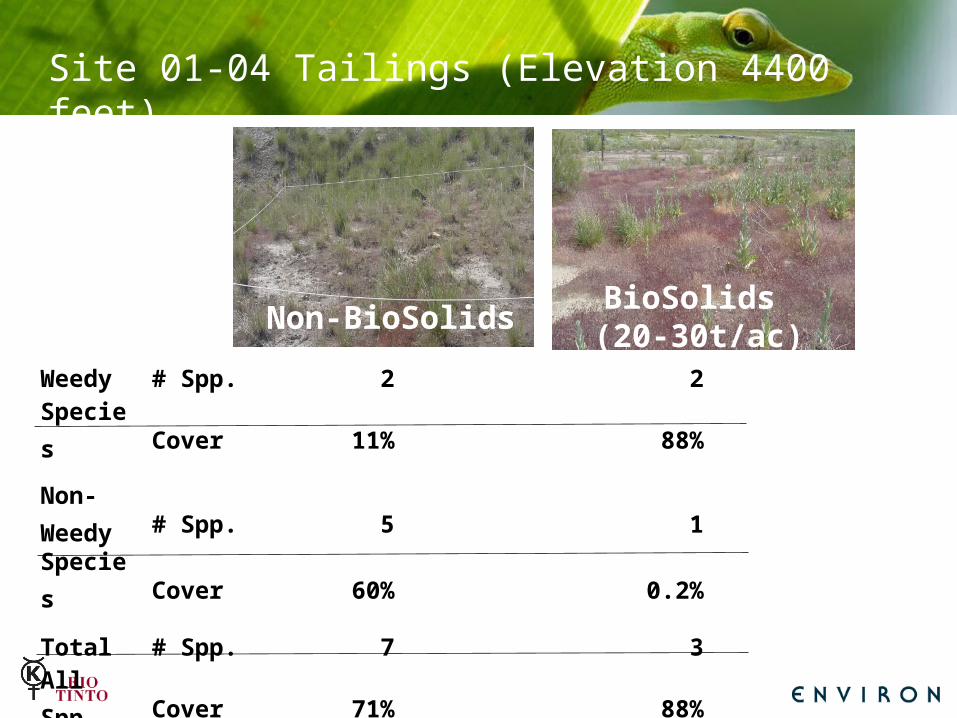
Non-BioSolidsBioSolids (20-30t/ac)
Weedy # Spp. 2 2Species Cover 11% 88%
Non-Weedy # Spp. 5 1Species Cover 60% 0.2%
Total # Spp. 7 3All Spp. Cover 71% 88%
Site 01-04 Tailings (Elevation 4400 feet)
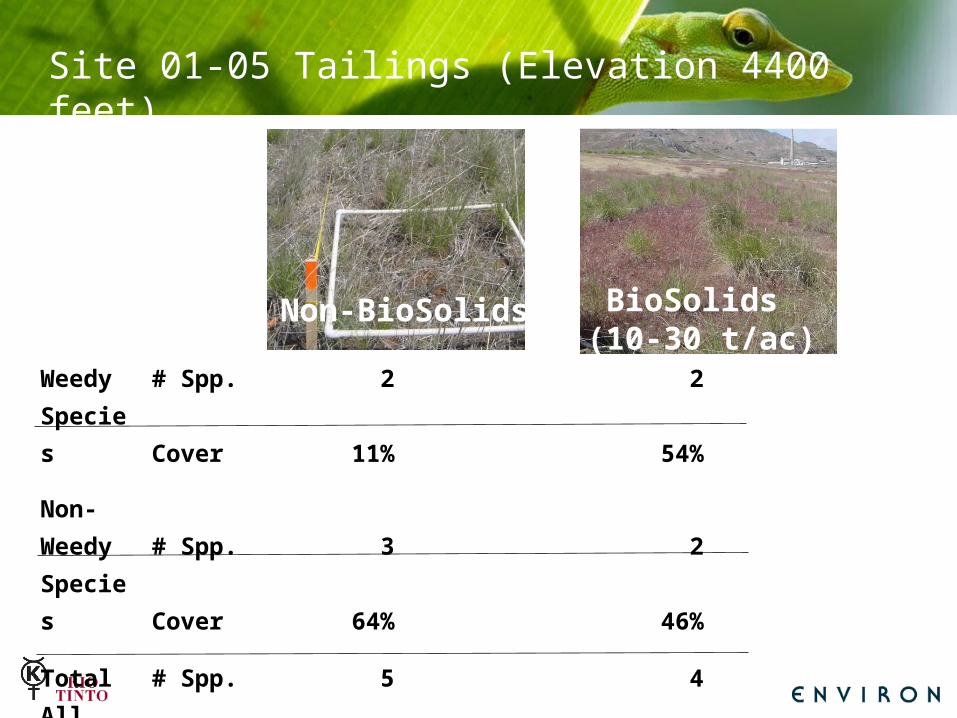
Weedy # Spp. 2 2Species Cover 11% 54%
Non-Weedy # Spp. 3 2Species Cover 64% 46%
Total # Spp. 5 4All Spp. Cover 75% 100%
Non-BioSolids BioSolids (10-30 t/ac)
Site 01-05 Tailings (Elevation 4400 feet)
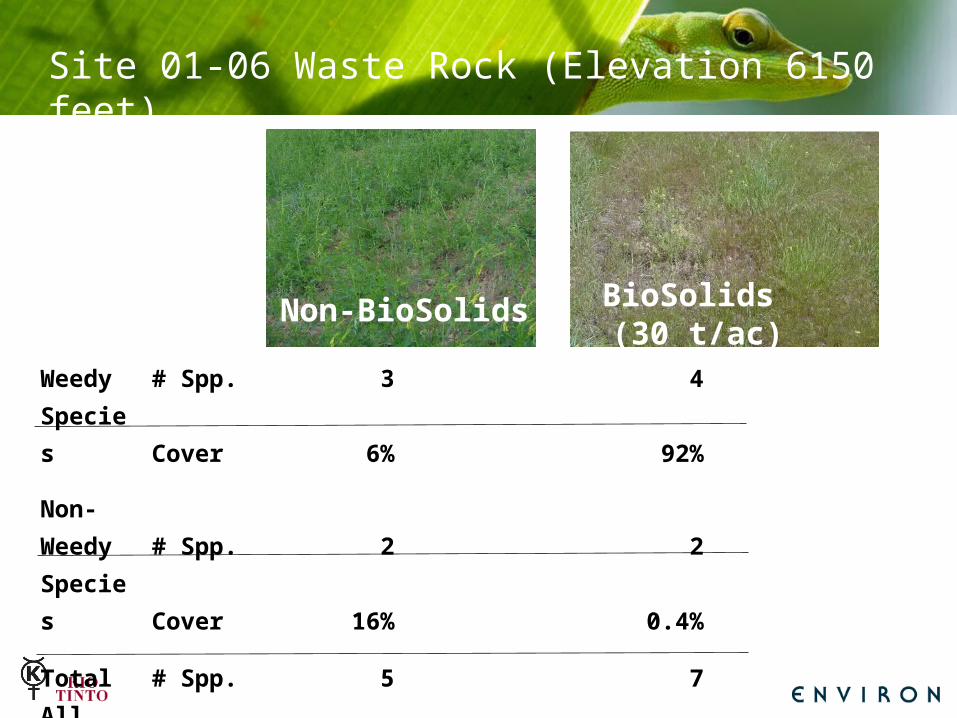
Weedy # Spp. 3 4Species Cover 6% 92%
Non-Weedy # Spp. 2 2Species Cover 16% 0.4%
Total # Spp. 5 7All Spp. Cover 22% 93%
Non-BioSolids BioSolids (30 t/ac)
Site 01-06 Waste Rock (Elevation 6150 feet)
Weedy # Spp. 7 6Species Cover 17% 101%
Non-Weedy # Spp. 14 7Species Cover 62% 7%
Total # Spp. 21 14All Spp. Cover 79% 108%
Non-BioSolids BioSolids (30 t/ac)
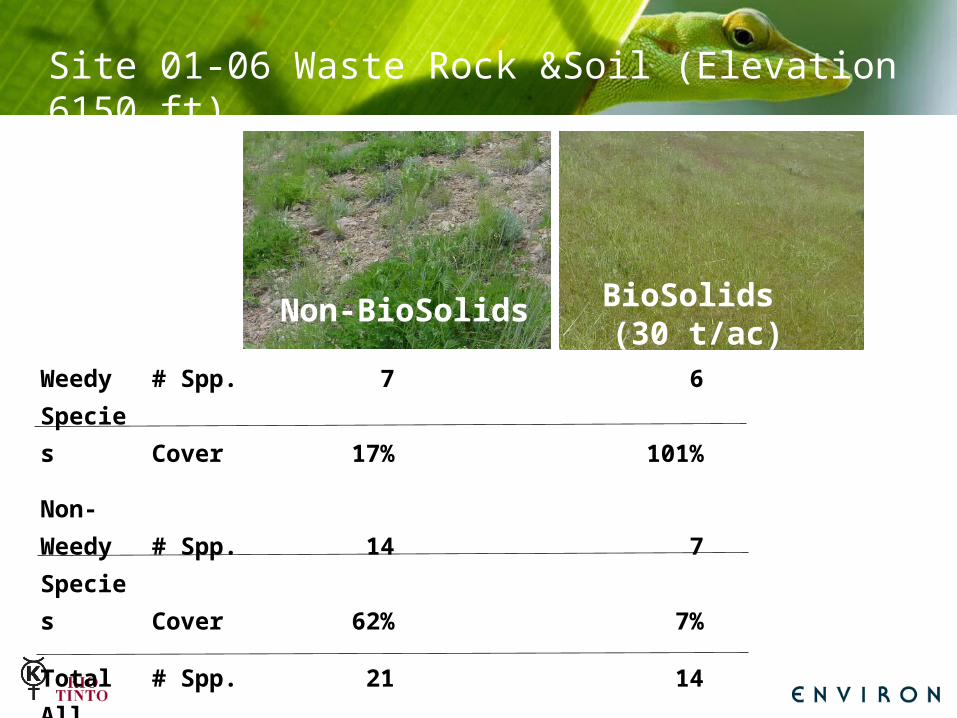
Site 01-06 Waste Rock &Soil (Elevation 6150 ft)
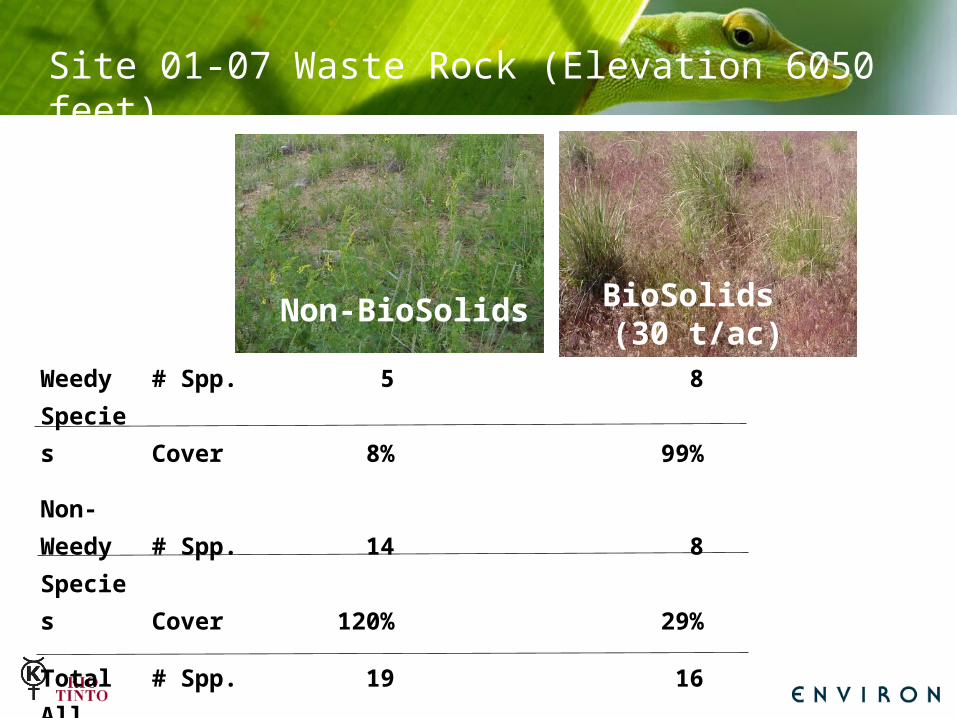
Weedy # Spp. 5 8Species Cover 8% 99%
Non-Weedy # Spp. 14 8Species Cover 120% 29%
Total # Spp. 19 16All Spp. Cover 128% 128%
Non-BioSolids BioSolids (30 t/ac)
Site 01-07 Waste Rock (Elevation 6050 feet)
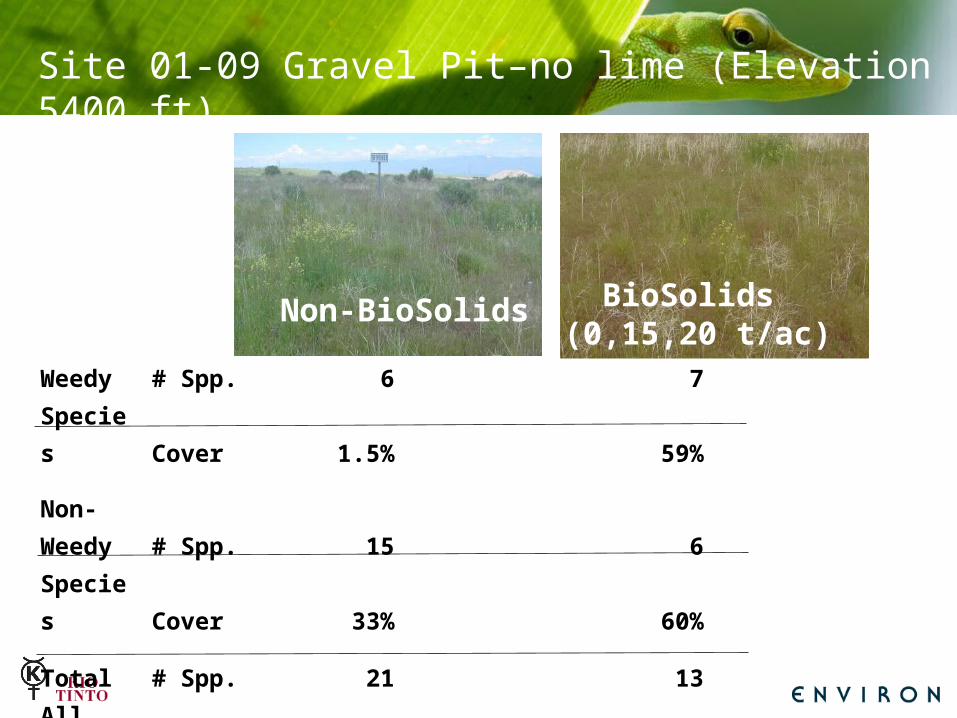
Weedy # Spp. 6 7Species Cover 1.5% 59%
Non-Weedy # Spp. 15 6Species Cover 33% 60%
Total # Spp. 21 13All Spp. Cover 35% 119%
Non-BioSolids BioSolids (0,15,20 t/ac)
Site 01-09 Gravel Pit–no lime (Elevation 5400 ft)
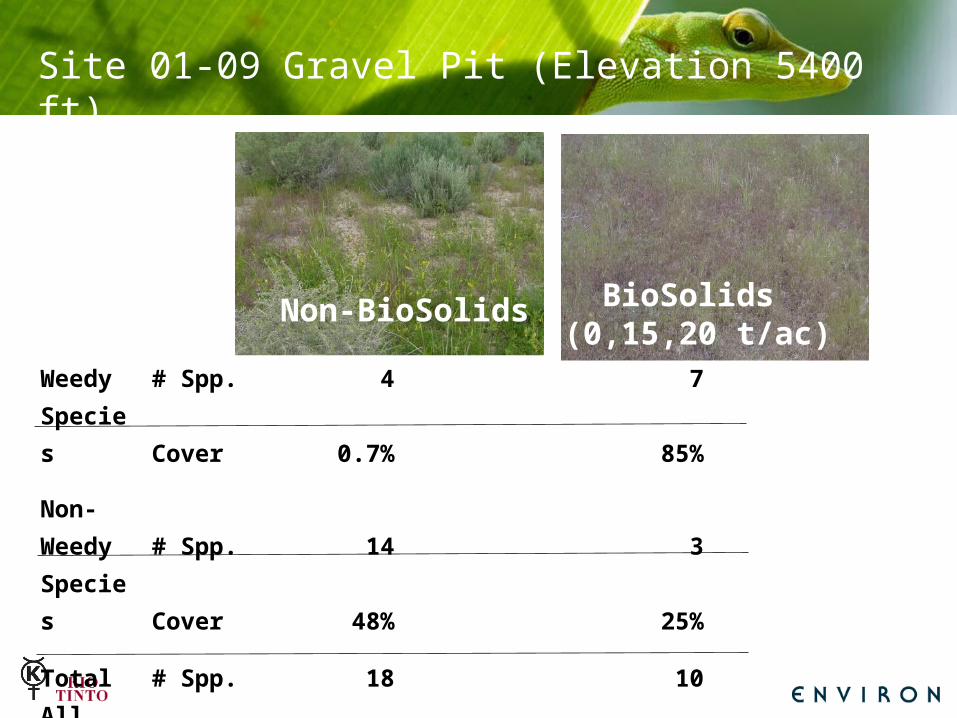
Weedy # Spp. 4 7Species Cover 0.7% 85%
Non-Weedy # Spp. 14 3Species Cover 48% 25%
Total # Spp. 18 10All Spp. Cover 49% 110%
Non-BioSolids BioSolids (0,15,20 t/ac)
Site 01-09 Gravel Pit (Elevation 5400 ft)

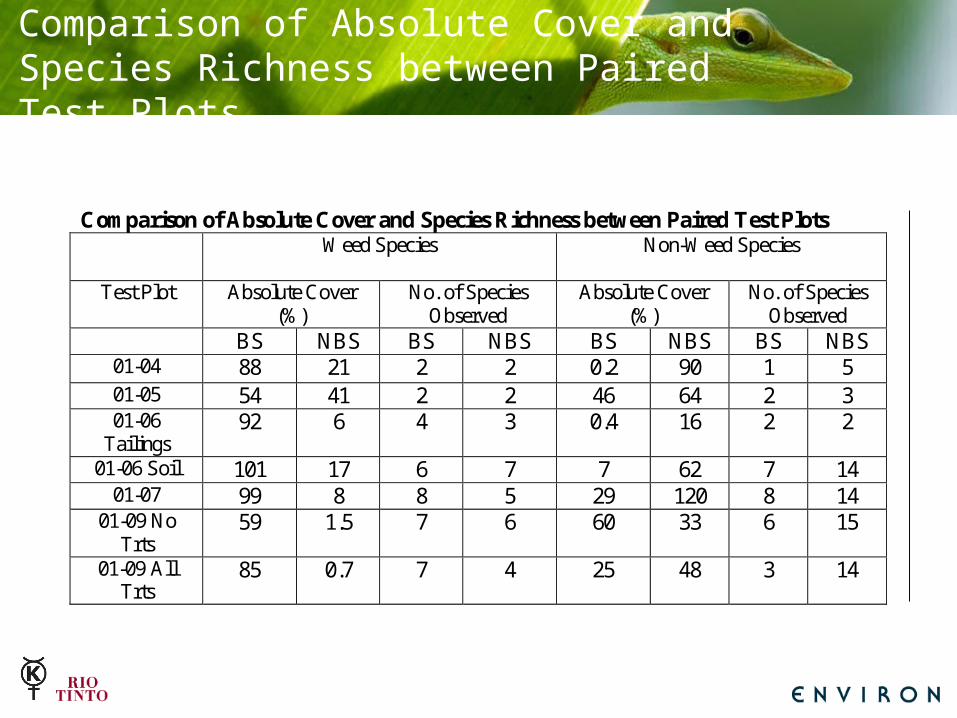
Comparison of Absolute Cover and Species Richness between Paired Test Plots
Comparison of Absolute Cover and Species Richness between Paired Test Plots Weed Species
Non-Weed Species
Test Plot Absolute Cover (%)
No. of Species Observed
Absolute Cover (%)
No. of Species Observed
BS NBS BS NBS BS NBS BS NBS 01-04 88 21 2 2 0.2 90 1 5 01-05 54 41 2 2 46 64 2 3 01-06
Tailings 92 6 4 3 0.4 16 2 2
01-06 Soil 101 17 6 7 7 62 7 14 01-07 99 8 8 5 29 120 8 14
01-09 No Trts
59 1.5 7 6 60 33 6 15
01-09 All Trts
85 0.7 7 4 25 48 3 14
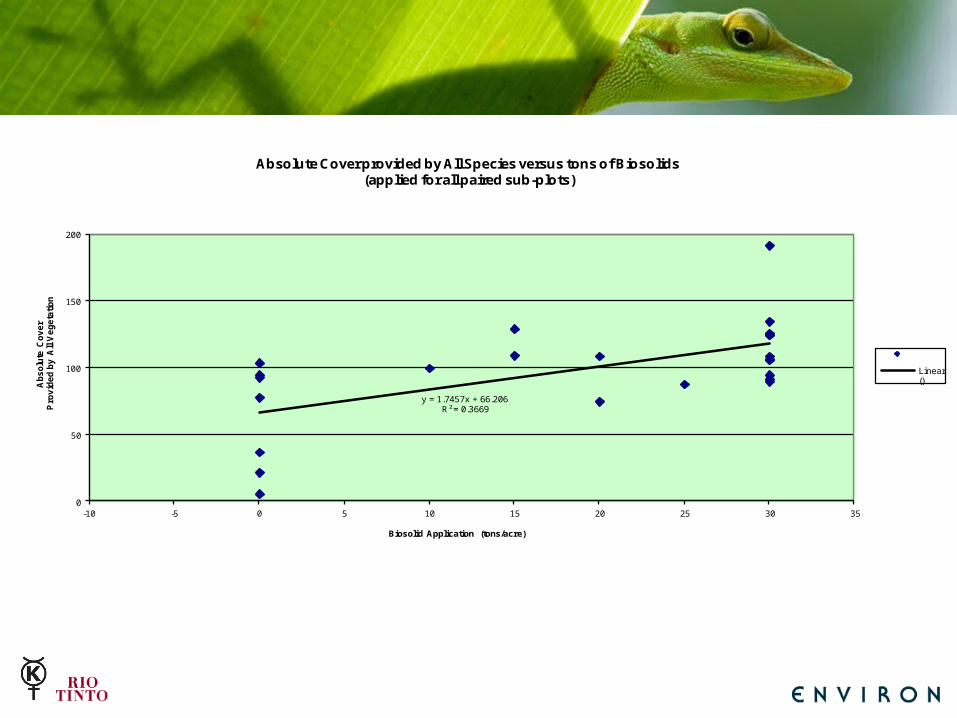
y = 1.7457x + 66.206R² = 0.3669
0
50
100
150
200
-10 -5 0 5 10 15 20 25 30 35
Ab
so
lute
Co
ve
r P
rov
ide
d b
y A
ll V
eg
eta
tio
n
Biosolid Application (tons/acre)
Absolute Cover provided by All Species versus tons of Biosolids(applied for all paired sub-plots)
Linear ()
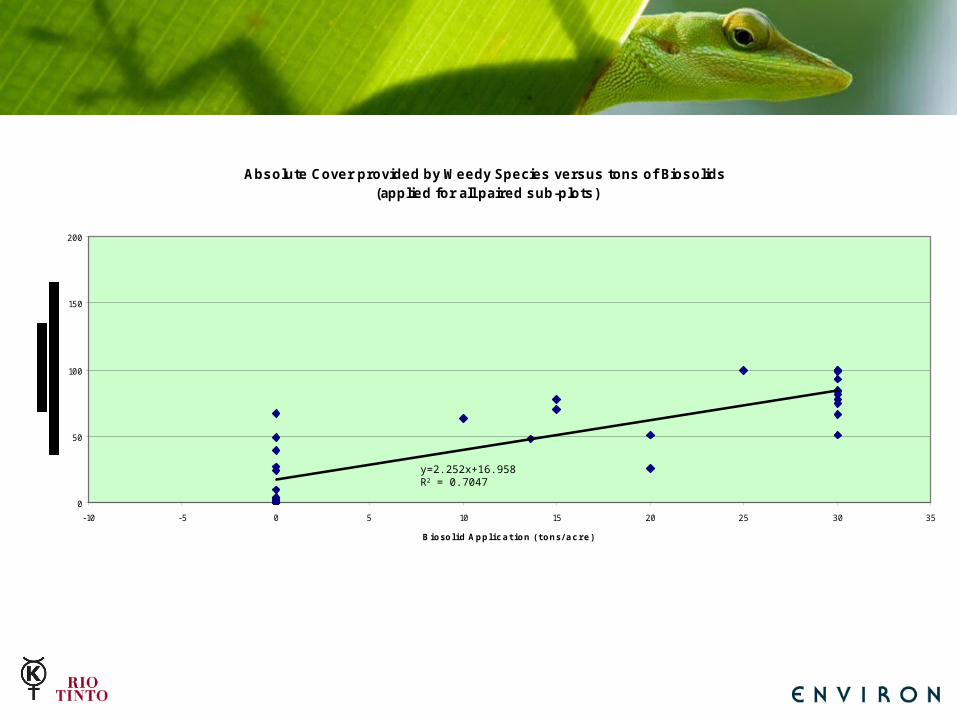
Absolute Cover provided by Weedy Species versus tons of Biosolids (applied for all paired sub-plots )
0
50
100
150
200
-10 -5 0 5 10 15 20 25 30 35
Biosolid Application ( tons/ ac re)
y=2.252x+16.958R2 = 0.7047
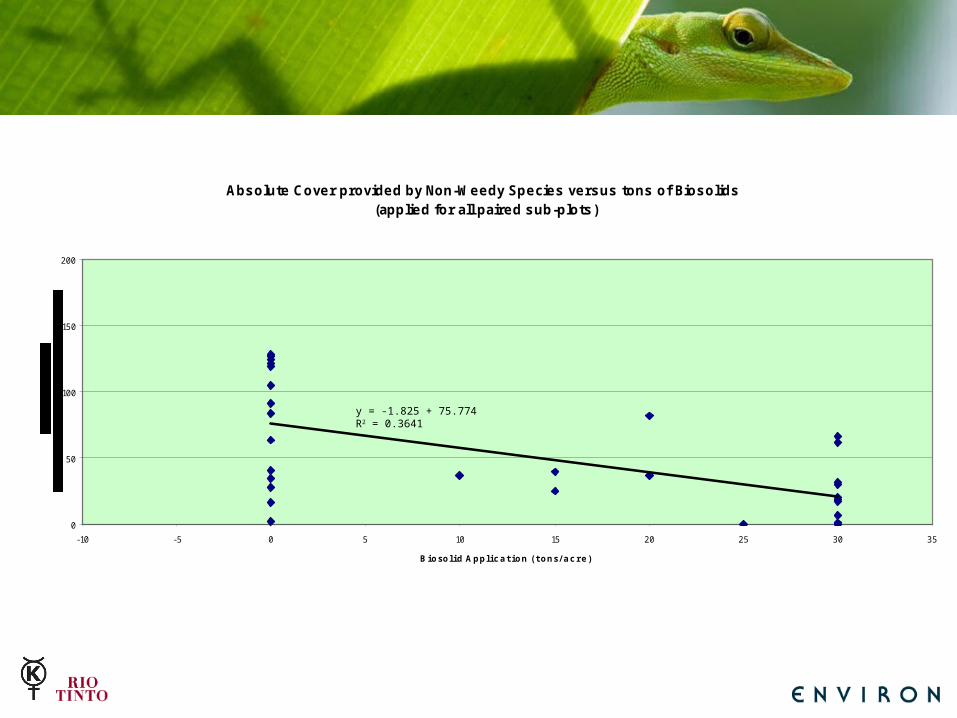
Absolute Cover provided by Non-Weedy Species versus tons of Biosolids (applied for all paired sub-plots )
0
50
100
150
200
-10 -5 0 5 10 15 20 25 30 35
Biosolid Application ( tons/ ac re)
y = -1.825 + 75.774R2 = 0.3641
Comparison of Absolute Cover and Species Richness between Paired Test Plots
Comparison of Absolute Cover and Species Richness between Paired Test Plots Weed Species
Non-Weed Species
Test Plot Absolute Cover (%)
No. of Species Observed
Absolute Cover (%)
No. of Species Observed
BS NBS BS NBS BS NBS BS NBS 01-04 88 21 2 2 0.2 90 1 5 01-05 54 41 2 2 46 64 2 3 01-06
Tailings 92 6 4 3 0.4 16 2 2
01-06 Soil 101 17 6 7 7 62 7 14 01-07 99 8 8 5 29 120 8 14
01-09 No Trts
59 1.5 7 6 60 33 6 15
01-09 All Trts
85 0.7 7 4 25 48 3 14
Questions ?
Recommended