Page 1 of 9
Millennium Minerals Ltd (MOY)
Gold
: P
rodu
ce
r
MOY.asxBuy
Share Price
Valuation $0.26
Price Target (12 month) $0.30
Brief Business Description:
Hartleys Brief Investment Conclusion
Chairman & CEO
Top Shareholders
IMC Resource Investment Pty Ltd 45.8%
Board & Management 1.9%
Company Address
Issued Capital 786.2m
- fully diluted
Market Cap
- fully diluted
A$20.1m
A$0.0m
EV
EV/Resource Au oz 88.7
EV/Reserve Au oz 610.8
Prelim. (A$m) CY16a CY17e CY18e
Prod (koz Au) 84.4 73.3 96.8
Op Cash Flw 42.0 37.9 49.6
Norm NPAT 11.9 14.3 34.2
CF/Share (cps) 5.5 4.9 6.3
EPS (cps) 2.2 1.4 3.4
P/E 7.6 12.1 5.0
A u
Resources (Moz) 1.28
Reserves (Moz) 0.19
Mike Millikan
Resources Analyst
Ph: +61 8 9268 2805
27 Dec 2017
$0.170
Gold producer in the Pilbara
Peter Cash (CEO)
Ground Floor, 10 Kings Park Road
West Perth, WA 6873
WA gold producer w ith both production and mine life
grow th potential. Fresh ore processing study w ell
progressed. Signif icant exploration upside. Bartons f irst
underground in early CY18.
Greg Bittar (Non-Exec Chairman)
Hartleys has provided corporate advice w ithin the past 12
months and continues to provide corporate advice to
MOY for w hich it has earned fees. The analyst recently
visited site at the expense of MOY, all associated costs
covered by MOY.
842.6m
A$133.7m
A$143.2m
A$113.6m
Cash and Bullion (30 Sep 17a)
Debt (30 Sep 17a)
MILLENNIUM MINERALS LTD (MOY)
Nullagine organic growth options coming to the fore Exploration remains a key value driver for Millennium (MOY) at the 100%-
owned Nullagine gold project in WA. The Company committed ~A$22M to
exploration in CY17, and a similar budget for CY18 appears likely. The
Company continues to report outstanding results. In particular from deeper
drilling at Barton, which is expected to be the Company’s first underground
mine and recently from a new greenfields discovery at the Redbeard
prospect, which reports good-grade, shallow gold mineralisation.
Drilling continues to be focused on oxide resource/reserve growth and deeper
testing of the underground potential for the field. The aim is to establish more
sustainable, lower cost ore sources, to provide higher production levels to
maximise free cash generation. MOY is targeting annual production in excess
of 100kozpa for a minimum of 5 years, with the higher grade ores from
deposits such as Bartons considered key for this objective.
Recent success at Redbeard highlights more upside to come First pass RC drilling at Redbeard, part of the Yates Trend has now defined
gold mineralisation (grading +1g/t Au) over some 480m of strike and remains
open to the west and down-dip. Recent drill highlights include: 9m @ 3.9g/t
Au from 17m (incl. 1m @ 8.1g/t Au), 10m @ 2.6g/t Au from 37m and 12m @
2.0g/t Au from 30m (1m @ 5.6g/t Au). Resource infill drilling has commenced
with the aim of delivering a maiden resource in early CY18. Redbeard is
located ~40kms northeast of the processing plant, and is expected to provide
oxide and transitional ores to the mine plan over time. Importantly this new
potential mining centre (Twenty Mile Sandy) is considered under explored
and has proven prospectivity (including undrilled historical workings).
Golden Gate new oxides and conceptual UG design completed Field mapping and sampling at the Golden Gate Mining Centre has identified
a new high grade zone of mineralisation, with rock chips from quartz veins
grading up to 49g/t Au. Drilling to test this area is expected to commence in
the New Year and could provide additional oxide material for the Nullagine
plant. High-grade sulphide ores extend under a number of previously mined
open pits and are considered potential underground mines. The conceptual
underground mine design has already been completed for Golden Gate, but
a plant modification to enable processing of sulphide ores is required (ball
mill, flotation circuit and concentrate handling facilities), capex of ~A$40-46M.
Bartons UG FS due early in the New Year; Maintain Buy The Bartons underground feasibility study (FS) is due for release early in the
New Year. The Phase 1 underground current resource estimate is ~80koz
grading 5.3g/t Au, but with the system is still open at depth and with drilling
ongoing we expect resources to grow and confidence to increase. We
envisage a smooth transition to underground mining, once a decision to
proceed has been approved by the MOY Board and low pre-production
capital costs are expected as the underground starts from shallow depths.
CY17 guidance remains unchanged for 75k–80koz @ AISC of A$1,360–
$1390/oz. We maintain our Buy recommendation on MOY, with our latest
price target of 30cps. The Company appears well poised for production
growth and for mine life extensions. Reserves and resources are expected to
be updated in Q1 CY18.
Hartleys Limited ABN 33 104 195 057 (AFSL 230052) 141 St Georges Terrace, Perth, Western Australia, 6000
Hartleys does and seeks to do business with companies covered in its research reports. As a result, investors should be aware that the
firm may have a conflict of interest that could affect the objectivity of this report. Investors should consider this report as only a single
factor in making their investment decision. Further information concerning Hartleys’ regulatory disclosures can be found on Hartleys
website www.hartleys.com.au
0.00
0.05
0.10
0.15
0.20
0.25
0.30
0.35
0.40
.
1.
2.
3.
4.
5.
6.
Dec-17Sep-17May-17Jan-17
Volume - RHS
MOY Shareprice - LHS
Sector (S&P/ASX SMALL RESOURCES) - LHS
A$ M
Millennium Min Ltd
Source: IRESS

Hartleys Limited Millennium Minerals Limited (MOY) 27 December 2017
Page 2 of 9
SUMMARY MODEL
Millennium Min Ltd
MOY $0.170 Buy
Key Market Information Directors Company InformationShare Price $0.170 Greg Bittar (Non-Exec Chairman) Ground Floor, 10 Kings Park RoadMarket Capitalisation - ordinary A$134m Peter Cash (CEO) West Perth, WA 6873Net Debt (cash) -A$20m Peter Lester (Non-exec Director) +61 8 9216 9012Market Capitalisation - fully diluted A$143m Tim Kennedy (Non-Exec Director) +61 8 9481 0289EV A$123m Michael Chye (Non-Exec Director)Issued Capital 786.2m www.millenniumminerals.com.auOptions & Rights 56.4m Dean Will (COO)
Issued Capital (fully diluted inc. all options) 842.6m Ray Parry (CFO and Joint Comp Sec)
Issued Capital (fully diluted inc. all options and new capital) 842.6m Asareh Mansoori (GM Nullagine)
Valuation $0.26 1 Top Shareholders m shares %12month price target $0.30 2 IMC Resource Investment Pty Ltd 360.0 45.8%
3 Board & Management 15.0 1.9%
P&L Unit 31 Dec 15 31 Dec 16 31 Dec 17 31 Dec 18 4
Net Revenue A$m 142.5 141.6 120.5 162.8 5 Reserves & Resources Mt g/t Au KozTotal Costs A$m -103.2 -99.5 -88.9 -111.5 6 TOTAL RESOURCE & RESERVEEBITDA A$m 39.3 42.1 31.6 51.2 7 Measured 11.0 1.3 460
- margin 28% 30% 26% 31% 8 Indicated 11.4 1.3 470
Depreciation/Amort A$m -11.8 -21.9 -20.6 -24.9 9 Inferred 9.4 1.2 351
EBIT A$m 27.4 20.1 11.0 26.3 Resource (Total) 31.76 1.3 1,280 Dec-16Net Interest A$m -4.5 -3.1 0.0 0.0 Bartons UG - Phase 1 0.48 5.3 80 Aug-17Pre-Tax Profit A$m 22.9 17.1 11.0 26.3 10 Reserve (OP) 4.0 1.4 186 Dec-16Tax Expense A$m 0.0 0.0 0.0 0.0
Normalised NPAT A$m 16.0 11.9 14.3 34.2 Production Summary Unit Dec 15 Dec 16 Dec 17 Dec 18Abnormal Items A$m -6.9 -5.1 -3.3 -7.9 Mill Throughput Mt 1.8 2.0 1.9 1.7
Reported Profit A$m 22.9 17.1 11.0 26.3 Strip Ratio x 2.7 4.0 6.0 6.0Minority A$m 0.0 0.0 0.0 0.0 Mined grade g/t 1.67 1.62 1.39 2.00Profit Attrib A$m 22.9 17.1 11.0 26.3 Combined Recovery & Payability % 85.4% 89.8% 90.0% 91.0%
Gold (Koz) 91.5 84.4 73.3 96.8
Balance Sheet Unit 31 Dec 15 31 Dec 16 31 Dec 17 31 Dec 18 Gold Equiv (Koz) 91.2 84.4 73.3 96.8
Cash A$m 11.4 25.2 26.5 49.1 M & I Resource Conversion Mt 23% 32% 37% 22%
Other Current Assets A$m 21.4 20.6 11.5 15.1 Modelled Mining Inventory Mt 12.2 10.4 8.4 6.5
Total Current Assets A$m 32.8 45.7 38.1 64.1 Modelled Mine Life yr 6.3 6.3 5.5 4.5
Property, Plant & Equip. A$m 33.7 23.1 17.0 3.1Exploration A$m 15.4 37.2 59.3 75.3 Costs Unit Dec 15 Dec 16 Dec 17 Dec 18Investments/other A$m 0.0 0.0 0.0 0.0 Cost per milled tonne $A/t 60.1 66.1 67.0 67.0
Tot Non-Curr. Assets A$m 49.1 60.3 76.2 78.3 EBITDA / tonne milled ore $A/t 21.8 21.5 16.5 30.6
Total Assets A$m 81.9 106.0 114.3 142.5 Total cash costs $A/oz 1,128 1,179 1,213 1,152 C1: Operating Cash Cost = (a) $A/oz 812 1,023 1,076 1,032
Short Term Borrowings A$m 3.7 - - - (a) + Royalty = (b) $A/oz 860 1,077 1,130 1,087
Other A$m 11.1 11.1 8.4 10.2 C2: (a) + depreciation & amortisation = (c) $A/oz 941 1,283 1,358 1,290
Total Curr. Liabilities A$m 14.8 11.1 8.4 10.2 (a) + actual cash for development = (d) $A/oz 842 1,333 1,575 1,311 Long Term Borrowings A$m - - - - C3: (c) + Royalty $A/oz 989 1,337 1,412 1,344
Other A$m 11.4 19.2 19.2 19.2 (d) + Royalty $A/oz 890 1,387 1,630 1,366
Total Non-Curr. Liabil. A$m 11.4 19.2 19.2 19.2 All In Sustaining Cost (AISC) $A/oz 1,175 1,213 1,411 1,311
Total Liabilities A$m 26.3 30.3 27.6 29.4Net Assets A$m 55.6 75.7 86.7 113.0 Price Assumptions Unit Dec 15 Dec 16 Dec 17 Dec 18Net Debt A$m -7.7 -25.2 -26.5 -49.1 AUDUSD A$/US$ 0.74 0.75 0.78 0.78
Gold US$/oz 1133 1227 1278 1303
Cashflow Unit 31 Dec 15 31 Dec 16 31 Dec 17 31 Dec 18 Gold A$/oz 1529 1632 1645 1674Operating Cashflow A$m 30.6 41.9 37.9 49.6Income Tax Paid A$m 0.0 0.0 0.0 0.0 Hedging Dec 15 Dec 16 Dec 17 Dec 18Interest & Other A$m -0.9 0.1 0.0 0.0 Hedges maturing? No No Yes Yes
Operating Activities A$m 29.7 42.0 37.9 49.6
Sensitivity AnalysisProperty, Plant & Equip. A$m -0.6 -0.1 -14.5 -11.0 Valuation FY17 NPATExploration and Devel. A$m -1.5 -16.1 -22.1 -16.0 Base Case 0.26 11.0Other A$m -0.6 -10.0 0.0 0.0 Spot Prices 0.26 (2.2%) 5.0 (-54.7%)
Investment Activities A$m -2.7 -26.2 -36.6 -27.0 Spot USD/AUD 0.77, Gold $1282/oz.
AUDUSD +/--10% 0.18 / 0.35 (-30.4% / 36.9%) 0.4 / 24.0 (-96.3% / 117.7%)Net Borrowings A$m -36.6 -4.0 0.0 0.0 Gold +/--10% 0.34 / 0.17 (33.2% / -33.4%) 22.7 / -0.7 (105.9% / -105.9%)Equity or "tbc capital" A$m 19.3 2.0 0.0 0.0 Production +/--10% 0.33 / 0.18 (28.5% / -28.6%) 14.7 / 7.3 (33.4% / -33.4%)Dividends Paid A$m 0.0 0.0 0.0 0.0 Operating Costs +/--10% 0.20 / 0.31 (-21.3% / 21.3%) 3.1 / 18.9 (-71.7% / 71.7%)
Financing Activities A$m -17.3 -2.0 0.0 0.0Unpaid Capital
Net Cashflow A$m 9.8 13.8 1.3 22.6 Options and Rights
Year Expires No. (m) $m Avg price % ord
Shares Unit 31 Dec 15 31 Dec 16 31 Dec 17 31 Dec 18 31-Dec-17 0.0 0.0 0.00 0%Ordinary Shares - End m 742.7 780.9 780.9 780.9 31-Dec-18 9.1 0.0 0.00 1%Ordinary Shares - Weighted m 480.2 761.8 780.9 780.9 31-Dec-19 31.9 2.5 0.08 4%Diluted Shares - Weighted m 480.2 761.9 781.0 781.0 31-Dec-20 13.0 10.2 0.78 2%
31-Dec-21 2.4 1.1 0.45 0%
Ratio Analysis Unit 31 Dec 15 31 Dec 16 31 Dec 17 31 Dec 18 TOTAL 56.4 13.8 0.25 7%Cashflow Per Share A$ cps 6.2 5.5 4.9 6.3Cashflow Multiple x 0.0 0.0 0.0 0.0 Share Price Valuation (NAV) Risked Est. A$m Est. A$/shareEarnings Per Share A$ cps 4.8 2.2 1.4 3.4 100% Nullagine (pre-tax NAV at disc. rate of 8%) 201.9 0.24Price to Earnings Ratio x 3.6 7.6 12.1 5.0 Exploration & fresh ore upside potential 80.0 0.09Dividends Per Share AUD - - - - Forwards 0.0 0.00Dividend Yield % 0.0% 0.0% 0.0% 0.0% Corporate Overheads -37.3 -0.04Net Debt / Net Debt + Equity% -16% -50% -44% -77% Net Cash (Debt) 20.1 0.02Interest Cover X 6.0 6.5 - - Tax (NPV future liability) -50.9 -0.06Return on Equity % 29% 16% 16% 30% Options & Other Equity 1.5 0.00
Hedges 0.7 0.00
Total 216.1 0.26
Analyst: Mike Millikan
+61 8 9268 2805
"tbc capital" could be equity or debt. Our valuation is risk-adjusted for how this may be obtained.
Sources: IRESS, Company Information, Hartleys Research
27 December 2017Share Price

Hartleys Limited Millennium Minerals Ltd (MOY) 27 December 2017
Page 3 of 9
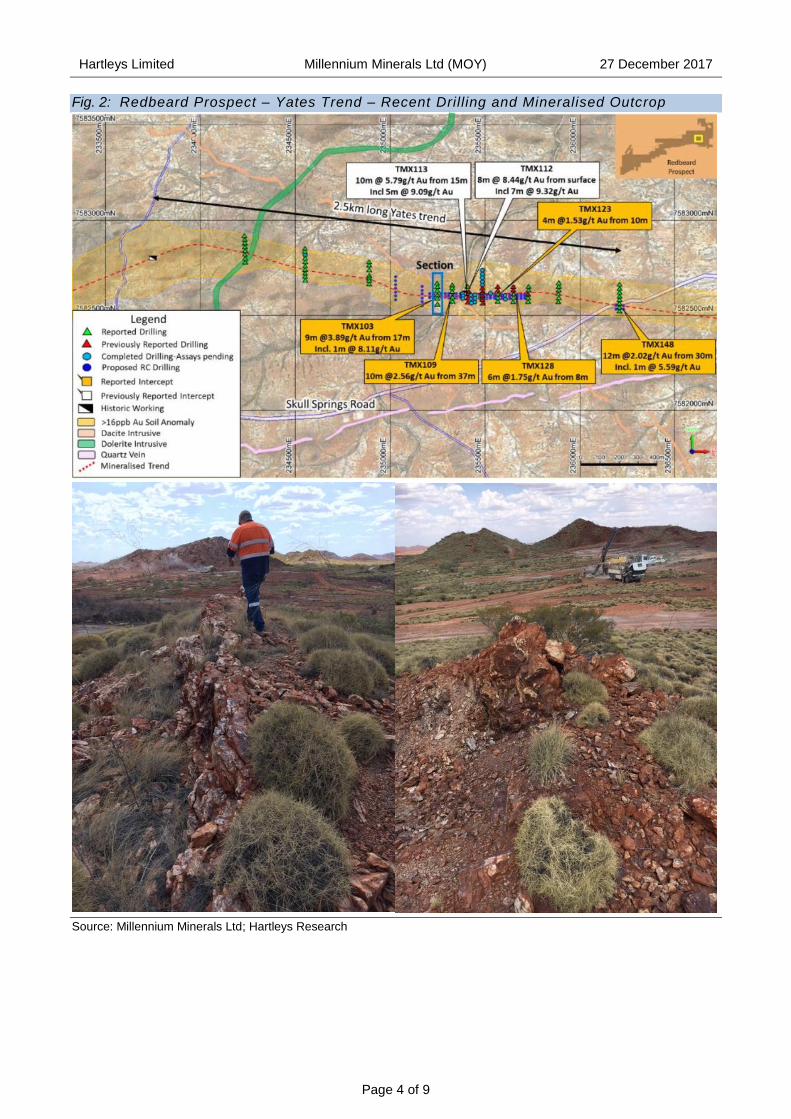
REDBEARD – YATES TREND MORE OZ POTENTIAL We recently visited MOY’s Nullagine Gold Operation in WA. Redbeard, is one
prospect that is gaining traction, with good-grade, shallow gold mineralisation
identified from first pass RC drilling. Mineralisation (grading +1g/t Au) now spans
over 480m of strike and remains open to the west and down-dip. Some recent drill
highlights include:
9m @ 3.9g/t Au from 17m (incl. 1m @ 8.1g/t Au),
10m @ 2.6g/t Au from 37m and
12m @ 2.0g/t Au from 30m (1m @ 5.6g/t Au).
Fig. 1: Redbeard Prospect Location
Source: Millennium Minerals Ltd
Redbeard is part of the Yates Trend and is located ~40kms northeast of the
processing plant, and has potential to provide oxide and transitional ores in to the
mine plan over time. Resource infill drilling recently commenced with the aim of
delivering a maiden resource in early CY18.
Importantly this new potential mining centre (Twenty Mile Sandy) is considered
under explored and has proven prospectivity (including undrilled historical
workings).
More outstanding
resul ts reported from
the recent ly
discovered Redbeard
prospect, Yates Trend
Mineralisat ion
(grading +1g/t Au)
now spans over 480m
of str ike and remains
open to the west and
down-dip
Redbeard is located
~40kms northeast of
the processing plant,
and has potentia l to
provide oxide and
transit ional ores in to
the mine plan over
t ime
Resource inf i l l dr i l l ing
has commenced with
the aim of delivering a
maiden resource in
early CY18
Hartleys Limited Millennium Minerals Ltd (MOY) 27 December 2017
Page 4 of 9
Fig. 2: Redbeard Prospect – Yates Trend – Recent Drill ing and Mineralised Outcrop
Source: Millennium Minerals Ltd; Hartleys Research

Hartleys Limited Millennium Minerals Ltd (MOY) 27 December 2017
Page 5 of 9
BARTONS – FIRST UNDERGROUND MINE MOY has already released a positive scoping study into the underground
development of the Bartons deposit, with the feasibility study (FS) due for release
early in the New Year (CY18). The deeper fresh ore at Bartons is free-milling and
as such can be processed through the existing CIL plant with recoveries of ~90%
anticipated. Bartons has a current underground resource, providing ~80oz at good
grade of 5.3g/t Au, with the resource considered interim as the deposit remains open
at depth and along strike. A previous pit cut-back estimate for ~25koz at a good-
grade 2.2g/t Au is likely to be well exceeded. MOY is now completing an infill drill
program to upgrade Inferred ounces to Indicated for use in the FS.
Bartons is expected to be the first underground mine for MOY at Nullagine, but
before the underground commences, a pit cut-back should provide good-grade
(+2g/t Au) ores. The introduction of underground ores (Bartons) will lift mill head
grades for production beyond 85kozpa towards the targeted +100kozpa.
Fig. 3: Bartons underground potential
Source: Millennium Minerals Ltd; Hartleys Research
Bartons is expected to
be MOY’s f irst
underground mine
Before the
underground
commences MOY has
a pit cut back to mine
good-grade
mineralisat ion (+25koz
grading over 2g/t Au)
and establish a good
posi t ion for a porta l
Phase 1 underground
resource of 475.9kt @
5.3g/ t Au for 80 .4koz
Bartons underground
FS is due for re lease
in ear ly CY18
The introduct ion of
higher grade ore
sources provides
opportunit ies to l i f t
mil l head grades to
increase product ion -
+100kozpa is being
targeted
Hartleys Limited Millennium Minerals Ltd (MOY) 27 December 2017
Page 6 of 9
EARNINGS CHANGES
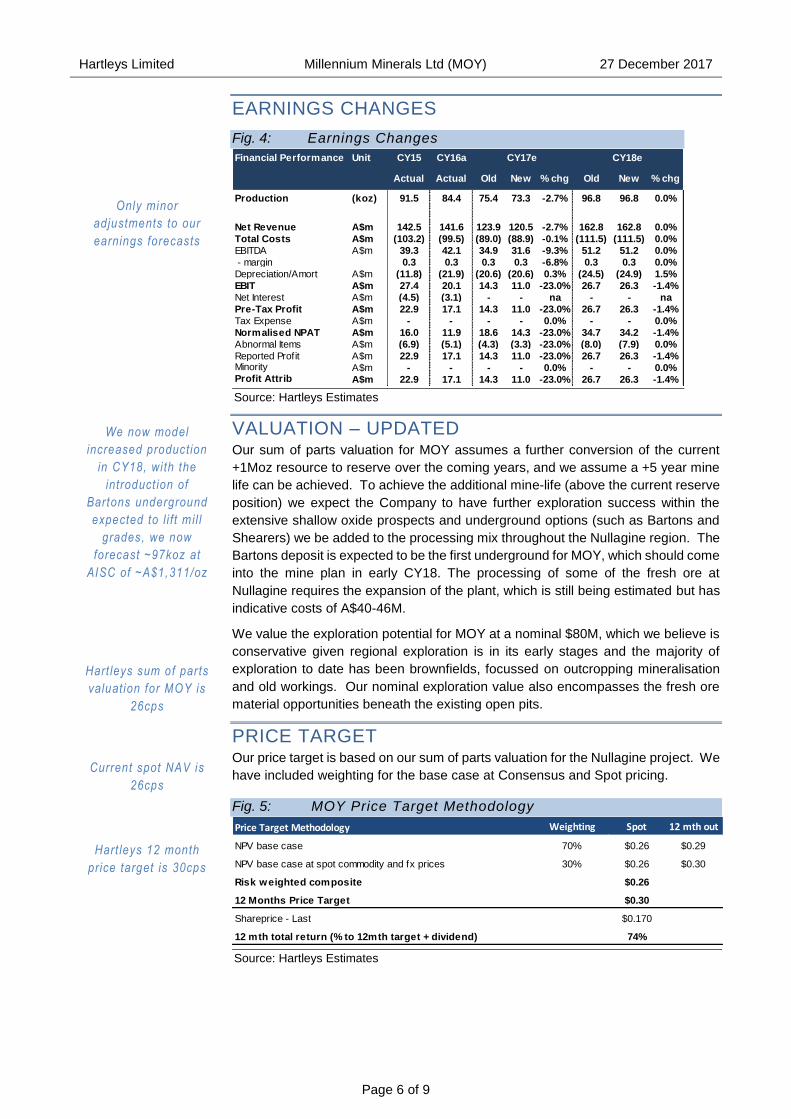
Fig. 4: Earnings Changes
Source: Hartleys Estimates
VALUATION – UPDATED Our sum of parts valuation for MOY assumes a further conversion of the current
+1Moz resource to reserve over the coming years, and we assume a +5 year mine
life can be achieved. To achieve the additional mine-life (above the current reserve
position) we expect the Company to have further exploration success within the
extensive shallow oxide prospects and underground options (such as Bartons and
Shearers) we be added to the processing mix throughout the Nullagine region. The
Bartons deposit is expected to be the first underground for MOY, which should come
into the mine plan in early CY18. The processing of some of the fresh ore at
Nullagine requires the expansion of the plant, which is still being estimated but has
indicative costs of A$40-46M.
We value the exploration potential for MOY at a nominal $80M, which we believe is
conservative given regional exploration is in its early stages and the majority of
exploration to date has been brownfields, focussed on outcropping mineralisation
and old workings. Our nominal exploration value also encompasses the fresh ore
material opportunities beneath the existing open pits.
PRICE TARGET Our price target is based on our sum of parts valuation for the Nullagine project. We
have included weighting for the base case at Consensus and Spot pricing.
Fig. 5: MOY Price Target Methodology
Source: Hartleys Estimates
Financial Performance Unit
Actual Actual Old New % chg Old New % chg
Production (koz) 91.5 84.4 75.4 73.3 -2.7% 96.8 96.8 0.0%
Net Revenue A$m 142.5 141.6 123.9 120.5 -2.7% 162.8 162.8 0.0%
Total Costs A$m (103.2) (99.5) (89.0) (88.9) -0.1% (111.5) (111.5) 0.0%
EBITDA A$m 39.3 42.1 34.9 31.6 -9.3% 51.2 51.2 0.0%
- margin 0.3 0.3 0.3 0.3 -6.8% 0.3 0.3 0.0%
Depreciation/Amort A$m (11.8) (21.9) (20.6) (20.6) 0.3% (24.5) (24.9) 1.5%
EBIT A$m 27.4 20.1 14.3 11.0 -23.0% 26.7 26.3 -1.4%
Net Interest A$m (4.5) (3.1) - - na - - na
Pre-Tax Profit A$m 22.9 17.1 14.3 11.0 -23.0% 26.7 26.3 -1.4%
Tax Expense A$m - - - - 0.0% - - 0.0%
Normalised NPAT A$m 16.0 11.9 18.6 14.3 -23.0% 34.7 34.2 -1.4%
Abnormal Items A$m (6.9) (5.1) (4.3) (3.3) -23.0% (8.0) (7.9) 0.0%
Reported Profit A$m 22.9 17.1 14.3 11.0 -23.0% 26.7 26.3 -1.4%Minority A$m - - - - 0.0% - - 0.0%Profit Attrib A$m 22.9 17.1 14.3 11.0 -23.0% 26.7 26.3 -1.4%
CY15 CY16a CY17e CY18e
Price Target Methodology Weighting Spot 12 mth out
70% $0.26 $0.29
NPV base case at spot commodity and fx prices 30% $0.26 $0.30
Risk weighted composite $0.26
12 Months Price Target $0.30
Shareprice - Last $0.170
12 mth total return (% to 12mth target + dividend) 74%
NPV base case
Only minor
adjustments to our
earnings forecasts
We now model
increased production
in CY18, wi th the
introduct ion of
Bartons underground
expected to l i f t mil l
grades, we now
forecast ~97koz at
AISC of ~A$1,311/oz
Hart leys sum of par ts
valuation for MOY is
26cps
Current spot NAV is
26cps
Hart leys 12 month
price target is 30cps
Hartleys Limited Millennium Minerals Ltd (MOY) 27 December 2017
Page 7 of 9
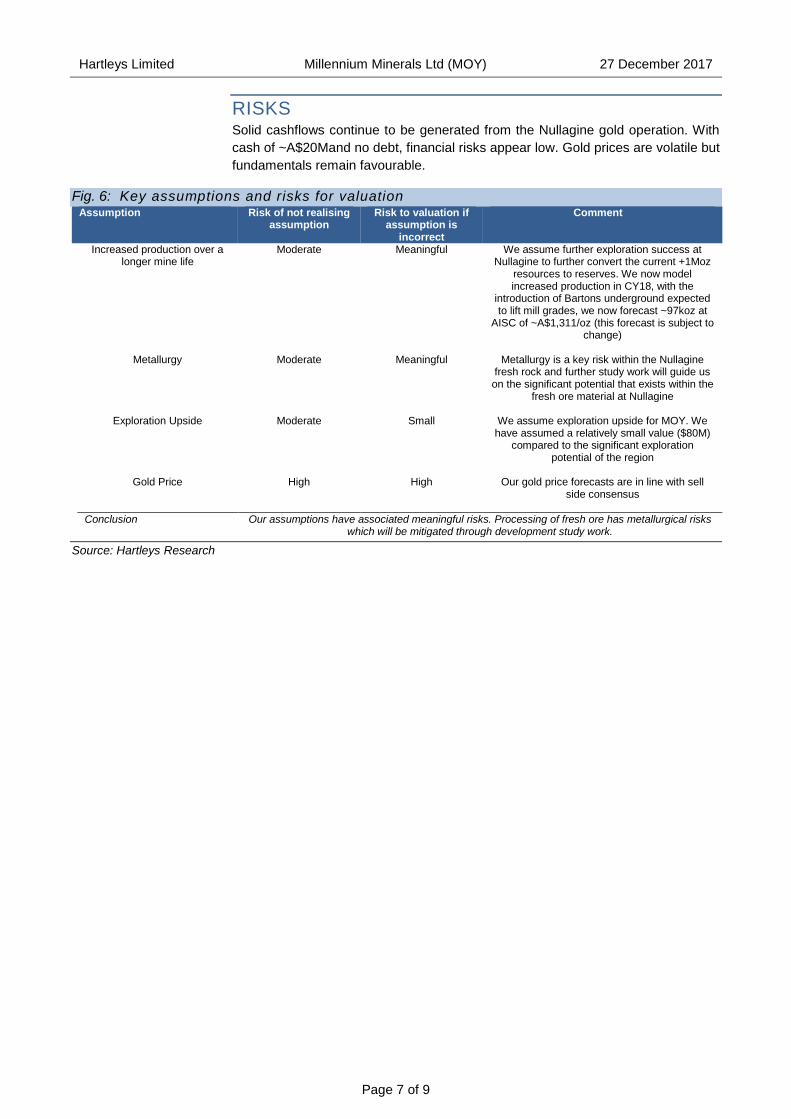
RISKS Solid cashflows continue to be generated from the Nullagine gold operation. With
cash of ~A$20Mand no debt, financial risks appear low. Gold prices are volatile but
fundamentals remain favourable.
Fig. 6: Key assumptions and risks for valuation Assumption Risk of not realising
assumption Risk to valuation if
assumption is incorrect
Comment
Increased production over a longer mine life
Moderate Meaningful We assume further exploration success at Nullagine to further convert the current +1Moz
resources to reserves. We now model increased production in CY18, with the
introduction of Bartons underground expected to lift mill grades, we now forecast ~97koz at
AISC of ~A$1,311/oz (this forecast is subject to change)
Metallurgy Moderate Meaningful Metallurgy is a key risk within the Nullagine
fresh rock and further study work will guide us on the significant potential that exists within the
fresh ore material at Nullagine
Exploration Upside Moderate Small We assume exploration upside for MOY. We have assumed a relatively small value ($80M)
compared to the significant exploration potential of the region
Gold Price High High Our gold price forecasts are in line with sell
side consensus
Conclusion Our assumptions have associated meaningful risks. Processing of fresh ore has metallurgical risks which will be mitigated through development study work.
Source: Hartleys Research
Hartleys Limited Millennium Minerals Ltd (MOY) 27 December 2017
Page 8 of 9
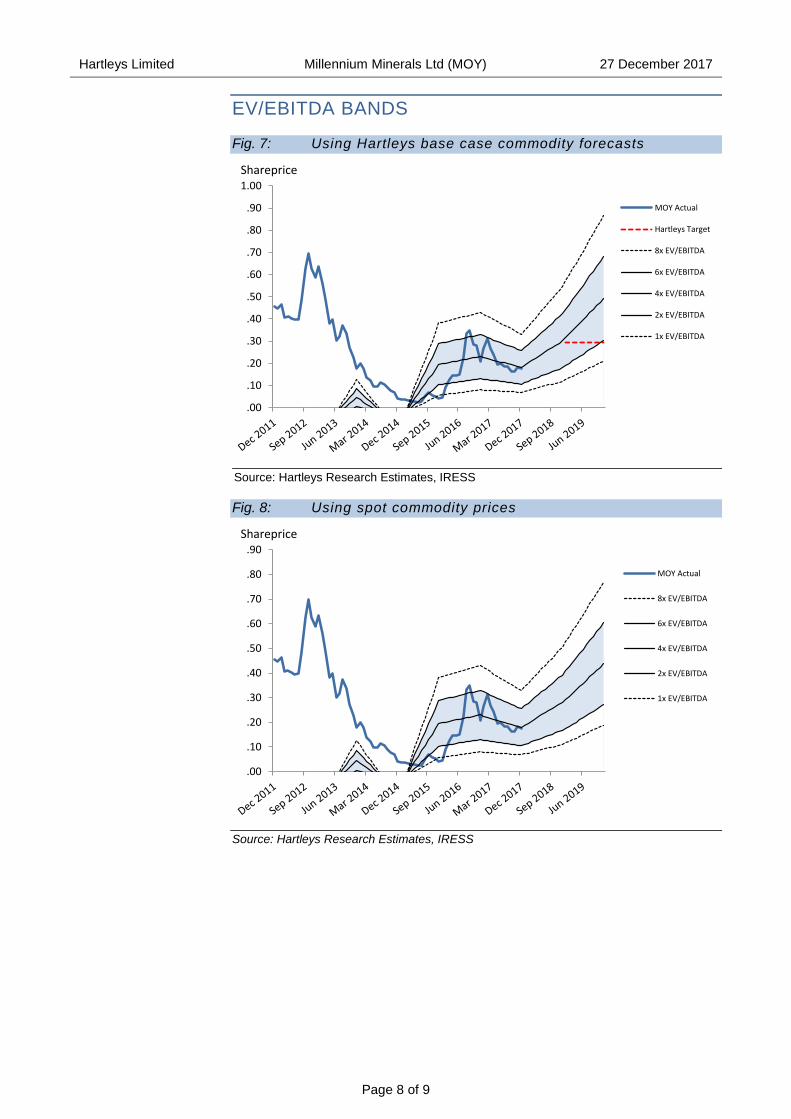
EV/EBITDA BANDS
Fig. 7: Using Hartleys base case commodity forecasts
Source: Hartleys Research Estimates, IRESS
Fig. 8: Using spot commodity prices
Source: Hartleys Research Estimates, IRESS
.00
.10
.20
.30
.40
.50
.60
.70
.80
.90
1.00
MOY Actual
Hartleys Target
8x EV/EBITDA
6x EV/EBITDA
4x EV/EBITDA
2x EV/EBITDA
1x EV/EBITDA
Shareprice
.00
.10
.20
.30
.40
.50
.60
.70
.80
.90
MOY Actual
8x EV/EBITDA
6x EV/EBITDA
4x EV/EBITDA
2x EV/EBITDA
1x EV/EBITDA
Shareprice
Page 9 of 9
HARTLEYS CORPORATE DIRECTORY Research Trent Barnett Head of Research +61 8 9268 3052
Mike Millikan Resources Analyst +61 8 9268 2805
John Macdonald Resources Analyst +61 8 9268 3020
Paul Howard Resources Analyst +61 8 9268 3045
Aiden Bradley Research Analyst +61 8 9268 2876
Michael Scantlebury Junior Analyst +61 8 9268 2837
Janine Bell Research Assistant +61 8 9268 2831
Corporate Finance Dale Bryan Director & Head of
Corp Fin.
+61 8 9268 2829
Richard Simpson Director +61 8 9268 2824
Ben Crossing Director +61 8 9268 3047
Ben Wale Associate Director +61 8 9268 3055
Stephen Kite Associate Director +61 8 9268 3050
Scott Weir Associate Director +61 8 9268 2821
Scott Stephens Associate Director +61 8 9268 2819
Rhys Simpson Manager +61 8 9268 2851
Registered Office
Level 6, 141 St Georges TcePostal Address:
PerthWA 6000 GPO Box 2777
Australia Perth WA 6001
PH:+61 8 9268 2888 FX: +61 8 9268 2800
www.hartleys.com.au [email protected]
Note: personal email addresses of company employees are
structured in the following
manner:[email protected]
Hartleys Recommendation Categories
Buy Share price appreciation anticipated.
Accumulate Share price appreciation anticipated but the risk/reward is
not as attractive as a “Buy”. Alternatively, for the share
price to rise it may be contingent on the outcome of an
uncertain or distant event. Analyst will often indicate a
price level at which it may become a “Buy”.
Neutral Take no action. Upside & downside risk/reward is evenly
balanced.
Reduce /
Take profits
It is anticipated to be unlikely that there will be gains over
the investment time horizon but there is a possibility of
some price weakness over that period.
Sell Significant price depreciation anticipated.
No Rating No recommendation.
Speculative
Buy
Share price could be volatile. While it is anticipated that,
on a risk/reward basis, an investment is attractive, there
is at least one identifiable risk that has a meaningful
possibility of occurring, which, if it did occur, could lead to
significant share price reduction. Consequently, the
investment is considered high risk.
Institutional Sales Carrick Ryan +61 8 9268 2864
Justin Stewart +61 8 9268 3062
Simon van den Berg +61 8 9268 2867
Chris Chong +61 8 9268 2817
Digby Gilmour +61 8 9268 2814
Veronika Tkacova +61 8 9268 3053
Wealth Management Nicola Bond +61 8 9268 2840
Bradley Booth +61 8 9268 2873
Adrian Brant +61 8 9268 3065
Nathan Bray +61 8 9268 2874
Sven Burrell +61 8 9268 2847
Simon Casey +61 8 9268 2875
Tony Chien +61 8 9268 2850
Tim Cottee +61 8 9268 3064
David Cross +61 8 9268 2860
Nicholas Draper +61 8 9268 2883
John Featherby +61 8 9268 2811
Ben Fleay +61 8 9268 2844
James Gatti +61 8 9268 3025
John Goodlad +61 8 9268 2890
Andrew Gribble +61 8 9268 2842
David Hainsworth +61 8 9268 3040
Murray Jacob +61 8 9268 2892
Gavin Lehmann +61 8 9268 2895
Shane Lehmann +61 8 9268 2897
Steven Loxley +61 8 9268 2857
Andrew Macnaughtan +61 8 9268 2898
Scott Metcalf +61 8 9268 2807
David Michael +61 8 9268 2835
Jamie Moullin +61 8 9268 2856
Chris Munro +61 8 9268 2858
Michael Munro +61 8 9268 2820
Ian Parker +61 8 9268 2810
Matthew Parker +61 8 9268 2826
Charlie Ransom
(CEO)
+61 8 9268 2868
Mark Sandford +61 8 9268 3066
David Smyth +61 8 9268 2839
Greg Soudure +61 8 9268 2834
Sonya Soudure +61 8 9268 2865
Dirk Vanderstruyf +61 8 9268 2855
Samuel Williams +61 8 9268 3041
Jayme Walsh +61 8 9268 2828
Disclaimer/Disclosure
The author of this publication, Hartleys Limited ABN 33 104 195 057 (“Hartleys”), its Directors and their Associates from time to time may hold
shares in the security/securities mentioned in this Research document and therefore may benefit from any increase in the price of those securities.
Hartleys and its Advisers may earn brokerage, fees, commissions, other benefits or advantages as a result of a transaction arising from any advice
mentioned in publications to clients.
Hartleys has provided corporate advice within the past 12 months and continues to provide corporate advice to Millennium Minerals Limited for
which it has earned fees. The analyst recently visited site at the expense of MOY, all associated costs covered by MOY.
This report was prepared solely by Hartleys Limited. ASX did not prepare any part of the report and has not contributed in any way to its content.
The role of ASX in relation to the preparation of the research reports is limited to funding their preparation, by Hartleys Limited, in accordance with
the ASX Equity Research Scheme. ASX does not provide financial product advice. The views expressed in this research report may not
necessarily reflect the views of ASX. To the maximum extent permitted by law, no representation, warranty or undertaking, express or implied, is
made and no responsibility or liability is accepted by ASX as to the adequacy, accuracy, completeness or reasonableness of the research reports.
Any financial product advice contained in this document is unsolicited general information only. Do not act on this advice without first consulting
your investment adviser to determine whether the advice is appropriate for your investment objectives, financial situation and particular needs.
Hartleys believes that any information or advice (including any financial product advice) contained in this document is accurate when issued.
Hartleys however, does not warrant its accuracy or reliability. Hartleys, its officers, agents and employees exclude all liability whatsoever, in
negligence or otherwise, for any loss or damage relating to this document to the full extent permitted by law.
Recommended