[ 1 ]
Millennials & the “New American Dream”
A Survey Commissioned by ZipcarJanuary 2014
2 confidential
Driving Deeper: The Millennials Survey
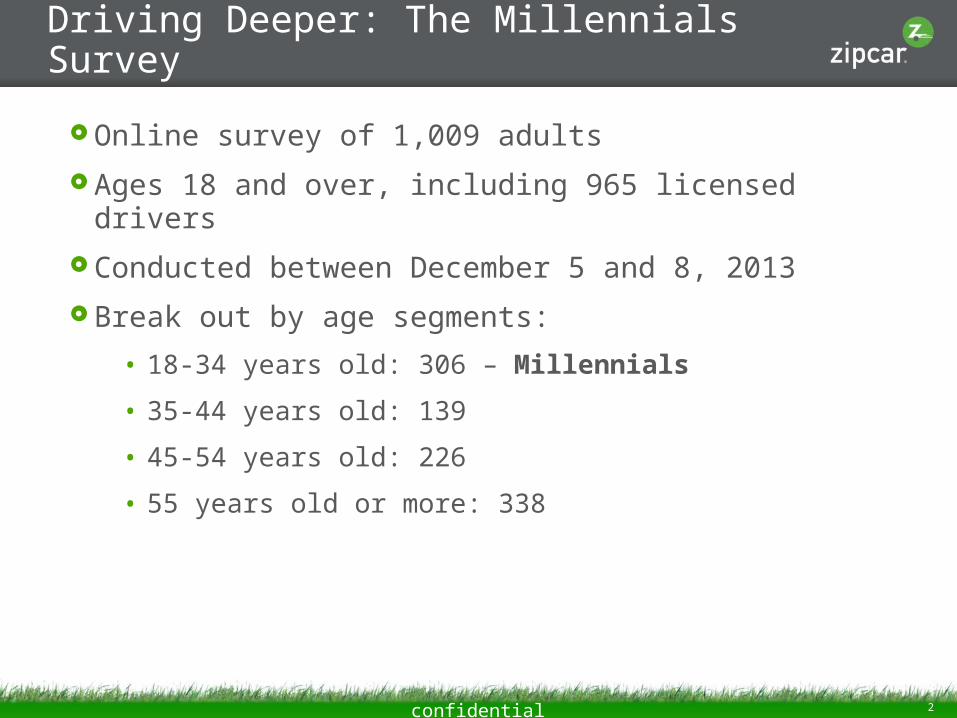
Online survey of 1,009 adults Ages 18 and over, including 965 licensed drivers Conducted between December 5 and 8, 2013 Break out by age segments:
• 18-34 years old: 306 – Millennials
• 35-44 years old: 139
• 45-54 years old: 226
• 55 years old or more: 338
3 confidential
2013 Key Findings
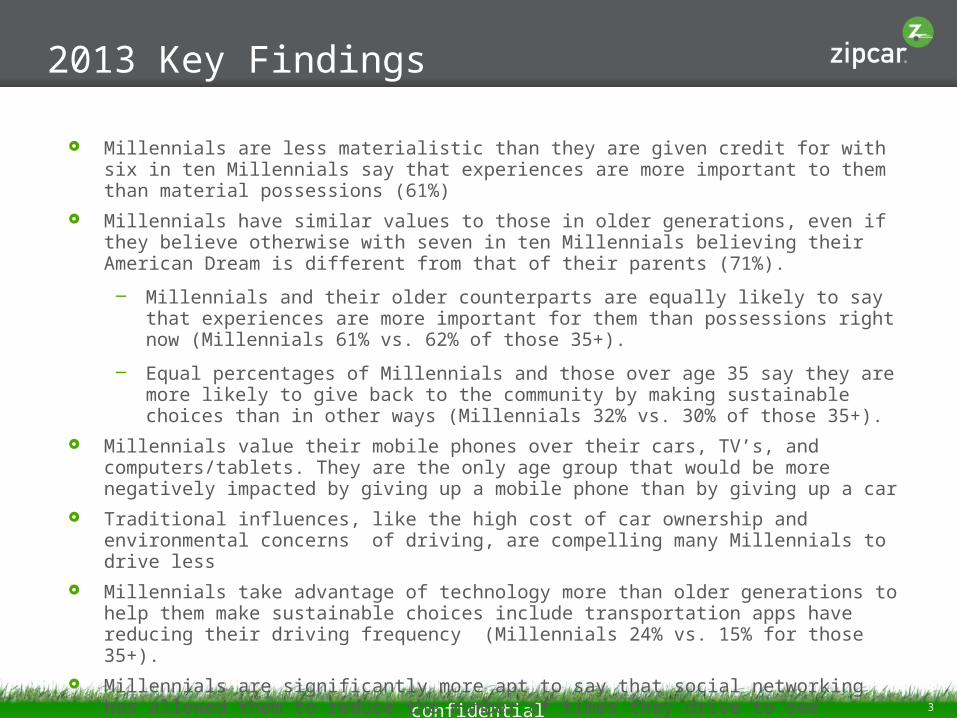
Millennials are less materialistic than they are given credit for with six in ten Millennials say that experiences are more important to them than material possessions (61%)
Millennials have similar values to those in older generations, even if they believe otherwise with seven in ten Millennials believing their American Dream is different from that of their parents (71%).
– Millennials and their older counterparts are equally likely to say that experiences are more important for them than possessions right now (Millennials 61% vs. 62% of those 35+).
– Equal percentages of Millennials and those over age 35 say they are more likely to give back to the community by making sustainable choices than in other ways (Millennials 32% vs. 30% of those 35+).
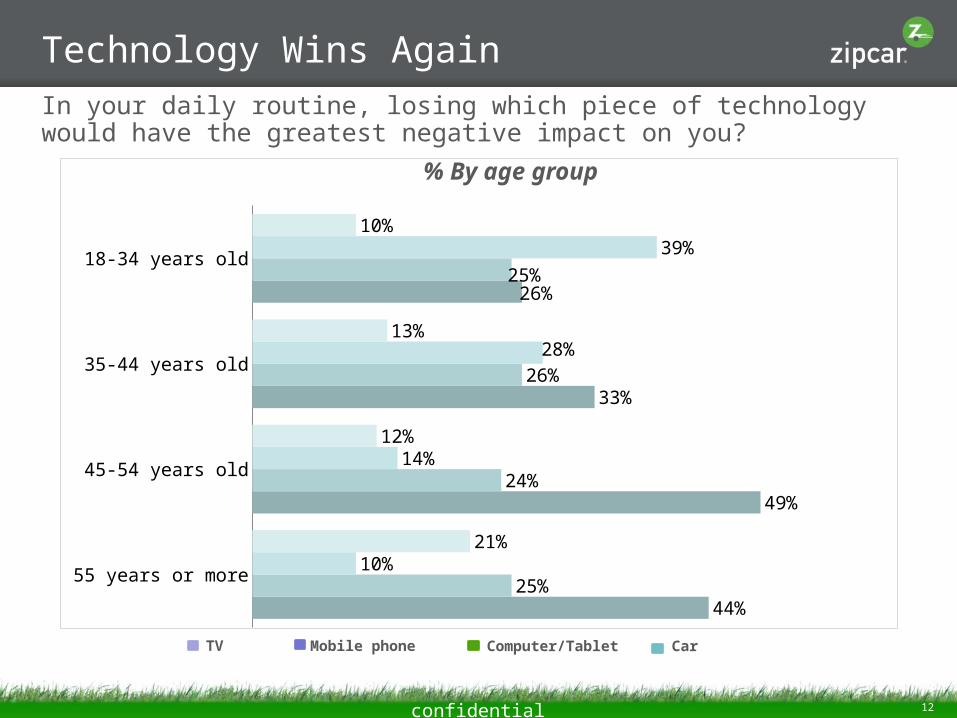
Millennials value their mobile phones over their cars, TV’s, and computers/tablets. They are the only age group that would be more negatively impacted by giving up a mobile phone than by giving up a car
Traditional influences, like the high cost of car ownership and environmental concerns of driving, are compelling many Millennials to drive less
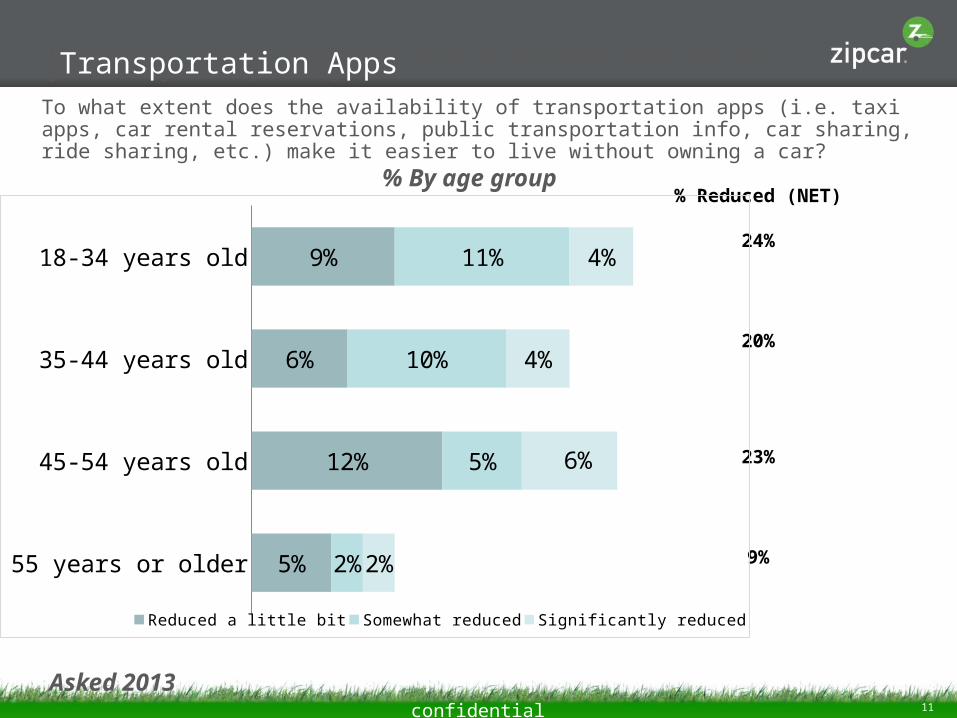
Millennials take advantage of technology more than older generations to help them make sustainable choices include transportation apps have reducing their driving frequency (Millennials 24% vs. 15% for those 35+).
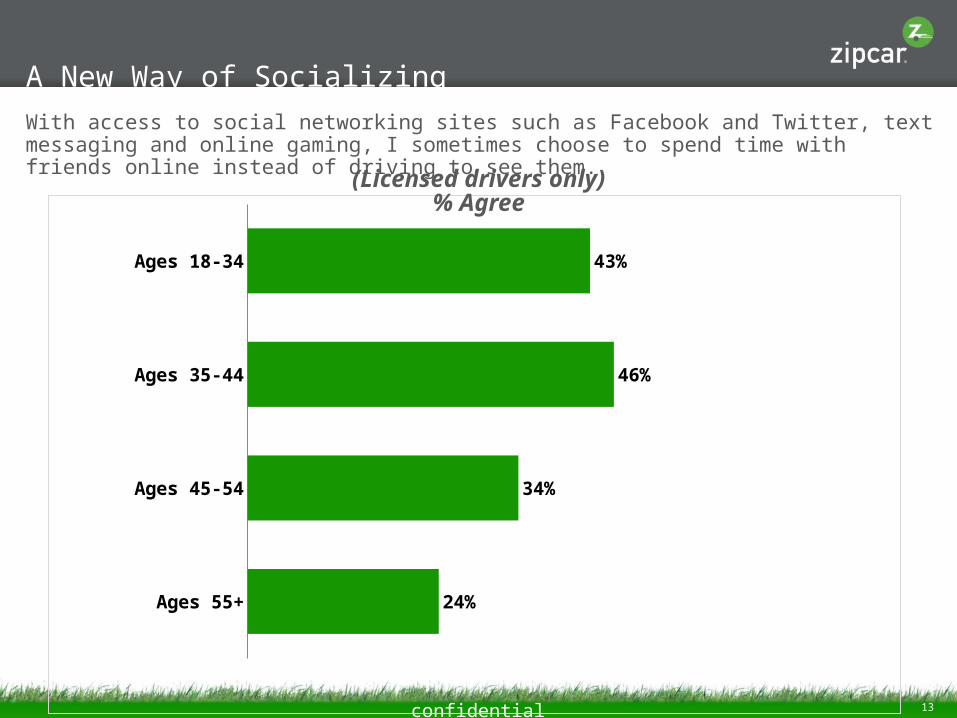
Millennials are significantly more apt to say that social networking has allowed them to reduce the number of times they drive to see friends and, instead, socialize online or through texts (43% Millennials vs. 32% of those 35+).
4 confidential
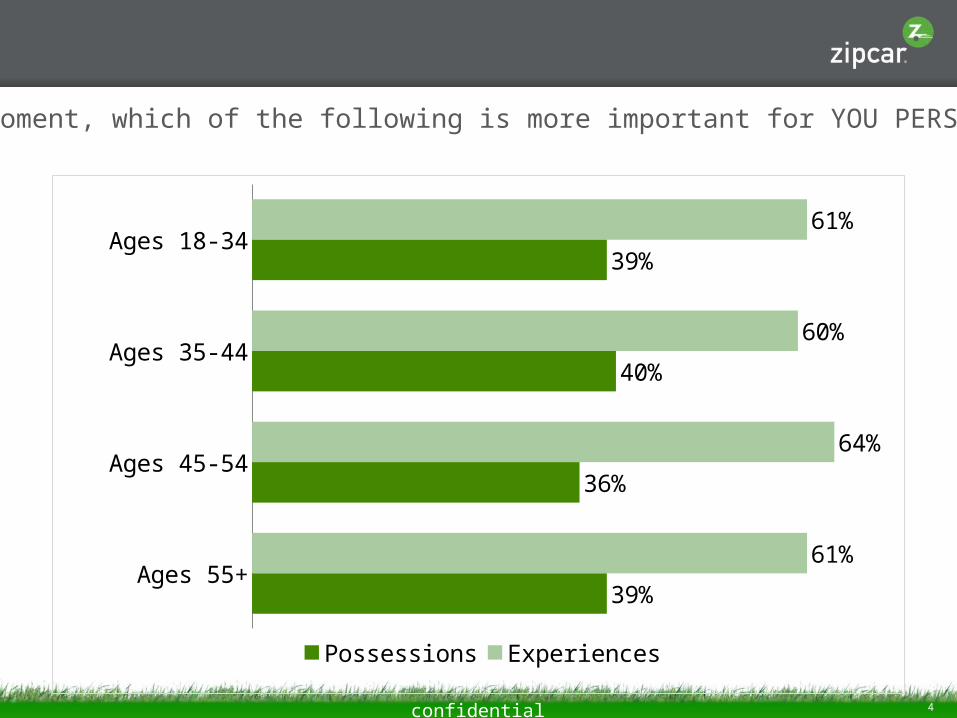
Millennials Prefer Experiences over PossessionsAt this moment, which of the following is more important for YOU PERSONALLY?
Ages 18-34
Ages 35-44
Ages 45-54
Ages 55+
61%
60%
64%
61%
39%
40%
36%
39%
Possessions Experiences
5 confidential
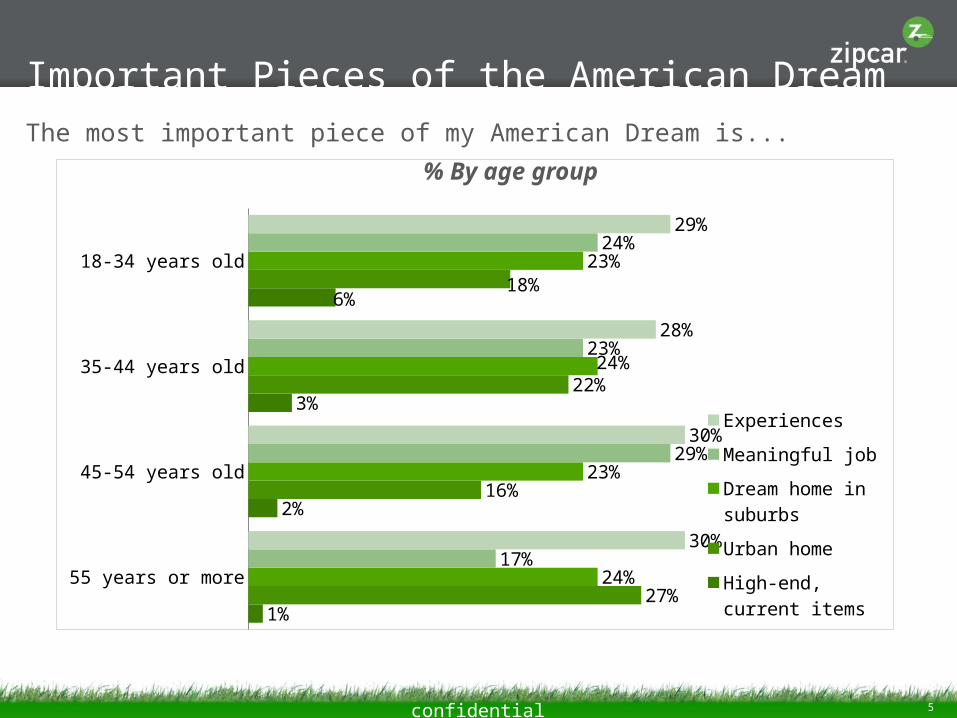
Important Pieces of the American DreamThe most important piece of my American Dream is...
55 years or more
45-54 years old
35-44 years old
18-34 years old
1%
2%
3%
6%
27%
16%
22%
18%
24%
23%
24%
23%
17%
29%
23%
24%
30%
30%
28%
29%
Experiences
Meaningful job
Dream home in suburbs
Urban home
High-end, current items
% By age group
6 confidential
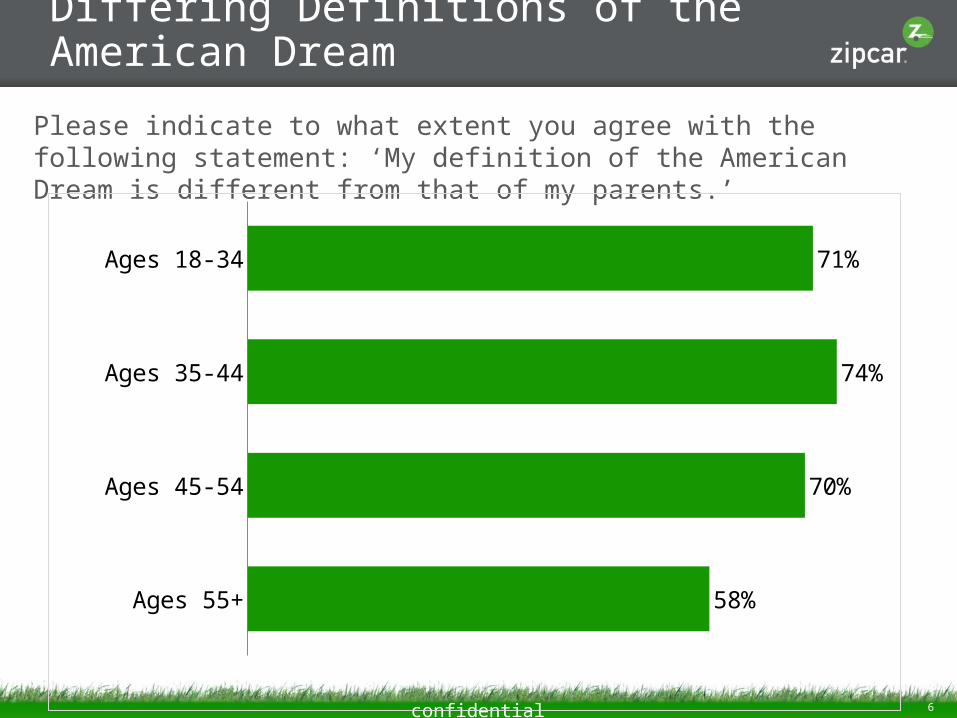
Differing Definitions of the American Dream
Please indicate to what extent you agree with the following statement: ‘My definition of the American Dream is different from that of my parents.’
Ages 18-34
Ages 35-44
Ages 45-54
Ages 55+
71%
74%
70%
58%
7 confidential
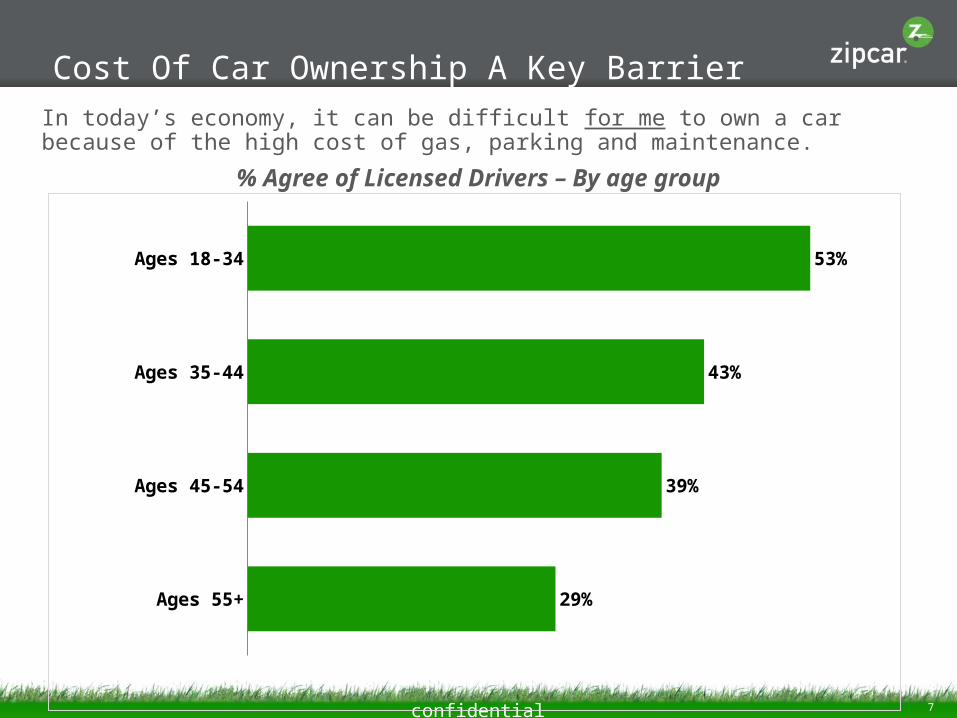
Cost Of Car Ownership A Key BarrierIn today’s economy, it can be difficult for me to own a car because of the high cost of gas, parking and maintenance.
% Agree of Licensed Drivers – By age group
Ages 18-34
Ages 35-44
Ages 45-54
Ages 55+
53%
43%
39%
29%
8 confidential
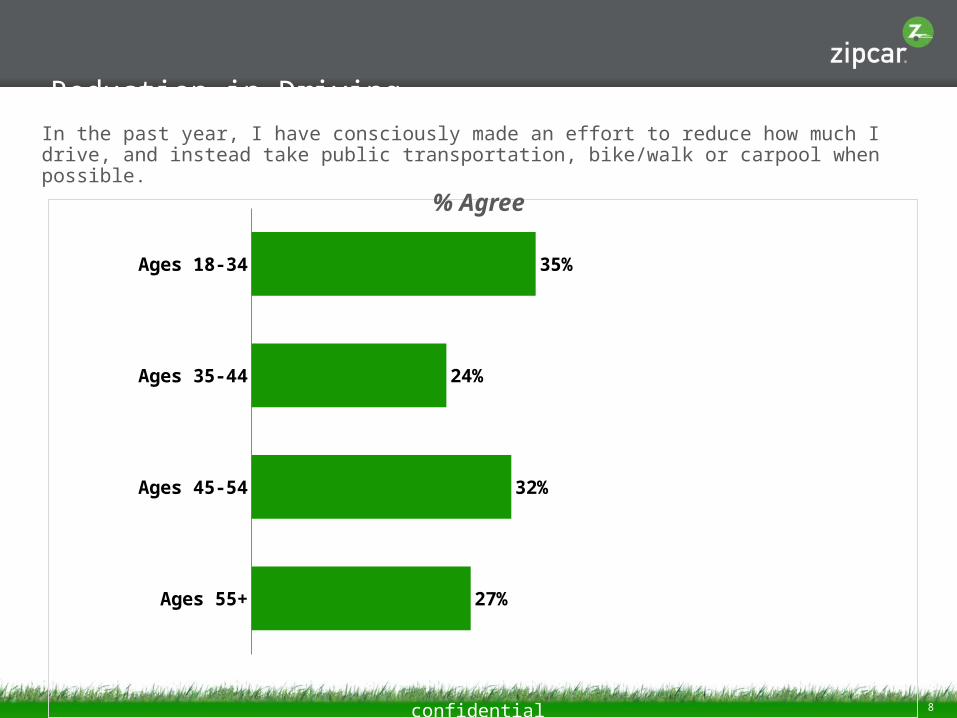
Reduction in DrivingIn the past year, I have consciously made an effort to reduce how much I drive, and instead take public transportation, bike/walk or carpool when possible.
Ages 18-34
Ages 35-44
Ages 45-54
Ages 55+
35%
24%
32%
27%
% Agree
9 confidential
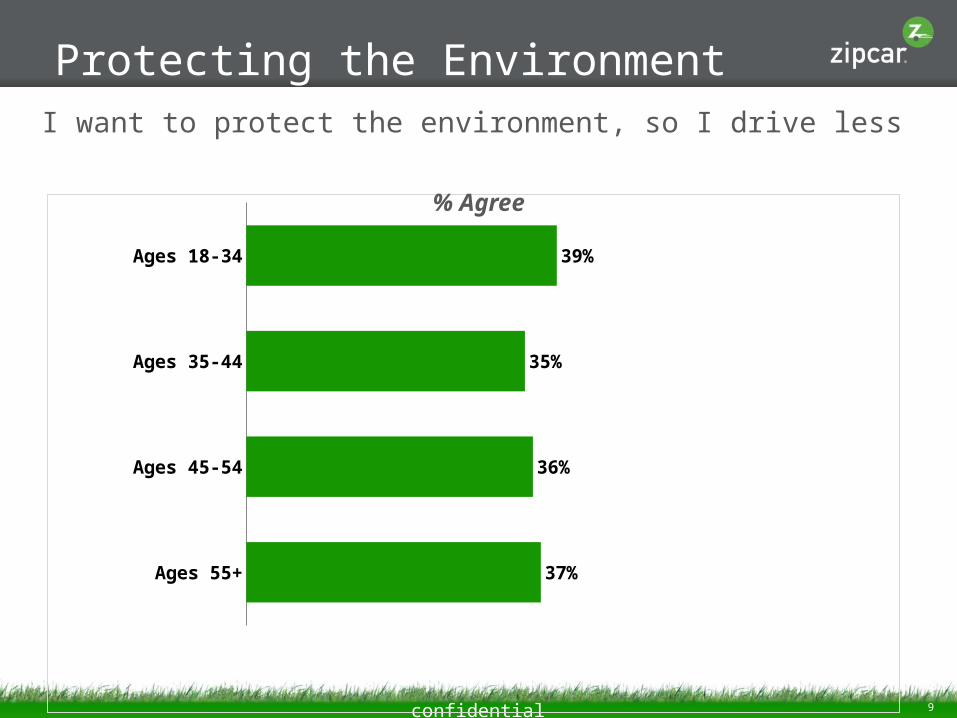
Protecting the EnvironmentI want to protect the environment, so I drive less
Ages 18-34
Ages 35-44
Ages 45-54
Ages 55+
39%
35%
36%
37%
% Agree
10 confidential
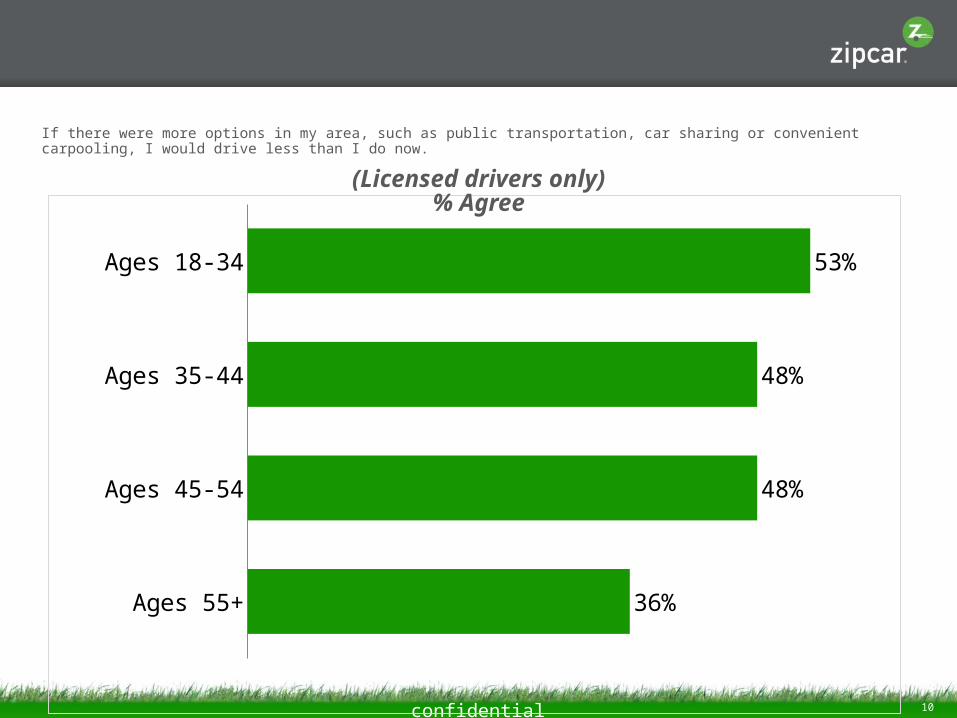
Transportation OptionsIf there were more options in my area, such as public transportation, car sharing or convenient carpooling, I would drive less than I do now.
Ages 18-34
Ages 35-44
Ages 45-54
Ages 55+
53%
48%
48%
36%
% Agree(Licensed drivers only)
11 confidential
In your daily routine, losing which piece of technology would have the greatest negative impact on you? Transportation AppsTo what extent does the availability of transportation apps (i.e. taxi apps, car rental reservations, public transportation info, car sharing, ride sharing, etc.) make it easier to live without owning a car?
% By age group% Reduced (NET)
24%
20%
23%
9%
Asked 2013
18-34 years old
35-44 years old
45-54 years old
55 years or older
9%
6%
12%
5%
11%
10%
5%
2%
4%
4%
6%
2%
Reduced a little bit Somewhat reduced Significantly reduced
12 confidential
Technology Wins AgainIn your daily routine, losing which piece of technology would have the greatest negative impact on you?
% By age group
55 years or more
45-54 years old
35-44 years old
18-34 years old
44%
49%
33%
26%
25%
24%
26%
25%
10%
14%
28%
39%
21%
12%
13%
10%
CarComputer/TabletTV Mobile phone
13 confidential
A New Way of SocializingWith access to social networking sites such as Facebook and Twitter, text messaging and online gaming, I sometimes choose to spend time with friends online instead of driving to see them.
Ages 18-34
Ages 35-44
Ages 45-54
Ages 55+
43%
46%
34%
24%
% Agree(Licensed drivers only)
Recommended