5/13/2015
1
MGMA Yellow BeltCertificate Program
1
TO: Medical Practice Leaders
2
Efficiency starts with you butdoes not come from you!
Objectives
To define Lean and Six Sigma
To review key tools used in implementing LSS and help identify what might work first
To drill into key tools to make LSS work
To challenge you to transition your practice in areas of efficiency, quality, and cost effectiveness
3
5/13/2015
2
Table of Contents
• Background
• Project Management
• Deployment Platform
• Tools
• Four case studies
• 20 question multiple choice exam
4
Culture defined . . .
• Culture in its broadest sense is cultivated behavior; that is the totality of a person's learned, accumulated experience which is socially transmitted, or more briefly, behavior through social learning.
• A culture is a way of life of a group of people--the behaviors, beliefs, values, and symbols that they accept, generally without thinking about them, and that are passed along by communication and imitation from one generation to the next.
5
Source: https://www.tamu.edu/faculty/choudhury/culture.html
Culture – 6 components
• Built on the vision – mission of the practice
• Built on the values
• Built on the “practices”
• Built on the people
• Built on the language used
• Built on the place
6
Source: http://blogs.hbr.org/2013/05/six-components-of-culture/
5/13/2015
3
Creative Culture of Transition
• Create an attitude that everyone needs to participate in changing the culture• Everyone has ideas that when brought out in the open will create the ultimate
outcome of improved care for each patient served in your office
• Know that when everyone works together there will be better results• The team is more effective in implementing change than one individual
• Openly talk about how things are done. • Who has the knowledge in areas that need to be fixed, let them take the lead in
changing how we’ve always done it!
• Change the “messages” or “notes” that have been hanging around desks and in the break area for months or years.
• Spruce up the work environment.
7
Culture of Transition
• Use symbols which can help remind you of a change in the way things are done or in an attitude. Toyota uses a rope (called Andon Cord) to “stop” the assembly line when something is wrong.
• Do a daily or weekly huddle, again open communication, but use this time to review what happened yesterday and what may be the bottle necks for the day ahead.
• Instead of donuts, try fruit for your morning snack!
• Share positive stories, successful events with patients
• Recognize each other with a friendly greeting in the morning, thank each other for a job well done, find ways to reinforce the behavior that you want and expect.
• Talk and think positive, it is easier to draw on strengths rather than remove barriers
8
Changing culture occurs first
AT THE TOP
9
5/13/2015
4
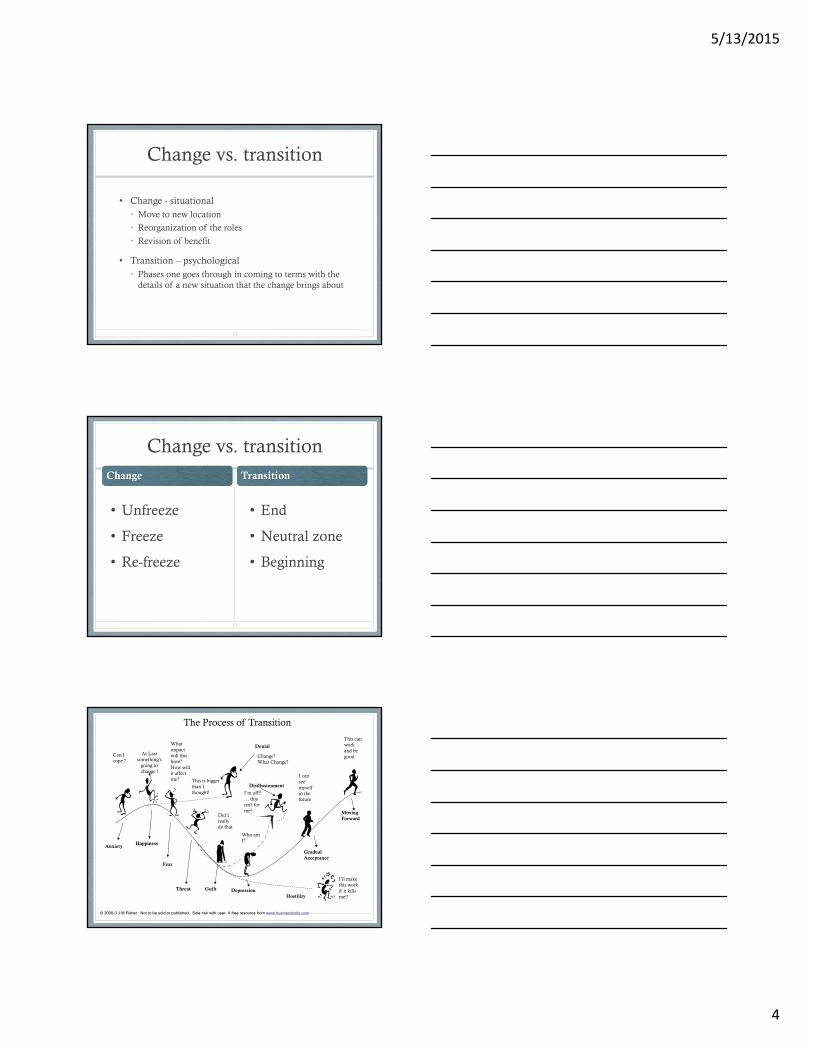
Change vs. transition
• Change - situational• Move to new location
• Reorganization of the roles
• Revision of benefit
• Transition – psychological• Phases one goes through in coming to terms with the
details of a new situation that the change brings about
10
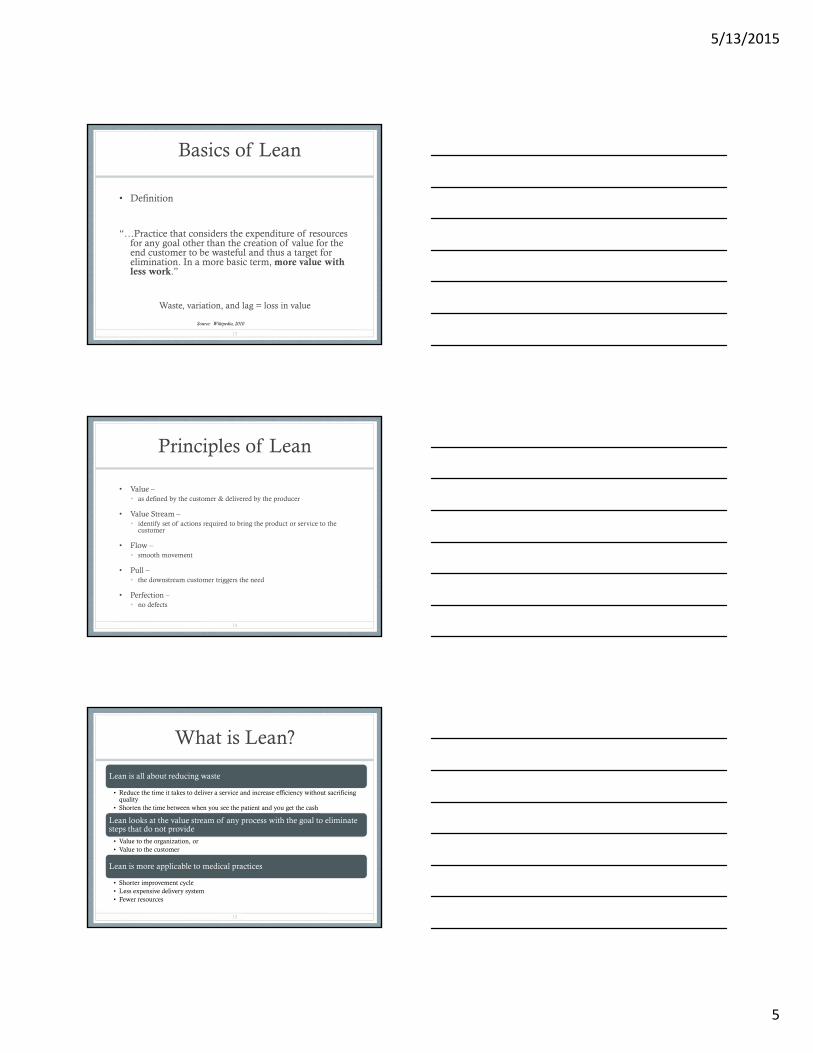
Change vs. transition
• Unfreeze
• Freeze
• Re-freeze
• End
• Neutral zone
• Beginning
11
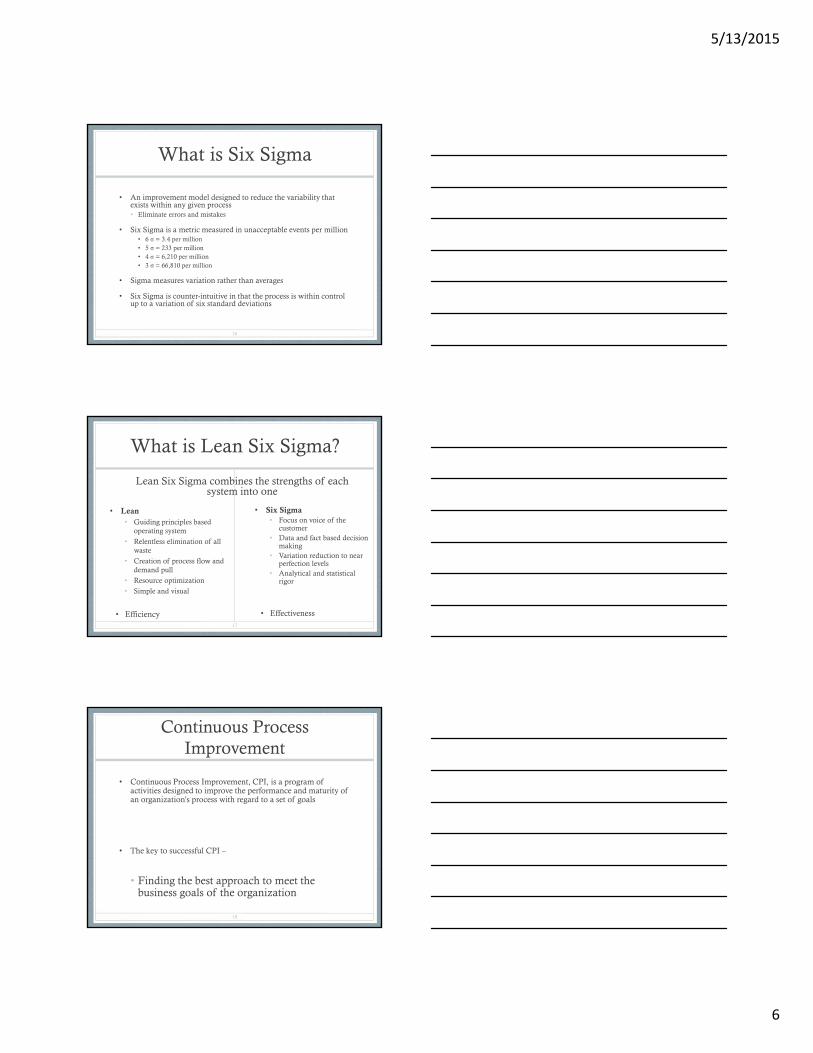
The Process of Transition
Anxiety
Can I cope ?
Happiness
At Last something’s
going to change !
Fear
What impact will this have?How will it affect me?
Threat
This is bigger than I thought!
Guilt
Did I really do that
Depression
Who am I?
Gradual Acceptance
I can see myself in the future
Moving Forward
This can work and be good
Hostility
I’ll make this work if it kills me!!
© 2000-3 J M Fisher. Not to be sold or published. Sole risk with user. A free resource from www.businessballs.com.
Denial
Change? What Change?
Disillusionment
I’m off!! … this isn’t for me!
12
5/13/2015
5
Basics of Lean
• Definition
“…Practice that considers the expenditure of resources for any goal other than the creation of value for the end customer to be wasteful and thus a target for elimination. In a more basic term, more value withless work.”
Waste, variation, and lag = loss in value
13
Source: Wikipedia, 2010
Principles of Lean
• Value –• as defined by the customer & delivered by the producer
• Value Stream –• identify set of actions required to bring the product or service to the
customer
• Flow –• smooth movement
• Pull –• the downstream customer triggers the need
• Perfection –• no defects
14
What is Lean?
Lean is all about reducing waste
• Reduce the time it takes to deliver a service and increase efficiency without sacrificing quality
• Shorten the time between when you see the patient and you get the cash
Lean looks at the value stream of any process with the goal to eliminate steps that do not provide
• Value to the organization, or• Value to the customer
Lean is more applicable to medical practices
• Shorter improvement cycle• Less expensive delivery system• Fewer resources
15
5/13/2015
6
What is Six Sigma
• An improvement model designed to reduce the variability that exists within any given process• Eliminate errors and mistakes
• Six Sigma is a metric measured in unacceptable events per million• 6 σ = 3.4 per million• 5 σ = 233 per million• 4 σ = 6,210 per million• 3 σ = 66,810 per million
• Sigma measures variation rather than averages
• Six Sigma is counter-intuitive in that the process is within control up to a variation of six standard deviations
16
What is Lean Six Sigma?
Lean Six Sigma combines the strengths of each system into one
• Lean • Guiding principles based
operating system
• Relentless elimination of all waste
• Creation of process flow and demand pull
• Resource optimization
• Simple and visual
• Efficiency
• Six Sigma• Focus on voice of the
customer• Data and fact based decision
making• Variation reduction to near
perfection levels • Analytical and statistical
rigor
• Effectiveness17
Continuous Process Improvement
• Continuous Process Improvement, CPI, is a program of activities designed to improve the performance and maturity of an organization’s process with regard to a set of goals
• The key to successful CPI –
• Finding the best approach to meet the business goals of the organization
18
5/13/2015
7
CPI Begins with Benchmarking
Current state or condition of operational components
PMS and other IT systems
Find and review MCO contracts
Accounting system and financial performance benchmarks
Patient Capacity (Maximum, minimum, excess, over, etc.)
Cycle Time
HR policies and practices
Value stream efficiencies
19
Waste (Downtime) (muda)
• Defects
• Overproduction
• Waiting
• Not using Talent
• Transport
• Inventory
• Motion
• Extra processing
20
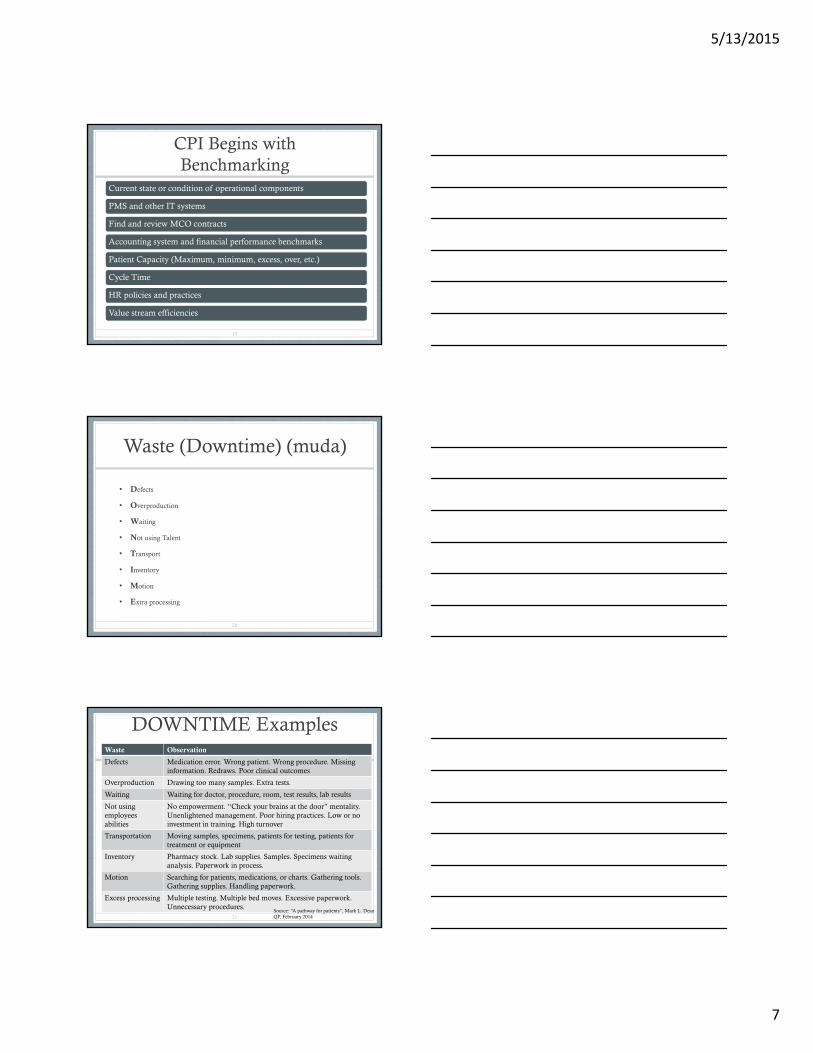
DOWNTIME ExamplesWaste Observation
Defects Medication error. Wrong patient. Wrong procedure. Missing information. Redraws. Poor clinical outcomes
Overproduction Drawing too many samples. Extra tests.
Waiting Waiting for doctor, procedure, room, test results, lab results
Not using employees abilities
No empowerment. “Check your brains at the door” mentality. Unenlightened management. Poor hiring practices. Low or no investment in training. High turnover
Transportation Moving samples, specimens, patients for testing, patients for treatment or equipment
Inventory Pharmacy stock. Lab supplies. Samples. Specimens waiting analysis. Paperwork in process.
Motion Searching for patients, medications, or charts. Gathering tools. Gathering supplies. Handling paperwork.
Excess processing Multiple testing. Multiple bed moves. Excessive paperwork. Unnecessary procedures.
21Source: “A pathway for patients”, Mark L. DeanQP, February 2014
5/13/2015
8
Deployment PlatformsDefine – Measure – Analyze – Improve – Control
Plan – Do – Study – Act
22
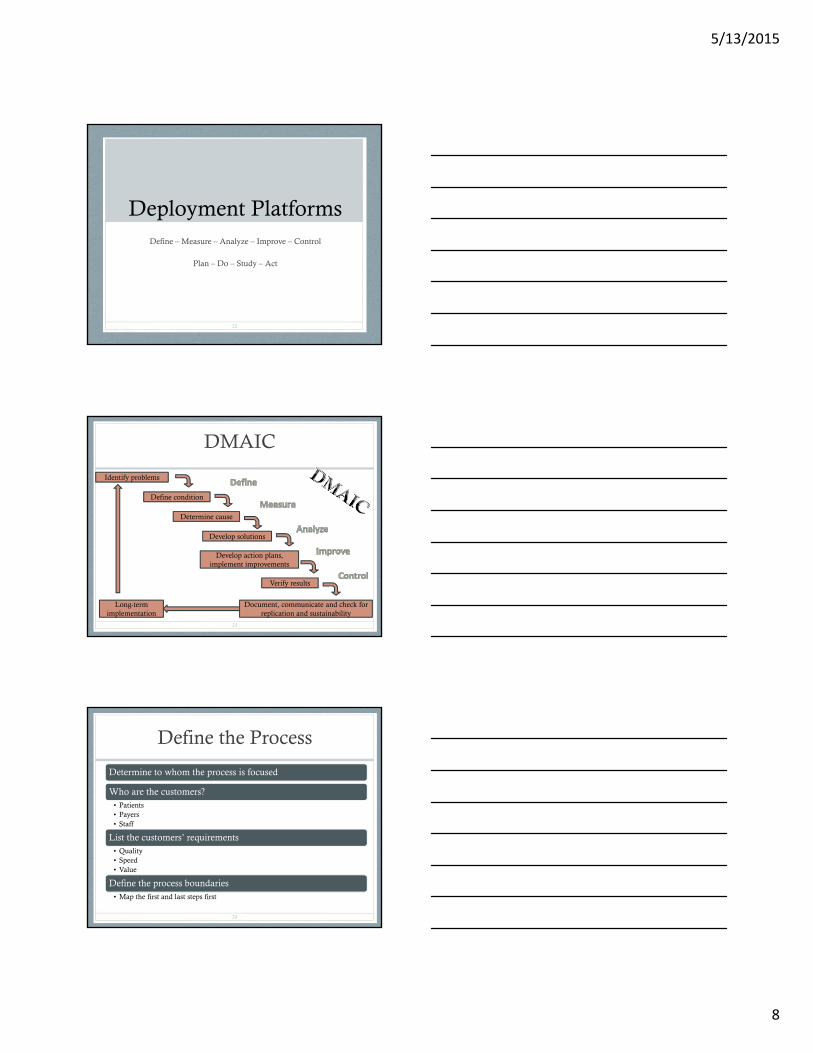
DMAIC
23
Document, communicate and check for replication and sustainability
Long-term implementation
Verify results
Develop action plans, implement improvements
Develop solutions
Determine cause
Define condition
Identify problems
Define the Process
Determine to whom the process is focused
Who are the customers?• Patients• Payers• Staff
List the customers’ requirements• Quality• Speed• Value
Define the process boundaries• Map the first and last steps first
24

5/13/2015
9
Measure - Collect the Data
Know ahead of time what data you need vs. what data you can collect
For primary research, create a design for the experiment
• This is particularly prevalent with cycle time studies
Look for existing studies
Identify specialists within (and outside of) your organization that may be necessary to assist you
• IT support• PMS support
Have a written data collection plan
• Includes the ‘what’ and ‘where’ and ‘who’25
Analyze the Data
Separate useful from fun-to-know data
Use analytical tools and statistical methods to conduct the analysis
Look for variability and conduct root-cause analyses to understand the underlying conditions
The key is accountability
• Someone within the organization should be able to explain, in understandable language, the reason for every significant variation.
26
Improve the Process
Use the information from the VSM and analysis phase to recommend process improvements
Develop future state maps with the improvements embedded and compare to current state maps
Include contingencies associated to risk analysis
27
5/13/2015
10
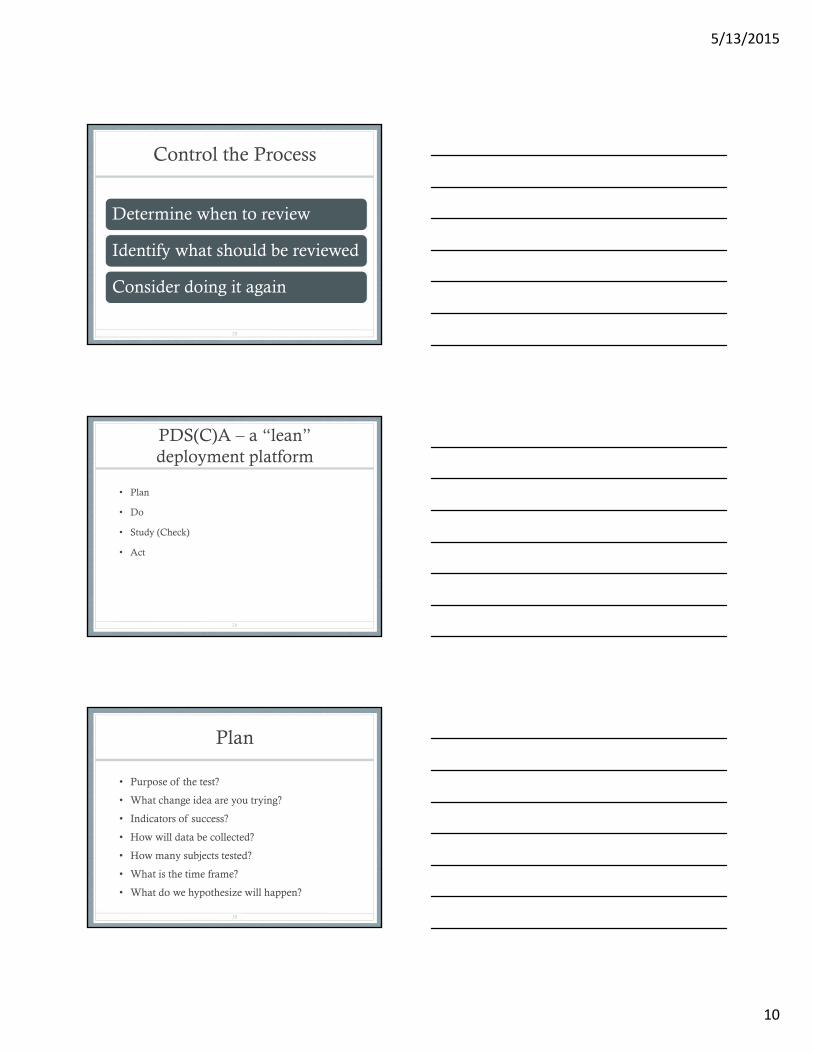
Control the Process
Determine when to review
Identify what should be reviewed
Consider doing it again
28
PDS(C)A – a “lean” deployment platform
• Plan
• Do
• Study (Check)
• Act
29
Plan
• Purpose of the test?
• What change idea are you trying?
• Indicators of success?
• How will data be collected?
• How many subjects tested?
• What is the time frame?
• What do we hypothesize will happen?
30
5/13/2015
11
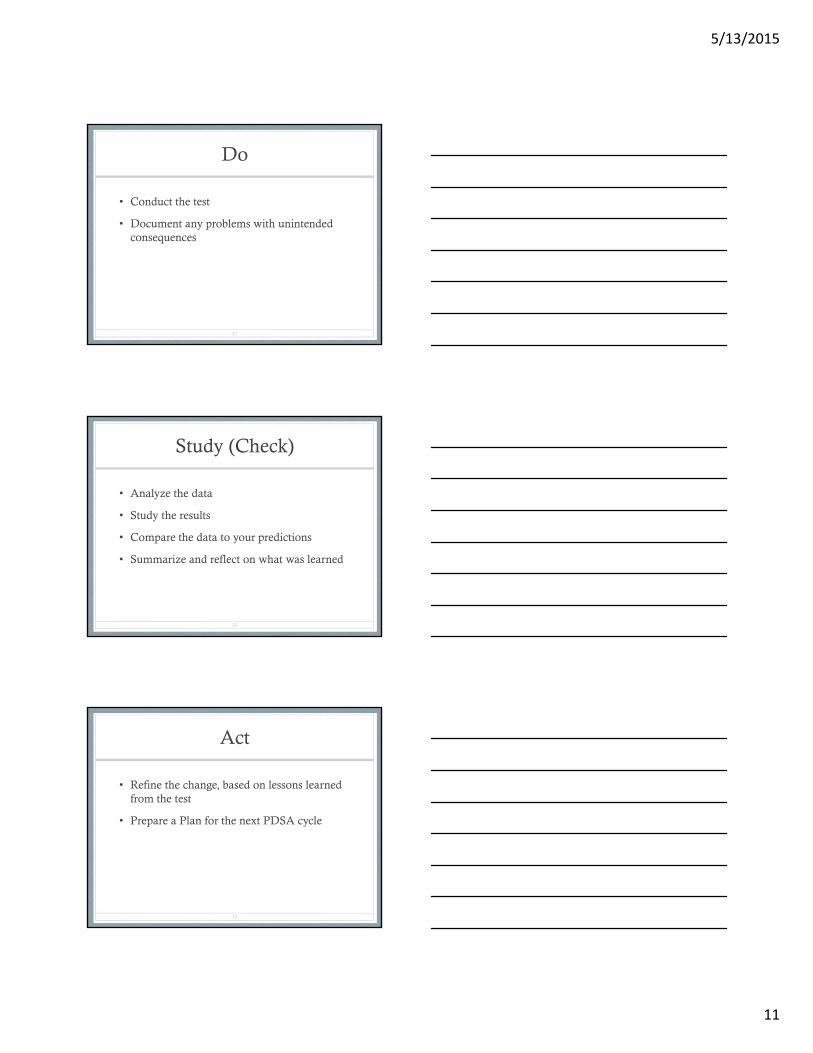
Do
• Conduct the test
• Document any problems with unintended consequences
31
Study (Check)
• Analyze the data
• Study the results
• Compare the data to your predictions
• Summarize and reflect on what was learned
32
Act
• Refine the change, based on lessons learned from the test
• Prepare a Plan for the next PDSA cycle
33
5/13/2015
12
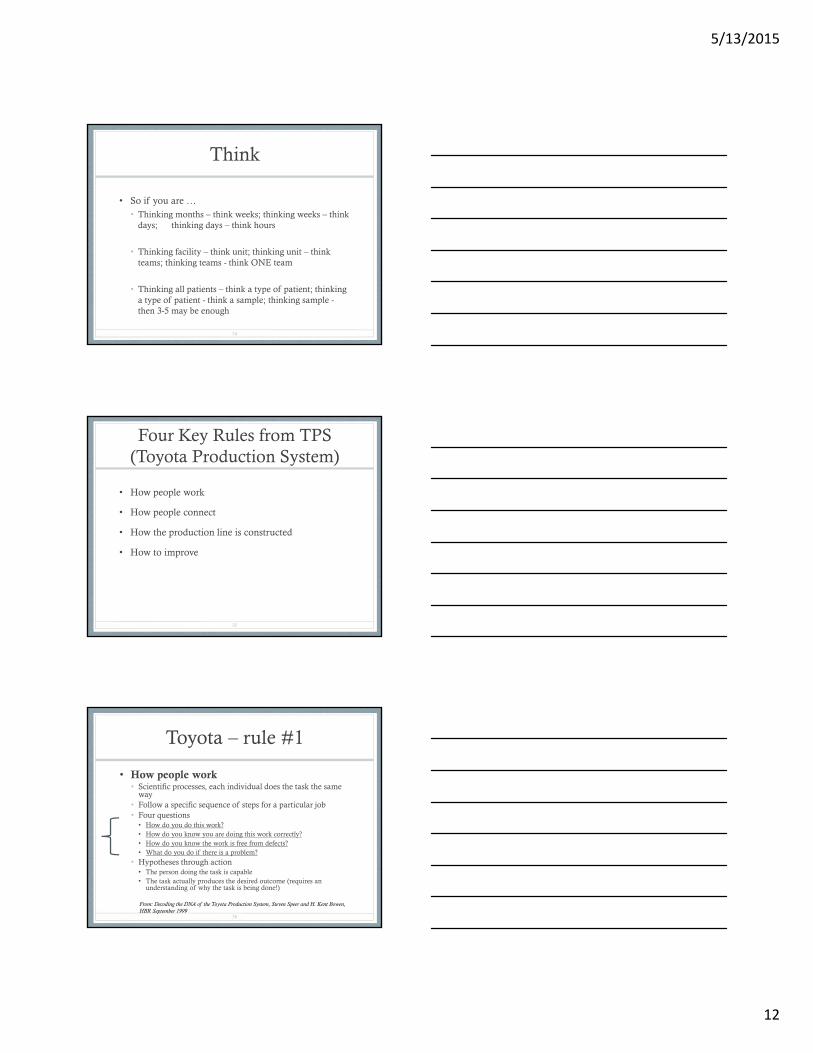
Think
• So if you are … • Thinking months – think weeks; thinking weeks – think
days; thinking days – think hours
• Thinking facility – think unit; thinking unit – think teams; thinking teams - think ONE team
• Thinking all patients – think a type of patient; thinking a type of patient - think a sample; thinking sample -then 3-5 may be enough
34
Four Key Rules from TPS(Toyota Production System)
• How people work
• How people connect
• How the production line is constructed
• How to improve
35
Toyota – rule #1
• How people work• Scientific processes, each individual does the task the same
way• Follow a specific sequence of steps for a particular job• Four questions
• How do you do this work?• How do you know you are doing this work correctly?• How do you know the work is free from defects?• What do you do if there is a problem?
• Hypotheses through action• The person doing the task is capable• The task actually produces the desired outcome (requires an
understanding of why the task is being done!)
36
From: Decoding the DNA of the Toyota Production System, Steven Speer and H. Kent Bowen, HBR September 1999

5/13/2015
13
Rule #2
• How people connect• Supplier customer relationship between each
person• Connection as smooth as the Olympic relay
team• Specific tasks done by specific people, expected and
understood by all that are in the process• When problems arise, there is knowledge of who
to ask for help• The help is timely and responsive
37
Rule #3
• How the production line is constructed• Simple and specific• Services flow to a specific person, e.g.,
Jane, MA to Smith, MD
38
Rule #4
• How to improve• To make changes, staff must know how to change and
who is responsible for making the change• Staff is taught problem solving skills by redesigning their
own work• Staff is trained to frame problems better and to formulate
and test hypotheses• Teams are created to include those directly affected and
with the person responsible for supervising the pathway involved
• State clearly the expected change (outcome) when the plan is implemented
39

5/13/2015
14
The ideal output
• Is it defect free
• Can be delivered one request at a time
• Can be supplied on demand in the version requested
• Can be delivered immediately
• Can be produced without wasting any materials, labor, energy, or resources
• Can be produced in a work environment that is safe physically, emotionally and professionally for every employee
40
From: Decoding the DNA of the Toyota Production System, Steven Speer and H. Kent Bowen, HBR September 1999
What is a project? (Beginning & End)
Any temporary, organized effort that creates a unique product, service, process or plan
Projects bring together people from a wide range of jobs and provides them with the opportunity to collaborate in a unique way
41
Project Management
• Application of specific knowledge, skills, tools, and techniques to project activities
• A discipline that balances• Time, cost, and quality
• Expectations
• Identified needs
• Unidentified needs
42
5/13/2015
15
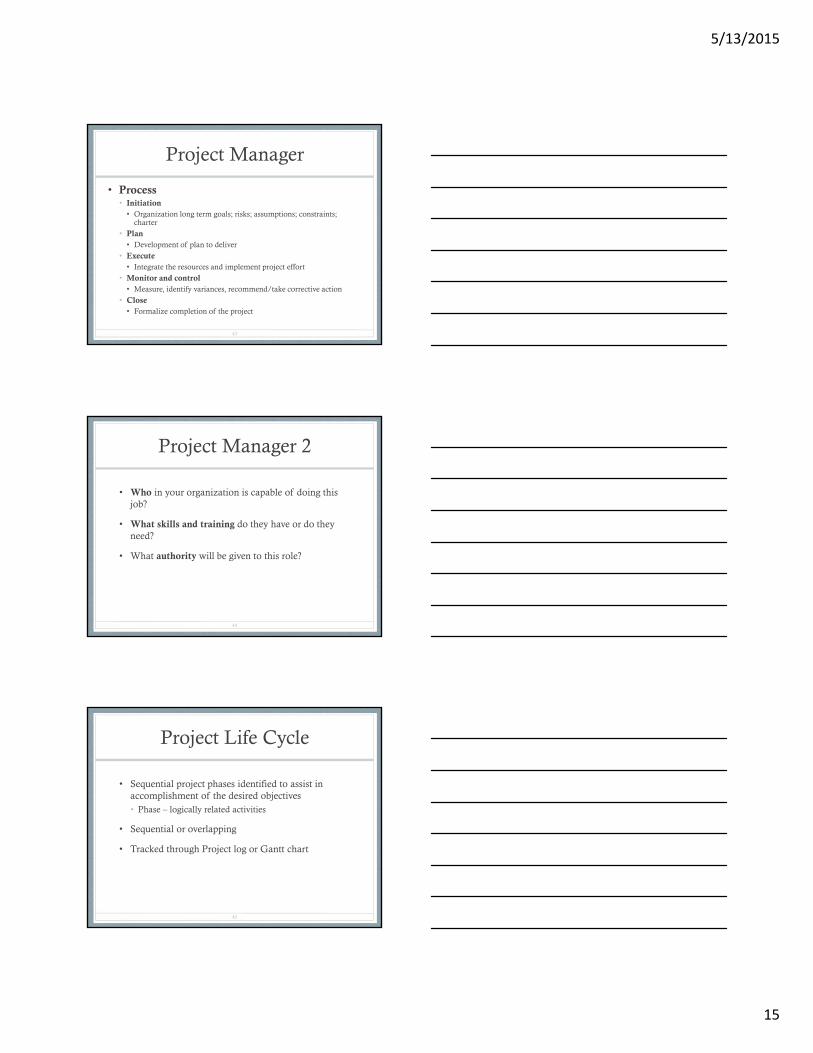
Project Manager
• Process• Initiation
• Organization long term goals; risks; assumptions; constraints; charter
• Plan
• Development of plan to deliver
• Execute• Integrate the resources and implement project effort
• Monitor and control• Measure, identify variances, recommend/take corrective action
• Close • Formalize completion of the project
43
Project Manager 2
• Who in your organization is capable of doing this job?
• What skills and training do they have or do they need?
• What authority will be given to this role?
44
Project Life Cycle
• Sequential project phases identified to assist in accomplishment of the desired objectives• Phase – logically related activities
• Sequential or overlapping
• Tracked through Project log or Gantt chart
45

5/13/2015
16
Voice of the Customer
• Think price
• What is our price (does price have to be in $$$$?)• High deductible
• Wait time
• Time to get appointment
• Reputation
• Friendly staff
46
Customer Segmentation
• All patients are not the same
• Identify groups and sub groups to care for
• Economic• Revenue, loyalty, frequency, services
• Descriptive• Geography, age, gender
• Attitudinal• Price, value, service
47
Meet customer expectations
• Service MUST meet customer expectation requirements
• Must understand the customer expectation
48
V = R - EV = Value (quality)R = ResultsE - Expectations
5/13/2015
17
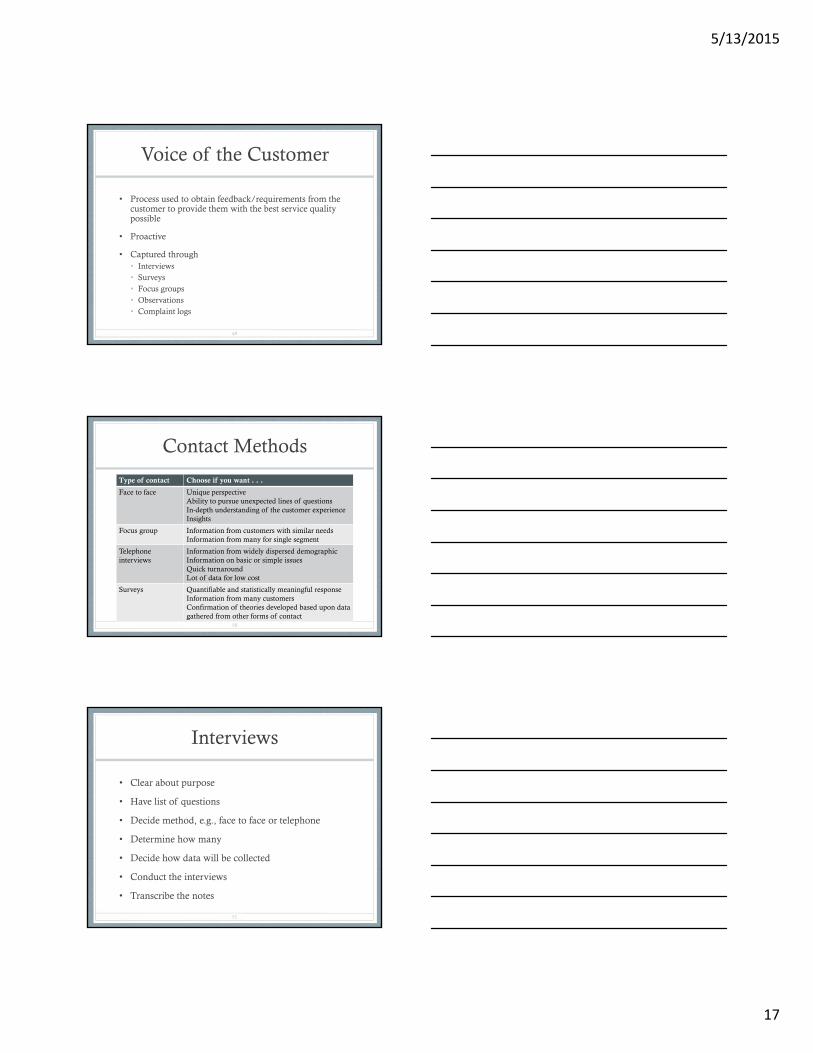
Voice of the Customer
• Process used to obtain feedback/requirements from the customer to provide them with the best service quality possible
• Proactive
• Captured through• Interviews• Surveys• Focus groups• Observations• Complaint logs
49
Contact Methods
Type of contact Choose if you want . . .
Face to face Unique perspectiveAbility to pursue unexpected lines of questionsIn-depth understanding of the customer experienceInsights
Focus group Information from customers with similar needsInformation from many for single segment
Telephone interviews
Information from widely dispersed demographicInformation on basic or simple issuesQuick turnaroundLot of data for low cost
Surveys Quantifiable and statistically meaningful responseInformation from many customersConfirmation of theories developed based upon data gathered from other forms of contact
50
Interviews
• Clear about purpose
• Have list of questions
• Decide method, e.g., face to face or telephone
• Determine how many
• Decide how data will be collected
• Conduct the interviews
• Transcribe the notes
51
5/13/2015
18
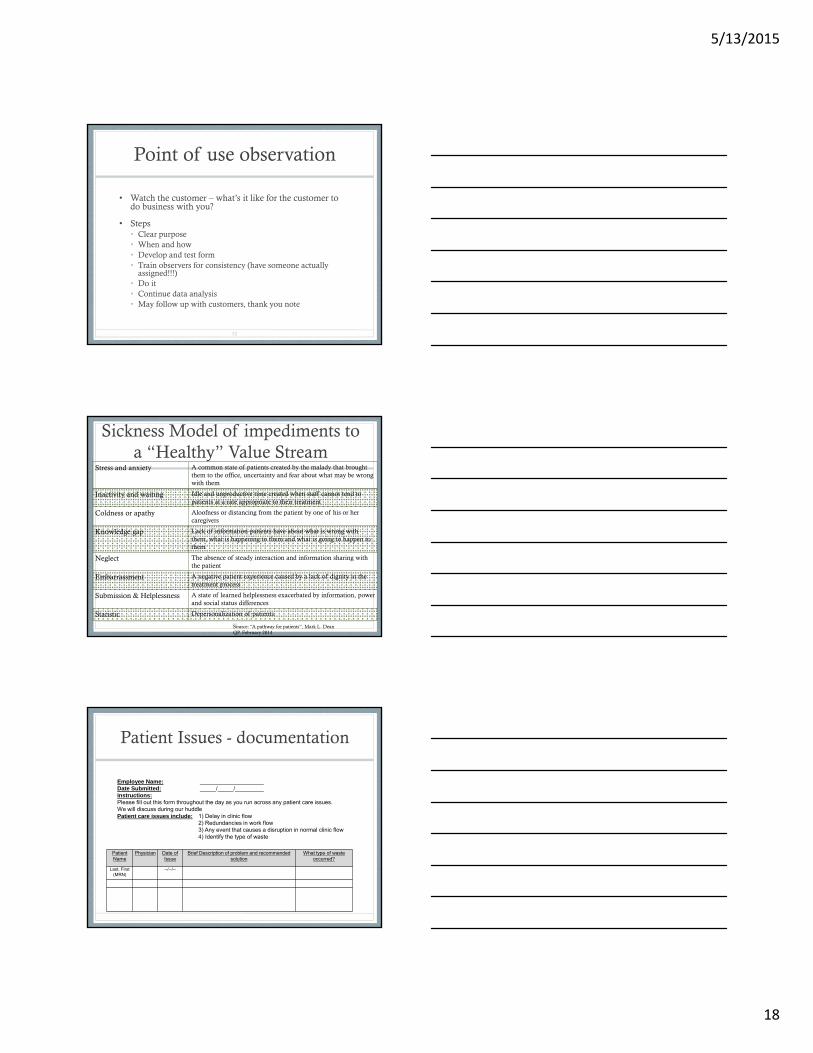
Point of use observation
• Watch the customer – what’s it like for the customer to do business with you?
• Steps• Clear purpose• When and how• Develop and test form• Train observers for consistency (have someone actually
assigned!!!)• Do it• Continue data analysis• May follow up with customers, thank you note
52
Sickness Model of impediments to a “Healthy” Value Stream
Stress and anxiety A common state of patients created by the malady that brought them to the office, uncertainty and fear about what may be wrong with them
Inactivity and waiting Idle and unproductive time created when staff cannot tend to patients at a rate appropriate to their treatment
Coldness or apathy Aloofness or distancing from the patient by one of his or her caregivers
Knowledge gap Lack of information patients have about what is wrong with them, what is happening to them and what is going to happen to them
Neglect The absence of steady interaction and information sharing with the patient
Embarrassment A negative patient experience caused by a lack of dignity in the treatment process
Submission & Helplessness A state of learned helplessness exacerbated by information, power and social status differences
Statistic Depersonalization of patients.
53Source: “A pathway for patients”, Mark L. DeanQP, February 2014
Patient Issues - documentation
Patient Name
Physician Date of Issue
Brief Description of problem and recommended solution
What type of waste occurred?
Last, First (MRN)
--/--/--
Employee Name: ____________________Date Submitted: _____/_____/_________Instructions:Please fill out this form throughout the day as you run across any patient care issues. We will discuss during our huddle Patient care issues include: 1) Delay in clinic flow
2) Redundancies in work flow3) Any event that causes a disruption in normal clinic flow 4) Identify the type of waste
5/13/2015
19
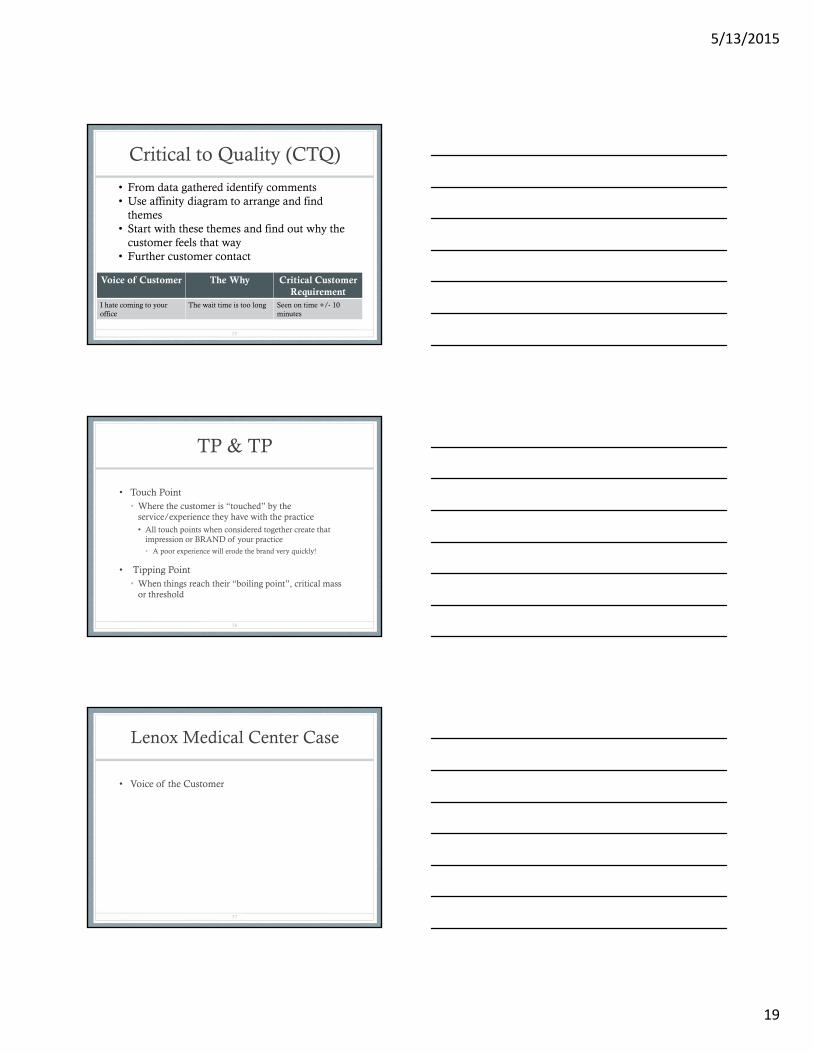
Critical to Quality (CTQ)
Voice of Customer The Why Critical Customer Requirement
I hate coming to youroffice
The wait time is too long Seen on time +/- 10 minutes
55
• From data gathered identify comments• Use affinity diagram to arrange and find
themes• Start with these themes and find out why the
customer feels that way• Further customer contact
TP & TP
• Touch Point• Where the customer is “touched” by the
service/experience they have with the practice• All touch points when considered together create that
impression or BRAND of your practice• A poor experience will erode the brand very quickly!
• Tipping Point• When things reach their “boiling point”, critical mass
or threshold
56
Lenox Medical Center Case
• Voice of the Customer
57
5/13/2015
20
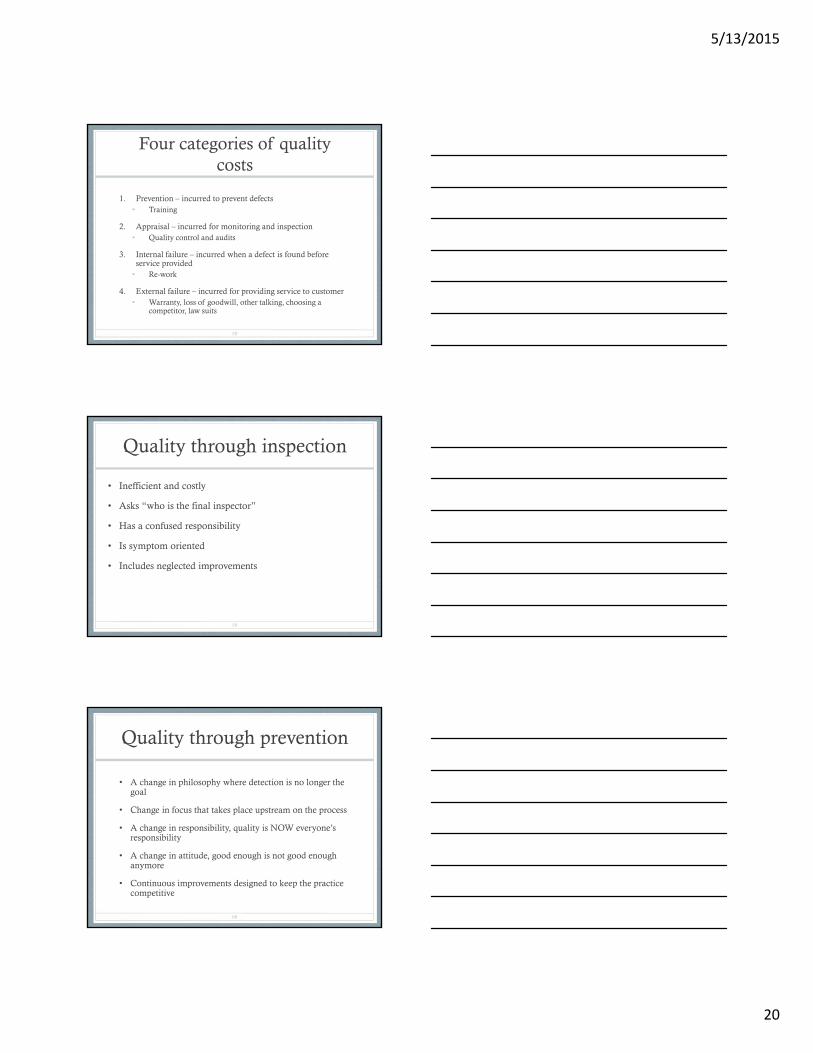
Four categories of quality costs
1. Prevention – incurred to prevent defects• Training
2. Appraisal – incurred for monitoring and inspection• Quality control and audits
3. Internal failure – incurred when a defect is found before service provided
• Re-work
4. External failure – incurred for providing service to customer• Warranty, loss of goodwill, other talking, choosing a
competitor, law suits
58
Quality through inspection
• Inefficient and costly
• Asks “who is the final inspector”
• Has a confused responsibility
• Is symptom oriented
• Includes neglected improvements
59
Quality through prevention
• A change in philosophy where detection is no longer the goal
• Change in focus that takes place upstream on the process
• A change in responsibility, quality is NOW everyone’s responsibility
• A change in attitude, good enough is not good enough anymore
• Continuous improvements designed to keep the practice competitive
60
5/13/2015
21
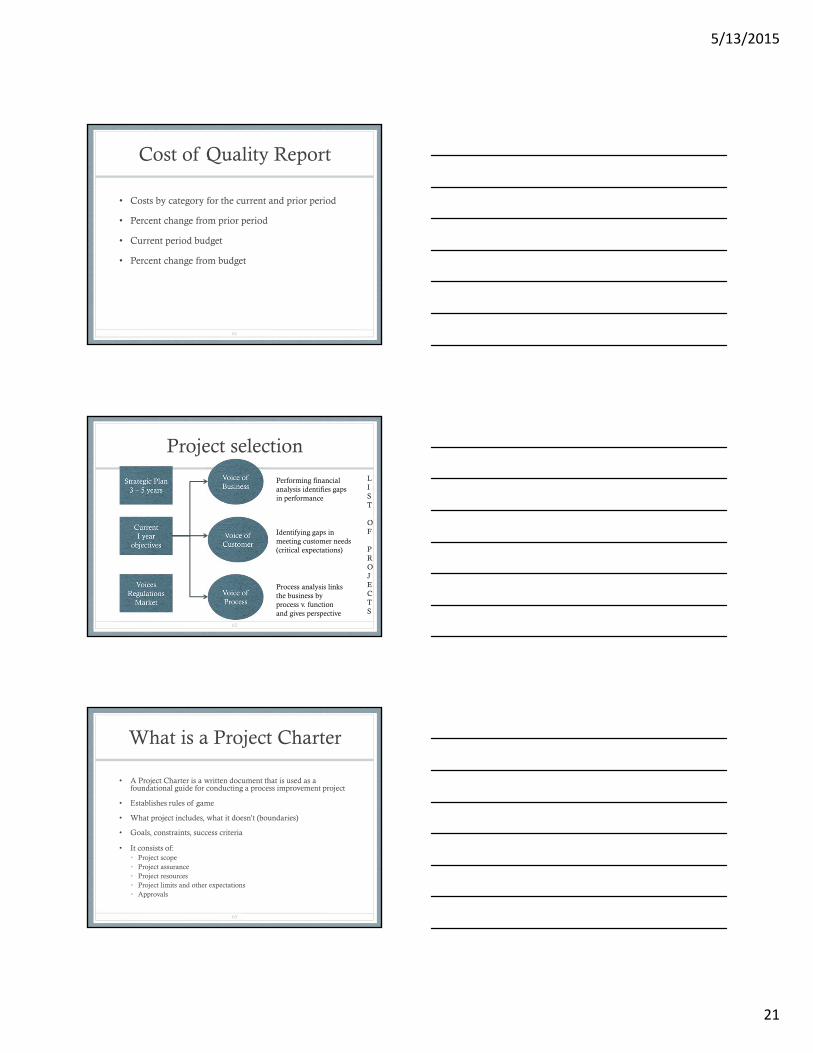
Cost of Quality Report
• Costs by category for the current and prior period
• Percent change from prior period
• Current period budget
• Percent change from budget
61
Project selection
62
Performing financialanalysis identifies gapsin performance
Identifying gaps in meeting customer needs(critical expectations)
Process analysis linksthe business byprocess v. function and gives perspective
LIST
OF
PROJECTS
What is a Project Charter
• A Project Charter is a written document that is used as a foundational guide for conducting a process improvement project
• Establishes rules of game
• What project includes, what it doesn’t (boundaries)
• Goals, constraints, success criteria
• It consists of:• Project scope• Project assurance• Project resources• Project limits and other expectations• Approvals
63
5/13/2015
22
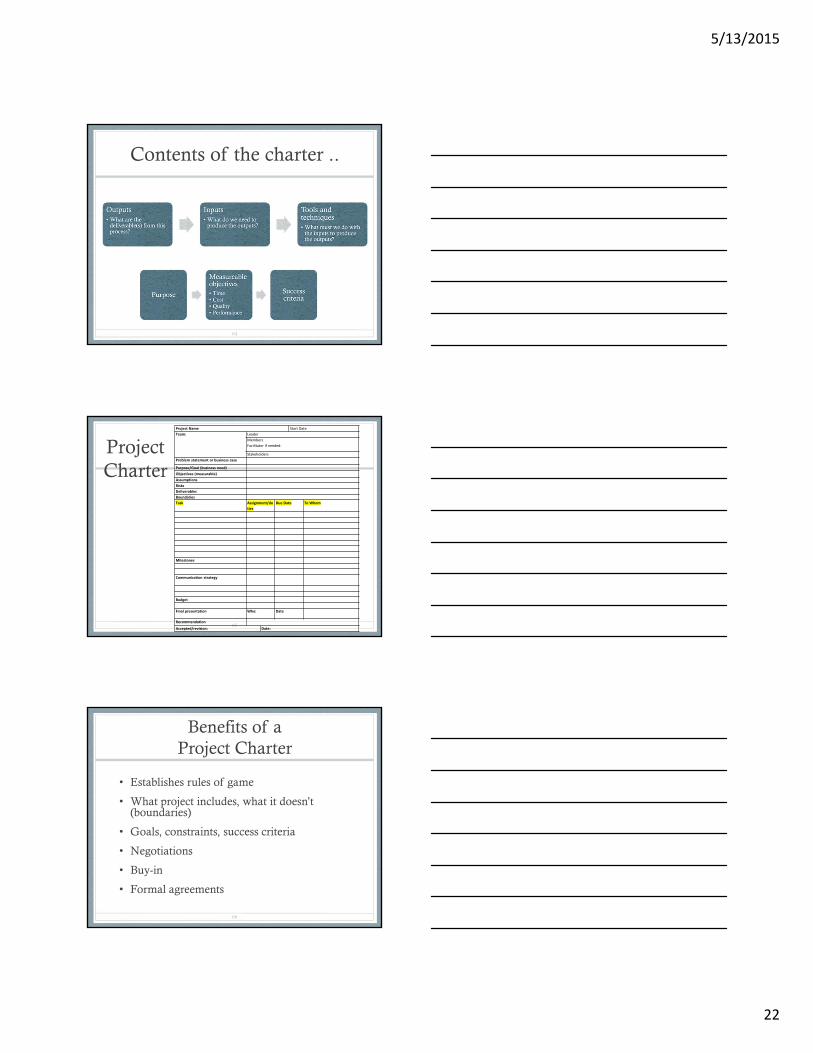
Contents of the charter ..
64
Project Charter
65
Project Name Start Date
Team: Leader
Members
Facilitator if needed:
Stakeholders
Problem statement or business case
Purpose/Goal (business need)
Objectives (measurable)
Assumptions
Risks
Deliverables
Boundaries
Task Assignment/du
ties
Due Date To Whom
Milestones
Communication strategy
Budget
Final presentation Who: Date
Recommendation
Accepted/revision: Date:
Benefits of a Project Charter
• Establishes rules of game
• What project includes, what it doesn’t (boundaries)
• Goals, constraints, success criteria
• Negotiations
• Buy-in
• Formal agreements
66
5/13/2015
23
Business Case
• Market demand
• Organizational need
• Customer request
• Technology advance
• Legal requirements
• Ecological need
• Social need
67
A Good Project Charter
• Describe issues or situation motivating the project
• Describe the objective (outcome) of the project
• Identify the customers (patients, staff, payers, etc.)
• Stipulate boundaries (specific targets and/or goals)
• Estimate financial impact
• Define what the final deliverable will look like
68
Changes may occur …. later
• Assess the value of the change
• Assess the impact of the change
• Maintain integrity of baseline and original thoughts
• Ensure that only APPROVED changes are implemented
• Coordinate changes across all aspects of the project
• Communicating the changes
69

5/13/2015
24
VA vs. BVA vs. NVA
• Value Add• Any step or activity that transforms the form, fit, or
function of the product or service for which the “customer” is willing to pay
• Business value add• Necessary to support but not directly related to the
customer
• Non-value Add• Waste in the process
70
Question
• Is a low bank balance a problem?
• Symptom?
• Poor financial planning?
• Inadequate systems to manage revenue cycle?
71
Define
• The problem or what are we improving• Scope• Business case• The customer• The sponsor• Current state
• Customer value• What matters• What priorities
• The vision • Future state• Strategy
72
5/13/2015
25
Define – key steps
• Review project charter
• Validate the problem statement and goals
• Validate the financial benefits
• Create/validate the process map current state and scope of project
• Create communication plan
• Develop the project plan based upon the above
73
Key time for project charter
• Problem statement• When, what, magnitude, and impact or consequence
• Key stakeholders – who
• Business case
• Goal statement
• Verification of project scope
• Project plan
• Team members - key
74
Team Member Selection
Who selects the team?
What is the purpose of the project?• Single issues may only require small, focused team• Multi-issue may require process owners and management• Complex project may require cross-disciplinary members
Always include process owners
Each member needs to contribute in some fashion• Skills, technology, experience, facilitation, etc.
Each team member needs to share the goal
75
5/13/2015
26
Team Objectives
The primary purpose of a team is to provide the organization with an efficient and effective model of process improvement and problem resolution
A properly functioning team will:
• Improve employee morale• Develop creative skills of members• Improve relationships and communication• Build problem solving skills and techniques• Demonstrate to management that employees have good ideas
76
Characteristics of an effective team
Clear sense of vision
Cohesive
Understand team interdependencies
Enthusiasm
Support each other
Developed level of trust
77
Project Management team . .
• The process of tracking team member performance, providing feedback, resolving issues, and managing changes to optimize project performance.
78
Source: Guide to Project Management Body of Knowledge

5/13/2015
27
Team Roles
Champions
Facilitator
Team leader
Process owners
Inside subject experts
Outside subject experts
The recorder
79
Stakeholder
• Sponsor who is actively involved in the project OR whose interests may be positively or negatively affected by the project
• Exert influence on the project
80
Team Champions
• Upper level managers that control and allocate resources
• Team champions should be trained in process improvement techniques and strategies
• Team champions are (should be) there to lend support and encouragement from the organizations upper management• Sometimes, they are just spies and may jeopardize the
benefit of group dynamics
• They are normally involved in all reviews pertaining to project milestones
81
5/13/2015
28
Team Facilitator
• Perhaps the most important member of the team because . . . they are not really members
• The facilitator is normally someone from outside the team structure• From a different department• Outside the company (consultant)
• Should be trained in team structure and group dynamics• Forming, storming, norming and performing
82
The Team Leader
• Can be the facilitator, also, but not near as effective
• The team leader should:• Provide direction and suggest assignments• Act as a liaison to management• Handle administrative duties, i.e., meeting site and
scheduling• Enforce meeting rules and regulations (sergeant at arms)• Work with and not over (or against) members
• The leader should be more of an encourager than a boss
• The role of the team leader will diminish as the team becomes more self-directed
83
The Process Owner
• A process owner is someone who is an expert regarding the process being reviewed and/or studied
• The process owner should:• Know the process inside and out• Be able to assist with process and value stream mapping• Have a good understanding of process improvement techniques• Support team’s missions and goals
• Process owners may or may not be in management positions• billing manager vs. biller• office manager vs. front office staff
84
5/13/2015
29
Subject Matter Experts --SME
• Different from the process owners, these are people who offer an expertise in a particular technical area• IT, data analysis, statistics, clinical, CPC, technology, etc.
• Subject experts can be internal, external or both• External experts can provide new and unique perspectives
• Be careful regarding their ability to communicate effectively and work within a group environment• The ‘geek’ factor
85
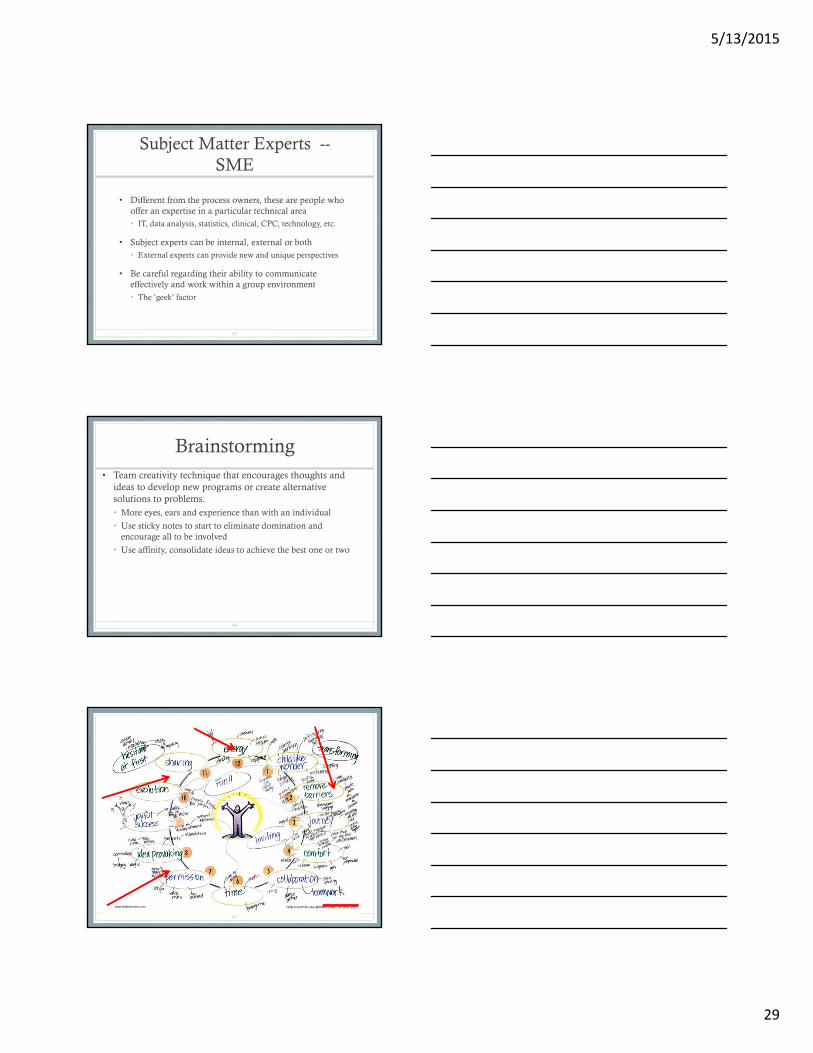
Brainstorming• Team creativity technique that encourages thoughts and
ideas to develop new programs or create alternative solutions to problems.• More eyes, ears and experience than with an individual
• Use sticky notes to start to eliminate domination and encourage all to be involved
• Use affinity, consolidate ideas to achieve the best one or two
86
87
5/13/2015
30
Communication
88
• Selects media and content• Prepares the message• Controls the environment• Sends the information• Solicits feedback
• Keeps focused on the process
• Listens, reads, & observes• Provides feedback, content,
effect
Receiver’s memory retention
• 50% now
• 25% in two days
• 10% after a week
• 10% of what we hear
• 15% of what we see and hear
• 40% of what we discuss
• 80% of what we experience
• 90% of what we teach others
89
Media
• Writing
• Speaking
• Non-verbal
• Pictures
• Experience
• Combination
• Factors leading to your choice:• Speed• Technology• Utilization• Cost
90
5/13/2015
31
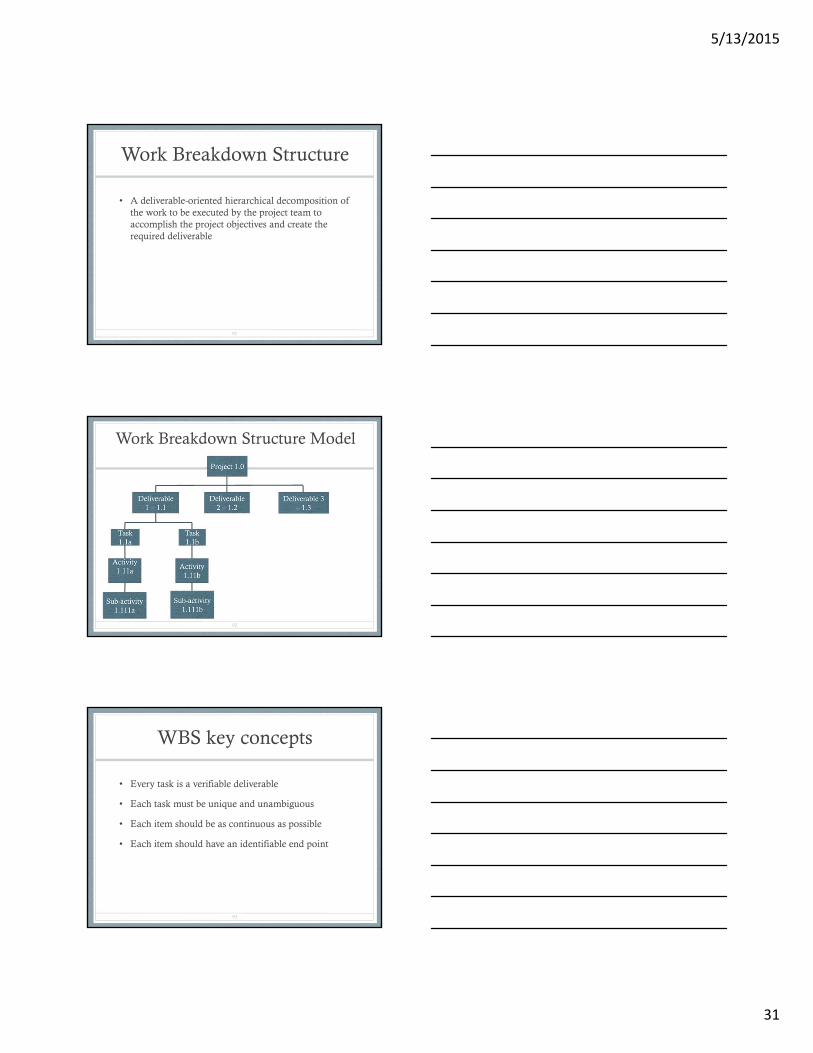
Work Breakdown Structure
• A deliverable-oriented hierarchical decomposition of the work to be executed by the project team to accomplish the project objectives and create the required deliverable
91
Work Breakdown Structure Model
92
WBS key concepts
• Every task is a verifiable deliverable
• Each task must be unique and unambiguous
• Each item should be as continuous as possible
• Each item should have an identifiable end point
93
5/13/2015
32
Define - deliverables
• Completed project charter
• Document – customers affected by the project either current or future
• High level process map
• Completed project plan
• Consensus of team related to the outcomes expected from the project (hypotheses)
94
Spring Hills Clinic Case
• Define the key problem
95
JUMPING TO CONCLUSIONS
96 DUCK TAPEBAND-AID FIXES
5/13/2015
33
Measure
• Develop a thorough understanding of the current state and collect reliable data on the process itself –time, quality and cost that identify the problem current state
• Need benchmark – baseline (current state)
• Need hypothesis (targeted future state)
97
Factors to consider
• Time to order, transport, receive, etc.
• Room (area) change over
• Lead times
• Maintenance downtime
• Schedule demands
• Quality levels
• Process cycle times
• Constraints or bottlenecks
98
Data Collection
• Continuous• Variable measured on a continuum
• Discrete• Count
• Binary – has only two values, e.g., yes/no
• Attribute – Nominal – simple names or labels, no reason to arrange in any order
• Attribute – Ordinal – names or labels have some inherent value, e.g., excellent, very good, good, fair, poor
99

5/13/2015
34
X and Y
• X = process or input measures • Quality, speed, cost of information coming into the
process
• Y =output measures• How well customer needs were met
• GOAL – find the Xs that are leading indicators of the critical output the Ys
100
Outputs from Measure
• Baseline of current state
• Key input process variables - X
• Key output process variables - Y
• Validated goals – financial or other
• Quantified objectives
101
Definition of Terms
• FTE = full time equivalent, 40 hours per work week
• Measures of central tendency• Mean = average (total value/count)• Median = data point, true center of count
• Standard deviation = measure of variation, cluster around the mean
• Percentile (%tile) = relative position of other data point: (number of values above/below a specific value) +/- 0.5 / total number of values * 100%
• Count – N/n
102
5/13/2015
35
Data
• Valid• Meaningful• No bias
• Reliable (Gage R & R)
• Repeat & re-produce (R & R)• Stable
• Some one else can use or reproduce
103
Metrics
• Informational• Average number of patients seen per
month
• Actionable• Average number of patients seen per
month per provider
104
Sampling
• Data from one or more subsets to make decisions about the entire group
• Population – fixed group with definable boundaries, e.g., customers
• Process – sampling from a changing flow of items moving through the business, time factor
105

5/13/2015
36
Sample Selection
• Situation – population (set of items that will not change) or process (continually changing)
• Data type – continuous or attribute
• Objectives - what will you do with the results
• Familiarity – How much prior knowledge is available
• Certainty – how much confidence do you need in the conclusions
106
Choosing samples
• Worst• Judgment – sample based upon someone’s knowledge
= bias
• Convenience – easiest or best time to measure
• Best• Random – random number table or draw numbers to
identify which subject to include in sample
• Systematic – select every “nth” unit
107
Sample size
• 30!
• http://www.surveysystem.com/sscalc.htm
108
5/13/2015
37
Data Plan - steps
1. Decide what data to collect• How will data be used?• How will data be displayed?
2. Determine needed sample size
3. Identify source/location of data
4. Develop data collection forms
5. Decide who will collect data
6. Train data collectors
7. Do ground work for analysis
8. Execute the collection plan
109
SIPOC
110
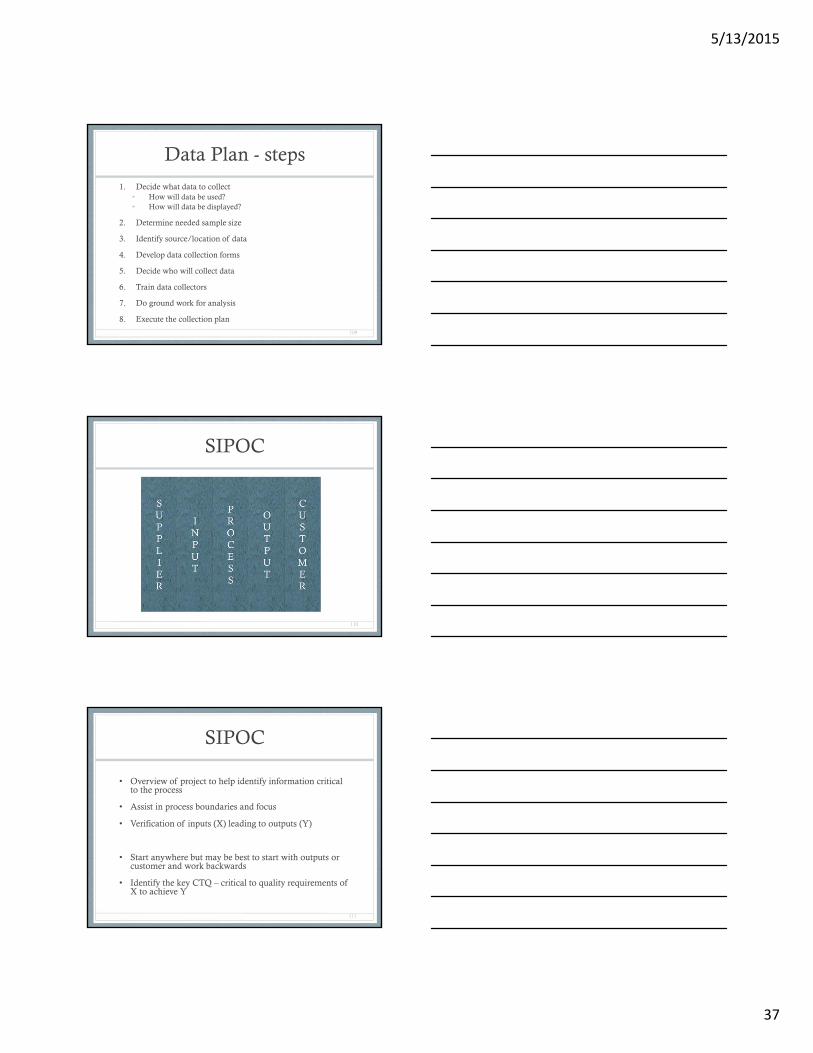
SIPOC
• Overview of project to help identify information critical to the process
• Assist in process boundaries and focus
• Verification of inputs (X) leading to outputs (Y)
• Start anywhere but may be best to start with outputs or customer and work backwards
• Identify the key CTQ – critical to quality requirements of X to achieve Y
111
5/13/2015
38
SIPOC example
• Output- x-ray, lab, surgery schedule, script, next appointment, check out
• Customer – patient, another department, hospital, pharmacy, check out staff
• Process – patient visit, exam, care plan, orders conceptualized
• Input – visit, triage, provider in exam room
• Supplier – appointment desk, receptionist, patient
112
Basics of Lean
113
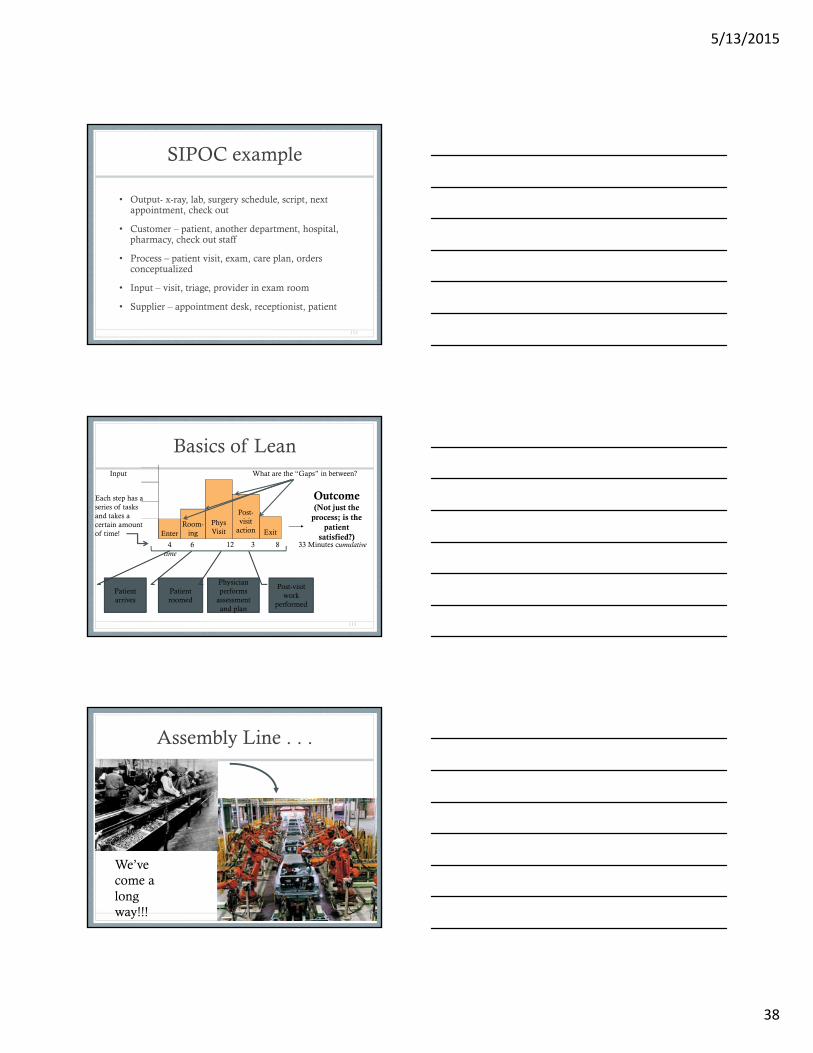
Input
Outcome(Not just the
process; is the patient
satisfied?)
PhysVisitEnter
Room-ing Exit
Post-visit
action
4 6 12 3 8 33 Minutes cumulative time
Each step has aseries of tasksand takes a certain amountof time!
Patient roomed
Patient arrives
Physician performs
assessment and plan
Post-visit work
performed
What are the “Gaps” in between?
Assembly Line . . .
114
We’ve come along way!!!
5/13/2015
39
Non-integrated business processes - Problems!
• Different information systems
• No standard procedures
• Terminology
• Paper vs. computer
• Too many details
• Time lags
• Silos
• Communication
115
Integrated business processes
• Systematic, all phases and activities support the project and organizational goals
116
117
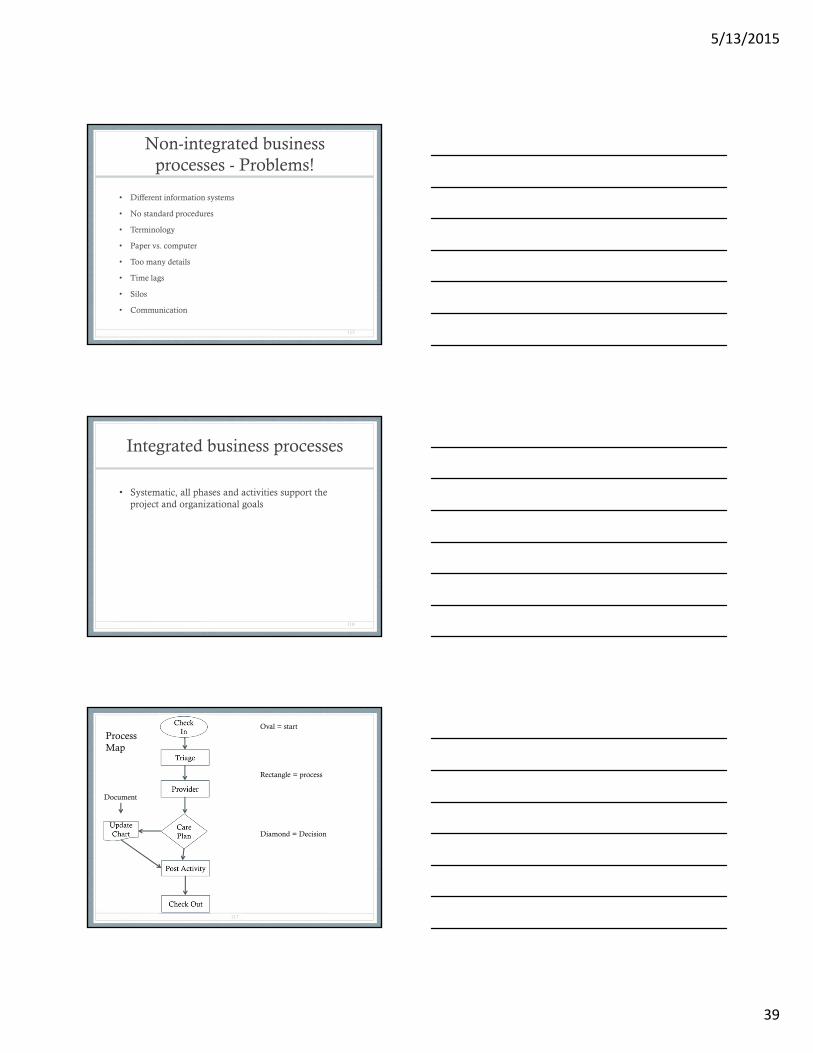
Oval = start
Rectangle = process
Diamond = Decision
Document
ProcessMap

5/13/2015
40
NOYESNO
Process map with sub process identified
119
Basic Procedure
• Define the process to be diagrammed.
• Discuss and decide on the boundaries of your process: Where or when does the process start? Where or when does it end? Discuss and decide on the level of detail to be included in the diagram.
• Visit the “Gemba” – the place where the process occurs
• Brainstorm the activities that take place. Write each on a card or sticky note. Sequence is not important at this point, although thinking in sequence may help people remember all the steps.
• Arrange the activities in proper sequence.
• When all activities are included and everyone agrees that the sequence is correct, draw arrows to show the flow of the process.
• Review the flowchart with others involved in the process (workers, supervisors, suppliers, customers) to see if they agree that the process is drawn accurately.
120
Materials needed: sticky notes or cards, flipchart, marking pens
5/13/2015
41
Flow or process charts
• When to Use a Flowchart• To develop understanding of how a process is done.
• To study a process for improvement.
• To communicate to others how a process is done.
• When better communication is needed between people involved with the same process.
• To document a process.
• When planning a project
121
Process map tips
• Walk through forward and then backward
• Visit the Gemba – the place where the process occurs
• Use sticky notes, remember step one is draft
• Date the notes
• Clarify who has option to update the map
• Concentrate on the process, not the tools, metrics
122
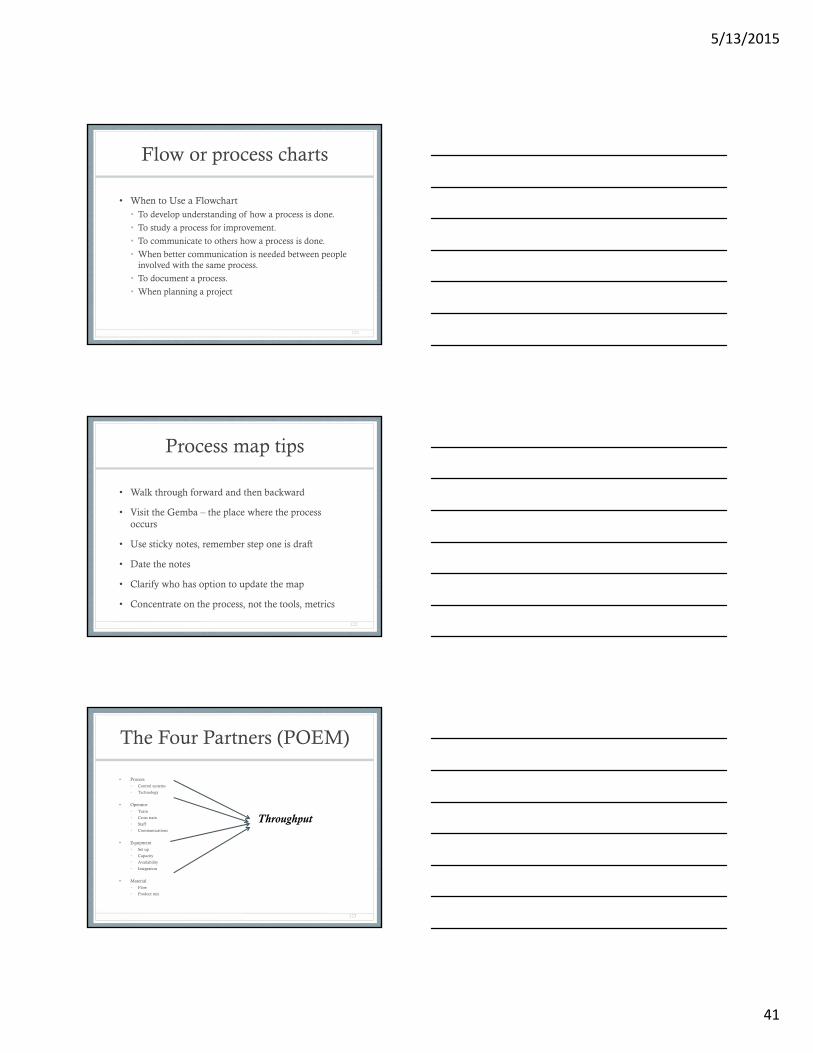
The Four Partners (POEM)
• Process
• Control systems
• Technology
• Operator
• Team
• Cross train
• Staff
• Communications
• Equipment
• Set up
• Capacity
• Availability
• Integration
• Material
• Flow
• Product mix
123
Throughput

5/13/2015
42
What is Value Stream Mapping?
Value stream mapping starts as a paper and pencil tool that helps you to see and understand the flow of objects, patients, materials, supplies and information as a product or service makes its way through the value stream.
It differs from the process mapping in four ways: It gathers and displays a far broader range of information than a
typical process map It tends to be more specific than process maps It tends to be used at a broader level, i.e. from inventory to
accounting to clinical It tends to be used to identify where to focus future projects,
subprojects, and/or kaizen events124
VSM – Activity ++++
A value stream map takes into account not only the activity of the procedure/service, but the management and information systems that support the basic process. This is especially helpful when working to reduce cycle
time, because you gain insight into the decision making flow in addition to the process flow
The basic idea is to first map your process, then map the information flow that enables the process to occur
125
Value Stream
• Set of specific actions required to bring a specific product through three critical management • Problem solving – concept to launch
• Information management – order to delivery
• Physical transformation – get the product in the hands of the customer
126
5/13/2015
43
127
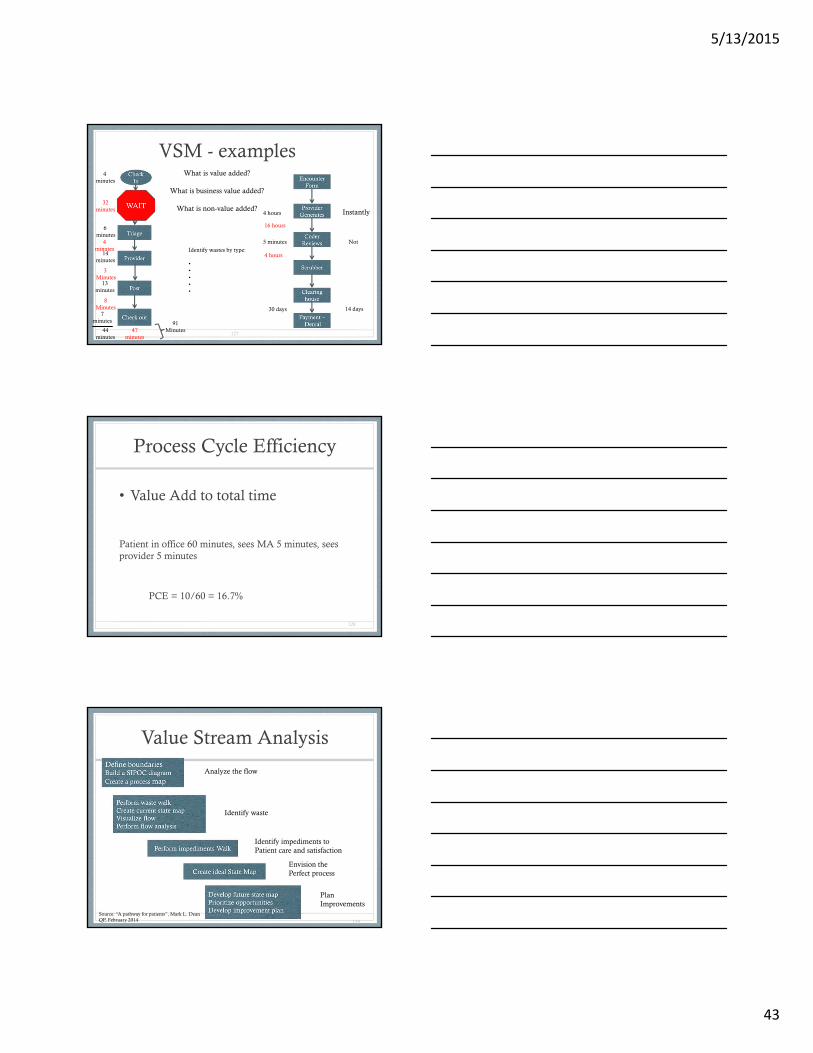
VSM - examples
4 hours Instantly
5 minutes
30 days
Not
14 days
4 minutes
6minutes
14minutes
13minutes
7minutes
44minutes
4minutes
3 Minutes
8Minutes
32minutes
47minutes
91Minutes
16 hours
4 hours
What is value added?
What is business value added?
What is non-value added?
Identify wastes by type:
•••••
Process Cycle Efficiency
• Value Add to total time
Patient in office 60 minutes, sees MA 5 minutes, sees provider 5 minutes
PCE = 10/60 = 16.7%
128
Value Stream Analysis
129
Analyze the flow
Identify waste
Identify impediments to Patient care and satisfaction
Envision the Perfect process
PlanImprovements
Source: “A pathway for patients”, Mark L. DeanQP, February 2014
5/13/2015
44
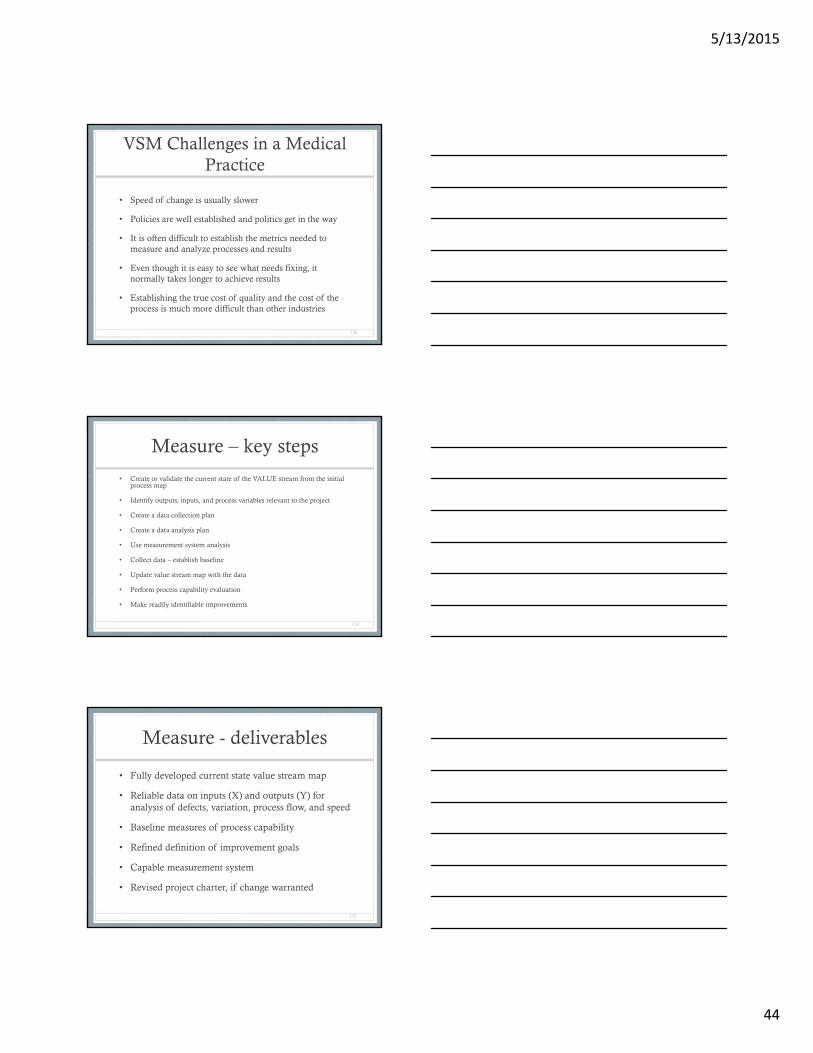
VSM Challenges in a Medical Practice
• Speed of change is usually slower
• Policies are well established and politics get in the way
• It is often difficult to establish the metrics needed to measure and analyze processes and results
• Even though it is easy to see what needs fixing, it normally takes longer to achieve results
• Establishing the true cost of quality and the cost of the process is much more difficult than other industries
130
Measure – key steps
• Create or validate the current state of the VALUE stream from the initial process map
• Identify outputs, inputs, and process variables relevant to the project
• Create a data collection plan
• Create a data analysis plan
• Use measurement system analysis
• Collect data – establish baseline
• Update value stream map with the data
• Perform process capability evaluation
• Make readily identifiable improvements
131
Measure - deliverables
• Fully developed current state value stream map
• Reliable data on inputs (X) and outputs (Y) for analysis of defects, variation, process flow, and speed
• Baseline measures of process capability
• Refined definition of improvement goals
• Capable measurement system
• Revised project charter, if change warranted
132

5/13/2015
45
Analyze“Seek to understand”
• Pinpoint and verify causes affecting the key input (X) and output (Y) variables – finding the key (X)
• Understand – common picture• Cause & effect relationships
• Optional solutions
• Prioritize –• Issues and opportunities
• Plan improvements
133
Variation
• Common cause• Random changes in process yet stable and predictable• “in control” (statistically)
• Special cause• Variations that are not always present in the process• Special causes that are not random, not predictable as
to when they appear or the overall impact of the variation
• “out of control”• Requires a look to determine what’s different
134
Visit Times82 60 68 3761 73 61 5450 57 157 6752 67 82 5556 60 54 7035 32 125 7857 54 92 7728 37 80 68
75 54 98 6885 127 82 52
20
135
5/13/2015
46
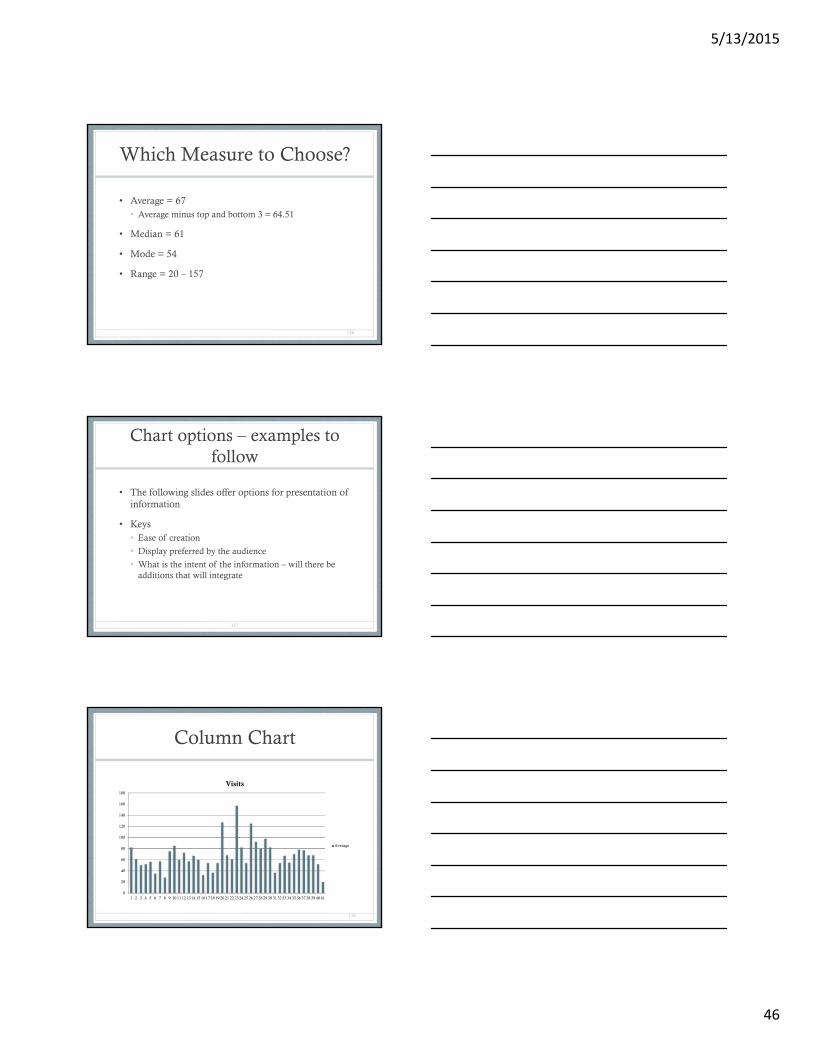
Which Measure to Choose?
• Average = 67• Average minus top and bottom 3 = 64.51
• Median = 61
• Mode = 54
• Range = 20 – 157
136
Chart options – examples to follow
• The following slides offer options for presentation of information
• Keys• Ease of creation
• Display preferred by the audience
• What is the intent of the information – will there be additions that will integrate
137
Column Chart
0
20
40
60
80
100
120
140
160
180
1 2 3 4 5 6 7 8 9 10 11 12 13 14 15 16 17 18 19 20 21 22 23 24 25 26 27 28 29 30 31 32 33 34 35 36 37 38 39 40 41
Visits
Average
138

5/13/2015
47
Scatter Diagram
0
20
40
60
80
100
120
140
160
180
0 5 10 15 20 25 30 35 40 45
Visits
Scatter
139
Normal
0
0.05
0.1
0.15
0.2
0.25
0.3
0.35
0.4
0.45
-3
-2.8
-2.6
-2.4
-2.2 -2
-1.8
-1.6
-1.4
-1.2 -1
-0.8
-0.6
-0.4
-0.2
1.52
656E
-15
0.2
0.4
0.6
0.8 1
1.2
1.4
1.6
1.8 2
2.2
2.4
2.6
2.8 3
Normal DIstribution
curve
140
From our data
0
0.002
0.004
0.006
0.008
0.01
0.012
0.014
0.016
20 32 37 50 52 54 54 56 57 60 61 67 68 70 75 78 82 82 92 125 157
Curve
Curve
141Use normal distribution formula in Excel

5/13/2015
48
Run Chart
0
20
40
60
80
100
120
140
160
180
1 2 3 4 5 6 7 8 9 10 11 12 13 14 15 16 17 18 19 20 21 22 23 24 25 26 27 28 29 30 31 32 33 34 35 36 37 38 39 40 41
Run Chart
Visits
142
Control Chart
82
61
50 5256
35
57
75
28
85
60 57
73
6067
32
54
37
68
127
61
157
82
54
92
125
80
98
82
54
37
67
55
7078 77
68 68
52
20
0
20
40
60
80
100
120
140
160
180
A -
new B C D E F G
H -
new
I J K L M N O P Q R S T U VW
- n
ew X Y Z A B C D E F G H I J K L MN
- In
j
Actual time
Median
UCL
LCL
Target
Monitor and Set Control Limits3 Sigma above and below mean
10 above12 below45% in range
3 sigma Xbar chart
0
20
40
60
80
100
120
140
160
180
1 6 11 16 21 26 31 36 41
144Software template available by emailing Owen
5/13/2015
49
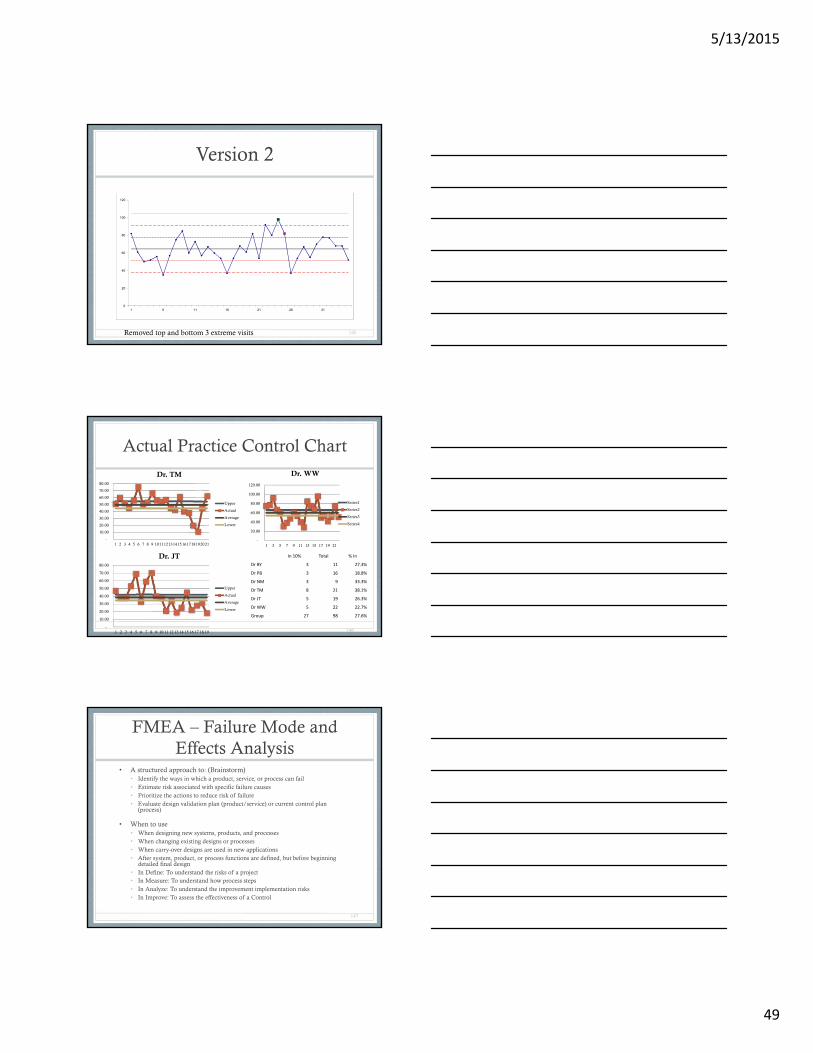
Version 2
0
20
40
60
80
100
120
1 6 11 16 21 26 31
145Removed top and bottom 3 extreme visits
Actual Practice Control Chart
146
-
10.00
20.00
30.00
40.00
50.00
60.00
70.00
80.00
1 2 3 4 5 6 7 8 9 101112131415161718192021
Dr. TM
Upper
Actual
Average
Lower
-
10.00
20.00
30.00
40.00
50.00
60.00
70.00
80.00
1 2 3 4 5 6 7 8 9 10 11 12 13 14 15 16 17 18 19
Dr. JT
Upper
Actual
Average
Lower
-
20.00
40.00
60.00
80.00
100.00
120.00
1 3 5 7 9 11 13 15 17 19 21
Dr. WW
Series1
Series2
Series3
Series4
In 10% Total % In
Dr BY 3 11 27.3%
Dr PB 3 16 18.8%
Dr NM 3 9 33.3%
Dr TM 8 21 38.1%
Dr JT 5 19 26.3%
Dr WW 5 22 22.7%
Group 27 98 27.6%
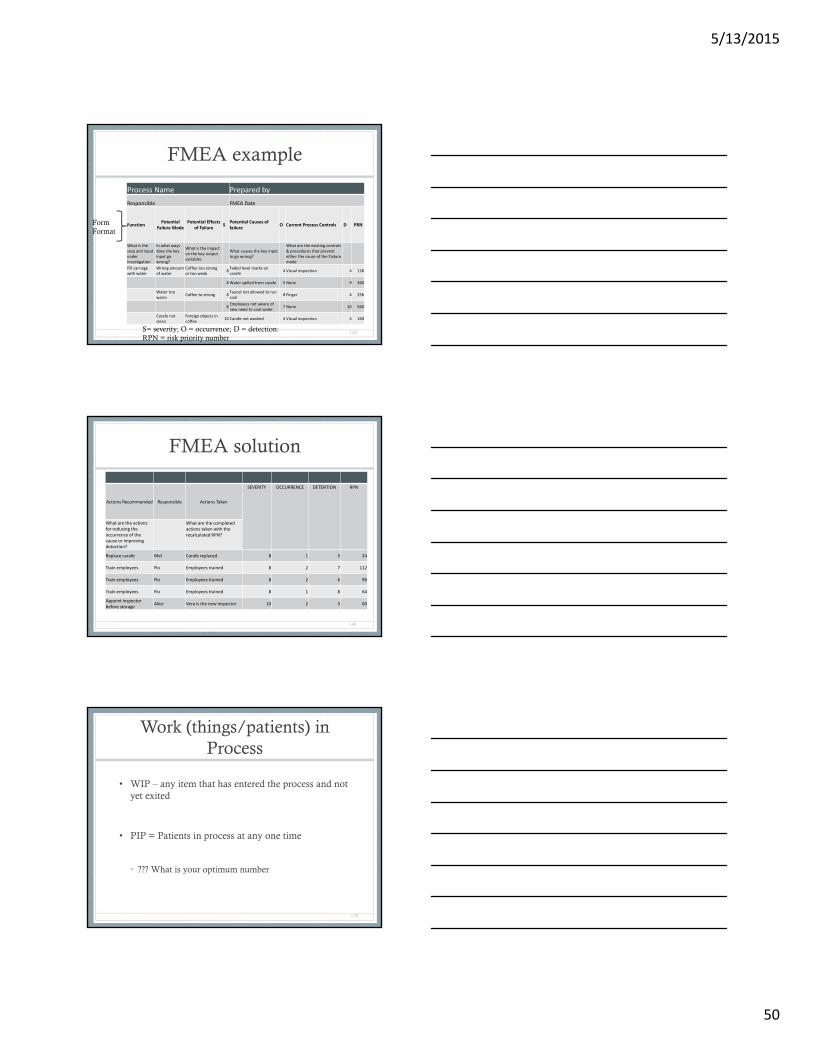
FMEA – Failure Mode and Effects Analysis
• A structured approach to: (Brainstorm)• Identify the ways in which a product, service, or process can fail• Estimate risk associated with specific failure causes • Prioritize the actions to reduce risk of failure • Evaluate design validation plan (product/service) or current control plan
(process)
• When to use• When designing new systems, products, and processes • When changing existing designs or processes • When carry-over designs are used in new applications • After system, product, or process functions are defined, but before beginning
detailed final design • In Define: To understand the risks of a project • In Measure: To understand how process steps • In Analyze: To understand the improvement implementation risks • In Improve: To assess the effectiveness of a Control
147
5/13/2015
50
FMEA example
Process Name Prepared by
Responsible FMEA Date
FunctionPotential
Failure ModePotential Effects
of FailureS
Potential Causes of failure
O Current Process Controls D PRN
What is the step and input under investigation
In what ways does the key input go wrong?
What is the impact on the key output variables
What causes the key input to go wrong?
What are the existing controls & procedures that prevent either the cause of the Failure mode
Fill carriagewith water
Wrong amount of water
Coffee too strong or too weak
8Faded level marks on carafe
4 Visual inspection 4 128
8Water spilled from carafe 5 None 9 360
Water too warm
Coffee to strong 8Faucet not allowed to run cool
8 Finger 4 256
8Employees not aware of new need to cool water
7 None 10 560
Carafe not clean
Foreign objects in coffee
10 Carafe not washed 4 Visual inspection 4 160
148S= severity; O = occurrence; D = detection:RPN = risk priority number
FormFormat
FMEA solution
Actions Recommended Responsible Actions Taken
SEVERITY OCCURRENCE DETENTION RPN
What are the actions for reducing the occurrence of the cause or improving detection?
What are the completed actions taken with the recalculated RPN?
Replace carafe Mel Carafe replaced 8 1 3 24
Train employees Flo Employees trained 8 2 7 112
Train employees Flo Employees trained 8 2 6 96
Train employees Flo Employees trained 8 1 8 64
Appoint inspector before storage
Alice Vera is the new inspector 10 2 3 60
149
Work (things/patients) in Process
• WIP – any item that has entered the process and not yet exited
• PIP = Patients in process at any one time
• ??? What is your optimum number
150
5/13/2015
51
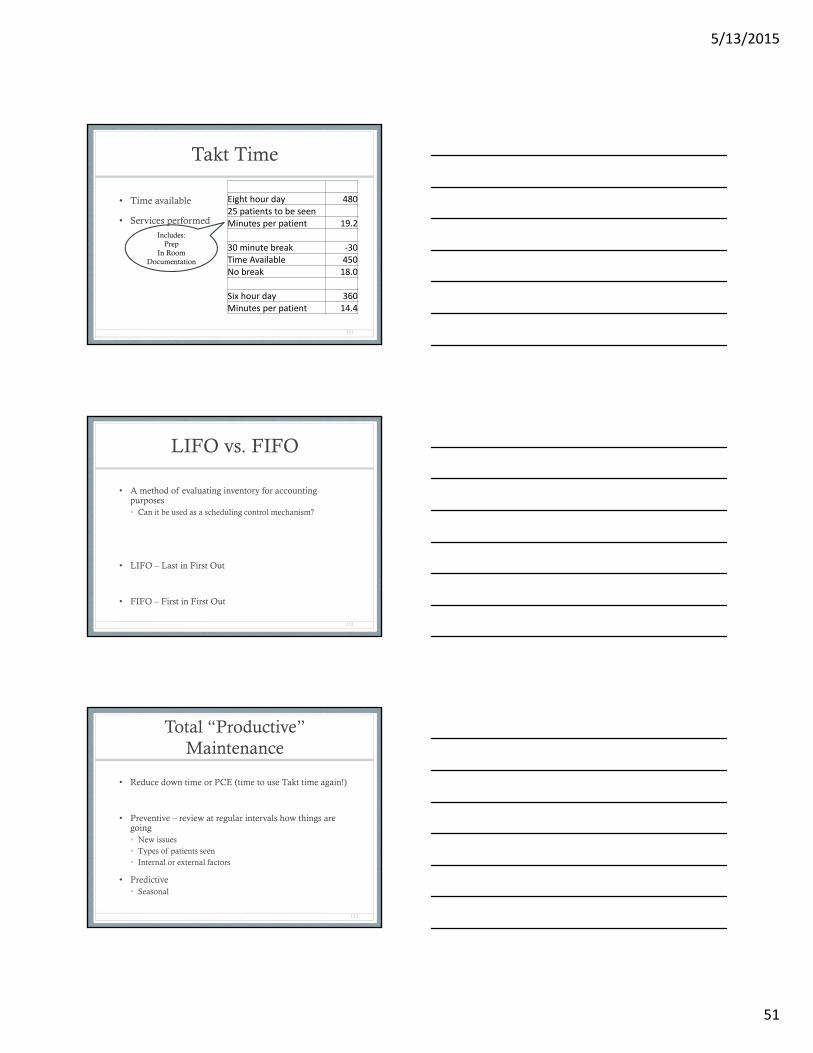
Takt Time
• Time available
• Services performed
151
Eight hour day 48025 patients to be seenMinutes per patient 19.2
30 minute break ‐30Time Available 450No break 18.0
Six hour day 360Minutes per patient 14.4
Includes:Prep
In RoomDocumentation
LIFO vs. FIFO
• A method of evaluating inventory for accounting purposes• Can it be used as a scheduling control mechanism?
• LIFO – Last in First Out
• FIFO – First in First Out
152
Total “Productive” Maintenance
• Reduce down time or PCE (time to use Takt time again!)
• Preventive – review at regular intervals how things are going• New issues• Types of patients seen• Internal or external factors
• Predictive• Seasonal
153
5/13/2015
52
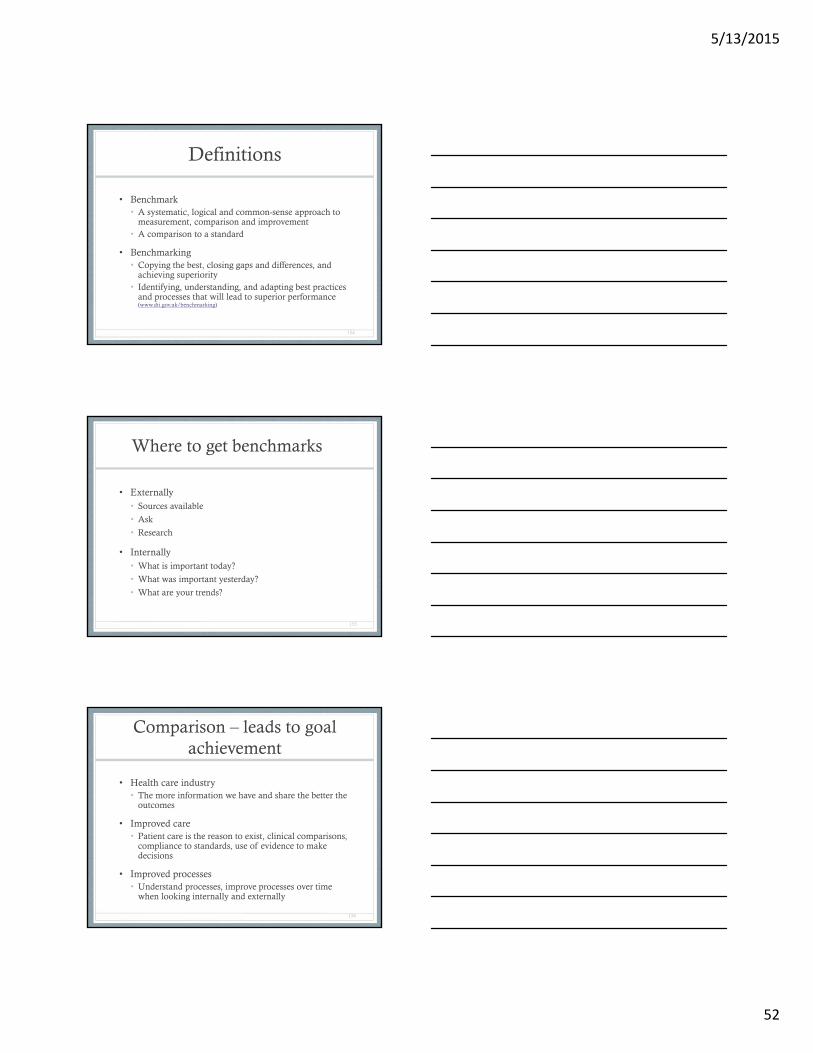
Definitions
• Benchmark• A systematic, logical and common-sense approach to
measurement, comparison and improvement• A comparison to a standard
• Benchmarking• Copying the best, closing gaps and differences, and
achieving superiority• Identifying, understanding, and adapting best practices
and processes that will lead to superior performance (www.dti.gov.uk/benchmarking)
154
Where to get benchmarks
• Externally• Sources available
• Ask
• Research
• Internally• What is important today?
• What was important yesterday?
• What are your trends?
155
Comparison – leads to goal achievement
• Health care industry• The more information we have and share the better the
outcomes
• Improved care• Patient care is the reason to exist, clinical comparisons,
compliance to standards, use of evidence to make decisions
• Improved processes• Understand processes, improve processes over time
when looking internally and externally
156
5/13/2015
53
What are your goals in any benchmarking project?
• Increase• Patient satisfaction• Efficiency• Revenue• Productivity
• Decrease• Cost of doing business• Overhead• Overall cost of care for each patient
• Optimize• As opposed to maximize = seeking quality outcomes
157
Two key principles
1. If you don’t measure it, you can’t change it
• Description• Comparison• Context
2. If you don’t value it, you won’t change it
• Benefit
158
Nguyen Case
• Process map, value stream map and calculations
159
5/13/2015
54
Analyze – key steps
• Conduct the value analysis – identify the value add and non-value add steps
• Calculate process cycle efficiency – compare to benchmarks, how much improvement needed
• Analyze process flow
• Analyze data collected
• Generate theories to identify and explain causes
• Refine the focus to root causes and cause and effect relationships
• Collect additional data
160
5 Why’s
• May not take “5’ to get to the root cause
• This is a guideline, not an absolute
• Drilling down in a vertical fashion, not a horizontal
• Skill developed in asking the right questions
161
5 Why’s for a receptionist
• Baseline – develop job description and engaged staff
• Question: what do you get paid to do?
• Answer: Greet patients
• 5 Why’s• Why is greeting patients important?
• I was told that was the main part of my job
• Why were you told to do that?• It helps the clinic staff know that the patient is here
• Why does the clinic staff need to know the patient is here?• So they can get the patient into the room
• Why is it important to get the patient into the room?• So they can see the provider
• Why does the patient need to see the provider?• So they can get well, get good patient care
162

5/13/2015
55
Cause and Effect
• Purpose• For teams – to push beyond symptoms to uncover
potential root causes• To provide structure to cause identification efforts• To obtain a balanced list of ideas and to insure major
possible causes are not missed
• Use• Cause identification• Cause prevention – surfaces during brainstorming and
may help address future problems
163
Ishikawa Diagram
• “Fishbone” or Cause and Effect
• A causal diagram that show the causes of a specific event
• Each cause is the source of a process variation
• Causes are best tracked in major categories
• Major categories: method, materials, methods, and manpower. There are many independent variations and additions.
• You will need to determine the major categories when designing
• Best developed by brainstorming and the “5 whys”
164
What is an Ishikawa Diagram?
• Also called a Fishbone diagram
• This is a tool that is used to drill down during cause-and-effect steps in a project
165
What’s Your Problem?
Practice Process
Payers Patients
5/13/2015
56
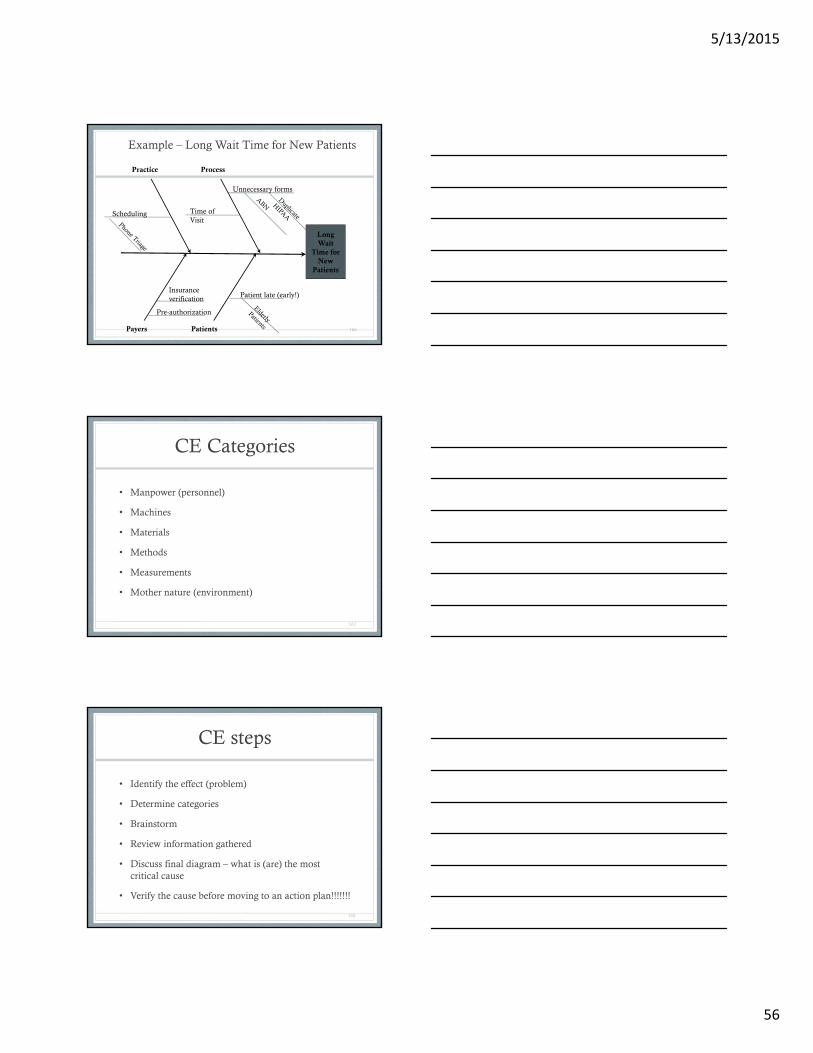
Long Wait
Time for New
Patients
Practice Process
Payers Patients
Patient late (early!)
Unnecessary forms
Scheduling
Insurance verification
Time of Visit
Pre-authorization
Example – Long Wait Time for New Patients
166
CE Categories
• Manpower (personnel)
• Machines
• Materials
• Methods
• Measurements
• Mother nature (environment)
167
CE steps
• Identify the effect (problem)
• Determine categories
• Brainstorm
• Review information gathered
• Discuss final diagram – what is (are) the most critical cause
• Verify the cause before moving to an action plan!!!!!!!
168
5/13/2015
57
Applying 5 Why’s to C & E
• Select any cause from the diagram
• Ask “why does this outcome occur”
• Continue
• Nothing sacred about “5”
• Stop when you have reached a potential cause
169
5S• Sort – what is needed and not, eliminate the latter
• Remove or “red tag”
• Set in order – keep needed items in right place• “Picture” current state, draw future state
• Shine – keep area clean• Safety, waste, cleanliness
• Standardize – clean up – the first 3 S• Every day• Create your OWN agreement to accomplish
• Sustain – make this a habit to clean, establish processes or procedures to insure success• Self discipline – do you have it???????
170
5S
• Purpose – create and maintain an organized, clean, safe, and HIGH PERFORMANCE work place• Distinguish between normal and abnormal
• Foundation for continuous improvement
• Systematic way to improve the workplace
• When
171
5/13/2015
58
Handle seasonality!
• Determine Process Lead Time for the season
• Identify schedule to optimize to meet demand
• Identify what is maximum (safety) level of patients to schedule
• *Process Lead Time – PLT – time from initiation of process to actual activity
172
Analyze - deliverables
• Documentation of potential causes considered
• Data charts and other analyses showing link between X and Y
• Identification of value-add and non-value add work
• Calculation of process cycle efficiency
173
Analyze outputs
• Approach used in analysis
• Statistical analysis of data sources of waste, variation, constraint
• Value stream map
• Revised problem statement
• Improvement opportunities
174
5/13/2015
59
Dulles Clinic Case
• Use of Fishbone diagram, brainstorming
175
Improve
• Reduce waste, complexity, variation
• Identify and learn from pilots of solutions and move to full scale implementation• Test and confirm
• Design controls
• Plan implementation
176
Improve – key steps
• Develop potential solutions
• Evaluate, select, and optimize best solutions
• Develop future state value stream map
• Develop and implement pilot solution
• Confirm attainment of project goals
• Develop and execute full-scale implementation plan
177
5/13/2015
60
Pilot Testing
• To identify practical problems and failures in a chosen solution so those can be addressed before full scale implementation
• Keys• Small scale
• Evaluate the solution and the implementation
• Step to make full scale implementation more effective
178
How to pilot• Plan
• What needs to be piloted• Where, who, when, how long
• Review design• Elements complete• All pieces and parts fit together• Identify possible failure points and vulnerability• Review plans
• Finalize design and implement• Do it
• Evaluate the test and verify• Statistical tools for evaluation• Celebrate success• Improve the design
179
Pull system
• Set cap or maximum number of WIP, means predictable
• Then apply tools to improve
• Current PLT (process lead time)
• Current PCE
• Target PCE
180
5/13/2015
61
Pull = part 2
• Count WIP
• Can you “release” into process
• Identify trigger – how will you know when to release more into process?
• Triage system – determine order of patients to be released into system
• Once items identified, implement and maintain!
181
Workflow Optimization “Pull in” the work (kanban) Do work in small batches; “just do it!!”
Continuous work flow
Why?▪ (Paper) Charts can be put back into circulation
▪ You must spend time remembering
▪ If you don’t, callbacks overwhelm the practice
▪ If you don’t, staff spend the next morning playing catch up
182
Workflow Optimization
• (More!) “Pull in” the work• Avoid interruptions
• Be organized
• Establish protocols for message taking and callbacks• Urgent?
• Referring physician?
• Document in exam room• Customize template
183
5/13/2015
62
Signal to “pull” (push)
• How does the staff know the next step is “ready”?• Observation (visual)
• Electronic notification (material)
• Room marker (material)
• Other?
184
Improve - deliverables
• For Quality Improvement (QI) project – tested, robust solutions that affect the causes of X that impact the critical Y
• For lean project – document the proven best practice or solution applied
• An improved process – stable, predictable AND meets customer expectations!
185
Improve outputs
• Process improvements
• Pilot results
• Control system design
• Implementation plan
186
5/13/2015
63
Control
• Complete project work and train, support to the operational team the procedures identified to maintain the gain
187
Control – key steps• Develop supporting steps of documentation
• Launch company wide implementation
• Secure performance gains
• Monitor implementation
• Develop the process control plans and pass on to those operationally responsible
• Audit the results
• Finalize the project
• Review the process, memorialize for others and the next improvement project
188
Control - deliverables
• Documented plans to transition to the process owner for implementation
• All data metrics
• Operationalize, train, communicate, and provide documents from process to support improvements
• A system of monitoring and metrics necessary to insure successful implementation
• Completed project documentation – lessons learned and recommendations to others
189
5/13/2015
64
“Outputs” from control
• Trained personnel
• Deployed improvements
• Implemented controls
• Documented adjustments
• Completed recognition events
• Documented lessons learned
190
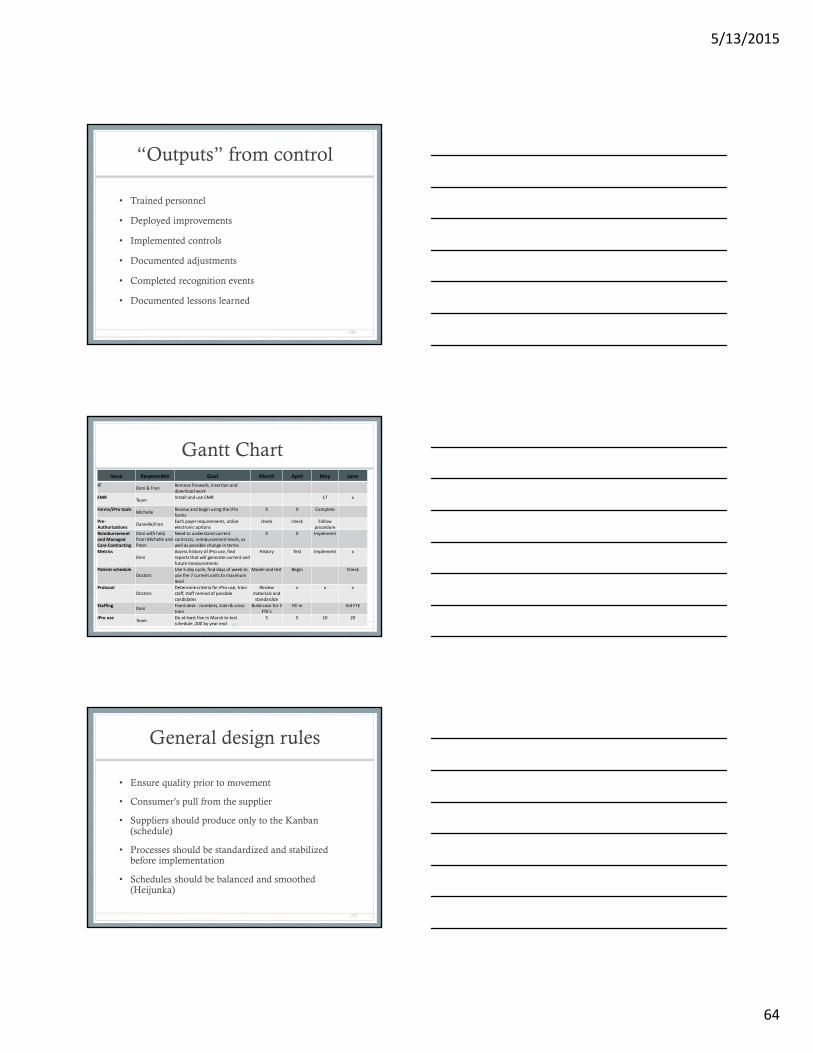
Gantt ChartIssue Responsible Goal March April May June
ITDeni & Fran
Remove firewalls, insertion and download work
EMRTeam
Install and use EMR 17 x
Forms/iPro toolsMichelle
Review and begin using the iPro forms
X X Complete
Pre‐Authorizations
Danielle/FranEach payer requirements, utilize electronic options
check check Follow procedure
Reimbursement and Managed Care Contracting
Deni with help from Michelle and Peter
Need to understand current contracts, reimbursement levels, as well as possible change in terms
X X Implement
MetricsDeni
Assess history of iPro use, find reports that will generate current and future measurements
History Test Implement x
Patient scheduleDoctors
Use 5 day cycle, find days of week to use the 7 current units to maximum level
Model and test Begin Check
ProtocolDoctors
Determine criteria for iPro use, train staff, staff remind of possible candidates
Review materials and standardize
x x x
StaffingDeni
Front desk ‐ numbers, train & cross train
Build case for 3 FTE's
Fill in 3rd FTE
iPro useTeam
Do at least five in March to test schedule, 200 by year end
5 5 10 20
191
General design rules
• Ensure quality prior to movement
• Consumer’s pull from the supplier
• Suppliers should produce only to the Kanban (schedule)
• Processes should be standardized and stabilized before implementation
• Schedules should be balanced and smoothed (Heijunka)
192
5/13/2015
65
Bottlenecks
• Patient
• Supplies
• Staff
• Equipment – scopes, wheelchairs
• Space
193
Adult learning
• Focus on real world issues that apply to their job
• Meets THEIR goals and expectations
• Allows for debate and challenge of ideas
• Encourages an exchange of ideas and opinions
• Allows them to be resources for others
• Meets a current need
194
Different ways of learning
• Visual• What you see
• Auditory• What you hear
• Kinesthetic• What you can “touch”
195
5/13/2015
66
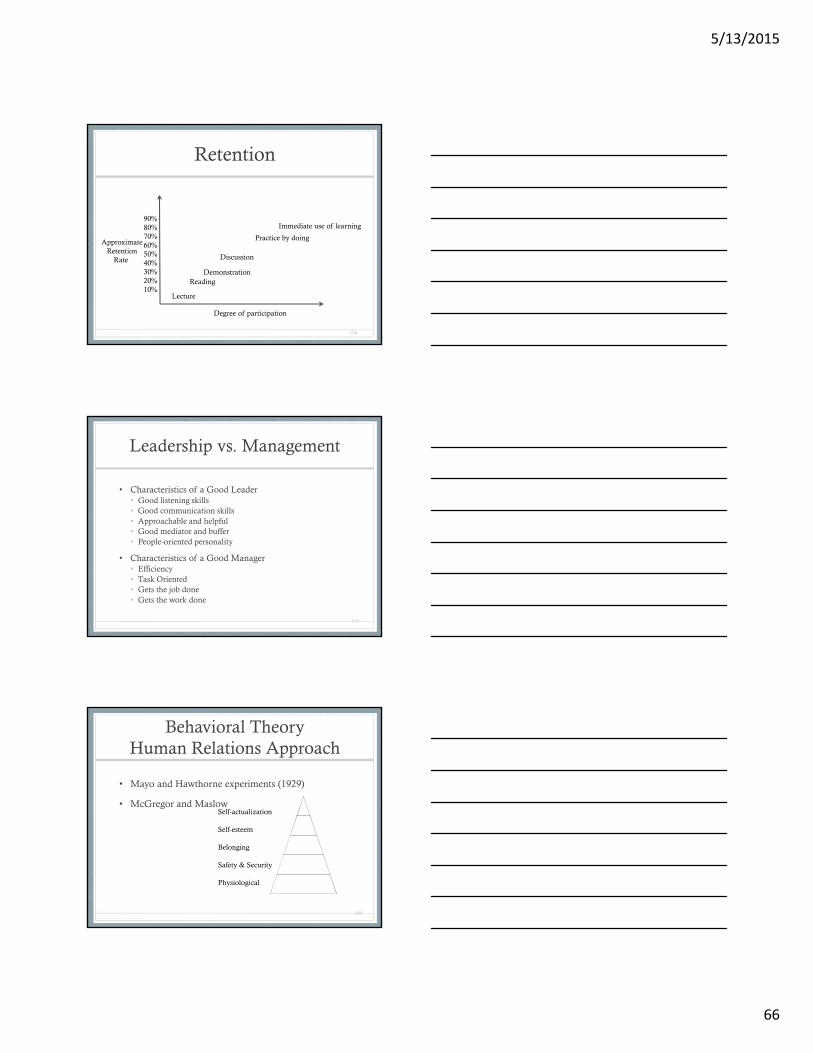
Retention
196
90%80%70%60%50%40%30%20%10%
Lecture
ReadingDemonstration
Discussion
Practice by doing
Immediate use of learning
ApproximateRetention
Rate
Degree of participation
Leadership vs. Management
• Characteristics of a Good Leader• Good listening skills• Good communication skills• Approachable and helpful• Good mediator and buffer• People-oriented personality
• Characteristics of a Good Manager• Efficiency• Task Oriented• Gets the job done• Gets the work done
197
Behavioral TheoryHuman Relations Approach
• Mayo and Hawthorne experiments (1929)
• McGregor and Maslow
198
Self-actualization
Self-esteem
Belonging
Safety & Security
Physiological
5/13/2015
67
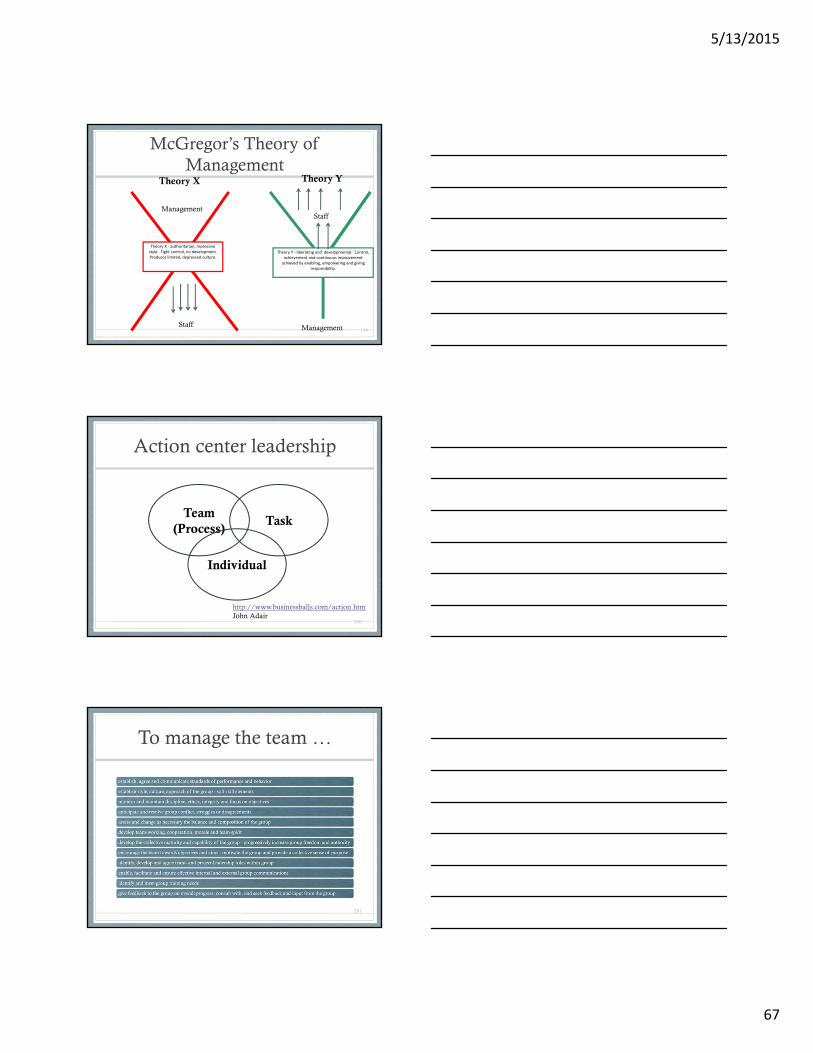
McGregor’s Theory of Management
199
Theory X ‐ authoritarian, repressive style. Tight control, no development. Produces limited, depressed culture.
Theory Y ‐ liberating and developmental. Control, achievement and continuous improvement achieved by enabling, empowering and giving
responsibility.
Management
Staff
Staff
Management
Theory X Theory Y
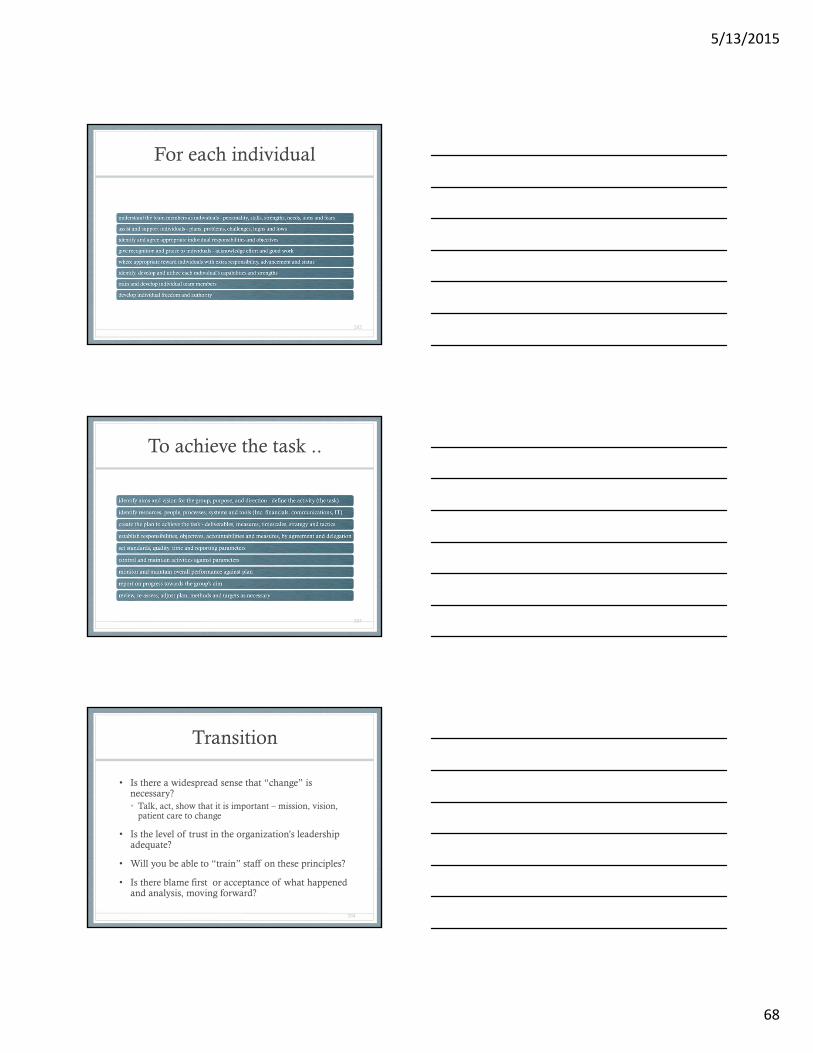
Action center leadership
200
TaskTeam
(Process)
Individual
http://www.businessballs.com/action.htmJohn Adair
To manage the team …
201
5/13/2015
68
For each individual
202
To achieve the task ..
203
Transition
• Is there a widespread sense that “change” is necessary?• Talk, act, show that it is important – mission, vision,
patient care to change
• Is the level of trust in the organization’s leadership adequate?
• Will you be able to “train” staff on these principles?
• Is there blame first or acceptance of what happened and analysis, moving forward?
204

5/13/2015
69
Transition
• Is process improvement a widely understood strategy?
• Does the culture work in favor of process improvement?
• Do YOU understand that transitions will necessarily take longer than changes?
205
Your Process Improvement Organization Chart
206
Typical Structure
The Process
Improvement Way
Are you ready to rumble?
207
5/13/2015
70
208
Hints to expose waste and keep clean
1) Avoid stickers in manufacturing environments2) Engrave labels and color code, visual aids3) Eliminate flat surfaces on tables (they collect clutter)4) Eliminate unnecessary shelves (also collect clutter)5) Minimize drawers (say it again one more time.......clutter)6) Use light colors of paint to expose grease, oil, dirt, leaks7) Local task lighting is cheaper than lighting an entire area8) Do everything practical to keep the operator at station(s) or machine(s) all the time9) Put items on stands, casters, or legs (easier to clean around)10) Make items portable and standardized for interchangeability11) Use standard for all signage, keeps signs & labels consistent12) Remove obsolete postings, slogans, mission statements, etc.
http://www.six-sigma-material.com/Spaghetti-Diagram.html
Recommended