Data Sheet
Redox reactions are powerful chemical processes that
involve the reduction and oxidation of proteins and
metabolites found in living things. The mechanisms
that regulate them are key to maintaining homeostasis
and the balance between good health and disease
pathology.
Oxidative stress is the state where the delicate balance
of redox biology is upset, and the pathology of
oxidative stress are the cellular consequences to such
an imbalance.
White Paper
Modern Methods in Oxidative Stress Research
Caspase-9 Caspase-3Apaf-1
ONOO-
NO•
NOS
SOD
GSHPeroxidase
GSHSynthase
GSHReductase
GSSG
GSH
Fe2+
Fe3+
Glycine
CysteineGlutamate
γ-glutamyl CysteineSynthase
NADP+
NADPH
L-arginine
CytC
Nuc
leus
Cell
Mem
bran
e
Apoptosis
ProteinOxidation
CellularDysfunction
Nitrosative StressInflammation
DNA Damage
CellDeath
LipidPeroxidation
(MDA)
ATP
∆ΨmMitochondrialDamage
CarbonylFormation (PCC)
Fenton Reaction
Telomere Attrition
Fe2+
Fe3+
OH•
O2
H+
H+
O2
O2
H2O
+
O2
H2O+
OH•
H2O2
H2O2
O2•-
O2•-O2
•-
O2•-
O2•-
Com
plex
I
Com
plex
III
Com
plex
II
Com
plex
IV ATP
Synt
hase
Inner Mitochondrial Membrane
H+
H+ H+H+H+
O2
H+
H+
ROS
ADP+Pi
ATP
Figure 1: Oxidative stress can be linked to inflammation, DNA damage, mitochondrial damage, and cell death.
Redox biology and oxidative stress
Merck Millipore is a business of
2
Reactive oxygen species (ROS) and reactive nitrogen
species (RNS) are naturally occurring, short-lived,
chemically reactive molecules produced by all living
things. Structurally, they are chemical radicals and non-
radical molecules derived from molecular oxygen species
such as superoxide (O2¯), singlet oxygen, and peroxide, or
from reactive nitrogen species like nitric oxide (·NO) and
peroxynitrite (ONOO-), for ROS and RNS, respectively1,4.
In mammalian cells, major endogenous sources of ROS
are mitochondria and the oxidative phosphorylation
reactions and respiratory processes contained within
them, but other organelles such as the endoplasmic
reticulum and even nuclear membranes can generate
ROS/RNS as well.
ROS and RNS species also arise from a host of enzymatic
reactions catalyzed by various enzymes including the
cytochrome P450 enzymes, various oxidases, lipoxidases,
and nitric oxide synthases. Besides endogenous sources,
exogenous sources of ROS/RNS abound, both from our
natural environment, like the UV radiation found in
sunlight, to various food, pollutants, and toxins. Other
sources include gamma irradiation, X-rays, xenobiotics,
drugs, and poisons, all of which can lead to the
production of ROS/RNS compounds in living systems.
In addition, our immune system has adapted the power
of ROS/RNS for self-defense. ROS have a bactericidal
effect on invading bacteria, and thus form a major
component of our innate immune systems, though they
can also contribute to and augment inflammation and
immune disorders if left unchecked. Moreover, ROS/
RNS are essential for various other biological functions,
including cell survival, cell growth, proliferation, and
differentiation24, 28.
Common sources of ROS/RNS species* Exogenous Sources• γ irradiation
• UV irradiation
• Ultrasound
• Food
• Drugs (e.g. narcotic drugs and anesthetizing gases)
• Pollutants
• Xenobiotics
• Toxins
Endogenous Sources• Cells (e.g. WBC, basophils, monocytes)
• Immune response
• ROS enzymes (e.g. NO synthase)
• Xanthine oxidase
• Metabolism and oxidative respiration
(e.g. mitochondria)
• Injury (e.g. ischemic processes, burns)
• Metabolic disorders (intestinal disorders, aging)
• Diseases (chronic inflammation, cancer,
hemochromatosis, thalassemia)
*Adapted from Kohen, R. et al. (2002)
Oxidative stress research approachesTraditionally, oxidative stress research has focused on
understanding how living cells handle the impact that
ROS and RNS have on macromolecular homeostasis, and
the traditional belief is that the pathology associated
with oxidative stress is in direct response to ROS/RNS
interactions. This connection is logical because ROS/RNS
have the ability to react with a variety of cellular targets,
including enzyme active sites, nucleic acids, and lipids.
Diverse pathophysiologies are associated with ROS/RNS
activity including diseases ranging from Alzheimer’s
disease, cancer, and cardiovascular disease, to diabetes
and sepsis16, 25, 27.
More recently, oxidative stress research has focused
on the role of ROS/RNS in redox cell signaling, and
how the disruption of normal redox signaling leads to
a signaling dyshomeostasis and disease. ROS/RNS are
known to be critical conveyors of signals (such as in
NO signal transduction in the eye or in direct AP-1 and
NFkB activation) and activators of important kinase
signaling cascades including MAP kinases or Jak/Stat
pathways. Thus, they directly regulate cell growth as well
as cell death and autophagic cellular responses24. The
challenge for scientists studying redox signaling is that it
constitutes an essential part of normal homeostasis, so
that any experimental and or therapeutic design must be
carefully constructed to distinguish pathological redox
signaling from normal physiological redox activity.
3
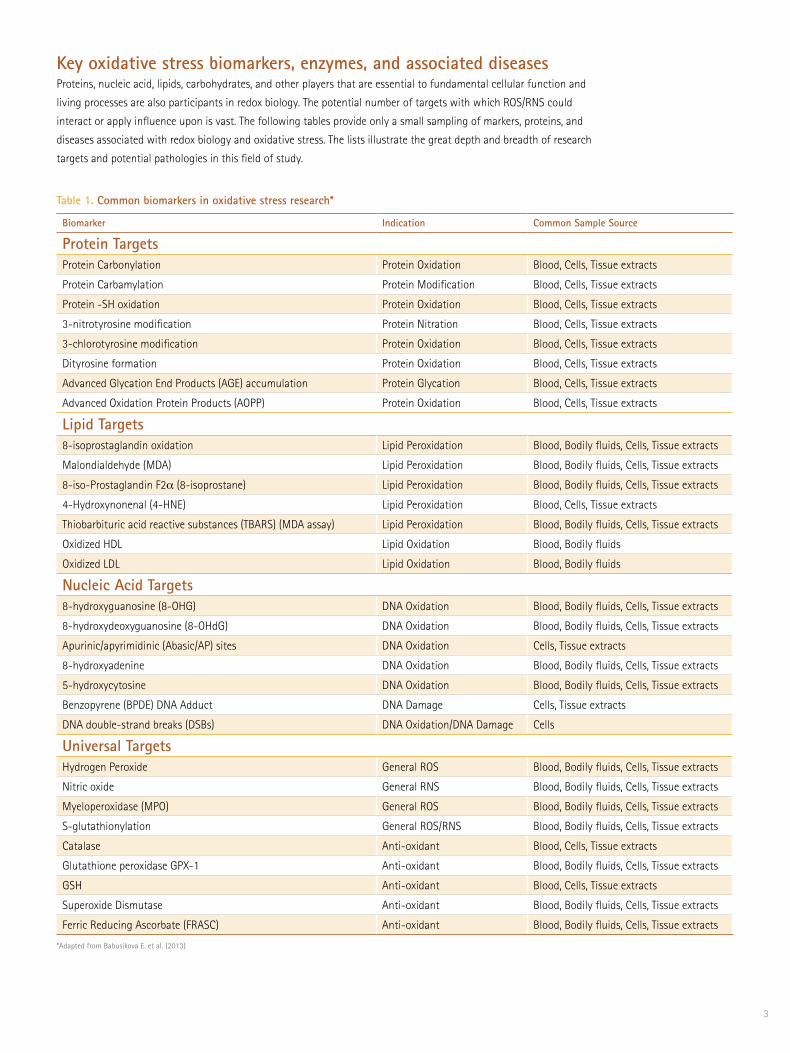
Key oxidative stress biomarkers, enzymes, and associated diseasesProteins, nucleic acid, lipids, carbohydrates, and other players that are essential to fundamental cellular function and
living processes are also participants in redox biology. The potential number of targets with which ROS/RNS could
interact or apply influence upon is vast. The following tables provide only a small sampling of markers, proteins, and
diseases associated with redox biology and oxidative stress. The lists illustrate the great depth and breadth of research
targets and potential pathologies in this field of study.
Biomarker Indication Common Sample Source
Protein TargetsProtein Carbonylation Protein Oxidation Blood, Cells, Tissue extracts
Protein Carbamylation Protein Modification Blood, Cells, Tissue extracts
Protein -SH oxidation Protein Oxidation Blood, Cells, Tissue extracts
3-nitrotyrosine modification Protein Nitration Blood, Cells, Tissue extracts
3-chlorotyrosine modification Protein Oxidation Blood, Cells, Tissue extracts
Dityrosine formation Protein Oxidation Blood, Cells, Tissue extracts
Advanced Glycation End Products (AGE) accumulation Protein Glycation Blood, Cells, Tissue extracts
Advanced Oxidation Protein Products (AOPP) Protein Oxidation Blood, Cells, Tissue extracts
Lipid Targets8-isoprostaglandin oxidation Lipid Peroxidation Blood, Bodily fluids, Cells, Tissue extracts
Malondialdehyde (MDA) Lipid Peroxidation Blood, Bodily fluids, Cells, Tissue extracts
8-iso-Prostaglandin F2α (8-isoprostane) Lipid Peroxidation Blood, Bodily fluids, Cells, Tissue extracts
4-Hydroxynonenal (4-HNE) Lipid Peroxidation Blood, Cells, Tissue extracts
Thiobarbituric acid reactive substances (TBARS) (MDA assay) Lipid Peroxidation Blood, Bodily fluids, Cells, Tissue extracts
Oxidized HDL Lipid Oxidation Blood, Bodily fluids
Oxidized LDL Lipid Oxidation Blood, Bodily fluids
Nucleic Acid Targets8-hydroxyguanosine (8-OHG) DNA Oxidation Blood, Bodily fluids, Cells, Tissue extracts
8-hydroxydeoxyguanosine (8-OHdG) DNA Oxidation Blood, Bodily fluids, Cells, Tissue extracts
Apurinic/apyrimidinic (Abasic/AP) sites DNA Oxidation Cells, Tissue extracts
8-hydroxyadenine DNA Oxidation Blood, Bodily fluids, Cells, Tissue extracts
5-hydroxycytosine DNA Oxidation Blood, Bodily fluids, Cells, Tissue extracts
Benzopyrene (BPDE) DNA Adduct DNA Damage Cells, Tissue extracts
DNA double-strand breaks (DSBs) DNA Oxidation/DNA Damage Cells
Universal TargetsHydrogen Peroxide General ROS Blood, Bodily fluids, Cells, Tissue extracts
Nitric oxide General RNS Blood, Bodily fluids, Cells, Tissue extracts
Myeloperoxidase (MPO) General ROS Blood, Bodily fluids, Cells, Tissue extracts
S-glutathionylation General ROS/RNS Blood, Bodily fluids, Cells, Tissue extracts
Catalase Anti-oxidant Blood, Cells, Tissue extracts
Glutathione peroxidase GPX-1 Anti-oxidant Blood, Bodily fluids, Cells, Tissue extracts
GSH Anti-oxidant Blood, Cells, Tissue extracts
Superoxide Dismutase Anti-oxidant Blood, Bodily fluids, Cells, Tissue extracts
Ferric Reducing Ascorbate (FRASC) Anti-oxidant Blood, Bodily fluids, Cells, Tissue extracts
Table 1. Common biomarkers in oxidative stress research*
*Adapted from Babusikova E. et al. (2013)

4
As indicated in the preceding tables, there are numerous biomarkers, protein targets, enzymatic reactions and pathological consequences linked to biological redox reactions and oxidative stress. Fortunately, the approaches available for quantifying, imaging, and analyzing the cellular and physiological responses governing a cell’s redox biology and oxidative state are equally broad. Oxidative stress is essentially driven by an imbalance or dyshomeostasis in vital redox chemistries. Most assays and reagents developed to study oxidative stress either use the direct chemical imbalance to detect the oxidative state, or they detect the downstream consequences of the oxidative condition on the proteins, lipids, DNA, or cellular processes.
For example, reduced glutathione (GSH) is considered to be one of the most important scavengers of reactive oxygen species, and its ratio with oxidized glutathione (GSSG, shown in Figure 2) is a well-accepted biomarker of oxidative stress30. Normally, GSH acts as an important ROS scavenger and works to maintain the level of toxic compounds like peroxides at a low level, as well as to regenerate important cellular anti-oxidant molecules like ascorbic acid (vitamin C) which help to maintain redox homeostasis6.
Alcohol dehydrogenase (AdhE) Glyoxalase Enzymes
Aldehyde Oxidase Enzyme family Myeloperoxidase/MPO
Catalase NAD(P)H dehydrogenase Enzymes (NQO1, NQO2)
COX (Cyclooxygenase) Enzymes NADPH Oxidases
FeS Enzymes (i.e. succinate dehydrogenase, aconitase, dihydroxyacid dehydratase)
Nitric oxide synthase Enzyme family (NOS, eNOS, nNOS)
GAPDH (Glyceraldehyde 3-phosphate dehydrogenase) Peroxiredoxin Enzyme family
Glutaredoxin Enzyme family SOD (Superoxide Dismutase)Enzyme Family
Glutathione Peroxidase Thioredoxin Reductase Enzyme Family
Table 2. Selected enzyme families studied in oxidative stress
Disease Systems Affected Link to Oxidative Stress
Macular degeneration Eyes, retina ROS and intermediates
Diabetes Multiple organs ROS multiple enzyme dysfunction
Chronic fatigue Multiple organs Inflammation, C-reactive protein (CRP), ROS
Autoimmune disorders (Lupus, RA, MS)
Immune system, Multiple organs, Joints
Inflammatory ROS
Asthma Lung Inflammatory ROS
Neurodegenerative Diseases (Alzheimer’s, Parkinson’s, Amyotrophic Lateral Sclerosis Disease)
Brain, CNS, PNS ROS/RNS, inflammation
Nephritis Kidney ROS, Glutathione dysfunction
Melanoma Skin DNA damage, lipid peroxidation, ROS
Myocardial infarction Heart ROS
Metabolic Syndrome Multiple organ ROS/RNS, inflammation
Table 3. Diseases associated with oxidative stress*
*Adapted from Rahal, A. et al. (2014)
O
OO
O
HO
HO
O O
O
O
O
OO S
S
Glutathione(GSH)
GSSG
O
OH
OH
OH
OH
HS
NHNH
NHNH
NHNH
NH2
NH2
NH2
Figure 2: GSH to GSSH diagram* *Adapted from Zitka, O. et al. (2012)
Oxidative stress research methodology

5
The GSH:GSSG ratio in normal, healthy cells is known to be greater than 100:1. However, under various models of oxidative stress, this healthy ratio can plummet to just 10:1 or lower7,30. These levels can be measured either directly via chromatography, or biochemically by exploiting the existing chemistry with indicators or dyes, and quantifying the signal. For example, by including the chromogenic dye compound DTNB as an indicator (Merck Millipore Cat. No. 371757 or APT250), one can measure the level GSH:GSSG in cell extracts by ELISA (Figure 3).
More recently, GSH:GSSG levels have been measured using live cell dyes that become fluorescent only when reacted under oxidized conditions, such as monochlorobimane (mBCI) or newer dyes like ThiolTracker™ Violet. These can be used to measure levels dynamically, thus enabling researchers to analyze oxidative stress in real time3,5.
Detection of modified targets of ROS/RNS activityThe consequence of ROS activity can be detected directly by measuring physical changes. For example, the modification of guanine in DNA to 8-hydroxydeoxguanosine (8-OdHG) or the tyrosine in proteins to nitrotyrosine may be detected by specific antibodies or by altering the ROS modification through linking it to a chemical tag and then employing immunodetection or other means. Figure 4 shows the use of antibodies to detect ROS byproducts, and Table 4 lists some commonly used antibodies (see appendix for a wider selection).
Antibody Target Catalog Number
Aldehyde dehydrogenase 3A (Aldh3A1) ABS454
γ H2A.X 16-202A
4-Hydroxynonenal (4-HNE) AB5605
8-Hydroxydeoxyguanosine (8-OHdG) AB5830
8-Hydroxyguanosine MAB3560
Lysyl Oxidase (LOX) ABT112
Cu/Zn SOD 07-403
Dual Oxidase 2 MABN787
Myeloperoxidase 475915
NADPH Oxidase ABC459
Neuronal Nitric Oxide Synthase (nNOS) AB5380
Nitrotyrosine AB5411
Peroxiredoxin 1 07-609
Superoxide dismutase 1 (SOD1) AB5482
Thioredoxin 1 (TRX) AB9328
Table 4. Selected antibodies used in oxidative stress research
Figure 3: Measuring the level of GSSG using a chromogenic dye.**Representative data using Merck Millipore Cat. No. 371757
Figure 4: Modifications to DNA, lipids, and proteins caused by oxidative stress were analyzed using immunohistochemical (IHC) and immunofluorescence (IF) techniques.
Protein oxidation detection using Nitrotyrosine antibody (Catalog No. AB5411)
DNA oxidation detection using 8-Hydroxydeoxyguanosine antibody (Catalog No. AB5830)
Detection of DNA damage by oxidative stress usinganti-phospho-histone H2A.X (Ser139), clone JBW301, Alexa Fluor® 488 conjugated antibody (Catalog No. 05-636-AF488)
Lipid peroxidation detection using 4-Hydroxynonenal antibody (Catalog No. AB5605)
6
5
4
3
2
1
00 20
Hours
GSSG Stability inIntact Red Blood Cells at +4°C
GSSG
, µM
40 60 80
Sample 1Sample 2

6
Protein carbonylation and the formation of the protein carbonyl group is a common modification observed under oxidative stress. High levels of protein carbonylation have been associated with various diseases, including Alzheimer’s disease, diabetes, autoimmune disease, arthritis, sepsis, and respiratory distress8. Protein carbonylation can be detected and measured by chemically linking the existing carbonyl groups to a detection molecule, most commonly dinitrophenol (DNP), and then detecting that entity with an antibody. Because they are commercially available, researchers have access to assays that include most common methods including western blot, IHC, ELISA, and flow cytometry. An example of detection via chemically altering the ROS modification is shown in Figure 5.
Merck Millipore applies this antibody-based technology to various platforms to enable ROS activity detection: Western blot (OxyBlot™ Protein Oxidation Detection Kit; Catalog No. S7150), ELISA (OxyELISA™ Oxidized Protein Quantitation Kit; Catalog No. S7250), ICC (OxyICC™ Oxidized Protein Detection Kit; Catalog No. S7350), IHC (OxyIHC™ Oxidative Stress Detection Kit; Catalog No. S7450), and flow cytometry (Nitrotyrosine Assay Kits; Catalog Nos. 17-10006 & 17-376). This is a useful technique, and applying it to immunohistochemistry, for instance, enables the localization of the affected tissue in relation to healthy tissues, which can be useful in measuring the effect of ischemic conditions such as stroke. With appropriate controls and data collection methods, staining can be semi-quantitative as well.
Figure 5: Diagram of assay used in various OxyBlot™, OxyELISA™, OxyICC™, OxyIHC™ and FlowCellect® protein oxidation detection assays*. Method detects the DNP epitope using an anti-DNP specific antibody (e.g. MAB2223) and has been adapted for ready-to-use kits for applications in flow cytometry, western blot, ELISA and immunocytochemistry, and immunohistochemistry.
Oxidative Stress (H2O2, NO, Superoxides etc.)
Protein sample from cell lysate, tissue homogenate, biological fluids.
Carbonyl-modified protein
DNPH Anti-DNP conjugated to HRP
DNP-derivatized protein
O YYY
H2N
NHNO2
NO2
NH
N
NO2
NO2
YNHN
NO 2NO 2
Immunodetection
Detection Platforms
ICC IHCWesternBlot
1 2 3 4 5 6 7
FlowCytometry
160
140
100
Coun
t80
6040
200
100 101 102
DXP-FITC (GRN-HLog)103 104
ELISA
1.6
1.4
1.2
1.0
0.8
0.6
0.4
0.4nmol
car
bony
ls/m
g pr
otei
n
0 500
100H2O2 treated (µM)
200 400
7
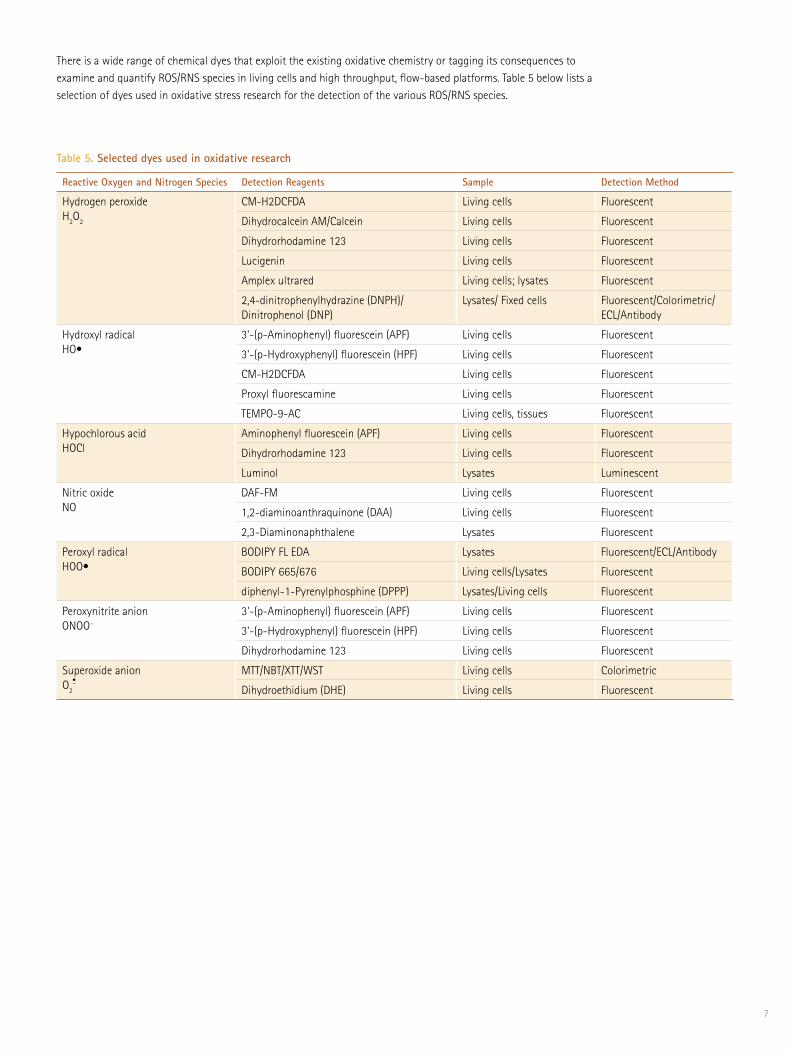
There is a wide range of chemical dyes that exploit the existing oxidative chemistry or tagging its consequences to examine and quantify ROS/RNS species in living cells and high throughput, flow-based platforms. Table 5 below lists a selection of dyes used in oxidative stress research for the detection of the various ROS/RNS species.
Reactive Oxygen and Nitrogen Species Detection Reagents Sample Detection Method
Hydrogen peroxide H2O2
CM-H2DCFDA Living cells Fluorescent
Dihydrocalcein AM/Calcein Living cells Fluorescent
Dihydrorhodamine 123 Living cells Fluorescent
Lucigenin Living cells Fluorescent
Amplex ultrared Living cells; lysates Fluorescent
2,4-dinitrophenylhydrazine (DNPH)/ Dinitrophenol (DNP)
Lysates/ Fixed cells Fluorescent/Colorimetric/ ECL/Antibody
Hydroxyl radical HO•
3'-(p-Aminophenyl) fluorescein (APF) Living cells Fluorescent
3'-(p-Hydroxyphenyl) fluorescein (HPF) Living cells Fluorescent
CM-H2DCFDA Living cells Fluorescent
Proxyl fluorescamine Living cells Fluorescent
TEMPO-9-AC Living cells, tissues Fluorescent
Hypochlorous acid HOCl
Aminophenyl fluorescein (APF) Living cells Fluorescent
Dihydrorhodamine 123 Living cells Fluorescent
Luminol Lysates Luminescent
Nitric oxide NO
DAF-FM Living cells Fluorescent
1,2-diaminoanthraquinone (DAA) Living cells Fluorescent
2,3-Diaminonaphthalene Lysates Fluorescent
Peroxyl radical HOO•
BODIPY FL EDA Lysates Fluorescent/ECL/Antibody
BODIPY 665/676 Living cells/Lysates Fluorescent
diphenyl-1-Pyrenylphosphine (DPPP) Lysates/Living cells Fluorescent
Peroxynitrite anion ONOO–
3'-(p-Aminophenyl) fluorescein (APF) Living cells Fluorescent
3'-(p-Hydroxyphenyl) fluorescein (HPF) Living cells Fluorescent
Dihydrorhodamine 123 Living cells Fluorescent
Superoxide anion O2
–•MTT/NBT/XTT/WST Living cells Colorimetric
Dihydroethidium (DHE) Living cells Fluorescent
Table 5. Selected dyes used in oxidative research

8
Aside from measuring ROS/RNS species and their consequences upon macromolecules themselves, significant efforts in research are focused upon the impact that oxidative stress has on the living cell’s health and metabolism. The impact of ROS/RNS species on cell metabolism can be measured using bead-based multiplex assay technology, such as the Luminex® platform, where levels of individual analytes can be quantified by comparing signals with a standard curve. Multiplex assays have readouts that are similar to traditional single analyte ELISAs, but they are more complex because of the difficulties associated with antibody interactions and multi-target matrix effects. Analytically validated multiplex analyte panels and arrays address these complexities.
Traditionally a mainstay of cytokine and inflammation research, multiplex assays are also widely used in toxicology and new arenas like oxidative stress. For example, multiplex assays are used to measure the upregulation of anti-oxidant associated enzymes such as superoxide dismutases, catalases, glutathione peroxidases, and peroxiredoxins. These enzymes
are used by cells to defend themselves against ROS damage by clearing the ROS/RNS molecules. In normal conditions, superoxide dismutase and catalase convert the superoxide and hydrogen peroxide ROS radicals into oxygen and water to minimize the damage to the cells. However, when the ROS clearance pathway is impaired, accumulation of ROS can cause oxidative stress to the cells and induce DNA damage, lipid peroxidation, and enzyme inactivation. An example of the kind of data generated through multiplex assays for such anti-oxidant enzymes is shown in Figure 6.
Furthermore, an advantage of multiplex assay platforms is that analyte targets from multiple pathways can be measured together, thereby allowing the quantification of pathway interactions. For example, drugs and various compounds can act as sources of oxidative stress, which is a major cause of cell cytotoxicity-mediated cell death in the liver. Figure 7 shows multiplexed quantitation of biomarkers of drug-induced liver injury (DILI), a measure of liver cytotoxicity, in rat liver following treatment with various small molecule drug compounds such as acetaminophen (APAP) and thioacetamide (TAA).
Figure 6: Multiplexed analysis of oxidative stress associated enzymes in human cell lines and heart tissue. Lysates from different human cell lines (HUVEC, HEK 293, HeLa, and HepG2) and heart tissue were analyzed with the MILLIPLEX® map Human Oxidative Stress Magnetic Bead Panel (Catalog No. H0XSTMAG-18K) according to the assay protocol. The Median Fluorescence Intensity (MFI) was measured with the Luminex® system.
Figure 7: Multiplexed quantitation of biomarkers of drug-induced liver injury in rat following treatment with acetaminophen or thioacetamide. (A) Time-course measurements of blood protein concentrations of hepatotoxicity biomarkers ARG1, GOT1, GST-α, 5’-NT and SDH in rat acetaminophen injury model. (B) Blood protein concentrations of ARG1, GOT1, GST-α, 5’-NT and SDH are elevated in rat thioacetamide liver injury model. The MILLIPLEX® map Rat Liver Injury Magnetic Bead Panel (Catalog No. RLI1MAG-92K) was used to quantify blood protein concentration.
ARG1
GOT1GSTA
5NT
SDH
150000
pre-b
leed
24 hr
t48
hr72
hr96
hr
10000050000
4500
3000
1500
0
pg/m
L
Aver
age
MFI
10
100
1000
10000
100000 ARGARG toxGOT1GOT1 ctrlGOT1 toxGSTAGSTA tox5NT5NT toxSDHSDH tox101
100
1000
1000
0
1000
00
1000
000
Concentration (pg/mL)
A. B.
0SOD1
5
MFI
(x10
00)
10
15
20
25
30
Catalase SOD2
Human Oxidative Stress Panel:Differential Expression in Cell Lines and Tissues
TRX1 PRX2
HUVEC293HeLaHepG2HepG2 LyoHuman Heart
Measuring pathways and complex cellular responses to oxidative stress
9
The results demonstrate that such multi-analyte panels can be used for quantitative immunoassays that simultaneously and precisely measure circulating hepatotoxicity biomarkers and prominent cytokines, demonstrating the value of this very powerful approach for investigators to monitor oxidative stress and its impact on cellular pathways.
As demonstrated in the previous example, drugs and other small molecules are often sources of oxidative stress. In biological research, small molecule inhibitors are often used to modulate an experimental system to assist researchers in sorting out the myriad complex protein and chemical interactions that are occurring at any one time.
With redox biology and ROS/RNS species playing such vital roles in living systems, their impact on gene expression has been well studied. Direct signaling by ROS/RNS can impact gene expression, in turn affecting cell health and cell proliferation; for example, NO-mediated signaling can regulate gene expression12,22,23. Traditional methods for examining gene expression follow what have become standard approaches, from quantitative PCR to RNA sequencing.
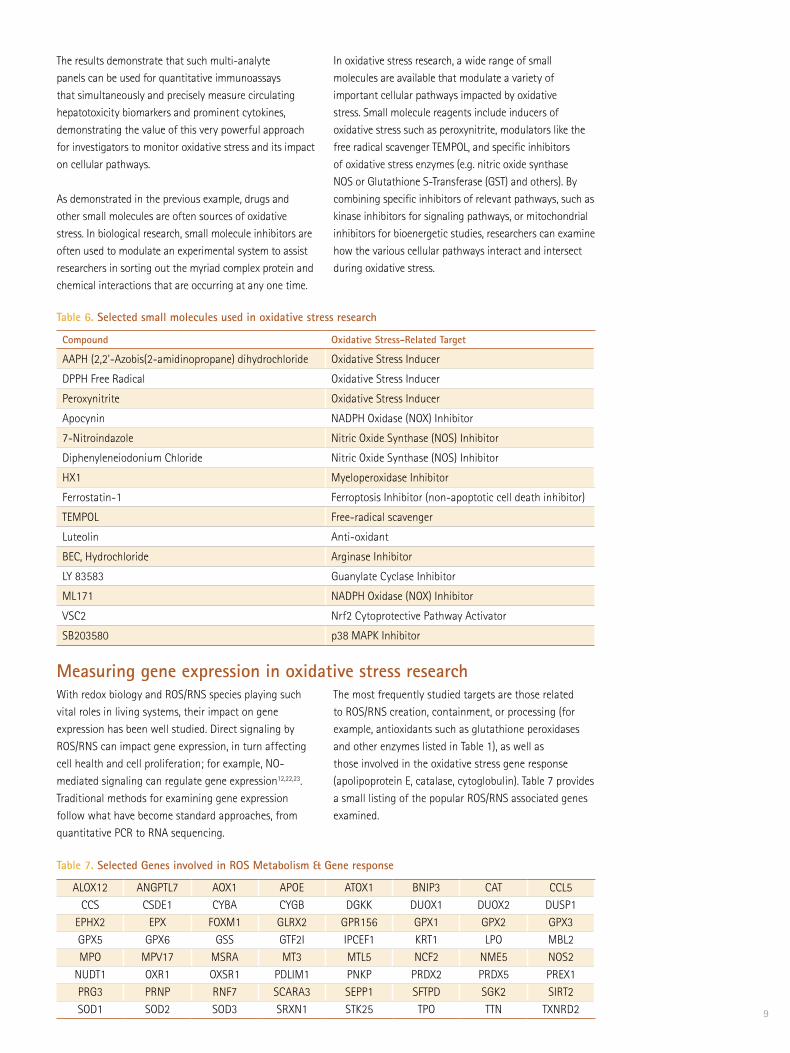
In oxidative stress research, a wide range of small molecules are available that modulate a variety of important cellular pathways impacted by oxidative stress. Small molecule reagents include inducers of oxidative stress such as peroxynitrite, modulators like the free radical scavenger TEMPOL, and specific inhibitors of oxidative stress enzymes (e.g. nitric oxide synthase NOS or Glutathione S-Transferase (GST) and others). By combining specific inhibitors of relevant pathways, such as kinase inhibitors for signaling pathways, or mitochondrial inhibitors for bioenergetic studies, researchers can examine how the various cellular pathways interact and intersect during oxidative stress.
Compound Oxidative Stress-Related Target
AAPH (2,2'-Azobis(2-amidinopropane) dihydrochloride Oxidative Stress Inducer
DPPH Free Radical Oxidative Stress Inducer
Peroxynitrite Oxidative Stress Inducer
Apocynin NADPH Oxidase (NOX) Inhibitor
7-Nitroindazole Nitric Oxide Synthase (NOS) Inhibitor
Diphenyleneiodonium Chloride Nitric Oxide Synthase (NOS) Inhibitor
HX1 Myeloperoxidase Inhibitor
Ferrostatin-1 Ferroptosis Inhibitor (non-apoptotic cell death inhibitor)
TEMPOL Free-radical scavenger
Luteolin Anti-oxidant
BEC, Hydrochloride Arginase Inhibitor
LY 83583 Guanylate Cyclase Inhibitor
ML171 NADPH Oxidase (NOX) Inhibitor
VSC2 Nrf2 Cytoprotective Pathway Activator
SB203580 p38 MAPK Inhibitor
Table 6. Selected small molecules used in oxidative stress research
Table 7. Selected Genes involved in ROS Metabolism & Gene response
The most frequently studied targets are those related to ROS/RNS creation, containment, or processing (for example, antioxidants such as glutathione peroxidases and other enzymes listed in Table 1), as well as those involved in the oxidative stress gene response (apolipoprotein E, catalase, cytoglobulin). Table 7 provides a small listing of the popular ROS/RNS associated genes examined.
ALOX12 ANGPTL7 AOX1 APOE ATOX1 BNIP3 CAT CCL5CCS CSDE1 CYBA CYGB DGKK DUOX1 DUOX2 DUSP1
EPHX2 EPX FOXM1 GLRX2 GPR156 GPX1 GPX2 GPX3GPX5 GPX6 GSS GTF2I IPCEF1 KRT1 LPO MBL2MPO MPV17 MSRA MT3 MTL5 NCF2 NME5 NOS2
NUDT1 OXR1 OXSR1 PDLIM1 PNKP PRDX2 PRDX5 PREX1PRG3 PRNP RNF7 SCARA3 SEPP1 SFTPD SGK2 SIRT2SOD1 SOD2 SOD3 SRXN1 STK25 TPO TTN TXNRD2
Measuring gene expression in oxidative stress research

10
With our growing understanding of gene regulation and RNA metabolism, miRNAs are increasingly being researched for their role in oxidative stress and ROS/RNS regulation. Table 8 lists some of the miRNAs that are known to touch oxidative stress and redox biology.
Lastly, new detection technologies, such as SmartFlare™ RNA detection probes, enable measurement of oxidative stress response in single, live cells, using flow cytometry, imaging flow cytometry, or other cell analysis methods. Such technologies offer researchers the ability to track these miRNA and also mRNA corresponding to ROS/RNS metabolic and response genes in heterogeneous cell populations.
MicroRNAs Association with oxidative stress
miR-150 downregulated
miR-142-5p downregulated
miR-122 downregulated
miR-34c upregulated
miR-34-5p upregulated
miR-29b upregulated
miR-743a involved
miR-335 involved
miR-34a involved
miR-200c involved
miR-145 involved
miR-205 involved
miR-320 involved
Let-7 involved
miR-23 involved
miR144 involved
miR-451 involved
Table 8. New miRNA targets associated with oxidative stress*
Adapted from Ganguly, N.K. et al. (2014)
*Adapted from Marin-Garcia, J. et al. (2013)
Measuring mitochondrial health in oxidative stressMitochondrial function is critical to cellular health. Ironically, mitochondria are responsible for up to 90% of the endogenous ROS present in the normal healthy cell11, so it is not surprising that oxidative stress research focuses much attention on tracking mitochondrial ROS and measuring mitochondrial function and health. Because mitochondria are dynamic organelles that move and fuse inside living cells, the advancements made in fluorescent and potentiometric dyes have made it possible to study not only the number and size of mitochondria in cells but also their health, membrane potential, and the impact of oxidative stress and cell death processes.
Mitochondrial membrane potential (Δψm) is a critical measurement as it relates to the cell’s capacity to generate ATP by oxidative phosphorylation. The maintenance of the mitochondrial membrane potential is accomplished by a delicate balance of electrical charges, pH, and ion gradients. Oxidative stress and the associated ROS impact these electrical and chemical gradients, and when the ionic fluxes surpass the ability of the mitochondria to buffer them, the mitochondrial membrane potential can collapse and lead to bioenergetic stress and cell death20.
Most of the mitochondria-specific dyes used in oxidative research depend upon a healthy mitochondrial membrane potential for entry and accumulation. The mitochondrial dyes are positively charged lipophilic compounds that equilibrate across membranes in a polarized fashion. In other words, the amount of dye that accumulates is proportional to the polarization of the membrane potential. As the dyes enter and become concentrated, many undergo a fluorescence shift that can be used to monitor the status of the mitochondrial membrane potential and, by extension, mitochondrial function.
Fluorescent Dye Ex Max Em Max Comment/ Function
DASPEI 461 589 Excellent for staining live mitochondria in living cells
DiOC6 488 501 Indicator of mitochondrial membrane potential, widely used but must use very low concentrations
JC-1 498 527/599 Indicator of mitochondrial membrane potential; spectral shift depends upon dye concentration; commonly used in apoptosis studies
MitoSense Red (DilC1(5))
638 659 Indicator of mitochondrial health, useful when combined with other cytoplasmic dyes like CF488A and 7-AAD for cell health studies
MitoSOX Red 488 580 A live-cell permeant fluorogenic dye which targets the mitochondria and reacts with superoxide radicals and fluoresces yellow/red
NAO 495 522 Uptake is not dependent upon mitochondrial membrane potential, good for measuring mass
RHOD 123 507 529 Indicator of mitochondrial membrane potential and ATP production, fast but can be self-quenching
TMRE TMRM 533 576 Indicator of mitochondrial membrane potential but more permeable than RHOD 123, low mitochondrial binding, effective a low concentrations (1-30 nM)
Table 9. Common fluorescent dyes to study mitochondria

11
MitoSOX red is a live-cell-permeant fluorogenic dye that targets the mitochondria because it binds mtDNA, but also reacts with superoxide radicals present in excess during oxidative stress and fluoresces yellow/red. CF647 is a bright, far red fluorescent dye. An example of how mitochondrial health is examined using dyes such as these is shown in Figure 8. Here, the FlowCellect® MitoStress Kit (Catalog No. FCCH100109) was used to collect information on both oxidative stress and apoptotic state in a population of cells using flow cytometry.
The FlowCellect® MitoStress Kit includes MitoSOX Red as well as Annexin V conjugated to CF647 (which binds to phosphatidylserine (PS) on the surface of apoptotic cells). As shown in Figure 8, healthy control cells do not
demonstrate Annexin V signal, while apoptotic cells will exhibit positive 665 nm fluorescence as Annexin V binds exposed PS. The FlowCellect® MitoStress kit can thus distinguish the following populations: 1) Live, healthy, cells with little or no superoxide; 2) Stressed cells with oxidized MitoSOX Red (indicator of accumulated superoxide) but no Annexin V staining; 3) Stressed and Early Apoptotic cells with oxidized MitoSOX Red and Annexin V binding; and 4) Apoptotic Cells with Annexin V binding only. Because the assay is flow cytometry-based, it is rapid and requires minimal sample. Researchers can exploit this biochemistry to their advantage to assess levels of oxidative stress (measured via the MitoSOX red fluorescence) and the state of apoptosis (measured by CF647 fluorescence).
Figure 8: Dot plot analysis of Jurkat cells treated with different inducers and then stained using FlowCellect® MitoStress Kit. Untreated Jurkat cells (left plot), or those treated with 150 μM Antimycin A (inhibitor of Mitochondrial complex III which increases mitochondrial ROS production, middle plot), or with 1 μM Staurosporine (right plot) were stained using FlowCellect® MitoStress Kit and analyzed by flow cytometry. Samples which undergo a change in mitochondrial superoxide production show an increase in yellow/red fluorescence and samples which demonstrate increased apoptosis show an increase in red2 fluorescence.
Mito
Sox
Red
Annexin V CF647
Yello
w F
luor
esce
nce
(YEL
-HLo
g)
2.9% 3.9%
89.9% 3.4%
Red2 Fluorescence (RED2-HLog)
Uninduced
100 101 102 103 104100
101
102
103
104
Yello
w F
luor
esce
nce
(YEL
-HLo
g)
97.1% 2.5%
0.4% 0%
Red2 Fluorescence (RED2-HLog)
150 μM Antimycin A
100 101 102 103 104100
101
102
103
104
Yello
w F
luor
esce
nce
(YEL
-HLo
g)
0.3% 90.1%
2.2% 7.4%
Red2 Fluorescence (RED2-HLog)
1 μM Staurosporine
100 101 102 103 104100
101
102
103
104

12
In the FlowCellect® MitoDamage Kit (Figure 9), MitoSense Red is combined with Annexin V conjugated to the dye CF488A, and combined with the cell impermeant DNA intercalator 7-Aminoactinomycin-D (7-AAD), a dye that distinguishes dead from live cells. The simultaneous use of these reagents enables the simultaneous determination of viability along with early, mid and late apoptosis in one simple assay. Healthy cells with intact mitochondrial membrane potentials demonstrate robust fluorescence at 650 nm from MitoSense red, while cells which have impaired mitochondrial membrane potential demonstrate lower 650 nm fluorescence. The early-apoptosis indicator Annexin V is labeled with the green fluorophore CF488A, so healthy cells exhibit no green fluorescence, while apoptotic cells fluoresce green. Finally, by including the 7-AAD dye, permeability changes typically observed later in apoptosis as well as in necrotic
cell death can also be determined. 7-AAD is excluded from live, healthy cells as well as early apoptotic cells and these cells have low red fluorescence, but 7-AAD can pass into late stage and necrotic cells thus these cells exhibit strong 7-AAD fluorescence. Therefore in such an analysis four different cell populations can be distinguished: 1) Live cells with normal mitochondrial membrane potential; 2) Cells with dissipated membrane potential but no Annexin V or 7AAD staining; 3) Early apoptotic cells with dissipated membrane potential and Annexin V binding; and 4) Late apoptotic cells or dead cells with dissipated membrane potentials. The capacity for this assay to place each cell into one of these populations provides a complete picture of mitochondrial and cell health and enables correlation of mitochondrial damage to cell health.
Figure 9: Dot plots depicting Jurkat cells treated with multiple inducers and stained using the FlowCellect® MitoDamage Kit. Jurkat cells were treated with zero (left), 2 µM Staurosporine (middle) and 50 µM CCCP (right) and then stained using the MitoDamage Kit. Plots show the percentage of positive cells for 1) Apoptosis (Annexin V binding) and mitochondrial membrane potential change (Red2), 2) Cell death and mitochondrial membrane potential change, and 3) apoptosis and cell death.
Mito
Sens
e Re
d
Annexin V, CF488A
Mito
Sens
e Re
d7-
AAD
Annexin V, CF488A
Red2
Flu
ores
cenc
e (R
D2-H
Log)
Green Fluorescence (GRN-HLog)
94.4%
0.75% 3.7%
Uninduced
100 101 102 103 104100
101
102
103
104
1.1%
Red2
Flu
ores
cenc
e (R
D2-H
Log)
Red Fluorescence (RED-HLog)
0.3%
3.2% 1.3%100 101 102 103 104
100
101
102
103
104
95.2%
Red2
Flu
ores
cenc
e (R
D2-H
Log)
Green Fluorescence (GRN-HLog)
0.16%
95.2% 3.2%100 101 102 103 104
100
101
102
103
104
1.4%
Red2
Flu
ores
cenc
e (R
D2-H
Log)
Red Fluorescence (RED-HLog)
0.06%
70.5% 28.2%100 101 102 103 104
100
101
102
103
104
1.2%
Red2
Flu
ores
cenc
e (R
D2-H
Log)
Red Fluorescence (RED-HLog)
0.10%
93.9% 4.8%100 101 102 103 104
100
101
102
103
104
1.2%
Red2
Flu
ores
cenc
e (R
D2-H
Log)
Red Fluorescence (RED-HLog)
58.4%
40.4% 1.2%100 101 102 103 104
100
101
102
103
104
0.06%
Red2
Flu
ores
cenc
e (R
D2-H
Log)
Red Fluorescence (RED-HLog)
0.26%
98.4% 1.3%100 101 102 103 104
100
101
102
103
104
0.02%
Red2
Flu
ores
cenc
e (R
D2-H
Log)
Green Fluorescence (GRN-HLog)
54.7%
14.6% 27.0%
2 μM Staurosporine
100 101 102 103 104100
101
102
103
104
3.7%
Red2
Flu
ores
cenc
e (R
D2-H
Log)
Green Fluorescence (GRN-HLog)
0.20%
93.2% 6.6%
50 μM CCCP
100 101 102 103 104100
101
102
103
104
0.04%
7-AAD
13
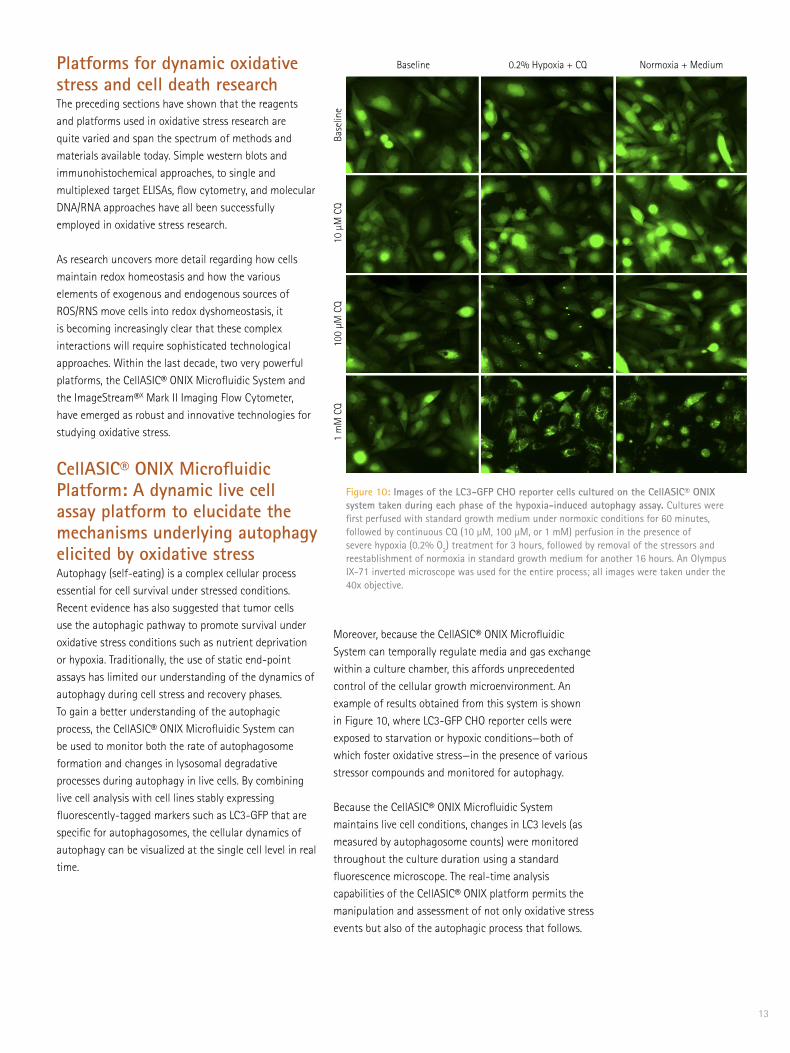
Figure 10: Images of the LC3-GFP CHO reporter cells cultured on the CellASIC® ONIX system taken during each phase of the hypoxia-induced autophagy assay. Cultures were first perfused with standard growth medium under normoxic conditions for 60 minutes, followed by continuous CQ (10 µM, 100 µM, or 1 mM) perfusion in the presence of severe hypoxia (0.2% O2) treatment for 3 hours, followed by removal of the stressors and reestablishment of normoxia in standard growth medium for another 16 hours. An Olympus IX-71 inverted microscope was used for the entire process; all images were taken under the 40x objective.
Platforms for dynamic oxidative stress and cell death researchThe preceding sections have shown that the reagents and platforms used in oxidative stress research are quite varied and span the spectrum of methods and materials available today. Simple western blots and immunohistochemical approaches, to single and multiplexed target ELISAs, flow cytometry, and molecular DNA/RNA approaches have all been successfully employed in oxidative stress research. As research uncovers more detail regarding how cells maintain redox homeostasis and how the various elements of exogenous and endogenous sources of ROS/RNS move cells into redox dyshomeostasis, it is becoming increasingly clear that these complex interactions will require sophisticated technological approaches. Within the last decade, two very powerful platforms, the CellASIC® ONIX Microfluidic System and the ImageStream®X Mark II Imaging Flow Cytometer, have emerged as robust and innovative technologies for studying oxidative stress.
CellASIC® ONIX Microfluidic Platform: A dynamic live cell assay platform to elucidate the mechanisms underlying autophagy elicited by oxidative stress Autophagy (self-eating) is a complex cellular process essential for cell survival under stressed conditions. Recent evidence has also suggested that tumor cells use the autophagic pathway to promote survival under oxidative stress conditions such as nutrient deprivation or hypoxia. Traditionally, the use of static end-point assays has limited our understanding of the dynamics of autophagy during cell stress and recovery phases. To gain a better understanding of the autophagic process, the CellASIC® ONIX Microfluidic System can be used to monitor both the rate of autophagosome formation and changes in lysosomal degradative processes during autophagy in live cells. By combining live cell analysis with cell lines stably expressing fluorescently-tagged markers such as LC3-GFP that are specific for autophagosomes, the cellular dynamics of autophagy can be visualized at the single cell level in real time.
Moreover, because the CellASIC® ONIX Microfluidic System can temporally regulate media and gas exchange within a culture chamber, this affords unprecedented control of the cellular growth microenvironment. An example of results obtained from this system is shown in Figure 10, where LC3-GFP CHO reporter cells were exposed to starvation or hypoxic conditions—both of which foster oxidative stress—in the presence of various stressor compounds and monitored for autophagy.
Because the CellASIC® ONIX Microfluidic System maintains live cell conditions, changes in LC3 levels (as measured by autophagosome counts) were monitored throughout the culture duration using a standard fluorescence microscope. The real-time analysis capabilities of the CellASIC® ONIX platform permits the manipulation and assessment of not only oxidative stress events but also of the autophagic process that follows.
Base
line
Baseline
10 µ
M C
Q10
0 µM
CQ
1 m
M C
Q
0.2% Hypoxia + CQ Normoxia + Medium

14
Amnis brand ImageStream®X Mark II Imaging Flow Cytometer: high resolution images of thousands of cells undergoing oxidative stressOxidative stress research techniques and methods rely heavily on identifying markers and utilizing detection chemistries to help scientists quantify, record, and compare the cellular and organismal responses to oxidative stress. With the advances made in fluorescent chemistries and the increasing use of live cell analysis as an experimental stage, combined with the need for statistically significant data from populations, the advantages of a system that collects images in flow are clear.
The ImageStream®X Mark II Imaging Flow Cytometer platform combines the power of digital fluorescence microscopy with the speed and sensitivity of flow cytometry to enable researchers to approach scientific questions with experimental approaches that are not possible with either technique alone. For example, ionizing radiation is an exogenous source of oxidative stress that results in DNA damage. One of the most common methods of detecting DNA damage as measured by the DNA double strand breaks (DSBs) that are the hallmark of ionizing radiation is to detect the phosphorylation of histone H2A.X using a phosphospecific antibody that has been labeled with a fluorescent tag15. Phosphorylated H2AX (γ-H2AX) facilitates recognition and repair of DNA double strand
Figure 11: Quantitation of γ-H2AX foci in irradiated cells using the ImageStream®X platform. Imaging flow cytometry was used to visualize the presence of phosphorylated histone H2A.X in the nuclei of irradiated cells in order to quantify the level of DNA damage response in every cell of a large population.
breaks that may occur from exposure to ionizing radiation. Staining irradiated cells for γ-H2AX reveals nuclear foci that are readily observed microscopically in a dose-dependent manner (Figure 11).
Irradiated cells were analyzed for the number of spots in the nuclear region using advanced masking techniques that identify punctate staining. Morphological measurements employed in this analysis including object shape, size, and punctate fluorescence spot counting emphasize the advantages of quantitative multiparametric image analysis on large numbers of cells enabled by the ImageStream®X system.
As discussed, oxidative stress can have an impact on cell health and even activate apoptotic or autophagic pathways. While traditional flow cytometry solutions are helpful for resolving populations based on degree of fluorescent signal from stress markers, discrimination of apoptotic cells from healthy cells is enhanced on the ImageStream®X system, which uses the image of the apoptotic cell nuclei as the differentiating data. For example, Figure 12 shows the dramatic changes in nuclear morphology that are hallmarks of apoptosis. When cells begin to die by apoptosis, fragmentation and condensation of the DNA occurs. This makes possible the automated identification of apoptotic cells by measurement of the area and the intensities of the brightest portions of the nuclear image. The bright, punctate nuclear satellites found in apoptotic cells can be quantitatively distinguished from the appearance of a normal, healthy nucleus.
Brightfield DAPI γH2A.X DAPI/ γH2A.X
10
8
6
Nor
mal
ized
Fre
quen
cy
4
2
00 10 20
Spot Count H2A.X
Nuclear Spot Count
Mean=18.5Std=5.3
30 40 50

15
Figure 12: Apoptotic Index Using the ImageStream®X Platform. Imaging flow cytometry used to quantify the degree of nuclear fragmentation in apoptotic cells.
A review of the published literature making use of the ImageStream®X technology in oxidative stress demonstrates its utility in a variety of living systems from bacteria to cancers, addressing studies from cigarette smoke toxicity and its influence on DNA damage to transcription factor localization in miR-144/451−/− mice26,29. Furthermore, one the most useful aspects that an imaging platform like the ImageStream®X instrument brings to researchers is the ability to precisely determine within a cell where a particular drug or compound, or protein is localizing. For instance, researchers examining a new chemical variant of an anti-tumor compound, which normally localized to the nucleus was found to be localized to the mitochondria and not the nucleus, thus providing an alternative explanation for its cytotoxicity than
previously thought13. In another example, researchers examining a new redox marker designed to study the dynamics of pathogenic bacteria during infection in both permissive and non-permissive human macrophages were able to discover and quantify redox marker differences in subpopulations of the human cells, while still being able to process individual images of individual bacteria. Because of the large sampling size and high image resolution available on ImageStream®X imaging flow cytometer, researchers were able to observe redox heterogeneity between cells, and even between bacteria, providing a level of detail that had not been available before26. Collectively, these studies highlight the many advantages of the ImageStream®X platform, and the advances in research it is enabling.
120
90
Nuc
lear
Are
a
60
30
0
0 103 104
Nuclear Bright Detail Intensity
105
Non-Apoptotic
Apoptotic

16
Concluding remarksThe importance and complexity of research into redox biology and that of oxidative stress cannot be underestimated. The potential damage inflicted upon biological systems by ROS/RNS and oxidative stress has been implicated in contributing to a number of important diseases including cancer, Alzheimer’s disease, heart disease, and diabetes. Therefore, there is a pressing need to learn as much as we can about the factors that manifest, contribute, respond to, and control oxidative stress in living systems. As we learn more and more about the relationship that redox biology and ROS/RNS share in the chemistry of life, we have come to
understand their importance not only in the fundamental enzymatic and energy metabolism of living things, but also in health, developmental biology, and aging. This brief review has attempted to outline some of the reagents, kits, assays, and platform options available to scientists studying redox biology and oxidative stress research. With them, scientists will be able to continue research and discovery into the cellular and environmental mechanisms that govern the production, maintenance, response and deposition of ROS/RNS species.
EXTERNAL STIMULI (Drugs/Toxicants/Environment/Nutrition/Physical)
UV/X rays Smoking Food Physical Bacteria
MitochondrialOxidative Burst
CardiovascularDisease
EndocrineDisfunction
Alzheimer’sDisease
Parkinson’sDisease
Endobiotic orxenobiotic Peroxidases
Hypertension
Change in CaHomeostasis
Alternative inProtein/Lipid
ProinflammatoryMediators
Pituitary
AutoimmuneDisorder
Renal Damage/Apoptosis
AlteredXenobiotic
Biotransformation
ImmuneDysfunction
Phagocytes/Other Cell Organelles
Limited ATPGeneration
Carcinogen/Mutation
Ageing
Hepatocellular, cervical,colon, breast cancers
TelomereShortening
CYP450Modulation
TranscriptionFactors Inhibited
NeurologicalDisorders
Susceptibleto Infection
Viruses
Necrosis/Other DisordersInternal Agents(Disease/Ischemia/
Necrosis)
AntioxidantsGSH
NADPHThioredoxin Vitamin E & C
Trace Minerals such as Selenium
Card
iopr
otec
tive
DNADamage
CytosolicEnzyme
XMEProteinKinase
ROS
ROS
O2 O2•-
H2O2
H2O
OH-
NFκB
MacrophageFatty Acid-binding
Protein-4 (aP2)
PKC
NADPHOxidase
ROS
HepaticDamage
EnergyCrisis
ChronicInflammation
Electron Transport
Overview of Oxidative Stress and Disease Development

17
References:1. Apel, K et al (2004) “Reactive oxygen species: metabolism,
oxidative stress, and signal transduction. “ Annu Rev Plant Biol. 55:373-399.PMID:15377225.
2. Babusikova E et al (2013) “Oxidative Changes and Possible Effects of Polymorphism of Antioxidant Enzymes in Neurodegenerative Disease.” In Mental and Behavioral Disorders and Diseases of the Nervous System. Uday Kishore eds, page 425.
3. Baker MA et al (1990) “Microtiter plate assay for the measurement of glutathione and glutathione disulfide in large numbers of biological samples.” Anal Biochem. 190(2):360-5. PMID:2291479.
4. Brieger, K et al (2012) “Reactive oxygen species: from health to disease.” Swiss Med Wkly. 17:142.PMID:22903797.
5. Camera E et al (2002). “Analytical methods to investigate glutathione and related compounds in biological and pathological processes. J. Chromatogr B Analyt Technol Biomed Life Sci. 781(1-2):181-206. PMID:12450659.
6. Cerielo, A et al (1997) “Hyperglycemia counterbalances the antihypertensive effect of glutathione in diabetic patients: evidence linking hypertension and glycemia through the oxidative stress in diabetes mellitus.” J. Diabetes Complications. 11(4):250-5. PMID: 9201603.
7. Chai, YC et al (1994) “S-thiolation of individual human neutrophil proteins including actin by stimulation of the respiratory burst: evidence against a role for glutathione disulfide. Arch. Biochem Biophys. 310(1):273-81. PMID:8161216
8. Dalle-Donne, I et al (2003). “Protein carbonylation in human diseases.” Trends Mol Med. (4):169-76. PMID:12727143.
9. Domann, FE (2013) “Aberrant Free Radical Biology Is a Unifying Theme in the Etiology and Pathogenesis of Major Human Diseases.” Int. J. Mol. Sci. 14(4), 8491-8495. PMID:23594999.
10. Ganguly, NK et al (2014) “Studies on Respiratory Disorders.” Springer Science, page 8.
11. Gao, L et al (2008) “Mitochondrial pathophysiology, reactive oxygen species, and cardiovascular diseases.” Vet Clin North Am Small Anim Pract. 38(1):137-55. PMID:18249246.
12. Immenschuh, S et al (2005) “Peroxiredoxins, oxidative stress, and cell proliferation.” Antioxid Redox Signal. 7(5-6):768-77. PMID:15890023.
13. Ipothova, Z et al (2013) “Subcellular localization of proflavine derivative and induction of oxidative stress--in vitro studies. Bioorg Med Chem. 21(21):6726-31. PMID:23993675.
14. Kohen R et al (2002) “Oxidation of Biological Systems: Oxidative Stress Phenomena, Antioxidants, Redox Reactions, and Methods for Their Quantification.” Toxicol. Pathol. 30(6):620-50. PMID:12512863.
15. Kuo, LJ et al (2008) “Gamma-H2AX-a novel biomarker for DNA double-strand breaks.” In Vivo. 22(3):305-9. PMID:18610740.
16. Manton, KG et al (2004) “ROS effects on neurodegeneration in Alzheimer’s disease and related disorders: on environmental stresses of ionizing radiation.” Curr Alzheimer Res.14:277-293.PMID:15975057.
17. Marin-Garcia, J et al (2013) “Mitochondria and their role in Cardiovascular Disease” Springer Sci, page 14.
18. McCoy MK et al (2011) “DJ-1 regulation of mitochondrial function and autophagy through oxidative stress.” Autophagy 7(5):531-2: PMID:21317550.
19. Moktar, A et al (2011) “Cigarette smoke condensate-induced oxidative DNA damage and is removal in human cervical cancer cells.” Int J Oncol. 39(4):947-7.
20. Perry, SW (2011) “Mitochondrial membrane potential probes and the proton gradient: a practical usage guide.” Biotechniques 50(2):98-115. PMID21486251
21. Rahal, A et al (2014) “Oxidative Stress, Prooxidants, and Antioxidants: The Interplay.” BioMed Res. International Article ID:761264.
22. Riccio, A et al (2006) “A nitric oxide signaling pathway controls CREB-mediated gene expression in neurons.” Mol Cell. 21(2):283-94. PMID:16427017.
23. Tanaka, T et al (2000) “Expression of stress-response and cell proliferation genes in renal cell carcinoma induced by oxidative stress.” Am J Pathol. 156(6):2149-57. PMID:10854235.
24. Valacchi, G et al (2008) eds. “Oxidants in Biology, a question of Balance” Springer Publishers, ISBN 978-1-4020-8399-0
25. Valko, M et al (2007) “Free radicals and antioxidants in normal physiological functions and human disease.” Int J Biochem Cell Biol. 39:44-84.PMID:16978905.
26. van der Heijden, J et al (2015) “Direct measurement of oxidative and nitrosative stress dynamics in Salmonella inside macrophages.” Proc. Natl. Acad. Sci. U.S.A. 112(2):560-5. PMID:25548165.
27. Waris, G et al (2006). “Reactive oxygen species: role in the development of cancer and various chronic conditions.” J Carcinog. 5:14.PMID:1668993.
28. Yang, Y et al (2013) “ Reactive oxygen species in the immune system.” Int Rev Immunol. 32(3):249-70. PMID:23617726.
29. Yu, D et al (2010) “ miR-451 protects against erythroid oxidant stress by repressing 14-3-3zeta. Genes Dev. 24(15):1620-33. PMID:20679398.
30. Zitka, O et al (2012) “Redox status expressed as GSH:GSSG ratio as a marker for oxidativestress in paediatric tumour patients.” Oncol Lett. 4(6):1247-1253. PMID:23205122

18
AppendixProducts for Oxidative Stress Research
Description Cat. No
AntibodiesAnti-4-Hydroxynonenal AB5605
Anti-8-Hydroxydeoxyguanosine AB5830
Anti-8-Oxoguanine, clone 483.15 MAB3560
Anti-AGE (Advanced Glycated End-products) AB9890
Anti-Aldh3A1 ABS454
Anti-Cu/Zn-SOD 07-403
Anti-Cytochrome C, clone C-7 05-479
Anti-Dual oxidase 2, clone Duox S-12 MABN787
Anti-eNOS/NOS III, CT 07-520
Anti-Glutathione AB5520
Anti-Glutathione, clone D8 MAB5310
Anti-Glutathione, detects both GSH & GSSG AB5010
Anti-Glutathione: N-ethylmaleimide adduct, clone 8.1GSH MAB3194
Anti-Glutathione-S-Transferase (GST), S. japonicum form ABN116
Anti-Glutathione-S-Transferase, S. japonicum form AB1372
Anti-Glutathione-S-Transferase, S. japonicum form AB3282
Anti-Glutathione-S-Transferase, S. japonicum form, clone 8F6.2 MAB3117
Anti-Glutathione-S-Transferase-pi, mammalian form AB8902
Anti-GPx1 ABN63
Anti-iNOS/NOS II, clone 13F5.1 MABN527
Anti-iNOS/NOS II, NT 06-573
Anti-iNOS/NOS II, NT ABN26
Anti-KEAP1 ABS97
Anti-KEAP1, clone 7G4B10 MABC713
Anti-Lactotransferrin 07-685
Anti-Lysyl Oxidase (LOX) ABT112
Anti-Mitochondrial dicarboxylate carrier, clone 1F5.1 MABN457
Anti-Mn-SOD 06-984
Anti-Myeloperoxidase Rabbit pAb 475915
Anti-Myeloperoxidase, human white cell AB1224
Anti-NDUFB7 ABC391
Anti-Nitric Oxide Synthase I AB1529
Anti-Nitric Oxide Synthase I AB1632
Anti-Nitric Oxide Synthase I AB5380
Anti-Nitric Oxide Synthase II AB16311
Anti-Nitric Oxide Synthase II AB5382
Anti-Nitric Oxide Synthase II AB5384
Anti-Nitric Oxide Synthase III AB16301
Anti-Nitric Oxide-Dopamine AB5902
Anti-Nitric Oxide-Glutathione AB5540
Anti-Nitrotyrosine 06-284
Anti-Nitrotyrosine AB5411

19
AppendixProducts for Oxidative Stress Research
Description Cat. No
AntibodiesAnti-4-Hydroxynonenal AB5605
Anti-8-Hydroxydeoxyguanosine AB5830
Anti-8-Oxoguanine, clone 483.15 MAB3560
Anti-AGE (Advanced Glycated End-products) AB9890
Anti-Aldh3A1 ABS454
Anti-Cu/Zn-SOD 07-403
Anti-Cytochrome C, clone C-7 05-479
Anti-Dual oxidase 2, clone Duox S-12 MABN787
Anti-eNOS/NOS III, CT 07-520
Anti-Glutathione AB5520
Anti-Glutathione, clone D8 MAB5310
Anti-Glutathione, detects both GSH & GSSG AB5010
Anti-Glutathione: N-ethylmaleimide adduct, clone 8.1GSH MAB3194
Anti-Glutathione-S-Transferase (GST), S. japonicum form ABN116
Anti-Glutathione-S-Transferase, S. japonicum form AB1372
Anti-Glutathione-S-Transferase, S. japonicum form AB3282
Anti-Glutathione-S-Transferase, S. japonicum form, clone 8F6.2 MAB3117
Anti-Glutathione-S-Transferase-pi, mammalian form AB8902
Anti-GPx1 ABN63
Anti-iNOS/NOS II, clone 13F5.1 MABN527
Anti-iNOS/NOS II, NT 06-573
Anti-iNOS/NOS II, NT ABN26
Anti-KEAP1 ABS97
Anti-KEAP1, clone 7G4B10 MABC713
Anti-Lactotransferrin 07-685
Anti-Lysyl Oxidase (LOX) ABT112
Anti-Mitochondrial dicarboxylate carrier, clone 1F5.1 MABN457
Anti-Mn-SOD 06-984
Anti-Myeloperoxidase Rabbit pAb 475915
Anti-Myeloperoxidase, human white cell AB1224
Anti-NDUFB7 ABC391
Anti-Nitric Oxide Synthase I AB1529
Anti-Nitric Oxide Synthase I AB1632
Anti-Nitric Oxide Synthase I AB5380
Anti-Nitric Oxide Synthase II AB16311
Anti-Nitric Oxide Synthase II AB5382
Anti-Nitric Oxide Synthase II AB5384
Anti-Nitric Oxide Synthase III AB16301
Anti-Nitric Oxide-Dopamine AB5902
Anti-Nitric Oxide-Glutathione AB5540
Anti-Nitrotyrosine 06-284
Anti-Nitrotyrosine AB5411
Description Cat. No
Antibodies (continued)
Anti-Nitrotyrosine AB5532
Anti-Nitrotyrosine Magnetic Bead Conjugate 16-310
Anti-Nitrotyrosine, clone 1A6 05-233
Anti-Nitrotyrosine, clone 1A6, agarose conjugate 16-163
Anti-Nitrotyrosine, clone 1A6, Alexa Fluor® 488 conjugate 16-226
Anti-Nitrotyrosine, clone 1A6, Alexa Fluor® 555 conjugate 16-227
Anti-Nitrotyrosine, clone 1A6, HRP conjugate 16-207
Anti-Nitrotyrosine, clone 2A8.2 MAB5404
Anti-nNOS/NOS I 07-571
Anti-nNOS/NOS I 07-571-I
Anti-nNOS/NOS I, clone 2G1.1 MABN533
Anti-NOX4 Antibody ABC459
Anti-Peroxiredoxin 1 07-609
Anti-Peroxiredoxin 2 07-610
Anti-Peroxiredoxin 3 07-611
Anti-Peroxiredoxin 4 07-612
Anti-Peroxiredoxin-2 ABN1011
Anti-Peroxiredoxin-3, clone EPR8115, Rabbit Monoclonal MABN1162
Anti-Peroxiredoxin-4, clone CPTC-PRDX4-3 MABS37
Anti-Peroxiredoxin-5 (PRDX5), Human, clone 5 286 6F7 MABN300
Anti-Peroxiredoxin-5, (PRDX5), clone 5 288 2F4 MABN301
Anti-phospho eNOS (Ser1177) 07-428-I
Anti-phospho-eNOS (Ser1177) 07-428
Anti-phospho-eNOS/NOS III (Ser116) 07-357
Anti-phospho-eNOS/NOS III (Ser617) 07-561
Anti-phospho-eNOS/NOS III (Ser635) 07-562
Anti-phospho-eNOS/NOS III (Thr495), Rabbit Monoclonal 04-811
Anti-phospho-Histone H2A.X (Ser139), clone JBW301, FITC conjugate 16-202A
Anti-RAGE AB5484
Anti-RAGE AB9714
Anti-RAGE, azide free AB5484Z
Anti-RAGE, clone DD/A11 or A11 MAB5328
Anti-RAGE, CT AB5601
Anti-REDD1 ABC245
Anti-SOD1 (ALS mutant), clone MS785 MABN834
Anti-SOD1, clone 6F5 MABC684
Anti-SOD2 AB10346
Anti-SODD, NT AB16518
Anti-SSBP1 ABN403
Anti-Superoxide Dismutase 1 AB5482
Anti-Superoxide Dismutase 1, aa 25-37 AB5480
Anti-Thioredoxin 1 AB9328

20
AppendixProducts for Oxidative Stress Research
Description Cat. No
Small MoleculesOxidative stress Inducers
AAPH 100100
DPPH Free Radical 300267
Peroxynitrite 516620
Anti-oxidants and Free Radical Scavengers
(±)-Taxifolin Hydrate 580553
a-Lipoic Acid 437692
Carboxy-PTIO, Sodium Salt 217386
EUK-8 341209
Ferrostatin-1 341494
FeTMPyP 341501
FeTPPS 341492
Glutathione Monoethyl Ester 353905
Glutathione, Reduced, Free Acid 3541
Luteolin 440025
MCI-186 443300
Mn-cpx 3 475867
MnTBAP 475870
MnTMPyP 475872
Myeloperoxidase Inhibitor III, HX1 532280
Myeloperoxidase Inhibitor-II 504908
N-tert-Butyl-α-phenylnitrone 203995
PTIO 523350
TEMPOL 581500
Arginase Inhibitors BEC, Hydrochloride 197900
DL-α-Difluoromethylornithine, Hydrochloride 288500
NG-Hydroxy-L-arginine, Monoacetate Salt 399250
Nω-Hydroxy-nor-L-arginine, Diacetate Salt 399275
Guanylate Cyclase Inhibitors
LY 83583 440205
Methylene Blue 467250
NS 2028 492030
ODQ 495320
NADPH Oxidase (NOX) Inhibitors
Apocynin 178385
NOX1 Inhibitor, ML171 492002
NOX1 Inhibitor, NoxA1ds Set 532759
NOX Inhibitor III, VAS2870 492200
NOX Inhibitor VII, Thr101 500526
NOX Inhibitor VIII, VAS3947 532336

21
AppendixProducts for Oxidative Stress Research
Description Cat. No
Small MoleculesOxidative stress Inducers
AAPH 100100
DPPH Free Radical 300267
Peroxynitrite 516620
Anti-oxidants and Free Radical Scavengers
(±)-Taxifolin Hydrate 580553
a-Lipoic Acid 437692
Carboxy-PTIO, Sodium Salt 217386
EUK-8 341209
Ferrostatin-1 341494
FeTMPyP 341501
FeTPPS 341492
Glutathione Monoethyl Ester 353905
Glutathione, Reduced, Free Acid 3541
Luteolin 440025
MCI-186 443300
Mn-cpx 3 475867
MnTBAP 475870
MnTMPyP 475872
Myeloperoxidase Inhibitor III, HX1 532280
Myeloperoxidase Inhibitor-II 504908
N-tert-Butyl-α-phenylnitrone 203995
PTIO 523350
TEMPOL 581500
Arginase Inhibitors BEC, Hydrochloride 197900
DL-α-Difluoromethylornithine, Hydrochloride 288500
NG-Hydroxy-L-arginine, Monoacetate Salt 399250
Nω-Hydroxy-nor-L-arginine, Diacetate Salt 399275
Guanylate Cyclase Inhibitors
LY 83583 440205
Methylene Blue 467250
NS 2028 492030
ODQ 495320
NADPH Oxidase (NOX) Inhibitors
Apocynin 178385
NOX1 Inhibitor, ML171 492002
NOX1 Inhibitor, NoxA1ds Set 532759
NOX Inhibitor III, VAS2870 492200
NOX Inhibitor VII, Thr101 500526
NOX Inhibitor VIII, VAS3947 532336
Description Cat. No
Small Molecules (continued)
Nitric Oxide Synthase Inhibitors
1400W 100050
1-Pyrrolidinecarbodithioic Acid, Ammonium Salt 548000
7-Nitroindazole 483400
Advanced Glycation Endproduct-BSA 121800
AG126 658452
Diphenyleneiodonium Chloride 300260
L-N⁵-(1-Iminoethyl)ornithine, Dihydrochloride 400600
L-NIL, Dihydrochloride 482100
NG,NG-Dimethyl-L-arginine, Dihydrochloride 311203
NG,NG-Dimethyl-L-arginine, Dihydrochloride 311204
NG-Monomethyl-L-arginine, Monoacetate Salt 475886
NG-Nitro-L-arginine Methyl Ester, Hydrochloride 483125
Nitric Oxide Synthase, Neuronal Inhibitor I 490070
nNOS - PSD-95 Interaction Inhibitor, ZL006 482740
p-Nitroblue Tetrazolium Chloride 484235
SKF-525A, Hydrochloride 567300
S-Methyl-L-thiocitrulline, Dihydrochloride 472804
Nrf2 Related Products
Keap1-Nrf2 Interaction Probe, ML334 505987
Nrf2 Activator 492040
Nrf2 Activator II, AI-1 492051
Nrf2 Activator III, TAT-14 Peptide 492042
Nrf2 Activator IV, VSC2 530351
Description Cat. No
Kits and AssaysOxyBlot™ Protein Oxidation Detection Kit S7150
OxyELISA™ Oxidized Protein Quantitation Kit S7250
OxyICC™ Oxidized Protein Detection Kit S7350
OxyIHC™ Oxidized Protein Detection Kit S7450
Human Oxidative Phosphorylation (OXPHOS) Magnetic Bead Panel H0XPSMAG-16K
Rat/Mouse Oxidative Phosphorylation (OXPHOS) Magnetic Bead Panel RM0XPSMAG-17K
Cytochrome C ELISA kit EAMT001-1KIT
Human Fatty Acid Oxidation Magnetic Bead Panel 1 HFA01MAG-11K
Human Fatty Acid Oxidation Magnetic Bead Panel 2 HFA02MAG-11K
Human Oxidative Stress Magnetic Bead Panel H0XSTMAG-18K
Mitochondrial Complex I Activity Assay Kit AAMT001-1KIT
Mitochondrial Complex II Activity Assay Kit AAMT002-1KIT
Mitochondrial Complex IV (Human) Activity Assay Kit AAMT004-1KIT
Mitochondrial Complex IV (Mouse) Activity Assay Kit AAMT006-1KIT
Mitochondrial Complex V (ATP synthase) Activity Assay Kit AAMT005-1KIT
NovaQUANT® Human Mitochondrial to Nuclear DNA Ratio Assay 72620
NovaQUANT® Human Oxidative Stress qPCR Kit 72627
NovaQUANT® Mouse Mitochondrial to Nuclear DNARatio Assay 72621
NovaQUANT® Mouse Oxidative Stress qPCR Kit 72628

www.merckmillipore.com
OxyBlot, OxyELISA, OxyICC, OxyIHC, and SmartFlare are trademarks and Merck Millipore, FlowCellect, CellASIC, ImageStream, MILLIPLEX, Luminex, NovaQUANT and the M logo are registered trademarks of Merck KGaA, Darmstadt, Germany.All trademarks belonging to third parties are the properties of their respective owners. Lit No. RF1101ENEU BS-GEN-15-11491 7/2015 © 2015 EMD Millipore Corporation, Billerica, MA USA. All rights reserved.
To place an order or receivetechnical assistanceIn Europe, please call Customer Service:
France: 0825 045 645Germany: 069 86798021Italy: 848 845 645Spain: 901 516 645 Option 1Switzerland: 0848 645 645United Kingdom: 0870 900 4645
For other countries across Europe, please call: +44 (0) 115 943 0840
Or visit: www.merckmillipore.com/offices
For Technical Service visit:www.merckmillipore.com/techservice
Recommended