ARTICLE IN PRESS
0301-4215/$ - se
doi:10.1016/j.en
�Correspondfax: +603 7967
E-mail add
(T.M.I. Mahlia
Energy Policy 34 (2006) 2429–2432
www.elsevier.com/locate/enpol
Communication
Method for calculating annual energy efficiency improvementof TV sets
M. Varman, T.M.I. Mahlia�, H.H. Masjuki
Department of Mechanical Engineering, University of Malaya, Lembah Pantai, 50603 Kuala Lumpur, Malaysia
Available online 18 April 2005
Abstract
The popularization of 24 h pay-TV, interactive video games, web-TV, VCD and DVD are poised to have a large impact on overall
TV electricity consumption in the Malaysia. Following this increased consumption, energy efficiency standard present a highly
effective measure for decreasing electricity consumption in the residential sector. The main problem in setting energy efficiency
standard is identifying annual efficiency improvement, due to the lack of time series statistical data available in developing countries.
This study attempts to present a method of calculating annual energy efficiency improvement for TV set, which can be used for
implementing energy efficiency standard for TV sets in Malaysia and other developing countries. Although the presented result is
only an approximation, definitely it is one of the ways of accomplishing energy standard. Furthermore, the method can be used for
other appliances without any major modification.
r 2005 Elsevier Ltd. All rights reserved.
Keywords: Television; TV; Energy efficiency; Appliance standards; Annual efficiency improvement
1. Introduction
Energy labeling and minimum energy efficiencystandard for household appliances are now becominga common practice in many countries around the world.For developing Asian countries, these options can hedgeagainst increase in energy intensity, particularly that ofelectricity, towards their pursuit for economic develop-ment (Harrington and Damnics, 2001). However, themain problem of setting energy efficiency standard andlabel in developing countries is the lack of time seriesdata for determining annual efficiency improvement ofappliances.
Minimum energy efficiency standards are the specifiedminimum energy efficiency level that products mustmeet before it can be legally sold. To date, only sixnations have been known to have minimum energy
e front matter r 2005 Elsevier Ltd. All rights reserved.
pol.2005.01.013
ing author. Tel.: +603 7967 6842;
5317.
resses: [email protected], [email protected]
).
efficiency standard for residential television sets. China’sstandard has yet to be translated in English. Japan’sstandard is not specific to energy efficiency and is usedonly for comparing and evaluating performance. Amer-ica’s standard is regarding standby power consumption.Meanwhile, Russia’s standard is regarding on modepower consumption only. On the other hand, Group forEnergy Efficient Appliances for EU nation states thatthe energy efficiency index should be less than 0.75(Siderious, 2002). According to Biermayer et al. (2000),Sri Lanka’s standard is regarding test for powerconsumption, to measure electrical, acoustical andoptical properties. In proposing a minimum energyefficiency standard, it was found that the main problemis to identify the appliance’s annual energy efficiencyimprovement that will be used to determine futureimprovements required by the standard. Thereforeinline with this problem, this study attempts to discussthe method for calculating annual energy efficiencyimprovement of TV set which is essential for setting upenergy efficiency standard and label.
ARTICLE IN PRESS
Nomenclature
AEI annual efficiency improvement of televisionset (%)
AEIst annual efficiency improvement for standby-mode (%)
AEIon annual efficiency improvement for on-mode(%)
n present year – previous year (year)Pb power consumption in the previous year (W)Pi power consumption in the present year (W)To duration of TV on on-mode daily (hour)Tst duration of TV on standby-mode daily (hour)
M. Varman et al. / Energy Policy 34 (2006) 2429–24322430
2. Methodology
For most appliances, there are only two parametersnecessary for calculating annual energy efficiencyimprovement. The parameters are on-mode and stand-by-mode efficiency improvement. On-mode is thecondition when the appliance consumes energy duringits normal operation stage e.g., producing picture andsound. Standby-mode is the condition when theappliance consumes energy even when there are nosound and picture produced. In this study, in addition tothe equation to compute annual efficiency improvement,the regression analysis methodology is utilized todetermine the average appliance power level. This valueis then replaced in the equation to determine the annualefficiency improvement.
y = -2.2208x + 4592.8200
250
W)
21-inch29-inch
14-inch
2.1. On-mode and Standby-mode efficiency improvement
The annual efficiency improvement is the percentageof efficiency improvement between two consecutiveyears. This can be also calculated by considering thepercentage of efficiency improvement between twoperiod of time and dividing it with the duration betweenthese two periods. The equation can be used for bothstandby and active power and it is enumerated below:
AEI ¼
Pi�Pb
Pi� 100
� �
n. (1)
The value of average power level (P) is obtained fromthe equation for average on-mode and standby-modeefficiency improvement which is derived from regressionanalysis of data.
y = 0.1846x - 278.73
y = -0.2103x + 485.46
0
50
100
150
1978
1980
1982
1984
1986
1988
1990
1992
1994
1996
1998
2000
2002
2004
2006
Year
Pow
er L
evel
(
Fig. 1. On-mode power level for three TV sizes.
3. Results and Discussions
It has been mentioned that the TV sets annualefficiency improvement depends on on-mode efficiencyimprovement and standby-mode efficiency improve-ment. Therefore to estimate TV sets annual efficiencyimprovement, the calculation is divided into twosections which are on-mode efficiency improvement
and stand-by mode efficiency improvement. The calcu-lation results are presented in the following section.
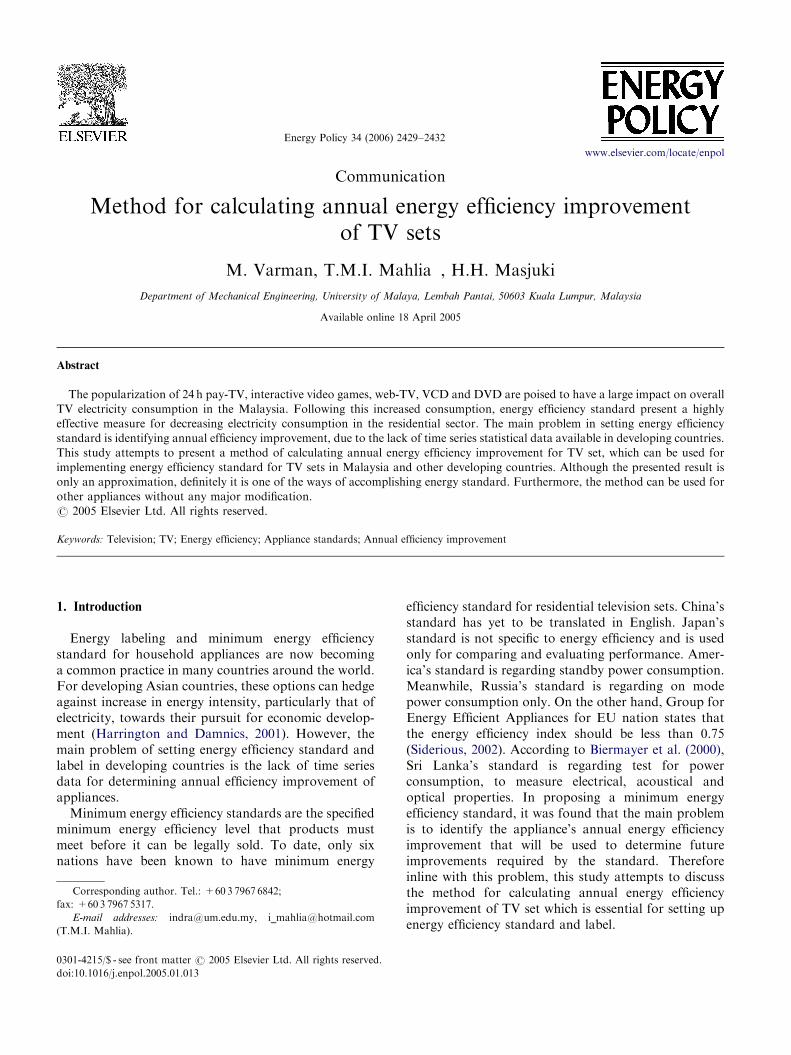
3.1. On-mode efficiency improvement
First, the TV power level data obtained from house-hold survey is plotted against the year it is manufac-tured. In this study the plot involves 14-in, 21-in and 29-in TV sets which correspond to the highest TV owner-ship class. Next, a trend line is drawn through aregression analysis of all the data points. This linerepresents the average on-mode efficiency improvementline that will be used to compute the annual efficiencyimprovement. Fig. 1 shows the plot for three sizes of TVsets to determine the on-mode annual efficiencyimprovement.
In order to determine the annual efficiency improve-ment (AEIon), the percentage of efficiency improvementbetween the collected data in the year 1980 and 2000 isdivided by the duration between these two periods,which is 20 years. Based on Eq. (1), the formula can bewritten as follows:
AEIon ¼
P1980�P2000
P1980� 100
� �
20. (2)
Meanwhile the value of average power level (P) isobtained from the regression analysis trend line
ARTICLE IN PRESS
Table 1
Average power level from average on-mode efficiency improvement
Type of TV Equation (P1980) (P2000)
14 in P ¼ �0.2103x+485.46 69 65
21 in P ¼ 0.1846x�278.73 87 90
29 in P ¼ �2.2208x+4592.8 196 151
y = -1.1045x + 17.355
0.0
2.0
4.0
6.0
8.0
10.0
12.0
14.0
16.0
18.0
1991 1992 1993 1994 1995 1996 1997 1998 1999 2000 2001Year
Pow
er L
evel
(W
)
Avg.standby pow
M. Varman et al. / Energy Policy 34 (2006) 2429–2432 2431
equation that is presented in Fig. 1. The results aretabulated in Table 1.
The annual efficiency improvement for:
Fig. 2. Average standby power level.
(i) TVAEI14-in ¼69�6569� 100
� �20
¼ 0:3%. (3)
(ii)
21-in TVAEI21-in ¼ �0:2%.
(iii)
29-in TVAEI29-in ¼ 1:1%.
Therefore, the on-mode annual efficiency improve-ment for 14-in, 21-in and 29-in TV are 0.3%, �0.2%and 1.1% each, respectively. Although this is a smallamount of improvement, similar results were alsoreported by Rosen and Meier (2000). The authorscollected TV average power level data from the year1985 to the year 1998 in the United States. Eventuallythey found out that the TV power level has not changedsignificantly since 1985. However the exact figure wasnot mentioned. The low-efficiency improvement isexpected due to the focus of manufacturers to producebigger and flatter screen TV that is equipped withadditional accessory rather than its efficiency.
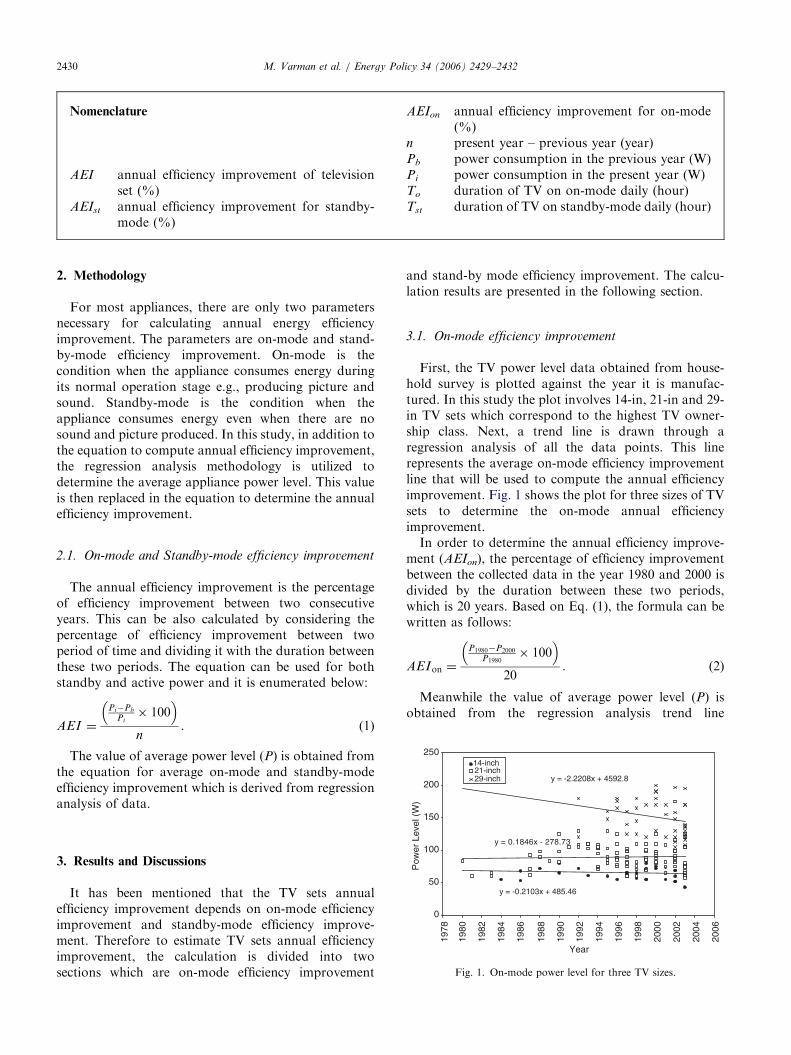
3.2. Standby-mode efficiency improvement
The standby-mode efficiency improvement calcula-tion is adapted from Harrington and Kleverlaan (2001).This is because, it is impossible to obtain this data fromthe household survey because manufacturers do notdisplay standby power level on TV sets or its usermanual. Even the data obtained from product catalo-gues only published standby power level data from theyear 2002 onwards. However, this particular authorshave conducted an in depth study whereby standbypower level data have been measured in retail outletsfrom the year 1970 to 2001 with an average TV size of63 cm (�25 in) displayed in 2001. These data areapplicable in Malaysia because many TV sets are
identical. It is produced by large multinational compa-nies and sold worldwide. However, it is important toonly concentrate on standby power improvement fromthe year 1990 onwards. This is because most TV sets inMalaysia before this period were not equipped with aremote control which causes TV sets to be switched intostandby mode. The average standby power level plotfrom the year 1990 onwards is presented in Fig. 2(Harrington and Kleverlaan, 2001).
Hence, the annual standby efficiency improvement(AEIst) is estimated using Eq. (1) and considering n ¼ 10years for the duration from 1991 to 2001. The result is asfollows:
AEI st ¼16:3�5:3
16:3 � 100� �
10¼ 6:7%. (4)
4. Conclusions
The energy efficiency standard for television sets hasproven to reduce national electricity consumption inmany countries around the world. Once the standard isimplemented, only television sets that meet this standardshould be allowed into the market. This will enableoptimum amount of energy to be saved during theeffective period of standard. This study has presentedthe method to calculate annual energy efficiencyimprovement for TV sets, which can be used forimplementing minimum energy efficiency standard andlabel in countries where lack of time series data arepresent. Although this study only uses TV as a casestudy, the method can be used for other applianceswithout major modification. Based on the calculationresult, TV sets on-mode efficiency does not show anobvious trend that suggests its efficiency is improving ordeteriorating. However the standby-mode efficiency hasshown a strong trend towards its improvement. Thismay due to the efforts proposed by some countries to
ARTICLE IN PRESSM. Varman et al. / Energy Policy 34 (2006) 2429–24322432
introduce 1-W label in the future. Although thepresented results are only an approximation, its mainobjective is to reduce energy consumption of thisappliance. Furthermore, implementation of energyefficiency standard is the best way to conserve energyin a developing country like Malaysia.
References
Biermayer, P., Busch, J., Hakim, S, Turiel, I., DuPont, P., Stone, C.,
2000. Feasibility of an Appliance Energy Testing and Labeling
Program for Sir Lanka. DSM Branch Ceylon Electricity Board.
Harrington, L., Damnics, M., 2001. Energy labelling and standards
programs throughout the world. In: Regional Symposium on
Energy Efficiency Standard and Labelling, Bangkok, Thailand,
2001.
Harrington, L., Kleverlaan, P., 2001. Quantification of residential
standby power consumption in Australia: results of recent
survey work, Project for the National Appliance & Equipment
Energy Efficient Committee, Australian Greenhouse Office,
pp. 1–13.
Rosen, K., Meier, A., 2000. Power measurements and national energy
consumption of televisions and videocassette recorders in the USA.
Energy 25 (3), 219–232.
Siderious, H. P., 2002. Energy efficiency index TV–introduction
brochure. Compiled from www.efficient-appliances.org. Group
for Energy Efficient Appliances (GEEA).
Recommended