METAL OXIDE–CARBON NANOCOMPOSITES FOR ENERGY STORAGE
AND CONVERSION
by
Wijayantha Asanga Perera
APPROVED BY SUPERVISORY COMMITTEE:
___________________________________________
Dr. Kenneth J. Balkus, Jr., Chair
___________________________________________
Dr. John P. Ferraris
___________________________________________
Dr. Yves J. Chabal
___________________________________________
Dr John W. Siber

Copyright 2017
Wijayantha Asanga Perera
All Rights Reserved

Dedicated to my loving parents, Neel Perera, Jayanthi Herath and my wife Anuradha for their
endless love, wisdom, support and encouragement
METAL OXIDE–CARBON NANOCOMPOSITES FOR ENERGY STORAGE
AND CONVERSION
by
WIJAYANTHA ASANGA PERERA, BS, MS
DISSERTATION
Presented to the Faculty of
The University of Texas at Dallas
in Partial Fulfillment
of the Requirements
for the Degree of
DOCTOR OF PHILOSOPHY IN
CHEMISTRY
THE UNIVERSITY OF TEXAS AT DALLAS
May 2017

v
ACKNOWLEDGMENTS
First of all I would like to express my deepest gratitude to my research supervisor, Dr. Kenneth J.
Balkus, Jr., for his constant support and encouragement with guidance throughout my PhD
program. His kind guidance encouraged me to identify my weaknesses and improve myself. I have
been very fortunate and proud to be one of his students. I would like to extend my special thanks
to him for guiding me to the end and giving me moral and emotional support to be successful. I
am also grateful to Dr. John P. Ferraris, my research collaborator who always helped me when
needed and gave me an opportunity to access cutting edge facilities. And also I would like to
express my special thanks to Dr. Yves Chabal for helping me in many ways. His kind, encouraging
words helped me to reach my goals. I want to express my gratitude to supervising committee
member Dr. John W. Sibert, for his support and guidance. Their valuable ideas and suggestions
helped me to understand and successfully overcome research challenges.
I would like to extend my gratitude to past and present members in the Balkus lab. They have been
a family for me throughout the years. I would also like to acknowledge all past and present
chemistry department staff members, especially Dr. George D. McDonald, Dr. Winston Layne,
Betty Maldonado, Linda L. Heard and Lydia Selvidge who helped in many ways to succeed. I
would like to extend my thanks to all my friends back in Sri Lanka and in USA who helped me in
many ways. I would like to thank all my Sri Lankan friends at UTD for giving me support during
my rough times. We spent a lot of enjoyable time together. Finally, I would like to express my
deepest gratitude to my mother Jayanthi Herath, my father Neel Perera, my brother Sanjaya Perera,
my sister Sandaruwani Perera and my loving wife Anuradha Liyanage, for their endless love and

vi
encouragement offered during difficult time periods. Without their support and love I would not
be able to reach this far.
March 2017

vii
METAL OXIDE–CARBON NANOCOMPOSITES FOR ENERGY STORAGE
AND CONVERSION
Wijayantha Asanga Perera, PhD
The University of Texas at Dallas, 2017
ABSTRACT
Supervising Professor: Dr. Kenneth J. Balkus, Jr.
Increased energy demand with the exponential growth in population has become one of the major
challenges that mankind has to face. To overcome the growing energy demand, there is a
significant need to find either a sustainable and renewable energy source or efficient ways to store
energy. Therefore, development of novel energy storage devices have attracted a great attention.
Among different energy storage devices, batteries are the most convenient and accessible devices
that are commercially available for a wide range of consumer devices. However, low power density
of batteries greatly limits its use in applications requiring quick burst of energy. Thus, one of the
overall goals of this study is to develop novel electrode nanostructures and compositions for the
next generation of electrochemical devices that are capable of delivering high energy density, high
power density and high capacitance.
In the first part of the dissertation, the preparation of metal oxide-carbon nanocomposites
using different methodologies and the evaluation of their performance will be discussed. Currently,
RuO2 is considered as the best metal oxide that possesses the highest pseudocapacitive properties.

viii
In the second chapter, the use of RuO2 as the pseudocapacitive metal oxide and carbon nanotubes
as the electrical double layer capacitive (EDLC) material will be discussed. Moreover, a novel
method was introduced to prepare RuO2 nanoribbons. Since RuO2 is an expensive material,
incorporating it with a cheaper alternative, i.e. vanadium oxide (V2O5) will be discussed in the
third chapter. To achieve this, RuO2 nanodots were deposited on V2O5 nanorods. The use of V2O5
significantly decreased the material cost. Since this novel method used RuO2 quantum dots in low
compositions, harvesting the great electrochemical performance of RuO2 without increasing the
material cost was successfully achieved. In the fourth chapter, graphene oxide mediated sodium
niobate nanotubes were prepared and used as the supercapacitor electrode material. Recently, the
use of high surface area carbon nanomaterials for electrochemical energy storage devices has
gained more attention. In the fifth chapter, the incorporation of high surface area wrinkled
mesoporous carbon to supercapacitor electrodes will be presented. Different amounts of RuO2
nanoparticles were deposited on to the wrinkled mesoporous carbon and the electrochemical
performance of supercapacitors were evaluated.
Another major challenge associated with the increasing population is rapid industrialization.
With the development of new industries, more waste are generated and released to the
environment. Most of these industrial waste contain organic pollutants and eventually they are
collected in free water bodies such as oceans and water streams ultimately resulting in the
accumulation of toxic organic components in the biomass.
The second part of the dissertation will be focused on the development of novel TiO2
nanotube/ RuO2 nanoribbons/graphene oxide composites for photocatalytic degradation of organic
pollutants. This novel photocatalyst significantly increased the photocatalytic remediation of

ix
organic dye due to reduced rate of electron-hole recombination. These results suggest that TiO2
nanotube/ RuO2 nanoribbons/graphene oxide composite is capable of efficiently degrading toxic
organic components present in industrial waste.

x
TABLE OF CONTENTS
ACKNOWLEDGMENTS ………………………….……………………….…….……….......... v
ABSTRACT …..…………………………………………………………….…………..............vii
LIST OF FIGURES …………………………………………………………………….……. ...xiv
LIST OF TABLES …………………………………………………….…………………...….. xvii
CHAPTER 1 INTRODUCTION ....................................................................................................1
1.1 Introduction ..............................................................................................................1
1.2 References ................................................................................................................2
CHAPTER 2 RUTHENIUM OXIDE NANORIBBON – CARBON NANOTUBE COMPOSITE
ELECTRODES FOR HIGH PERFORMANCE SUPERCAPACITORS .......................................4
2.1 Introduction ..............................................................................................................4
2.2 Materials and methods .............................................................................................6
2.3 Synthesis of ruthenium oxide nanoribbons (RuO2 NR) ...........................................7
2.4 Preparation of ruthenium oxide nanoribbon/ carbon nanotube composite
electrodes .................................................................................................................7
2.5 Supercapacitor assembly ..........................................................................................9
2.6 Characterization .......................................................................................................9
2.7 Results and discussion ...........................................................................................10
2.8 Characterization of RuO2 nanoribbons ..................................................................10
2.9 Fabrication and characterization of hybrid RuO2 nanoribbon carbon nanotube
composite papers ....................................................................................................13
2.10 Electrochemical characterization of MCNT- RuO2 NR composite papers ...........16
2.11 Conclusion .............................................................................................................23
2.12 Supporting information ..........................................................................................24
2.13 References ..............................................................................................................27
CHAPTER 3 RUTHENIUM OXIDE NANODOT DECORATED VANADIUM OXIDE
NANOROD– CARBON NANOTUBE COMPOSITES FOR SUPERCAPACITORS ................37
3.1 Introduction ............................................................................................................37

xi
3.2 Materials and methods ...........................................................................................39
3.3 Synthesis of vanadium oxide nanorods (VNRs) ....................................................39
3.4 Synthesis of ruthenium oxide nanodot (RuO2 ND) decorated vanadium oxide
nanorods (VNRs) ...................................................................................................40
3.5 Preparation of ruthenium oxide nanodot (RuO2 ND) chemically bound vanadium
oxide nanorods/ carbon nanotube composite electrodes ........................................40
3.6 Supercapacitor assembly ........................................................................................41
3.7 Characterization .....................................................................................................41
3.8 Results and discussion ...........................................................................................42
3.9 Characterization of ruthenium oxide nanodots (RuO2 NDs) decorated vanadium
oxide nanorods (VNRs) .........................................................................................42
3.10 Electrochemical characterization of RuO2 NDs /VNRs composite papers ...........47
3.11 Conclusion .............................................................................................................53
3.12 References ..............................................................................................................53
CHAPTER 4 BINDER FREE GRAPHENE–SODIUM NIOBATE NANOTUBE/ NANO-ROD
COMPOSITE ELECTRODES FOR SUPERCAPACITORS .......................................................58
4.1 Introduction ............................................................................................................58
4.2 Experimental ..........................................................................................................61
4.3 Material and methods .............................................................................................61
4.4 Synthesis of graphene oxide (GO) .........................................................................61
4.5 Synthesis of hydrothermally reduced graphene oxide (hGO) ................................62
4.6 Synthesis of sodium niobate nanotubes on hydrothermally reduced graphene
oxide (hGO) ...........................................................................................................62
4.7 Synthesis of NaNbO3 nanorods/hGO composite ...................................................63
4.8 Fabrication of coin cell type supercapacitors .........................................................63
4.9 Characterization .....................................................................................................64
4.10 Results and discussion ...........................................................................................64
4.11 Characterization of hGO and NaNbO3 nanorods ...................................................64
4.12 Characterization of NaNbO3 nanotube/hGO composites ......................................68
4.13 Proposed mechanism for NaNbO3 nanorod formation. .........................................69
4.14 Proposed mechanism for NaNbO3 nanotube formation.........................................72
4.15 Electrode preparation .............................................................................................73

xii
4.16 Conclusion .............................................................................................................80
4.17 References ..............................................................................................................82
CHAPTER 5 RUO2 NANODOTS SUPPORTED WRINKLED MESOPOROUS CARBON
FORSUPERCAPACITORS………………...………………………………………………….91
5.1 Introduction ............................................................................................................91
5.2 Materials and methods ...........................................................................................92
5.3 Synthesis of wrinkled mesoporous silica (WMS) ..................................................92
5.4 Synthesis of wrinkled mesoporous carbon (WMC) ...............................................93
5.5 Synthesis of ruthenium oxide nanodots on wrinkled mesoporous carbon
(WMCR) ................................................................................................................93
5.6 Synthesis of ruthenium oxide nanodots on wrinkled mesoporous carbon using a
reducing method.....................................................................................................94
5.7 Preparation of ruthenium oxide on wrinkled mesoporous carbon (WMCR)
composite electrodes ..............................................................................................94
5.8 Supercapacitor assembly. .......................................................................................95
5.9 Characterization .....................................................................................................95
5.10 Results and discussion ...........................................................................................96
5.11 Characterization of ruthenium oxide nanodots grown on wrinkled mesoporous
carbon (WMCR) ....................................................................................................96
5.12 Conclusion ...........................................................................................................102
5.13 References ............................................................................................................102
CHAPTER 6 HYDROTHERMAL SYNTHESIS OF TIO2 NANOTUBE (TNT)/ RUO2
NANORIBBON (NR)/ GRAPHENE OXIDE COMPOSITES WITH ENHANCED
PHOTOCATALYTIC ACTIVITY ..............................................................................................104
6.1 Introduction ..........................................................................................................104
6.2 Experimental section ............................................................................................107
6.3 Materials and methods .........................................................................................107
6.4 Characterization. ..................................................................................................107
6.5 Synthesis of graphene Oxide (GO). .....................................................................108
6.6 Synthesis of TNT/RuO2 NR/hGO (TRG) composites. ........................................108
6.7 Photocatalytic measurements. ..............................................................................109
6.8 Results and discussion .........................................................................................110

xiii
6.9 Characterization of TNT/ RuO2 NR/ hGO composites ........................................110
6.10 Morphology of TNT/RuO2 NR/ hGO composite.................................................115
6.11 Photocatalytic performance of TNT/RuO2 NR/ hGO composite. .......................118
6.12 Conclusion ...........................................................................................................123
6.13 Supporting information ........................................................................................123
6.14 References ............................................................................................................126
BIOGRAPHICAL SKETCH …………………………………………………………….……. 132
CURRICULUM VITAE ………………………………………………………………………133

xiv
LIST OF FIGURES
Figure 2-1 SEM images of RuO2 nanoribbons at a) low and b) high magnification. A histogram
for the ribbon width (inset). ...............................................................................................10
Figure 2-2 a) XRD pattern of annealed RuO2 nanoribbons with the simulated pattern (JCPDS-00-
040-1290) b) Crystal structure of RuO2 viewed in (110) direction, calculated using crystal
maker and the crystallographic data in reference.87 ...........................................................12
Figure 2-3 a) Top view TEM images of RuO2 NRs a) and b) with different magnification and
inset of high resolution image showing (110) plane with the d-spacing of 0.318 nm .......12
Figure 2-4 TEM image of a) MCNT- RuO2 nanoribbon composite electrode (R-3), b) high
resolution image showing planes of RuO2 nanoribbons lattice fringes with the d spacing
of 0.318 nm (110) and MCNT. ..........................................................................................14
Figure 2-5 XPS spectrum of RuO2 NR with the peak assignments. ..............................................15
Figure 2-6 Cyclic voltammograms of composite paper having different RuO2 nanoribbon
compositions b) galvanostatic charging and discharging curves measured at constant
current density 1.0 A g-1 c) charge–discharge profile of R-3 supercapacitor at 1 A g−1 for
the 1st and 1000th cycle d) capacitance retention of R-3 over 1000 charge/discharge cycles
evaluated from the galvanostatic discharge curves. ...........................................................16
Figure 2-7 Three electrode cyclic voltammogram of RuO2 NRs with reference to Ag/Ag+ in 1M
EMIM TFSI in acetonitrile at 50 mV s-1 ............................................................................18
Figure 2-8 a), b) Electrochemical impedance spectroscopy (EIS) of different RuO2 NRs
composite electrodes. .........................................................................................................19
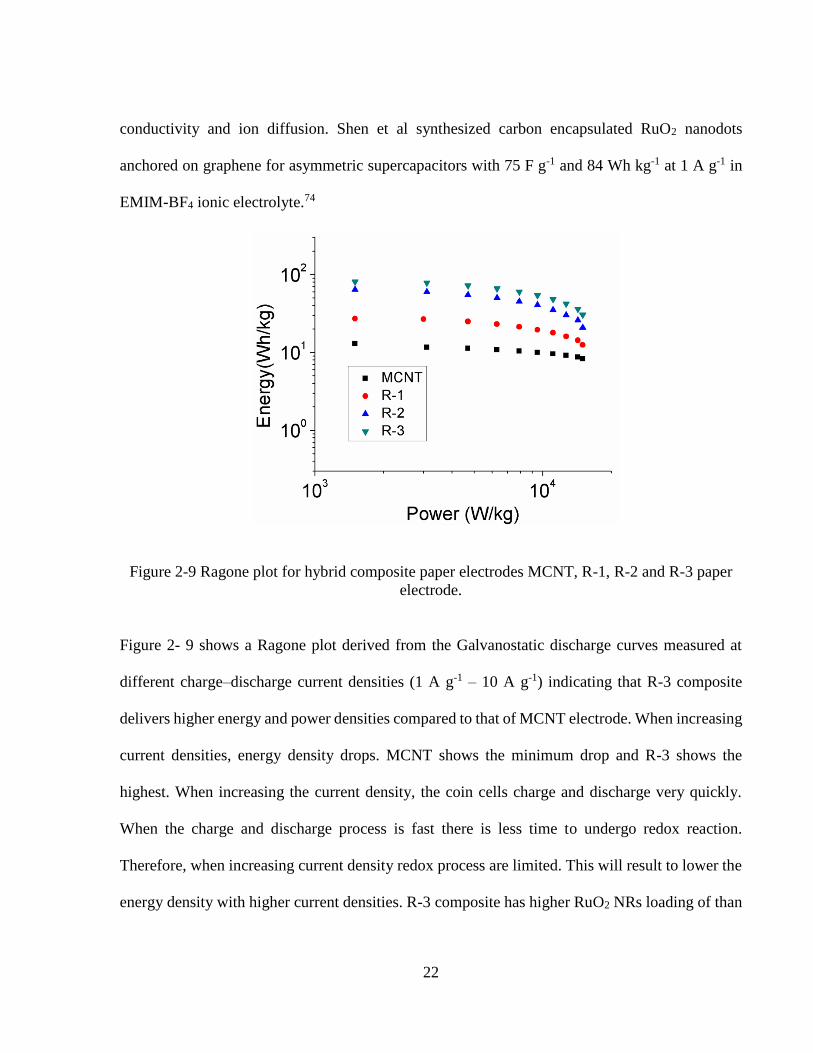
Figure 2-9 Ragone plot for hybrid composite paper electrodes MCNT, R-1, R-2 and R-3 paper
electrode. ............................................................................................................................22
Figure 2-S. 1 Structure of 1-ethyl-3-methyl imidazolium (EMIM+)…………………………… 25
Figure 2-S. 2 shows the nitrogen adsorption–desorption isotherms of the RuO2 NRs sample….26
Figure 2-S. 3 XPS spectrum of MCNTs a) before b) after wash with 30% HNO3 with the peak
assignments………………………………………………………………………..……..27
Figure 2-S. 4 digital photograph of MCNT- RuO2 nanoribbon composite paper electrode (VR-3)
………………………………………………………………………………………...27
Figure 2-S. 5 FT-IR spectra of (a) pure Triton X-100 and (b) VR-3 composite electrode………28

xv
Figure 3-1 a) SEM b) TEM image of as synthesized VNRs (inset) size distribution histogram ...42
Figure 3-2 Scheme for the preparation of VNRs decorated with RuO2 NDs ................................43
Figure 3-3 a),b) TEM images of RuO2 ND bound VNRs c) particle size distribution of RuO2
NDs on VNRs ....................................................................................................................44
Figure 3-4 XRD pattern of a) VNRs b) RuO2 NDs decorated VNRs. ...........................................44
Figure 3-5 XPS spectrum of RuO2 NDs bound VNRs with peak assignments for a) V2O5 b)
RuO2 ...................................................................................................................................46
Figure 3-6 Cyclic voltammograms b) discharge curves of composite electrodes at 25 mV s-1 c)
charge discharge curve of 1st and 1000th cycle and d) capacitance retention for VR-5 .....47
Figure 3-7 Three electrode cyclic voltammogram (CV) of RuO2 NDs decorated VNR (VR-5)
with reference to Ag/Ag+ in 0.1 M LiTFSI in EMITFSI ...................................................51
Figure 3-8 a) Electrochemical impedance spectroscopy (EIS) b) Ragone plot of different
composite electrodes ..........................................................................................................52
Figure 4-1 a), b) SEM c), d) TEM image of NaNbO3 nanorods e) Raman spectra for GO, hGO,
graphite and NaNbO3 Nt-hGO (Nb-1) ...............................................................................66
Figure 4-2 Crystal structure of NaNbO3 in a) (111) b) (100) direction, calculated using crystal
maker and the crystallographic data in ref 36 c) digital image of flexible paper electrode
(Nb-2) XRD pattern for d) NaNbO3 nanorods e) as synthesized hGO-NaNbO3 nanotube
composite (Nb-2) f) simulated XRD pattern JCPDS 33-1270...........................................67
Figure 4-3 SEM images at a) low and b) high magnification, TEM image of c) low and d) high
magnification of Nb-2 composite electrode .......................................................................68
Figure 4-4 Schematic diagram for the formation mechanism of NaNbO3 nanorods .....................71
Figure 4-5 Schematic diagram of formation mechanism of NaNbO3 nanotube with the presence
of hGO ...............................................................................................................................73
Figure 4-6 Cyclic voltammograms of a) NaNbO3 nanotube/hGO composites b) NaNbO3
nanorods/hGO composite c) all the composite electrodes at 25 mV s-1 scanned rate. ......75
Figure 4-7 a) Charge discharge profile for coin cell series at 1 A g-1 b) Cell voltage vs. discharge
time of sample Nb-2 in 1 M LiTFSI at different discharge current densities c) Charge–
discharge profile of Nb-2 supercapacitor in 1 M LiTFSI at 1.5 A g−1 for the 1st and 7000th
cycle d) capacitance retention of Nb-2 over 1000 charge/discharge cycles evaluated from
the galvanostatic discharge curves .....................................................................................76

xvi
Figure 4-8 Three electrode cyclic voltammogram of NaNbO3/hGO (Nb-2) composite electrode
and hGO with reference to Ag/Ag+ in 1M LITFSI in acetonitrile at 50 mV s-1 ................78
Figure 5-1 a), wrinkled mesoporous silica (WMS) b) SEM image of wrinkled mesoporous
carbon (WMC) ...................................................................................................................96
Figure 5-3 TEM images of a), b) 10 wt% c), d) 20 wt% e), f) 40 wt% and g), h) 80 wt%
WMCR ...............................................................................................................................97
Figure 6-1 Graphical illustration of the synthesis of TNT/RuO2 NR/hGO composites. .............106
Figure 6-2 XRD patterns of (a) TG-1, (b) RG-2, (c) TRG-3, (d) TRG-4 and (e) TRG-5. ..........110
Figure 6-3 Raman spectra of (a) RuO2 NR and (b) RuO2 /hGO (RG-2). Inset Raman spectra
showing the blue shift of the Eg band of the composite. ..................................................112
Figure 6-4 Raman spectra of TNT (a), TG-1 (b), TRG-3 (c), TRG-4 (d) and TRG-5 (e). Inset
Raman spectra showing the blue shift of the Eg band of the composites. .......................112
Figure 6-5 Characteristic D and G bands of a) GO b) RG-2 c) TRG-3 d) TRG-4 and e) TRG-5
composites........................................................................................................................113
Figure 6-6 Deconvoluted peak of high resolution XPS core level of a) Ru 3d/ C 1s b) Ti 2p of
TRG-5 composite. ............................................................................................................114
Figure 6-7 SEM image of a) RuO2 NRs on hGO b) TNTs on RuO2 NRs, high resolution TEM
image of c) RuO2 NRs and TNTs on hGO sheet (TRG-5) d) RuO2 NRs and TNTs in
composite TRG-5. ............................................................................................................117
Figure 6-8 Plot of C/Co (%) versus time for the photocatalytic degradation of malachite green in
a quartz reactor. ................................................................................................................120
Figure 6-9 Graphical illustration of photodegradation of MGO in the presence of RuO2/
TiO2/hGO composite. .......................................................................................................121
Figure 6-S. 1 TEM-EDAX spectrum accrued at 10 nm magnification. ..................................12124
Figure 6-S. 2 a), b) High resolution TEM images of bulk TNTs.. ...........................................12124
Figure 6-S. 3 UV-vis diffuse reflectance spectra of composites .............................................12125
Figure 6-S. 4 a) Direct bandgap model of TRG-5 and RuO2 NRs b) indirect bandgap model of
TNTs. ...........................................................................................................................12125

xvii
LIST OF TABLES
Table 2-1 Specific capacitance, energy and power densities for different compositions calculated
from galvanostatic charging/discharging curves. ..........................................................…21
Table 2-S. 1 Composition of composite electrodes……………………………………...………26
Table 2-S. 2 d-spacing comparison calculated by XRD and TEM image………………...……..26
Table 3-1 Specific capacitance and IR drop of composite electrodes. ..........................................48
Table 3-2 Energy densities of composite electrodes ......................................................................50
Table 4-1Summarized parameters for electrode preparation .........................................................74
Table 6-1 Rate constant comparison for the oxidation of organic dyes ......................................122
Table 6-S. 1 Amount of TiO2, RuO2 and hGO in composites .....................................................122

1
CHAPTER 1
INTRODUCTION
1.1 Introduction
Energy consumption continually increases as the world population increases, resulting in greater
demands for energy to support human existence. Therefore, research towards renewable energy
and energy storage devices have been gaining more attention.1 Among the energy storage devices,
supercapacitors may have potential applications in the near future.2 Therefore, research has been
done to improve the performance of high surface area carbons and different redox active metal
oxide nanostructures.
The chapter 2 of the dissertation reports a novel method to prepare RuO2 nanoribbons for
supercapacitor applications. RuO2 is one of the best pseudocapacitive materials reported.3 It is
important to obtain a high surface area, high capacitive material which can deliver high energy
and high power density. RuO2 nanoribbons were combined with carbon nanotubes to prepare
composite electrodes and evaluate its performance. The nanocomposite paper having highest RuO2
nanoribbon loading displayed ideal capacitive behavior with 1510 W kg-1 of power density and
160.8 Wh kg-1 energy density and 276.66 F g-1 specific capacitance.
There are many energy storage devices available ranging from fuel cells to batteries.4 Batteries are
a convenient method to store energy but with low power density. In the third chapter, a novel
strategy to prepare V2O5 nanorods modified with RuO2 nanodots is reported. RuO2 is expensive,
while V2O5 is a cheaper, layered pseudocapacitive metal oxide. In order to reduce the cost we have
prepared V2O5 nanorod decorated with RuO2 nanodots. The RuO2 provides extra capacitance with
2
high conductivity to enhance the performance of the supercapacitors. Composite electrodes were
prepared using different amounts of RuO2 nanodots and V2O5 nanorods with a constant amount of
carbon nanotubes. The composite electrode with 1:2 (wt%) shows the best performance where
capacitance of 158 F g-1, energy density of 157.08 Wh kg-1 and highest power density of 10.1 kW
kg-1 was observed.
In chapter 4, the preparation of sodium niobate nanorods and nanotubes is reported. It was found
that graphene oxide facilitates the formation of sodium niobate nanotubes. A possible mechanism
for the preparation of graphene oxide mediated sodium niobate nanotubes is proposed.
A high surface area wrinkled mesoporous carbon was prepared and RuO2 nanoparticles deposited
in the mesopores. The WMC/ RuO2 nanodots were combined with carbon nanotubes and the high
performance electrodes was evaluated in chapter 5.
Managing waste and waste treatment is a challenging task. In the second part of the dissertation,
the development of a new heterojunction photocatalytic material is discussed.5 Using high surface
area graphene oxide, ruthenium oxide nanoribbons and titanium oxide nanotubes a sequential
synthesis was developed and the photocatalytic activity of the composite was evaluated. The
highest loading of RuO2 NR/TNTs on hGO showed the highest photodegradation efficiency with
a 0.9625 min-1 rate constant. We have shown that a RuO2 NR/TNT/ hGO heterojunction helps to
improve the photodegradation efficiency of organic dyes by decreasing the electron hole
recombination.
1.2 References
1. H. Jiang, P. S. Lee and C. Li, Energy & Environmental Science, 2013, 6, 41-53.

3
2. E. Frackowiak and F. Béguin, Carbon, 2001, 39, 937-950.
3. B. J. Lee, S. R. Sivakkumar, J. M. Ko, J. H. Kim, S. M. Jo and D. Y. Kim, Journal of
Power Sources, 2007, 168, 546-552.
4. J. Liang, F. Li and H.-M. Cheng, Energy Storage Materials, 2016, 2, A1-A2.
5. M. T. Uddin, Y. Nicolas, C. Olivier, T. Toupance, M. M. Müller, H.-J. Kleebe, K.
Rachut, J. Ziegler, A. Klein and W. Jaegermann, The Journal of Physical Chemistry C,
2013, 117, 22098-22110.

4
CHAPTER 2
RUTHENIUM OXIDE NANORIBBON – CARBON NANOTUBE COMPOSITE
ELECTRODES FOR HIGH PERFORMANCE SUPERCAPACITORS
2.1 Introduction
Supercapacitors have gained considerable attention in recent years due to their ultra-fast charge
and discharge rate, excellent stability, long cycle life, and very high power density.1-3 There are
two types of supercapacitors depending on their charge storage mechanism- electric double layer
capacitors (EDLC) and pseudocapacitors.4-13 In EDLC, charges are stored at the electrode surface
14-21 while pseudocapacitors generate a large number of charges due to Faradic reactions.18, 22-27
Hydrous RuO2 has been extensively studied as a pseudocapacitive electrode material because of
its high electrical conductivity, capacitance and energy densities in aqueous electrolytes.28-34 RuO2
is considered one of the best pseudocapacitive materials in terms of charge storage and fast,
reversible reaction kinetics compared with other metal oxides.35-43 Additionally, the availability
of several oxidation states for RuO2 helps store large quantities of charge in RuO2 electrodes.44-
48,89-91 Zheng et. al reported that RuO2 exhibits a specific capacitance as large as 720 F g−1 in
aqueous electrolytes.49-50 High aspect ratio nanostructures such as nanoribbons, nanorods,
nanotubes and nanowires can exhibit high surface areas which helps to increase performance.
However, there are relatively few examples of different RuO2 nanostructures reported including
thin films and nanoparticles.1, 51-54 Methods that have been used to prepare RuO2 nanostructures
include electrostatic spray deposition (ESD) 55, synthesis of ruthenium oxide aerogels 56, radio
frequency rf magnetron sputtering 57 and electrodeposition. 58-59 These methods are expensive and/
or time consuming with little or no control of morphology. Chang et. al reported the synthesis of

5
hydrous RuO2 tubular arrays by anodic deposition with tubes about 200 nm in diameter for
supercapacitor applications.60 Dubala and coworkers reported a chemical bath deposition method
to synthesize RuO2 nanograins of size less than 20 nm to form thin films for supercapacitors and
obtained 167 F g−1 in a polyvinyl alcohol gel electrolyte.61 Bhowmik et al. reported the growth of
one-dimensional RuO2 nanowires (~10 nm in width) on g-carbon nitride, an active and stable
bifunctional electrocatalyst for hydrogen and oxygen evolution.62 Wang et al. synthesized hydrous
ruthenium oxide nanoparticles (~ 5 nm ) anchored to graphene and carbon nanotube hybrid foams
and have achieved a maximum energy density of 13.09 Wh kg-1, a power density of 42.67 kW kg-
1 and a specific capacitance of 502.78 F g−1 in 2 M Li2SO4 aqueous electrolyte.1 Park et. al reported
graphene as a template for growing one dimensional RuO2 nanorods (~ 50 nm width) using a CVD
(chemical vapor deposition) technique.63 Barronco and coworkers have also grown RuO2
nanoparticles (3-15 nm) on amorphous carbon nanofibers for supercapacitor electrodes.64 Kim et
al. reported a template-free synthesis of ruthenium oxide nanotubes (diameter 5-7 nm) for
electrochemical capacitors using a microwave-hydrothermal process and achieved 511 F g-1 in
aqueous electrolyte. In this study, the synthesis of RuO2 nanoribbons is reported for the first time
using a surfactant assisted process.
Pseudocapacitance of a hybrid supercapacitor arises, when the application of a potential induces
faradaic current from reactions such as electrosorption or from the oxidation/ reduction of
electroactive materials.65 When using aqueous electrolyte, ruthenium dioxide exhibits
pseudocapacitance via a coupled proton–electron transfer according to the Eq. (1).66
𝑅𝑢𝑂2 + 𝑛𝐻+ + 𝑛𝑒− ⇌ 𝑅𝑢𝑂2−𝑛(𝑂𝐻) (1)

6
In the past, the presence of protons in equation 1 has restricted the study of ruthenium oxide to
aqueous electrolytes. Unfortunately, the use of aqueous electrolytes is limited to an operating
voltage of about 1.23 V above which water decomposes. In contrast, organic electrolytes can
provide a higher operating voltage up to 4 V.67-72 In the present study, the electrochemical behavior
of RuO2 NR/ Multiwall carbon nanotube composite electrodes in a non-aqueous ionic liquid
electrolyte is reported. 1-Ethyl-3-methylimidazolium bis-(trifluoromethylsulfonyl)-imide (EMIM
TFSI) has interesting properties and has been shown to facilitate redox chemistry in RuO2
pseudocapacitors.38, 73-77. Some imidazolium salts have recently attracted attention as ionic liquid
electrolytes operating at ambient temperature.78 Electrolytic salts with 1,3-substituted imidazolium
cation form ionic liquids which have low viscosity and good fluidity.79-80 Molecular structure of
1-ethyl-3-methyl imidazolium (EMIM+) has shown in Figure S.1-1. Surprisingly, a significant
amount of hydrogen bonding is predicted for nonprotic ionic liquids such as EMIM TFSI.81-82
Egashira et al. studied pseudocapacitive reactions based on imidazolium cation with RuO2.78 The
imidazolium cation has been proposed to form hydrogen bonds and adsorb on the ruthenium oxide
surface.38 Another study involving EMIM/ RuO2 shows that the EMIM cation can intercalate in
the RuO2.74 In this study, EMIM TFSI was used with RuO2 NRs and MNCTs to form coin cells,
where the RuO2 nanoribbons form binderless free standing papers with the MCNTs. Additionally,
the RuO2 provides conducting pathways in the composites.
2.2 Materials and methods
All reagents were used as received. Ruthenium chloride (RuCl3.xH2O) was purchased from
Pressure chemical co. SPAN-80 surfactant was purchased from Sigma Aldrich. High purity

7
multiwall carbon nanotubes (CNTs) (∼ 50 µm in length) were purchased from Sun Innovations
Inc. 1-Ethyl-3-methylimidazolium bis(trifluoromethylsulfonyl)imide (EMIM TFSI) was obtained
from Sigma Aldrich. Typical coin cell packaging (CR-2032) was used to assemble the coin cell
type supercapacitors 67. A Teflon film (Gore Company) was used as the separator between the two
electrodes.
2.3 Synthesis of ruthenium oxide nanoribbons (RuO2 NR)
Hydrous ruthenium oxide nanoribbons were synthesized using a hydrothermal synthesis method
in the presence of a surfactant. First, 0.2 g of ruthenium chloride (RuCl3.xH2O) were dissolved in
10 mL of deionized water. Then, 1.5 mL of Span-80 surfactant was added and stirred at room
temperature until it dissolved. Then 10 mL of butanol were added to the mixture and stirred for
two hours at room temperature. The mixture was transferred to a Teflon lined autoclave with 0.6
g of sodium hydroxide and heated at 180 oC for 15 hours. The resulting product was isolated by
centrifugation and washed with deionized water and ethanol five times. The final product was
vacuum dried at room temperature overnight. The resulting black solid was annealed at 350 oC for
two hours in air.
2.4 Preparation of ruthenium oxide nanoribbon/ carbon nanotube composite electrodes
Prior to the use, MCNTs were washed with 30% (v/v) HNO3 to remove any impurities, followed
by filtration using Millipore (0.22 μm) hydrophilic polycarbonate membrane, with the aid of a
vacuum pump, and washed thoroughly with DI water. XPS spectra were taken before and after

8
washing with 30% (v/v) HNO3 and are reported in supplementary section (Figure 2-S.3). Lee et.
al reported the electrochemical properties of multi-walled carbon nanotubes treated with nitric acid
for a supercapacitor electrode. In this study capacitance increased seven times by treating MCNTs
with HNO3 acid for three hours. Oxidized defect sites provide ionic interaction sites for the
electrolyte and plays a key role in the formation of the electric double layer.83 The MCNTs were
dried at ambient temperature for 15 h using a vacuum oven. The carbon nanotubes (0.2 g) were
dispersed in DI water (200 mL) containing Triton-X 100 (2 g), then bath sonicated for 1 h and
probe sonicated for 15 min at (13 W) in order to disperse the MCNTs in the solution. The MCNT-
RuO2 NR composites were made by mixing w/w ratios of MCNT: RuO2 NR, 50:5 mg (R-1), 50:10
mg (R-2), 50:30 mg (R-3) and 50 mg of MCNTs as a control as shown in table 2-S.1. In order to
establish a well dispersed network of carbon nanotubes and RuO2 nanoribbons in a composite
paper, a high frequency resonant acoustic mixing technique was applied for 10 min prior to
filtration. Both high frequency (acoustic mixing) and low frequency (probe sonication) are very
important to break agglomerates and blend the two components. The composite dispersions were
suction filtered using a Nylon filter paper (Varian Chromatography System-Nylon 66, 0.45 μ m
pore size and 47 mm in diameter). Excess surfactant (Triton-X 100) was removed by washing with
DI water (250 mL) under suction filtration. Complete removal of Triton-X surfactant was
confirmed by FTIR (Figure 2-S.5). The composite papers were allowed to dry at room temperature
for 24 hours and then peeled off the filter paper as a flexible freestanding paper.

9
2.5 Supercapacitor assembly
The MCNT/RuO2 NR and the MCNT electrodes were immersed in the electrolyte, EMIM TFSI
for 1 h at room temperature. The composite paper anode and the MCNT cathode were separated
by a Teflon film. The coin cell packaging (CR2032) was used to assemble the supercapacitors as
previously described. Carbon coated aluminum sheets were used as the current collectors.
Additional EMIM TFSI electrolyte (~ 0.2 ml) was introduced to each electrode and sealed in the
coin cell using a coin cell crimper (Shenzhen Yongxingye precision machinery mold) by pressing
at 1100 psig.
2.6 Characterization
Transmission electron microscope (TEM) and scanning electron microscope (SEM) images were
acquired using a JEOL JEM-2100 TEM at 200 kV (JEOL Co. Ltd.) and a Leo 1530 VP field
emission electron microscope. X-ray powder diffraction (XRD) patterns were obtained using a
Rigaku Ultima IV diffractometer (CuKα radiation). Cyclic voltammograms (CV) and
galvanostatic charge/discharge curves were obtained using Arbin battery testing system (BT2000)
in the range of –2.0 to 2.0 V (voltage window of 4V). X-ray Photoelectron Spectroscopy (XPS)
measurements were performed using a Perkin Elmer PHI 5600 System. The photoelectrons were
excited using monochromatic Al Kα radiation (h ν = 1486.6 eV) and the spectra were acquired with
a 45o emission angle, using 0.125 eV step size and a pass energy of 29.35 eV in the hemispherical
analyzer. The porosity and pore volume were measured from the nitrogen adsorption isotherms at

10
-196.15 oC K (Quantachrome Instruments Autosorb-1). The specific surface area of the composites
was determined by the Brunauer–Emmett–Teller (BET) method
2.7 Results and discussion
2.8 Characterization of RuO2 nanoribbons
Figure 2-1 SEM images of RuO2 nanoribbons at a) low and b) high magnification. A histogram
for the ribbon width (inset).

11
Figure 2-1. shows the typical scanning electron microscope images of the as synthesized RuO2
nanoribbons at different magnifications. Figure 2-1.a shows a low magnification SEM image that
reveals the densely packed network of stacked nanoribbons. The width of the RuO2 NRs ~ 10-12
nm (insert 1.a). A higher magnification SEM image of the RuO2 in Figure 2-1.b clearly shows the
ribbon nature. The thickness of the RuO2 NRs is ~ 2 nm and up to 600 nm long. The nanoribbons
tend to aggregate in to bundles.
Figure 2-S.2 shows the nitrogen adsorption–desorption isotherms of the RuO2 NRs. The surface
area of the RuO2 NRs was 148 m2 g-1 which is higher than what has been reported for other RuO2
nanostructures. For example, Jeon et al reported RuO2 nanoparticles (size ~12.2 nm) with a surface
area of 78.2 m2 g-1 and Sivakami et. al reported RuO2 nanoparticles (~20 nm) with a surface area
of 118–133 m2 g-1.84-85 Hyoung et. al reported ruthenium and ruthenium oxide nanoparticles
supported carbon nanofibers having a surface area of 54.7 m2 g-1.86 The as synthesized RuO2
nanoribbons were also characterized using X-ray diffraction (XRD) as shown in Figure 2-2 where
the characteristic peaks for RuO2 (JCPDS-00-040-1290) are assigned to the (110), (101), (200),
(111), (211), (220) and (022).87
Figure 2-3. a) and b) shows the top views of TEM image of RuO2 NRs. The higher resolution TEM
image (inset) shows the RuO2 NRs (~ 9 nm) are oriented in the (110) direction (Figure 2-2.b) along
the ribbon axis consistent with the d-spacing of 0.318 nm (table 2-S.2). The RuO2 (110) orientation
is generally more stable and readily reducible orientation than other orientations.88

12
Figure 2-2 a) XRD pattern of annealed RuO2 nanoribbons with the simulated pattern (JCPDS-00-
040-1290) b) Crystal structure of RuO2 viewed in (110) direction, calculated using crystal maker
and the crystallographic data in reference.87
Figure 2-3 a) Top view TEM images of RuO2 NRs a) and b) with different magnification and
inset of high resolution image showing (110) plane with the d-spacing of 0.318 nm

13
2.9 Fabrication and characterization of hybrid RuO2 nanoribbon carbon nanotube
composite papers
Recently, multiwall carbon nanotubes (MCNTs) have attracted interest as electrode materials for
supercapacitors due to their unique structure and morphology, low mass density, outstanding
chemical stability, electronic conductivity and mechanical performance.89-91 Most importantly,
MCNTs can be used to prepare binder free flexible electrodes.67, 92-94 MCNT composites with
various metal oxides, such as RuO2, MnO2 and V2O5 have been used as electrode materials for
pseudocapacitors due to their large capacitance and fast redox kinetics.30, 54, 67, 95-97 The low
electrical conductivity of most metal oxides decreases the power density in asymmetric
capacitors.60 In an effort to increase electrical conductivity, metal oxide nanostructures have been
combined with conductive carbons such as graphene, MCNTs, activated carbon, etc.67, 98-100 RuO2
is a well-known conducting metal oxide and the electrical conductivity of the RuO2 NRs was
measured to be 1390 S m-1. The conductivity of the RuO2 NR/MCNT composites were measured
using a four probe measurement and found to be 1210 S m-1 for R-1, 1260 S m-1 for R-2, 1264 S
m-1 for R-3 and only 2.054 S m-1 for just the MCNTs. Therefore, the RuO2 provides
pseudocapacitance and increases the conductivity of the electrodes. The RuO2 NRs are only ~ 100-
600 nm long and do not form free standing papers themselves. In contrast, the MCNTs are ~ 50
µm long and readily form free standing papers. The MCNTs combined with the RuO2 NRs also
form free standing flexible composite paper electrodes. A digital image of the MCNT- RuO2 NR
(R-3) composite paper is shown in Figure 2-S.4. The binderless free standing composite papers
are flexible and can be cut in to electrodes with constant area in order to fabricate the coin cells.

14
The R-3 MCNT- RuO2 nanoribbon composite electrode (R-3) was further characterized using HR-
TEM as shown in Figure 2-4.a. The RuO2 nanoribbons and MCNTs are well dispersed and
connected, which is important for migration of electrons and ions through the electrode. The
thickness of the all the composite electrodes (R-1, R-2, R-3 and MCNT) was measured to be 0.05
± 0.01 mm.
Figure 2-4 TEM image of a) MCNT- RuO2 nanoribbon composite electrode (R-3), b) high
resolution image showing planes of RuO2 nanoribbons lattice fringes with the d spacing of 0.318
nm (110) and MCNT.
Figure 2-4.b shows a high resolution TEM image of a selected area, where the d-spacing was
measured to be 0.318 nm again consistent with the (110) plane orientation of RuO2. The d-spacing
was calculated using the XRD pattern and Bragg’s law in order to compare with the TEM images
and are reported in the supplementary section table 2-S.2. The calculated d-spacing match well
with the d-spacing measured from the TEM images.

15
XPS studies provide further insight into the local environment and oxidation state of the ruthenium
oxide nanoribbons. Figure 2-5 shows the deconvoluted XPS spectrum of RuO2 NRs, where the
two bands at 286.2 eV and 281.5 eV, readily assigned to Ru 3d3/2 and Ru 3d5/2.39 There are four
peaks appeared after deconvolute the two spin orbital-doublet. These high binding energy satellite
peaks can be identify as a second spin doublet due to the strong coulombic interaction between
the electrons in the d-orbital and the hole generated by the photoionization.101 Foelske and
coworkers have done extensive study on X-ray photoelectron studies of RuO2 at different
annealing temperatures and found out the second doublet evolve with the increasing annealing
temperature.102 Morgan et. al reported similar study and showed that the second doublet is an
indication of dehydration level of the crystalline structure and available RuO2 oxidation state is
only +4.103 Peak intensity increase or decrease with the hydration level and crystallinity of the
structure.
Figure 2-5 XPS spectrum of RuO2 NR with the peak assignments.

16
2.10 Electrochemical characterization of MCNT- RuO2 NR composite papers
Figure 2-6 Cyclic voltammograms of composite paper having different RuO2 nanoribbon
compositions b) galvanostatic charging and discharging curves measured at constant current
density 1.0 A g-1 c) charge–discharge profile of R-3 supercapacitor at 1 A g−1 for the 1st and
1000th cycle d) capacitance retention of R-3 over 1000 charge/discharge cycles evaluated from
the galvanostatic discharge curves.
Electric charge can be stored in the bulk ruthenium oxide in addition to the carbon
electrode/electrolyte interface. However, capacitance decreases rapidly as the scan rate increases
which can be described to electrolyte depletion and oversaturation during the charge discharge
process. In the case of pseudo-capacitors, reversible redox processes take place on the surface
when the valance electrons in the electroactive RuO2 are transferred across the electrode-
electrolyte interface depending on the applied potential window. The MCNTs contribute electric
double layer capacitance and also provide electrical pathways for electron transfer during charging

17
and discharging. The combined redox capacitance from the RuO2 nanoribbons and EDLC from
MCNTs in the composite paper is expected to give higher energy and power densities.30 The
electrochemical behavior of the composite was evaluated using two electrode CR2032 type coin
cell supercapacitors. The cyclic voltammograms (CVs) and galvanostatic charge/discharge curves
for the composite papers with different loadings of MCNTs are shown in Figure 2-6. All
electrochemical studies were performed in a voltage range of −2.0 to 2.0 V, which is more
beneficial in terms of the high energy densities compared to aqueous electrolytes.2
The cyclic voltammograms of different RuO2 NR/ MCNT electrodes in Figure 2-6.a show a quasi-
rectangular shape indicating ideal capacitive behavior over the selected potential range. It appears
the RuO2 NRs play an important role in electrochemical behavior of composite papers. The MCNT
electrode exhibits the lowest current output (Figure 2-6.a) as well as poor capacitive behavior. This
illustrates the necessity of optimizing the amount of RuO2 NRs in the composite to overcome the
low performance. The composite paper having higher amounts of RuO2 NRs (R-3) generated
higher current densities. It should be noted that increasing the amount of RuO2 NRs creates more
conducting paths, which increases the rate of electron flow from the electrode. Figure 2-6.b shows
the charge/discharge curves obtained at constant a current of 3 A g −1. Figure 2-6.c shows the
charge and discharge curves for the 1st and 1000th cycles which was performed in a 3.0 V potential
window. Over 1000 cycles, the charge and discharge time decreases about 15%. The retention of
the specific capacitance against the cycle number is shown in Figure 2-6.d. After the 500th cycle
~80% of the specific capacitance was retained while after 1000th cycles ~70% of the capacitance
was retained as shown in the Figure 2-6.d which shows good cycling ability. The capacitance
retention reflects in part the degradation of the coin cell since it was assembled in air. Compared

18
with the literature, Lee et. al reported a carbon nanofiber/hydrous RuO2 nanocomposite that
exhibits a 10% loss in capacitance over 300 cycles in 1M H2SO4 electrolyte.104 Kim et al also
reported a hydrous ruthenium oxide/ carbon nanocomposite which exhibits a ~10 % loss in
capacitance after 1000 cycles in 1M H2SO4 electrolyte.
With higher loadings of RuO2 NRs a redox couple can be observed in the CV (Figure 2-6.a) which
is due to the pseudocapacitive behavior of the RuO2 NRs. These redox couples cannot be identified
using a two electrode system (without reference). Therefore, a three electrode experiment was
conducted as shown in Figure 2-7.
Figure 2-7 Three electrode cyclic voltammogram of RuO2 NRs with reference to Ag/Ag+ in 1M
EMIM TFSI in acetonitrile at 50 mV s-1
The electrochemical behavior of the pure RuO2 NRs was analyzed by cyclic voltammetry using
1M EMIM TFSI in acetonitrile at 50 mV s-1 with a Pt counter electrode reference to Ag/Ag+ in the
potential range 2.0 to -1.0 V. Figure 2-7, shows pure RuO2 NR electrode cyclic voltammogram
that exhibits two redox couples situated at Eeq(I) = 0.12 V and Eeq(II) = 0.63 V in 1M EMIM TFSI

19
in acetonitrile. (Eeq = (Epa+ Epc)/2, where Epa is the potential value of the anodic peak and Epc the
potential value of the corresponding cathodic peak). Erwin et al. reported the redox couple related
to Ru+2/Ru+3 is at approximately 0.12 V which can be attributed to peak (I) and Ru+3/Ru+4 is
approximately at 0.6 V which can be assigned to peak (II).105 Therefore, the RuO2 NRs can
undergo oxidation and reduction in this system to achieve pseudocapacitance using EMIM-TFSI.
Figure 2-8 a), b) Electrochemical impedance spectroscopy (EIS) of different RuO2 NRs
composite electrodes.
Electrochemical impedance spectroscopy (EIS) measurements of the MCNT and the RuO2 NR
nanocomposite electrodes are shown in Figure 2-8.a and 2-8.b. The EIS plots consist of (1) a high-
frequency intercept on the real Z' axis, (2) a semicircle in the high-to-medium-frequency region,
and (3) a straight line at the very low-frequency region.106 The diameter of the semicircle decreases
with increasing RuO2 NR, contact showing the charge transfer resistance is decreasing with an
increasing amount of RuO2 NRs in the composite.107 The pure MCNT electrode has the highest
radius semicircle which shows the highest resistance. Increasing the RuO2 amount in R-1, R-2 and

20
R-3 decreases the diameter of the semicircle, corresponding to a decrease in internal resistance.
The R-3 composite does not have a visible semicircle in Figure 2-8.b showing the lowest internal
resistance. This is consistent with the electrical conductivity of RuO2 NRs and MCNT electrodes
(1390 S m-1 and 2.05 S m-1 respectively).
The energy and power densities for the composite papers were calculated according to the equation
E = (I ×Δ t×ΔV)/(2×m) and P = E/Δt, where I is the constant discharge current, Δt is the discharge
time, ΔV is the voltage difference after the voltage drop (due to internal device resistant) and m
is the total mass of both electrodes (carbon fiber electrode and the composite paper electrode).
Table 2-1 shows capacitance, power and energy densities at different loadings of RuO2 NRs. The
specific capacitance (Csp) was calculated according to the equation Csp = ( I×Δt )/( m×Δ V ) where
I is the discharge current and t is the time it takes to discharge to 0 V from the initial voltage (ΔV),
taking into account the IR drop at the beginning of discharge. The specific capacitance is found to
be around 277 F g−1 for the R-3 device (fabricated coin cell supercapacitor). It should be noted that
the Csp calculated is for a two electrode system based on the total weight of the positive and the
negative electrode. Only MCNTs were used in a control experiment and the calculated specific
capacitance was 20.5 F g-1, energy density was 13 Wh Kg−1 and power density was 1.5 kW Kg −1
at 1 Ag-1. R-1, R-2 and R-3 composite electrodes have increasing loading of RuO2 nanoribbons
and constant amount of MCNTs. R-1 has the minimum amount of RuO2 nanoribbons (10 wt%)
and a 43.75 F g-1 which is a 150% increase in specific capacitance compared to MCNTs. R-2 has
20 % (w/w) RuO2 nanoribbons and it shows specific capacitance around 65.62 F g-1 which is a
275% increase. R-3 has 60 % (w/w) RuO2 nanoribbons and it shows 276.66 F g-1 which is over a
1400 % increase in specific capacitance. R-1 shows the energy density 27 Wh Kg −1, a 107.6 %

21
increase over the pure MCNTs. R-2- shows 64 Wh Kg −1 which is 392.3 % increase in energy
density. R-3 shows 161 Wh Kg −1 which is over 1138.4 % increase in energy density.
Table 2-1Specific capacitance, energy and power densities for different compositions calculated
from galvanostatic charging/discharging curves.
Sample Specific
capacitance (Fg-1)
Energy density (Wh kg-1) Power density (W/kg)
1 A g-1 10 A g-1 1 A g-1 10 A g-1
MCNT 20.5 ± 2.0 12.9 ± 0.5 8.3 ± 0.5 1499 ± 10 15000 ± 25
R-1 43.7 ± 1.5 27.0 ± 0.5 12.5 ± 0.5 1500 ± 10 15100 ± 50
R-2 65.6 ± 1.0 63.7 ± 1.0 20.8 ± 1.0 1504 ± 8 15000 ± 25
R-3 276.6 ± 2.0 160.8 ± 1.0 110.4 ± 1.0 1510 ± 10 15100 ± 25
According to Table 2-1, the electrochemical contribution of RuO2 NRs can be seen by comparing
the capacitance, power and energy density of samples R-1, R-2 and R-3 which are in the order of
increasing amount of RuO2 NRs. The composite having the highest RuO2 NRs content (R-3)
exhibits a higher energy density. The higher energy density largely reflects an increase in
pseudocapacitance from the RuO2 NRs compared with the electric double layer capacitance where,
R-3 gives ~ 80 Wh kg-1 and MCNT gives ~13 Wh kg-1. Kim et. al reported hydrous ruthenium
oxide/ carbon nanotube base supercapacitors with capacitance 863 Fg-1 in 1M H2SO4 aqueous
electrolyte and reported a power density 4000 W kg-1 and 17.6 Wh kg-1 energy density.108 The
aqueous electrolyte gives a higher capacitance compared with ionic liquid because of its high
22
conductivity and ion diffusion. Shen et al synthesized carbon encapsulated RuO2 nanodots
anchored on graphene for asymmetric supercapacitors with 75 F g-1 and 84 Wh kg-1 at 1 A g-1 in
EMIM-BF4 ionic electrolyte.74
Figure 2-9 Ragone plot for hybrid composite paper electrodes MCNT, R-1, R-2 and R-3 paper
electrode.
Figure 2- 9 shows a Ragone plot derived from the Galvanostatic discharge curves measured at
different charge–discharge current densities (1 A g-1 – 10 A g-1) indicating that R-3 composite
delivers higher energy and power densities compared to that of MCNT electrode. When increasing
current densities, energy density drops. MCNT shows the minimum drop and R-3 shows the
highest. When increasing the current density, the coin cells charge and discharge very quickly.
When the charge and discharge process is fast there is less time to undergo redox reaction.
Therefore, when increasing current density redox process are limited. This will result to lower the
energy density with higher current densities. R-3 composite has higher RuO2 NRs loading of than

23
MCNT. Therefore, energy density drops faster in R-3 than the MCNT electrode. The significant
improvement in the performance of R-3 (RuO2 NR/MCNT composite) can be attributed to the
increasing conductivity of the electrode due to the RuO2 and the pseudocapacitive behavior.
Increasing the amount of RuO2 NRs in the composite leads to brittle electrodes. Therefore, there
is a limitation with regards to the amount of pseudocapacitive material because of mechanical
properties. In EDLCs the charges are stored at the surface of the electrode such that charge can be
accessed readily in a short time to deliver higher power densities. The pseudocapacitance from
RuO2 NRs is due to the generation of large number of charges from the redox reactions, which
results in higher energy densities.
RuO2 is one of the best pseudocapacitive materials, but supercapacitor applications have been
generally limited to aqueous electrolytes (1.2 V potential window). In this study ionic electrolytes
were used which are having a higher voltage window (4 V potential window). Additionally, the
RuO2 nanoribbons have increased the supercapacitor performance with pseudocapacitance.
2.11 Conclusion
The ribbon morphology enabled the preparation of freestanding flexible RuO2 NR-MCNT
nanocomposite paper without using organic binders. These composite electrodes were used as the
cathode and MCNTs used as an anode in a coin cell type supercapacitor. The nanocomposite paper
having highest RuO2 nanoribbon loading (R-3) displayed ideal capacitive behavior with 1510 W
kg-1 of power density and 160.8 Wh kg-1 energy density and 276.66 F g-1 specific capacitance based
on the total weight of the electrodes. Ability to use these hybrid nanocomposite papers in wide
range of applications was demonstrated with constant energy densities. Our results have proven

24
the ability to use ionic liquid electrolyte with RuO2 to obtain the pseudocapacitance. Novel
preparation method of RuO2 nanoribbons can also be applied to prepare other metal oxide
nanoribbons. These binder-free metal oxide nanoribbon composites are promising candidates for
application in high performance supercapacitors.
2.12 Supporting information
Figure 2-S. 1 Structure of 1-ethyl-3-methyl imidazolium (EMIM+)
Figure 2-S. 2 shows the nitrogen adsorption–desorption isotherms of the RuO2 NRs sample.

25
Table 2-S. 1 Composition of composite electrodes.
Sample MCNT (mg) RuO2 NR (mg)
CNT 50 -
R-1 50 5
R-2 50 10
R-3 50 30
Table 2-S. 2 d-spacing comparison calculated by XRD and TEM image
Plane d-spacing calculated by XRD (nm) d-spacing calculated by TEM (nm)
(110) 0.301 0.318
Figure 2-S. 3 XPS spectrum of MCNTs a) before b) after wash with 30% HNO3 with the peak
assignments
Figure 2-S. 3 shows the XPS spectra of MCNTs used to make composite electrodes. Prior to use,
MCNTs were washed with 30 % HNO3 to remove any metal catalysts and debris. During this
process conductivity was increased from 100 Sm-1 to 205 Sm-1 and also sp2 character was
increased. Casa XPS software were used to estimate the area under the curve. Peak at 284.0 eV

26
(C-C sp2) have increased 61 %, peak at 284.6 (C=O) have increased 18% and peak at 288.5 eV
(O-C=O) have increased 2%.
Figure 2-S. 4 digital photograph of MCNT- RuO2 nanoribbon composite paper electrode (VR-3).
Figure 2-S. 5 FT-IR spectra of (a) pure Triton X-100 and (b) VR-3 composite electrode
FTIR spectra of pure Triton X-100 and VR-3 composite was collected In order to confirm the
complete removal of Triton X-100 surfactant. Figure 2-S. 5 shows the FTIR spectra of pure Tritin
X-100 and VR-3 composite electrode. The bands at 2951 and 2871 cm−1 are owing to the
asymmetric and symmetric CH2 stretch corresponding to the Triton X-100 surfactant which is not
visible in VR-3 composite.

27
2.13 References
1. Wang, W.; Guo, S.; Lee, I.; Ahmed, K.; Zhong, J.; Favors, Z.; Zaera, F.; Ozkan, M.; Ozkan, C.
S., Hydrous Ruthenium Oxide Nanoparticles Anchored to Graphene and Carbon Nanotube Hybrid
Foam for Supercapacitors. Scientific Reports 2014, 4, 4452.
2. Wei, L.; Yushin, G., Nanostructured Activated Carbons from Natural Precursors for Electrical
Double Layer Capacitors. Nano Energy 2012, 1, 552-565.
3. Wang, X.; Ruan, D.; Wang, P.; Lu, Y., Pseudo-Capacitance of Ruthenium Oxide/Carbon Black
Composites for Electrochemical Capacitors. Journal of University of Science and Technology
Beijing, Mineral, Metallurgy, Material 2008, 15, 816-821.
4. Egashira, M.; Izumi, T.; Yoshimoto, N.; Morita, M., Determining Water Content in Activated
Carbon for Double-Layer Capacitor Electrodes. Journal of Power Sources 2016, 326, 635-640.
5. Li, L.; Gao, P.; Gai, S.; He, F.; Chen, Y.; Zhang, M.; Yang, P., Ultra Small and Highly Dispersed
Fe3O4 Nanoparticles Anchored on Reduced Graphene for Supercapacitor Application.
Electrochimica Acta 2016, 190, 566-573.
6. Feng, W. X.; Ji, W. D. Z. L., Research on the Hybrid Supercapacitor with Nickel Oxide and
Carbon Nanotube Electrodes. Chinese Journal of Inorganic Chemistry 2003, 2, 005.
7. Kim, H. K.; Park, S. H.; Yoon, S. B.; Lee, C. W.; Jeong, J. H.; Roh, K. C.; Kim, K. B., In Situ
Synthesis of Three-Dimensional Self-Assembled Metal Oxide–Reduced Graphene Oxide
Architecture. Chemistry of Materials 2014, 26, 4838-4843.
8. Kim, I. H.; Kim, J. H.; Cho, B. W.; Kim, K. B., Pseudocapacitive Properties of
Electrochemically Prepared Vanadium Oxide on Carbon Nanotube Film Substrate. Journal of The
Electrochemical Society 2006, 153, A1451-A1458.
9. Lee, C. W.; Yoon, S. B.; Bak, S. M.; Han, J.; Roh, K. C.; Kim, K. B., Soft Templated
Mesoporous Manganese Oxide/Carbon Nanotube Composites Via Interfacial Surfactant
Assembly. Journal of Materials Chemistry A 2014, 2, 3641-3647.
10. Lee, C. W.; Yoon, S. B.; Kim, H. K.; Youn, H. C.; Han, J.; Roh, K. C.; Kim, K. B., A Two-
Dimensional Highly Ordered Mesoporous Carbon/Graphene Nanocomposite for Electrochemical
Double Layer Capacitors: Effects of Electrical and Ionic Conduction Pathways. Journal of
Materials Chemistry A 2015, 3, 2314-2322.
11. Lee, S. W.; Bak, S. M.; Lee, C. W.; Jaye, C.; Fischer, D. A.; Kim, B. K.; Yang, X. Q.; Nam,
K. W.; Kim, K. B., Structural Changes in Reduced Graphene Oxide Upon MnO2 Deposition by

28
the Redox Reaction between Carbon and Permanganate Ions. The Journal of Physical Chemistry
C 2014, 118, 2834-2843.
12. Nam, K. W.; Kim, K. H.; Lee, E. S.; Yoon, W. S.; Yang, X. Q.; Kim, K. B., Pseudocapacitive
Properties of Electrochemically Prepared Nickel Oxides on 3-Dimensional Carbon Nanotube Film
Substrates. Journal of Power Sources 2008, 182, 642-652.
13. Nazarian-Samani, M.; Kim, H.; Park, S.; Youn, H.; Mhamane, D.; Lee, S.; Kim, M.; Jeong,
Ji.; Haghighat-Shishavan, S.; Roh, K.; Kashani-Bozorg.; Seyed Farshid.; Kim, K.,Three-
Dimensional Graphene-Based Spheres and Crumpled Balls: Micro- and Nano-Structures,
Synthesis Strategies, Properties and Applications. RSC Advances 2016, 6, 50941-50967.
14. Morita, M.; Arizono, R.; Yoshimoto, N.; Egashira, M., On the Electrochemical Activation of
Alkali-Treated Soft Carbon for Advanced Electrochemical Capacitors. Journal of Applied
Electrochemistry 2014, 44, 447-453.
15. Tokita, M.; Egashira, M.; Yoshimoto, N.; Morita, M., The Influence of Graphitic Structure of
Carbon Electrode on Aging Behavior of Electric Double Layer Capacitor. Electrochemistry 2012,
80, 752-754.
16. Roy, S.; Soin, N.; Bajpai, R.; Misra, D. S.; McLaughlin, J. A.; Roy, S. S., Graphene Oxide for
Electrochemical Sensing Applications. Journal of Materials Chemistry 2011, 21, 14725-14731.
17. Roy, S.; Bajpai, R.; Soin, N.; Bajpai, P.; Hazra, K. S.; Kulshrestha, N.; Roy, S. S.; McLaughlin,
J. A.; Misra, D. S., Enhanced Field Emission and Improved Supercapacitor Obtained from Plasma-
Modified Bucky Paper. Small 2011, 7, 688-693.
18. Li, C.; Wang, D.; Liang, T.; Wang, X.; Ji, L., A Study of Activated Carbon Nanotubes as
Double-Layer Capacitors Electrode Materials. Materials Letters 2004, 58, 3774-3777.
19. Wang, X. F.; Wang, D. Z.; Liang, J.; Kong, X. H., Research on the Carbon Based Double-
Layer Capacitor and Hybrid Power Source. Acta Electronica Sinica 2002, 30, 1100-1103.
20. Kim, M. H.; Kim, K. B.; Kang, K.; Han, J. T.; Roh, K. C., Ribbon-Like Activated Carbon with
a Multi-Structure for Supercapacitors. Journal of Materials Chemistry A 2013, 1, 14008-14012.
21. Kim, M. H.; Kim, K. B.; Park, S. M.; Roh, K. C., Hierarchically Structured Activated Carbon
for Ultracapacitors. Scientific Reports 2016, 6, 21182.
22. Egashira, M.; Tsubouchi, Y.; Yoshimoto, N.; Morita, M., Electrode Behavior of Iron
Oxide/Carbon Nanotube Composite in Ionic Liquid Electrolyte. Electrochemistry 2015, 83, 244-
248.

29
23. Egashira, M.; Kushizaki, J. Y.; Yoshimoto, N.; Morita, M., The Effect of Dispersion of Nano-
Carbon on Electrochemical Behavior of Fe/Nano-Carbon Composite Electrode. Journal of Power
Sources 2008, 183, 399-402.
24. Bhattacharya, G.; Kandasamy, G.; Soin, N.; Upadhyay, R. K.; Deshmukh, S.; Maity, D.;
McLaughlin, J.; Roy, S. S., Novel-Conjugated Iron Oxide/Reduced Graphene Oxide
Nanocomposites for High Performance Electrochemical Supercapacitors. RSC Advances 2017, 7,
327-335.
25. Wang, X. F.; Ruan, D. B.; You, Z., Pseudo-Capacitive Behavior of Cobalt Hydroxide/Carbon
Nanotubes Composite Prepared by Cathodic Deposition. Chinese Journal of Chemical Physics
2006, 19, 499-505.
26. Wang, X. F.; Ruan, D. B.; You, Z., Application of Spherical Ni(OH)2/Cnts Composite
Electrode in Asymmetric Supercapacitor. Transactions of Nonferrous Metals Society of China
2006, 16, 1129-1134.
27. Wang, X. F.; Wang, D. Z.; Liang, J., Pseudo-Capacitance of Ultrafine Nickel Hydroxide
Prepared by Sol-Gel Method. Acta Physico-Chimica Sinica 2005, 21, 117-122.
28. Jiang, H.; Lee, P. S.; Li, C., 3D Carbon Based Nanostructures for Advanced Supercapacitors.
Energy & Environmental Science 2013, 6, 41-53.
29. Yu, Z.; Tetard, L.; Zhai, L.; Thomas, J., Supercapacitor Electrode Materials: Nanostructures
from 0 to 3 Dimensions. Energy & Environmental Science 2015, 8, 702-730.
30. Frackowiak, E.; Béguin, F., Carbon Materials for the Electrochemical Storage of Energy in
Capacitors. Carbon 2001, 39, 937-950.
31. Huo, Y.; Xie, Z.; Wang, X.; Li, H.; Hoang, M.; Caruso, R. A., Methyl Orange Removal by
Combined Visible-Light Photocatalysis and Membrane Distillation. Dyes and Pigments 2013, 98,
106-112.
32. Xia, H.; Meng, Y. S.; Yuan, G.; Cui, C.; Lu, L., A Symmetric RuO2/RuO2 Supercapacitor
Operating at 1.6 V by Using a Neutral Aqueous Electrolyte. Electrochemical and Solid-State
Letters 2012, 15, A60-A63.
33. Jang, J. H.; Kato, A.; Machida, K.; Naoi, K., Supercapacitor Performance of Hydrous
Ruthenium Oxide Electrodes Prepared by Electrophoretic Deposition. Journal of The
Electrochemical Society 2006, 153, A321-A328.
34. Xiao-feng, W.; Zheng, Y.; Dian-bo, R., Hydrous Ruthenium Oxide with High Rate Pseudo-
Capacitance Prepared by a New Sol-Gel Process. Chinese Journal of Chemical Physics 2006, 19,
341.

30
35. Fu, R.; Ma, Z.; Zheng, J. P., Proton NMR and Dynamic Studies of Hydrous Ruthenium Oxide.
The Journal of Physical Chemistry B 2002, 106, 3592-3596.
36. Sugimoto, W.; Iwata, H.; Yokoshima, K.; Murakami, Y.; Takasu, Y., Proton and Electron
Conductivity in Hydrous Ruthenium Oxides Evaluated by Electrochemical Impedance
Spectroscopy: The Origin of Large Capacitance. The Journal of Physical Chemistry B 2005, 109,
7330-7338.
37. Brumbach, M. T.; Alam, T. M.; Nilson, R. H.; Kotula, P. G.; McKenzie, B. B.; Tissot, R. G.;
Bunker, B. C., Ruthenium Oxide–Niobium Hydroxide Composites for Pseudocapacitor
Electrodes. Materials Chemistry and Physics 2010, 124, 359-370.
38. Egashira, M.; Matsuno, Y.; Yoshimoto, N.; Morita, M., Pseudo-Capacitance of Composite
Electrode of Ruthenium Oxide with Porous Carbon in Non-Aqueous Electrolyte Containing
Imidazolium Salt. Journal of Power Sources 2010, 195, 3036-3040.
39. Soin, N.; Roy, S. S.; Mitra, S. K.; Thundat, T.; McLaughlin, J. A., Nanocrystalline Ruthenium
Oxide Dispersed Few Layered Graphene Nanoflakes as Supercapacitor Electrodes. Journal of
Materials Chemistry 2012, 22, 14944-14950.
40. Wang, X.; Yin, Y.; Hao, C.; You, Z., A High-Performance Three-Dimensional Micro
Supercapacitor Based on Ripple-Like Ruthenium Oxide–Carbon Nanotube Composite Films.
Carbon 2015, 82, 436-445.
41. Wang, X.; Yin, Y.; Li, X.; You, Z., Fabrication of a Symmetric Micro Supercapacitor Based
on Tubular Ruthenium Oxide on Silicon 3d Microstructures. Journal of Power Sources 2014, 252,
64-72.
42. Feng, W. X.; Ji, W. D. Z. L., Prepatation of Ultra-Fine Ruthenium Oxide as an Electrode
Material for Electrochemical Capacitors. Chinese Journal of Inorganic Chemistry 2003, 4, 006.
43. Kim, I. H.; Kim, J. H.; Lee, Y. H.; Kim, K. B., Synthesis and Characterization of
Electrochemically Prepared Ruthenium Oxide on Carbon Nanotube Film Substrate for
Supercapacitor Applications. Journal of The Electrochemical Society 2005, 152, A2170-A2178.
44. Simon, P.; Gogotsi, Y., Materials for Electrochemical Capacitors. Nature Materials 2008, 7,
845-854.
45. Xiaofeng, W.; Qi, G.; Ji, L., Nano Ruthenium Oxide/Carbon Nanotubes Composite Electrode
Material for Electrochemical Capacitors. Rare Metal Materials and Engineering 2006, 35, 295.
46. Xiaofeng, W.; Dazhi, W.; Ji, L., Activated Carbon Based Ruthenium Oxide Materials for
Supercapacitor. Rare Metal Materials and Engineering 2003, 32, 424-427.

31
47. Kim, J. Y.; Kim, K. H.; Kim, H. K.; Park, S. H.; Chung, K. Y.; Kim, K. B., Nanosheet-
Assembled 3d Nanoflowers of Ruthenium Oxide with Superior Rate Performance for
Supercapacitor Applications. RSC Advances 2014, 4, 16115-16120.
48. Kim, J. Y.; Kim, K. H.; Kim, H. K.; Park, S. H.; Roh, K. C.; Kim, K. B., Template-Free
Synthesis of Ruthenium Oxide Nanotubes for High-Performance Electrochemical Capacitors. ACS
Applied Materials & Interfaces 2015, 7, 16686-16693.
49. Zheng, J. P.; Jow, T. R., A New Charge Storage Mechanism for Electrochemical Capacitors.
Journal of The Electrochemical Society 1995, 142, L6-L8.
50. Zheng, J. P.; Cygan, P. J.; Jow, T. R., Hydrous Ruthenium Oxide as an Electrode Material for
Electrochemical Capacitors. Journal of The Electrochemical Society 1995, 142, 2699-2703.
51. Zheng, Y. Z.; Ding, H. Y.; Zhang, M. L., Hydrous–Ruthenium–Oxide Thin Film Electrodes
Prepared by Cathodic Electrodeposition for Supercapacitors. Thin Solid Films 2008, 516, 7381-
7385.
52. Kim, I. H.; Kim, K. B., Ruthenium Oxide Thin Film Electrodes for Supercapacitors.
Electrochemical and Solid-State Letters 2001, 4, A62-A64.
53. Kim, I. H.; Kim, K. B., Ruthenium Oxide Thin Film Electrodes Prepared by Electrostatic Spray
Deposition and Their Charge Storage Mechanism. Journal of The Electrochemical Society 2004,
151, E7-E13.
54. Kim, J. Y.; Kim, K. H.; Park, S. H.; Kim, K. B., Microwave-Polyol Synthesis of
Nanocrystalline Ruthenium Oxide Nanoparticles on Carbon Nanotubes for Electrochemical
Capacitors. Electrochimica Acta 2010, 55, 8056-8061.
55. Park, S. H.; Kim, J. Y.; Kim, K. B., Pseudocapacitive Properties of Nano-Structured
Anhydrous Ruthenium Oxide Thin Film Prepared by Electrostatic Spray Deposition and
Electrochemical Lithiation/Delithiation. Fuel Cells 2010, 10, 865-872.
56. Suh, D. J.; Park, T. J.; Kim, W. I.; Hong, I. K., Synthesis of High-Surface-Area Ruthenium
Oxide Aerogels by Non-Alkoxide Sol–Gel Route. Journal of Power Sources 2003, 117, 1-6.
57. Vayunandana Reddy, Y. K.; Mergel, D., Structural and Electrical Properties of RuO2 Thin
Films Prepared by Rf-Magnetron Sputtering and Annealing at Different Temperatures. Journal of
Materials Science: Materials in Electronics 2006, 17, 1029-1034.
58. Park, B. O.; Lokhande, C. D.; Park, H. S.; Jung, K. D.; Joo, O. S., Cathodic Electrodeposition
of RuO2 Thin Films from Ru(III)Cl3 Solution. Materials Chemistry and Physics 2004, 87, 59-66.

32
59. Hu, C. C.; Wang, C. W.; Wu, T. H.; Chang, K. H., Anodic Composite Deposition of Hydrous
RuO2–TiO2 Nanocomposites for Electrochemical Capacitors. Electrochimica Acta 2012, 85, 90-
98.
60. Hu, C. C.; Chang, K. H.; Lin, M. C.; Wu, Y. T., Design and Tailoring of the Nanotubular
Arrayed Architecture of Hydrous RuO2 for Next Generation Supercapacitors. Nano Letters 2006,
6, 2690-2695.
61. Dubal, D. P.; Gund, G. S.; Holze, R.; Jadhav, H. S.; Lokhande, C. D.; Park, C. J., Solution-
Based Binder-Free Synthetic Approach of RuO2 Thin Films for All Solid State Supercapacitors.
Electrochimica Acta 2013, 103, 103-109.
62. Bhowmik, T.; Kundu, M. K.; Barman, S., Growth of One-Dimensional RuO2 Nanowires on
G-Carbon Nitride: An Active and Stable Bifunctional Electrocatalyst for Hydrogen and Oxygen
Evolution Reactions at all pH Values. ACS Applied Materials & Interfaces 2016, 8, 28678-28688.
63. Park, J. E.; Lee, Y.; Lee, J.; Jang, H. S.; Shin, H. Y.; Yoon, S.; Baik, J. M.; Kim, M. H.; Kim,
S. J., Graphene as a Highly Efficient Template for Growing One-Dimensional RuO2
Nanostructures. Crystal Growth & Design 2012, 12, 3829-3833.
64. Barranco, V.; Pico, F.; Ibañez, J.; Lillo-Rodenas, M. A.; Linares-Solano, A.; Kimura, M.; Oya,
A.; Rojas, R. M.; Amarilla, J. M.; Rojo, J. M., Amorphous Carbon Nanofibres Inducing High
Specific Capacitance of Deposited Hydrous Ruthenium Oxide. Electrochimica Acta 2009, 54,
7452-7457.
65. Faraji, S.; Ani, F. N., Microwave-Assisted Synthesis of Metal Oxide/Hydroxide Composite
Electrodes for High Power Supercapacitors – a Review. Journal of Power Sources 2014, 263, 338-
360.
66. Conway, B. E., Transition from “Supercapacitor” to “Battery” Behavior in Electrochemical
Energy Storage. Journal of The Electrochemical Society 1991, 138, 1539-1548.
67. Perera, S. D.; Patel, B.; Nijem, N.; Roodenko, K.; Seitz, O.; Ferraris, J. P.; Chabal, Y. J.;
Balkus, K. J., Vanadium Oxide Nanowire–Carbon Nanotube Binder-Free Flexible Electrodes for
Supercapacitors. Advanced Energy Materials 2011, 1, 936-945.
68. Egashira, M.; Tanaka, T.; Yoshimoto, N.; Morita, M., Electrode Reaction Concerning
Imidazolium Cation and Graphite in Organic Solvent Electrolyte. Solid State Ionics 2012, 219, 29-
33.
69. Egashira, M.; Asai, T.; Yoshimoto, N.; Morita, M., Ionic Conductivity of Ternary Electrolyte
Containing Sodium Salt and Ionic Liquid. Electrochimica Acta 2011, 58, 95-98.

33
70. Egashira, M.; Okada, S.; Yamaki, J. I., The Effect of the Coexistence of Anion Species in
Imidazolium Cation-Based Molten Salt Systems. Solid State Ionics 2002, 148, 457-461.
71. Choi, B. R.; Park, S. J.; Kim, S., Effect of Ionic Liquids on the Capacitance Behaviors of
Activated Carbon Electrodes against Organic Electrolytes. Journal of Nanoscience and
Nanotechnology 2016, 16, 9149-9152.
72. Kim, H. S.; Kim, Y. H.; Roh, K. C.; Kim, K. B., Sandwich-Type Ordered Mesoporous
Carbon/Graphene Nanocomposites Derived from Ionic Liquid. Nano Research 2016, 9, 2696-
2706.
73. Rochefort, D.; Pont, A. L., Pseudocapacitive Behaviour of RuO2 in a Proton Exchange Ionic
Liquid. Electrochemistry Communications 2006, 8, 1539-1543.
74. Shen, B.; Zhang, X.; Guo, R.; Lang, J.; Chen, J.; Yan, X., Carbon Encapsulated RuO2 Nano-
Dots Anchoring on Graphene as an Electrode for Asymmetric Supercapacitors with Ultralong
Cycle Life in an Ionic Liquid Electrolyte. Journal of Materials Chemistry A 2016, 4, 8180-8189.
75. Egashira, M.; Shimomura, H.; Yoshimoto, N.; Morita, M.; Yamaki, J. I., Effect of Carbonate
Additives on the Conductivity of Lithium Salt Solution of Ionic Liquid. Electrochemistry 2005,
73, 585-588.
76. Egashira, M.; Todo, H.; Yoshimoto, N.; Morita, M., Lithium Ion Conduction in Ionic Liquid-
Based Gel Polymer Electrolyte. Journal of Power Sources 2008, 178, 729-735.
77. Egashira, M.; Todo, H.; Yoshimoto, N.; Morita, M.; Yamaki, J. I., Functionalized Imidazolium
Ionic Liquids as Electrolyte Components of Lithium Batteries. Journal of Power Sources 2007,
174, 560-564.
78. Egashira, M.; Tanaka, T.; Matsuno, Y.; Yoshimoto, N.; Morita, M. In Pseudo-Capacitive
Reactions Based on Imidazolium Ion, 2011; 80350F-80350F-6.
79. Wilkes, J. S.; Zaworotko, M. J., Air and Water Stable 1-Ethyl-3-Methylimidazolium Based
Ionic Liquids. Journal of the Chemical Society, Chemical Communications 1992, 965-967.
80. Bonhôte, P.; Dias, A. P.; Papageorgiou, N.; Kalyanasundaram, K.; Grätzel, M., Hydrophobic,
Highly Conductive Ambient-Temperature Molten Salts. Inorganic Chemistry 1996, 35, 1168-
1178.
81. Housaindokht, M. R.; Hosseini, H. E.; Sadeghi Googheri, M. S.; Monhemi, H.; Najafabadi, R.
I.; Ashraf, N.; Gholizadeh, M., Hydrogen Bonding Investigation in 1-Ethyl-3-Methylimidazolium
Based Ionic Liquids from Density Functional Theory and Atoms-in-Molecules Methods. Journal
of Molecular Liquids 2013, 177, 94-101.

34
82. Dong, K.; Song, Y.; Liu, X.; Cheng, W.; Yao, X.; Zhang, S., Understanding Structures and
Hydrogen Bonds of Ionic Liquids at the Electronic Level. The Journal of Physical Chemistry B
2012, 116, 1007-1017.
83. Lee, K. S.; Park, M.; Ko, J. M.; Kim, J. D., Electrochemical Properties of Multi-Walled Carbon
Nanotubes Treated with Nitric Acid for a Supercapacitor Electrode. Colloids and Surfaces A:
Physicochemical and Engineering Aspects 2016, 506, 664-669.
84. Jeon, H. S.; Chandra Permana, A. D.; Kim, J.; Min, B. K., Water Splitting for Hydrogen
Production Using a High Surface Area RuO2 Electrocatalyst Synthesized in Supercritical Water.
International Journal of Hydrogen Energy 2013, 38, 6092-6096.
85. Sivakami, R.; Dhanuskodi, S.; Karvembu, R., Estimation of Lattice Strain in Nanocrystalline
RuO2 by Williamson–Hall and Size–Strain Plot Methods. Spectrochimica Acta Part A: Molecular
and Biomolecular Spectroscopy 2016, 152, 43-50.
86. An, G. H.; Lee, E. H.; Ahn, H. J., Ruthenium and Ruthenium Oxide Nanofiber Supports for
Enhanced Activity of Platinum Electrocatalysts in the Methanol Oxidation Reaction. Physical
Chemistry Chemical Physics 2016, 18, 14859-14866.
87. Yang, F.; Zhang, L.; Zuzuarregui, A.; Gregorczyk, K.; Li, L.; Beltrán, M.; Tollan, C.; Brede,
J.; Rogero, C.; Chuvilin, A.; Knez, M., Functionalization of Defect Sites in Graphene with RuO2
for High Capacitive Performance. ACS Applied Materials & Interfaces 2015, 7, 20513-20519.
88. Over, H., Surface Chemistry of Ruthenium Dioxide in Heterogeneous Catalysis and
Electrocatalysis: From Fundamental to Applied Research. Chemical Reviews 2012, 112, 3356-
3426.
89. Zhang, Y. N.; Sun, G. Z.; Zheng, L. X., Fabrication and Properties of Macroscopic Carbon
Nanotube Assemblies Transforming from Aligned Nanotubes. Journal of Nanomaterials 2015,
2015, 8.
90. Hu, L.; Pasta, M.; Mantia, F. L.; Cui, L.; Jeong, S.; Deshazer, H. D.; Choi, J. W.; Han, S. M.;
Cui, Y., Stretchable, Porous, and Conductive Energy Textiles. Nano Letters 2010, 10, 708-714.
91. Liang, J.; Li, F.; Cheng, H. M., Flexible Supercapacitors: Tuning with Dimensions. Energy
Storage Materials.
92. Pan, H.; Li, J.; Feng, Y., Carbon Nanotubes for Supercapacitor. Nanoscale Research Letters
2010, 5, 654-668.
93. Youn, H. C.; Bak, S. M.; Park, S. H.; Yoon, S. B.; Roh, K. C.; Kim, K. B., One-Step
Preparation of Reduced Graphene Oxide/Carbon Nanotube Hybrid Thin Film by Electrostatic

35
Spray Deposition for Supercapacitor Applications. Metals and Materials International 2014, 20,
975-981.
94. Youn, H. C.; Park, S. H.; Roh, K. C.; Kim, K. B., Highly Dispersible Surface-Unzipped Multi-
Walled Carbon Nanotubes as Binder-Free Electrodes for Supercapacitor Applications. Current
Applied Physics 2015, 15, Supplement 1, S21-S26.
95. Lv, W.; Li, Z.; Deng, Y.; Yang, Q. H.; Kang, F., Graphene-Based Materials for
Electrochemical Energy Storage Devices: Opportunities and Challenges. Energy Storage
Materials 2016, 2, 107-138.
96. Chen, T.; Dai, L., Flexible and Wearable Wire-Shaped Microsupercapacitors Based on Highly
Aligned Titania and Carbon Nanotubes. Energy Storage Materials 2016, 2, 21-26.
97. Yoon, S. B.; Roh, K. C.; Kim, K. B., Effect of Electronic Wiring on the Electrochemical
Reaction Sites in Manganese Oxide with Pseudocapacitive Behavior. Journal of The
Electrochemical Society 2014, 161, H365-H369.
98. Perera, S. D.; Liyanage, A. D.; Nijem, N.; Ferraris, J. P.; Chabal, Y. J.; Balkus Jr, K. J.,
Vanadium Oxide Nanowire – Graphene Binder Free Nanocomposite Paper Electrodes for
Supercapacitors: A Facile Green Approach. Journal of Power Sources 2013, 230, 130-137.
99. Xu, X.; Wang, M.; Liu, Y.; Li, Y.; Lu, T.; Pan, L., In Situ Construction of Carbon
Nanotubes/Nitrogen-Doped Carbon Polyhedra Hybrids for Supercapacitors. Energy Storage
Materials 2016, 5, 132-138.
100. Liang, J.; Li, F.; Cheng, H. M., Carbons: Multi-Functional Energy Storage Materials. Energy
Storage Materials 2016, 2, A1-A2.
101. Kim, Y. J.; Gao, Y.; Chambers, S. A., Core-Level X-Ray Photoelectron Spectra and X-Ray
Photoelectron Diffraction of RuO2 (110) Grown by Molecular Beam Epitaxy on TiO2 (110).
Applied Surface Science 1997, 120, 250-260.
102. Foelske, A.; Barbieri, O.; Hahn, M.; Kötz, R., An X-Ray Photoelectron Spectroscopy Study
of Hydrous Ruthenium Oxide Powders with Various Water Contents for Supercapacitors.
Electrochemical and Solid-State Letters 2006, 9, A268-A272.
103. Morgan, D. J., Resolving Ruthenium: Xps Studies of Common Ruthenium Materials. Surface
and Interface Analysis 2015, 47, 1072-1079.
104. Lee, B. J.; Sivakkumar, S. R.; Ko, J. M.; Kim, J. H.; Jo, S. M.; Kim, D. Y., Carbon
Nanofibre/Hydrous RuO2 Nanocomposite Electrodes for Supercapacitors. Journal of Power
Sources 2007, 168, 546-552.
36
105. Coleman, G. N.; Gesler, J. W.; Shirley, F. A.; Kuempel, J. R., Rates of Acid Hydrolysis and
Stabilities of Ruthenium(II) Pentaammine Chloride and Bromide Complex Ions. Inorganic
Chemistry 1973, 12, 1036-1038.
106. Guan, C.; Xia, X.; Meng, N.; Zeng, Z.; Cao, X.; Soci, C.; Zhang, H.; Fan, H. J., Hollow Core-
Shell Nanostructure Supercapacitor Electrodes: Gap Matters. Energy & Environmental Science
2012, 5, 9085-9090.
107. Xiao, Xu Ding, T.; Yuan, L.; Shen, Y.; Zhong, Q.; Zhang, X.; Cao, Y.; Hu, B.; Zhai, T.;
Gong, L.; Chen, J.; Tong, Y.; Zhou, J.; Wang, Z., WO3−X/MOO3−X Core/Shell Nanowires on
Carbon Fabric as an Anode for All-Solid-State Asymmetric Supercapacitors. Advanced Energy
Materials 2012, 2, 1328-1332.
108. Kim, K. S.; Winograd, N., X-Ray Photoelectron Spectroscopic Studies of Ruthenium-Oxygen
Surfaces. Journal of Catalysis 1974, 35, 66-72.
37
CHAPTER 3
RUTHENIUM OXIDE NANODOT DECORATED VANADIUM OXIDE NANOROD–
CARBON NANOTUBE COMPOSITES FOR SUPERCAPACITORS
3.1 Introduction
Electrolytic capacitors produce high power densities but low energy densities.1 The ideal energy
storage device, should be able to achieve high energy density, high power density and cycling
ability. This device most likely will be a supercapacitor. The ability to deliver high power density
in short time intervals would be an added advantage for the application of portable electric power
sources.2 Supercapacitors are attractive for highly time-dependent power demands3 when charge
and discharge can occur in a short time of period. Supercapacitors can be classified into two
categories depending on their charge-storage mechanism. Electric double-layer capacitors
(EDLCs) store energy based on the adsorption and desorption of both anions and cations. In
contrast, pseudocapacitors, store energy through fast surface redox reactions.4-5 In EDLCs charges
are stored at the electrode surface and they are readily accessible and help to obtain high power
densities.6 Carbon-based materials such as activated carbons and carbon nanotubes (CNTs) are
being used as electrode materials due to their fast charge-discharge rates and longer cycling lives.1,
6-7 Composite electrodes that integrate CNTs are growing in interest.8-9 Carbon-based electrode
nanomaterials often display good cycling stability but their specific capacitance is not high.
Therefore, developing composite electrodes that combine both EDLC and pseudocapacitor type
materials has become more popular where redox active materials show higher specific capacitance
than conventional EDLCs.10-11 Different types of transition metal oxides such as RuO2, Fe3O4,
CuO, MnO2, CuO, WO3, V2O5 have been shown to be promising materials for
38
pseudocapacitance.8, 12-17 RuO2 has been studied widely as a pseudocapacitive electrode material
because of its high electrical conductivity, high capacitance and high energy densities.18-19 RuO2
is one of the best pseudocapacitive materials known and displays good electrical conductivity,20
however, it is expensive.13, 21 In contrast V2O5 costs ~2-3 times less than RuO2 and is a good
pseudocapacitive material.9 Unfortunately, V2O5 is not very conductive. Therefore, the addition of
a small amount of RuO2 could increase the conductivity of a V2O5 composite and improve
pseudocapacitance.
Pusawale et. al have reported RuO2- SnO2 film prepared by chemical bath deposition method and
obtained capacitance 150 F g-1 in aqueous electrolyte.22 Shen et. al synthesized carbon
encapsulated RuO2 nanodots (~ 1- 4 nm) anchored on to the graphene and prepared an asymmetric
supercapacitor in ionic liquid electrolyte (75 F g-1 capacitance23, 108 Wh Kg-1 energy density and
103 W h kg-1 power density).23 Leng et. al reported that pseudocapacitive behavior of RuO2
nanoparticles (~3-8 nm) dispersed on graphene sheets can deliver 542.5 F g-1 capacitance in
aqueous electrolyte.24 Wang and coworkers reported RuO2 nanoparticles anchored on a graphene
/ carbon nanotube hybrid foam exhibited a capacitance of 502.78 F g-1 in aqueous electrolyte.8
While these results are promising, replacing more of the RuO2 with V2O5 would result in an
economic saving.
In this study, RuO2 NDs were chemically attached with VNRs and used to make composite
electrodes with carbon nanotubes. Since VNRs are only partially covered by the RuO2 NDs, the
electrolyte can access and penetrate the VNRs. RuO2 NDs can also act as a pseudocapacitive
material while enhancing the conductivity of the composite.25-28 In this study 0.1 M LiTFSI in
EMIM TFSI ionic liquid electrolyte was used to provide a higher operating voltage window (4 V)

39
than aqueous electrolytes (1.23 V). To our knowledge this is the first example of V2O5 surface
modified with RuO2 used for supercapacitors.
3.2 Materials and methods
All reagents were used without further purification. Ammonium metavanadate (NH4VO3) (99%)
was purchased from Sigma-Aldrich. Pluronic P123 surfactant was obtained from BASF
Corporation. Lithium bis(trifluoromethanesulfonamide) (LiTFSI) was obtained from TCI
America. A Teflon film (Gore Company) was used as the separator for supercapacitor assembly.
Ruthenium chloride (RuCl3.xH2O) was purchased from Pressure chemical CO. Thiolactic acid
(95%) was purchased from Sigma-Aldrich. High purity multiwall carbon nanotubes (CNTs) (∼ 50
µm in length) were obtain from Sun Innovations Inc. 1-Ethyl-3-methylimidazolium
bis(trifluoromethylsulfonyl)imide (EMIM TFSI) was obtained from Sigma Aldrich. All solvents
were used without further purification. Two electrode coin cell package (CR2032) was used to
assemble all coin cell type supercapacitors.15
3.3 Synthesis of vanadium oxide nanorods (VNRs)
VNRs were synthesized according to a previously reported procedure.15 Briefly, ammonium
metavanadate (0.3 g) and P123 (EO20PO70EO20) (0.5 g) were dissolved in 30 mL of deionized (DI)
water in the presence of 2M HCl (1.5 mL, ~ pH 1). The mixture was stirred at room temperature
for 7 h. Then the resulting solution was transferred to a 45 mL Teflon-lined autoclave and heated
at 120 oC for 24 h under static conditions. The product was then dispersed in 50 mL DI water and

40
probe sonicated (10 W) for 5 min to obtain a homogeneous dispersion. The resulting product was
isolated by centrifugation (4000 rpm) and washed with deionized water and ethanol five times.
The final green product was vacuum dried at room temperature overnight.
3.4 Synthesis of ruthenium oxide nanodot (RuO2 ND) decorated vanadium oxide nanorods
(VNRs)
VNRs (0.3 g) were re-dispersed in 30 mL of DI water and 25 µL of Thiolactic acid (TLA) (95%)
were added to the solution and then stirred for 24 h. RuCl3.xH2O (0.1 g) was then added to the
solution and stirred for another 24 h (~ pH 5). Solid was isolated by centrifuging and washed with
DI water several times to remove any excess RuCl3 and dried at room temperature. Then, the VNRs
were treated with 20 mL of a 1M NaOH solution for 24 h at room temperature. The dark green
solid was isolated by filtration and washed several times with DI water to remove any unbound
RuO2. The resulting dark green solid was then annealed at 250 oC for 3 h in air.
3.5 Preparation of ruthenium oxide nanodot (RuO2 ND) chemically bound vanadium oxide
nanorods/ carbon nanotube composite electrodes
To prepare the electrodes, different concentrations of RuO2 NDs modified on VNRs were mixed
with a constant amount of CNTs as follows. Samples VR-1, VR-2, VR-3, VR-4, VR-5 and VR-6
were prepared by mixing 0.025 g, 0.05 g, 0.075 g, 0.1 g, 0.2 g and 0.3 g of RuO2 NDs bound VNRs
with 0.1 g of CNTs and 4% PTFE as a binding agent to bind everything together. As a control 0.1

41
g of CNT was used to prepare CNT electrode. Additionally, 0.1 g of CNTs and 0.1 g of VNRs
were mixed to prepare a VNRs /CNT composite electrode.
3.6 Supercapacitor assembly
The VR composite electrodes and the CNT electrodes were immersed in the electrolyte 0.1 M
LiTFSI in EMIM TFSI (~ 1 ml) for 1 h at room temperature. The composite paper anode and the
CNT cathode were separated by a Teflon film. The coin cell packaging (CR2032) was used to
assemble the supercapacitors as previously described.29 Carbon coated aluminum sheets were used
as the current collectors. Additional electrolyte (~ 0.2 mL) was introduced to each electrode and
sealed in coin cell using a crimper (Shenzhen Yongxingye precision machinery mold) by pressing
at 1500 psig.
3.7 Characterization
High resolution transmission electron microscope (HR-TEM) and scanning electron microscope
(SEM) images were acquired using a JEOL JEM-2100 TEM at 200 kV (JEOL Co. Ltd.) and a Leo
1530 VP field emission electron microscope. X-ray powder diffraction (XRD) patterns were
obtained using a Rigaku Ultima IV diffractometer (Cu Kα radiation). Cyclic voltammograms (CV)
and galvanostatic charge/discharge curves were obtained using Arbin battery testing system
(BT2000) in the range of – 2.0 to 2.0 V (voltage window of 4V). X-ray Photoelectron Spectroscopy
(XPS) measurements were obtained using a Perkin Elmer PHI 5600 System.

42
3.8 Results and discussion
3.9 Characterization of ruthenium oxide nanodots (RuO2 NDs) decorated vanadium oxide
nanorods (VNRs)
Figure 3-1 a) SEM b) TEM image of as synthesized VNRs (inset) size distribution histogram
Vanadium nanorods (VNRs) were synthesized using a hydrothermal synthesis method.9 The
morphology of VNRs was characterized using scanning electron microscopy (SEM) as shown in
Figure 3-1.a. The Figure 3-1.a inset shows the size distribution histogram for the VNRs where the
average diameter and length are about 1-3 μm long and ~ 60 nm in diameter. Figure 3-1.b shows
the top view of transmission electron microscope of VNR. Calculated d-spacing of 0.96 nm
corresponds to the plane (001).9

43
Figure 3-2 Scheme for the preparation of VNRs decorated with RuO2 NDs
The VNRs were modified with RuO2 NDs following the procedure developed for growing PbS
quantum dots on TiO2 nanotubes as shown in Figure 3-2.30 First, the surface of the VNRs were
functionalized with thiolactic acid where the carboxylate group of the thiolactic acid binds to the
surface of the VNRs. Then the thiol group binds to the Ru+3 ions. Growth of RuO2 NDs occurs
after reaction with NaOH (Figure 3-2). This experimental design results in RuO2 NDs attached to
the surface of the VNRs and prevents the formation of bulk RuO2 nanoparticles since there is no
free Ru+3 ions in solution. Additionally, by changing the TLA concentration, the amount of Ru+3
is limited and in theory the size of the RuO2 NDs can be controlled. Transmission electron
microscopy (TEM) images and the corresponding size distribution of the RuO2 NDs on the VNRs
are shown in Figure 3-3. The size of the RuO2 NDs are 1-4 nm in size, where ~ 50 % of the RuO2
NDs were 2 nm in size. The RuO2 NDs are well dispersed on the VNRs as shown by TEM (Figure
3-3b). Leng et. al reported the growth of RuO2 nanoparticle (~ 3 – 8 nm) on graphene sheets.24 A
study by Shen and coworkers also obtained ~ 3 nm RuO2 nanoparticles on graphene. Wang et. al
reported ~ 5 nm hydrous RuO2 nanoparticles were anchored on graphene/ carbon nanotube

44
composites.8 Uddin et. al prepared RuO2 nanoparticle (~ 2-5 nm) deposited TiO2 nanoparticles (~
15- 18 nm) for photocatalysis.
Figure 3-3 a),b) TEM images of RuO2 ND bound VNRs c) particle size distribution of RuO2
NDs on VNRs
Figure 3-4 XRD pattern of a) VNRs b) RuO2 NDs decorated VNRs.
Figure 3-4 shows the XRD pattern of the VNRs (Figure 3-4.a) and RuO2 ND modified VNRs
(Figure 3-4.b) after annealing process. The characteristic peaks for dehydrated V2O5 assigned to
(200), (001), (101), (110), (400), (011), (111), (310), (002), (102), (411), (600), (021), (020), (610),

45
(601), (021), (020), (601), (021), (320) and (710) planes are labeled in Figure 4. For RuO2 the
reflections are assigned to the (110), (101), (111) and (211) planes as shown in Figure 3-4.b.31-34
The X-ray photoelectron spectra (XPS) spectra of RuO2 NDs combined with VNRs are shown in
Figure 3-5.a. The peak at 517.4 eV corresponds to the binding energy of the V2p3/2 electrons for
vanadium in the + 5 oxidation state. The peak at 515.9 eV is due to the partial reduction of the + 5
ions to + 4 during the hydrothermal synthesis of the VNRs.9, 33 Figure 3-5.a shows the
deconvoluted XPS spectrum of the RuO2 NDs, where the two bands at 285.2 eV and 281.2 eV, are
readily assigned to Ru 3d3/2 and Ru 3d5/2. Besides the two major spin orbit-doublet, there is a
second doublet that appears after peak deconvolution. The second doublet at B.E = 282.1 eV and
286.2 eV occurs due to the RuO2 crystalline structure. Foelske et. al reported on X-ray
photoelectron spectroscopy study of RuO2 at different annealing temperatures and showed that
with increasing temperature (above 200 oC) a second spin-orbit doublet evolves.35 The peak
intensity of the second doublet increases with the annealing temperature. The second doublet was
generated due to the final state screen effects coursed by the strong coulombic interaction between
d-orbital electrons and photoionized holes. Similar studies by Morgan and coworkers showed that
the second doublet is on indication of dehydration and crystallinity of the structure.36 Kim et. al
reported core level X-ray photoelectron spectra of RuO2 and shown that the second doublet is
strictly due to the final-state screening effects of the Ru+4 oxidation state.37

46
Also they have shown that the only possible oxidation state present in RuO2 is Ru+4.
Figure 3-5 XPS spectrum of RuO2 NDs bound VNRs with peak assignments for a) V2O5 b) RuO2

47
3.10 Electrochemical characterization of RuO2 NDs /VNRs composite papers
Figure 3-6 Cyclic voltammograms b) discharge curves of composite electrodes at 25 mV s-1 c)
charge discharge curve of 1st and 1000th cycle and d) capacitance retention for VR-5
The electrochemical behavior of the composite electrodes was investigated using an asymmetric
coin cell set up using composite electrode as an anode and the CNT as the cathode. Various
electrochemical measurements were performed to contrast the electrochemical performance of the
different composite electrodes and carbon nanotubes (CNTs). Cyclic voltammetry (CV) curves of
the composites were collected at a scan rate of 25 mV s-1, in the potential range of -2.0 to 2.0 V
(Figure 3-6.a). In this study EMIM TFSI (4 V) was used as the electrolyte since organic electrolyte
have larger potential windows than aqueous electrolyte (1.23 V).38 EMIM TFSI have been use
with RuO2 in order to achieve higher capacitance, energy densities and power densities.23, 39 The

48
CV curves from the composites were compared to the CV curves of CNTs and VNRs/CNTs. The
cyclic voltammograms of the composites in Figure 3-6.a show a quasi-rectangular shape that
indicate ideal capacitive behavior. When RuO2 NDs were bound on to the VNRs, the capacitance
increased ~ 12 times. With increasing amounts of RuO2 NDs on the VNRs, the capacitance rapidly
increased (VR-5, 158.3 F g-1). Discharge curves for the CNTs and VNRs /CNT electrode at 1 Ag-
1 are shown in Figure 3-6.b. The coin cells were charged up to 3.5 V and time calculated to reach
0 V. The initial IR drop in the discharge curve is related to the device resistance. The IR drop
varies with the conductivity of the electrodes. With increasing amounts of the RuO2 ND on VNRs
the IR drop decreases. Table 3-1 shows the IR drop for each electrode related to each discharge
curve. The highest IR drop was observed for the CNT and VNR/ CNT electrodes. Upon
incorporation of RuO2 NDs on to the VNRs, the IR drop decreases significantly as a result of
increased conductivity. Furthermore, the conductivity of the VNRs and RuO2 ND bound VNRs
was also measured using a four probe conductivity meter. V2O5 is a poor electrical conductor 40
and the conductivity of VNRs found to be 0.2 S m-1 which is similar to previous reports for V2O5.41
When the RuO2 NDs were added to the VNRs, the conductivity increased to 40 S m-1.
Table 3-1 Specific capacitance and IR drop of composite electrodes.
Sample name Specific capacitance (F g-1) IR drop (Ω)
CNT 17.5 0.41
VNR /CNT 20.1 0.46
VR-1 24.2 0.21
VR-2 40.1 0.15

49
VR-3 61.3 0.13
VR-4 81.2 0.10
VR-5 158.3 0.10
VR-6 110.1 0.31
The energy and power densities for the composite electrodes were calculated using the following
equation. E = (I ×Δ t×ΔV)/(2×m) and P = E/Δt, where I is the constant discharge current, Δt is
the discharge time, ΔV is the voltage difference after the voltage drop and m is the total mass of
the electrodes. Table 3-1 shows capacitance at different amounts of the VNRs with RuO2 nanodots.
The specific capacitance (Csp) was calculated according to the equation Csp = ( I×Δt )/( m×Δ V ).
Where I is the discharge current and t is the time it takes to discharge to 0 V from the initial voltage
(ΔV). After taking into account the IR drop at the beginning of discharge curve, the highest specific
capacitance (Csp) calculated using a current density of 1 Ag-1, was 158 F g-1 for the VR-5
composite. The ratio of CNT to VNRs for the VR-5 composite is 1:2 by wt%. Perera et. al reported
vanadium oxide nanorods carbon nanotube composite with specific capacitance 48.5 F g-1 for a
ratio of 1:1 wt%.9 Saravanakumar et. al synthesized a V2O5 functionalized CNT hybrid
nanocomposite for supercapacitors with 64 F g-1 capacitance.42 Bonso et. al reported a VNR
composite with Exfoliated graphite nanoplatelets for supercapacitors with 70 F g-1 capacitance.43
The CNT and VNR/ CNT composite electrodes used as control and showed in the present study
specific capacitance of 17 F g-1 and 20 F g-1 respectively. When the VNRs were combined with
RuO2 NDs, the specific capacitance increased to 24 F g-1 (VR-1). Which is higher than both the

50
VNRs / CNT and CNTs. When the amount of RuO2 NDs/ VNRs, the specific capacitance increased
to 158 F g-1, which is nine times higher than that of the pure CNT electrode. The Energy density
of the CNT electrode and the VR-5 composite were 13 Wh kg-1 and 157.08 Wh kg-1 respectively
(table 3-2). Perera et. al reported a 46. 3 Wh kg-1 energy density for a VNR/ CNT nanocomposite.9
Bonso and coworkers prepared exfoliated graphite nanoplatelets – V2O5 nanotube composites with
an energy density 28 Wh kg-1 and the maximum power density was 10.1 kW kg-1 at 10 A g-1 current
density (> 6.36 kW kg-1).15
Table 3-2 Energy densities of composite electrodes
Sample name Energy density (Wh kg-1)
CNT 12.92
VNR/CNT 30.45
VR-1 78.37
VR-2 80.20
VR-3 90.42
VR-4 120.21
VR-5 157.08
VR-6 132.91

51
In order to evaluate the cycling stability sample VR-5 was charged up to 3.5 V and discharged to
0 V continuously up to 1000 cycles. Figure 3-6.c shows the charge discharge curves for 1st and
1000th cycle for VR-5. Capacitance retention was calculated using charge discharge curves. Figure
3-6.d shows the capacitance retention vs cycle number. After 500 cycles 95 % of the capacitance
was retained and 80 % retained after 1000 cycles for the VR-5 composite electrode (Figure 3-6.d).
Since the coin cell was assembled in air, some loss in capacitance was expected.
Figure 3-7 Three electrode cyclic voltammogram (CV) of RuO2 NDs decorated VNR (VR-5)
with reference to Ag/Ag+ in 0.1 M LiTFSI in EMITFSI
Figure 3-6.a shows quasi reversible redox peaks that arise from the metal oxides. Therefore, a three
electrode CV was collected in order to assign the redox peaks appear in the CVs (Figure 3-7). The
composite electrode (VR-5) was used as a working electrode, Pt wire as a counter electrode and
Ag/Ag+ as a reference electrode. The CV was obtained in 0.1 M LiTFSI in EMIM TFSI at 10 mV
s-1 in the potential range of - 2.0 V to 2.0 V. The CV plot of the composite shows two distinct
redox peaks at Eeq = – 0.57 V which can be attribute the Li ion intercalation and deintercalation
in to V2O5.43 Peaks appear at Eeq = 0.63 V can be attributed to the Ru+3/Ru+4 couple.43-44

52
Figure 3-8 a) Electrochemical impedance spectroscopy (EIS) b) Ragone plot of different
composite electrodes
Electrochemical impedance spectroscopy (EIS) measurements of the composite electrodes are
shown in Figure 3-8.a (VR-1, 6). The EIS plots consists of (1) a high-frequency intercept on the
real Z' axis and (2) a semicircle in the high-to-medium-frequency region.45 The diameter of the
semicircle decreases with the increasing amount of RuO2 NDs decorated VNRs, showing the
charge transfer resistance is decreasing as the amount of RuO2 NDs in the composite increases.14
The VR-1 has the highest radius semicircle which shows the highest resistance (~ 5 Ω). Increasing
the RuO2 NDs with VNRs amount in VR-1 (1:0.25), VR-2 (1:0.5), VR-3 (1:0.75), VR-4 (1:1) and
VR-5 (1:2) decreases the diameter of the semicircle, corresponding to a decrease in internal
resistance.
Figure 3-8.b shows a Ragone plot of energy density versus power density for the different
composite electrodes. VR-5 delivered higher energy and power density compared to the other
composite electrodes. In Figure 3-8.b the energy density decreased with an increase in current

53
density. This may be due to the low penetration of the ions into the RuO2 NDs and V2O5 nanorods
layers due to fast potential changes. According to the Ragone plot, the composite electrodes with
VNRs modified with RuO2 NDs show improved performance over the other composite electrodes.
3.11 Conclusion
In this study we have successfully synthesized RuO2 nanodots bound to V2O5 nanorods by using
thiolactic acid as a linker to bind Ru+3 ions followed by a reaction with NaOH. The size of the
RuO2 nanodots are on average 2-3 nm and homogeneously dispersed on the V2O5 nanorods. The
composite electrode with 1:2 (wt%) (VR-5) shows the best performance where capacitance of 158
F g-1, energy density of 157.08 Wh kg-1 and highest power density of 10.1 kW kg-1 in. This novel
preparation method can be implemented to prepare different metal oxide nanodots composite
materials to improve the performance of energy storage device such as supercapacitors and lithium
ion batteries.
3.12 References
1. Liang, J.; Li, F.; Cheng, H. M., Carbons: Multi-functional Energy Storage Materials. Energy
Storage Materials 2016, 2, A1-A2.
2. Lee, H. Y.; Kim, S. W.; Lee, H. Y., Expansion of Active Site Area and Improvement of Kinetic
Reversibility in Electrochemical Pseudocapacitor Electrode. Electrochemical and Solid-State
Letters 2001, 4 (3), A19-A22.

54
3. Pan, H.; Li, J.; Feng, Y., Carbon Nanotubes for Supercapacitor. Nanoscale Research Letters
2010, 5 (3), 654-668.
4. Kim, B. K.; Sy, S.; Yu, A.; Zhang, J., Electrochemical Supercapacitors for Energy Storage and
Conversion. In Handbook of Clean Energy Systems, John Wiley & Sons, Ltd: 2015.
5. Park, J. E.; Lee, Y.; Lee, J.; Jang, H. S.; Shin, H. Y.; Yoon, S.; Baik, J. M.; Kim, M. H.; Kim,
S. J., Graphene as a Highly Efficient Template for Growing One-Dimensional RuO2
Nanostructures. Crystal Growth & Design 2012, 12 (8), 3829-3833.
6. Simon, P.; Gogotsi, Y., Materials for electrochemical capacitors. Nature Materials 2008, 7 (11),
845-854.
7. Frackowiak, E.; Béguin, F., Carbon materials for the electrochemical storage of energy in
capacitors. Carbon 2001, 39 (6), 937-950.
8. Wang, W.; Guo, S.; Lee, I.; Ahmed, K.; Zhong, J.; Favors, Z.; Zaera, F.; Ozkan, M.; Ozkan, C.
S., Hydrous Ruthenium Oxide Nanoparticles Anchored to Graphene and Carbon Nanotube Hybrid
Foam for Supercapacitors. Scientific Reports 2014, 4, 4452.
9. Perera, S. D.; Patel, B.; Bonso, J.; Grunewald, M.; Ferraris, J. P.; Balkus, K. J., Vanadium Oxide
Nanotube Spherical Clusters Prepared on Carbon Fabrics for Energy Storage Applications. ACS
Applied Materials and Interfaces 2011, 3 (11), 4512-4517.
10. Chen, L. M.; Lai, Q. Y.; Hao, Y. J.; Zhao, Y.; Ji, X. Y., Investigations on capacitive properties
of the AC/V2O5 hybrid supercapacitor in various aqueous electrolytes. Journal of Alloys and
Compounds 2009, 467 (1–2), 465-471.
11. Wang, P.; Liu, H.; Tan, Q.; Yang, J., Ruthenium oxide-based nanocomposites with high
specific surface area and improved capacitance as a supercapacitor. RSC Advances 2014, 4 (81),
42839-42845.
12. Perera, S. D.; Rudolph, M.; Mariano, R. G.; Nijem, N.; Ferraris, J. P.; Chabal, Y. J.; Balkus Jr,
K. J., Manganese oxide nanorod–graphene/vanadium oxide nanowire–graphene binder-free paper
electrodes for metal oxide hybrid supercapacitors. Nano Energy 2013, 2 (5), 966-975.
13. Wang, B.; Wu, X. L.; Shu, C. Y.; Guo, Y. G.; Wang, C. R., Synthesis of CuO/graphene
nanocomposite as a high-performance anode material for lithium-ion batteries. Journal of
Materials Chemistry 2010, 20 (47), 10661-10664.
14. Xiao, X.; Ding, T.; Yuan, L.; Shen, Y.; Zhong, Q.; Zhang, X.; Cao, Y.; Hu, B.; Zhai, T.; Gong,
L.; Chen, J.; Tong, Y.; Zhou, J.; Wang, Z. L., WO3−x/MoO3−x Core/Shell Nanowires on Carbon
Fabric as an Anode for All-Solid-State Asymmetric Supercapacitors. Advanced Energy Materials
2012, 2 (11), 1328-1332.

55
15. Perera, S. D.; Liyanage, A. D.; Nijem, N.; Ferraris, J. P.; Chabal, Y. J.; Balkus Jr, K. J.,
Vanadium oxide nanowire – Graphene binder free nanocomposite paper electrodes for
supercapacitors: A facile green approach. Journal of Power Sources 2013, 230 (0), 130-137.
16. Perera, S. D.; Patel, B.; Bonso, J.; Grunewald, M.; Ferraris, J. P.; Balkus, K. J., Vanadium
Oxide Nanotube Spherical Clusters Prepared on Carbon Fabrics for Energy Storage Applications.
ACS Applied Materials & Interfaces 2011, 3 (11), 4512-4517.
17. Wang, Q.; Jiao, L.; Du, H.; Wang, Y.; Yuan, H., Fe3O4 nanoparticles grown on graphene as
advanced electrode materials for supercapacitors. Journal of Power Sources 2014, 245, 101-106.
18. Yang, F.; Zhang, L.; Zuzuarregui, A.; Gregorczyk, K.; Li, L.; Beltrán, M.; Tollan, C.; Brede,
J.; Rogero, C.; Chuvilin, A.; Knez, M., Functionalization of Defect Sites in Graphene with RuO2
for High Capacitive Performance. ACS Applied Materials & Interfaces 2015, 7 (37), 20513-20519.
19. Xiao-feng, W.; Zheng, Y.; Dian-bo, R., Hydrous Ruthenium Oxide with High Rate Pseudo-
Capacitance Prepared by a New Sol-Gel Process. Chinese Journal of Chemical Physics 2006, 19
(4), 341.
20. Lee, B. J.; Sivakkumar, S. R.; Ko, J. M.; Kim, J. H.; Jo, S. M.; Kim, D. Y., Carbon
nanofibre/hydrous RuO2 nanocomposite electrodes for supercapacitors. Journal of Power Sources
2007, 168 (2), 546-552.
21. Brousse, T.; Toupin, M.; Dugas, R.; Athouël, L.; Crosnier, O.; Bélanger, D., Crystalline MnO2
as Possible Alternatives to Amorphous Compounds in Electrochemical Supercapacitors. Journal
of The Electrochemical Society 2006, 153 (12), A2171-A2180.
22. Pusawale, S. N.; Deshmukh, P. R.; Gunjakar, J. L.; Lokhande, C. D., SnO2–RuO2 composite
films by chemical deposition for supercapacitor application. Materials Chemistry and Physics
2013, 139 (2–3), 416-422.
23. Shen, B.; Zhang, X.; Guo, R.; Lang, J.; Chen, J.; Yan, X., Carbon encapsulated RuO2 nano-
dots anchoring on graphene as an electrode for asymmetric supercapacitors with ultralong cycle
life in an ionic liquid electrolyte. Journal of Materials Chemistry A 2016, 4 (21), 8180-8189.
24. Leng, X.; Zou, J.; Xiong, X.; He, H., Hydrothermal synthesis and pseudo capacitance behavior
of a highly homogeneous dispersed graphene sheets/ruthenium oxide nanocomposite. RSC
Advances 2014, 4 (106), 61596-61603.
25. Jiang, H.; Lee, P. S.; Li, C., 3D carbon based nanostructures for advanced supercapacitors.
Energy & Environmental Science 2013, 6 (1), 41-53.
26. Yu, Z.; Tetard, L.; Zhai, L.; Thomas, J., Supercapacitor electrode materials: nanostructures
from 0 to 3 dimensions. Energy & Environmental Science 2015, 8 (3), 702-730.

56
27. Xia, H.; Meng, Y. S.; Yuan, G.; Cui, C.; Lu, L., A Symmetric RuO2/RuO2 Supercapacitor
Operating at 1.6 V by Using a Neutral Aqueous Electrolyte. Electrochemical and Solid-State
Letters 2012, 15 (4), A60-A63.
28. Jang, J. H.; Kato, A.; Machida, K.; Naoi, K., Supercapacitor Performance of Hydrous
Ruthenium Oxide Electrodes Prepared by Electrophoretic Deposition. Journal of The
Electrochemical Society 2006, 153 (2), A321-A328.
29. Perera, S. D.; Liyanage, A. D.; Nijem, N.; Ferraris, J. P.; Chabal, Y. J.; Balkus Jr, K. J.,
Vanadium oxide nanowire – Graphene binder free nanocomposite paper electrodes for
supercapacitors: A facile green approach. Journal of Power Sources 2013, 230, 130-137.
30. Ratanatawanate, C.; Xiong, C.; Balkus, K. J., Fabrication of PbS Quantum Dot Doped TiO2
Nanotubes. ACS Nano 2008, 2 (8), 1682-1688.
31. Wee, G.; Soh, H. Z.; Cheah, Y. L.; Mhaisalkar, S. G.; Srinivasan, M., Synthesis and
electrochemical properties of electrospun V2O5 nanofibers as supercapacitor electrodes. Journal
of Materials Chemistry 2010, 20 (32), 6720-6725.
32. Xiong, C.; Aliev, A. E.; Gnade, B.; Balkus, K. J., Fabrication of Silver Vanadium Oxide and
V2O5 Nanowires for Electrochromics. ACS Nano 2008, 2 (2), 293-301.
33. Liu, A.; Ichihara, M.; Honma, I.; Zhou, H., Vanadium-oxide nanotubes: Synthesis and
template-related electrochemical properties. Electrochemistry Communications 2007, 9 (7), 1766-
1771.
34. Grigor’eva, A. V.; Anikina, A. V.; Tarasov, A. B.; Gudilin, E. A.; Knot’ko, A. V.; Volkov, V.
V.; Dembo, K. A.; Tret’yakov, Y. D., Micromorphology and structure of vanadium oxide
nanotubes. Doklady Chemistry 2006, 410 (2), 165-169.
35. Foelske, A.; Barbieri, O.; Hahn, M.; Kötz, R., An X-Ray Photoelectron Spectroscopy Study of
Hydrous Ruthenium Oxide Powders with Various Water Contents for Supercapacitors.
Electrochemical and Solid-State Letters 2006, 9 (6), A268-A272.
36. Morgan, D. J., Resolving ruthenium: XPS studies of common ruthenium materials. Surface
and Interface Analysis 2015, 47 (11), 1072-1079.
37. Kim, Y. J.; Gao, Y.; Chambers, S. A., Core-level X-ray photoelectron spectra and X-ray
photoelectron diffraction of RuO2(110) grown by molecular beam epitaxy on TiO2(110). Applied
Surface Science 1997, 120 (3), 250-260.
38. Egashira, M.; Asai, T.; Yoshimoto, N.; Morita, M., Ionic conductivity of ternary electrolyte
containing sodium salt and ionic liquid. Electrochimica Acta 2011, 58, 95-98.

57
39. Rochefort, D.; Pont, A. L., Pseudocapacitive behaviour of RuO2 in a proton exchange ionic
liquid. Electrochemistry Communications 2006, 8 (9), 1539-1543.
40. Murawski, L.; Gledel, C.; Sanchez, C.; Livage, J.; Audières, J. P., Electrical conductivity of
V2O5 and LixV2O5 amorphous thin films. Journal of Non-Crystalline Solids 1987, 89 (1), 98-106.
41. Coustier, F.; Hill, J.; Owens, B. B.; Passerini, S.; Smyrl, W. H., Doped Vanadium Oxides as
Host Materials for Lithium Intercalation. Journal of The Electrochemical Society 1999, 146 (4),
1355-1360.
42. Saravanakumar, B.; Purushothaman, K. K.; Muralidharan, G., V2O5/functionalized MWCNT
hybrid nanocomposite: the fabrication and its enhanced supercapacitive performance. RSC
Advances 2014, 4 (70), 37437-37445.
43. Bonso, J. S.; Rahy, A.; Perera, S. D.; Nour, N.; Seitz, O.; Chabal, Y. J.; Balkus Jr, K. J.;
Ferraris, J. P.; Yang, D. J., Exfoliated graphite nanoplatelets–V2O5 nanotube composite electrodes
for supercapacitors. Journal of Power Sources 2012, 203, 227-232.
44. Coleman, G. N.; Gesler, J. W.; Shirley, F. A.; Kuempel, J. R., Rates of acid hydrolysis and
stabilities of ruthenium(II) pentaammine chloride and bromide complex ions. Inorganic Chemistry
1973, 12 (5), 1036-1038.
45. Guan, C.; Xia, X.; Meng, N.; Zeng, Z.; Cao, X.; Soci, C.; Zhang, H.; Fan, H. J., Hollow core-
shell nanostructure supercapacitor electrodes: gap matters. Energy & Environmental Science 2012,
5 (10), 9085-9090.

58
CHAPTER 4
BINDER FREE GRAPHENE–SODIUM NIOBATE NANOTUBE/ NANO-ROD
COMPOSITE ELECTRODES FOR SUPERCAPACITORS
4.1 Introduction
Energy consumption continually increases as the world population increases, resulting in greater
demands for energy to support human existence. Therefore, renewable energy and energy storage
devices such as supercapacitors have grown in interest. A supercapacitor can store one million
times more energy than a regular capacitor and exhibits higher energy density, power density and
good cycling ability.1-3 Electrochemical double-layer capacitors (EDLCs) are can be explain as
combination of two capacitors connected in series with a conducting electrolyte medium. The
capacitance of these devices is generated from storing of charges at the high surface area electrode
and electrolyte interface, creating a double layer. In pseudocapacitors, charges are generated by
undergoing redox reaction, which are then stored in the surface of the electrode material.
Pseudocapacitors show higher charge densities but slower charge transfer kinetics compared to
EDLCs due to the charges are stored at the interface and can readily accessible. Many EDLC
electrodes are based on high surface area carbon materials such as carbon nanotubes, activated
carbon and graphene sheets due to their long cycling stability, good processing ability, high surface
area and low electrical resistivity.4 The irreversible adsorption of solvated ions can dilute the ion
density on the carbon and limit the available active surface area. These ions help to catalyze the
degradation of the electrode under high electric field yielding low surface area and tend to
collapsed structures.5 These limitations can be overcome with a hybrid system. Stable redox
(pseudocapacitance) and double layer capacitance can be combined to increase the power and

59
energy densities. Metal oxides such as Fe3O4, CuO, MnO2, and V2O5 have been used extensively
to replace expensive pseudocapacitive materials 6-10. Metal oxides such as MnO2 9, V2O5
11, SnO2
12 with reduced graphene oxide composites have been used for hybrid supercapacitors. Perera et
al. have studied vanadium oxide nanowire–carbon nanotube binder-free flexible electrodes for
supercapacitors and obtained 57.3 F g-1 capacitance, 65.9 Wh kg-1 and 8.32 Kw Kg-1.13-15 Niobium
and vanadium elements are in the same periodic group and show similar oxidation states. It is
possible to have pseudocapacitive properties for these compounds.13 Gum-Jae Park et al. reported
the preparation of a novel hybrid supercapacitor using a graphite cathode and a niobium (V) oxide
anode 16. The purpose of this study is to explore other possible pseudocapacitive electrode
materials such as sodium niobate. Alkaline metal niobates are excellent ferroelectric, piezoelectric,
electro-optic, nonlinear optical, photorefractive, photocatalytic and ion conductive materials 17. In
particular sodium niobate (NaNbO3) has generated interest for its use as lead free piezoelectric,
photocatalytic, dielectric and antiferroelectric materials. There are very few studies reported using
NaNbO3 as an electrode material for energy storage devices 18.
Morphology control has gained considerable attention in the synthesis of micro and nanostructures
when physical and chemical properties strongly depend on morphology 17. In this study NaNbO3
nanotubes were prepared for the first time. This synthesis involves the use of Pluronic P123 as a
soft template. At room temperature NaNbO3 forms orthorhombic crystals with antiferroelectric
properties 19. There is evidence that this structure is tolerant to ionic substitution, such as
replacement of Na+ by Li+, Mg+2, Mn+2 in solid solutions. Several synthesis routes have been
developed to prepare alkali-metal niobates including combustion, non-hydrolytic solution
reactions and hydrothermal processes 20. Herein, we report a hydrothermal synthesis route to

60
prepare NaNbO3 nanorod - graphene oxide composites and NaNbO3 nanotube – graphene oxide
composites as well as the first example of NaNbO3 nanotubes mediated by graphene. Various
synthesis methods to obtain different morphologies of NaNbO3 have been reported. For example,
Liu et al. reported the synthesis of NaNbO3 nanowires using a temperature induced solid phase
oriented rearrangement route 21. Li et al. reported the effects of crystal structure and electronic
structure on photocatalytic H2 evolution and CO2 reduction over two phases of NaNbO3 22. For
supercapacitors high surface area is very important. 13, 23-24. High surface area redox active material
will enhance energy density and power density of the supercapacitors. High surface area carbon
materials have been extensively investigated and commercialized as an EDLC material due to their
long cycling stability, good processing ability, high surface area and high electrical conductivity
13, 25-26. However, there are limitations to have higher energy and power density of carbon based
electric double layer capacitors. This limitation can be overcome by combining the high surface
area carbon with a redox active material. During the fast faradic reduction, multi-electron transfer
can be achieved between the electrodes. In recent years, graphene has gain more attention as an
electrode material, in part because of its high theoretical surface area (2630 m2g-1), excellent
electron mobility (250,000 cm2 Vs-1) and good mechanical strength (1 TPa) 23. Vivekch et al.
reported the electrochemical performance of chemically reduced graphene as an electrode material
for supercapacitors. In this paper, a novel method for the preparation of NaNbO3 nanotubes on
hGO and nanorods mixed with hGO is reported for the first time.

61
4.2 Experimental
4.3 Material and methods
All reagents were used without any further purification. Nb metal powder was purchased from
Sigma-Aldrich. Pluronic P123 surfactant was purchased from BASF Corporation. Graphite was
obtained from Sigma-Aldrich. Lithium bis(trifluoromethanesulfonamide) (LiTFSI) was purchased
from TCI America. A Teflon film (Gore Company) was used as the separator between anode and
cathode electrodes. A typical coin cell package (CR2032) was used to assemble all coin cell type
supercapacitors.
4.4 Synthesis of graphene oxide (GO)
GO was synthesized using previously reported modified Hummer’s method 27. First 0.5 g of
graphite and 0.5 g of NaNO3 were dispersed in 23 mL of 1 M H2SO4 and stirred in an ice bath for
15 min. Then, 4.0 g of KMnO4 was slowly mixed in an ice bath to obtain a dark-green mixture.
The resulting suspension was transferred in to a 40 oC water bath and stirred for 90 min. The
resulting dark brown colored solid was diluted by the of 50 mL of deionized (DI) water and allowed
to stir for a further 10 min. Then, 6 mL of H2O2 (30%) were slowly added to the mixture to produce
a golden brown sol. The product was centrifuged and washed with warm DI water repeatedly to
adjust the pH to 6. Finally, the product was dried at 80 oC for 24 h under vacuum.

62
4.5 Synthesis of hydrothermally reduced graphene oxide (hGO)
First, 50 mg of GO were sonicated in 50 mL of DI water for 1 h to have uniform dispersions of
GO 27. Then 10.5 g of NaOH were added and the mixture was transferred in to a Teflon-lined
autoclave and heated at 120 oC for 24 h. The resulting black colored solid was neutralized using
0.1 M HCl solution. The resulting product was washed with DI water five times and dispersed in
DI water. Finally, the hGO dispersion was suction filtered using nylon filter paper (Varian
Chromatography System Nylon 66, 0.45 mm pore size and 47 mm in diameter) to obtain flexible
paper electrodes.
4.6 Synthesis of sodium niobate nanotubes on hydrothermally reduced graphene oxide
(hGO)
First, 40 mL of hGO and 0.3 g of P123 surfactant were mixed in 10 mL of ethanol. The solution
was stirred for 15 min. Then, 0.1 g of niobium metal powder was added, followed by 8 g of sodium
hydroxide pellets to make a 10 M solution. The solution was stirred for 30 min and transferred to
a Teflon lined autoclave and heated 180 oC for 100 min. The above procedure was repeated using
0.25 g and 0.5 g of Nb metal powder. The resulting solutions were filtered using nylon filter paper
in order to make flexible electrodes and then these electrodes were washed several times with DI
water to remove any surfactant. These electrodes were used to prepare coin cell type
supercapacitors. To understand the mechanism of formation of graphene mediated NaNbO3
nanotubes, the reaction time was varied (Table 4-S.1) and samples were characterized using SEM
and TEM.

63
4.7 Synthesis of NaNbO3 nanorods/hGO composite
First, 0.3 g of P123 surfactant were mixed in 10 mL of ethanol and stirred for 15 min at room
temperature. Then, three different 10 M solutions were made using, 0.1 g, 0.25 g, and 0.5 g of
niobium metal powder with 8 g of sodium hydroxide pellets. The solutions were stirred for 30 min
at room temperature and transferred to a Teflon lined autoclave and heated for 180 oC at 100 min.
The resulting solutions were centrifuged and air dried for one day to prepare the NaNbO3 nanorods.
Then 0.1 g, 0.25 g, and 0.5 g of NaNbO3 nanorods were dispersed separately in 40 ml of hGO
solution using probe sonication followed by the bath sonication for 30 min in order to make
homogeneous mixture. Well dispersed solution then filtered using a nylon filter paper in order to
make flexible homogenous electrodes for supercapacitors. The electrode were washed with DI
water several times to remove any residual surfactant.
4.8 Fabrication of coin cell type supercapacitors
Coin cells were fabricated according to the previously reported method using CR2032 packaging
11. Composite electrode and carbon nanotube electrode were used to make coin cells as the anode
and the cathode in order to make asymmetrical coin cells. The masses of the cathode (carbon
nanotube electrode) remained constant and the masses of the anode electrodes were changed and
reported in the supplementary material (table 4-S.2). 1 M LiTFSI (Lithium bis(tri-
fluoromethanesulfonimide)) in acetonitrile, was added to each electrode and sealed in coin cell
using a coin cell crimper by pressing at 1000 PSIG.

64
4.9 Characterization
Powder X-ray diffraction (PXRD) patterns were obtained using a Rigaku Ultima IV diffractometer
(Cu Kα radiation). Raman spectra were collected using a JY Horiba HR-800 spectrophotometer.
Transmission electron microscope (TEM) images were taken using a JEOL JEM-2100 TEM at 200
kV (JEOL Co Ltd), Scanning electron microscope (SEM) images were acquired using Leo 1530
VP field emission electron microscope. Cyclic voltammograms (CV) and galvanostatic
charge/discharge curves (CDC) were obtained using a Arbin battery testing system (BT2000) with
a 2.0 V (for LiTFSI) potential window. Three electrode cyclic voltammograms were obtained by
potentiostat/Galvanostat (model 273A). X-ray Photoelectron Spectroscopy (XPS) measurements
were performed ex situ, using a Perkin Elmer PHI System. Electrochemical impedance
spectroscopy (EIS) measurements were obtain on EG&G Princeton Applied Research
potentiostat/galvanostat (model 273A). The energy and power densities for composite electrodes
were calculated according to the equations in the supplementary section.
4.10 Results and discussion
4.11 Characterization of hGO and NaNbO3 nanorods
The morphology of NaNbO3 nanorods were observed by SEM and TEM. Figure1 a) and b) shows
the SEM images of nanorods. NaNbO3 nanorods are 150 nm in length and diameter is about 50
nm. Figure 1 c) and d) shows the low and high magnification HR-TEM images. According to the
TEM images, NaNbO3 nanorods are about 50 nm in diameter, and the calculated d-spacing of 0.388
nm correspond to the plane (111). Graphene oxide was synthesized from graphite flakes using a

65
modified Hummer’s method 27. Figure1e shows the Raman spectra of graphite, graphene oxide
and hydrothermally reduced graphene oxide which exhibit characteristic D and G bands at 1300
cm-1 and 1600 cm-1 respectively 11. The G band generated from in-plane vibrations of sp2 carbons
in graphitic domains. The D band is originate due to the edges, defects and structurally disordered
carbons found in the graphene sheets. The low intensity of the D band shows a low degree of
defects. Compared to graphite, the intensity of the D band in GO and hGO is remarkably increased
after the chemical treatment due to the intrction of different types of structural defects. Disorder
and defects in graphite lead to broad D and G bands, as well as an increased intensity of the D
band 28. The intensity ratio of D band to G band (ID/IG) indicates the degree of defects presence in
graphene materials. Table 4-S.3 in the supplementary section summarizes the Raman data for GO,
hGO, graphite and NaNbO3 Nt-hGO composite. Reduced GO shows an increased ID/IG ratio
relative to the reduced graphene oxide (hGO), suggesting a decrease the size of the average sp2
domains due to the introduction of oxygen functional groups.29-30 The ID/IG ratio for NaNbO3 Nt-
hGO composite is lower than that of GO and hGO, indicating the hydrothermally prepared
composite has more sp2 domains 31. The ID/IG ratio for hGO is 0.97 and for the composite it is
0.86. During the composite preparation, hGO was reduced and it will should increase the
conductivity of the composite. The domain size of the graphite microcrystals (La) were calculated

66
according to the equation, La = 44/R, where R is ID/IG ratio 32. As reported in the Table S.3, graphite
has the highest domain size due to the uninterrupted graphite structure.
Figure 4-1 a), b) SEM c), d) TEM image of NaNbO3 nanorods e) Raman spectra for GO, hGO,
graphite and NaNbO3 Nt-hGO (Nb-1)
The oxidation of graphite introduces oxygen functional groups and disrupt the large continuous
Sp2 domains in to smaller domains (∼4 nm). The domain size for hGO, ∼4.5 nm, that is larger
than that of GO (∼4 nm) and smaller than the NaNbO3 Nt-hGO composite (~5.7 nm). This suggests
that, after the alkaline hydrothermal treatment and composite preparation, the size of the
undisrupted sp2 domains of GO increased dramatically 33The crystal structure of NaNbO3 (lushite)
is show in Figure 4-1 a) and Figure 4-1 b) viewed along the (111) and (100) directions. Like other
ABO3 perovskites, NaNbO3 is comprised of a three dimensional framework of corner sharing BO6

67
groups occupying octahedral with sodium cations in its cavities. In Figure 4-1 a), the octahedra
represent NbO6 units and the spheres represent sodium ions.34-35
Figure 4-2 Crystal structure of NaNbO3 in a) (111) b) (100) direction, calculated using crystal
maker and the crystallographic data in ref 36 c) digital image of flexible paper electrode (Nb-2)
XRD pattern for d) NaNbO3 nanorods e) as synthesized hGO-NaNbO3 nanotube composite (Nb-
2) f) simulated XRD pattern JCPDS 33-1270
It has been shown that this structure is tolerant to ionic substitution in the literature. Na+ can be
replaced by other cations such as Li+, Mg2+ and Mn2+ for charge compensation 37. Therefore, it is
possible to exchange Na+ ions in the crystal structure, especially, when using a Li+ ion based
electrolyte, resulting in the exchange of Li+ ions and Na+ ions 38. As shown in Figure 4-2 c. all the
composite electrode materials were flexible. These composite electrodes are promising electrodes
for flexible supercapacitors applications. As synthesized NaNbO3 nanorods were further

68
characterized using XRD. The X-ray diffraction pattern of the NaNbO3 nanorods is shown in the
Figure 4-2 d. The characteristic peaks corresponding to the NaNbO3 polymorph of lueshite,
matches well with the experimental pattern (JCPDS card 33-1270) 39.
4.12 Characterization of NaNbO3 nanotube/hGO composites
Perera et al. reported growing vanadium oxide nanowires on graphene sheets. Therefore, it was
reasoned that it may be possible to grow NaNbO3 nanorods on hGO sheets. The X-ray diffraction
(XRD) pattern of the hGO-NaNbO3 nanotube composite is shown in Figure 4-2 e. According to
the XRD pattern and the simulated pattern (JCPDS 33-1270), it is clear that the synthesized
NaNbO3 nanotubes have the same lushite structure as the nanorods phase.
Figure 4-3 SEM images at a) low and b) high magnification, TEM image of c) low and d) high
magnification of Nb-2 composite electrode
Figure 4-3a and Figure 4-3b show the SEM images of the hGO-NT composite electrode at different
magnifications and it can be seen NaNbO3 nanotubes were grown on graphene sheets and several
micrometers long. Transition electron microscopy (TEM) was used to investigate morphology and

69
the d-spacing. Figure 4-3.c shows TEM images of (Nb-2 composite) nanotubes. The outer diameter
of the nanotube is around 30 nm and the inner diameter of the nanotube is around 10 nm and the
observed length is about 3 µm. Figure 4-3.d shows a TEM image of nanotube at higher
magnification revealing the crystal lattice planes. The calculated d-spacing is 0.390 nm which
corresponds to the 111 plane. The surface oxygens on hydrothermally reduced graphene oxide
serves as a nucleation site for the growth of the nanotubes on the hGO plates. When the same
procedure was followed without graphene, the NaNbO3 nanorods were made.
4.13 Proposed mechanism for NaNbO3 nanorod formation.
A possible mechanism for the formation of sodium niobate nanotubes and nanorods is based on
results obtained from time-variable experiments and the reported literature. Triblock copolymers
(P123) have been used extensively to prepare different rod like nanostructures such as PbS
nanorods,40 hydroxyapatite nanorods,41 lanthanide phosphates single-crystalline
nanowires/nanorods,42 Al2O3 nanorods, NdVO4 nanorods, GdVO4 nanorods43 and SBA-15
nanorods 44. In these experiments, all the variables (reaction concentrations, temperature and
volumes) were kept constant except time. Nga et. al have reported the formation mechanism of
surfactant-assisted size controlled hydroxyapatite nanorods for bone tissue engineering, which is
similar to the formation of sodium niobate nanotubes/ nanorods 41. Bu et al. have also reported the
surfactant assisted synthesis of lanthanide phosphates and the synthesis of single-crystal PbS
nanorods via a simple hydrothermal process using a PEO-PPO-PEO (P123) triblock copolymer as
a structure directing 40, 42. The poly(ethylene oxide)−poly(propylene oxide)−poly(ethylene oxide)

70
(PEOm−PPOn−PEOm), surfactant normally form core−shell like micelles in aqueous medium
above the critical micelle concentration (CMC) or critical micelle temperature (CMT) 45-46. At
higher surfactant concentrations, block copolymers can also self-assemble into lyotropic liquid
crystals 45, 47. Self-aggregation of the PPO block helps to form a hydrophobic core with surrounded
by hydrophilic tail and hydrated PEO blocks 48-49. At low pluronic concentrations and above the
CMC, spherical micelles form or worm micelles as the temperature increases 48. The triblock
copolymer gel is bound together by reversible attachments between coronae of neighboring
micelles, due to the absence of covalent cross-linking between the micelles 50. The PEO and PPO
blocks are hydrophilic at low temperatures allowing them to form and disperse, yielding water
soluble transparent solutions 51. Here, the triblock copolymers remain as unimers surrounded by
water molecules.
Above CMC or CMT the molecular aggregation of hydrophobic PPO blocks in the solution leads
to the form micelles 52-54. These micelles exhibit a shape transition from spherical to rod-like or
worm-like micelles at elevated temperatures 55-57. The process of self-aggregation can therefore be
induced by increasing the concentration of triblock-polymer above the CMC 48, 58-65. Micelle
formation in triblock-polymers changes due to the following reasons. There is a broad temperature
range above the CMT that can coexist micelles in a solution with unimers 36, 51, 57, 66-71. A higher
temperature is needed to form micelles because the effective PEO-PEO, PPO-PPO, and PEO-PPO
interactions are highly temperature dependent. Above a certain temperature, the effective PPO-
PPO attraction will be higher than the PEO-PEO repulsion, and it will help to form micelles.
Micelle formation is a highly temperature-dependent entropy-driven process. The gradual growth
of the hydrophobic core with the increasing temperature is due to the increasing dehydration

71
process of PEO blocks. In the corona introduced instability in the spherical micellar dispersion,
that will leads to the formation of rod-like structures. Another parameter that affects micelle
formation in water is the cloud point (CP).71-72 At temperatures well above the CMT, the polymer
solution becomes opaque because phase separation occurs between the polymer and water. The CP
phenomenon in the triblock-polymer is related to the core and corona model of the triblock-
polymer aggregates. The presence of ether-oxygen species in both the PPO and PEO units allows
considerable amount of water molecules to be in the core.
Figure 4-4 Schematic diagram for the formation mechanism of NaNbO3 nanorods
Even at optimum temperatures, an increase in the temperature dehydrates the triblock-polymer
micelles by expelling water molecules, which are weakly associated with the ether-oxygen species
through electrostatic interactions. 73-74. The cloud point for the P123 is 90 oC and this temperature
is well below the synthesis temperature of 180 oC. Therefore, there is a tendency to move hydrated
PPO blocks to the corona and dehydrated PEO into the core. A graphical representation of the

72
formation mechanism of nanorods is shown in Figure 4-4. It is well studied that the tri block co-
polymer PEO20-PPO70-PEO20 (P123) surfactant molecules spontaneously organize into rod-shaped
micelles when their concentrations reach a critical values as shown in step 1 in Figure 4-4 40-41, 67,
75. These anisotropic structures can be used as soft templates to form 1D nanostructures. Since,
these are soft templates it can easily distort, there is a tendency to form non symmetrical
nanostructures. Na+ ions complexes with the hydrophilic functional groups in P123 as shown in
step 2 in Figure 4-4. When the Nb metal powder is added to the highly basic solution, it reacts with
NaOH to form Nb2O5 76. The Nb2O5 reacts further with OH- at high temperature and pressure to
form Nb6O19−8 at high temperature and pressure 75, 77. Then Nb6O19
−8 react with Na+ ions complexed
with P123 to form NaNbO3 77. Finally, when the surfactant molecules are removed, crystalline 1D
nanorods are obtained 75. Balanced chemical equations are provided in the supplementary section.
4.14 Proposed mechanism for NaNbO3 nanotube formation.
It is known that, at high pH values, hydrothermally reduced graphene oxide is hydrophilic 49.
Accordingly, the surface of the graphene remains hydrophilic after reduction of graphene oxide,
while the electrical conductivity of graphene is partially restored. Zeta potential of hydrothermally
reduced graphene oxide is around -60 mV, which is below the zeta potential at low pH 78. When
the pH was increased, the negative zeta potential increased. Higher pH values result in increased
edge charges and therefore increased hydrophilicity of the sheet. Consequently, hGO in high pH
media is hydrophilic. The XPS data of hGO show the presence of C-C, C-O and C=O, which is
consistent with the presence of surface COO- groups that contribute to the hydrophilic nature of

73
hGO.79 When the surface environment is hydrophilic, it is possible to direct hydrophilic head group
in P123 towards the hGO sheets and the hydrophobic tail group towards inside so as to form
reverse micelles. Figure 4-5 shows a schematic diagram of nanotube formation. Similarly, Na+
ions complexes with the hydrophilic functional groups in P123. Under basic conditions the Nb
metal particles react with NaOH to form ultimately NaNbO3 on the outside of the micelle (vide
supra). Finally, when surfactant molecules are removed, single-crystalline 1D nanotubes are
obtained. The proposed mechanism is supported by the TEM images (Figure 4-S.1 in the
supplementary section) taken at different time intervals.
Figure 4-5 Schematic diagram of formation mechanism of NaNbO3 nanotube with the presence
of hGO
4.15 Electrode preparation
Electrodes were prepared with either, different amounts of pre-prepared nanorods mixed with fixed
amounts of hGO or different amounts of Nb metal powder were used to grow nanotubes on hGO
sheets. Electrodes were prepared according to the table 4-1. Both types of electrodes were
characterized using cyclic voltammetry with 1M LiTFSI in acetonitrile as an electrolyte. Different
amount of Nb metal powder were used to prepare different electrodes (Nb-2, Nb-4, Nb-6), as

74
summarized in table 4-2. In this case the nanotubes were grown on hGO sheets. But NaNbO3
nanorods were mixed with hGO to prepare electrodes (Nb-1, Nb-3, Nb-5).
Table 4-1 Summarized parameters for electrode preparat
To investigate the electrochemical behavior of all the electrodes, cyclic voltammograms were
performed at 25 mV s-1 scan rates in the potential window of 3 V, using LiTFSI in acetonitrile as
the electrolyte. (Figure 4-6). When increasing the amount of NaNbO3 nanotubes or nanorods, the
electrode performance decreases. Composite electrodes generate higher current densities in a large
voltage window than aqueous electrolytes. Interestingly, the area under the curves decreases when
the amount of NaNbO3 nanotubes or nanorods is increased due to a decrease in conductivity. When
compared with the hGO-CNT electrode, it is clear that the NaNbO3 nanotubes and nanorods
Sample Amount of Nb or NaNbO3 nanorods
Nb-1 0.1 g Nanorods + hGO
Nb-2 0.1 g Nb to grow NaNbO3 Nt on hGO
Nb-3 0.25 g Nanorods + hGO
Nb-4 0.25 g Nb to grow NaNbO3 Nt on hGO
Nb-5 0.5 g Nanorods + hGO
Nb-6 0.5 g Nb to grow NaNbO3 Nt on hGO
hGO-CNT Control

75
enhance the performance of the electrodes. Figure 4-6.c shows the cyclic voltammogram
comparison of all the composite electrode with hGO-CNT electrode.
Figure 4-6 Cyclic voltammograms of a) NaNbO3 nanotube/hGO composites b) NaNbO3
nanorods/hGO composite c) all the composite electrodes at 25 mV s-1 scanned rate.
During the charge cycle, partial reduction of Nb+5 to Nb+4 at -0.92 V occurs, as shown in the
equation 1. The potential window lies in between -1.0 V to 2.0 V. This shows that NaNbO3
nanotubes generate pseudocapacitance, while the hGO sheets effectively create conducting
pathways for the electrons. The hGO also helps to generate EDLC, which improves the overall
capacitance of the composite electrode.
NaNbO3 + xLi+ + xe− ↔ Lix+NaNb2−xNbx
+4O52− … … (1)
The charge-discharge behavior of hGO-NaNbO3 composite electrodes was characterized under
Galvano-static conditions (Figure 4-7.a, b). The galvanostatic charge-discharge curves were
collected at constant current density of 1 A g-1. Compared to the hGO-CNT electrodes, the
discharge time of the hGO-NaNbO3 nanotube (Nb-2) composite was significantly increased,
suggesting that the combination of NaNbO3 nanotubes and hGO offers a larger charge capacity,
which is consistent with the CV behavior (Figure 4-6).

76
Figure 4-7 a) Charge discharge profile for coin cell series at 1 A g-1 b) Cell voltage vs. discharge
time of sample Nb-2 in 1 M LiTFSI at different discharge current densities c) Charge–discharge
profile of Nb-2 supercapacitor in 1 M LiTFSI at 1.5 A g−1 for the 1st and 7000th cycle d)
capacitance retention of Nb-2 over 1000 charge/discharge cycles evaluated from the
galvanostatic discharge curves
Energy- power densities and specific capacitance were based on the total weight of the anode and
the cathode (Table 4-S.1). The discharge profile of the asymmetric cell (Nb-2) at different
discharge current densities is shown in Figure 4-7.b. The retention of the specific capacitance
against the cycle number is shown in Figure 4-7.d. After 600th cycle ~80% of the specific
capacitance was retained while after 1000th cycle ~70% of the capacitance was retained. Cycle test
were carried out up to 7000th cycles and ~45 % of the capacitance was retained as shown in the

77
Figure 4-S. 3. Should be noted that the coin cell were assembled in air and that absorbed water can
influence to the loss in capacitance with time. During the charge discharge process Li ions in the
medium can be diluted due to the Li ion intercalation. Unlike in Li ion batteries, where Li metal
foil act as a Li ion source. But in this study Li ion source is the LiTFSI.
In order to explain the cycling, the coin cells were dissembled after the electrochemical
characterizations and characterized using XRD and Raman spectroscopy. Figure 4-S 2 in the
supplementary materials shows the XRD pattern for the Nb-2 electrode before and after the
electrochemical characterization of Nb-2. The XRD pattern shifted towards higher 2-theta values.
This is evidence for exchange of the Na+ ions with Li+ ions causing contraction of the crystal
structure decreasing the d-spacing 4. Li+ ions are smaller than Na+ ion with ionic sizes 0.076 nm
and 0.102 nm, respectively 80. The Nb can have different oxidation states, with +5 and +4 being
the most common. Therefore, doping may also result in contraction of the lattice. In order to
confirm this phenomena, cyclic voltammogram (CV) for Nb-2 was performed in Na+ ion
containing electrolyte (1M Na2SO4). Different scan rates have different ion exchange rates.
Therefore, at each scan rate 100 cycles were cycled in five different scan rates (10, 25, 50, 75 and
100 mV s-1). All together 500 cycles were cycled at different scan rates. Then coin cell were
dissembled and XRD was taken. According to the Figure 4-.8, there is no peak shift in XRD
pattern. This implies there is no crystal contraction. Therefore, it can be confirm that when NaNbO3

78
nanorods/hGO composite (Nb-2) in LiTFSI electrolyte exchange Li+ ions in electrolyte with the
Na+ ions in the crystal.
Figure 4-8 Three electrode cyclic voltammogram of NaNbO3/hGO (Nb-2) composite electrode
and hGO with reference to Ag/Ag+ in 1M LITFSI in acetonitrile at 50 mV s-1
The electrochemical behavior of NaNbO3/hGO composite electrode was analyzed by cyclic
voltammetry in 1M LITFSI in acetonitrile at 50 mV s-1 with Pt counter electrode reference to
Ag/Ag+ in the potential range 2.0 to -2.0 V. Carbon paste electrodes were prepared by using
NaNbO3/hGO composite carefully pressed in to the electrode. Figure 4-8 NaNbO3/hGO composite
electrode voltammograms exhibit two pairs of peaks I and II situated respectively at Eeq(I) = - 0.92
V, Eeq(II) = 0.57 V 1M LITFSI in acetonitrile (Eeq = (Epa+ Epc)/2, where Epa is the potential value of
the anodic peak and Epc the potential value of the corresponding cathodic peak). Kosho et al. have
reported the redox couple related to Nb+4/Nb+5 is approximately -0.92 V which can be assigned to
peak (I) 81. Yuyan Shao et al. reported the reduction of graphene oxide surface which can be
assigned to peak (II) 82-84. Even after chemical reduction, surface functional groups still exists.
These functional groups can undergo oxidation and reduction during electrochemical

79
characterization. Elzbieta et al. reported the following possible reactions of electroactive functional
surface groups on hGO 85.
−C − OH ↔ C = O + H+ + 𝑒 – (2)
−COOH ↔ −COO + H+ + 𝑒− (3)
Thus the, two well defined couples I and II in these voltammograms can be attributed to the
Nb+4/Nb+5 and reduced graphene oxide (hGO) redox processes.81, 86 Electrochemical impedance
spectroscopy (EIS) measurements were performed to evaluate resistant components on both the
hGO and Nb-2 composite electrodes. The EIS measurements in Figure 4-S.4 indicate Nb-2
electrodes display ideal capacitive behavior with a semicircle at high-medium frequency and an
inclined line at low frequency, which corresponds to charge transfer and diffusion respectively and
explain in the supplementary section 87.
The Nb-1 (nanorods) in table 4-2 coin cell produced an energy density of 30 Wh kg-1 and power
density of 900 W kg-1 at 1 A g-1 discharge rates. The energy density and power density are higher
than the hGO-CNT electrodes. The Nb-2 coin cell showed an energy density of 44.86 Wh kg-1 and
931.76 W kg-1 at 1 A g-1 discharge rates. The specific capacitance of the supercapacitors (Csp) of
the electrode was calculated using the equation given in the supplementary section. The specific
capacitances of Nb-1 and Nb-2 are 232 F g-1 and 260 F g-1, respectively, which is consistent with
the CV and discharge profiles. Under the same conditions, the hGO-CNT electrode has a
capacitance of 120 F g-1, which is lower than Nb-1 and Nb-2 coin cells. Liu et. al have reported
the highest capacitance of 137 F g-1 with using lithium niobate nanoflakes in 1M H2SO4 aqueous
electrolyte 88. Ke et. al have used chemical vapor deposition to grow RuO2 on lithium niobate
substrate. Electrochemical performance have been conducted and capacitance were found to be

80
high as 569 F g-1 in 1M H2SO4 aqueous electrolyte 89. The morphology change from nanorods to
nanotubes enhances the performance of the coin cell. The energy density and power density of the
hGO-CNT electrodes were 17.6 Wh kg-1 and 900 W kg-1 respectively. With increasing
pseudocapacitance, the energy density was observed to increase, while the power density remained
somewhat constant, presumably because the electric double layer capacitance remains constant in
electrodes containing the NaNbO3 nanostructures. The surface areas of the hGO and NaNbO3-
hGO composite (Nb-2) were measured to be 46.7 m2 g-1 and of 128.8 m2 g-1 respectively. Isotherms
and pore size distribution diagrams are shown in the supplementary section Figure 4-S.5 and
correlate with the measured capacitance.
4.16 Conclusion
Graphene-mediated NaNbO3 nanotubes were prepared for the first time. The freestanding flexible
NaNbO3 nanotube/ nanorod-hGO nanocomposite papers were also prepared without using any
organic binders. Coin cell type supercapacitors were prepared using NaNbO3 nanotubes/nanorods
graphene composite electrodes as the anode and the free standing carbon nanotube (CNT)
electrode as the cathode to investigate the application of sodium niobate as a supercapacitor
material. XPS data show the partial reduction of Nb+5 to Nb+4, consistent with the pseudocapacitive
properties of the electrode and confirmed with the three electrode measurements. The Raman band
shifts also explain the enhancement of physical attraction between graphene and the
nanostructures. The nanocomposite electrode prepared from 0.25 g of Nb powder shows the
capacitance behavior with 260 F g-1, 931.76 W kg-1 of power density and 44.86 Wh kg-1 of energy

81
density. These values are higher than hGO-CNT electrode itself. In this study, we have
demonstrated the potential application of NaNbO3 as a supercapacitor electrode and new method
and concept to prepare NaNbO3 nanotubes. These flexible nanocomposite paper electrodes are
promising binder-free electrodes for application in the high-energy storage devices. Graphene-
mediated NaNbO3 nanotubes were prepared for the first time. The freestanding flexible NaNbO3
nanotube/ nanorod-hGO nanocomposite papers were also prepared without using any organic
binders. Coin cell type supercapacitors were prepared using NaNbO3 nanotubes/nanorods
graphene composite electrodes as the anode and the free standing carbon nanotube (CNT)
electrode as the cathode to investigate the application of sodium niobate as a supercapacitor
material. The nanocomposite electrode prepared from 0.25 g of Nb powder shows the capacitance
behavior with 260 F g-1, 931.76 W kg-1 of power density and 44.86 Wh kg-1 of energy density.
These values are higher than hGO-CNT electrode itself. In this study, we have demonstrated the
potential application of NaNbO3 as a supercapacitor electrode and new method and concept to
prepare NaNbO3 nanotubes. These flexible nanocomposite paper electrodes are promising binder-
free electrodes for application in the high-energy storage devices. Reported new strategy to prepare
NaNbO3 nanotubes and nanorods can be used for other application such as lead free piezoelectric
materials.
AUTHOR INFORMATION
Corresponding Author *E-mail: [email protected].
Acknowledgements:
We thank the Robert A Welch Foundation Grant No AT-1153 for support of this research.

82
4.17 References
1. M. Winter, R.J. Brodd, What Are Batteries, Fuel Cells, and Supercapacitors?, Chemical
Reviews, 104 (2004) 4245-4270.
2. G.A. Snook, P. Kao, A.S. Best, Conducting-polymer-based supercapacitor devices and
electrodes, Journal of Power Sources, 196 (2011) 1-12.
3. K. Lota, V. Khomenko, E. Frackowiak, Capacitance properties of poly(3,4-
ethylenedioxythiophene)/carbon nanotubes composites, Journal of Physics and Chemistry of
Solids, 65 (2004) 295-301.
4. X. Zhao, B.M. Sanchez, P.J. Dobson, P.S. Grant, The role of nanomaterials in redox-based
supercapacitors for next generation energy storage devices, Nanoscale, 3 (2011) 839-855.
5. Y. Gao, S. Chen, D. Cao, G. Wang, J. Yin, Electrochemical capacitance of Co3O4 nanowire
arrays supported on nickel foam, Journal of Power Sources, 195 (2010) 1757-1760.
6. Q. Wang, L. Jiao, H. Du, Y. Wang, H. Yuan, Fe3O4 nanoparticles grown on graphene as advanced
electrode materials for supercapacitors, Journal of Power Sources, 245 (2014) 101-106.
7. S.E. Moosavifard, M.F. El-Kady, M.S. Rahmanifar, R.B. Kaner, M.F. Mousavi, Designing 3D
Highly Ordered Nanoporous CuO Electrodes for High-Performance Asymmetric Supercapacitors,
ACS Applied Materials & Interfaces, 7 (2015) 4851-4860.
8. T. Brousse, M. Toupin, R. Dugas, L. Athouël, O. Crosnier, D. Bélanger, Crystalline MnO2 as
Possible Alternatives to Amorphous Compounds in Electrochemical Supercapacitors, Journal of
The Electrochemical Society, 153 (2006) A2171-A2180.
9. S.D. Perera, M. Rudolph, R.G. Mariano, N. Nijem, J.P. Ferraris, Y.J. Chabal, K.J. Balkus Jr,
Manganese oxide nanorod–graphene/vanadium oxide nanowire–graphene binder-free paper
electrodes for metal oxide hybrid supercapacitors, Nano Energy, 2 (2013) 966-975.
10. S.K. Shinde, D.P. Dubal, G.S. Ghodake, D.Y. Kim, V.J. Fulari, Morphological tuning of CuO
nanostructures by simple preparative parameters in SILAR method and their consequent effect on
supercapacitors, Nano-Structures & Nano-Objects, 6 (2016) 5-13.
11. S.M. Mirvakili, M.N. Mirvakili, P. Englezos, J.D.W. Madden, I.W. Hunter, High-Performance
Supercapacitors from Niobium Nanowire Yarns, ACS Applied Materials & Interfaces, 7 (2015)
13882-13888.

83
12. S.D. Perera, B. Patel, N. Nijem, K. Roodenko, O. Seitz, J.P. Ferraris, Y.J. Chabal, K.J. Balkus,
Vanadium Oxide Nanowire–Carbon Nanotube Binder‐Free Flexible Electrodes for
Supercapacitors, Advanced Energy Materials, 1 (2011) 936-945.
13. J. Zhu, J. He, Facile Synthesis of Graphene-Wrapped Honeycomb MnO2 Nanospheres and
Their Application in Supercapacitors, ACS Applied Materials & Interfaces, 4 (2012) 1770-1776.
14. G. J. Park, D. Kalpana, A.K. Thapa, H. Nakamura, Y.-S. Lee, M. Yoshio, A novel hybrid
supercapacitor using a graphite cathode and a niobium (V) oxide anode, Bull Korean Chem Soc,
30 (2009) 817-820.
15. K. Kanie, Y. Numamoto, S. Tsukamoto, H. Takahashi, H. Mizutani, A. Terabe, M. Nakaya, J.
Tani, A. Muramatsu, Hydrothermal synthesis of sodium and potassium niobates fine particles and
their application to lead-free piezoelectric material, Mater. Trans., 52 (2011) 2119-2125.
16. K. Konieczny, Pyroelectric and dielectric study of NaNbO3 single crystals, Mater. Sci. Eng.,
B, B60 (1999) 124-127.
17. H. Xu, Y. Su, M.L. Balmer, A. Navrotsky, A New Series of Oxygen-Deficient Perovskites in
the NaTixNb1-xO3-0.5x System: Synthesis, Crystal Chemistry, and Energetics, Chem. Mater., 15
(2003) 1872-1878.
18. L. Liu, B. Li, D. Yu, Y. Cui, X. Zhou, W. Ding, Temperature-induced solid-phase oriented
rearrangement route to the fabrication of NaNbO3 nanowires, Chem. Commun. (Cambridge, U.
K.), 46 (2010) 427-429.
19. P. Li, S. Ouyang, G. Xi, T. Kako, J. Ye, The Effects of Crystal Structure and Electronic Structure
on Photocatalytic H2 Evolution and CO2 Reduction over Two Phases of Perovskite-Structured
NaNbO3, J. Phys. Chem. C, 116 (2012) 7621-7628.
20. A.G. Pandolfo, A.F. Hollenkamp, Carbon properties and their role in supercapacitors, J. Power
Sources, 157 (2006) 11-27.
21. P. Simon, Y. Gogotsi, Materials for electrochemical capacitors, Nat Mater, 7 (2008) 845-854.
22. A.B. Fuertes, M. Sevilla, Hierarchical Microporous/Mesoporous Carbon Nanosheets for High-
Performance Supercapacitors, ACS Applied Materials & Interfaces, 7 (2015) 4344-4353.

84
23. Z. Peng, J. Lin, R. Ye, E.L.G. Samuel, J.M. Tour, Flexible and Stackable Laser-Induced
Graphene Supercapacitors, ACS Applied Materials & Interfaces, 7 (2015) 3414-3419.
24. W.S. Hummers, Jr., R.E. Offeman, Preparation of graphitic oxide, J. Am. Chem. Soc., 80
(1958) 1339.
25. S.D. Perera, A.D. Liyanage, N. Nijem, J.P. Ferraris, Y.J. Chabal, K.J. Balkus Jr, Vanadium
oxide nanowire–Graphene binder free nanocomposite paper electrodes for supercapacitors: A
facile green approach, Journal of Power Sources, 230 (2013) 130-137.
26. S. Dubin, S. Gilje, K. Wang, V.C. Tung, K. Cha, A.S. Hall, J. Farrar, R. Varshneya, Y. Yang,
R.B. Kaner, A One-Step, Solvothermal Reduction Method for Producing Reduced Graphene Oxide
Dispersions in Organic Solvents, ACS Nano, 4 (2010) 3845-3852.
27. T. Bhardwaj, A. Antic, B. Pavan, V. Barone, B.D. Fahlman, Enhanced Electrochemical Lithium
Storage by Graphene Nanoribbons, Journal of the American Chemical Society, 132 (2010) 12556-
12558.
28. B.Z. Jang, C. Liu, D. Neff, Z. Yu, M.C. Wang, W. Xiong, A. Zhamu, Graphene Surface-Enabled
Lithium Ion-Exchanging Cells: Next-Generation High-Power Energy Storage Devices, Nano
Letters, 11 (2011) 3785-3791.
29. S. Stankovich, D.A. Dikin, R.D. Piner, K.A. Kohlhaas, A. Kleinhammes, Y. Jia, Y. Wu, S.T.
Nguyen, R.S. Ruoff, Synthesis of graphene-based nanosheets via chemical reduction of exfoliated
graphite oxide, Carbon, 45 (2007) 1558-1565.
30. D.S. Knight, W.B. White, Characterization of diamond films by Raman spectroscopy, Journal
of Materials Research, 4 (1989) 385-393.
31. S.D. Perera, R.G. Mariano, N. Nijem, Y. Chabal, J.P. Ferraris, K.J. Balkus, Jr., Alkaline
deoxygenated graphene oxide for supercapacitor applications: An effective green alternative for
chemically reduced graphene, J. Power Sources, 215 (2012) 1-10.
32. A.W. Hewat, Neutron powder profile refinement of ferroelectric and antiferroelectric crystal
structures. Sodium niobate at 22.deg, Ferroelectrics, 7 (1974) 83-85.
33. A.C. Sakowski-Cowley, K. Lukaczewicz, H.D. Megaw, Structure of sodium niobate at room
temperature, and the problem of reliability in pseudosymmetric structures, Acta Crystallogr., Sect.
B, 25 (1969) 851-865.

85
34. Z. Zhou, B. Chu, Light-scattering study on the association behavior of triblock polymers of
ethylene oxide and propylene oxide in aqueous solution, Journal of Colloid and Interface Science,
126 (1988) 171-180.
35. L.A. Reznitchenko, N.V. Dergunova, G.A. Geguzina, O.N. Razumovskaya, L.A. Shilkina, L.S.
Ivanova, New binary systems of solid solutions based on NaNbO3, Ferroelectrics, 214 (1998) 241-
254.
36. G.A. Geguzina, L.A. Reznitchenko, N.V. Dergunova, Atomic substitution effects in binary
solid solution systems based upon NaNbO3, Ferroelectrics, 214 (1998) 261-271.
37. H.D. Megaw, Seven phases of sodium niobate, Ferroelectrics, 7 (1974) 87-89.
38. Z. Zhigang, G. Fengxia, C. Hongtao, B. Jinbo, C. Hui-Ming, A simple solution route to
controlled synthesis of ZnS submicrospheres, nanosheets and nanorods, Nanotechnology, 17
(2006) 4731.
39. F. Kleitz, S. Hei Choi, R. Ryoo, Cubic Ia3d large mesoporous silica: synthesis and replication
to platinum nanowires, carbon nanorods and carbon nanotubes, Chemical Communications,
(2003) 2136-2137.
40. K. Yan, G. Wu, C. Jarvis, J. Wen, A. Chen, Facile synthesis of porous microspheres composed
of TiO2 nanorods with high photocatalytic activity for hydrogen production, Applied Catalysis B:
Environmental, 148–149 (2014) 281-287.
41. X. Ji, K.T. Lee, M. Monjauze, L.F. Nazar, Strategic synthesis of SBA-15 nanorods, Chemical
Communications, (2008) 4288-4290.
42. R. Kalai Selvan, A. Gedanken, P. Anilkumar, G. Manikandan, C. Karunakaran, Synthesis and
Characterization of Rare Earth Orthovanadate (RVO4; R = La, Ce, Nd, Sm, Eu & Gd)
Nanorods/Nanocrystals/Nanospindles by a Facile Sonochemical Method and Their Catalytic
Properties, Journal of Cluster Science, 20 (2009) 291-305.
43. G. Mingyun, S. Jianhua, H. Min, X. Zheng, T. Feifei, Y. Gui, W. Xianwen, Z. Jianmin, J. Xiqun,
Synthesis and luminescence of CePO4 and CePO4 :Tb hollow and core–shell microspheres
composed of single-crystal nanorods, Nanotechnology, 18 (2007) 415602.
44. W. Cai, Y. Hu, J. Chen, G. Zhang, T. Xia, Synthesis of nanorod-like mesoporous [gamma]-
Al2O3 with enhanced affinity towards Congo red removal: Effects of anions and structure-directing
agents, CrystEngComm, 14 (2012) 972-977.

86
45. B. Junfu, N. Chageng, L. Jinxia, S. Lan, X. Zhaoxiong, W. Qi, L. Changjian, Synthesis of
single-crystal PbS nanorods via a simple hydrothermal process using PEO–PPO–PEO triblock
copolymer as a structure-directing agent, Nanotechnology, 22 (2011) 125602.
46. N.K. Nga, L.T. Giang, T.Q. Huy, P.H. Viet, C. Migliaresi, Surfactant-assisted size control of
hydroxyapatite nanorods for bone tissue engineering, Colloids Surf., B, 116 (2014) 666-673.
47. J. Bu, C. Nie, J. Liang, L. Sun, Z. Xie, Q. Wu, C. Lin, Synthesis of single-crystal PbS nanorods
via a simple hydrothermal process using PEO-PPO-PEO triblock copolymer as a structure-
directing agent, Nanotechnology, 22 (2011) 125602.
48. W. B. Bu, Z. L. Hua, L. X. Zhang, H. R. Chen, W. M. Huang, J. L. Shi, Surfactant-assisted
synthesis of lanthanide phosphates single-crystalline nanowires/nanorods, J. Mater. Res., 19
(2004) 2807-2811.
49. P. Alexandridis, L. Yang, Thermoreversible micelle and gel formation of a polyoxyalkylene
block copolymer in formamide, in, American Chemical Society, 1999, pp. COLL-183.
50. E.S. Lee, Y.T. Oh, Y.S. Youn, M. Nam, B. Park, J. Yun, J.H. Kim, H. T. Song, K.T. Oh, Binary
mixing of micelles using Pluronics for a nano-sized drug delivery system, Colloids and Surfaces
B: Biointerfaces, 82 (2011) 190-195.
51. P. Alexandridis, U. Olsson, B. Lindman, Structural Polymorphism of Amphiphilic
Copolymers: Six Lyotropic Liquid Crystalline and Two Solution Phases in a Poly(oxybutylene)-
b-poly(oxyethylene)−Water−Xylene System, Langmuir, 13 (1997) 23-34.
52. C. Wu, T. Liu, B. Chu, D.K. Schneider, V. Graziano, Characterization of the PEO−PPO−PEO
Triblock Copolymer and Its Application as a Separation Medium in Capillary Electrophoresis,
Macromolecules, 30 (1997) 4574-4583.
53. B. Chu, Structure and Dynamics of Block Copolymer Colloids, Langmuir, 11 (1995) 414-421.
54. N. Asim, S. Radiman, M.A. Yarmo, M.S. Banaye Golriz, Vanadium pentoxide: Synthesis and
characterization of nanorod and nanoparticle V2O5 using CTAB micelle solution, Microporous and
Mesoporous Materials, 120 (2009) 397-401.
55. V. Singh, P. Khullar, P. Dave, N. Kaur, Micelles, mixed micelles, and applications of
polyoxypropylene (PPO)-polyoxyethylene (PEO)-polyoxypropylene (PPO) triblock polymers, Int
J Ind Chem, 4 (2013) 1-18.

87
56. P. Alexandridis, U. Olsson, B. Lindman, Structural Polymorphism of Amphiphilic
Copolymers: Six Lyotropic Liquid Crystalline and Two Solution Phases in a Poly(oxybutylene)-
b-poly(oxyethylene)-Water-Xylene System, Langmuir, 13 (1997) 23-34.
57. G. Wanka, H. Hoffmann, W. Ulbricht, The aggregation behavior of poly-(oxyethylene)-poly-
(oxypropylene)-poly-(oxyethylene)-block-copolymers in aqueous solution, Colloid & Polymer
Sci, 268 (1990) 101-117.
58. G. Mao, S. Sukumaran, G. Beaucage, M.-L. Saboungi, P. Thiyagarajan, PEO−PPO−PEO Block
Copolymer Micelles in Aqueous Electrolyte Solutions: Effect of Carbonate Anions and
Temperature on the Micellar Structure and Interaction, Macromolecules, 34 (2000) 552-558.
59. S. Zalipsky, Functionalized Poly(ethylene glycols) for Preparation of Biologically Relevant
Conjugates, Bioconjugate Chemistry, 6 (1995) 150-165.
60. T. Thurn, S. Couderc, J. Sidhu, D.M. Bloor, J. Penfold, J.F. Holzwarth, E. Wyn-Jones, Study
of Mixed Micelles and Interaction Parameters for ABA Triblock Copolymers of the Type
EOm−POn−EOm and Ionic Surfactants: Equilibrium and Structure, Langmuir, 18 (2002) 9267-
9275.
61. D. Attwood, J.H. Collett, C.J. Tait, The micellar properties of the poly(oxyethylene) -
poly(oxypropylene) copolymer Pluronic F127 in water and electrolyte solution, International
Journal of Pharmaceutics, 26 (1985) 25-33.
62. F. Cau, S. Lacelle, 1H NMR Relaxation Studies of the Micellization of a Poly(ethylene
oxide)−Poly(propylene oxide)−Poly(ethylene oxide) Triblock Copolymer in Aqueous Solution,
Macromolecules, 29 (1996) 170-178.
63. M. Malmsten, B. Lindman, Self-assembly in aqueous block copolymer solutions,
Macromolecules, 25 (1992) 5440-5445.
64. G. Wanka, H. Hoffmann, W. Ulbricht, Phase Diagrams and Aggregation Behavior of
Poly(oxyethylene)-Poly(oxypropylene)-Poly(oxyethylene) Triblock Copolymers in Aqueous
Solutions, Macromolecules, 27 (1994) 4145-4159.
65. P. Alexandridis, T. Nivaggioli, T.A. Hatton, Temperature Effects on Structural Properties of
Pluronic P104 and F108 PEO-PPO-PEO Block Copolymer Solutions, Langmuir, 11 (1995) 1468-
1476.
88
66. R.K. Prud'homme, G. Wu, D.K. Schneider, Structure and Rheology Studies of
Poly(oxyethylene−oxypropylene−oxyethylene) Aqueous Solution, Langmuir, 12 (1996) 4651-
4659.
67. P. Alexandridis, V. Athanassiou, S. Fukuda, T.A. Hatton, Surface Activity of Poly(ethylene
oxide)-block-Poly(propylene oxide)-block-Poly(ethylene oxide) Copolymers, Langmuir, 10
(1994) 2604-2612.
68. C. Allen, D. Maysinger, A. Eisenberg, Nano-engineering block copolymer aggregates for drug
delivery, Colloids and Surfaces B: Biointerfaces, 16 (1999) 3-27.
69. H. Otsuka, Y. Nagasaki, K. Kataoka, Self-assembly of block copolymers, Materials Today, 4
(2001) 30-36.
70. A.A. Al-Saden, T.L. Whateley, A.T. Florence, Poloxamer association in aqueous solution,
Journal of Colloid and Interface Science, 90 (1982) 303-309.
71. Z. Zhou, B. Chu, Anomalous micellization behavior and composition heterogeneity of a
triblock ABA copolymer of (A) ethylene oxide and (B) propylene oxide in aqueous solution,
Macromolecules, 21 (1988) 2548-2554.
72. M. Almgren, P. Bahadur, J. Alsins, Fluorescence quenching and excimer formation to probe
the micellization of a poly(ethylene oxide)-poly(propylene oxide)-poly(ethylene oxide) block
copolymer, as modulated by potassium fluoride in aqueous solution, Langmuir, 7 (1991) 446-450.
73. A. Tontisakis, R. Hilfiker, B. Chu, Effect of xylene on micellar solutions of block-copoly
(oxyethylene/oxypropylene/oxyethylene) in water, Journal of Colloid and Interface Science, 135
(1990) 427-434.
74. W. Brown, K. Schillen, M. Almgren, S. Hvidt, P. Bahadur, Micelle and gel formation in a
poly(ethylene oxide)/poly(propylene oxide)/poly(ethylene oxide) triblock copolymer in water
solution: dynamic and static light scattering and oscillatory shear measurements, The Journal of
Physical Chemistry, 95 (1991) 1850-1858.
75. R. Sedev, R. Steitz, G.H. Findenegg, The structure of PEO–PPO–PEO triblock copolymers at
the water/air interface, Physica B: Condensed Matter, 315 (2002) 267-272.
76. G. E. Yu, A. Eisenberg, Multiple Morphologies Formed from an Amphiphilic ABC Triblock
Copolymer in Solution, Macromolecules, 31 (1998) 5546-5549.

89
77. N.V. Sastry, H. Hoffmann, Interaction of amphiphilic block copolymer micelles with
surfactants, Colloids and Surfaces A: Physicochemical and Engineering Aspects, 250 (2004) 247-
261.
78]. G. Luo, H. Wang, The Calculation of Surface Potential for Spherical Ionic Micelles, Journal
of Dispersion Science and Technology, 28 (2007) 1108-1111.
79. L. Liu, H. Z. Kou, W. Mo, H. Liu, Y. Wang, Surfactant-Assisted Synthesis of α-Fe2O3
Nanotubes and Nanorods with Shape-Dependent Magnetic Properties, The Journal of Physical
Chemistry B, 110 (2006) 15218-15223.
80. A. Robin, Corrosion Behaviour of Niobium in Sodium Hydroxide Solutions, Journal of
Applied Electrochemistry, 34 623-629.
81. Y. Lu, T. Karaki, T. Fujii, Preparation of Morphology-Controlled Plate-Like Sodium Niobate
Particles by Hydrothermal Synthesis, Journal of the American Ceramic Society, 98 (2015) 1668-
1672.
82. X. Gong, Y. Bi, Y. Zhao, G. Liu, W.Y. Teoh, Graphene oxide-based electrochemical sensor: a
platform for ultrasensitive detection of heavy metal ions, RSC Advances, 4 (2014) 24653-24657.
83. X. Hu, Y. Yu, W. Hou, J. Zhou, L. Song, Effects of particle size and pH value on the
hydrophilicity of graphene oxide, Applied Surface Science, 273 (2013) 118-121.
84. E. Yoo, J. Kim, E. Hosono, H. S. Zhou, T. Kudo, I. Honma, Large Reversible Li Storage of
Graphene Nanosheet Families for Use in Rechargeable Lithium Ion Batteries, Nano Lett., 8 (2008)
2277-2282.
85. K. Akatsuka, G. Takanashi, Y. Ebina, N. Sakai, M. A. Haga, T. Sasaki, Electrochemical and
photoelectrochemical study on exfoliated Nb3O8 nanosheet, Journal of Physics and Chemistry of
Solids, 69 (2008) 1288-1291.
86. Y. Shao, J. Wang, M. Engelhard, C. Wang, Y. Lin, Facile and controllable electrochemical
reduction of graphene oxide and its applications, Journal of Materials Chemistry, 20 (2010) 743-
748.
87. M.A. Raj, S.A. John, Fabrication of Electrochemically Reduced Graphene Oxide Films on
Glassy Carbon Electrode by Self-Assembly Method and Their Electrocatalytic Application, The
Journal of Physical Chemistry C, 117 (2013) 4326-4335.
90
88. M.S. Chang, T. Kim, J.H. Kang, J. Park, C.R. Park, The effect of surface characteristics of
reduced graphene oxide on the performance of a pseudocapacitor, 2D Materials, 2 (2015) 014007.
89. E. Frackowiak, F. Béguin, Carbon materials for the electrochemical storage of energy in
capacitors, Carbon, 39 (2001) 937-950.
90. L. Kong, C. Zhang, J. Wang, W. Qiao, L. Ling, D. Long, Free-Standing T-Nb2O5/Graphene
Composite Papers with Ultrahigh Gravimetric/Volumetric Capacitance for Li-Ion Intercalation
Pseudocapacitor, ACS Nano, 9 (2015) 11200-11208.
91. S.D. Perera, B. Patel, J. Bonso, M. Grunewald, J.P. Ferraris, K.J. Balkus, Vanadium Oxide
Nanotube Spherical Clusters Prepared on Carbon Fabrics for Energy Storage Applications, ACS
Applied Materials & Interfaces, 3 (2011) 4512-4517.
92. J. Liu, I. Shakir, D.J. Kang, Lithium niobate nanoflakes as electrodes for highly stable
electrochemical supercapacitor devices, Materials Letters, 119 (2014) 84-87.
93. Y. F. Ke, D. S. Tsai, Y. S. Huang, Electrochemical capacitors of RuO2 nanophase grown on
LiNbO3(100) and sapphire(0001) substrates, Journal of Materials Chemistry, 15 (2005) 2122-
2127.

91
CHAPTER 5
RUO2 NANODOTS SUPPORTED WRINKLED MESOPOROUS CARBON
FOR SUPERCAPACITORS
5.1 Introduction
There are two types of supercapacitors according to the charge storage mechanism which are
electric double layer and pseudocapacitance.1 Electric double layer capacitors (EDLC) store
charges at the interface by forming an electric double layer.2 High surface area carbon materials
are common electric double layer capacitor materials such as carbon nanotubes (215.5 m2 g-1)3,
graphene (theoretical 2630 m2 g-1 )4 and activated carbon (1367 m2 g-1)3 which have high surface
areas, long cycle lives and high electrical conductivity. Pseudocapacitors generate charges by
undergoing redox reactions. RuO25, V2O5
6, MnO27, CuO8 and Fe3O4
9 can undergo redox reactions
and generate a large number of charges. A combination of EDLC and pseudocapacitance in a
hybrid supercapacitor could result in higher performance using a high surface area carbon and a
high pseudocapacitive metal oxide. RuO2 is the best known pseudocapacitive metal oxide for
supercapacitors that gives over 700 F g-1 capacitance in aqueous electrolytes.10 In our previous
studies we have shown that RuO2 can be used in ionic liquid electrolytes. We have also synthesized
novel high surface area (1370 m2 g-1) carbons derived from wrinkled mesoporous silica.11 The
wrinkled spherical shaped carbon has conical mesopores that can be modified with metals such as
Pd12 and different metal oxides such as RuO213, V2O5
6, MnO27 and CuO8. In this study, RuO2, has
beendeposited in the pores of WMC for supercapacitors. The conical shape mesopores allow better

92
diffusion of electrolyte. We have demonstrated two different methods that can be used to obtain
RuO2 nanoparticles inside the wrinkled mesoporous carbon framework.
5.2 Materials and methods
All reagents were used as received. Ruthenium chloride (RuCl3.xH2O) was purchased from
Pressure chemical co. High purity multiwall carbon nanotubes (CNTs) (∼ 50 µm in length) were
purchased from Sun Innovations Inc. 1-Ethyl-3-methylimidazolium bis(trifluoromethylsulfonyl)
imide (EMIM TFSI) was obtained from Sigma Aldrich. Typical coin cell packaging (CR-2032)
was used to assemble the coin cell type supercapacitors.6 A Teflon film (Gore Company) was used
as the separator between the two electrodes.
5.3 Synthesis of wrinkled mesoporous silica (WMS)
Wrinkled mesoporous silica (WMS) was synthesized using a previously reported procedure as
follows.11 1.8 g of urea were mixed with 15 mL of DI water and 1.2 mL of n-butanol with 1 g of
cetyltrimethylammonium bromide (CTAB) in the 40 ml round bottom flask and stirred at ambient
conditions to obtain a clear solution. Then, 15 mL of cyclohexane were added to the above mixture
and stirred for another 30 min. Next, 1.25 mL of tetraethylorthosilicate (TEOS) was added to the
mixture and stirred for 30 min at room temperature. Finally, the reaction mixture was heated at 70
oC for 24 h. The resulting product (WMS) was collected by centrifugation and washed with acetone
and water four times. The WMS was redispersed in 40 mL of ethanol and 4 mL of 12 M HCl and

93
refluxed at 70 oC overnight to remove any residual template. The final WMC product was
centrifuged and dried at 60 oC for 24 hours.
5.4 Synthesis of wrinkled mesoporous carbon (WMC)
In order to prepare wrinkled mesoporous carbon (WMC), first 0.25 g of WMS were dispersed in
mixture of 0.31 g sucrose, 0.035 g of concentrated H2SO4 and 1.25 mL of DI water. The mixture
was dried 24 hours 100 0C and the temperature increased up to 160 oC for another 6 hours. Then
the resultant solid was immersed again in a solution mixture of 0.19 g of sucrose, 0.01 mL of
H2SO4 and 1.25 mL of DI water. Next the mixture was dried at 100 oC for 24 hours and 160 oC for
6 hours. Then the product was carbonized at 900 oC for 3 h under nitrogen. The silica template
was removed by dissolving in 1M NaOH solution with ethanol: water 1:1 mixture twice. Finally,
the WMC product was dried at 100 oC overnight after washing with ethanol and water.
5.5 Synthesis of ruthenium oxide nanodots on wrinkled mesoporous carbon (WMCR)
Different amounts of the RuO2 nanodots were bound to the WMC using the following procedure.
First 20 mg of WMC were dispersed in 20 mL of DI water and stirred for 6 h at room temperature.
Then 3.47 mg, 7.78 mg, 0.020 g and 0.24 g of RuCl3 were dissolved separately in order to prepare
WMCR-A, WMCR-B, WMCR-C and WMCR-D. Solid was isolated by centrifuging and washed
with DI water several times to remove any excess RuCl3 and dried at room temperature. Then, the
WMCR were treated with 20 mL of 1M NaOH solution for 24 h at room temperature. The mixture
was transferred in to a 45 mL Teflon lined autoclave and heated at 180 oC for 15 h. Then the

94
solution was filtered to remove any unbound RuO2 nanoparticles. The black solid was annealed at
250 oC for 3 h in air.
5.6 Synthesis of ruthenium oxide nanodots on wrinkled mesoporous carbon using a
reducing method.
First 20 mg of WMC were dispersed in a mixture of 10 mL DI water and 10 mL 90% ethanol.
Then 0.1 g of RuCl3 were added and stirred for 6 h. Then 0.1 g of NaOH were added and stirred
until dissolved. The resultant solution was transferred in to a 45 mL Teflon lined autoclave and
heated at 180 oC for 15 h. Then resultant solid was isolated by centrifugation and washed with DI
water. The solid product was dried at 60 oC overnight. Finally, the black product was annealed at
250 oC for 3 h.
5.7 Preparation of ruthenium oxide on wrinkled mesoporous carbon (WMCR) composite
electrodes
The composite electrodes (WMCR-A, B, C and D) were made by mixing 20 mg of WMCR with
20 mg of carbon nanotubes (MCNTs) and with 2% PTFE as a binder to make a free standing paper.
WMC/ CNT and CNT electrodes were prepared by using 20 mg of WMC and 20 mg of MCNT as
a control.

95
5.8 Supercapacitor assembly.
Prior to use the electrodes were immersed in the 2 mL of EMIM TFSI electrolyte for 1 h at room
temperature. The composite paper anode and the MCNT cathode were separated by a Teflon film.
Coin cell packaging (CR2032) was used to assemble the supercapacitors as previously described.6
Carbon coated aluminum sheets were used as the current collectors. Additional EMIM TFSI
electrolyte (~ 0.2 mL) was introduced to each electrode and sealed in the coin cell using a coin cell
crimper (Shenzhen Yongxingye precision machinery mold) by pressing at 1100 psig.
5.9 Characterization
The RuO2 deposited on WMC was characterized by X-ray powder diffraction (XRD) using Rigaku
Ultima IV diffractometer (Cu Kα radiation). Transmission electron microscope (TEM) images
were acquired using a JEOL JEM-2100 TEM at 200 kV (JEOL Co. Ltd.). Thermogravimetric
analysis (TGA) was performed using a TA Instruments Q600 Simultaneous TGA. Cyclic
voltammograms (CV) and galvanostatic charge/discharge curves were obtained using Arbin
battery testing system (BT2000) in the range of –2.0 to 2.0 V (voltage window of 4V).

96
5.10 Results and discussion
5.11 Characterization of ruthenium oxide nanodots grown on wrinkled mesoporous carbon
(WMCR)
Figure 5-9 a), wrinkled mesoporous silica (WMS) b) SEM image of wrinkled mesoporous
carbon (WMC)
Figure 5-1.a shows a SEM image of a typical WMS synthesized from a microemulsion of urea,
cetylmethylammonium bromide, n-butanol, tetraethylorthosilicate and water. The WMS can
function as a template for making wrinkled mesoporous carbon (WMC) as shown in Figure 5-1.b.
These WMC were used as a framework to incorporate different amount of RuO2. The objective of
incorporating RuO2 was to increase the conductivity and pseudocapacitance. Figure 5-2. a-i, shows
the TEM images of different RuO2 loaded WMC composites labeled as WMCR-1 (10 wt% RuO2),
WMCR-2 (20 wt% RuO2), WMCR-3 (40 wt% RuO2) and WMCR-4 (80 wt% RuO2). Figure 5-2.
a, b, and c shows the TEM image with 10 wt% RuO2 loaded WMC. The particle size distribution
histograms (inset) shows the majority of the particles are about 2 nm. But is has ~ 1 – 9 nm range
size distribution. WMC has conical mesopores that act as a pockets to grow RuO2. These

97
mesopores are random in size and shape. Similarly, Figure 5-2.d, e and f shows the 20 wt% RuO2
loaded WMC with 2-3 nm average particle size. When increase the RuO2 amount in to 40 wt%
and 80 wt% particle size tend to increase.
Figure 5-10 TEM images of a), b) 10 wt% c), d) 20 wt% e), f) 40 wt% and g), h) 80 wt% WMCR

98
Figure 5-11 XRD patterns of a) WMC b) 10 wt% c) 20 wt% d) 40 wt% and e) 80 wt% WMCR
Synthesized wrinkled mesoporous carbon with different amount of RuO2 were characterized using
X-ray diffraction (XRD) as shown in Figure 5-3 where the characteristic peaks for RuO2 (JCPDS-
00-040-1290) are assigned to the (110), (101) and (220).
Furthermore, WMCRs were characterized using TGA analysis in order to quantify the amount of
RuO2 contain in each samples (Figure 5-4). WMC has decomposition temperature around 425 oC
in air while RuO2 is thermally stable up to 1300 0C. Therefore the weight loss around 424 oC
corresponds to the amount of WMC contained in each sample. According to the Figure 5-4, the
amount of RuO2 contain in each sample is approximately equal to the amount predict from
synthesis.

99
Figure 5-12 TGA of a) WMC b) 10wt% c) 20 wt% d) 40 wt% e) 80 wt% different RuO2 loading
and f) RuO2
Figure 5-5. shows the TEM images of RuO2 loaded WMC prepared by reduction method. During
this process first it forms Ru metal particles due to the reduction of RuCl3 with the presence of
ethanol in hydrothermal synthesis. Figure 5-5. b shows the well dispersed Ru metal particles on

100
WMC. During the annealing process these Ru metal particles oxidize in to RuO2 nanoparticles as
shown in Figure 5-5.d.
Figure 5-13 a), b) and c) TEM images of WMC with Ru metal nanoparticles and d) with RuO2
nanoparticles

101
Figure 5-14 Cyclic voltammograms of composite electrodes with different RuO2 loaded WMCs.
Figure 5-6 shows the cyclic voltammograms (CV) of different composite electrodes. It clearly
indicates that when increasing the amount of RuO2, capacitance increases. Quasi rectangular CV
implies the ideal capacitance with pseudocapacitance. 80 wt% electrode shows the redox couple
that may be appeared due to the RuO2. Capacitance of the WMC is calculated to be 15 F g-1. When
incorporated 10 wt% RuO2 capacitance increases to 52 F g-1. 20 wt% and 40 wt% electrodes show
78 F g-1 and 118 F g-1 capacitance. The highest loading 80 wt% RuO2 containing electrode shows
148 F g-1 capacitance. This investigation shows the potential application of WMC incorporated
with RuO2 nanoparticles for supercapacitors.

102
5.12 Conclusion
In this study we have demonstrated the novel method of synthesizing wrinkled mesoporous carbon
derived from mesoporous silica with RuO2 for supercapacitor applications. We have reported two
different methods to obtain RuO2 nanoparticles in WMC. This strategy can be used to incorporate
different metal oxides for supercapacitors and catalytic applications.
5.13 References
1. M. Winter and R. J. Brodd, Chemical Reviews, 2004, 104, 4245-4270.
2. A. G. Pandolfo and A. F. Hollenkamp, J. Power Sources, 2006, 157, 11-27.
3. E. Frackowiak and F. Béguin, Carbon, 2001, 39, 937-950.
4. M. S. Chang, T. Kim, J. H. Kang, J. Park and C. R. Park, 2D Materials, 2015, 2, 014007.
5. M. Egashira, Y. Matsuno, N. Yoshimoto and M. Morita, Journal of Power Sources, 2010,
195, 3036-3040.
6. S. D. Perera, A. D. Liyanage, N. Nijem, J. P. Ferraris, Y. J. Chabal and K. J. Balkus Jr,
Journal of Power Sources, 2013, 230, 130-137.
7. S. D. Perera, M. Rudolph, R. G. Mariano, N. Nijem, J. P. Ferraris, Y. J. Chabal and K. J.
Balkus Jr, Nano Energy, 2013, 2, 966-975.
8. S. E. Moosavifard, M. F. El-Kady, M. S. Rahmanifar, R. B. Kaner and M. F. Mousavi,
ACS Applied Materials & Interfaces, 2015, 7, 4851-4860.
9. M. Egashira, Y. Tsubouchi, N. Yoshimoto and M. Morita, Electrochemistry, 2015, 83, 244-
248.
10. P. Wang, H. Liu, Q. Tan and J. Yang, RSC Advances, 2014, 4, 42839-42845.
11. Z. Wang and K. J. Balkus Jr, Materials Letters, 2017, 195, 139-142.
12. Z. Wang and K. J. Balkus, J. Porous Mater., 2017, DOI: 10.1007/s10934-017-0415-0, 1-
7.

103
13. B. J. Lee, S. R. Sivakkumar, J. M. Ko, J. H. Kim, S. M. Jo and D. Y. Kim, Journal of
Power Sources, 2007, 168, 546-552.

104
CHAPTER 6
HYDROTHERMAL SYNTHESIS OF TIO2 NANOTUBE (TNT)/ RUO2 NANORIBBON
(NR)/ GRAPHENE OXIDE COMPOSITES WITH ENHANCED
PHOTOCATALYTIC ACTIVITY
6.1 Introduction
TiO2 is the most widely studied semiconducting metal oxide for photocatalytic applications due to
its high photocatalytic ability.1-8 In the presence of UV light, valance band electrons in TiO2 can
be excited from the valence band (VB) to the conduction band (CB). This will create electron−hole
pairs (e- and h+) which are powerful reducing and oxidizing agents.9 These electron−hole pairs are
mainly involved in the photocatalytic activity.10-11 However, the photocatalytic activity of TiO2 is
reduced when the photogenerated electron-hole pairs recombine.12-13 Therefore, the goal is to
minimize electron hole pair recombination and improve the photocatalytic efficiency of TiO2.6, 14
Electron−hole pair recombination can be reduced by surface modification with noble metals and
metal oxides.6, 10-11, 15 Many current studies are aimed at develop new strategies that combine
different metal oxide particles and ions with TiO2.16 There is growing interest in graphene/metal
oxide nanocomposites as photocatalysts due to higher adsorptivity, conductivity, tunable optical
behavior and stability.17 Graphene shows excellent electrical (electron mobility - 250,000 cm2 V-1
s-1), mechanical (Young’s modules – 1 TPa) and thermal (thermal conductivity – 5000 W m-1 K-1)
properties due to its single layer two-dimensional graphitic structure.18-19 Graphene is an
inexpensive material with properties that are attractive for applications such as nanoelectronics,
photovoltaics, catalysis and energy storage devices.20-22 Various methods have been used to
prepare a single layer or a few layers of graphene sheets by exfoliation of naturally occurring

105
graphite flakes.23-26 Strong oxidizing agents can be used to exfoliate graphite in to individual
graphene oxide sheets. This process introduces extra oxygen functional groups on the surface and
edges of the graphite.27 These oxygen functional groups help to improve the solubility of GO sheets
in various solvents and allow additional surface modification.28-29 Surface oxygen functional
groups disrupt sp2 hybridization of exfoliated GO sheets and reduce the electrical conductivity of
GO. Hydrazine (N2H4), sodium borohydride (NaBH4) and alcohols can be used to prepare reduced
graphene oxide (rGO). These reducing agents can reestablish the sp2 hybridized system and
improve its electronic conductivity.30-32 The two dimensional reduced graphene sheets can act as
a substrate to grow nanostructured catalysts.33 Furthermore, the functional groups on reduced
graphene sheets can provide nucleation and growth sites for metal oxide nanoparticles.9, 34 The
graphene support prevents loss of metal oxide nanoparticles in to the solution.35
Reduced graphene oxide (rGO) has been used as a support for various metal oxides such as TiO2,36-
38 ZnO,35, 39-45 Cu2O,33 SnS2,46 ZnFe2O4,
47 CuFe2O448 and Bi2WO6.
49 These composites have shown
excellent photocatalytic activity for the decomposition of synthetic dyes. Previously, we reported
the preparation of graphene-TiO2 nanotube composites while showed enhanced photocatalytic
activity.9
There have been several studies that report improved photocatalytic activity of RuO2/TiO2
mesoporous heterostructures for photodecomposition of organic dyes.50-51-52-57 Ibhadon et al.
reported the photocatalytic activity of surface modified TiO2 nanoparticles with RuO2 and SiO2
nanoparticles for azo-dye degradation.50 TiO2 nanoparticles and RuO2 nanoparticles can aggregate
and lead to poor interfacial contact with the graphene surface. Therefore, improved interfacial
contact (chemically bound) between TiO2/RuO2 and RuO2 with the graphene (hGO) surface

106
without aggregation is important to enhance the photocatalytic activity of TiO2/RuO2/hGO
composites. Therefore, RuO2 nanoribbons and TiO2 nanotubes were employed to achieve better
contact between nanostructures. RuO2 has excellent electronic conductivity due to the partially
filled metal (d)- oxygen (p) π* band 58 and can act as an efficient electron hole transfer catalyst
when deposited on TiO2. Furthermore, RuO2 has high work function that is located above the
valance band of the TiO2.59 Uddin and coworkers have reported upward band bending for a TiO2/
RuO2 heterojunction.60 This will help electrons to flow from TiO2 to RuO2 and separate charges at
the RuO2/ TiO2 interface under illumination. The RuO2 will increase the conductivity of the
composite which facilitates the efficient charge transfer.61 Tamez and coworkers have prepared
RuO2 /TiO2 mesoporous heterostructures and reported enhanced photocatalytic properties by band
alignment.60 The band bending for this RuO2/ TiO2 heterostructure was 0.2 ± 0.05 eV,60 which
helped to minimize the electron-hole pair recombination. The preparation of TNT/RuO2 NR/hGO
composites is illustrated in Figure 6-1. First, hydrothermally reduced graphene oxide (hGO) was
prepared and then RuO2 NRs were grown on the hGO. Then the TNTs were grown on the RuO2
NRs. Good interfacial contact between RuO2 NRs/TNTs and graphene at the interface help to
separate charges enhancing the photocatalytic efficiency.
Figure 6-1 Graphical illustration of the synthesis of TNT/RuO2 NR/hGO composites.
107
6.2 Experimental section
6.3 Materials and methods
TiO2 nanoparticles (P25) were purchased from Evonik-Degussa. Ruthenium chloride
(RuCl3.xH2O) was purchased from Pressure chemical CO. SPAN-80 surfactant and graphite
powder was purchased from Sigma Aldrich. H2SO4 (EMD chemicals), HCl (Fischer Scientific),
NaNO3 (Sigma Aldrich), NaOH (Alfa Aesar), and KMnO4 (Baker analyzed) were used without
any purification. Malachite green oxalate was obtained from Alfa Aesar.
6.4 Characterization.
X-ray powder diffraction (XRD) patterns were collected using a Rigaku Ultima IV diffractometer
(Cu Kα radiation). Raman spectra were obtained using a JY Horiba HR-800 spectrophotometer.
Transmission electron microscope (TEM) images and Energy-dispersive X-ray spectra (EDX)
were collected using a JEOL JEM-2100 TEM at 200 kV (JEOL Co. Ltd.). Scanning electron
microscope (SEM) images were obtained using a LEO 1530 VP field emission electron
microscope. UV−vis spectra were collected using a Shimadzo UV-1601PC spectrometer with
integrating sphere. X-ray photoelectron spectroscopy (XPS) measurements were carried out exsitu,
using a Perkin-Elmer PHI System.

108
6.5 Synthesis of graphene Oxide (GO).
GO was prepared by using a modified Hummer’s method.62 First, 0.5 g of graphite and 0.5 g of
NaNO3 were added to 23 mL of 12.1 M H2SO4 and stirred in an ice bath for 15 min. Next, 4.0 g
of KMnO4 was slowly mixed with the mixture in an ice bath to obtain a purple-green gel. Resultant
suspension was transferred to a 40 °C water bath and stirred for 90 min. Then 50 ml of deionized
water (DI) water was added to the dark brown colored paste and stirred for another 10 min. Then,
6 mL of H2O2 (30%) was added to the solution and obtained a brown sol. Then, 50 mL of DI water
was added, and the resulting product was isolated by centrifuge and solid was washed with warm
(60 oC) DI water five times. Finally the product was dried at 80 °C for 24 h.
6.6 Synthesis of TNT/RuO2 NR/hGO (TRG) composites.
The GO composites with different TNT/RuO2 NR content were synthesized using hydrothermal
method under alkaline conditions. To obtain homogeneous dispersions of GO, 10 mg of GO were
sonicated in 10 mL of DI water for 1 h. Ruthenium chloride (RuCl3.xH2O) was added to the GO
dispersions with stirring (0.1 g (TRG-3), 0.2 g (TRG-4) and 0.3 g (TRG-5)). Then, RuCl3 /GO
mixture was stirred for another 1 h at room temperature. 1.5 mL of Span-80 was added to the
RuCl3/ GO mixture and stirred at room temperature for 2 h. Then, 10 mL of butanol were added
to the mixture and stirred for two hours at room temperature. The mixture was transferred to a 40
mL Teflon lined autoclave with 0.6 g of sodium hydroxide and heated at 180 oC for 15 hours. Then
the product was isolated by centrifugation and washed with deionized water and ethanol five times.
The final product was vacuum dried at room temperature overnight. The resulting solid was

109
sonicated in 30 mL of DI-water for 15 min to obtain homogeneous dispersions of RuO2 NR/hGO.
TiO2 (P25) powder (0.1 g (TRG-3), 0.2 g (TRG-4) and 0.3 g (TRG-5)) were then added to the
RuO2 NR/hGO dispersions with stirring. The TiO2/RuO2 NR/hGO mixture was stirred for 1 h to
achieve complete mixing. Then 10.5 g of NaOH were added, and the mixture was transferred to a
45 mL Teflon lined autoclave and then heated at 120 °C for 24 h. The resulting precipitate was
washed with 0.1 M HCl solution and stirred overnight at room temperature. Then the product was
washed with DI water three times. Then centrifuged, dried at 80 °C and annealed at 250 °C for
120 min. Samples were prepared with constant amount of GO and different amount of RuCl3.xH2O
and TiO2 (P25) amounts. Sample labeled as TG-1 prepared using 10 mg of GO with 0.3 g of P25.
Sample labeled as RG-2 prepared by using 10 mg of GO and 0.3 g of RuCl3. Sample labeled as
TRG-3, TRG-4 and TRG-5 prepared using 10 mg of GO and 0.1 g, 0.2 g and 0.3 g of P25 and 0.1,
g, 0.2 g and 0.3 g of RuCl3 Table S.1 in the supplementary section shows the detail sample
preparation procedure.
6.7 Photocatalytic measurements.
The photocatalytic performance of the composites was investigated for the decomposition of
malachite green oxalate (MGO) (13.1 mg/L) in H2O. First 20 mg of the catalyst was stirred with
the 100 mL of the dye solution in a 250 mL quartz round-bottom flask and kept inside a dark box
with a water-cooled mercury lamp (450 W, quartz Hanovia). To obtain equilibrium, the mixture
was stirred in the dark for 1 h. Next, the mixture was irradiated with the 450 W mercury lamp.
Five milliliter aliquots were taken out after every 10 minutes and centrifuged to separate the
catalyst. Finally the absorbance measurements were taken using UV−vis spectroscopy.

110
6.8 Results and discussion
6.9 Characterization of TNT/ RuO2 NR/ hGO composites
The TNT/RuO2 NR/hGO composites were dispersed in aqueous medium due to the hydrophilic
oxygen functional groups on the surface of the hGO sheets. Oxygen functional groups such as
carboxylates promote the formation of metal oxide on GO.9, 63 Similarly, these functional groups
help the RuO2 nanostructures to grow on GO.64 Combining RuCl3.xH2O and GO results in a dark
brown suspension. Hydrothermal treatment under basic conditions using a previously reported
procedure results in hGO supported RuO2 NRs. The color of the hGO- RuO2 NR dispersion
became black after the hydrothermal treatment. In order to grow TNTs on the supported RuO2 NR,
a second hydrothermal treatment was conducted under basic conditions as describe above. During
this step the hGO will be further reduced removing oxygen functional groups from the surface.
Figure 6-2 XRD patterns of (a) TG-1, (b) RG-2, (c) TRG-3, (d) TRG-4 and (e) TRG-5.

111
X-ray diffraction (XRD) patterns were collected for the TNT/RuO2 NR/hGO composites as shown
in Figure 6-2. TG-1 (TNT/ hGO) exhibits characteristic (101), (004), (200), (105) and (211)
reflections corresponding to the anatase phase (JCPDS PDF#: 00-021-1272) (Figure 6-2.a). The
XRD pattern in Figure 6-2.b (RG-2) shows the characteristic peaks for RuO2 at 2ɵ = 27.9o (d -
0.318 nm), 35.0o, 39.9o, 40.4o, which are assigned to the (110), (101), (200), (111) and (211).
(JCPDS PDF#: 00-040-1290). The corresponding peaks for the composites are broader than pure
TNT and RuO2 NR. The average crystal size of the TNT/hGO (TG-1), RuO2 NR/hGO (RG-2)
were calculated using the Scherrer equation based on the XRD peak related to TiO2 (101) and
RuO2 (110) (Supporting Information, Table 6-S.2). Calculated average crystal size of TNT was
about ~ 8 nm and RuO2 NR was about ~ 6 nm which is consistent with the TEM analysis (vide
infra).
The Raman spectra of the RuO2 NR and RuO2 NR/ hGO composite (RG-2) are shown in Figure
6-3. There are 15 optical modes of RuO2. But four modes are Raman-active (A1g, B1g, B2g and
Eg).65 Four major Raman features of rutile RuO2 are placed at 528, 646, 716 and 812 cm-1,
respectively. The broader peaks related to the Eg mode for RuO2 NR and RuO2 NR/ hGO
composites are notably blue-shifted from 528 cm-1 to 534 cm-1 (Figure 6-3, inset). The blue-shift
and peak broadening is ascribed to the surface pressure or phonon confinement effect which are
common for nanomaterials.66 Previously reported TNT/ hGO composites also showed a similar
blue-shift due to the strong interaction between TNT and hGO.9 These results suggests a strong
chemical interaction between RuO2 NR and hGO.

112
Figure 6-3 Raman spectra of (a) RuO2 NR and (b) RuO2 /hGO (RG-2). Inset Raman spectra
showing the blue shift of the Eg band of the composite.
Figure 6-4 Raman spectra of TNT (a), TG-1 (b), TRG-3 (c), TRG-4 (d) and TRG-5 (e). Inset
Raman spectra showing the blue shift of the Eg band of the composites.
Raman spectra of the TNTs and composites with different TNT/ RuO2 NR compositions are shown
in Figure 6-4. The Raman active 144 cm-1 (Eg), 399 cm-1 (B1g), 513 cm-1 (A1g) and 638 cm-1 (Eg)

113
modes correspond to the anatase structure of TNTs.67 The peak related to the Eg mode for all
composites are broader and blue-shifted from 143 cm-1 to 158 cm-1 (Figure 6-4, inset). As
previously discussed, this could be due to the strong interaction between TNTs, RuO2 NR and
hGO. These interaction is important to reduce the electron hole recombination.
Figure 6-5 Characteristic D and G bands of a) GO b) RG-2 c) TRG-3 d) TRG-4 and e) TRG-5
composites.
Raman spectroscopy can be used to characterize the electronic structure of the carbon composites
figure 6-5 shows the characteristic D and G bands located at 1347 cm-1 and 1598 cm-1. The G band
provides information about sp2 carbons and the D band shows the sp3 defect sites.68-69 The intensity
ratio provides the level of defects in carbon material. The calculated Id/Ig ratio for GO is ~1.32
showing the high degree of defect sites, while TRG-5 was 0.953. In this case, the hydrothermal

114
process converts more sp3 hybridized carbons to sp2 hybridized carbons. The blue shift of the G
band can be ascribed to formation of graphene sheets from graphite.
Figure 6-6 Deconvoluted peak of high resolution XPS core level of a) Ru 3d/ C 1s b) Ti 2p of
TRG-5 composite.
XPS analysis helps to determine the chemical compositions of composites and oxidation states of
the ruthenium cations. Figure 6-6 (a, b) shows the XPS spectrum of the TRG-5 composite
(hGO/RuO2 NR/TNT). Figure 6.a shows two prominent bands at 280.1 eV and 285.2 eV, readily
assigned to 3d5/2 and 3d3/2 .70 The Ru 3d peak shifts ~ 1 eV to a lower binding energy compared to
pure RuO2 nanoribbons. Uddin et al. have reported the Ru 3d low binding energy shift when TiO2
deposited on RuO2 (~ 1 eV). X-ray photoelectron valance band spectra was used to determine the
core level binding energy shift and it was proposed that the shift reflect the band bending at the
interface.60 These peaks can also be deconvoluted in to four peaks with two higher binding energy
satellite peaks at 282.2 eV and 284.6 eV. This artifact is due to the strong interaction between the
d-orbital electrons and generated photoionized holes (final state screening effect).71 Foelske et. al

115
reported X-ray photoelectron spectroscopy of RuO2 and obtained an increase in satellite peak
intensity with increasing annealing temperature.72 Kim and coworkers have shown by X-ray
photoelectron spectroscopy that RuO2 is in the Ru+4 oxidation state.73 The peak at 285 eV
overlapped with carbon which can be attributed to hGO. Peaks at 285 eV, 287.1 eV, 289.0 eV,
289.6 eV can be assigned to sp2 C-C, C-O, C=O and O-C=O peaks respectively.17, 34, 60, 74 9. The
high resolution XPS spectra for Ti2p showed two prominent peaks in the Ti2p region (Figure 6.b).
The peak at 459.2 eV and 465.1 eV corresponds to Ti (IV) 2p1/2 and Ti (IV) 2p3/2.75
6.10 Morphology of TNT/RuO2 NR/ hGO composite
The composite materials were characterized using SEM and high resolution TEM. Figure 6-7.a
shows a SEM image of RuO2 NRs grown on hGO sheets. Figure 6-7.b shows the SEM image of
the TRG-5 composite where the surface is fully covered with the interconnected TNTs and RuO2
NRs. The sheet like morphology of the hGO is retained even after hydrothermal synthesis and
annealing (Figure 6-7.b). Figure 6-S.1. shows TEM-EDAX spectrum accrued at 10 nm
magnification. Figure 6-S.2. a and b shows the High resolution TEM images of bulk TNTs. The
high resolution TEM images of TRG-5 in Figure 6-7.c and d show the RuO2 NRs and TNTs are
grown on hGO sheets making an interconnected network. The RuO2 NRs are in the range of ~ 6-
7 nm in width and TNTs are ~ 9 nm in diameter with ~ 6 nm pores. TNTs grown on the hGO
sheets have inner and outer diameters of ∼ 6 nm and ∼ 9 nm that are smaller than TNT prepared
without hGO (~ 10 nm) as shown in Figure 6-S.3. The TRG-5 composite contains the highest
loading of RuO2 NRs and TNTs but a similar morphology was observed for the other composites.

116
The composite materials were characterized using SEM and high resolution TEM. Figure 6-7.a
shows a SEM image of RuO2 NRs grown on hGO sheets. Figure 6-7.b shows the SEM image of
the TRG-5 composite where the surface is fully covered with the interconnected TNTs and RuO2
NRs. The sheet like morphology of the hGO is retained even after hydrothermal synthesis and
annealing (Figure 6-7.b). Figure 6-S.1. shows TEM-EDAX spectrum accrued at 10 nm
magnification. Figure 6-S.2. a and b shows the High resolution TEM images of bulk TNTs. The
high resolution TEM images of TRG-5 in Figure 6-7.c and d show the RuO2 NRs and TNTs are
grown on hGO sheets making an interconnected network. The RuO2 NRs are in the range of ~ 6-
7 nm in width and TNTs are ~ 9 nm in diameter with ~ 6 nm pores. TNTs grown on the hGO
sheets have inner and outer diameters of ∼ 6 nm and ∼ 9 nm that are smaller than TNT prepared
without hGO (~ 10 nm) as shown in Figure 6-S.3. The TRG-5 composite contains the highest
loading of RuO2 NRs and TNTs but a similar morphology was observed for the other composites.
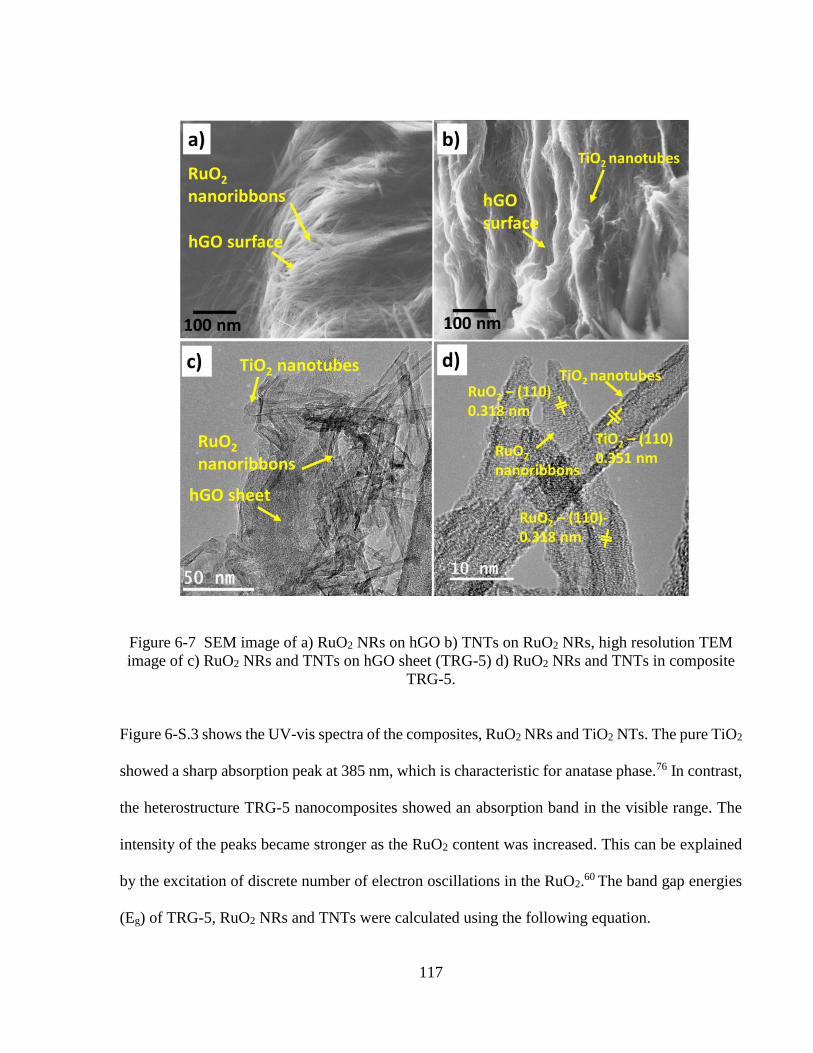
117
Figure 6-7 SEM image of a) RuO2 NRs on hGO b) TNTs on RuO2 NRs, high resolution TEM
image of c) RuO2 NRs and TNTs on hGO sheet (TRG-5) d) RuO2 NRs and TNTs in composite
TRG-5.
Figure 6-S.3 shows the UV-vis spectra of the composites, RuO2 NRs and TiO2 NTs. The pure TiO2
showed a sharp absorption peak at 385 nm, which is characteristic for anatase phase.76 In contrast,
the heterostructure TRG-5 nanocomposites showed an absorption band in the visible range. The
intensity of the peaks became stronger as the RuO2 content was increased. This can be explained
by the excitation of discrete number of electron oscillations in the RuO2.60
The band gap energies
(Eg) of TRG-5, RuO2 NRs and TNTs were calculated using the following equation.

118
𝛼(ℎʋ) = 𝐴(ℎʋ − 𝐸𝑔)𝑛 (1)
where α - absorption coefficient, ʋ - light frequency, Eg - band gap energy, A and n - constant
parameter depending on the nature of the semiconductor.77 78 The indirect bandgap Eg of TiO2 NTs
and direct band gap Eg of TRG-5 composite and RuO2 NRs79 were calculated and compared
(Figure 6-S.4.a, b).
Therefore for the TiO2 NTs the indirect band gap was estimated using Kubelka-Munk theory.80
The direct band gap model was used to estimate the band gap energy of TRG-5 composite and
RuO2 NRs. The band gap energy of TiO2 NTs were estimated to be 3.2 eV which matches the
literature 60 using the indirect bandgap model. The TRG-5 composite band gap was 2.7 eV which
has band gap energy more towards visible spectrum. This shows these composites can absorb
visible light and act as a photocatalyst. Uddin et. al reported RuO2/TiO2 mesoporous
heterostructure with band gap energy 3.15 eV that was active in UV region.60
6.11 Photocatalytic performance of TNT/RuO2 NR/ hGO composite.
To evaluate the photocatalytic efficiency of the TNT/RuO2 NR/ hGO composites, the
photocatalytic decomposition of malachite green oxalate (MGO) was performed as a test
reaction.50 The maximum absorption peak of MGO at 616 nm decreases exponentially and decayed
completely under UV light irradiation after 80 min in the presence of the TNT/RuO2 NR/ hGO
composite. The color of the solution decreases with the time due to the decomposition of the MGO.
Furthermore, similar experiments were carried out using a RuO2 NR/hGO composite and a

119
TNT/hGO composite as controls. The degradation efficiency was calculated using C/C0, where C0
and C are the initial concentration and the concentration at time t, respectively.
In order to explain the effect of the RuO2 NRs/ TNT ratio on the photocatalytic activity, a set of
experiments were conducted using the TNT/RuO2 NR/ hGO composites containing different ratios
of RuO2 NRs/TNTs. The TNT/RuO2 NR/ hGO composites (TRG-5, TRG-4, TRG-3) had a higher
photocatalytic activity than pure RuO2 NR/hGO and TNT/hGO as shown in Figure 6-8. The TRG-
5 composite shows the best performance with a degradation efficiency of 95% after 80 min
exposure to UV light. Perera and coworkers have prepared TNT/hGO composite and it shows 80%
degradation efficiency after 80 min.9 For the TRG-4, TRG-3 samples, the degradation efficiency
was lower, i.e., 90% and 85%, respectively, but still higher than that of pure TNT/hGO (TG-1)
and RuO2 NR/hGO (RG-2), i.e., 40% after 80 min and 20% after 80 min respectively.
The photocatalytic degradation reaction follows a pseudo-first order kinetics −ln(C/C0) = kt, where
k is the apparent reaction rate constant (min−1), C- dye concentration after time t and Co- initial
dye concentration. The highest rate constant for photocatalytic activity (0.9625 min−1) was
obtained for TRG-5, which is greater than TNT/ hGO (0.674 min-1) and ~4.5 times greater than
that of TNTs (0.218 min-1).9 Uddin et. al reported a RuO2/ TiO2 nanoparticle heterostructure that
exhibited a rate constant of 0.239 min-1 for decomposition of methylene blue dye.60 Rate constants
for the RuO2 NR/ TNT composites were TRG-4 (0.6924 min−1), TRG-3 (0.4818 min−1), RG-2
(0.0741 min−1), TG-1 (0.1583 min−1) respectively. With the increase of RuO2 NRs/ TiO2 NTs

120
composition, rate constant of the reactions increased rapidly. This is mainly due to the minimizing
the electron hole recombination rate.
Figure 6-8 Plot of C/Co (%) versus time for the photocatalytic degradation of malachite green in
a quartz reactor.
The photocatalytic mechanism includes several steps. Start with the adsorption of the pollutant to
the catalyst, absorption of light (UV) by the photocatalyst and generate electrons and holes and
undergoing charge transfer reactions to create radicals to decompose the pollutants. Aromatic
industrial dyes are able to form π-π interactions with the graphene.81 This will help to increase the
adsorption process significantly. To obtain enhanced photocatalytic degradation rates, higher dye
concentration near the substrate is an important factor (Figure 6-9, step 1). Under UV light
irradiation, electrons are excited from the TiO2 valance band (VB) to the conduction band (CB)
forming holes in the VB (Figure 6-9, step 2). These electrons and holes (step 2) tend to react with
H2O to create radical oxygen species that can react with dyes to decompose them into small

121
molecules (Figure 6-9, step 3). Fast electron−hole pair recombination (10−9 s) can reduce the
photocatalytic activity. This is due to the reaction kinetic of the pollutants (10−8−10−3 s) on TiO2
is slower than the electron−hole recombination time. Generally, a small amount of electrons and
holes (< 1%) are contributing in photocatalytic reactions, while the majority (99%) of electrons
and holes recombine without engage in any chemical reaction. Therefore, it is essential to control
step 2 and step 3 to enhance the photocatalytic activity by reducing the electron-hole
recombination. In this study, RuO2 NRs has been coupled with TNTs and hGO to reduce the
recombination rate.
Figure 6-9 Graphical illustration of photodegradation of MGO in the presence of RuO2/
TiO2/hGO composite.
The photogenerated charge separation mechanism at the interface of the RuO2 /TiO2 heterojunction
has been discussed by several groups.11, 50, 60 The Fermi level of TiO2 located above the Fermi
level of the RuO2. Therefore, electrons are transferred from TiO2 to the metal like RuO2 when they
are in contact. This will bring Fermi level of TiO2 and RuO2 to the same level forming an electron
depletion region and an upward band bend in the TiO2. When irradiated, electrons from valence
band of TiO2 are excited to the conduction band creating holes in the valance band. Due to the

122
internal electric field at the interface, generated electrons and holes can be separated. Generated
electrons reduce dissolve oxygen to form superoxide radicals (O2’-) and hydroxyl species OH*
which are very strong oxidizing agents that can decompose organic pollutants. Table 6-1 compares
the reactivity of the TNT/RuO2 NR/ hGO composites with related catalysts. TRG-5 composite
shows the exceptional photocatalytic performance among the other composites reported.
Table 6-1 Rate constant comparison for the oxidation of organic dyes
Sample Rate constant (min-1) Reference
TRG-5 0.9625 This study
RG-2 0.0741 This study
TG-1 0.1583 This study
TNT 0.218 Ref 9
TNT/hGO 0.674 Ref 9
RuO2/TiO2 nanoparticles 0.239 Ref 60
RuO2/TiO2 (SiO2 5%) 0.429 Ref 50
RuO2/TiO2 (SiO2 10%) 0.530 Ref 50
TiO2 (SiO2 10%) 0.376 Ref 14
TiO2/ rGO 0.0889 Ref 37

123
6.12 Conclusion
In this study we have prepared TNT/RuO2 NR/hGO composites using a sequential hydrothermal
synthesis method. Their photocatalytic activity was evaluated and the highest loading of RuO2
NR/TNTs on hGO shows the highest photodegradation efficiency of MG (TRG-5). By comparing
TNT/hGO and RuO2 NR/hGO photodegradation efficiencies, it is clear that TNT/RuO2 NR
heterojunction helps to improve the photodegradation efficiency of organic dyes by decreasing the
electron hole recombination rate. This technique for synthesizing TNT/ RuO2 NR/ hGO
heterojunction composites can be used to prepare other metal oxide heterojunction composites for
different applications.
6.13 Supporting information
Table 6-S. 1 Amount of TiO2, RuO2 and hGO in composites
Sample TiO2 (g) RuO2 (g) hGO (mg)
TRG-5 0.3 0.3 10
TRG-4 0.2 0.2 10
TRG-3 0.1 0.1 10
RG-2 0.3 - 10
TG-1 - 0.3 10

124
Figure 6-S. 2 TEM-EDAX spectrum accrued at 10 nm magnification
Figure 6-S. 3 a), b) High resolution TEM images of bulk TNTs.

125
Figure 6-S. 4 UV-vis diffuse reflectance spectra of composites.
Figure 6-S. 5 a) Direct bandgap model of TRG-5 and RuO2 NRs b) indirect bandgap model of
TNTs
126
6.14 References
1. Chiu, W. H.; Lee, K. M.; Hsieh, W. F., High Efficiency Flexible Dye-Sensitized Solar Cells by
Multiple Electrophoretic Depositions. Journal of Power Sources 2011, 196, 3683-3687.
2. Zhang, Y.; Tang, Z. R.; Fu, X.; Xu, Y. J., TiO2−Graphene Nanocomposites for Gas-Phase
Photocatalytic Degradation of Volatile Aromatic Pollutant: Is TiO2−Graphene Truly Different
from Other TiO2−Carbon Composite Materials? ACS Nano 2010, 4, 7303-7314.
3. Wang, G.; Wang, H.; Ling, Y.; Tang, Y.; Yang, X.; Fitzmorris, R. C.; Wang, C.; Zhang, J. Z.;
Li, Y., Hydrogen-Treated TiO2 Nanowire Arrays for Photoelectrochemical Water Splitting. Nano
Letters 2011, 11, 3026-3033.
4. Wang, D .; Choi, D.; Li, J.; Yang, Z.; Nie, Z.; Kou, R.; Hu, D.; Wang, C.; Saraf, V.; Zhang, J.;
Aksay, A.; Liu, J., Self-Assembled TiO2–Graphene Hybrid Nanostructures for Enhanced Li-Ion
Insertion. ACS Nano 2009, 3, 907-914.
5. Fujishima, A.; Rao, T. N.; Tryk, D. A., Titanium Dioxide Photocatalysis. Journal of
Photochemistry and Photobiology C: Photochemistry Reviews 2000, 1, 1-21.
6. Hoffmann, M. R.; Martin, S. T.; Choi, W.; Bahnemann, D. W., Environmental Applications of
Semiconductor Photocatalysis. Chemical Reviews 1995, 95, 69-96.
7. Ibhadon, A. O.; Greenway, G. M.; Yue, Y.; Falaras, P.; Tsoukleris, D., The Photocatalytic
Activity of TiO2 Foam and Surface Modified Binary Oxide Titania Nanoparticles. Journal of
Photochemistry and Photobiology A: Chemistry 2008, 197, 321-328.
8. Xu, H.; Wang, J.; Zhang, H.; Huang, Y., The Effects of Synthesis Procedures on the Structure
and Morphology of Multiwalled Carbon Nanotubes (MWNTs)/Titania (TiO2) Nanocomposites
Prepared by Hydrothermal Method. Journal of Materials Science 2010, 45, 6200-6205.
9. Perera, S. D.; Mariano, R. G.; Vu, K.; Nour, N.; Seitz, O.; Chabal, Y.; Balkus, K. Jr.,
Hydrothermal Synthesis of Graphene- TiO2 Nanotube Composites with Enhanced Photocatalytic
Activity. ACS Catalysis 2012, 2, 949-956.
10. Ola, O.; Maroto-Valer, M. M., Review of Material Design and Reactor Engineering on TiO2
Photocatalysis for CO2 Reduction. Journal of Photochemistry and Photobiology C:
Photochemistry Reviews 2015, 24, 16-42.
11. Banerjee, S.; Pillai, S. C.; Falaras, P.; O’Shea, K. E.; Byrne, J. A.; Dionysiou, D. D., New
Insights into the Mechanism of Visible Light Photocatalysis. The Journal of Physical Chemistry
Letters 2014, 5, 2543-2554.

127
12. Sarkar, A.; Gracia-Espino, E.; Wågberg, T.; Shchukarev, A.; Mohl, M.; Rautio, A. R.;
Pitkänen, O.; Sharifi, T.; Kordas, K.; Mikkola, J. P., Photocatalytic Reduction of CO2 with H2O
over Modified TiO2 Nanofibers: Understanding the Reduction Pathway. Nano Research 2016, 9,
1956-1968.
13. Ansari, S. A.; Cho, M. H., Highly Visible Light Responsive, Narrow Band Gap TiO2
Nanoparticles Modified by Elemental Red Phosphorus for Photocatalysis and
Photoelectrochemical Applications. Scientific Reports 2016, 6, 25405.
14. Ibhadon, A. O.; Greenway, G. M.; Yue, Y.; Falaras, P.; Tsoukleris, D., The Photocatalytic
Activity and Kinetics of the Degradation of an Anionic Azo-Dye in a Uv Irradiated Porous Titania
Foam. Applied Catalysis B: Environmental 2008, 84, 351-355.
15. Zhang, Y.; Zhang, H.; Cheng, L.; Miao, Y.; Hu, L.; Ding, G.; Jiao, Z.; Bian, L.; Nguyen, M.;
Zheng, G., Vacuum-Treated Mo,S-Doped TiO2:Gd Mesoporous Nanospheres: An Improved
Visible-Light Photocatalyst. European Journal of Inorganic Chemistry 2015, 2015, 2895-2900.
16. Nair, P. B.; V.B.Justinvictor; Daniel, G. P.; Joy, K.; Ramakrishnan, V.; Kumar, D. D.; Thomas,
P. V., Structural, Optical, Photoluminescence and Photocatalytic Investigations on Fe Doped TiO2
Thin Films. Thin Solid Films 2014, 550, 121-127.
17. Chen, Y.; Zhang, X.; Zhang, D.; Yu, P.; Ma, Y., High Performance Supercapacitors Based on
Reduced Graphene Oxide in Aqueous and Ionic Liquid Electrolytes. Carbon 2011, 49, 573-580.
18. Geim, A. K., Graphene: Status and Prospects. Science 2009, 324, 1530-1534.
19. Gu, L.; Zhang, H.; Jiao, Z.; Li, M.; Wu, M.; Lei, Y., Glucosamine-Induced Growth of Highly
Distributed TiO2 Nanoparticles on Graphene Nanosheets as High-Performance Photocatalysts.
RSC Advances 2016, 6, 67039-67048.
20. Stoller, M. D.; Park, S.; Zhu, Y.; An, J.; Ruoff, R. S., Graphene-Based Ultracapacitors. Nano
Letters 2008, 8, 3498-3502.
21. Wu, J.; Pisula, W.; Müllen, K., Graphenes as Potential Material for Electronics. Chemical
Reviews 2007, 107, 718-747.
22. Zhang, L. L.; Xiong, Z.; Zhao, X. S., Pillaring Chemically Exfoliated Graphene Oxide with
Carbon Nanotubes for Photocatalytic Degradation of Dyes under Visible Light Irradiation. ACS
Nano 2010, 4, 7030-7036.
23. Zhu, Y.; Murali, S.; Cai, W.; Li, X.; Suk, J. W.; Potts, J. R.; Ruoff, R. S., Graphene and
Graphene Oxide: Synthesis, Properties, and Applications. Advanced Materials 2010, 22, 3906-
3924.

128
24. Singh, V.; Joung, D.; Zhai, L.; Das, S.; Khondaker, S. I.; Seal, S., Graphene Based Materials:
Past, Present and Future. Progress in Materials Science 2011, 56, 1178-1271.
25. Li, X.; Cai, W.; Colombo, L.; Ruoff, R. S., Evolution of Graphene Growth on Ni and Cu by
Carbon Isotope Labeling. Nano Letters 2009, 9, 4268-4272.
26. López, V.; Sundaram, R. S.; Gómez-Navarro, C.; Olea, D.; Burghard, M.; Gómez-Herrero, J.;
Zamora, F.; Kern, K., Graphene Monolayers: Chemical Vapor Deposition Repair of Graphene
Oxide: A Route to Highly-Conductive Graphene Monolayers. Advanced Materials 2009, 21,
4683–4686.
27. Hummers, W. S.; Offeman, R. E., Preparation of Graphitic Oxide. Journal of the American
Chemical Society 1958, 80, 1339-1339.
28. Cassagneau, T.; Fendler, J. H., Preparation and Layer-by-Layer Self-Assembly of Silver
Nanoparticles Capped by Graphite Oxide Nanosheets. The Journal of Physical Chemistry B 1999,
103, 1789-1793.
29. Muszynski, R.; Seger, B.; Kamat, P. V., Decorating Graphene Sheets with Gold Nanoparticles.
The Journal of Physical Chemistry C 2008, 112, 5263-5266.
30. Park, S.; An, J.; Potts, J. R.; Velamakanni, A.; Murali, S.; Ruoff, R. S., Hydrazine-Reduction
of Graphite- and Graphene Oxide. Carbon 2011, 49, 3019-3023.
31. Shin, H.; Kim, K.; Benayad, A.; Yoon, S.; Park, H.; Jung, I.; Jin, M.; Jeong, H.; Kim, J.; Choi,
J.; Lee, Y.; Efficient Reduction of Graphite Oxide by Sodium Borohydride and Its Effect on
Electrical Conductance. Advanced Functional Materials 2009, 19, 1987-1992.
32. Su, C. Y.; Xu, Y.; Zhang, W.; Zhao, J.; Liu, A.; Tang, X.; Tsai, C. H.; Huang, Y.; Li, L. J.,
Highly Efficient Restoration of Graphitic Structure in Graphene Oxide Using Alcohol Vapors.
ACS Nano 2010, 4, 5285-5292.
33. Wang, M.; Huang, J.; Tong, Z.; Li, W.; Chen, J., Reduced Graphene Oxide–Cuprous Oxide
Composite Via Facial Deposition for Photocatalytic Dye-Degradation. Journal of Alloys and
Compounds 2013, 568, 26-35.
34. Wang, W.; Guo, S.; Lee, I.; Ahmed, K.; Zhong, J.; Favors, Z.; Zaera, F.; Ozkan, M.; Ozkan,
C. S., Hydrous Ruthenium Oxide Nanoparticles Anchored to Graphene and Carbon Nanotube
Hybrid Foam for Supercapacitors. Scientific Reports 2014, 4, 4452.
35. Fu, D.; Han, G.; Chang, Y.; Dong, J., The Synthesis and Properties of Zno–Graphene Nano
Hybrid for Photodegradation of Organic Pollutant in Water. Materials Chemistry and Physics
2012, 132, 673-681.

129
36. Shi, M.; Shen, J.; Ma, H.; Li, Z.; Lu, X.; Li, N.; Ye, M., Preparation of Graphene–TiO2
Composite by Hydrothermal Method from Peroxotitanium Acid and Its Photocatalytic Properties.
Colloids and Surfaces A: Physicochemical and Engineering Aspects 2012, 405, 30-37.
37. Loryuenyong, V.; Charoensuk, J.; Charupongtawitch, R.; Usakulwattana, A.; Buasri, A.,
Kinetics of Photocatalytic Degradation of Methylene Blue by TiO2-Graphene Nanocomposites.
Journal of Nanoscience and Nanotechnology 2016, 16, 296-302.
38. Gayathri, S.; Kottaisamy, M.; Ramakrishnan, V., Facile Microwave-Assisted Synthesis of
Titanium Dioxide Decorated Graphene Nanocomposite for Photodegradation of Organic Dyes.
AIP Advances 2015, 5, 127219.
39. Miao, Y.; Zhang, H.; Yuan, S.; Jiao, Z.; Zhu, X., Preparation of Flower-Like ZnO
Architectures Assembled with Nanosheets for Enhanced Photocatalytic Activity. Journal of
Colloid and Interface Science 2016, 462, 9-18.
40. Gayathri, S.; Jayabal, P.; Kottaisamy, M.; Ramakrishnan, V., Synthesis of ZnO Decorated
Graphene Nanocomposite for Enhanced Photocatalytic Properties. Journal of Applied Physics
2014, 115, 173504.
41. Jayabal, P.; Gayathri, S.; Sasirekha, V.; Mayandi, J.; Ramakrishnan, V., Preparation and
Characterization of ZnO/Graphene Nanocomposite for Improved Photovoltaic Performance.
Journal of Nanoparticle Research 2014, 16, 2640.
42. Fu, D.; Han, G.; Yang, F.; Zhang, T.; Chang, Y.; Liu, F., Seed-Mediated Synthesis and the
Photo-Degradation Activity of ZnO–Graphene Hybrids Excluding the Influence of Dye
Adsorption. Applied Surface Science 2013, 283, 654-659.
43. Fu, D.; Han, G.; Meng, C., Size-Controlled Synthesis and Photocatalytic Degradation
Properties of Nano-Sized Zno Nanorods. Materials Letters 2012, 72, 53-56.
44. Kaur, A.; Ibhadon, A. O.; Kansal, S. K., Photocatalytic Degradation of Ketorolac
Tromethamine Using Ag-Doped Zno Microplates. Journal of Materials Science 2017, 1-12.
45. Zhou, H.; Zhang, H.; Wang, Y.; Miao, Y.; Gu, L.; Jiao, Z., Self-Assembly and Template-Free
Synthesis of ZnO Hierarchical Nanostructures and Their Photocatalytic Properties. Journal of
Colloid and Interface Science 2015, 448, 367-373.
46. Yang, F.; Han, G.; Fu, D.; Chang, Y.; Wang, H., Improved Photodegradation Activity of TiO2
Via Decoration with SnS2 Nanoparticles. Materials Chemistry and Physics 2013, 140, 398-404.
47. Fu, Y.; Wang, X., Magnetically Separable ZnFe2O4–Graphene Catalyst and Its High
Photocatalytic Performance under Visible Light Irradiation. Industrial & Engineering Chemistry
Research 2011, 50, 7210-7218.

130
48. Fu, Y.; Chen, Q.; He, M.; Wan, Y.; Sun, X.; Xia, H.; Wang, X., Copper Ferrite-Graphene
Hybrid: A Multifunctional Heteroarchitecture for Photocatalysis and Energy Storage. Industrial &
Engineering Chemistry Research 2012, 51, 11700-11709.
49. Gao, E.; Wang, W.; Shang, M.; Xu, J., Synthesis and Enhanced Photocatalytic Performance of
Graphene-Bi2WO6 Composite. Physical Chemistry Chemical Physics 2011, 13, 2887-2893.
50. Ibhadon, A. O.; Greenway, G. M.; Yue, Y., Photocatalytic Activity of Surface Modified
TiO2/RuO2/SiO2 Nanoparticles for Azo-Dye Degradation. Catalysis Communications 2008, 9,
153-157.
51. Tian, J.; Hu, X.; Wei, N.; Zhou, Y.; Xu, X.; Cui, H.; Liu, H., RuO2/TiO2 Nanobelt
Heterostructures with Enhanced Photocatalytic Activity and Gas-Phase Selective Oxidation of
Benzyl Alcohol. Solar Energy Materials and Solar Cells 2016, 151, 7-13.
52. Liang, Y.; Wang, H.; Sanchez Casalongue, H.; Chen, Z.; Dai, H., TiO2 Nanocrystals Grown
on Graphene as Advanced Photocatalytic Hybrid Materials. Nano Research 2010, 3, 701-705.
53. Lin, X.; Rong, F.; Ji, X.; Fu, D., Visible Light Photocatalytic Activity and
Photoelectrochemical Property of Fe-Doped TiO2 Hollow Spheres by Sol–Gel Method. Journal of
Sol-Gel Science and Technology 2011, 59, 283-289.
54. Zhang, X. Y.; Li, H. P.; Cui, X. L.; Lin, Y., Graphene/ TiO2 Nanocomposites: Synthesis,
Characterization and Application in Hydrogen Evolution from Water Photocatalytic Splitting.
Journal of Materials Chemistry 2010, 20, 2801-2806.
55. Williams, G.; Seger, B.; Kamat, P. V., TiO2-Graphene Nanocomposites. Uv-Assisted
Photocatalytic Reduction of Graphene Oxide. ACS Nano 2008, 2, 1487-1491.
56. Fan, W.; Lai, Q.; Zhang, Q.; Wang, Y., Nanocomposites of TiO2 and Reduced Graphene Oxide
as Efficient Photocatalysts for Hydrogen Evolution. The Journal of Physical Chemistry C 2011,
115, 10694-10701.
57. Xie, S.; Zhang, Q.; Liu, G.; Wang, Y., Photocatalytic and Photoelectrocatalytic Reduction of
CO2 Using Heterogeneous Catalysts with Controlled Nanostructures. Chemical Communications
2016, 52, 35-59.
58. Riga, J.; Tenret-Noël, C.; Pireaux, J. J.; Caudano, R.; Verbist, J. J.; Gobillon, Y., Electronic
Structure of Rutile Oxides TiO2 , RuO2 and IrO2 Studied by X-Ray Photoelectron Spectroscopy.
Physica Scripta 1977, 16, 351.
59. Schafranek, R.; Schaffner, J.; Klein, A., In Situ Photoelectron Study of the (Ba,Sr)TiO3/RuO2
Contact Formation. Journal of the European Ceramic Society 2010, 30, 187-192.
131
60. Uddin, M. T.; Nicolas, Y.; Olivier, C.; Toupance, T.; Müller, M. M.; Kleebe, H. J.; Rachut, K.;
Ziegler, J.; Klein, A.; Jaegermann, W., Preparation of RuO2/TiO2 Mesoporous Heterostructures
and Rationalization of Their Enhanced Photocatalytic Properties by Band Alignment
Investigations. The Journal of Physical Chemistry C 2013, 117, 22098-22110.
61. Blondeel, G.; Harriman, A.; Porter, G.; Urwin, D.; Kiwi, J., Design, Preparation and
Characterization of Ruthenium Dioxide/Titanium Dioxide Catalytic Surfaces Active in
Photooxidation of Water. The Journal of Physical Chemistry 1983, 87, 2629-2636.
62. Hummers, W. S., Jr.; Offeman, R. E., Preparation of Graphitic Oxide. Jurnal of American
Chemical Society. 1958, 80, 1339.
63. Zhang, J.; Xiong, Z.; Zhao, X. S., Graphene-Metal-Oxide Composites for the Degradation of
Dyes under Visible Light Irradiation. Journal of Materials Chemistry 2011, 21, 3634-3640.
64. Shen, B.; Zhang, X.; Guo, R.; Lang, J.; Chen, J.; Yan, X., Carbon Encapsulated RuO2 Nano-
Dots Anchoring on Graphene as an Electrode for Asymmetric Supercapacitors with Ultralong
Cycle Life in an Ionic Liquid Electrolyte. Journal of Materials Chemistry A 2016, 4, 8180-8189.
65. Korotcov, A. V.; Huang, Y. S.; Tiong, K. K.; Tsai, D. S., Raman Scattering Characterization
of Well-Aligned RuO2 and IrO2 Nanocrystals. Journal of Raman Spectroscopy 2007, 38, 737-749.
66. Huang, Y. S.; Liao, P. C., Preparation and Characterization of RuO2 Thin Films. Solar Energy
Materials and Solar Cells 1998, 55, 179-197.
67. Arsov, L. D.; Kormann, C.; Plieth, W., Electrochemical Synthesis and in Situ Raman
Spectroscopy of Thin Films of Titanium Dioxide. Journal of Raman Spectroscopy 1991, 22, 573-
575.
68. Rao, R.; Podila, R.; Tsuchikawa, R.; Katoch, J.; Tishler, D.; Rao, A. M.; Ishigami, M., Effects
of Layer Stacking on the Combination Raman Modes in Graphene. ACS Nano 2011, 5, 1594-1599.
69. Kudin, K. N.; Ozbas, B.; Schniepp, H. C.; Prud'homme, R. K.; Aksay, I. A.; Car, R., Raman
Spectra of Graphite Oxide and Functionalized Graphene Sheets. Nano Letters 2008, 8, 36-41.
70. Soin, N.; Roy, S. S.; Mitra, S. K.; Thundat, T.; McLaughlin, J. A., Nanocrystalline Ruthenium
Oxide Dispersed Few Layered Graphene Nanoflakes as Supercapacitor Electrodes. Journal of
Materials Chemistry 2012, 22, 14944-14950.
71. Morgan, D. J., Resolving Ruthenium: XPS Studies of Common Ruthenium Materials. Surface
and Interface Analysis 2015, 47, 1072-1079.
72. Foelske, A.; Barbieri, O.; Hahn, M.; Kötz, R., An X-Ray Photoelectron Spectroscopy Study of
Hydrous Ruthenium Oxide Powders with Various Water Contents for Supercapacitors.
Electrochemical and Solid-State Letters 2006, 9, A268-A272.

132
73. Kim, Y. J.; Gao, Y.; Chambers, S. A., Core-Level X-Ray Photoelectron Spectra and X-Ray
Photoelectron Diffraction of RuO2 (110) Grown by Molecular Beam Epitaxy on TiO2 (110).
Applied Surface Science 1997, 120, 250-260.
74. Ok-Kyung, P.; Yong-Mun, C.; Jun Yeon, H.; Cheol-Min, Y.; Tea-Wook, K.; Nam-Ho, Y.; Hye
Young, K.; Joong Hee, L.; Bon-Cheol, K.; Munju, G., Defect Healing of Reduced Graphene Oxide
Via Intramolecular Cross-Dehydrogenative Coupling. Nanotechnology 2013, 24, 185604.
75. Zhang, H.; Xu, P.; Du, G.; Chen, Z.; Oh, K.; Pan, D.; Jiao, Z., A Facile One-Step Synthesis of
TiO2/Graphene Composites for Photodegradation of Methyl Orange. Nano Research 2011, 4, 274-
283.
76. Jiao, Z.; Chen, T.; Xiong, J.; Wang, T.; Lu, G.; Ye, J.; Bi, Y., Visible-Light-Driven
Photoelectrochemical and Photocatalytic Performances of Cr-Doped SrTiO3/TiO2
Heterostructured Nanotube Arrays. Scientific Reports 2013, 3, 2720.
77. Štengl, V.; Grygar, T. M., The Simplest Way to Iodine-Doped Anatase for Photocatalysts
Activated by Visible Light. International Journal of Photoenergy 2011, 2011, 13.
78. Jahan, F.; Islam, M. H.; Smith, B. E., Band Gap and Refractive Index Determination of Mo-
Black Coatings Using Several Techniques. Solar Energy Materials and Solar Cells 1995, 37, 283-
293.
79. El-Tantawy, F.; Al-Ghamdi, A. A.; Al-Ghamdi, A. A.; Al-Turki, Y. A.; Alshahrie, A.; Al-
Hazmi, F.; Al-Hartomy, O. A., Optical Properties of Nanostructured Ruthenium Dioxide Thin
Films Via Sol–Gel Approach. Journal of Materials Science: Materials in Electronics 2016, 1-8.
80. López, R.; Gómez, R., Band-Gap Energy Estimation from Diffuse Reflectance Measurements
on Sol–Gel and Commercial TiO2: A Comparative Study. Journal of Sol-Gel Science and
Technology 2012, 61, 1-7.
81. Shao, X.; Lu, W.; Zhang, R.; Pan, F., Enhanced Photocatalytic Activity of TiO2-C Hybrid
Aerogels for Methylene Blue Degradation. Scientific Reports 2013, 3, 3018.
BIOGRAPHICAL SKETCH
Wijayantha Asanga Perera was born in Kandy, Sri Lanka in 1984, son to Neel Perera and Jayanthi
Herath. He obtained his Bachelor’s degree in Chemistry (Hons) with Physics and Mathematics
from University of Peradeniya in 2009. Then he started his higher studies in Post Graduate Institute
of Science in University of Peradeniya and he earned his Master’s degree in Nanoscience and
Nanotechnology in 2012. During this time he worked as an assistant lecturer in Physics department
for undergraduate students. In fall 2012, he entered The University of Texas at Dallas to pursue
the degree of Doctor of Philosophy in Chemistry under the supervision of Prof. Kenneth J. Balkus,
Jr. His research was focused on “metal oxide-carbon nanocomposites for energy storage and
conversion.”

CURRICULUM VITAE
Wijayantha A. Perera
2200 Waterview Pkwy, 27210, Richardson, TX, 75080
https://www.linkedin.com/in/wijayanthaperera
(972) 876-6803
MATERIALS CHEMIST
Enthusiastic, goal-oriented scientist with excellent technical and nontechnical skills
Motivated chemist with interdisciplinary research experiences. Thrives in fast-paced
environments. Good interpersonal skills, and can work independently or as part of a team.
Reliable and energetic. Clear oral and written communication skills. Critical thinker with the
ability to develop innovative solutions. Quick learner with the desire to work in any field to gain
experience with scientific knowledge and skills in inorganic chemistry, analytical chemistry,
nanoscience and nanotechnology.
Certified User of Cleanroom Class 10,000 | HR-TEM | TEM-EDX | SEM | XRD | FTIR | Raman
| UV-Vis | Fluorescence | PLD | TGA | CV | HPLC | HPLC-MS | LC-MS | GC-MS |
PROFESSIONAL EXPERIENCE
University of Texas at Dallas, Texas
2012-2017 (May)
Graduate Assistant, Advisor: Prof. Kenneth J. Balkus, Jr.
Developed high efficient photocatalytic composite materials for water purification and
degradation of organic dyes by sequential synthesis of titanium oxide nanotubes, ruthenium
oxide nanoribbons and hydrothermally reduced graphene oxide.
Conducted sequential hydrothermal synthesis of composites to enhance photocatalytic
efficiency.
Designed, synthesized and conducted photochemical reaction to evaluate the
photocatalytic activity.
Developed a novel methodology to prepare sodium niobate nanotubes and nanorods. Designed,
synthesized and evaluated the sodium niobate nanotubes and nanorods composite materials with
graphene, graphene oxide and carbon nanotubes. Fabricated device prototypes using the
materials developed and evaluated the electrochemical properties.

Synthesized composite materials using hydrothermal synthesis.
Studied the structural and electrochemical behavior of nanostructures.
Designed and fabricated devices to analyze electrochemical performance using cyclic
voltammetry, charge/discharge characteristics and impedance spectroscopy.
Developed a new synthetic method to prepare different morphologies of ruthenium oxide
nanostructures to enhance the pseudocapacitive properties of supercapacitors (nanoribbons,
quantum dots).
Developed composite electrode with carbon nanotubes.
Developed a novel technology to decorate ruthenium oxide quantum dots on vanadium
oxide nanowires for high performance supercapacitor.
Studied the surface modification of vanadium oxide nanowires and carbon materials
for supercapacitor electrodes using ruthenium oxide quantum dots.
Developed novel methods to prepare pseudocapacitive carbon nanofibers by electrospinning
polymer solution polyacrylonitrile (PAN) with different metal oxide and nitride nanostructures.
In addition to the thesis projects mentored undergraduate students by teaching lab skills and
chemical concepts. Also conducted regular maintenance and repairing of lab equipment. Served
as the laboratory manager to get quotations and order laboratory supplies.
Post-Graduate Institute of Science, University of Peradeniya, Sri Lanka
2011-2012 Assistant Lecturer
Conducted nanoscience and nanotechnology laboratory courses (CHN 507 and CHN 508).
Post-Graduate Institute of Science, University of Peradeniya, Sri Lanka
2010-2012 Post-Graduate Researcher, Advisor: Prof. R.M.G. Rajapakse
Synthesized hydroxyapatite nanoparticles and investigated their mechanical properties for bio-
active prosthesis.
Department Of Physics, University Of Peradeniya, Sri Lanka
2010-2012 Assistant Lecturer
Instructed sophomore, junior and honors physics laboratory courses (PH103, PH204 and PH348)
through preparing and leading lab experiments, grading, and holding office hours.

SKILLS
Synthesis, nanofabrication, prototype fabrication and characterization of nanomaterials.
Characterization and laboratory techniques – Certified and trained to use cleanroom class
10,000 | Transmission electron microscopy | transmission electron microscopy-EDX | scanning
electron microscopy | X-ray diffraction spectroscopy | Raman spectroscopy | Fourier transform
infrared spectroscopy | Ultraviolet–visible spectroscopy | Pulsed laser deposition |
Thermogravimetric analysis |
Software – MS Office | OrginLab | Scifinder | ChemDraw | Crystal Maker | Material Studio |
Jade 9 | 3D Modeling with Autodesk Fusion 360 | Sketchup 2015
EDUCATION
PhD. Chemistry, Material Science.
2012-2016 University of Texas at Dallas, TX
M.S. Nanoscience and Nanotechnology
2010-2012 Post Graduate Institute of Science, University of Peradeniya
PROFESSIONAL AFFILIATIONS AND ACTIVITIES
Research collaborator at Laboratory for Surface and Nanostructure Modification, Department of
Material Science and Engineering, University of Texas at Dallas.
2012 – present Research collaborator at the Alan G. MacDiarmid Nanotech Institute, University of Texas at
Dallas.
2012 - present Member of the American Chemical Society, ACS Division of Inorganic Chemistry.
2012 - present Vice President of Sri Lankan Students’ Association, University of Texas at Dallas.
2014 - present

PUBLICATIONS
1) Wijayantha A. Perera, Yuzhi Gao, John Ferraris, Yves Chabal, Kenneth Balkus Jr.
“Hydrothermal synthesis of TiO2 nanotube (TNT)/ RuO2 nanoribbons (NRs)/ Graphene
composite for enhanced photocatalytic activity for water purification”. Manuscript
submitted.
2) Wijayantha A. Perera, Imalka Munaweera, Michel Trinh, Yuzhi Gao, John Ferraris, Yves
Chabal, Kenneth Balkus Jr. “Binder free Graphene–Sodium niobate nanotubes/ nano-rods
composite electrodes for supercapacitors”, ACS Appl. Mater. Interfaces, 2015, Manuscript
submitted.
3) Wijayantha A. Perera, Yuzhi Gao, John Ferraris, Yves Chabal, Kenneth Balkus Jr.
“Ruthenium Oxide nanoribbons for the supercapacitors” Manuscript submitted.
4) Wijayantha A. Perera, Yuzhi Gao, John Ferraris, Yves Chabal, Kenneth Balkus Jr. “RuO2
quantum dot decorated V2O5 nanowires for high performance supercapacitors”.
Manuscript submitted.
5) Zijie Wang, Wijayantha A. Perera, Sahila Perananthan, John P. Ferraris, and Kenneth J.
Balkus, Jr.*. Lanthanum Oxide Nanorod Templated Graphitic Hollow Carbon Nanorods
for Supercapacitors. ACS Energy Letters. In review.
6) Nimali C. Abeykoon, Velia Garcia, Rangana A. Jayawickramage, Wijayantha Perera,
Jeremy Cure, Yves J. Chabal,,Kenneth J. Balkus, Jr. and John P. Ferraris*, Novel binder-free
electrode materials for supercapacitors utilizing high surface area carbon nanofibers
derived from incompatible polymer blends of PBI/6FDA-DAM:DABA, RSC Advances,
2017, 7, 20947–20959.

Wijayantha A. Perera [email protected]
CONFERENCE PROCEEDING – RESEARCH PRESENTATIONS
W. A. Perera, K. J. Balkus Jr .; “ High surface area electrodes for supercapacitors using
polyacrylonitrile, tetracyanobenzene with the presence of zinc chloride” 46th ACS DFW Meeting
in Miniature, University of A&M (April 2013, Dallas TX)
W. A. Perera, K. J. Balkus Jr .; “ Niobium Oxide nanowire – Graphene binder free
nanocomposite flexible paper electrode for supercapacitors” ACS Southwest Regional Meeting
(November 2013, Waco, Dallas TX)
W. A. Perera, K. J. Balkus Jr .; “High surface area and redox active electrodes for
supercapacitors using lithium phthalocyanine and zinc phthalocyanine” 247th ACS National
Meeting and Exposition (March 2014, Dallas TX)
W. A. Perera, K. J. Balkus Jr .; “ Binder free graphene- sodium niobate naanotubes/ nanorods
composite electrodes for supercapacitors” ACS Southwest Regional Meeting (November 2014,
Fort Worth TX)
W. A. Perera, K. J. Balkus Jr .; “TiO2 nanotube/ RuO2 nanoribbons/ hGO composite for
photocatalytic activity” The International Chemical Congress of Pacific Basin Societies 2015
(December 2015, Honolulu, Hawaii)
Recommended