EVOLUTION AND APPLICATION OF URBAN WATERSHED MANAGEMENT PLANNING
Melissa L. Mika
Thesis submitted to the faculty of the Virginia Polytechnic Institute and State University in partial fulfillment of the requirements for the degree of
Master of Science In
Civil Engineering
Randel L. Dymond, Chair
Clayton C. Hodges
Kevin D. Young
December 18, 2017 Blacksburg, VA
Keywords: watershed management, master planning, urban municipality, adaptive management, stormwater
EVOLUTION AND APPLICATION OF URBAN WATERSHED MANAGEMENT PLANNING
Melissa L. Mika
ACADEMIC ABSTRACT
The development of Watershed Management Plans (WMPs) in urban areas aids municipalities in
allocating resources, engaging the public and stakeholders, addressing water quality regulations,
and mitigating issues related to stormwater runoff and flooding. In this study, 63 urban WMPs
across the nation were reviewed to characterize historical approaches and identify emerging
trends in watershed planning. Planning methods and tools were qualitatively evaluated, followed
by statistical analyses to identify correlations between planning factors. Plans developed by a
municipality or consultant were correlated to higher occurrences of hydrologic modeling and
site-specific recommendations, and lower occurrences of characterizing social watershed factors.
Trends in the use and selection of hydrologic, hydraulic, and pollutant load models were
identified, specifically in the past decade. Project prioritization was found to increasingly focus
on feasibility in implementation. Additional qualitative trends identified include an increased
focus on water quality and interdisciplinary studies, public participation, responsiveness to water
quality regulations, and risk aversion. The study concludes by envisioning future watershed
planning trends. This state of the practice review of planning efforts, innovation in
implementation, and the adoption of emergent technologies will aid future planners in employing
current tools and strategies in the development of new WMPs.
EVOLUTION AND APPLICATION OF URBAN WATERSHED MANAGEMENT PLANNING
Melissa L. Mika
PUBLIC ABSTRACT
Watershed-based management has long been used as the preferred approach for protection of
water resources at a hydrologic, ecological, and social level. The development of Watershed
Management Plans (WMPs) in urban areas aids municipalities in allocating resources, engaging
the public and stakeholders, addressing water quality regulations, and mitigating issues related to
stormwater runoff and flooding. The processes and tools used in watershed management
planning are ever-evolving based on improved technologies, changing regulations, and social
trends. In this study, 63 urban WMPs across the nation were reviewed to characterize historical
approaches as well as identify emerging trends in watershed planning. Planning methods, tools
of analysis, and recommended strategies were qualitatively evaluated to determine trends in the
planning process, followed by statistical analyses to identify correlations between planning
factors and methodologies. Plans developed by a municipality or consultant were correlated to
higher occurrences of hydrologic modeling and site-specific recommendations, and lower
occurrences of characterizing social watershed factors. Trends in the use and selection of
hydrologic, hydraulic, and pollutant load models were identified, specifically in the past decade.
Project prioritization was found to increasingly focus on feasibility in implementation. Other
qualitative trends identified include an increased focus on water quality and interdisciplinary
studies, public participation, responsiveness to water quality regulations, and risk aversion. The
study concludes by envisioning future watershed planning trends. This state of the practice
review of planning efforts, innovation in implementation, and the adoption of emergent
technologies will aid future planners in employing current tools and strategies in the
development of new WMPs.
iv
ACKNOWLEDGEMENTS Many thanks go out to the Virginia Tech faculty and community for their support in completing
this thesis. In particular, I want to thank Randy Dymond for serving as my committee chair, and
for guiding me and for pushing me to give my best. I would also like to thank my committee
members, Clay Hodges and Kevin Young, for their help and feedback.
Outside of my committee, I extend my sincerest gratitude to Marcus Aguilar for his significant
contributions in not only his insight and help in completing this thesis, but also his mentorship
and guidance. I would also like to thank the other members of my research group for their
encouragement, support, and “coffee and gossip”. Lastly, thank you to my friends and family for
supporting me in my endeavors and for lending an ear when I need it most.
v
TABLE OF CONTENTS
List of Figures ............................................................................................................................... vii
List of Tables ............................................................................................................................... viii
List of Abbreviations ..................................................................................................................... ix
1 Introduction ............................................................................................................................. 1
1.1 Background ..................................................................................................................... 1
1.2 Problem Statement and Objectives ................................................................................. 2
2 Literature Review .................................................................................................................... 4
2.1 History of Watershed Management ................................................................................ 4
2.2 Benefits of Watershed Management ............................................................................... 6
2.3 Watershed Management Planning .................................................................................. 7
2.3.1 Definition ................................................................................................................ 7
2.3.2 Scope ....................................................................................................................... 8
2.3.3 Planning Protocols .................................................................................................. 9
2.3.4 Shortcomings and Limitations .............................................................................. 10
2.3.5 Adaptive Management .......................................................................................... 11
3 Evolution and Application of Urban Watershed Management Planning .............................. 13
3.1 Introduction ................................................................................................................... 13
3.2 Analytical Methods ....................................................................................................... 15
3.2.1 Database Development ......................................................................................... 15
3.2.2 Statistical Analysis ................................................................................................ 17
3.3 Summary of Statistical Results ..................................................................................... 19
3.4 Study Results and Discussion ....................................................................................... 22
3.4.1 Initial Planning Steps ............................................................................................ 22
vi
3.4.2 Data Acquisition ................................................................................................... 26
3.4.3 Tools for Watershed Assessment .......................................................................... 28
3.4.4 Project Implementation ......................................................................................... 35
3.4.5 Emerging Trends in Watershed Management Planning ....................................... 37
3.5 Conclusions and Implications ....................................................................................... 40
4 Conclusion ............................................................................................................................ 42
4.1 Implications ................................................................................................................... 42
4.2 Future Work .................................................................................................................. 42
4.3 Final Words ................................................................................................................... 43
References ..................................................................................................................................... 44
Appendix A – List of 63 Study WMPs ......................................................................................... 54
Appendix B – Template for Qualitative Review .......................................................................... 59
Appendix C – Sample of Study Database (n=124) ....................................................................... 60
vii
LIST OF FIGURES
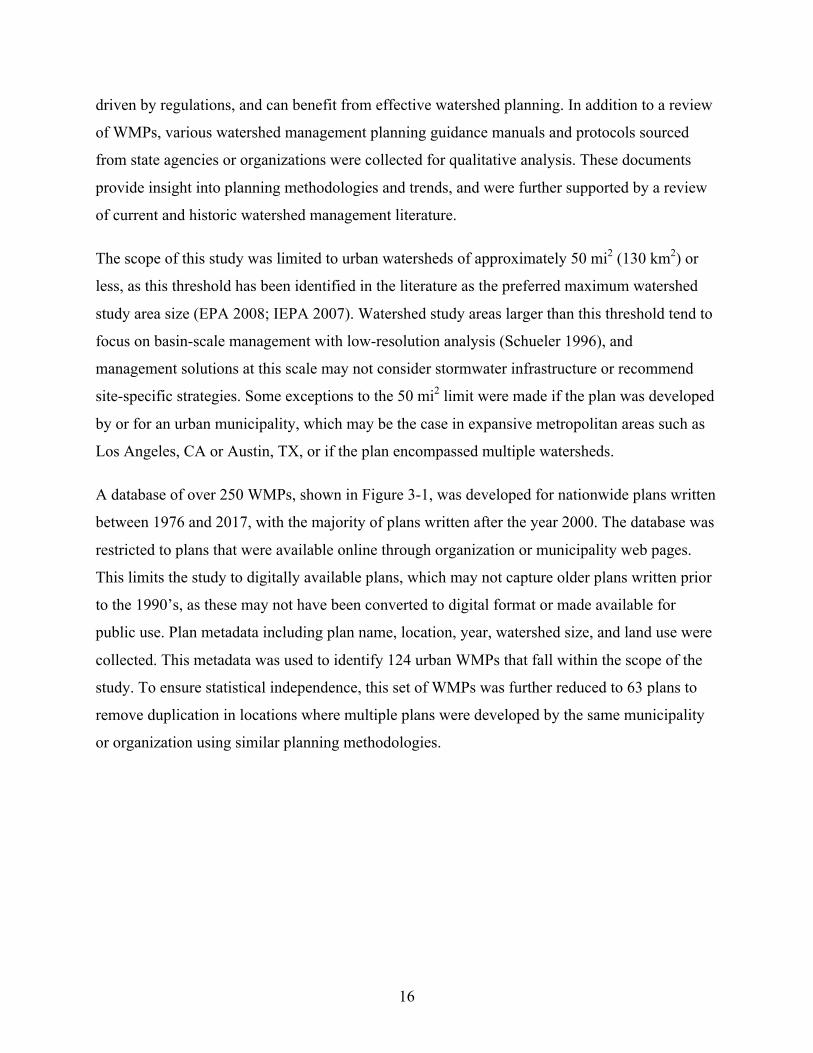
Figure 3-1: Approximate geographic location of all watershed management
plans (WMPs) collected. WMPs within the scope of the study (n=124)
are indicated by a darker shade. ............................................................................................ 17
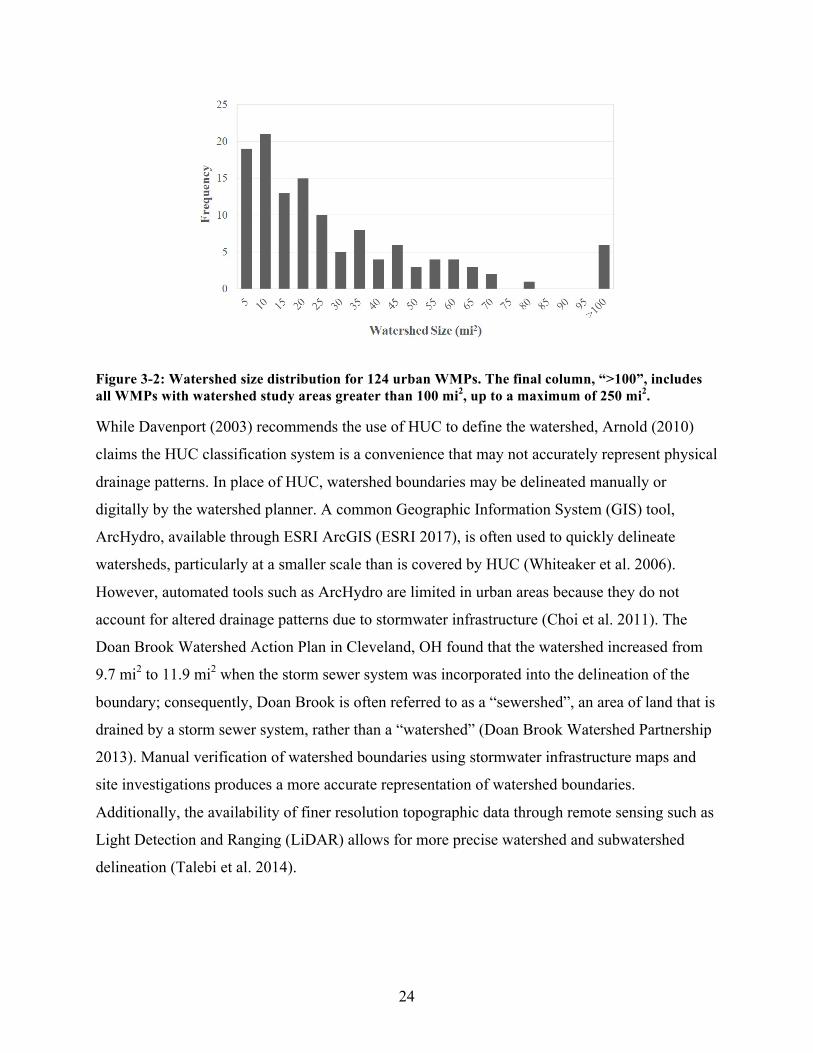
Figure 3-2: Watershed size distribution for 124 urban WMPs. The final
column, “>100”, includes all WMPs with watershed study areas greater
than 100 mi2, up to a maximum of 250 mi2. ......................................................................... 24
Figure 3-3: Frequency of WMP development plotted with the number of
TMDLs issued nationwide, by year. Number of WMPs include all
WMPs within the scope of the study (n=124). Number of TMDLs does
not refer to number of impaired water bodies; there may be multiple
TMDLs issued for a single water body in a given year (EPA 2017b). ................................. 39
viii
LIST OF TABLES
Table 2-1: “Nine Key Elements” of watershed planning required by the EPA for plans funded by
Section 319 Nonpoint Source Grants to States and Territories. ........................................... 10
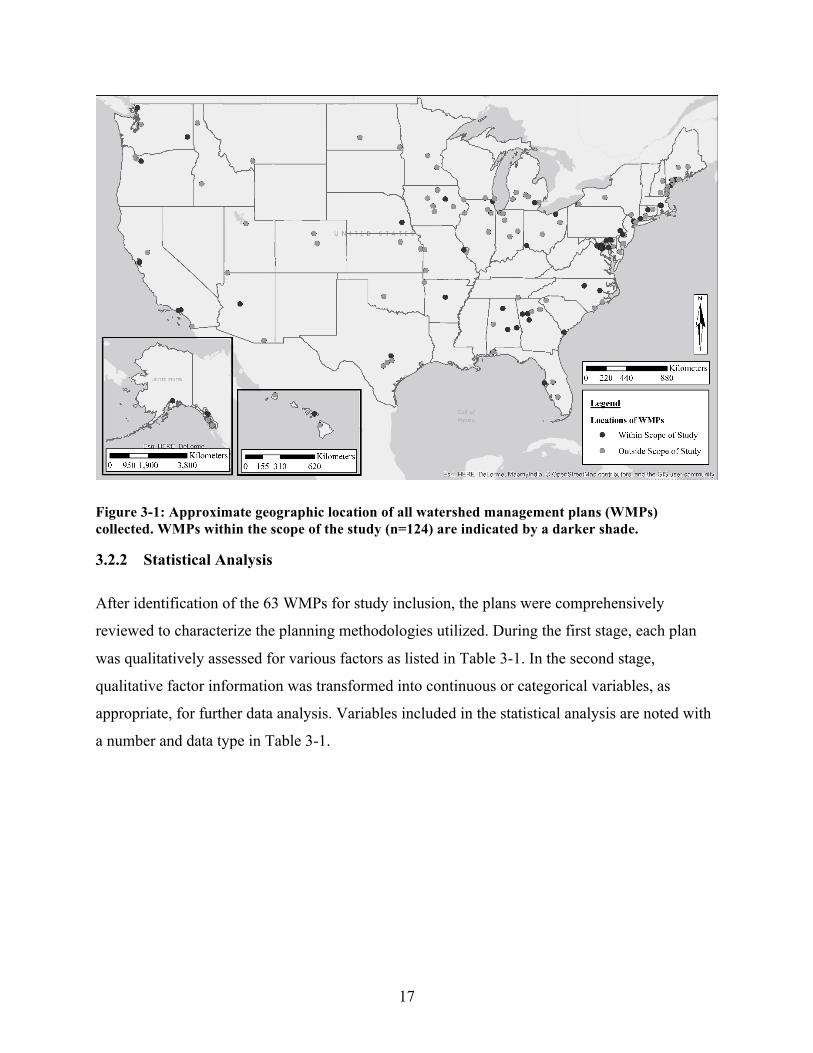
Table 3-1: Study factors for WMP analysis. Factors are categorized into Metadata, Watershed,
and Planning Methodology. Data type describes the type of statistical variable, where
“N/A” is for factors that were only qualitatively reviewed or not included in the statistical
analysis. “Dichotomous” variables refer to “Yes” or “No” conditions. ............................... 18
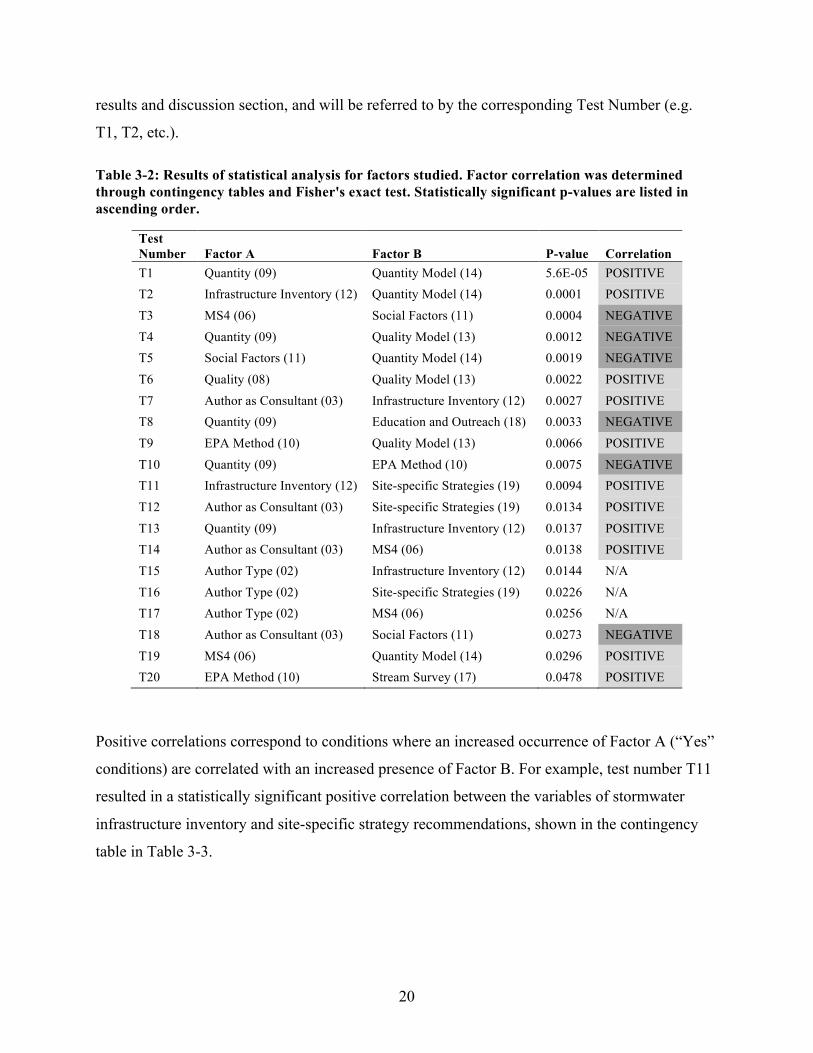
Table 3-2: Results of statistical analysis for factors studied. Factor correlation was determined
through contingency tables and Fisher's exact test. Statistically significant p-values are
listed in ascending order. ...................................................................................................... 20
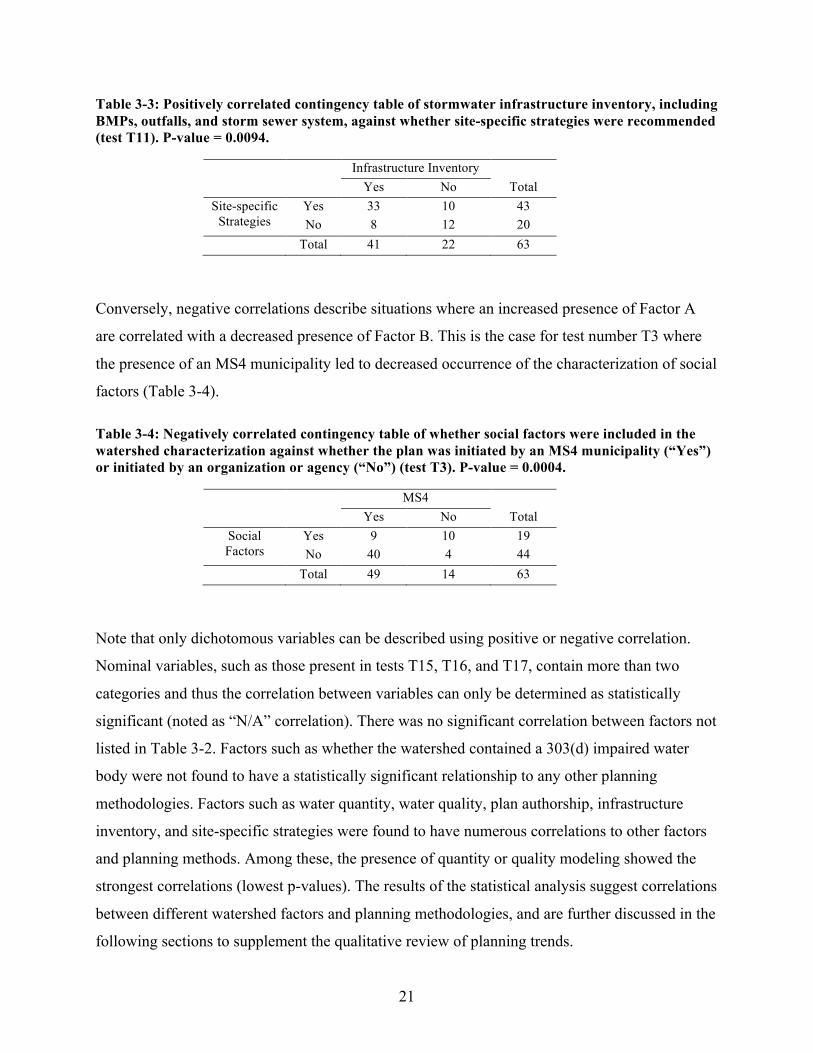
Table 3-3: Positively correlated contingency table of stormwater infrastructure inventory,
including BMPs, outfalls, and storm sewer system, against whether site-specific strategies
were recommended (test T11). P-value = 0.0094. ................................................................ 21
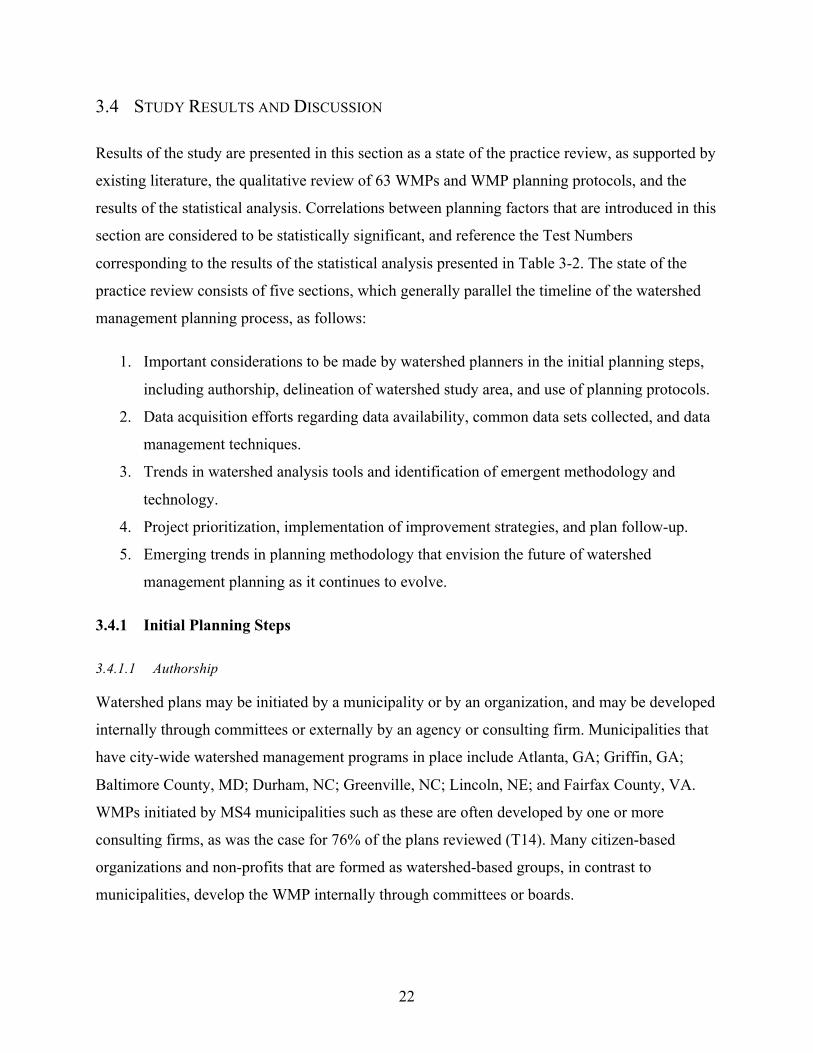
Table 3-4: Negatively correlated contingency table of whether social factors were included in the
watershed characterization against whether the plan was initiated by an MS4 municipality
(“Yes”) or initiated by an organization or agency (“No”) (test T3). P-value = 0.0004. ....... 21
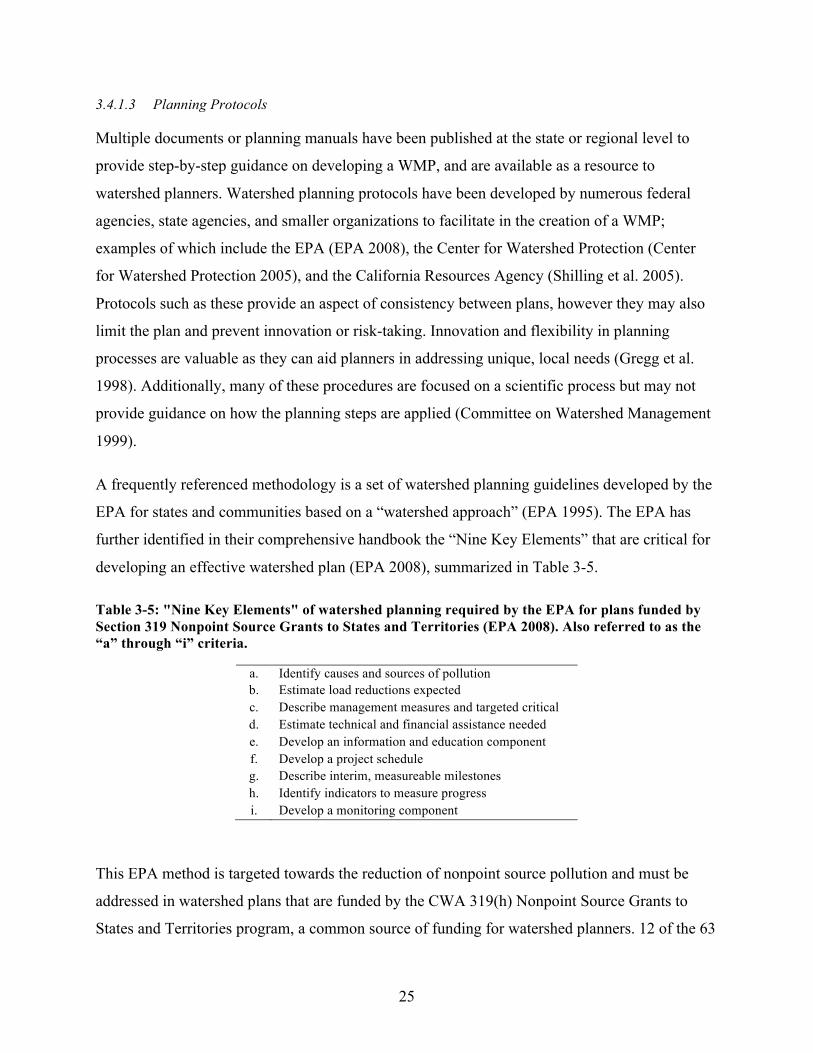
Table 3-5: "Nine Key Elements" of watershed planning required by the EPA for plans funded by
Section 319 Nonpoint Source Grants to States and Territories (EPA 2008). Also referred to
as the “a” through “i” criteria. ............................................................................................... 25
Table 3-6: Frequency and type of hydrologic/hydraulic models used in WMPs over time (in 5-
year periods). Note that some WMPs may utilize a combination of multiple models. ........ 29
Table 3-7: Frequency and type of pollutant loading models used by WMPs over time (in 5-year
periods). Model types are separated into calculation-based approximations, spreadsheet-
based models, or GIS-based models. “Percent” indicates the percentage of WMPs that used
a pollutant load model out of all WMPs. .............................................................................. 32
ix
LIST OF ABBREVIATIONS
BEHI
Bank Erosion Hazard Index, 33, 34
BMPs
Best Management Practices, viii, 12, 21,
29, 31, 35, 56
CCTV
Closed-Circuit Television, 27
CSOs
Combined Sewer Overflows, 30
CWA
Clean Water Act, 6, 10, 26
CWP
Center for Watershed Protection, 9
DCIA
Directly Connected Impervious Area, 34
EIA
Effective Impervious Area, 34
EPA
U.S. Environmental Protection Agency,
vii, viii, 1, 5, 6, 7, 9, 10, 11, 13, 14, 16,
18, 19, 20, 23, 25, 26, 27, 31, 33, 39, 40
GIS
Geographic Information System, viii, 18,
24, 26, 27, 28, 31, 32, 33, 34, 41
GPS
Global Positioning System, 27, 33
HEC
Hydrologic Engineering Center
(USACE), 29, 30, 40
HSPF
Hydrological Simulation Program -
Fortran, 30, 31
HUC
Hydrologic Unit Code, 8, 9, 23, 24
IC
Impervious Cover, 35
ICM
Impervious Cover Model, 34
IEPA
Illinois Environmental Protection Agency,
8, 9, 16, 24
ILLUDAS
Illinois Urban Drainage Simulator, 30
LiDAR
Light Detection and Ranging, 25
LSPC
Loading Simulation Program in C++, 29,
32
x
MS4
Municipal Separate Storm Sewer System,
viii, 1, 2, 3, 14, 15, 18, 19, 20, 21, 22,
23, 30, 38, 39
NPDES
National Pollutant Discharge Elimination
System, 30, 38
NRCS
Natural Resources Conservation Service,
5, 9
PSRM
Penn State Runoff Model, 29, 30
RSAT
Rapid Stream Assessment Technique, 33
SCS
Soil Conservation Service, 13
SLAMM
Source Loading and Management Model,
31
STEPL
Spreadsheet Tool for Estimating Pollutant
Loads, 32
SVAP
Stream Visual Assessment Protocol, 33
SWAT
Soil and Water Assessment Tool, 29, 32
SWMM
Storm Water Management Model, 29, 30,
32, 40
TIA
Total Impervious Area, 34
TMDL
Total Maximum Daily Load, 14, 30, 35,
39
TVA
Tennessee Valley Authority, 5
USACE
U.S. Army Corps of Engineers, 29
USDA
U.S. Department of Agriculture, 11, 29,
33, 53
USGS
U.S. Geological Survey, 8, 23
WAM
Watershed Analysis and Management, 10,
11
WIP
Watershed Implementation Plan, 6
WMP
Watershed Management Plan, vii, viii, 1,
2, 8, 9, 10, 11, 13, 15, 18, 22, 23, 25,
28, 29, 35, 37, 39
1
1 INTRODUCTION
1.1 BACKGROUND
Urban localities with a municipal separate storm sewer system (MS4), a stormwater conveyance
system permit administered by the U.S. Environmental Protection Agency (EPA), are required to
implement specific minimum control measures to reduce pollutants entering receiving water
bodies to mitigate the effects of urbanization. One proactive approach to meeting these
regulatory requirements and improving the hydrologic and ecologic functions of an urbanized
watershed is through watershed management planning. Watershed management planning is
defined by the EPA as a “strategy that provides assessment and management information for a
geographically defined watershed, including the analyses, actions, participants, and resources
related to developing and implementing the plan” (EPA 2008). It is a comprehensive planning
mechanism to guide public policy by assessing the existing hydrologic and ecologic conditions
of a watershed. The planning process culminates in the development of a watershed-based plan,
henceforth referred to as a Watershed Management Plan (WMP), which encompasses an array of
similar plans of differing terminologies, including but not limited to: Watershed Master Plan,
Watershed Based Plan, Watershed Protection Plan, and Watershed Action Plan. The general
procedure towards developing a WMP consists of establishing partnerships and setting plan
goals; watershed characterization and analysis; implementation of recommended solutions;
followed by evaluation, monitoring, and progress measurement (Davenport 2003; Doerfer and
Urbonas 2004; EPA 2008). WMPs are a useful tool for municipalities because they can help
prioritize areas within the watershed where improvement strategies could be implemented.
Improvement strategies may be in the form of grey infrastructure, such as culvert or pipe
improvements, green infrastructure, such as detention ponds and stream restorations, or other
non-structural management strategies such as public outreach and education.
Watershed-based management is a concept that was first proposed in 1878 by John Wesley
Powell, and it has been used in practice since the early 1900’s (Gregg et al. 1998). Watershed-
based management was historically a top-down approach, and has since evolved into a more
bottom-up process that values local participation (Western Water Policy Review Advisory
Commission 1998). The 1990’s are known as the decade in which the watershed approach
2
became widely popularized as a method of environmental management (Schueler 1996).
Although the watershed-based approach has become popularized, there is little agreement among
policy makers over methodology to develop and implement watershed-based plans (McGinnis
1999), and methodologies for an integrated watershed approach have been changing in response
to rapidly developing technologies (Wang et al. 2016). It is important to understand the evolution
of watershed management planning in order to better inform future efforts, as the processes and
tools used in watershed planning are ever-evolving based on improved technologies, changing
regulations, and social trends.
1.2 PROBLEM STATEMENT AND OBJECTIVES
The watershed management planning process is not well documented within the scientific
community. Understanding historical methodology and identifying trends in watershed
management processes is important as good planning processes can lead to better
recommendations and implementation by decision makers (Born and Genskow 2001). There are
numerous state- or regional-level documents and manuals that suggest methods for developing
WMPs, however, many documents are outdated. The methods for developing WMPs are varied
and may even be inconsistent within a municipality if watersheds are handled by different
consulting companies. For example, in Lincoln, NE between 2000 and 2015, ten WMPs were
developed by five different engineering consulting companies (City of Lincoln n.d.).
Additionally, the methods are continuously changing and developing based on new knowledge,
advanced technologies, and the availability of more precise data.
The purpose of this study is to investigate the evolution of watershed management planning in
urban areas based on historic and current methodologies, and to provide guidance to urban
municipalities with an MS4 to effectively develop, understand, and implement a Watershed
Management Plan (WMP). The objectives for this study are as follows:
1. Review existing literature on watershed management planning guidance manuals,
methodologies, and planning documents
2. Evaluate and compare the historical methodologies of watershed planning
3. Investigate the current methodologies that are available tools for watershed planning
3
4. Provide guidance to urban municipalities on the future of watershed management
planning
Although the focus of the study will be on urban municipalities with an MS4, this review of
watershed master planning methodologies will also be applicable to non-permitted urban
localities. WMPs can help mitigate the effects of urbanization on watershed health and function
beyond meeting regulatory requirements, and may also proactively prevent water body
degradation before regulatory agencies get involved, such as impairment listings or Total
Maximum Daily Loads (TMDLs). Therefore, any urban locality could benefit from effective
watershed management strategies.
The scope of this study is WMPs developed by or for urban municipalities with an MS4 permit,
and watershed study areas of approximately 50 mi2 or less. Watershed study areas larger than
this tend to focus on basin scale management with low-resolution analysis. Additionally,
management at the basin scale typically does not consider stormwater infrastructure or
recommend site-specific strategies. This study will focus on urban municipalities as these entities
have the authority to implement improvement strategies, are driven by regulations, and could
benefit from effective watershed planning.
4
2 LITERATURE REVIEW
Land-use changes, specifically urbanization, can have significant effects on local hydrologic
functions. The effects of urbanization on the hydrology of a landscape include changes in peak
flow characteristics, the volume of runoff, water quality, and the appearance of water bodies due
to increased impervious surfaces (Leopold 1968). Stream degradation has been shown to begin to
appear at 10% imperviousness, with 30% imperviousness causing severe degradation (Arnold
and Gibbons 1996). This modified hydrology from urban areas can degrade streams, rivers, and
other water bodies in the form of impaired water quality from stressors such as sediment or
contaminants, as well as incised or eroded banks from increased peak flows (Walsh et al. 2005).
One approach to addressing water quantity and quality issues related to land-use changes is
management at the watershed scale. Watersheds are appropriate units of analysis as their
boundaries are typically well defined by topographic drainage divides and their processes are
well researched (Arnold 2010; Ruhl 1999). Watersheds are also meaningful from an ecological
perspective; often the health of the watershed as a whole can be determined based on the health
of the aquatic system (McGinnis 1999). The watershed boundary provides a meaningful
management extent for organizations and municipalities. Issues that are within clear management
boundaries are more likely to be carefully addressed than problems that lie outside of the scope
of management (Blomquist and Schlager 2005). The history of watershed management in the
U.S., the benefits of management and planning efforts at the watershed scale, and a review of
watershed management planning is discussed in the following sections.
2.1 HISTORY OF WATERSHED MANAGEMENT
John Wesley Powell first proposed the concept of watershed-based planning to Congress in 1878
with a vision of pioneering the West that would delineate political boundaries coincident to
watershed divides. This arrangement would have greatly altered the design of the region as it is
now, and in part would have limited the growth potential if not altogether prevented the
existence of populous water-stressed cities such as Los Angeles and Phoenix (McGinnis 1999).
The interest in watershed management has since waxed and waned over the years (Heaney et al.
2000). Many prior watershed and basin management attempts were conducted as “top-down”
5
federal efforts that ultimately imposed on jurisdictions a form of coordinated management
(Western Water Policy Review Advisory Commission 1998), although conflicting objectives of
the federal agencies resulted in gridlock rather than coordination. Watershed management
practices have since evolved into more “bottom-up” approaches that emphasize local
partnerships.
The U.S. Inland Waterways Commission reported to Congress in 1908 that river systems should
be treated as an integrated system, one of the first examples of water resources management
within watersheds (EPA 1995). Other early efforts driven by federal agencies were largely
conceived during the progressive conservation era in the early 1900’s. The extensive private
control of resources that resulted in widespread deforestation prompted conservationists to
transfer control of natural resources to federal agencies (Gregg et al. 1998). Watershed
management was one practice that also spawned from the progressive era. The Tennessee Valley
Authority (TVA) undertook an experimental and ambitious regional water management project
in 1933 that initiated an era coined the “renaissance of regionalism” (Gregg et al. 1998).
Although the attention given to watershed management during this time was largely focused on
regional projects, the Soil Conservation Service (now known as the Natural Resources
Conservation Service, NRCS) established a “small watersheds program” in 1954 to fund local
organizations and state governments to address erosion and flooding problems at a smaller scale
(Gregg et al. 1998). This program provided a model for more localized watershed management
that further fueled the shift towards “bottom-up” management. Other federal interagency river
basin committees formed during this time did not prove as effective in improving coordinated
efforts (Gregg et al. 1998).
A notable change that rose out of the end of the 20th century was the diffusion of legal authority
to a larger set of partnerships with shared responsibility, encouraging “bottom-up” approaches
over previous “top-down” federal efforts (Committee on Watershed Management 1999; Western
Water Policy Review Advisory Commission 1998). Many states added provisions of “public
interest” and “public welfare” into state water codes as the state role in water management
became more prominent (Gregg et al. 1998). Although the state and local role was ever
6
increasing, the federal role did not disappear. By the end of 1999, there were 17 federal agencies
that had adopted watershed-based approaches (McGinnis 1999).
After the adoption of the Clean Water Act (CWA), the increasing challenge of addressing
nonpoint source pollution encouraged agency cooperation. Section 319 of the CWA offered a
powerful source of federal grants to watershed initiatives seeking to address local water quality
issues associated with nonpoint source pollution. This program, also known as the Section 319
Nonpoint Source Management Program, quadrupled the amount of grant funding between 1990
and 2000 (EPA 2017a). The 1990’s are known as the decade in which the watershed approach
became widely popularized as a method of environmental management (Schueler 1996).
The modern watershed movement continues to focus more on practical solutions to watershed
problems in addition to exclusively addressing distinct legal issues (Gregg et al. 1998). This has
the potential to overcome the limitations of past management approaches of conflicting federal
agencies. Watershed management has since continued to dynamically evolve to adapt to modern
technologies, a better understanding of hydrologic processes, and changing management goals
(Davenport 2003).
2.2 BENEFITS OF WATERSHED MANAGEMENT
Federal, state, local, and nongovernmental organizations’ planning efforts are commonly limited
to traditional site-specific strategies, which may not protect water quality at the watershed scale
(Brabec 2009). It is therefore reasonable for jurisdictions and organizations to undertake
management efforts that focus on watersheds as the unit of analysis. It has long been suggested
that existing jurisdictions combine and transfer resources to form an integrated watershed-scale
management program (Blomquist and Schlager 2005).
Traditional management of water resources may also focus on specific aspects of water
management, such as drinking water quality, flood prevention and mitigation, habitat restoration,
or wetland preservation. For example, Watershed Implementation Plans (WIPs) may be tailored
to address certain regulations, such as water quality improvements in response to Total
Maximum Daily Loads (TMDLs), but may not guide policy for all aspects of the watershed.
7
Watershed approaches can enhance program efficiency, coordination among agencies, and the
distribution of resources and funding (Browner 1996; EPA 1995).
2.3 WATERSHED MANAGEMENT PLANNING
2.3.1 Definition
One form of watershed management is a process called watershed management planning.
Watershed management planning is defined by the EPA as a “strategy that provides assessment
and management information for a geographically defined watershed, including the analyses,
actions, participants, and resources related to developing and implementing the plan” (EPA
2008). It is a systematic procedure to locate problems within the watershed and to identify
alternative solutions, following the general steps of assessment, planning, and implementation,
followed by evaluation (Davenport 2003). Watershed Management Planning is a science-based
and community-driven approach to address long-term management of watershed impairment
requiring diverse participation based on skills and knowledge (EPA 2008).
There is a distinction between a watershed “study” and a watershed “plan”. While a watershed
study is technical analysis used to identify problems, a watershed plan is a more comprehensive
process that leads to implementation and assessment of successes and failures (Schueler 1996).
Plans need to focus on achieving specific and obtainable goals, although these are more often
reactive to addressing existing problems rather than proactive towards preventing future
degradation (Davenport 2003). While watershed planning and management was historically
applied to solve flood related problems, current plans attempt to integrate principles of flood
control, fluvial geomorphology, and water quality (Doerfer and Urbonas 2004), as well as
habitat, ecology, and community values (EPA 2013). A critical aspect of watershed-based
management is balancing the needs of society with the needs of the environment. The watershed
approach recognizes the complex interactions between humans and the ecosystem; it is said that
“managing for one without considering the other can be detrimental for both” (EPA 1995).
Watershed management planning is also an important tool for municipalities to inform and
engage the public and stakeholders. Stakeholders should have access to scientific information
regarding physical watershed processes in order to create a sense of “ownership” and allow them
8
to be effectively involved in management decisions (Maguire 2003). The WMP creates a venue
of communication between stakeholders and the scientists assessing and modeling the watershed.
The involvement and sense of “ownership” by stakeholders and the public is not only important
for informing policy decisions, but also because watersheds are as much a cultural construct as a
scientific unit of analysis due to the associations, relationships, and partnerships that might
develop on a watershed basis (McGinnis et al. 1999). The watershed is composed of
communities of people that interact with and impact the natural and built landscape, and these
cultural conditions have the potential to influence watershed planning practices. For example, the
level of involvement of the community with regard to the watershed can greatly influence the
success of particular restoration efforts or management approaches (Shilling et al. 2005). For this
reason, watershed planning should include an understanding of the history, politics, economics,
and culture of the watershed (Allan et al. 2008). It also is critical that local municipalities,
stakeholders, and the public be actively involved in the watershed planning process.
2.3.2 Scope
One of the primary causes of unsuccessful plan implementation is that the plan is conducted at
too large or small a scale (Davenport 2003; Schueler 1996). Planning efforts conducted in
smaller watersheds may discourage integration and neglect broader watershed context
(Blomquist and Schlager 2005). At broader scopes, however, localized problems and detailed
analyses are sacrificed for a larger area of coverage. The selection of an appropriate geographic
scale for the watershed study largely depends on the desired level of detail. The USGS uses a
hierarchical Hydrologic Unit Code (HUC) to describe the location and relative size of a
watershed, which ranges from HUC-2 at the regional level to HUC-12 at the subwatershed level.
Larger basin or subbasin studies (HUC-6 and HUC-8) are more realistic in rural watersheds of
homogeneous land use with few pollutants of concern, such as sediment from agricultural
practices (Davenport 2003; IEPA 2007) Watershed studies focusing on a smaller area (HUC-10
and HUC-12) are able to accommodate a higher level of detail in analysis, such as urban
stormwater infrastructure and multiple water quality constituents (EPA 2008).
The Center for Watershed Protection (CWP) defines “small urban watersheds” as between 20
and 100 mi2 (Schueler 1996). This allows for easier incorporation with stakeholders and fewer
9
political jurisdictions. While it is recognized that planning may need to occur up to the 100 mi2
watershed scale, watersheds below 50 mi2 are the recommended management planning units
(Schueler 1996). The Illinois Environmental Protection Agency (IEPA) suggests that watershed
projects be limited to 63 mi2 or less, with 50 mi2 as the recommended maximum for urban
projects (IEPA 2007). Other studies have cited 50 mi2 as the recommended maximum watershed
study area because it encourages more local involvement, can provide more site-specific
recommendations, and has fewer players sharing the responsibility to implement (DeShazo et al.
1996).
2.3.3 Planning Protocols
Many municipalities have developed WMPs that have taken various forms. For example, Fairfax
County, VA has developed 13 WMPs between 2005 and 2011 for their 30 watersheds (Fairfax
County 2015). Other examples of WMPs have been developed by Atlanta, GA (City of Atlanta
2017); Lake County, IL (Lake County 2017); and Durham, NC (Durham 2017). These WMPs
help to guide policy and prioritize implementation of restoration and improvement projects in the
watershed. The task of developing a WMP may be given to a consultant or other external entity,
or it may be produced by the local government itself.
To facilitate the creation of a WMP, multiple documents, or watershed planning manuals, have
been developed at the state or regional level. Watershed planning protocols have been developed
by agencies such as the Environmental Protection Agency (EPA), Bureau of Reclamation, and
the National Resource Conservation Service (NRCS) (Committee on Watershed Management
1999). The EPA specifically has developed a set of watershed planning guidelines for states and
communities based on a “watershed approach”. This watershed approach focuses on targeting
priority problems in the watershed, involving stakeholders, using integrated solutions from
interdisciplinary agencies, and measuring success through monitoring (EPA 1995). The EPA
describes the benefits of using a watershed approach as providing a “unique and effective way to
assess the environment, identify problems, establish priorities for preservation or restoration, and
implement solutions” (EPA 2003). A comprehensive methodology, called Watershed Analysis
and Management (WAM), was first developed by the EPA in 1997 (EPA 2003). More recently,
the EPA has identified the “Nine Key Elements” that are critical for developing an effective
10
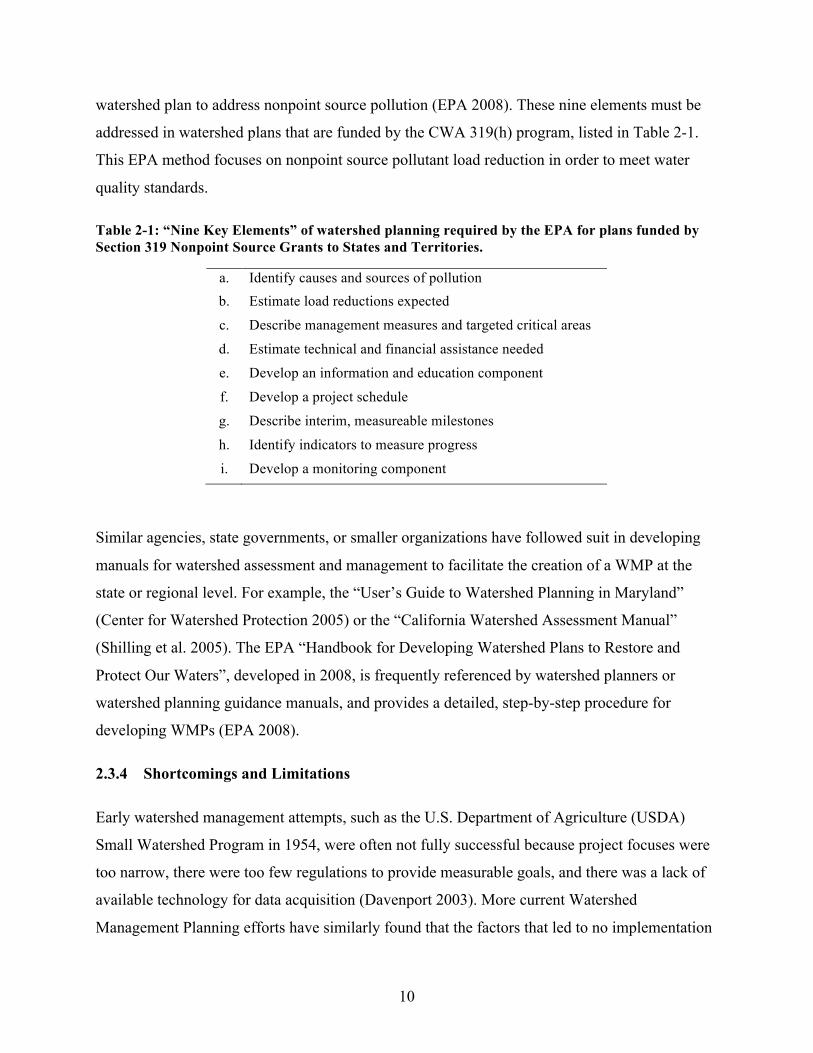
watershed plan to address nonpoint source pollution (EPA 2008). These nine elements must be
addressed in watershed plans that are funded by the CWA 319(h) program, listed in Table 2-1.
This EPA method focuses on nonpoint source pollutant load reduction in order to meet water
quality standards.
Table 2-1: “Nine Key Elements” of watershed planning required by the EPA for plans funded by Section 319 Nonpoint Source Grants to States and Territories.
a. Identify causes and sources of pollution b. Estimate load reductions expected
c. Describe management measures and targeted critical areas
d. Estimate technical and financial assistance needed
e. Develop an information and education component
f. Develop a project schedule
g. Describe interim, measureable milestones
h. Identify indicators to measure progress
i. Develop a monitoring component
Similar agencies, state governments, or smaller organizations have followed suit in developing
manuals for watershed assessment and management to facilitate the creation of a WMP at the
state or regional level. For example, the “User’s Guide to Watershed Planning in Maryland”
(Center for Watershed Protection 2005) or the “California Watershed Assessment Manual”
(Shilling et al. 2005). The EPA “Handbook for Developing Watershed Plans to Restore and
Protect Our Waters”, developed in 2008, is frequently referenced by watershed planners or
watershed planning guidance manuals, and provides a detailed, step-by-step procedure for
developing WMPs (EPA 2008).
2.3.4 Shortcomings and Limitations
Early watershed management attempts, such as the U.S. Department of Agriculture (USDA)
Small Watershed Program in 1954, were often not fully successful because project focuses were
too narrow, there were too few regulations to provide measurable goals, and there was a lack of
available technology for data acquisition (Davenport 2003). More current Watershed
Management Planning efforts have similarly found that the factors that led to no implementation
11
of the plans included a lack of funding, enforcement, awareness, and cooperation (Koski and
Lorenz 1999). An important factor leading to the success of a WMP is whether the plan has any
regulatory meaning, or mechanisms for enforcement. Although a lack of funding can lead to
unsuccessful implementation of plans, some watershed initiatives have found that federal support
may come at the expense of restrictions on their planning processes (Gregg et al. 1998).
Restricted planning may hinder the success of the plan and discourage innovation or
implementation.
Many of the recommended planning procedures, such as the EPA WAM approach, are focused
on a scientific process for assessing watersheds, however they may not provide guidance on how
the planning steps are applied (Committee on Watershed Management 1999). Other
shortcomings that are common to watershed assessments are the cataloging of data with little
analysis, scarce integration of different aspects of assessment, or weak application of the science
to decision-making processes (Shilling et al. 2005).
The watershed planning process is one that is continually being revised and refined. Although
certain aspects of watershed management have been shown to be more successful than others,
there is no single catch-all process that can encompass the diverse needs of each individual
watershed. Each watershed’s unique characteristics, circumstances, and management approaches
need to be addressed using a flexible process that takes advantage of emerging opportunities
(Davenport 2003).
2.3.5 Adaptive Management
Watershed management continues to grow in use and feasibility as more advanced technologies
and technical tools become available (Committee on Watershed Management 1999). An
effective way to improve upon the watershed management strategies is through a concept called
adaptive management. Adaptive management consists of a continuous and iterative feedback
loop of implementation followed by assessment and improvement, where failures and
shortcomings are embraced so that it provides an opportunity to learn and change (Allan et al.
2008). This process can allow for management to progress and improve under uncertain and
variable conditions (Jensen et al. 1996). This is particularly applicable for watershed
management as stormwater regulatory programs may not adequately account for the many
12
limitations to the technical knowledge available, such as the effectiveness of BMPs (Brabec
2009; Wagner 2006). Others have suggested that watershed planning could be the leader in
forging the future of climate change modeling (Arnold 2010). Watershed planning creates a
demand for more accurate climate change models that can help to improve flood frequency
analyses. It is therefore imperative that the process of watershed master planning be adaptive to
improved methodologies based on historic successes and failures.
Current watershed planning has been often shown to possess “risk aversion” that may not
adequately promote adaptive management (Arnold 2010). One possible cause for risk aversion in
watershed planning is that there are few incentives for risk-taking and innovation (Allan et al.
2008). One community-based watershed group in Oregon expressed that their willingness to
explore alternative solutions was deterred when they were singled out for praise and, under the
spotlight, were dissuaded from taking more innovative or risky approaches (Gregg et al. 1998).
Another factor that might contribute to risk aversion is strict adherence to watershed planning
guidance manuals and standard procedures. The Center for Watershed Protection states that,
“Much of the watershed planning field is so new that each plan is basically its own watershed
experiment” (Center for Watershed Protection 2005). Innovation and experimentation in
watershed planning can improve future efforts by exploring new options and by assessing
successes and failures.
13
3 EVOLUTION AND APPLICATION OF URBAN WATERSHED
MANAGEMENT PLANNING
3.1 INTRODUCTION
John Wesley Powell first proposed the concept of watershed-based planning to Congress in 1878
with a vision of drawing political boundaries coincident to watershed divides. Although Powell’s
proposal was rejected at the time, the concept of management at the watershed-scale has since
become widely popularized. Early watershed endeavors were conducted as “top-down” federal
efforts that ultimately imposed a form of coordinated management on jurisdictions (Western
Water Policy Review Advisory Commission 1998). The inherent conflicting objectives of federal
agencies resulted in gridlock rather than coordination, which other programs attempted to
overcome through narrower foci. For example, the Small Watersheds Program was established in
1954 by the Soil Conservation Service (SCS) to address local erosion and flooding problems at a
smaller scale (Gregg et al. 1998). Programs such as these provided a model for more localized
watershed management that further fueled a shift at the end of the 20th century towards “bottom-
up” management (Committee on Watershed Management 1999). This approach involved the
diffusion of legal authority to a larger set of partnerships with shared responsibility. The modern
watershed movement continues to focus more on practical solutions to watershed problems
rather than becoming stymied by legal rights and jurisdictional delineations (Gregg et al. 1998).
Watershed management has since been dynamically evolving to adapt to modern technologies, a
better understanding of hydrologic processes, and changing management goals (Davenport
2003).
One manifestation of watershed-based management is watershed management planning: a
science-based and community-driven approach to address long-term management of watershed
impairment (EPA 2008). It is a systematic procedure to locate problems within the watershed
and to identify alternative solutions. The planning process culminates in the development of a
watershed-based plan, henceforth referred to as a Watershed Management Plan (WMP), which
encompasses an array of similar plans of differing terminologies, including but not limited to:
Watershed Master Plan, Watershed Based Plan, Watershed Protection Plan, and Watershed
Action Plan. The general procedure towards developing a WMP consists of establishing
14
partnerships and setting plan goals; watershed characterization and analysis; implementation of
recommended solutions; followed by evaluation, monitoring, and progress measurement
(Davenport 2003; Doerfer and Urbonas 2004; EPA 2008). Evaluation and progress measurement
are a form of adaptive management, a continuous and iterative feedback loop of implementation
followed by assessment, where failures and shortcomings are embraced to provide an
opportunity to improve (Allan et al. 2008; NRC 2004). This process can allow for management
to progress and improve under uncertain and variable conditions (Jensen et al. 1996). Plan
evaluation enables planners to identify areas of improvement so that previous steps of the
planning process can be revisited and adapted to improve methodologies based on historic
successes and failures.
Watershed management planning can also be a useful prioritization tool for urban localities
required to implement structural and non-structural stormwater controls, pursuant to
requirements of municipal separate storm sewer system (MS4) permits and total maximum daily
load (TMDL) waste load allocations (33 USC 26, §§ 402 and 303, respectively). Planning for
implementation of controls in urban areas is especially challenging because multiple objectives
(e.g. flood control, erosion and sediment control, aquatic insect impairments) must be fulfilled
with limited available space for implementation, relatively high cost of land, complex surface
and subsurface drainage patterns, and constraints of local government budgets (Lee et al. 2012;
McGarity 2012; Walsh et al. 2016). A watershed-based approach can benefit municipal planning
efforts as these approaches can enhance program efficiency, improve coordination among
agencies, and better allocate the distribution of resources and funding (Browner 1996). WMPs
can equip planners to prioritize implementation projects that address local concerns related to
public health and safety, flooding, water quality regulations, and watershed aesthetics.
Additional benefits of watershed planning for urban municipalities include providing a venue of
communication between governing bodies, stakeholders, and the public. Watersheds are
composed of communities of people that interact with and impact the natural and built landscape.
The level of involvement of the community with regard to the watershed can greatly influence
the success of particular restoration efforts or management approaches (Shilling et al. 2005).
Additionally, watershed plans allow policy makers and stakeholders to have access to scientific
information regarding physical watershed processes to allow them to be effectively involved in
15
management decisions (Maguire 2003). This sharing of information is particularly essential
when policy makers are required to make technically complex environmental policy decisions
(Chess and Purcell 1999).
Although the watershed management approach has earned prevalence, there is little agreement
among policy makers over methodology to develop and implement watershed-based plans
(McGinnis 1999), and methodologies for an integrated watershed approach have been changing
in response to rapidly developing technologies (Wang et al. 2016). This study aims to investigate
the evolution of watershed management planning in urban areas based on historic and current
methodologies, and to provide guidance to urban municipalities with an MS4 to effectively
develop, understand, and implement a WMP. To achieve this goal, 63 WMPs were evaluated for
several factors related to general methodology or unique planning procedures, with a focus on
small urban watersheds. These factors were then used to identify trends in the watershed
planning processes through qualitative review and statistical analysis. The intent of this study is
to provide a state of the practice review of watershed management and to identify emerging
trends in planning methodology as evidenced by existing plans and published literature, rather
than to gauge the success of the plans or rank the plan effectiveness. It is important to understand
the evolution of watershed management planning in order to better inform future efforts, as the
processes and tools utilized continue to evolve with improved technologies, changing
regulations, and social trends. The results of the study are first presented as a statistical summary
of the WMP documents reviewed, followed by a state of the practice review and discussion of
observed trends.
3.2 ANALYTICAL METHODS
3.2.1 Database Development
Numerous spatially and temporally diverse urban WMPs were reviewed to compare and assess
trends in planning methodologies. Urban watersheds are the focus of this study as urbanization
significantly affects local hydrologic functions and contributes a number of stressors on water
body health, including increased rate and volume of stormwater runoff and water quality
degradation (Leopold 1968; Walsh et al. 2005). Furthermore, the study focuses on urban
municipalities as these jurisdictions have the authority to implement improvement strategies, are
16
driven by regulations, and can benefit from effective watershed planning. In addition to a review
of WMPs, various watershed management planning guidance manuals and protocols sourced
from state agencies or organizations were collected for qualitative analysis. These documents
provide insight into planning methodologies and trends, and were further supported by a review
of current and historic watershed management literature.
The scope of this study was limited to urban watersheds of approximately 50 mi2 (130 km2) or
less, as this threshold has been identified in the literature as the preferred maximum watershed
study area size (EPA 2008; IEPA 2007). Watershed study areas larger than this threshold tend to
focus on basin-scale management with low-resolution analysis (Schueler 1996), and
management solutions at this scale may not consider stormwater infrastructure or recommend
site-specific strategies. Some exceptions to the 50 mi2 limit were made if the plan was developed
by or for an urban municipality, which may be the case in expansive metropolitan areas such as
Los Angeles, CA or Austin, TX, or if the plan encompassed multiple watersheds.
A database of over 250 WMPs, shown in Figure 3-1, was developed for nationwide plans written
between 1976 and 2017, with the majority of plans written after the year 2000. The database was
restricted to plans that were available online through organization or municipality web pages.
This limits the study to digitally available plans, which may not capture older plans written prior
to the 1990’s, as these may not have been converted to digital format or made available for
public use. Plan metadata including plan name, location, year, watershed size, and land use were
collected. This metadata was used to identify 124 urban WMPs that fall within the scope of the
study. To ensure statistical independence, this set of WMPs was further reduced to 63 plans to
remove duplication in locations where multiple plans were developed by the same municipality
or organization using similar planning methodologies.
17
Figure 3-1: Approximate geographic location of all watershed management plans (WMPs) collected. WMPs within the scope of the study (n=124) are indicated by a darker shade.
3.2.2 Statistical Analysis
After identification of the 63 WMPs for study inclusion, the plans were comprehensively
reviewed to characterize the planning methodologies utilized. During the first stage, each plan
was qualitatively assessed for various factors as listed in Table 3-1. In the second stage,
qualitative factor information was transformed into continuous or categorical variables, as
appropriate, for further data analysis. Variables included in the statistical analysis are noted with
a number and data type in Table 3-1.
18
Table 3-1: Study factors for WMP analysis. Factors are categorized into Metadata, Watershed, and Planning Methodology. Data type describes the type of statistical variable, where “N/A” is for factors that were only qualitatively reviewed or not included in the statistical analysis. “Dichotomous” variables refer to “Yes” or “No” conditions.
Factor Type Number Data Type Factor
Metadata
N/A Unique WMP ID N/A Location
01 Continuous Year
02 Nominal Author type (consultant, organization, agency, or university)
03 Dichotomous Author type as consultant (YES=consultant, NO=other) N/A Watershed plan name
Watershed
04 Continuous Watershed size 05 Continuous Land use (percent impervious or developed) 06 Dichotomous Plan initiated by a municipality (MS4) 07 Dichotomous Impairments, 303(d)
Planning Methodology
08 Dichotomous Plan focused on water quality 09 Dichotomous Plan focused on water quantity
N/A Public/stakeholder involvement 10 Dichotomous EPA “Nine Key Elements” method followed
N/A Type of physical features characterized 11 Dichotomous Social features characterized 12 Dichotomous Stormwater infrastructure inventoried
N/A Water quality assessment methods and models 13 Dichotomous Water quality modeling performed
N/A Water quantity assessment methods and models 14 Dichotomous Water quantity modeling performed
15 Nominal Type of water quality model (calculation, spreadsheet, or GIS-based)
N/A Stream condition survey methods 17 Dichotomous Stream condition survey performed
N/A Recommended improvement strategies 18 Dichotomous Education and outreach recommended 19 Dichotomous Site-specific strategies recommended
N/A Implementation timeline/budget
Factors to be included in the statistical analysis were categorized into continuous or discrete
variables. Continuous variables included numerical factors such as year and watershed size.
Discrete or categorical variables included nominal factors (e.g. author type) and dichotomous
factors (e.g. stream impairment, Y/N). Dichotomous factors describe the presence or absence of
said method, also known as a “Yes” or “No” condition.
19
Statistical analyses were performed using R 3.4.2 (R Core Team 2017). Categorical variables
were analyzed using contingency tables and tested for statistical significance using Fisher’s exact
test (Fisher 1970). Fisher’s exact test determines whether there is a nonrandom association
between two categorical variables. A two-tailed 95% confidence interval was considered
statistically significant (p £ 0.05). At p £ 0.05, it can be reasonably concluded that there is a
statistically significant relationship between the two tested factors. Fisher’s exact test was
selected over similar analyses such as the chi-squared approximation as this test is appropriate
for smaller sample sizes, such as in this study, with occurrences of low frequencies (less than 5)
in a given cell in the contingency table.
It was postulated that WMPs initiated by MS4 municipalities or written by a consultant would
produce plans that used more advanced modeling tools and were more focused on
recommending site-specific strategies, while WMPs initiated or written by organizations or
agencies would be more focused on the community aspect and have a reduced access to
modeling tools. It was additionally hypothesized that the presence of Clean Water Act Section
303(d) waterway impairments or the use of Section 319(h) funding (and consequently the EPA
“Nine Key Elements” planning approach) would influence planning methodologies. Other
factors such as the collection of infrastructure data or the use of hydrologic, hydraulic, and
pollutant load models were hypothesized to correlate with the prevalence of site-specific
recommendations. Additional qualitative trends in planning methodologies were postulated,
including the progressive emergence of public participation, water quality and ecological
considerations, and the use of modeling software.
3.3 SUMMARY OF STATISTICAL RESULTS
Statistical analyses were performed on factors generated from a set of WMPs to identify trends
in management procedures or correlations between planning factors, and serve to support the
state of the practice review. These trends and correlations indicate potential areas of further study
to understand the complex relationships between planning methodologies. Relationships between
the variables described in Table 3-1 were tested for statistical significance, where p £ 0.05, using
Fisher’s exact test. The results of statistically significant correlations are summarized in Table 3-
2 by ascending p-value. The statistical results presented herein are further described in the study
20
results and discussion section, and will be referred to by the corresponding Test Number (e.g.
T1, T2, etc.).
Table 3-2: Results of statistical analysis for factors studied. Factor correlation was determined through contingency tables and Fisher's exact test. Statistically significant p-values are listed in ascending order.
Test Number Factor A Factor B P-value Correlation T1 Quantity (09) Quantity Model (14) 5.6E-05 POSITIVE T2 Infrastructure Inventory (12) Quantity Model (14) 0.0001 POSITIVE T3 MS4 (06) Social Factors (11) 0.0004 NEGATIVE T4 Quantity (09) Quality Model (13) 0.0012 NEGATIVE T5 Social Factors (11) Quantity Model (14) 0.0019 NEGATIVE T6 Quality (08) Quality Model (13) 0.0022 POSITIVE T7 Author as Consultant (03) Infrastructure Inventory (12) 0.0027 POSITIVE T8 Quantity (09) Education and Outreach (18) 0.0033 NEGATIVE T9 EPA Method (10) Quality Model (13) 0.0066 POSITIVE T10 Quantity (09) EPA Method (10) 0.0075 NEGATIVE T11 Infrastructure Inventory (12) Site-specific Strategies (19) 0.0094 POSITIVE T12 Author as Consultant (03) Site-specific Strategies (19) 0.0134 POSITIVE T13 Quantity (09) Infrastructure Inventory (12) 0.0137 POSITIVE T14 Author as Consultant (03) MS4 (06) 0.0138 POSITIVE T15 Author Type (02) Infrastructure Inventory (12) 0.0144 N/A T16 Author Type (02) Site-specific Strategies (19) 0.0226 N/A T17 Author Type (02) MS4 (06) 0.0256 N/A T18 Author as Consultant (03) Social Factors (11) 0.0273 NEGATIVE T19 MS4 (06) Quantity Model (14) 0.0296 POSITIVE T20 EPA Method (10) Stream Survey (17) 0.0478 POSITIVE
Positive correlations correspond to conditions where an increased occurrence of Factor A (“Yes”
conditions) are correlated with an increased presence of Factor B. For example, test number T11
resulted in a statistically significant positive correlation between the variables of stormwater
infrastructure inventory and site-specific strategy recommendations, shown in the contingency
table in Table 3-3.
21
Table 3-3: Positively correlated contingency table of stormwater infrastructure inventory, including BMPs, outfalls, and storm sewer system, against whether site-specific strategies were recommended (test T11). P-value = 0.0094.
Infrastructure Inventory Yes No Total
Site-specific Strategies
Yes 33 10 43 No 8 12 20
Total 41 22 63
Conversely, negative correlations describe situations where an increased presence of Factor A
are correlated with a decreased presence of Factor B. This is the case for test number T3 where
the presence of an MS4 municipality led to decreased occurrence of the characterization of social
factors (Table 3-4).
Table 3-4: Negatively correlated contingency table of whether social factors were included in the watershed characterization against whether the plan was initiated by an MS4 municipality (“Yes”) or initiated by an organization or agency (“No”) (test T3). P-value = 0.0004.
MS4 Yes No Total
Social Factors
Yes 9 10 19 No 40 4 44
Total 49 14 63
Note that only dichotomous variables can be described using positive or negative correlation.
Nominal variables, such as those present in tests T15, T16, and T17, contain more than two
categories and thus the correlation between variables can only be determined as statistically
significant (noted as “N/A” correlation). There was no significant correlation between factors not
listed in Table 3-2. Factors such as whether the watershed contained a 303(d) impaired water
body were not found to have a statistically significant relationship to any other planning
methodologies. Factors such as water quantity, water quality, plan authorship, infrastructure
inventory, and site-specific strategies were found to have numerous correlations to other factors
and planning methods. Among these, the presence of quantity or quality modeling showed the
strongest correlations (lowest p-values). The results of the statistical analysis suggest correlations
between different watershed factors and planning methodologies, and are further discussed in the
following sections to supplement the qualitative review of planning trends.
22
3.4 STUDY RESULTS AND DISCUSSION
Results of the study are presented in this section as a state of the practice review, as supported by
existing literature, the qualitative review of 63 WMPs and WMP planning protocols, and the
results of the statistical analysis. Correlations between planning factors that are introduced in this
section are considered to be statistically significant, and reference the Test Numbers
corresponding to the results of the statistical analysis presented in Table 3-2. The state of the
practice review consists of five sections, which generally parallel the timeline of the watershed
management planning process, as follows:
1. Important considerations to be made by watershed planners in the initial planning steps,
including authorship, delineation of watershed study area, and use of planning protocols.
2. Data acquisition efforts regarding data availability, common data sets collected, and data
management techniques.
3. Trends in watershed analysis tools and identification of emergent methodology and
technology.
4. Project prioritization, implementation of improvement strategies, and plan follow-up.
5. Emerging trends in planning methodology that envision the future of watershed
management planning as it continues to evolve.
3.4.1 Initial Planning Steps
3.4.1.1 Authorship
Watershed plans may be initiated by a municipality or by an organization, and may be developed
internally through committees or externally by an agency or consulting firm. Municipalities that
have city-wide watershed management programs in place include Atlanta, GA; Griffin, GA;
Baltimore County, MD; Durham, NC; Greenville, NC; Lincoln, NE; and Fairfax County, VA.
WMPs initiated by MS4 municipalities such as these are often developed by one or more
consulting firms, as was the case for 76% of the plans reviewed (T14). Many citizen-based
organizations and non-profits that are formed as watershed-based groups, in contrast to
municipalities, develop the WMP internally through committees or boards.
23
While WMPs developed by organizations are not constrained to political boundaries, citizen-
based groups often lack the data, resources, and expertise necessary to successfully address
watershed concerns; consequently, these groups may seek influence rather than the authority to
implement (Gregg et al. 1998). In the review of WMPs, it was found that plans initiated by
municipalities were more likely to perform hydrologic and hydraulic modeling (T19).
Additionally, WMPs developed internally by the MS4 or developed by a consultant showed
higher occurrences of inventorying stormwater infrastructure (T7; T15) or recommending site-
specific strategies for implementation (T12; T16) over plans developed by organizations,
universities, or state agencies. Municipalities have the jurisdiction and resources to implement
recommended strategies, at the cost of often being constrained to portions of the watershed that
are within their political boundary.
3.4.1.2 Watershed Delineation
Watersheds can be delineated at virtually any scale, from a 5 square-mile subwatershed to a
5,000 square-mile basin. The selected scale can greatly affect the analysis potential of any
watershed study, as inappropriate watershed scale has been cited as one of the primary causes of
unsuccessful plan implementation (Davenport 2003; Schueler 1996). Planning efforts conducted
at too small a scale may discourage integration and neglect broader watershed context
(Blomquist and Schlager 2005). At broader scopes, however, localized problems and detailed
analyses are sacrificed for a larger area of coverage.
The United States Geological Survey (USGS) uses a hierarchical Hydrologic Unit Code (HUC)
to describe the location and relative size of a watershed, which ranges from HUC-2 at the
regional level to HUC-12 at the subwatershed level. Watershed studies focusing on a smaller
area – HUC-10 averaging 225 mi2 (583 km2), or HUC-12 averaging 40 mi2 (104 km2) – is the
Environmental Protection Agency (EPA) recommended scale for urban studies as they are able
to accommodate a higher level of detail in analysis (EPA 2008). Numerous studies have cited 50
mi2 (130 km2) as the recommended maximum watershed study area because it encourages more
local involvement, can provide more site-specific recommendations, and has fewer players
sharing the responsibility to implement (DeShazo et al. 1996; IEPA 2007; Schueler 1996). A
review of existing urban WMPs revealed a median study area of 18.1 mi2 (47.0 km2) and a mean
of 30.7 mi2 (79.4 km2) (Figure 3-2).
24
Figure 3-2: Watershed size distribution for 124 urban WMPs. The final column, “>100”, includes all WMPs with watershed study areas greater than 100 mi2, up to a maximum of 250 mi2.
While Davenport (2003) recommends the use of HUC to define the watershed, Arnold (2010)
claims the HUC classification system is a convenience that may not accurately represent physical
drainage patterns. In place of HUC, watershed boundaries may be delineated manually or
digitally by the watershed planner. A common Geographic Information System (GIS) tool,
ArcHydro, available through ESRI ArcGIS (ESRI 2017), is often used to quickly delineate
watersheds, particularly at a smaller scale than is covered by HUC (Whiteaker et al. 2006).
However, automated tools such as ArcHydro are limited in urban areas because they do not
account for altered drainage patterns due to stormwater infrastructure (Choi et al. 2011). The
Doan Brook Watershed Action Plan in Cleveland, OH found that the watershed increased from
9.7 mi2 to 11.9 mi2 when the storm sewer system was incorporated into the delineation of the
boundary; consequently, Doan Brook is often referred to as a “sewershed”, an area of land that is
drained by a storm sewer system, rather than a “watershed” (Doan Brook Watershed Partnership
2013). Manual verification of watershed boundaries using stormwater infrastructure maps and
site investigations produces a more accurate representation of watershed boundaries.
Additionally, the availability of finer resolution topographic data through remote sensing such as
Light Detection and Ranging (LiDAR) allows for more precise watershed and subwatershed
delineation (Talebi et al. 2014).
25
3.4.1.3 Planning Protocols
Multiple documents or planning manuals have been published at the state or regional level to
provide step-by-step guidance on developing a WMP, and are available as a resource to
watershed planners. Watershed planning protocols have been developed by numerous federal
agencies, state agencies, and smaller organizations to facilitate in the creation of a WMP;
examples of which include the EPA (EPA 2008), the Center for Watershed Protection (Center
for Watershed Protection 2005), and the California Resources Agency (Shilling et al. 2005).
Protocols such as these provide an aspect of consistency between plans, however they may also
limit the plan and prevent innovation or risk-taking. Innovation and flexibility in planning
processes are valuable as they can aid planners in addressing unique, local needs (Gregg et al.
1998). Additionally, many of these procedures are focused on a scientific process but may not
provide guidance on how the planning steps are applied (Committee on Watershed Management
1999).
A frequently referenced methodology is a set of watershed planning guidelines developed by the
EPA for states and communities based on a “watershed approach” (EPA 1995). The EPA has
further identified in their comprehensive handbook the “Nine Key Elements” that are critical for
developing an effective watershed plan (EPA 2008), summarized in Table 3-5.
Table 3-5: "Nine Key Elements" of watershed planning required by the EPA for plans funded by Section 319 Nonpoint Source Grants to States and Territories (EPA 2008). Also referred to as the “a” through “i” criteria.
a. Identify causes and sources of pollution b. Estimate load reductions expected c. Describe management measures and targeted critical
areas d. Estimate technical and financial assistance needed e. Develop an information and education component f. Develop a project schedule g. Describe interim, measureable milestones h. Identify indicators to measure progress i. Develop a monitoring component
This EPA method is targeted towards the reduction of nonpoint source pollution and must be
addressed in watershed plans that are funded by the CWA 319(h) Nonpoint Source Grants to
States and Territories program, a common source of funding for watershed planners. 12 of the 63
26
WMPs reviewed followed the EPA method. These plans were found to correlate to a higher use
of water quality modeling (T9). One of the requirements for the EPA method is estimation of
pollutant loads (element b. listed in Table 3-5), which explains the correlation and suggests that
the EPA method is successful in encouraging planners to employ water quality modeling tools.
There was also a weak correlation between adhering to the EPA method and conducting a stream
survey (T20), though it was not clear why this is the case, as there are no requirements in the
EPA method for surveying the streams. It was additionally found that users of the EPA method
did not focus on water quantity mitigation (T10). The EPA method therefore may expand the
water quality focused methods and tools that planners employ, but may not encourage
assessment of stormwater, flooding, or other water quantity related issues.
3.4.2 Data Acquisition
Characterization of the watershed is a critical component of the watershed planning process
which involves data collection and analysis. Watershed characteristics generally fall into the
categories of physical characteristics, such as climate, land use, soil, and topography; social
characteristics, such as history, population, and demographics; water body condition; stormwater
infrastructure inventory; water quality; and water quantity. The individual factors studied
depends on the unique goals and characteristics of each watershed. The use of GIS for data
storage, organization, and management has become the industry norm (Cox and Madramootoo
1998; St. John 2005). Data was historically more difficult to acquire and necessitated
considerable time and effort; presently, sources of data are widely available online through
numerous federal, state, or local databases (Wang et al. 2016).
While most WMPs consistently collect data on physical factors such as those listed previously,
the social watershed characteristics of human communities are rarely the focus of the watershed
plan as the “community picture” is the most difficult to quantify (Shilling et al. 2005). WMPs
initiated by a municipality were less likely to characterize social factors of the watershed (T3), as
were WMPs developed by a consultant (rather than an organization or agency) (T18). Based on
the author’s review of watershed plans, community-based organizations were more focused on
characterizing the “local picture” of the watershed through describing the history, politics,
demographics, and community value of the watershed. These factors can aid planners in
27
understanding the potential level of involvement and level of success in those implementation
strategies that might necessitate community participation and support.
In addition to describing the physical and social characteristics of the watershed, an inventory of
stormwater infrastructure is critical in urban areas, particularly for older municipalities where the
infrastructure is aged and the drainage patterns are unknown (Aguilar and Dymond 2014).
Effective characterization of the location and condition of this infrastructure provides a better
understanding of the drainage capacity of the watershed, and tools such as GIS and GPS continue
to improve infrastructure mapping efforts. Closed-circuit television (CCTV), while not a novel
technology, underwent advancements in the 1990’s and 2000’s that commercialized the use of
the technology, including for stormwater pipe inspections and mapping of underground
infrastructure (Romanova et al. 2013). An analysis of WMPs showed a correlation between
inventorying stormwater infrastructure data and focusing on water quantity mitigation (T13),
utilizing hydrologic and hydraulic modeling software (T2), as well as recommending site-
specific strategies (T11). Stormwater infrastructure data can be utilized in pipe capacity analyses
and floodplain modeling, or merged with monitoring efforts, thereby improving efficiency and
coordination.
The collection of watershed data through online acquisition, surveys, field investigations, or
monitoring benefits the planning process by indicating the presence or location of existing
problems; justifying the spending of resources for planning and implementation to taxpayers and
stakeholders; and providing information towards monitoring the success of implemented
strategies (EPA 2008). However, large gaps in data may make assessment difficult, as was
reported by planners in Alabama who found that although an abundance of data for the
watershed was available, the spatial and temporal extent of the data was limited, and significant
data gaps were apparent (ALOA 2011). Other jurisdictions, such as Los Angeles County,
explicitly incorporated the identification of information gaps into the planning processes to
improve future data acquisition efforts (MEC Analytical Systems Inc. 2004).
While insufficient data could limit the reliability of data analysis or modeling, excessive data can
also stymie watershed assessment. A shortcoming common to watershed assessments is the
cataloging of data with little analysis (Shilling et al. 2005). Watershed planners occasionally
28
chronicle the full extent of data available, which results in superfluous data and graphs that may
not be appropriately utilized. A WMP in Alabama presented numerous graphs of available data
which insinuated analysis, but the data was not effectively applied in plan recommendations;
consequently, after submission of the WMP, it was decided that too many ambitious goals were
set, and the plan had to be revisited to better prioritize projects (ALOA 2011). The recognition of
critical data to include or discard can simplify data management and analysis, particularly in the
present-day where too much data availability could become burdensome to the planning process.
3.4.3 Tools for Watershed Assessment
Numerous tools, methods, and technologies exist for the assessment and analysis of watershed
data, spanning from comparative indices and standards of evaluation to highly technical
computer models. The purpose of a watershed assessment is to organize, map, and interpret data
to improve management decisions related to water quantity and water quality mitigation, as well
as identify locations of potential remediation projects through field assessment (Center for
Watershed Protection 2005). In particular, GIS is a tool that has been embraced by watershed
planners, as it allows users to view spatial data and perform complex analyses (Johnson 2005;
Seth et al. 2006). GIS can be incorporated into most other forms of watershed assessment; for
example, modeling programs for hydrologic, hydraulic, and water quality analyses are
increasingly being built with GIS compatibility (Salvadore et al. 2015). This study focused on
analytical tools within five principal watershed assessment areas as discussed in the following
sections: hydrologic and hydraulic modeling, water quality analysis, pollutant load modeling,
stream assessment, and imperviousness.
3.4.3.1 Hydrologic and Hydraulic Modeling
The 1960’s marked the first use of computer modeling for stormwater analysis, followed in the
late 1970’s by a push to further develop specialized models (Whipple et al. 1983). Hydrologic
and hydraulic modeling is most frequently used by urban municipalities to aid in the mitigation
of flooding and increased urban stormwater runoff. During the past decade, integrated modeling
approaches that additionally address management of water supply and water quality has also
emerged (Fletcher et al. 2013). Modeling software, such as HEC-RAS and HEC-HMS developed
by the U.S. Army Corps of Engineers (USACE) Hydrologic Engineering Center (HEC) (U.S.
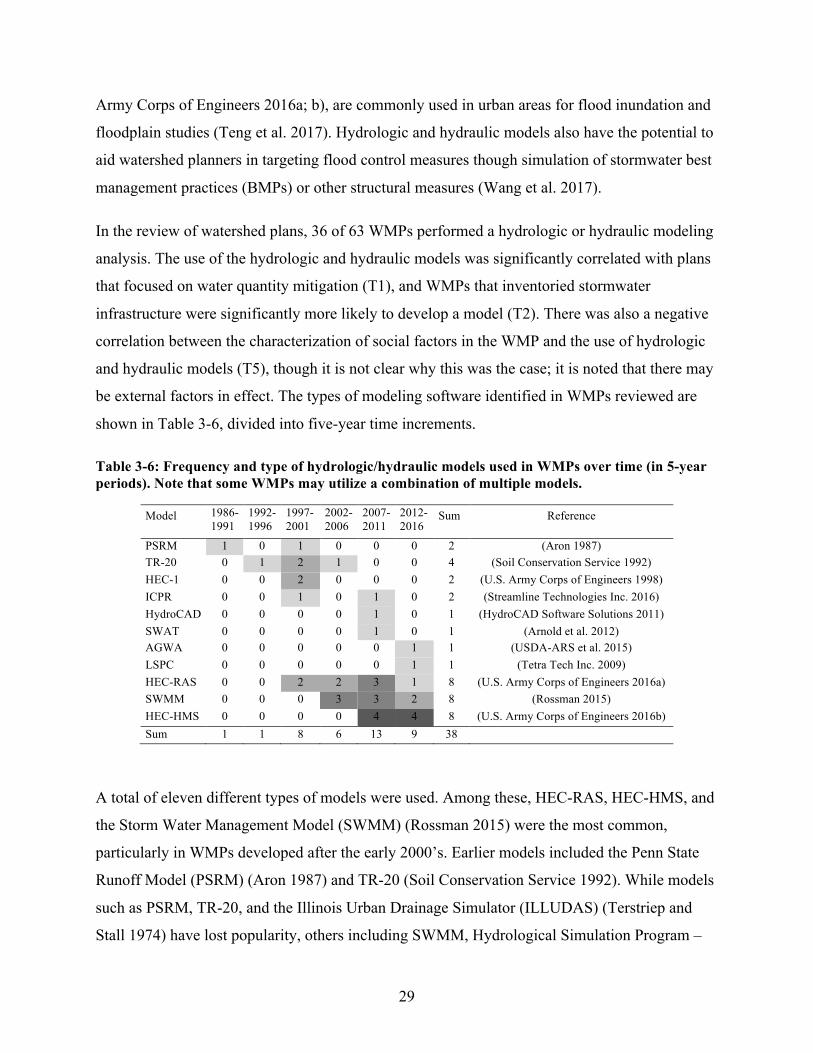
29
Army Corps of Engineers 2016a; b), are commonly used in urban areas for flood inundation and
floodplain studies (Teng et al. 2017). Hydrologic and hydraulic models also have the potential to
aid watershed planners in targeting flood control measures though simulation of stormwater best
management practices (BMPs) or other structural measures (Wang et al. 2017).
In the review of watershed plans, 36 of 63 WMPs performed a hydrologic or hydraulic modeling
analysis. The use of the hydrologic and hydraulic models was significantly correlated with plans
that focused on water quantity mitigation (T1), and WMPs that inventoried stormwater
infrastructure were significantly more likely to develop a model (T2). There was also a negative
correlation between the characterization of social factors in the WMP and the use of hydrologic
and hydraulic models (T5), though it is not clear why this was the case; it is noted that there may
be external factors in effect. The types of modeling software identified in WMPs reviewed are
shown in Table 3-6, divided into five-year time increments.
Table 3-6: Frequency and type of hydrologic/hydraulic models used in WMPs over time (in 5-year periods). Note that some WMPs may utilize a combination of multiple models.
Model 1986-1991
1992-1996
1997-2001
2002-2006
2007-2011
2012-2016
Sum Reference
PSRM 1 0 1 0 0 0 2 (Aron 1987) TR-20 0 1 2 1 0 0 4 (Soil Conservation Service 1992) HEC-1 0 0 2 0 0 0 2 (U.S. Army Corps of Engineers 1998) ICPR 0 0 1 0 1 0 2 (Streamline Technologies Inc. 2016) HydroCAD 0 0 0 0 1 0 1 (HydroCAD Software Solutions 2011) SWAT 0 0 0 0 1 0 1 (Arnold et al. 2012) AGWA 0 0 0 0 0 1 1 (USDA-ARS et al. 2015) LSPC 0 0 0 0 0 1 1 (Tetra Tech Inc. 2009) HEC-RAS 0 0 2 2 3 1 8 (U.S. Army Corps of Engineers 2016a) SWMM 0 0 0 3 3 2 8 (Rossman 2015) HEC-HMS 0 0 0 0 4 4 8 (U.S. Army Corps of Engineers 2016b) Sum 1 1 8 6 13 9 38
A total of eleven different types of models were used. Among these, HEC-RAS, HEC-HMS, and
the Storm Water Management Model (SWMM) (Rossman 2015) were the most common,
particularly in WMPs developed after the early 2000’s. Earlier models included the Penn State
Runoff Model (PSRM) (Aron 1987) and TR-20 (Soil Conservation Service 1992). While models
such as PSRM, TR-20, and the Illinois Urban Drainage Simulator (ILLUDAS) (Terstriep and
Stall 1974) have lost popularity, others including SWMM, Hydrological Simulation Program –
30
Fortran (HSPF) (Bicknell et al. 1997), and HEC-based models have remained relevant through
the years, undergoing numerous updates and improvements (Salvadore et al. 2015; Whipple et al.
1983; Wurbs 1994). This shift to models that are more widely used and accepted, such as
SWMM and HEC-RAS, may be a result of the increased computational capacity and inclusion of
interdisciplinary elements over older models that were purely engineering or economic in nature
(Mirchi et al. 2010). Future model development is likely to manifest in the form of advanced
modeling capabilities that incorporate complex interdisciplinary elements such as climate change
modeling (Fletcher et al. 2013).
3.4.3.2 Water Quality Analysis
Water quality analysis is highly driven by regulations, most notably in urban areas as progress
towards TMDL Waste Load Allocations must be demonstrated in annual MS4 permit reports. To
address these regulations, watershed planners may collect water quality data and/or perform
pollutant load modeling. Water quality data, including physical, chemical, and biological
parameters, can be obtained through existing local water quality monitoring programs, volunteer
monitoring, past studies, and state or regional agencies. Long-term water quality data aids
planners by indicating trends in water body health or by explaining cause-and-effect situations
(Espinosa-Villegas et al. 2005).
The identification of pollutant sources is frequently an outcome of water quality analyses. Water
quality constituents may be a result of point or nonpoint source pollution. Point source pollution
is often identified as septic systems, combined sewer overflows (CSOs), or National Pollutant
Discharge Elimination System (NPDES) permit dischargers, among others. Nonpoint source
pollution is more difficult to identify, and is generally estimated based on land use and land
cover. To further improve the identification of pollutant sources in the watershed, source
tracking studies are on the forefront of water quality analyses (Bushon et al. 2017). Microbial
source tracking and fluorometry (fluorescence spectroscopy) monitoring are among the types of
source tracking used. Microbial source tracking was performed (or recommended) for watershed
studies including Clearwater, Florida (Parsons 2001); Atlanta, Georgia (Atlanta Regional
Commission 2011); and Bergen County, NJ (Rutgers Cooperative Extension Water Resources
Program 2013). The goal of these studies was principally to determine the origins, prevalence,
and/or rate of transport of human pathogens in streams. Source tracking helps planners determine
31
whether microbes are anthropogenic or animal, and can trace the spatial extent of pathogens to
identify pollutant sources originating from contributing water bodies and tributary streams. There
was insufficient information on the use of microbial source tracking to conduct a statistical
analysis on these data.
3.4.3.3 Pollutant Load Modeling
A common tool for assessing water quality across a watershed is through pollutant load
modeling, which can simulate watershed functions to fill in data gaps, identify pollutant sources,
model implementation strategies, or assess future conditions (EPA 2008; Wurbs 1994). These
models rely on several factors – primarily land use – to estimate the total pollutant loading by
watershed or catchment area, and can be tailored towards specific pollutants; although these
models are typically targeted towards modeling nonpoint source pollution as this is more
difficult to identify and remediate than point source pollution (Carle et al. 2005). Pollutant load
modeling can additionally be used to estimate pollutant removal by simulating various BMPs
and land use change scenarios (Wang et al. 2017). However, there are limitations in the
application of pollutant load models due to uncertainty in the removal efficiencies of BMPs, as
many studies have shown that BMP removal efficiencies vary greatly based on construction and
maintenance practices, as well as uncertainties in design (Barrett 2008; Strecker et al. 2001).
It was found that plans focusing on water quality mitigation were more likely to develop a water
quality model (T6) over plans that identified water quantity mitigation goals (T4). Pollutant load
modeling was performed in 43 of the 63 WMPs reviewed in this study, and the methods used can
be broadly categorized as either calculation-based, spreadsheet-based, or GIS-based models.
Calculation-based models frequently used the Simple Method, a lumped-parameter empirical
model that estimates pollutant load using basic inputs of land area, land use, and precipitation
(Schueler 1987). Spreadsheet-based models, while still largely based on calculations such as the
Simple Method, allow for additional data inputs and simulation of BMPs. Common spreadsheet-
based models observed in the review of WMPs include HSPF, the Source Loading and
Management Model (WinSLAMM) (Pitt et al. 1997), the Spreadsheet Tool for Estimating
Pollutant Loads (STEPL) (Tetra Tech Inc. 2017), and the Loading Simulation Program in C++
(LSPC) (Tetra Tech Inc. 2009). GIS-based models incorporate the spreadsheet-based
calculations into a GIS environment, thereby improving the modeling and simulation
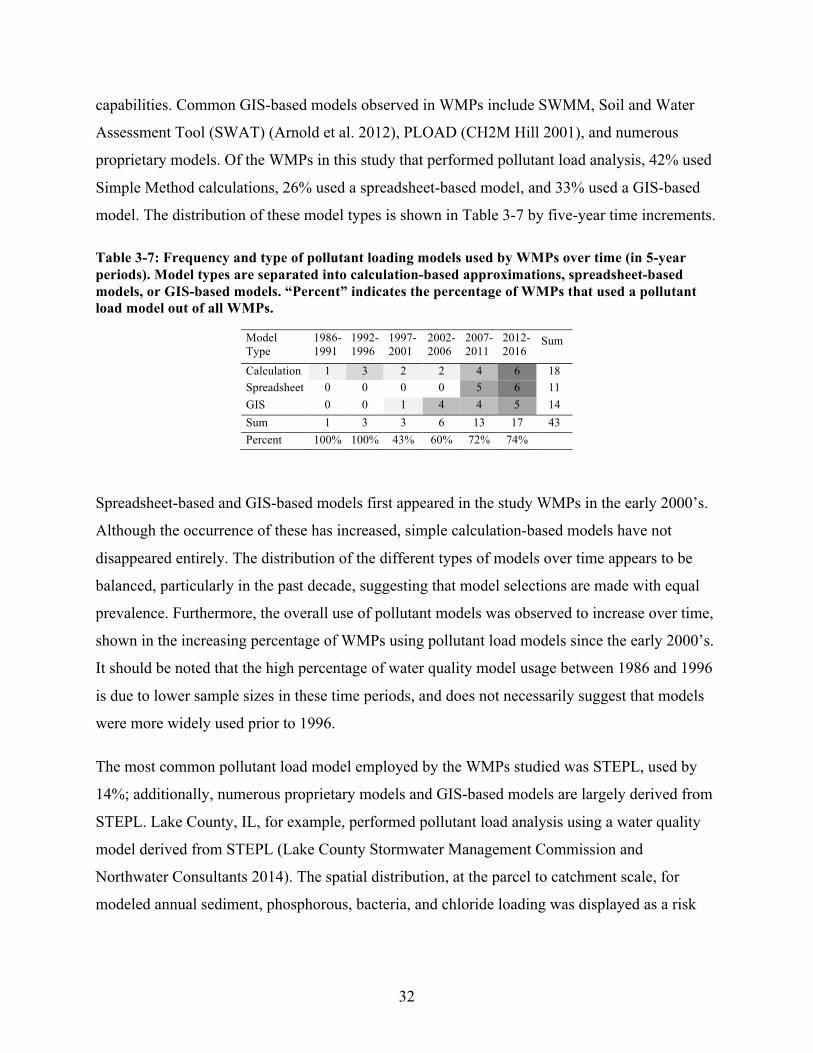
32
capabilities. Common GIS-based models observed in WMPs include SWMM, Soil and Water
Assessment Tool (SWAT) (Arnold et al. 2012), PLOAD (CH2M Hill 2001), and numerous
proprietary models. Of the WMPs in this study that performed pollutant load analysis, 42% used
Simple Method calculations, 26% used a spreadsheet-based model, and 33% used a GIS-based
model. The distribution of these model types is shown in Table 3-7 by five-year time increments.
Table 3-7: Frequency and type of pollutant loading models used by WMPs over time (in 5-year periods). Model types are separated into calculation-based approximations, spreadsheet-based models, or GIS-based models. “Percent” indicates the percentage of WMPs that used a pollutant load model out of all WMPs.
Model Type
1986-1991
1992-1996
1997-2001
2002-2006
2007-2011
2012-2016
Sum
Calculation 1 3 2 2 4 6 18 Spreadsheet 0 0 0 0 5 6 11 GIS 0 0 1 4 4 5 14 Sum 1 3 3 6 13 17 43 Percent 100% 100% 43% 60% 72% 74%
Spreadsheet-based and GIS-based models first appeared in the study WMPs in the early 2000’s.
Although the occurrence of these has increased, simple calculation-based models have not
disappeared entirely. The distribution of the different types of models over time appears to be
balanced, particularly in the past decade, suggesting that model selections are made with equal
prevalence. Furthermore, the overall use of pollutant models was observed to increase over time,
shown in the increasing percentage of WMPs using pollutant load models since the early 2000’s.
It should be noted that the high percentage of water quality model usage between 1986 and 1996
is due to lower sample sizes in these time periods, and does not necessarily suggest that models
were more widely used prior to 1996.
The most common pollutant load model employed by the WMPs studied was STEPL, used by
14%; additionally, numerous proprietary models and GIS-based models are largely derived from
STEPL. Lake County, IL, for example, performed pollutant load analysis using a water quality
model derived from STEPL (Lake County Stormwater Management Commission and
Northwater Consultants 2014). The spatial distribution, at the parcel to catchment scale, for
modeled annual sediment, phosphorous, bacteria, and chloride loading was displayed as a risk
33
map that highlighted zones of the watershed that have the potential to produce higher loadings of
the identified pollutants of concern.
3.4.3.4 Stream Assessment
The assessment of stream condition, health, and habitat is a fundamental step towards making
sound natural resource management decisions (Somerville and Pruitt 2004). Stream assessments
ranging from qualitative visual assessments to more comprehensive quantitative exercises might
be used to address any number of purposes including the management of fish and wildlife,
assessment of drinking water sources, regulatory compliance, and watershed or land use planning
(Somerville and Pruitt 2004). For the purposes of watershed planning, a visual assessment of the
stream corridor can provide information towards characterizing current stream conditions,
monitoring the effects of restoration strategies, identifying specific locations of concern, and
familiarizing local stakeholders, decision makers, or agency personnel with the stream (Center
for Watershed Protection 2005; EPA 2008).
In the review of watershed plans, 42 WMPs performed a stream assessment survey or stream
condition inventory. Methods and factors surveyed generally consisted of one (or more)
categories of: channel classification, geomorphic assessment, bank stability and erosion, riparian
vegetation, and stream habitat. Bank stability or bank erosion was the most common assessment,
performed in 16 WMPs, followed by riparian vegetation (11), channel condition (8), and stream
habitat (8). The channel condition factor describes the extent of channel modification, such as
natural, re-routed, or piped. Numerous standard methods and assessment protocols exist to guide
the stream survey process. In the review of WMPs, a total of 20 unique stream assessment
protocols, methods, or indices were referenced; these include methods such as the Bank Erosion
Hazard Index (BEHI) (Rosgen 2001), Stream Visual Assessment Protocol (SVAP) (USDA
1998), and Rapid Stream Assessment Technique (RSAT) (Galli 1996). Approximately one-third
of WMPs that performed a stream assessment did not follow an established protocol, instead
performing a visual inventory through field surveys using GPS or GIS to catalog photographs,
survey notes, or other stream features.
Results of the stream assessment are often used by municipalities to identify potential stream
restoration sites or establish benchmark conditions for future monitoring. For example,
34
watershed planners in Atlanta, GA conducted numerous field investigations at over 300 points in
the Peachtree Creek watershed to identify hydrologic and anthropogenic alterations, riparian
buffer condition, BEHI, and habitat, among other metrics of assessment (BC/DHA 2017). These
indices were mapped along the streams to identify locations where restoration projects could be
implemented, and some channel condition indices were additionally input into a planning-level
water quality model. However, the applicability of stream assessment outcomes is limited.
Standard metrics of evaluation are not a substitute for determining causes of impairment or
appropriate restoration actions that should occur; for example, it is misguided to assume that
bank erosion is universally undesirable, as it has been shown to have benefits as well as costs to
the dynamic ecological processes of a stream (Rubin et al. 2017). Additionally, the selection of
restoration sites is often highly limited in urban areas by adequate access to the stream,
availability of land, and the presence of other facets of infrastructure, among other challenges
(Landers 2010).
3.4.3.5 Imperviousness
The amount of impervious cover in a watershed is often used as an indicator of overall stream
health, as it is relatively simple to measure and has been shown to correlate with water quality
degradation (Booth et al. 2002; Glick 2009). A metric frequently referenced by watershed
planners to describe the level of anticipated water body impairment is the Impervious Cover
Model (ICM), which predicts that stream degradation occurs in response to 10% impervious area
in the watershed, with severe impairment occurring after 30% imperviousness (Arnold and
Gibbons 1996). There were 16 WMPs in the study that cited the ICM or a similar relationship
between stream health and impervious cover. Tools for estimating impervious cover have
advanced from aerial photography and remote sensing to direct calculation using GIS. Among
the different methods of estimating impervious cover, the functional difference between total
impervious area (TIA) and effective impervious area (EIA), sometimes referred to as the directly
connected impervious area (DCIA), is now being realized and incorporated into watershed
planning (Brabec 2009), as DCIA and EIA provide more mechanistic representation of
watershed function (Ebrahimian et al. 2016; Lee and Heaney 2003).
Watershed planners have applied the estimation of impervious cover as a surrogate measurement
for stream health (FB Environmental Associates 2014), as a factor in the prioritization of
35
subwatersheds or catchments for restoration strategies (AKRF Inc. 2012), or as a predictor for
channel enlargement (City of Austin 2016). While the assessment of watershed imperviousness
can be a beneficial tool, planners are limited in the restoration strategies they can employ. The
City of Fairfax, VA modeled stormwater flows resulting from impervious cover scenarios and
discovered that a 50% reduction in impervious area would be required to achieve significant
reduction in flows, which would necessitate substantial changes to the existing built-out
landscape (The Louis Berger Group Inc. et al. 2005). Others have sought to prioritize the
disconnection of impervious through incentives such as “tree credits” (Philadelphia Water
Department 2005), or through policy application (Center for Watershed Protection et al. 2001).
In Maine, a state-wide impervious cover (IC) TMDL has been issued that identifies local IC
targets, such as a goal of 8% effective impervious area in the Topsham Fair Mall watershed (FB
Environmental Associates 2014).
3.4.4 Project Implementation
Recommendations for improvement strategies are often a combination of monitoring, education
and outreach, policy, infrastructure improvements, and structural BMPs. The selection of
appropriate strategies will depend on assessing existing programs, the availability of resources,
and the needs of the watershed. Two important factors that will carry the plan from preliminary
planning through to implementation are whether the plan outlines realistic mechanisms of
enforcement (Schueler 1996) and if the watershed plan consider how projects will be
implemented given limited resources and the availability of land. A WMP in Juneau, AK found
that the primary factors that led to no implementation of the plans were a lack of funding,
enforcement, awareness, and cooperation (Koski and Lorenz 1999). In contrast, Griffin, GA
attributes their success in improved planning and management to stormwater utility funding that
allowed the division to get organized before the planning process commenced (Kaplan and
Watson 2013).
It is critical that planners extend the outcomes of the watershed analysis into the project
implementation phase. Analysis outcomes inform the prioritization of strategies – a necessary
step towards implementation for jurisdictions faced with limited resources. Considerations for
project prioritization observed in watershed plans include:
36
• Cost,
• Land availability,
• Effectiveness of strategy type,
• Short-term versus long-term solutions, and
• Priority catchments or subwatersheds.
Subwatershed prioritization allows planners to determine locations within the watershed that
warrant a greater allocation of resources. Pollutant load modeling completed on a subwatershed
basis can identify locations within the watershed that may be at a higher risk of producing certain
pollutants or increased runoff. Other factors tailored to local concerns might be overlain in order
to prioritize project implementation by subwatershed. A robust prioritization and ranking scheme
was developed in Austin, TX that generates “problem scores” for issues related to flooding,
erosion, and water quality (City of Austin 2016). A similar prioritization scheme was applied in
Fairfax County, VA based on watershed impact indicators, source indicators, priority
subwatersheds, sequencing (upstream versus downstream projects), and “implementability” (F.
X. Browne Inc. et al. 2011). While overall project effectiveness is important for the success of
implementation, newer management programs are focusing more on the feasibility of projects
over other prioritization factors (Ormsbee and McAlister 2014). Often, the obtainability of
undeveloped public land and sufficient funding are the principal factors limiting implementation
efforts.
It was found that the plan outcomes and implementation recommendations differed between
plans that were a first-time effort versus those that had prior experience developing WMPs, a
more robust department or planning group dedicated to stormwater or watershed planning, a
reliable source of funding, and/or greater access to data and analytical tools. For example, the
Watkins Creek Watershed Management Plan in St. Louis, MO developed in 2012 was
commenced by a partnership of organizations and was supported by state funding (Rollins and
Johnson 2012). Few watershed studies were completed in the past, and the partnership was
limited by access to funding, data, and authority to implement; therefore, the plan resulted in
only general recommendations. In comparison, the Antelope Creek Watershed Basin
Management Plan was also developed in 2012, and was initiated and funded by the City of
Lincoln, NE (EA Engineering Science and Technology Inc. 2012). Prior to this plan, the City

37
had completed previous plans for other watersheds in the City, dating back to 2000. The access
to reliable funding, data, and technological tools, as well as the knowledge from prior planning
efforts, allowed the City to recommend more site-specific strategies with the capacity to
implement. While the year in which the WMP was developed was a factor that was initially
hypothesized to correlate to other planning methodologies, this trend in planning efforts was
observed to be a more explanatory relationship, as there were no identified trends based on the
year in which the WMP was developed.
Sequent to project implementation is monitoring and plan follow-up to track the implementation
of recommended projects and to evaluate the successes and failures of planning outcomes. This
adaptive management technique allows planners to better inform future efforts. The Center for
Watershed Protection suggests revisiting WMPs on a rolling five-year cycle (Schueler 1996);
however most plans take several years to implement, making the five-year cycle difficult to
achieve (Ormsbee and McAlister 2014). While some WMPs do periodically update the plans,
few plans were found to complete meaningful evaluation of successes and failures. Adaptive
management in watershed planning is critical for improvement, as watershed conditions are
dynamic.
3.4.5 Emerging Trends in Watershed Management Planning
Current watershed planning has often been shown to possess risk aversion that may not
adequately promote adaptive management (Arnold 2010). One possible cause for risk aversion in
watershed planning is that there are few incentives for risk-taking and innovation (Allan et al.
2008). A community-based watershed group in Oregon expressed that their willingness to
explore alternative solutions was deterred when they were singled out for praise and, under the
spotlight, became dissuaded from taking more innovative or risky approaches (Gregg et al.
1998). Another factor that might contribute to risk aversion is strict adherence to watershed
planning guidance manuals and standard procedures, where planners become inhibited by a finite
list of tools, methods, and recommendations that they can employ. Innovation and
experimentation in watershed planning can improve future efforts by exploring new options and
by assessing successes and failures.
38
An example of innovation in watershed planning is the Conway Urban Watershed Framework
Plan, which has received numerous awards and recognition for planning and design and was
developed to create a “reconciliation landscape” that fuses green infrastructure with a livable
urban landscape (University of Arkansas Community Design Center et al. 2016). While the plan
is not scientifically-based in the standard watershed management planning process, innovative
designs such as water treatment art parks, urban eco-farms, parking gardens, and floating bio-
mats are among the recommended solutions. The watershed management field is, in many ways,
still in its infancy, and many acknowledge that each watershed plan or management action is its
own experiment (Center for Watershed Protection 2005; Shilling et al. 2005). Implementing
innovative solutions, evaluating and monitoring the successes and failures of those solutions, and
reporting those outcomes allows for others to learn from and adapt to those techniques. Failures
should be documented and reflected on by watershed planners to the same degree as successes.
A shift in focus from stormwater and flooding towards water quality, community involvement,
and ecological issues was observed, consistent with the findings of watershed management
literature (Davenport 2003; Doerfer and Urbonas 2004). Older watershed plans, such as those
developed in Cullman County, AL (Cullman County 1976) or Montgomery County, PA
(Montgomery County 1997), were more focused on mitigation of flooding or stormwater issues,
and often provided specific design alternatives due to the limited scope of the plans. Conversely,
more recent watershed plans have a greater focus on water quality and interdisciplinary issues.
This may be due to the increased role of water quality regulations. Watershed planning is highly
responsive to regulations, particularly for WMPs developed for urban municipalities, and
planning efforts are often initiated under the threat of regulatory action (Born and Genskow
2001). MS4 permit requirements, NPDES requirements, and TMDLs are among the water
resources regulations that municipalities must address. Figure 3-3 compares the number of
TMDLs issued per year to the number of WMPs developed (of 124 WMPs within the scope of
the study).
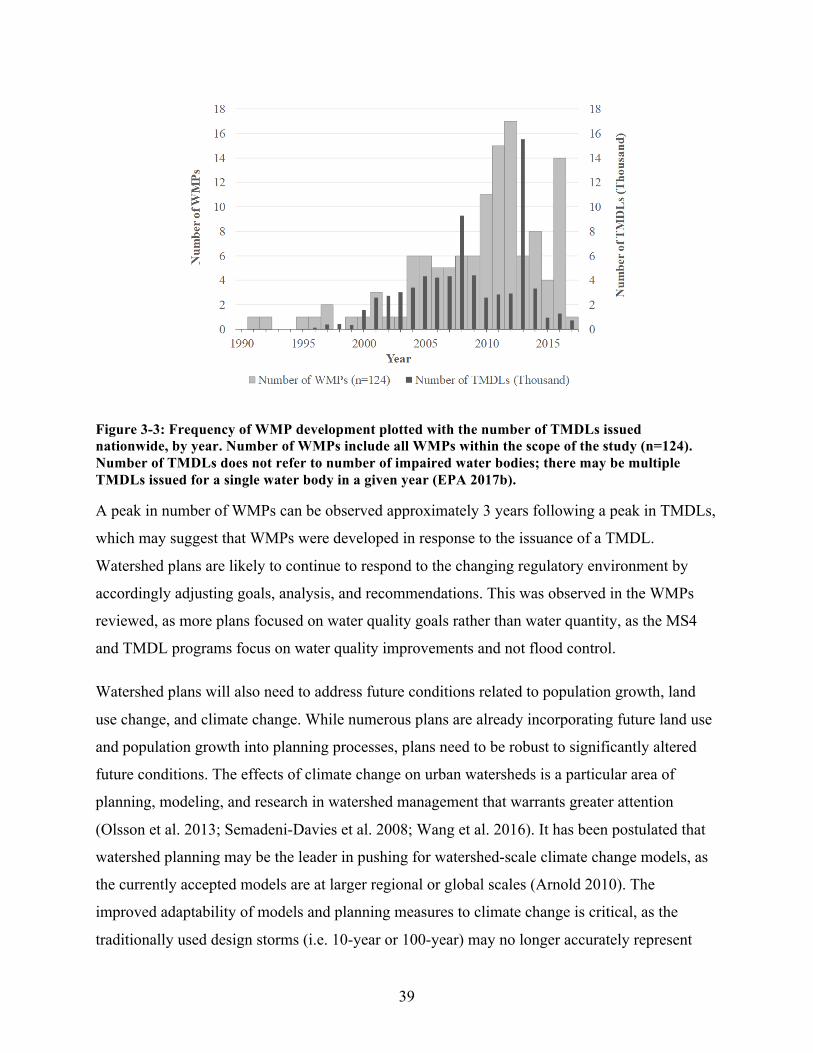
39
Figure 3-3: Frequency of WMP development plotted with the number of TMDLs issued nationwide, by year. Number of WMPs include all WMPs within the scope of the study (n=124). Number of TMDLs does not refer to number of impaired water bodies; there may be multiple TMDLs issued for a single water body in a given year (EPA 2017b).
A peak in number of WMPs can be observed approximately 3 years following a peak in TMDLs,
which may suggest that WMPs were developed in response to the issuance of a TMDL.
Watershed plans are likely to continue to respond to the changing regulatory environment by
accordingly adjusting goals, analysis, and recommendations. This was observed in the WMPs
reviewed, as more plans focused on water quality goals rather than water quantity, as the MS4
and TMDL programs focus on water quality improvements and not flood control.
Watershed plans will also need to address future conditions related to population growth, land
use change, and climate change. While numerous plans are already incorporating future land use
and population growth into planning processes, plans need to be robust to significantly altered
future conditions. The effects of climate change on urban watersheds is a particular area of
planning, modeling, and research in watershed management that warrants greater attention
(Olsson et al. 2013; Semadeni-Davies et al. 2008; Wang et al. 2016). It has been postulated that
watershed planning may be the leader in pushing for watershed-scale climate change models, as
the currently accepted models are at larger regional or global scales (Arnold 2010). The
improved adaptability of models and planning measures to climate change is critical, as the
traditionally used design storms (i.e. 10-year or 100-year) may no longer accurately represent
40
their respective return intervals, and the impacts of this at a localized scale is uncertain (Willems
et al. 2012). Use of increasingly sophisticated data and models is necessary as one of the
vulnerabilities of watershed plans is the failure to appropriately utilize available climate change
data and models (Arnold 2010). Watershed planners will need to take advantage of advanced
modeling and technology, as well as create the demand for improved technology.
3.5 CONCLUSIONS AND IMPLICATIONS
Watershed management planning has evolved considerably since its inception in the early 20th
century. Watershed approaches are becoming more focused on local participation and the
complex relationships between water resources, ecology, biology, and environmental health.
These approaches, if effectively employed, can benefit urban municipalities by informing the
allocation of resources and improvement strategies. Numerous trends in planning methodologies
were identified for various aspects of the planning process, from plan inception to project
implementation and follow-up. Among these, trends in data management techniques, modeling
programs, and technology are a recognizable driving force. The following summarizes the
primary trends identified in the study.
• WMPs developed by a consultant or a municipality were more likely to inventory
stormwater infrastructure, perform hydrologic and hydraulic modeling, and recommend
site specific strategies, while plans developed by organizations focused more on the
community picture through characterizing the social factors of the watershed.
• A common planning protocol is the EPA “Nine Key Elements” method, which resulted in
higher occurrences of water quality modeling and stream assessments; however, there
was a lower focus on water quantity mitigation in the plans that used this method.
• The collection of stormwater infrastructure data was highly correlated to performing
hydrologic and hydraulic modeling and to recommending site-specific strategies over
general recommendations.
• Trends in the types of hydrologic and hydraulic models were observed, most notably in
the increased use of HEC-RAS, HEC-HMS, and SWMM over the past decade.
41
• The use of pollutant load modeling has been gradually increasing, though no clear
preference for a type of model (either calculation-, spreadsheet-, or GIS-based) was
observed.
• The prioritization of projects prior to implementation is based in a common set of factors;
however, the “implementability” of projects, such as the availability of land, funding, and
personnel, has been of increasing importance.
• Few plans were observed to take innovative or risky approaches in the analysis or
recommendations of improvement strategies; plans may be further hindered or limited in
scope by strict adherence to planning protocols.
• WMPs were observed to be highly responsive to regulations, as indicated by a response
to TMDLs. It is conjectured that regulations will continue to drive the future of watershed
planning.
The tools, techniques, and methodologies identified in this study can be a useful resource for
municipalities and watershed planners. It is emphasized, however, that this study was limited in
scope to digitally available plans, and did not attempt to evaluate the successes or failures of the
plan outcomes. To understand the effectiveness of the planning methodologies, plan follow-up
and evaluation of implemented strategies will need to occur. Additionally, the scope of this study
was largely limited by the availability of digital WMPs and the popularity in developing WMPs
has surged in more recent years; consequently, this study resulted in an approximately 15- to 20-
year period of study. A similar study conducted 15 years in the future that revisits the identified
trends in planning methodology would produce a more long-term analysis of watershed
planning. Watershed management planning is a promising field for urban municipalities, as the
planning processes, technology, modeling programs, and assimilation of interdisciplinary fields
of study continue to progress.
42
4 CONCLUSION
4.1 IMPLICATIONS
This study has identified existing and emerging trends in watershed management planning
methodologies and procedures, as employed by urban municipalities. 63 WMPs were
qualitatively reviewed based on planning processes, followed by a statistical analysis of planning
factors. The qualitative review and statistical analyses were presented as a state of the practice
review of watershed management planning, supplemented by existing literature and planning
protocols or manuals. Numerous trends in planning methodologies were identified for various
aspects of the planning process; specifically, initial planning steps, data acquisition, tools for
watershed assessment, project implementation, and emerging trends were discussed. Among
these, trends in data management techniques, modeling programs, and technology are a
recognizable driving force. It was also observed that watershed approaches are becoming more
focused on local participation and the complex relationships between water resources, ecology,
biology, and environmental health.
The tools, techniques, and methodologies identified in this study can be a useful resource for
municipalities and watershed planners. These approaches, if effectively employed, can benefit
urban municipalities by informing the allocation of resources and improvement strategies. The
watershed management planning process has been evolving based on improved technologies,
social trends, and changing regulations. This study assessed changes and trends to the planning
process which can benefit future planners through adaptive management techniques.
4.2 FUTURE WORK
While this study reviewed trends in planning processes, the evaluation of the successes or
failures of plan outcomes was not attempted. To understand the effectiveness of the planning
methodologies, plan follow-up and evaluation of implemented strategies will need to occur.
Future research should be conducted that evaluates the effectiveness of planning methodologies
to better inform future efforts. Interviews or surveys conducted with municipalities or other
planning organizations that have developed a WMP would aid in assessing the level of success in
various planning efforts, as well as providing insight into whether certain plan recommendations
43
were employed. This is of particular importance as few plans reviewed in this study reported that
plan-follow up or assessment was completed.
Additionally, the scope of this study was largely limited by the availability of digital WMPs. As
the popularity in developing WMPs has surged in more recent years, and as many older WMPs
may not have been converted to digital format or made available to public use, this study resulted
in an approximately 15- to 20-year period of study. Future research conducted approximately 15
years in the future that revisits the identified trends in planning methodology would produce a
more long-term analysis of watershed planning. Future studies additionally should continue to
investigate existing and emerging technologies, as improvements to data availability and
technological tools have been rapidly progressing in recent decades.
4.3 FINAL WORDS
Watershed management planning is a promising field for urban municipalities, as the planning
processes, technology, modeling programs, and assimilation of interdisciplinary fields of study
continue to progress. This study attempts to evaluate the state of the practice of watershed
management planning to equip urban municipalities and watershed planners with the tools and
knowledge to develop, understand, and employ a WMP. It is important to dynamically adapt to
changing technology, tools, regulations, and social trends, as well as future land use changes and
climate change, in order to improve the health and safety of the public and the environment.
44
REFERENCES
Aguilar, M. F., and Dymond, R. L. (2014). “Innovative Technologies for Storm-Water
Management Programs in Small Urbanized Areas.” Journal of Water Resources Planning
and Management, 140(11), 4014029.
AKRF Inc. (2012). “Mianus River Watershed Based Plan.” The South Western Regional
Planning Agency, Stamford, CT.
Allan, C., Curtis, A., Stankey, G., and Shindler, B. (2008). “Adaptive Management and
Watersheds: A Social Science Perspective.” Journal of the American Water Resources
Association, 44(1), 166–174.
ALOA. (2011). “Parkerson Mill Creek Watershed Management Plan.” Alabama Cooperative
Extension System, Auburn, AL.
Arnold, C. A. (2010). “Adaptive Watershed Planning and Climate Change.” Environmental and
Energy Law and Policy Journal, 5, 417–488.
Arnold, C. L., and Gibbons, C. J. (1996). “Impervious Surface Coverage: The Emergence of a
Key Environmental Indicator.” Journal of the American Planning Association, 62(2), 243–
258.
Arnold, J. G., Kiniry, J. R., Srinivasan, R., Williams, J. R., Haney, E. B., and Neitsch, S. L.
(2012). “Soil & Water Assessment Tool (SWAT) Input/Output Documentation Version
2012.” Texas Water Resources Institute.
Aron, G. (1987). Penn State Runoff Model for IBM PC. Dept. of Civil Engineering and Institute
for Research on Land and Water Resources, Pennsylvania State University.
Atlanta Regional Commission. (2011). “Proctor Creek - Headwaters to Chattahoochee River:
Watershed Improvement Plan.” Atlanta, GA.
Barrett, M. E. (2008). “Comparison of BMP Performance Using the International BMP
Database.” Journal of Irrigation and Drainage Engineering, 134(5), 556–561.
BC/DHA. (2017). “Peachtree Creek Watershed Improvement Plan.” Department of Watersehd
Management, Atlanta, GA.
Bicknell, B. R., Imhoff, J. C., Kittle, Jr., J. L., Donigian, Jr., A. S., and Johanson, R. C. (1997).
“Hydrological Simulation Program: FORTRAN User’s Manual for Version 11.” U.S.
Environmental Protection Agency, National Exposure Research Laboratory, Athens, GA.
45
Blomquist, W., and Schlager, E. (2005). “Political Pitfalls of Integrated Watershed
Management.” Society and Natural Resources, 18(2), 101–117.
Booth, D. B., Hartley, D., and Jackson, R. (2002). “Forest Cover, Impervious-Surface Area, and
the Mitigation of Stormwater Impacts.” Journal of the American Water Resources
Association, 38(3), 947–835.
Born, S. M., and Genskow, K. D. (2001). Toward Understanding New Watershed Initiatives: A
Report from the Madison Watershed Workshop. Madison, WI.
Brabec, E. A. (2009). “Imperviousness and Land-Use Policy: Toward an Effective Approach to
Watershed Planning.” Journal of Hydrologic Engineering, 14(4), 425–433.
Browner, C. M. (1996). Watershed Approach Framework. (EPA Publication No. 840-S-96-001),
U.S. Environmental Protection Agency.
Bushon, R. N., Brady, A. M. G., Christensen, E. D., and Stelzer, E. A. (2017). “Multi-Year
Microbial Source Tracking Study Characterizing Fecal Contamination in an Urban
Watershed.” Water Environment Research, 89(2), 127–143.
Carle, M. V., Halpin, P. N., and Stow, C. A. (2005). “Patterns of Watershed Urbanization and
Impacts on Water Quality.” Journal of the American Water Resources Association
(JAWRA), 41(3), 693–708.
Center for Watershed Protection. (2005). A User’s Guide to Watershed Planning in Maryland.
Center for Watershed Protection, Macris Hendricks and Glasock Inc., and Environmental
Systems Analysis Inc. (2001). “Watts Branch Watershed Study and Management Plan Final
Report.” City of Rockville Department of Public Works, Rockville, MD.
CH2M Hill. (2001). “PLOAD Version 3.0 User’s Manual.” U.S. Environmental Protection
Agency.
Chess, C., and Purcell, K. (1999). “Policy Analysis Public Participation and the Environment:
Do We Know What Works?” Environmental Science & Technology, 33(732), 2685–2692.
Choi, Y., Yi, H., and Park, H.-D. (2011). “A new algorithm for grid-based hydrologic analysis
by incorporating stormwater infrastructure.” Computers & Geosciences, 37(8), 1035–1044.
City of Atlanta. (2017). “Atlanta’s Watersheds.” Office of Watershed Protection, Atlanta, GA,
<http://www.atlantawatershed.org/inside-dwm/offices/watershed-protection/>.
City of Austin. (2016). “Watershed Protection Master Plan.” Watershed Protection Department,
Austin, TX.
46
City of Lincoln. (n.d.). “Watershed Master Plans.”
<https://www.lincoln.ne.gov/city/pworks/watershed/master-plan/> (Mar. 23, 2017).
Committee on Watershed Management. (1999). New Strategies for America’s Watersheds.
National Research Council, National Academy Press, Washington D.C.
Cox, C., and Madramootoo, C. (1998). “Application of Geographic Information Systems in
Watershed Management Planning in St. Lucia.” Computers and Electronics in Agriculture,
20, 229–250.
Cullman County. (1976). “Watershed Plan and Environmental Impact Statement for Watershed
Protection and Flood Prevention: Mud Creek.” Cullman County, AL.
Davenport, T. E. (2003). The Watershed Project Management Guide. Lewis Publishers.
DeShazo, R. P., Garrigan, P., and Merrimack River Initiative. (1996). Watershed Connections,
Lessons Learned in Subwatersheds of the Merrimack River Watershed: The Nashua,
Souhegan and Stony Brook Watersheds. Wilmington, NH.
Doan Brook Watershed Partnership. (2013). “Doan Brook Watershed Action Plan.” Cleveland,
OH.
Doerfer, J. T., and Urbonas, B. R. (2004). “Urban Watershed Master Planning for Stream
Protection in the Denver Metropolitan Area.” Protection and Restoration of Urban and
Rural Streams, American Society of Civil Engineers, 51–60.
Durham. (2017). “Durham’s Watersheds.” Public Works Department, Durham, NC,
<https://durhamnc.gov/705/Durhams-Watersheds>.
EA Engineering Science and Technology Inc. (2012). “Antelope Creek Watershed Basin
Management Plan.” City of Lincoln Watershed Management, and the Lower Platte South
Natural Resources District, Lincoln, NE.
Ebrahimian, A., Wilson, B. N., and Gulliver, J. S. (2016). “Improved methods to estimate the
effective impervious area in urban catchments using rainfall-runoff data.” Journal of
Hydrology, 536, 109–118.
EPA. (1995). Watershed Protection: A Statewide Approach. Office of Water, U.S.
Environmental Protection Agency, Washington D.C.
EPA. (2003). “Watershed Analysis and Management (WAM) Guide for States and
Communities.” Office of Water, U.S. Environmental Protection Agency.
EPA. (2008). Handbook for Developing Watershed Plans to Restore and Protect Our Waters.
47
Office of Water, U.S. Environmental Protection Agency, Washington D.C.
EPA. (2013). “A Quick Guide to Developing Watershed Plans to Restore and Protect Our
Waters.” 59.
EPA. (2017a). “319 Grant Program for States and Territories.” Polluted Runoff: Nonpoint Source
Pollution, <https://www.epa.gov/nps/319-grant-program-states-and-territories> (Mar. 10,
2017).
EPA. (2017b). “National Summary of Impaired Waters and TMDL Information.” U.S.
Environmental Protection Agency, <https://iaspub.epa.gov/waters10/attains_index.home>
(May 1, 2017).
Espinosa-Villegas, C. O., Just, C. L., and Schnoor, J. L. (2005). “Sustainable Watershed
Management: Impacts of a 30-Year Historical Record of Water Quality of the Iowa River.”
Managing Watersheds for Human and Natural Impacts: Engineering, Ecological, and
Economic Challenges, 1741–1748.
ESRI. (2017). “ArcGIS 10.5.1.” Environmental Systems Research Institute (ESRI), Redlands,
CA.
F. X. Browne Inc., Tetra Tech Inc., RESOLVE Inc., and Fairfax County Stormwater Planning
Division. (2011). “Nichol Run and Pond Branch Watershed Management plan.” Fairfax
County, VA.
Fairfax County. (2015). “Watershed Management Plans.” Watersheds, Fairfax County, VA,
<https://www.fairfaxcounty.gov/dpwes/watersheds/>.
FB Environmental Associates. (2014). “Topsham Fair Mall Stream Watershed Based Plan.”
Topsham, ME.
Fisher, R. A. (1970). “The exact treatment of 2x2 tables.” Statistical Methods for Research
Workers, E. A. Cornish, Darien, CT, 96–97.
Fletcher, T. D., Andrieu, H., and Hamel, P. (2013). “Understanding, Management and Modelling
of Urban Hydrology and its Consequences for Receiving Waters: A State of the Art.”
Advances in Water Resources, 51, 261–279.
Galli, J. (1996). “Rapid Stream Assessment Technique (RSAT) Field Methods.” Metropolitan
Washington Council of Governments, Washington D.C.
Glick, R. H. (2009). “Impacts of Impervious Cover and Other Factors on Storm-Water Quality in
Austin, Tex.” Journal of Hydrologic Engineering, 14(4), 316–323.
48
Gregg, F., Rice, T., Kenney, D., and Mutz, K. (1998). “The State Role in Western Watershed
Initiatives.” Natural Resources Law Center, University of Colorado School of Law,
Boulder, CO.
Heaney, J. P., Wright, L., and Sample, D. (2000). “Urban Stormwater and Watershed
Management: A Case Study.” Innovative Urban Wet-Weather Flow Management Systems,
R. Field, J. P. Heaney, and R. Pitt, eds., Technomic Publishing Co. Inc., Lancaster, PA,
329–389.
HydroCAD Software Solutions. (2011). “HydroCAD Stormwater Modeling System Version 10
Owner’s Manual.” Chocorua, NH.
IEPA. (2007). Guidance for Developing Watershed Action Plans in Illinois. Illinois
Environmental Protection Agency; Chicago Metropolitan Agency for Planning, Springfield,
IL.
Jensen, M. E., Bourgeron, P., Everett, R., and Goodman, I. (1996). “Ecosystem Management: A
Landscape Ecology Perspective.” Journal of the American Water Resources Association
(JAWRA), 32(2), 203–216.
St. John, D. (2005). “How Advances in GIS Improve Watershed Master Planning.” Managing
Watersheds for Human and Natural Impacts: Engineering, Ecological, and Economic
Challenges, G. E. Moglen, ed., ASCE, Williamsburg, VA.
Johnson, M. L. (2005). “Using GIS For Stormwater Management and Responsible Land Use
Planning.” Managing Watersheds for Human and Natural Impacts.
Kaplan, J. K., and Watson, B. J. (2013). “Watershed Master Planning, City of Griffin, Georgia,
USA.” Water Resources Management VII, WIT Press, 3–10.
Koski, K., and Lorenz, M. (1999). “Duck Creek Watershed Management Plan.” The Duck Creek
Advisory Group, Juneau, AK.
Lake County. (2017). “Watershed Management Plans.” Stormwater Management Commission,
Lake County, IL, <https://www.lakecountyil.gov/2437/Watershed-Management-Plans>.
Lake County Stormwater Management Commission, and Northwater Consultants. (2014). “Mill
Creek Watershed and Flood Mitigation Plan.” Lake County, IL.
Landers, J. (2010). “Entering the Mainstream.” Civil Engineering, 80(8), 58–69.
Lee, J. G., and Heaney, J. P. (2003). “Estimation of Urban Imperviousness and its Impacts on
Storm Water Systems.” Journal of Water Resources Planning and Management, 129(5),
49
419–426.
Lee, J. G., Selvakumar, A., Alvi, K., Riverson, J., Zhen, J. X., Shoemaker, L., and Lai, F. (2012).
“A watershed-scale design optimization model for stormwater best management practices.”
Environmental Modelling and Software, 37, 6–18.
Leopold, L. B. (1968). Hydrology for Urban Land Planning - A Guidebook on the Hydrologic
Effects of Urban Land Use. Geological Survey Circular, United States Department of the
Interior, Washington D.C.
Maguire, L. A. (2003). “Interplay of Science and Stakeholder Values in Neuse River Total
Maximum Daily Load Process.” Journal of Water Resources Planning and Management,
129(4), 261–270.
McGarity, A. E. (2012). “Storm-Water Investment Strategy Evaluation Model for Impaired
Urban Watersheds.” Journal of Water Resources Planning and Management, 138(2), 111–
124.
McGinnis, M. V. (1999). “Making the Watershed Connection.” Policy Studies Journal, 27(3),
497–501.
McGinnis, M. V., Woolley, J., and Gamman, J. (1999). “Bioregional Conflict Resolution:
Rebuilding Community in Watershed Planning and Organizing.” Environmental
Management, 24(1), 1–12.
MEC Analytical Systems Inc. (2004). “Dominguez Watershed Management Master Plan.”
County of Los Angeles Department of Public Works, Alhambra, CA.
Mirchi, A., Watkins, Jr., D., and Madani, K. (2010). “Modeling for Watershed Planning,
Management, and Decision Making.” Waatersheds: Management, Restoration and
Environmental Impact (Environmental Science, Engineering and Technology), J. C.
Vaughn, ed., Nova Science Publishers Inc.
Montgomery County. (1997). “Lower Merion Drainage Area Act 167 Stormwater Management
Plan.” Montgomery County, PA.
NRC. (2004). Adaptive Management for Water Resources Project Planning. National Research
Council, Washington D.C.
Olsson, J., Amaguchi, H., Alsterhag, E., Daverhog, M., Adrian, P.-E., and Kawamura, A. (2013).
“Adaptation to climate change impacts on urban storm water: a case study in Arvika,
Sweden.” Climatic Change, 116(2), 231–247.
50
Ormsbee, L., and McAlister, M. (2014). “Evolution of a Watershed-Management Framework in
the Kentucky River Basin.” Journal of Water Resource Planning and Management, 140(9),
1–11.
Parsons. (2001). “Stevenson Creek Watershed Management Plan.” Clearwater, FL.
Philadelphia Water Department. (2005). “Tookany/Tacony-Creek Integrated Watershed
Management Plan.” Tookany/Tacony-Frankford Watershed Partnership, Philadelphia, PA.
Pitt, R., Voorhees, J. G., Burger, C. L., and Joachim, D. (1997). “WinSLAMM Version 10.2
User’s Guide.” PV & Associates.
R Core Team. (2017). “R: A Language and Environment for Statistical Computing Version
3.4.2.” R Foundation for Statistical Computing, Vienna, Austria. Retreived from
https://www.r-project-org/.
Rollins, R. W., and Johnson, N. (2012). “Watkins Creek Watershed Management Plan.”
Metropolitan St. Louis Sewer District, St. Louis, MO.
Romanova, A., Horoshenkov, K. V, Tait, S. J., and Ertl, T. (2013). “Sewer Inspections and
Comparison of Acoustic and CCTV Methods.” Water Management, 166(2), 70–80.
Rosgen, D. L. (2001). “A Practical Method of Computing Streambank Erosion Rate.”
Proceedings of the Seventh Federal Interagency Sedimentation Conference, Reno, NV, 9–
15.
Rossman, L. A. (2015). “Storm Water Management Model (SWMM) User’s Manual Version
5.1.” U.S. Environmental Protection Agency, Cincinnati, OH.
Rubin, Z., Kondolf, G. M., and Rios-Touma, B. (2017). “Evaluating Stream Restoration Projects:
What Do We Learn from Monitoring?” Water, 9(3), 174–189.
Ruhl, J. B. (1999). “The (Political) Science of Watershed Management in the Ecosystem Age.”
Journal of the American Water Resources Association, 35(3), 519–526.
Rutgers Cooperative Extension Water Resources Program. (2013). “Tenakill Brook Watershed
Restoration and Protection Plan.” Bergen County, NJ.
Salvadore, E., Bronders, J., and Batelaan, O. (2015). “Hydrological Modelling of Urbanized
Catchments: A Review and Future Directions.” Journal of Hydrology, 529, 62–81.
Schueler, T. (1987). Controlling Urban Runoff: A Practical Manual for Planning and Designing
Urban BMPs. Metropolitan Washington Council of Governments, Washington D.C.
Schueler, T. R. (1996). “Crafting Better Urban Watershed Protection Plans.” Watershed
51
Protection Techniques, 2(2), 329–337.
Semadeni-Davies, A., Hernebring, C., Svensson, G., and Gustafsson, L.-G. (2008). “The impacts
of climate change and urbanisation on drainage in Helsingborg, Sweden: Suburban
stormwater.” Journal of Hydrology, 350(1–2), 114–125.
Seth, I., Soonthornnonda, P., and Christensen, E. R. (2006). “Use of GIS in Urban Storm-Water
Modeling.” Journal of Environmental Engineering, 132(12), 1550–1553.
Shilling, F., Sommarstrom, S., Kattelmann, R., Florsheim, J., Henly, R., and Washburn, B.
(2005). “The California Watershed Assessment Manual: Volume I.”
Soil Conservation Service. (1992). “TR-20 Computer Program for Project Formulation
Hydrology.” Soil Conservation Service Hydrology Unit and Technology Development
Support Staff.
Somerville, D. E., and Pruitt, B. A. (2004). “Physical Stream Assessment: A Review of Selected
Protocols for Use in the Clean Water Act Section 404 Program.” U.S. Environmental
Protection Agency, Office of Wetlands, Oceans, and Watersheds, Wetlands Division,
Washington D.C.
Streamline Technologies Inc. (2016). “Interconnected Channel and Pond Routing Model (ICPR)
Version 4.” Available from http://www.streamnologies.com/, Winter Springs, FL.
Strecker, E. W., Quigley, M. M., Urbonas, B. R., Jones, J. E., and Clary, J. K. (2001).
“Determining Urban Storm Water BMP Effectiveness.” Journal of Water Resources
Planning and Management, 127(3), 144–149.
Talebi, L., Kuczynski, A., Graettinger, A. J., and Pitt, R. (2014). “Automated Classification of
Urban Areas for Storm Water Management Using Aerial Photography and LiDAR.”
Journal of Hydrologic Engineering, 19(5), 887–895.
Teng, J., Jakeman, A. J., Vaze, J., Croke, B. F. W., Dutta, D., and Kim, S. (2017). “Flood
Inundation Modelling: A Review of Methods, Recent Advances and Uncertainty Analysis.”
Environmental Modelling and Software, 90, 201–216.
Terstriep, M. L., and Stall, J. B. (1974). “The Illinois Urban Drainage Area Simulator;
ILLUDAS.” Illinois State Water Survey, Urbana, IL.
Tetra Tech Inc. (2009). “Loading Simulation Program in C++ (LSPC) Version 3.1 User’s
Manual.” Fairfax, VA.
Tetra Tech Inc. (2017). “User’s Guide: Spreadsheet Tool for the Estimation of Pollutant Load
52
(STEPL) Version 4.4.” U.S. Environmental Protection Agency, Fairfax, VA.
The Louis Berger Group Inc., Gannett Fleming Inc., and City of Fairfax. (2005). “City of
Fairfax, Virginia Watershed Management Plan.” City of Fairfax, Fairfax, VA.
U.S. Army Corps of Engineers. (1998). “HEC-1 Flood Hydrograph Package User’s Manual
Version 4.1.” U.S. Army Corps of Engineers Hydrologic Engineering Center, Davis, CA.
U.S. Army Corps of Engineers. (2016a). “HEC-RAS River Analysis System User’s Manual
Version 5.0.” U.S. Army Corps of Engineers Hydrologic Engineering Center, Davis, CA.
U.S. Army Corps of Engineers. (2016b). “Hydrologic Modeling System HEC-HMS User’s
Manual Version 4.2.” U.S. Army Corps of Engineers Hydrologic Engineering Center,
Davis, CA.
University of Arkansas Community Design Center, Fay Jones School of Architecture + Design,
University of Arkansas Department of Biological and Agricultural Engineering, Arkansas
Natural Resources Commission, and City of Conway. (2016). “Conway Urban Watershed
Framework Plan.” Conway, AR.
USDA. (1998). “Stream Visual Assessment Protocol.” National Water and Climate Center
Technical Note 99-1, U.S. Department of Agriculture, Natural Resources Conservation
Service.
USDA-ARS, EPA, and University of Wyoming. (2015). “Automated Geospatial Watershed
Assessment (AGWA) Version 3.” U.S. Department of Agriculture Southwest Watershed
Research Center, Tucson, AZ.
Wagner, W. E. (2006). “Stormy Regulation: The Problems that Result when Stormwater (and
Other) Regulatory Programs Neglect to Account for Limitations in Scientific and Technical
Information.” Chapman Law Review, 9(2), 191–231.
Walsh, C. J., Booth, D. B., Burns, M. J., Fletcher, T. D., Hale, R. L., Hoang, L. N., Livingston,
G., Rippy, M. A., Roy, A. H., Scoggins, M., and Wallace, A. (2016). “Principles for urban
stormwater management to protect stream ecosystems.” Journal of Freshwater Science,
35(1), 398–411.
Walsh, C. J., Roy, A. H., Feminella, J. W., Cottingham, P. D., Groffman, P. M., and Morgan, R.
P. I. (2005). “The Urban Stream Syndrome: Current Knowledge and the Search for a Cure.”
Journal of the North American Benthological Society, 24(3), 706–723.
Wang, G., Mang, S., Cai, H., Liu, S., Zhang, Z., Wang, L., and Innes, J. L. (2016). “Integrated
53
Watershed Management: Evolution, Development, and Emerging Trends.” Journal of
Forestry Research, Springer Berlin Heidelberg, 27(5), 967–994.
Wang, Y., Montas, H. J., Brubaker, K. L., Leisnham, P. T., Shirmohammadi, A., Chanse, V., and
Rockler, A. K. (2017). “A Diagnostic Decision Support System for BMP Selection in Small
Urban Watershed.” Water Resources Management, 31(5), 1649–1664.
Western Water Policy Review Advisory Commission. (1998). Water in the West: The Challenge
for the Next Century. Albuquerque, NM.
Whipple, W., Grigg, N. S., Grizzard, T., Randall, C. W., Schubinski, R. P., and Tucker, L. S.
(1983). Stormwater Management in Urbanizing Areas. Prentice-Hall Inc., Englewood
Cliffs, NJ.
Whiteaker, T. L., Maidment, D. R., Goodall, J. L., and Takamatsu, M. (2006). “Integrating Arc
Hydro Features with a Schematic Network.” Transactions in GIS, 10(2), 219–237.
Willems, P., Arnbjerg-Nielsen, K., Olsson, J., and Nguyen, V. T. V. (2012). “Climate Change
Impact Assessment on Urban Rainfall Extremes and Urban Drainage: Methods and
Shortcomings.” Atmospheric Research, 103, 106–118.
Wurbs, R. A. (1994). Computer Models for Water Resources Planning and Management.
Institute for Water Resources.
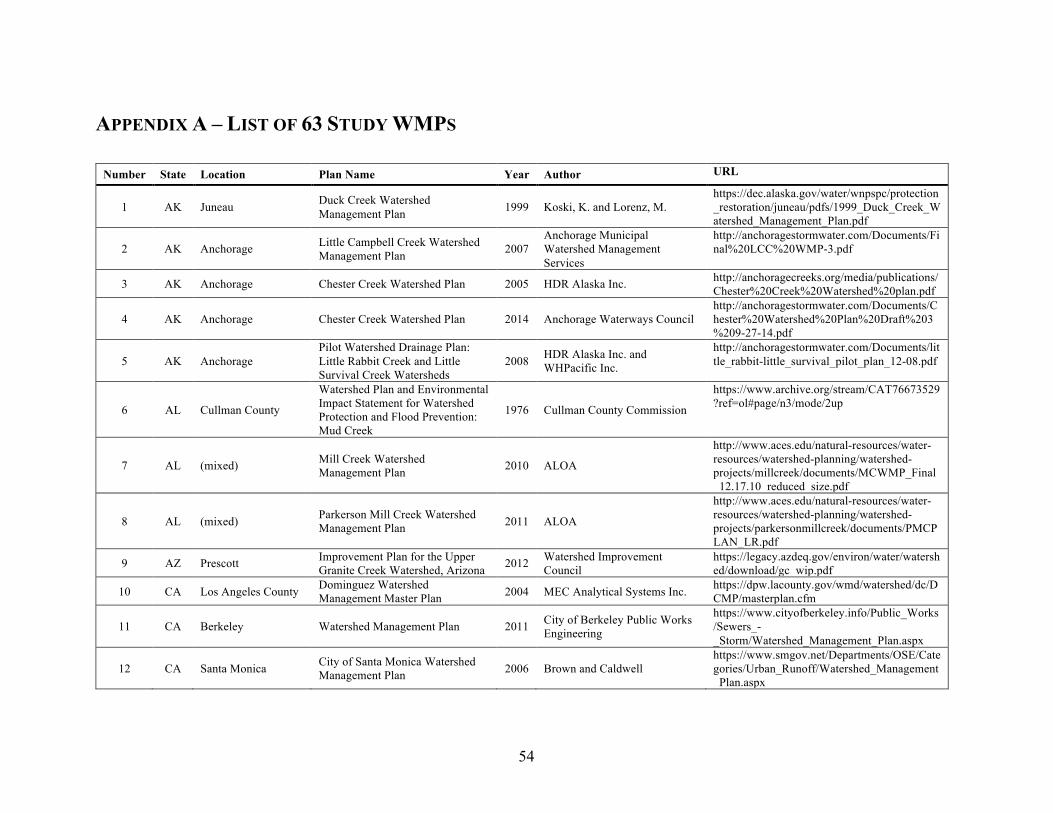
54
APPENDIX A – LIST OF 63 STUDY WMPS
Number State Location Plan Name Year Author URL
1 AK Juneau Duck Creek Watershed Management Plan 1999 Koski, K. and Lorenz, M.
https://dec.alaska.gov/water/wnpspc/protection_restoration/juneau/pdfs/1999_Duck_Creek_Watershed_Management_Plan.pdf
2 AK Anchorage Little Campbell Creek Watershed Management Plan 2007
Anchorage Municipal Watershed Management Services
http://anchoragestormwater.com/Documents/Final%20LCC%20WMP-3.pdf
3 AK Anchorage Chester Creek Watershed Plan 2005 HDR Alaska Inc. http://anchoragecreeks.org/media/publications/Chester%20Creek%20Watershed%20plan.pdf
4 AK Anchorage Chester Creek Watershed Plan 2014 Anchorage Waterways Council http://anchoragestormwater.com/Documents/Chester%20Watershed%20Plan%20Draft%203%209-27-14.pdf
5 AK Anchorage Pilot Watershed Drainage Plan: Little Rabbit Creek and Little Survival Creek Watersheds
2008 HDR Alaska Inc. and WHPacific Inc.
http://anchoragestormwater.com/Documents/little_rabbit-little_survival_pilot_plan_12-08.pdf
6 AL Cullman County
Watershed Plan and Environmental Impact Statement for Watershed Protection and Flood Prevention: Mud Creek
1976 Cullman County Commission
https://www.archive.org/stream/CAT76673529?ref=ol#page/n3/mode/2up
7 AL (mixed) Mill Creek Watershed Management Plan 2010 ALOA
http://www.aces.edu/natural-resources/water-resources/watershed-planning/watershed-projects/millcreek/documents/MCWMP_Final_12.17.10_reduced_size.pdf
8 AL (mixed) Parkerson Mill Creek Watershed Management Plan 2011 ALOA
http://www.aces.edu/natural-resources/water-resources/watershed-planning/watershed-projects/parkersonmillcreek/documents/PMCPLAN_LR.pdf
9 AZ Prescott Improvement Plan for the Upper Granite Creek Watershed, Arizona 2012 Watershed Improvement
Council https://legacy.azdeq.gov/environ/water/watershed/download/gc_wip.pdf
10 CA Los Angeles County Dominguez Watershed Management Master Plan 2004 MEC Analytical Systems Inc. https://dpw.lacounty.gov/wmd/watershed/dc/D
CMP/masterplan.cfm
11 CA Berkeley Watershed Management Plan 2011 City of Berkeley Public Works Engineering
https://www.cityofberkeley.info/Public_Works/Sewers_-_Storm/Watershed_Management_Plan.aspx
12 CA Santa Monica City of Santa Monica Watershed Management Plan 2006 Brown and Caldwell
https://www.smgov.net/Departments/OSE/Categories/Urban_Runoff/Watershed_Management_Plan.aspx
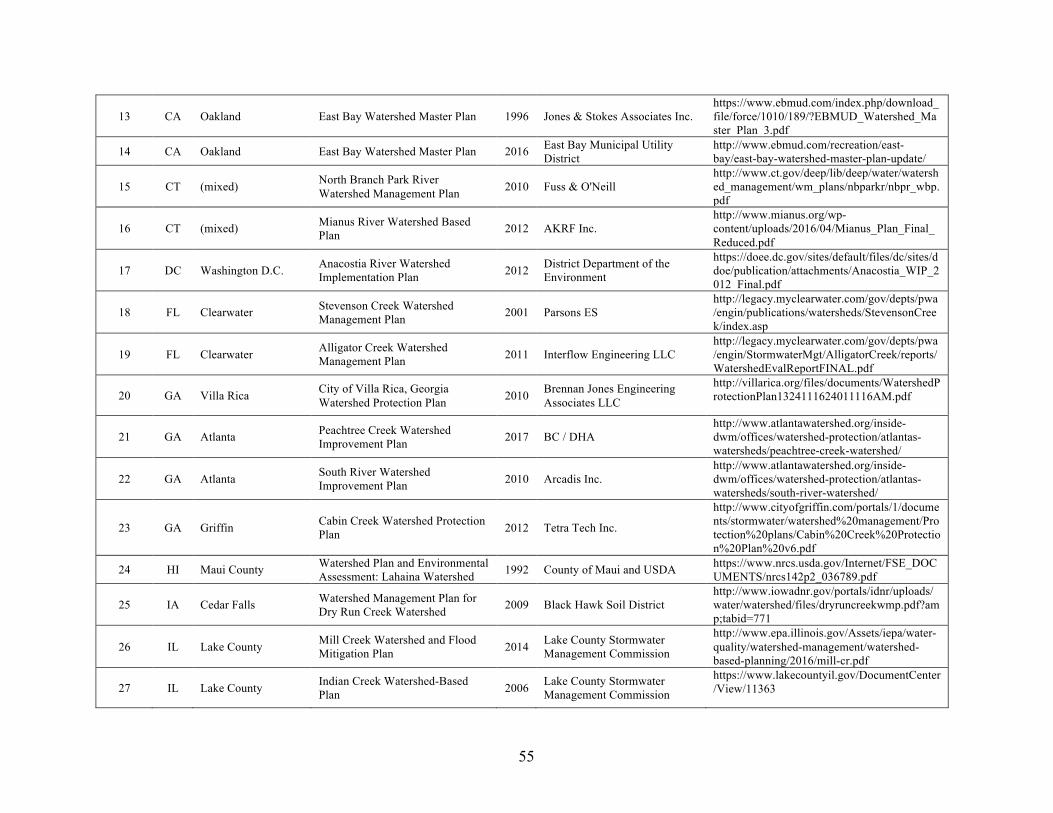
55
13 CA Oakland East Bay Watershed Master Plan 1996 Jones & Stokes Associates Inc. https://www.ebmud.com/index.php/download_file/force/1010/189/?EBMUD_Watershed_Master_Plan_3.pdf
14 CA Oakland East Bay Watershed Master Plan 2016 East Bay Municipal Utility District
http://www.ebmud.com/recreation/east-bay/east-bay-watershed-master-plan-update/
15 CT (mixed) North Branch Park River Watershed Management Plan 2010 Fuss & O'Neill
http://www.ct.gov/deep/lib/deep/water/watershed_management/wm_plans/nbparkr/nbpr_wbp.pdf
16 CT (mixed) Mianus River Watershed Based Plan 2012 AKRF Inc.
http://www.mianus.org/wp-content/uploads/2016/04/Mianus_Plan_Final_Reduced.pdf
17 DC Washington D.C. Anacostia River Watershed Implementation Plan 2012 District Department of the
Environment
https://doee.dc.gov/sites/default/files/dc/sites/ddoe/publication/attachments/Anacostia_WIP_2012_Final.pdf
18 FL Clearwater Stevenson Creek Watershed Management Plan 2001 Parsons ES
http://legacy.myclearwater.com/gov/depts/pwa/engin/publications/watersheds/StevensonCreek/index.asp
19 FL Clearwater Alligator Creek Watershed Management Plan 2011 Interflow Engineering LLC
http://legacy.myclearwater.com/gov/depts/pwa/engin/StormwaterMgt/AlligatorCreek/reports/WatershedEvalReportFINAL.pdf
20 GA Villa Rica City of Villa Rica, Georgia Watershed Protection Plan 2010 Brennan Jones Engineering
Associates LLC
http://villarica.org/files/documents/WatershedProtectionPlan1324111624011116AM.pdf
21 GA Atlanta Peachtree Creek Watershed Improvement Plan 2017 BC / DHA
http://www.atlantawatershed.org/inside-dwm/offices/watershed-protection/atlantas-watersheds/peachtree-creek-watershed/
22 GA Atlanta South River Watershed Improvement Plan 2010 Arcadis Inc.
http://www.atlantawatershed.org/inside-dwm/offices/watershed-protection/atlantas-watersheds/south-river-watershed/
23 GA Griffin Cabin Creek Watershed Protection Plan 2012 Tetra Tech Inc.
http://www.cityofgriffin.com/portals/1/documents/stormwater/watershed%20management/Protection%20plans/Cabin%20Creek%20Protection%20Plan%20v6.pdf
24 HI Maui County Watershed Plan and Environmental Assessment: Lahaina Watershed 1992 County of Maui and USDA https://www.nrcs.usda.gov/Internet/FSE_DOC
UMENTS/nrcs142p2_036789.pdf
25 IA Cedar Falls Watershed Management Plan for Dry Run Creek Watershed 2009 Black Hawk Soil District
http://www.iowadnr.gov/portals/idnr/uploads/water/watershed/files/dryruncreekwmp.pdf?amp;tabid=771
26 IL Lake County Mill Creek Watershed and Flood Mitigation Plan 2014 Lake County Stormwater
Management Commission
http://www.epa.illinois.gov/Assets/iepa/water-quality/watershed-management/watershed-based-planning/2016/mill-cr.pdf
27 IL Lake County Indian Creek Watershed-Based Plan 2006 Lake County Stormwater
Management Commission
https://www.lakecountyil.gov/DocumentCenter/View/11363
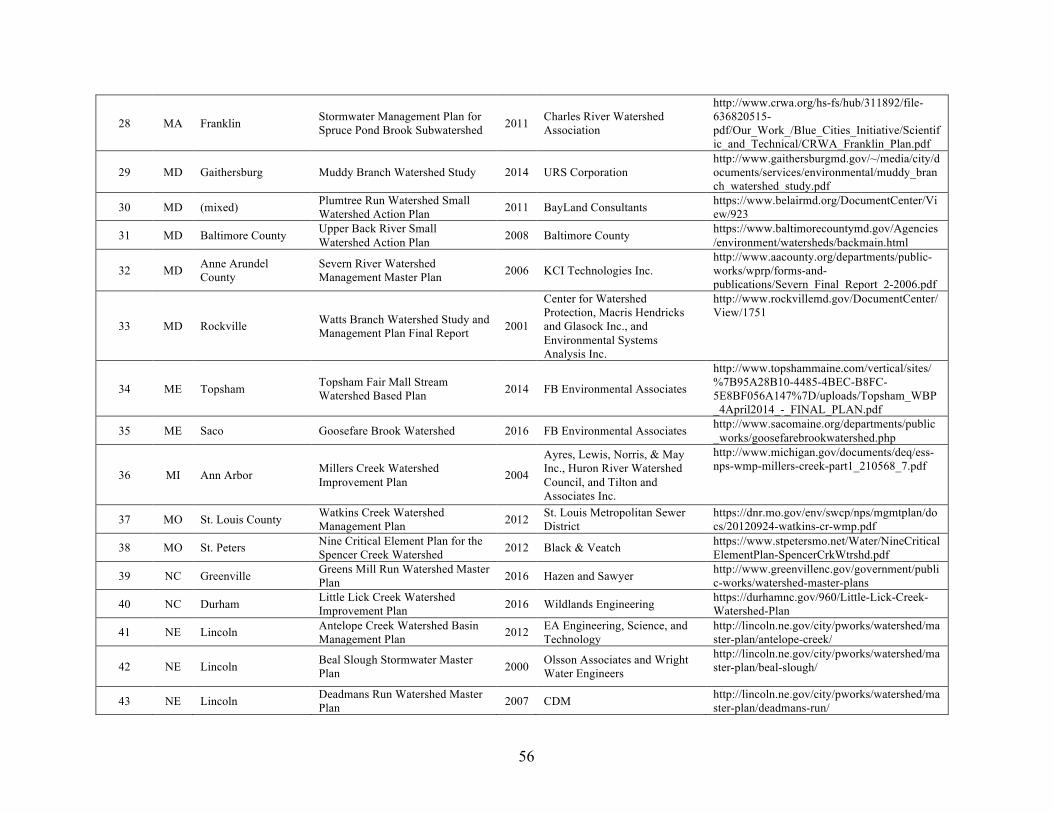
56
28 MA Franklin Stormwater Management Plan for Spruce Pond Brook Subwatershed 2011 Charles River Watershed
Association
http://www.crwa.org/hs-fs/hub/311892/file-636820515-pdf/Our_Work_/Blue_Cities_Initiative/Scientific_and_Technical/CRWA_Franklin_Plan.pdf
29 MD Gaithersburg Muddy Branch Watershed Study 2014 URS Corporation http://www.gaithersburgmd.gov/~/media/city/documents/services/environmental/muddy_branch_watershed_study.pdf
30 MD (mixed) Plumtree Run Watershed Small Watershed Action Plan 2011 BayLand Consultants https://www.belairmd.org/DocumentCenter/Vi
ew/923
31 MD Baltimore County Upper Back River Small Watershed Action Plan 2008 Baltimore County https://www.baltimorecountymd.gov/Agencies
/environment/watersheds/backmain.html
32 MD Anne Arundel County
Severn River Watershed Management Master Plan 2006 KCI Technologies Inc.
http://www.aacounty.org/departments/public-works/wprp/forms-and-publications/Severn_Final_Report_2-2006.pdf
33 MD Rockville Watts Branch Watershed Study and Management Plan Final Report 2001
Center for Watershed Protection, Macris Hendricks and Glasock Inc., and Environmental Systems Analysis Inc.
http://www.rockvillemd.gov/DocumentCenter/View/1751
34 ME Topsham Topsham Fair Mall Stream Watershed Based Plan 2014 FB Environmental Associates
http://www.topshammaine.com/vertical/sites/%7B95A28B10-4485-4BEC-B8FC-5E8BF056A147%7D/uploads/Topsham_WBP_4April2014_-_FINAL_PLAN.pdf
35 ME Saco Goosefare Brook Watershed 2016 FB Environmental Associates http://www.sacomaine.org/departments/public_works/goosefarebrookwatershed.php
36 MI Ann Arbor Millers Creek Watershed Improvement Plan 2004
Ayres, Lewis, Norris, & May Inc., Huron River Watershed Council, and Tilton and Associates Inc.
http://www.michigan.gov/documents/deq/ess-nps-wmp-millers-creek-part1_210568_7.pdf
37 MO St. Louis County Watkins Creek Watershed Management Plan 2012 St. Louis Metropolitan Sewer
District https://dnr.mo.gov/env/swcp/nps/mgmtplan/docs/20120924-watkins-cr-wmp.pdf
38 MO St. Peters Nine Critical Element Plan for the Spencer Creek Watershed 2012 Black & Veatch https://www.stpetersmo.net/Water/NineCritical
ElementPlan-SpencerCrkWtrshd.pdf
39 NC Greenville Greens Mill Run Watershed Master Plan 2016 Hazen and Sawyer http://www.greenvillenc.gov/government/publi
c-works/watershed-master-plans
40 NC Durham Little Lick Creek Watershed Improvement Plan 2016 Wildlands Engineering https://durhamnc.gov/960/Little-Lick-Creek-
Watershed-Plan
41 NE Lincoln Antelope Creek Watershed Basin Management Plan 2012 EA Engineering, Science, and
Technology http://lincoln.ne.gov/city/pworks/watershed/master-plan/antelope-creek/
42 NE Lincoln Beal Slough Stormwater Master Plan 2000 Olsson Associates and Wright
Water Engineers
http://lincoln.ne.gov/city/pworks/watershed/master-plan/beal-slough/
43 NE Lincoln Deadmans Run Watershed Master Plan 2007 CDM http://lincoln.ne.gov/city/pworks/watershed/ma
ster-plan/deadmans-run/
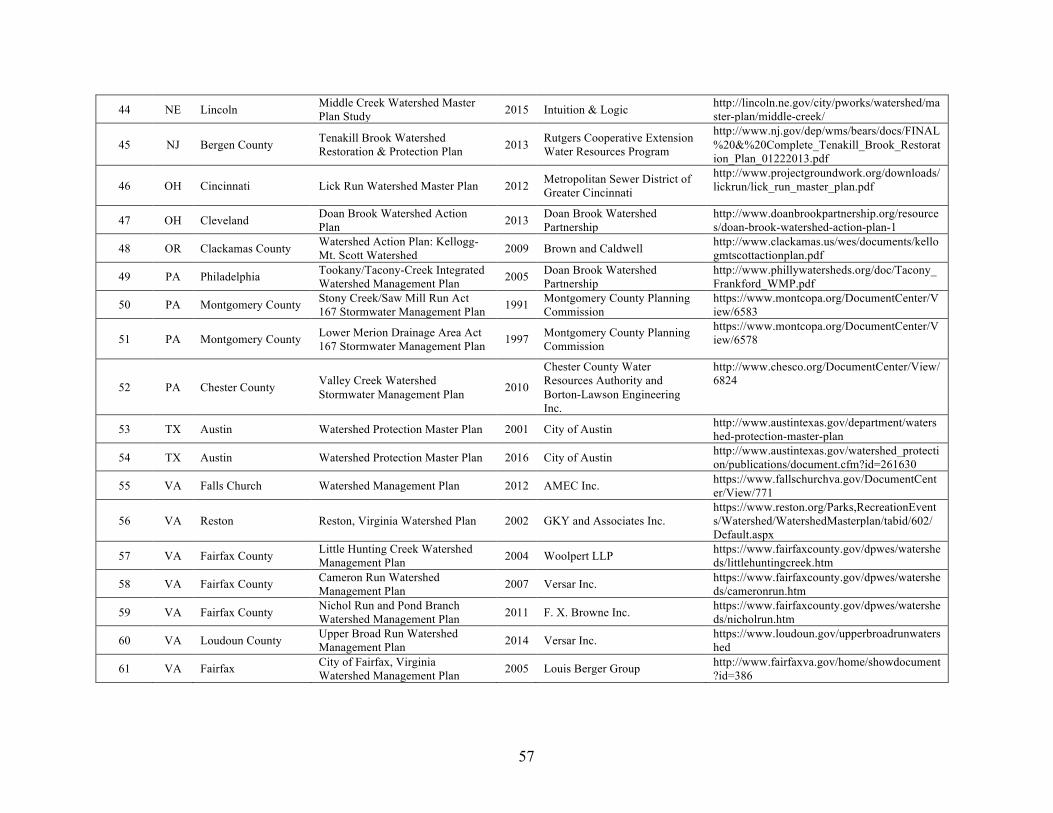
57
44 NE Lincoln Middle Creek Watershed Master Plan Study 2015 Intuition & Logic http://lincoln.ne.gov/city/pworks/watershed/ma
ster-plan/middle-creek/
45 NJ Bergen County Tenakill Brook Watershed Restoration & Protection Plan 2013 Rutgers Cooperative Extension
Water Resources Program
http://www.nj.gov/dep/wms/bears/docs/FINAL%20&%20Complete_Tenakill_Brook_Restoration_Plan_01222013.pdf
46 OH Cincinnati Lick Run Watershed Master Plan 2012 Metropolitan Sewer District of Greater Cincinnati
http://www.projectgroundwork.org/downloads/lickrun/lick_run_master_plan.pdf
47 OH Cleveland Doan Brook Watershed Action Plan 2013 Doan Brook Watershed
Partnership http://www.doanbrookpartnership.org/resources/doan-brook-watershed-action-plan-1
48 OR Clackamas County Watershed Action Plan: Kellogg-Mt. Scott Watershed 2009 Brown and Caldwell http://www.clackamas.us/wes/documents/kello
gmtscottactionplan.pdf
49 PA Philadelphia Tookany/Tacony-Creek Integrated Watershed Management Plan 2005 Doan Brook Watershed
Partnership http://www.phillywatersheds.org/doc/Tacony_Frankford_WMP.pdf
50 PA Montgomery County Stony Creek/Saw Mill Run Act 167 Stormwater Management Plan 1991 Montgomery County Planning
Commission https://www.montcopa.org/DocumentCenter/View/6583
51 PA Montgomery County Lower Merion Drainage Area Act 167 Stormwater Management Plan 1997 Montgomery County Planning
Commission
https://www.montcopa.org/DocumentCenter/View/6578
52 PA Chester County Valley Creek Watershed Stormwater Management Plan 2010
Chester County Water Resources Authority and Borton-Lawson Engineering Inc.
http://www.chesco.org/DocumentCenter/View/6824
53 TX Austin Watershed Protection Master Plan 2001 City of Austin http://www.austintexas.gov/department/watershed-protection-master-plan
54 TX Austin Watershed Protection Master Plan 2016 City of Austin http://www.austintexas.gov/watershed_protection/publications/document.cfm?id=261630
55 VA Falls Church Watershed Management Plan 2012 AMEC Inc. https://www.fallschurchva.gov/DocumentCenter/View/771
56 VA Reston Reston, Virginia Watershed Plan 2002 GKY and Associates Inc. https://www.reston.org/Parks,RecreationEvents/Watershed/WatershedMasterplan/tabid/602/Default.aspx
57 VA Fairfax County Little Hunting Creek Watershed Management Plan 2004 Woolpert LLP https://www.fairfaxcounty.gov/dpwes/watershe
ds/littlehuntingcreek.htm
58 VA Fairfax County Cameron Run Watershed Management Plan 2007 Versar Inc. https://www.fairfaxcounty.gov/dpwes/watershe
ds/cameronrun.htm
59 VA Fairfax County Nichol Run and Pond Branch Watershed Management Plan 2011 F. X. Browne Inc. https://www.fairfaxcounty.gov/dpwes/watershe
ds/nicholrun.htm
60 VA Loudoun County Upper Broad Run Watershed Management Plan 2014 Versar Inc. https://www.loudoun.gov/upperbroadrunwaters
hed
61 VA Fairfax City of Fairfax, Virginia Watershed Management Plan 2005 Louis Berger Group http://www.fairfaxva.gov/home/showdocument
?id=386
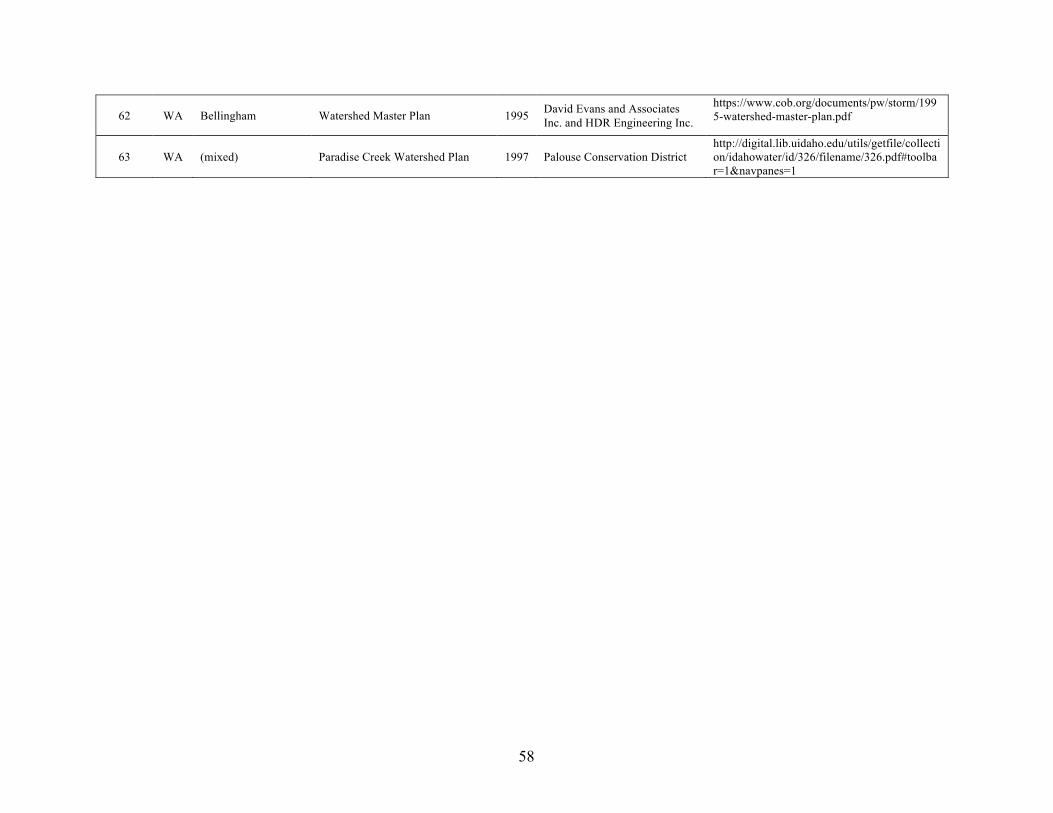
58
62 WA Bellingham Watershed Master Plan 1995 David Evans and Associates Inc. and HDR Engineering Inc.
https://www.cob.org/documents/pw/storm/1995-watershed-master-plan.pdf
63 WA (mixed) Paradise Creek Watershed Plan 1997 Palouse Conservation District http://digital.lib.uidaho.edu/utils/getfile/collection/idahowater/id/326/filename/326.pdf#toolbar=1&navpanes=1
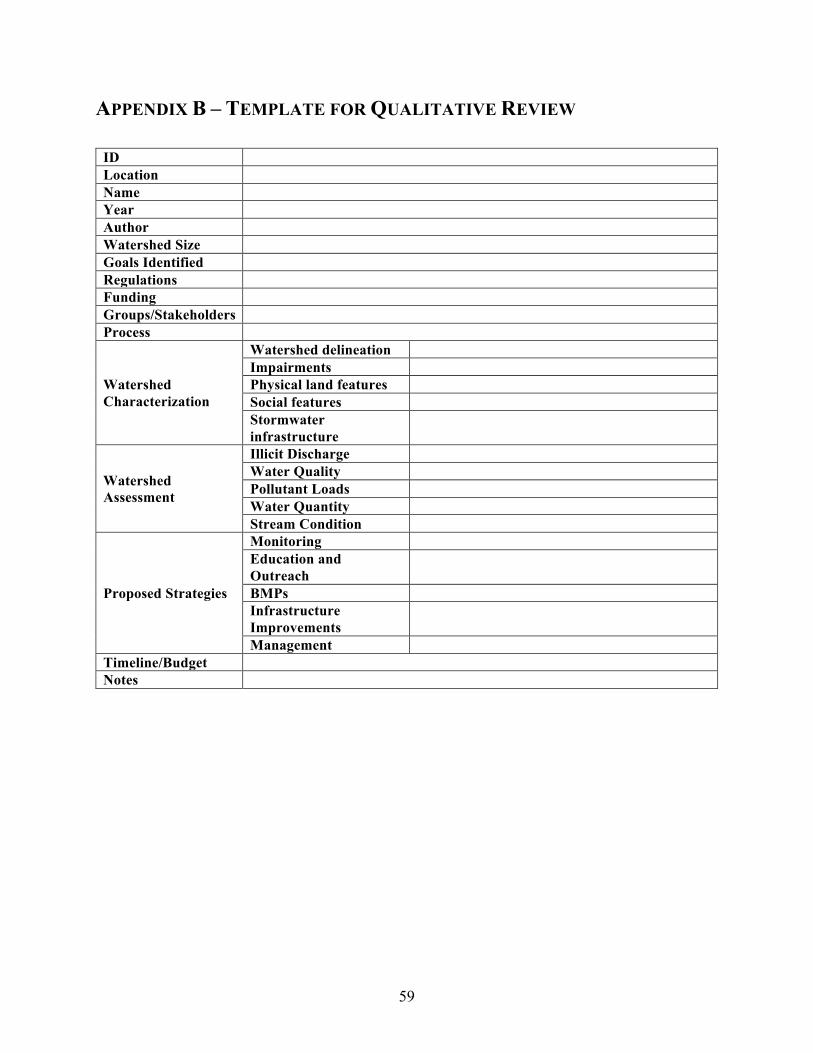
59
APPENDIX B – TEMPLATE FOR QUALITATIVE REVIEW
ID Location Name Year Author Watershed Size Goals Identified Regulations Funding Groups/Stakeholders Process
Watershed Characterization
Watershed delineation Impairments Physical land features Social features Stormwater infrastructure
Watershed Assessment
Illicit Discharge Water Quality Pollutant Loads Water Quantity Stream Condition
Proposed Strategies
Monitoring Education and Outreach
BMPs Infrastructure Improvements
Management Timeline/Budget Notes
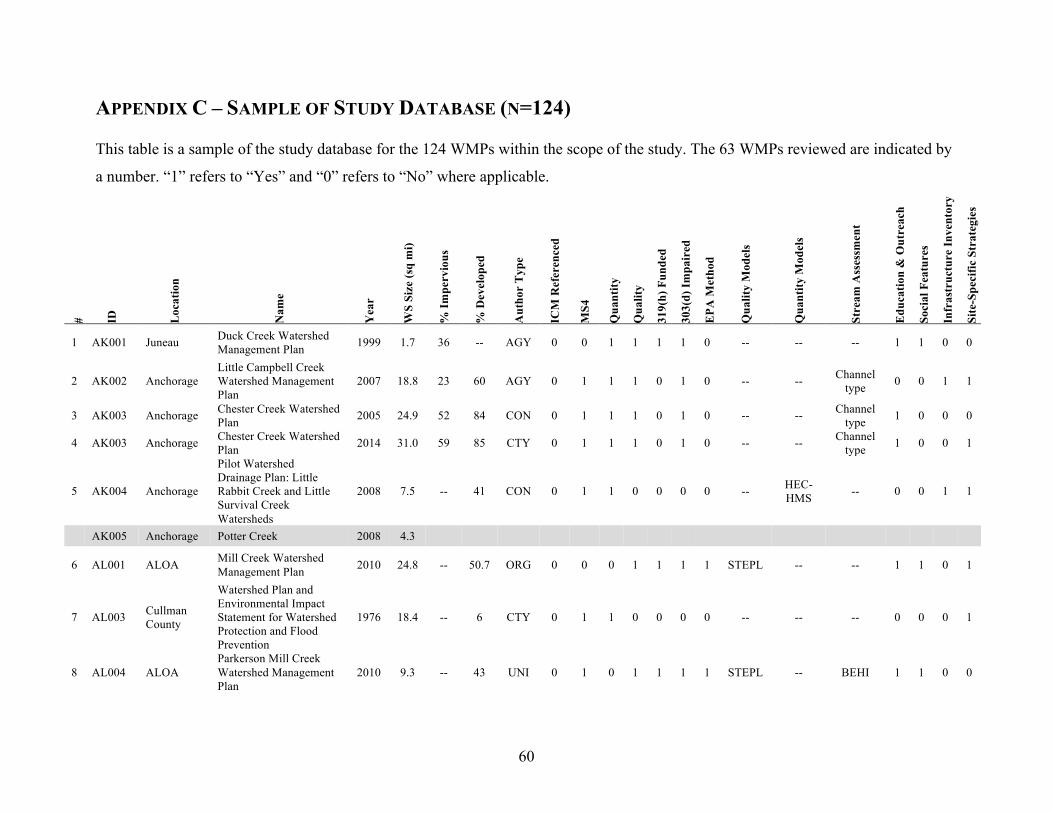
60
APPENDIX C – SAMPLE OF STUDY DATABASE (N=124)
This table is a sample of the study database for the 124 WMPs within the scope of the study. The 63 WMPs reviewed are indicated by
a number. “1” refers to “Yes” and “0” refers to “No” where applicable.
# ID
Loc
atio
n
Nam
e
Yea
r
WS
Size
(sq
mi)
% Im
perv
ious
% D
evel
oped
Aut
hor
Typ
e
ICM
Ref
eren
ced
MS4
Qua
ntity
Qua
lity
319(
h) F
unde
d
303(
d) Im
pair
ed
EPA
Met
hod
Qua
lity
Mod
els
Qua
ntity
Mod
els
Stre
am A
sses
smen
t
Edu
catio
n &
Out
reac
h
Soci
al F
eatu
res
Infr
astr
uctu
re In
vent
ory
Site
-Spe
cific
Str
ateg
ies
1 AK001 Juneau Duck Creek Watershed Management Plan 1999 1.7 36 -- AGY 0 0 1 1 1 1 0 -- -- -- 1 1 0 0
2 AK002 Anchorage Little Campbell Creek Watershed Management Plan
2007 18.8 23 60 AGY 0 1 1 1 0 1 0 -- -- Channel type 0 0 1 1
3 AK003 Anchorage Chester Creek Watershed Plan 2005 24.9 52 84 CON 0 1 1 1 0 1 0 -- -- Channel
type 1 0 0 0
4 AK003 Anchorage Chester Creek Watershed Plan 2014 31.0 59 85 CTY 0 1 1 1 0 1 0 -- -- Channel
type 1 0 0 1
5 AK004 Anchorage
Pilot Watershed Drainage Plan: Little Rabbit Creek and Little Survival Creek Watersheds
2008 7.5 -- 41 CON 0 1 1 0 0 0 0 -- HEC-HMS -- 0 0 1 1
AK005 Anchorage Potter Creek 2008 4.3
6 AL001 ALOA Mill Creek Watershed Management Plan 2010 24.8 -- 50.7 ORG 0 0 0 1 1 1 1 STEPL -- -- 1 1 0 1
7 AL003 Cullman County
Watershed Plan and Environmental Impact Statement for Watershed Protection and Flood Prevention
1976 18.4 -- 6 CTY 0 1 1 0 0 0 0 -- -- -- 0 0 0 1
8 AL004 ALOA Parkerson Mill Creek Watershed Management Plan
2010 9.3 -- 43 UNI 0 1 0 1 1 1 1 STEPL -- BEHI 1 1 0 0
Recommended