Mega Trends in Workers Compensation
Past, Present and Future16th Annual AMCOMP Conference
Las Vegas, NVMarch 27, 2014
Download at www.iii.org/presentationsRobert P. Hartwig, Ph.D., CPCU, President & Economist
Insurance Information Institute 110 William Street New York, NY 10038Tel: 212.346.5520 Cell: 917.453.1885 [email protected] www.iii.org
2
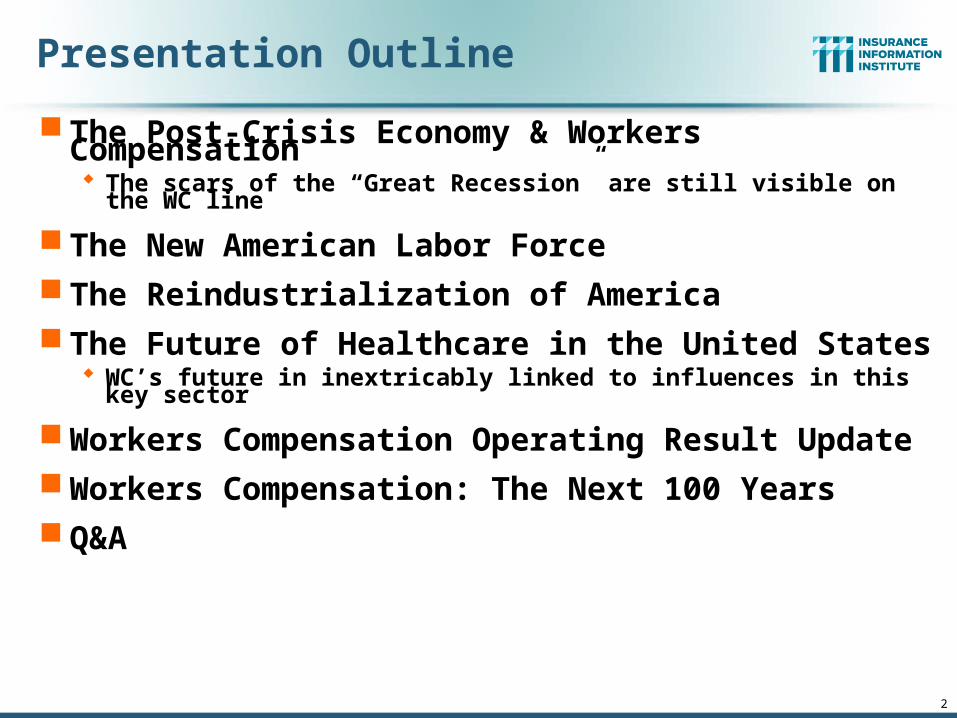
Presentation Outline
The Post-Crisis Economy & Workers Compensation The scars of the “Great Recession” are still visible on the WC line
The New American Labor Force The Reindustrialization of America The Future of Healthcare in the United States
WC’s future in inextricably linked to influences in this key sector
Workers Compensation Operating Result Update Workers Compensation: The Next 100 Years Q&A
The Slow and Uneven Nature of the Economic Recovery Is
Changing the WC Playing Field
3
Despite a Still-Sluggish Economy, there Are Potent Growth Drivers for Workers
Comp and Commercial Insurers in General
3
4
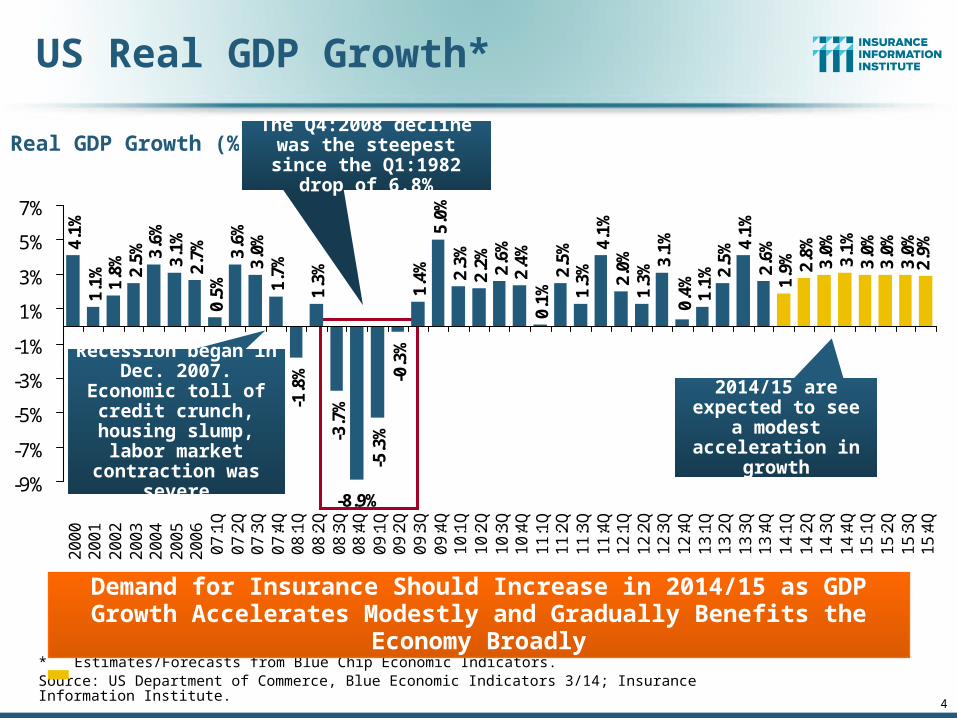
US Real GDP Growth*
* Estimates/Forecasts from Blue Chip Economic Indicators.Source: US Department of Commerce, Blue Economic Indicators 3/14; Insurance Information Institute.
2.7%
0.5%
3.6%
3.0%
1.7%
-1.8
%1.
3%-3
.7%
-5.3
%-0
.3%
1.4%
5.0%
2.3%
2.2% 2.6%
2.4%
0.1%
2.5%
1.3%
4.1%
2.0%
1.3%
3.1%
1.1% 2.
5%4.
1%2.
6%1.
9% 2.8%
3.0%
3.1%
3.0%
3.0%
3.0%
2.9%
0.4%
-8.9%
4.1%
1.1% 1.
8% 2.5% 3.
6%3.
1%
-9%
-7%
-5%
-3%
-1%
1%
3%
5%
7%
2
00
0
2
00
1
2
00
2
2
00
3
2
00
4
2
00
5
2
00
6
07
:1Q
07
:2Q
07
:3Q
07
:4Q
08
:1Q
08
:2Q
08
:3Q
08
:4Q
09
:1Q
09
:2Q
09
:3Q
09
:4Q
10
:1Q
10
:2Q
10
:3Q
10
:4Q
11
:1Q
11
:2Q
11
:3Q
11
:4Q
12
:1Q
12
:2Q
12
:3Q
12
:4Q
13
:1Q
13
:2Q
13
:3Q
13
:4Q
14
:1Q
14
:2Q
14
:3Q
14
:4Q
15
:1Q
15
:2Q
15
:3Q
15
:4Q
Demand for Insurance Should Increase in 2014/15 as GDP Growth Accelerates Modestly and Gradually Benefits the Economy Broadly
Real GDP Growth (%)
Recession began in Dec. 2007. Economic toll of credit crunch, housing slump, labor market contraction
was severe
The Q4:2008 decline was the steepest since the Q1:1982 drop of 6.8%
2014/15 are expected to see a
modest acceleration in growth
5
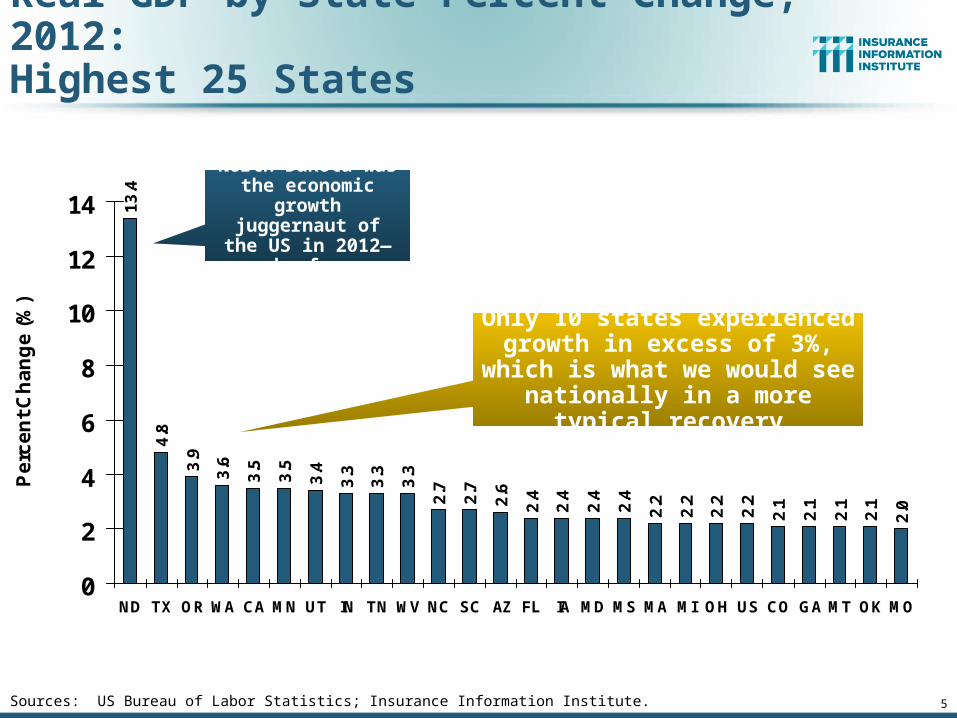
Real GDP by State Percent Change, 2012:Highest 25 States
13
.4
4.8
3.9
3.6
3.5
3.5
3.4
3.3
3.3
3.3
2.7
2.7
2.6
2.4
2.4
2.4
2.4
2.2
2.2
2.2
2.2
2.1
2.1
2.1
2.1
2.0
0
2
4
6
8
10
12
14
ND TX OR WA CA MN UT IN TN WV NC SC AZ FL IA MD MS MA MI OH US CO GA MT OK MO
Pe
rce
nt
Ch
an
ge
(%
)
Sources: US Bureau of Labor Statistics; Insurance Information Institute.
North Dakota was the economic growth juggernaut of the US
in 2012—by far
Only 10 states experienced growth in excess of 3%, which is what we would see nationally in
a more typical recovery
6
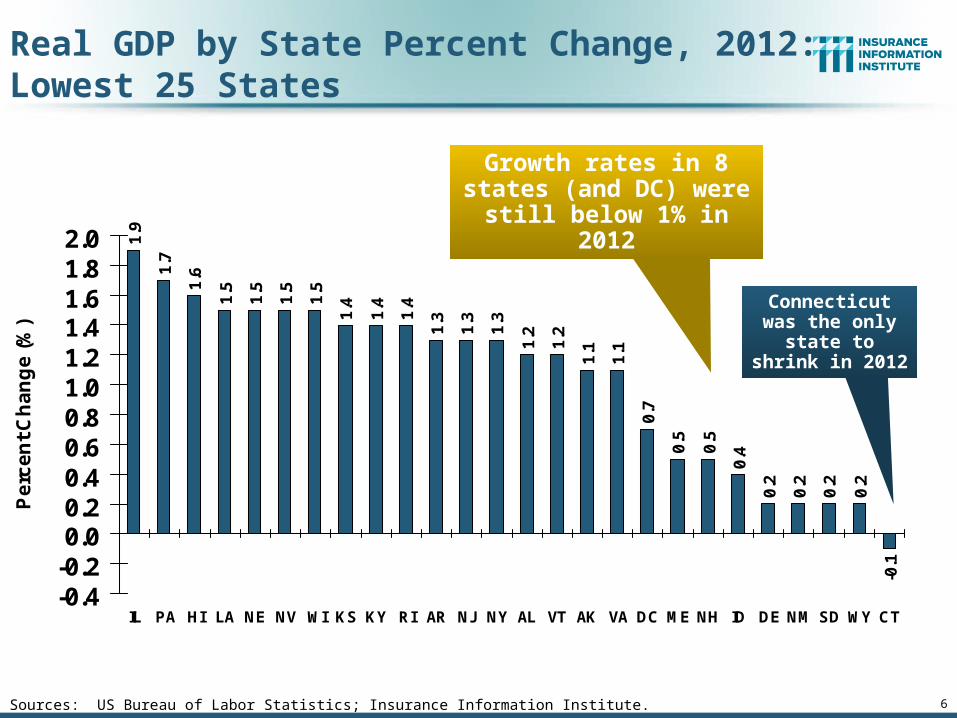
1.9
1.7
1.6
1.5
1.5
1.5
1.5
1.4
1.4
1.4
1.3
1.3
1.3
1.2
1.2
1.1
1.1
0.7
0.5
0.5
0.4
0.2
0.2
0.2
0.2
-0.1
-0.4-0.20.00.20.40.60.81.01.21.41.61.82.0
IL PA HI LA NE NV WI KS KY RI AR NJ NY AL VT AK VA DC ME NH ID DE NM SD WY CT
Pe
rce
nt
Ch
an
ge
(%
)
Real GDP by State Percent Change, 2012: Lowest 25 States
Sources: US Bureau of Labor Statistics; Insurance Information Institute.
Connecticut was the only state to shrink in 2012
Growth rates in 8 states (and DC) were still below
1% in 2012
74
.47
3.6
73
.67
2.2
73
.6 76
67
.86
8.9
68
.26
7.7 7
1.6 74
.57
4.2 77
.56
7.5 69
.8 74
.37
1.5
63
.75
5.7 5
9.5
60
.9 64
.16
9.9
75
.07
5.3
76
.27
6.4 79
.37
3.2
72
.3 74
.38
2.6
82
.77
4.5
73
.8 77
.67
8.6
84
.58
4.1
85
.18
2.1
77
.57
3.2 75
.18
2.5
81
.28
1.6
79
.9
76
.4
40
45
50
55
60
65
70
75
80
85
90
Jan
-10
Fe
b-1
0M
ar-
10
Ap
r-1
0M
ay-
10
Jun
-10
Jul-
10
Au
g-1
0S
ep
-10
Oct
-10
No
v-1
0D
ec-
10
Jan
-11
Fe
b-1
1M
ar-
11
Ap
r-1
1M
ay-
11
Jun
-11
Jul-
11
Au
g-1
1S
ep
-11
Oct
-11
No
v-1
1D
ec-
11
Jan
-12
Fe
b-1
2M
ar-
12
Ap
r-1
2M
ay-
12
Jun
-12
Jul-
12
Au
g-1
2O
ct-1
2N
ov-
12
De
c-1
2Ja
n-1
3F
eb
-13
Ma
r-1
3A
pr-
13
Ma
y-1
3Ju
n-1
3Ju
l-1
3A
ug
-13
Se
p-1
3O
ct-1
3N
ov-
13
De
c-1
3Ja
n-1
4F
eb
-14
Ma
r-1
4
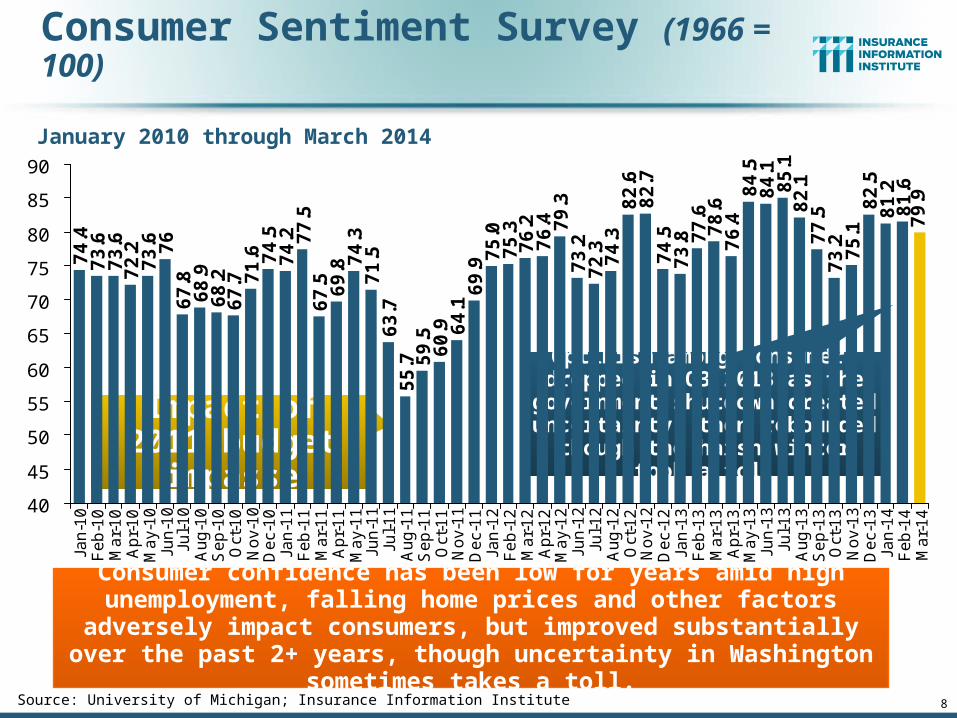
Consumer Sentiment Survey (1966 = 100)
January 2010 through March 2014
Consumer confidence has been low for years amid high unemployment, falling home prices and other factors adversely impact consumers, but improved substantially over the past 2+ years, though
uncertainty in Washington sometimes takes a toll.Source: University of Michigan; Insurance Information Institute
Optimism among consumers dropped in Q3 2013 as the
government shutdown created uncertainty, then rebounded
though the harsh winter took a toll
8
Impact of 2011 budget impasse
9
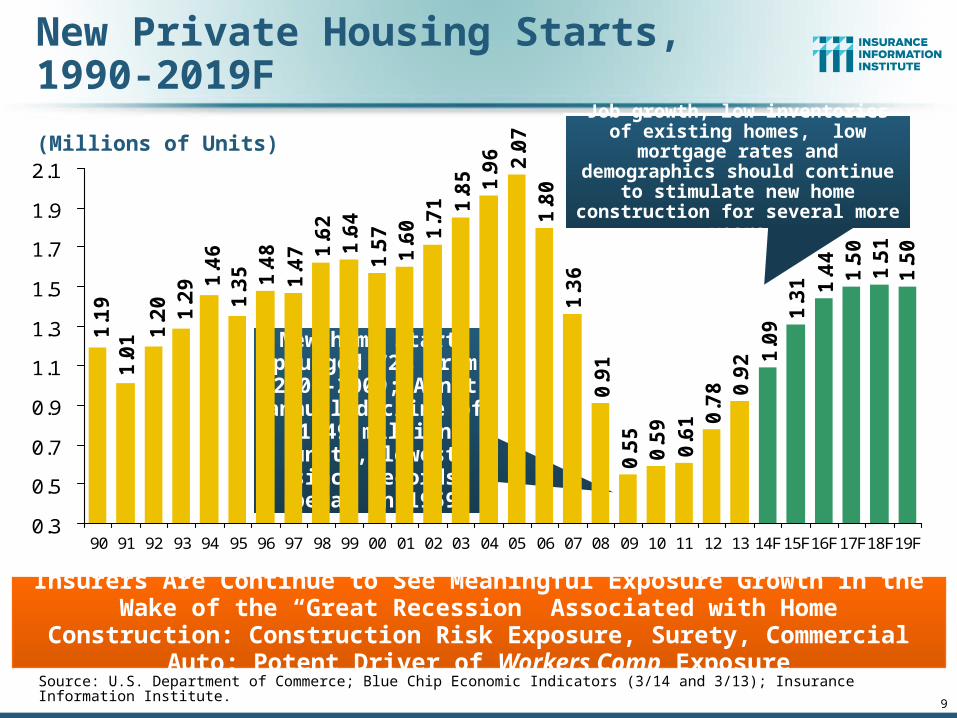
(Millions of Units)
New Private Housing Starts, 1990-2019F
1.4
8
1.4
7 1.6
21
.64
1.5
71
.60 1.7
1 1.8
5 1.9
6 2.0
71
.80
1.3
6
0.9
10
.55
0.5
9
0.6
1 0.7
8 0.9
2 1.0
91
.31 1.4
41
.50
1.5
11
.50
1.3
51.4
61
.29
1.2
0
1.0
11.1
9
0.3
0.5
0.7
0.9
1.1
1.3
1.5
1.7
1.9
2.1
90 91 92 93 94 95 96 97 98 99 00 01 02 03 04 05 06 07 08 09 10 11 12 13 14F15F16F17F18F19F
Source: U.S. Department of Commerce; Blue Chip Economic Indicators (3/14 and 3/13); Insurance Information Institute.
Insurers Are Continue to See Meaningful Exposure Growth in the Wake of the “Great Recession” Associated with Home Construction: Construction Risk
Exposure, Surety, Commercial Auto; Potent Driver of Workers Comp Exposure
New home starts plunged 72% from 2005-2009; A net
annual decline of 1.49 million units, lowest since records began
in 1959
Job growth, low inventories of existing homes, low mortgage rates and demographics should continue to stimulate new home construction
for several more years
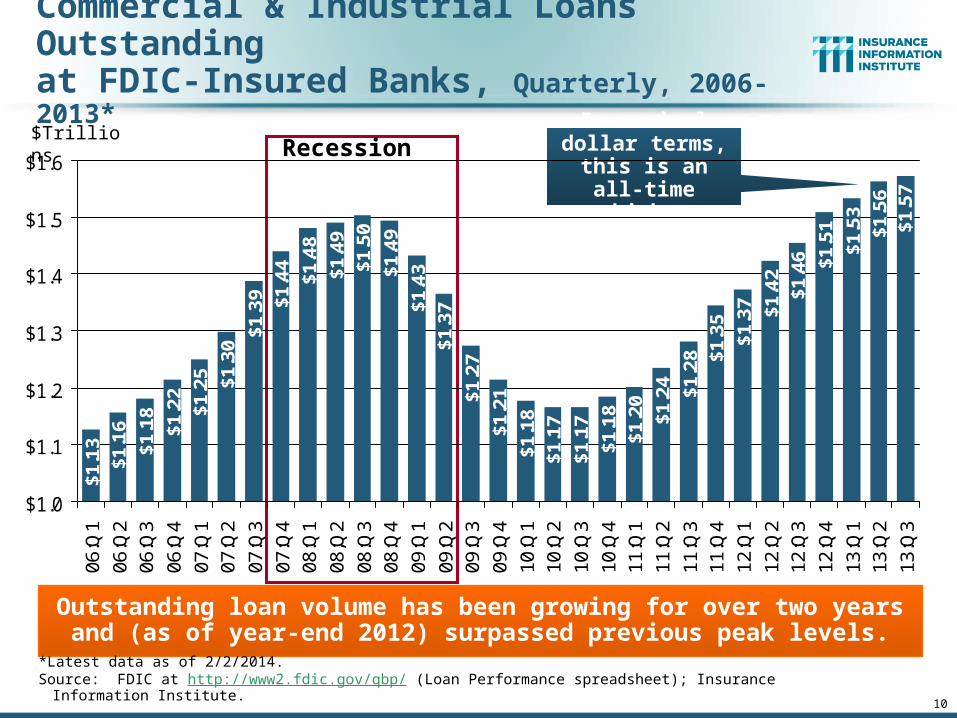
10
Commercial & Industrial Loans Outstandingat FDIC-Insured Banks, Quarterly, 2006-2013*
$1.1
6$1
.18
$1.2
2
$1.4
4$1
.48
$1.4
9$1
.50
$1.4
9$1
.43
$1.3
7$1
.27
$1.2
1$1
.18
$1.1
7$1
.17
$1.1
8$1
.20
$1.2
4 $1.2
8 $1.3
5$1
.37 $1
.42
$1.4
6 $1.5
1$1
.53
$1.5
6$1
.57
$1.1
3
$1.2
5 $1.3
0$1
.39
$1.0
$1.1
$1.2
$1.3
$1.4
$1.5
$1.6
06:Q
106
:Q2
06:Q
306
:Q4
07:Q
107
:Q2
07:Q
307
:Q4
08:Q
108
;Q2
08:Q
308
:Q4
09:Q
109
:Q2
09:Q
309
:Q4
10:Q
110
:Q2
10:Q
310
:Q4
11:Q
111
:Q2
11:Q
311
:Q4
12:Q
112
:Q2
12:Q
312
:Q4
13:Q
113
:Q2
13:Q
3
Outstanding loan volume has been growing for over two yearsand (as of year-end 2012) surpassed previous peak levels.
*Latest data as of 2/2/2014.Source: FDIC at http://www2.fdic.gov/qbp/ (Loan Performance spreadsheet); Insurance Information Institute.
$Trillions In nominal dollar terms, this is an
all-time high.
Recession
50
.7 52
.7 54
.15
4.6
54
.85
3.5
53
.75
2.8 53
.95
4.6 56 5
7.1 5
9.4
59
.75
6.3
54
.45
3.3
53
.45
3.8
52
.65
2.6
52
.65
2.6
53
.05
6.8
56
.15
5.0
53
.75
4.1
52
.75
2.9 54
.3 55
.25
4.8
54
.85
5.7
55
.25
6.0
53
.15
3.7
52
.25
6.0
58
.65
4.4 55
.45
3.9
53
.0 54
.05
1.6
54
.4
40
45
50
55
60
65
Jan
-10
Fe
b-1
0M
ar-
10
Ap
r-1
0M
ay-
10
Jun
-10
Jul-
10
Au
g-1
0S
ep
-10
Oct
-10
No
v-1
0D
ec-
10
Jan
-11
Fe
b-1
1M
ar-
11
Ap
r-1
1M
ay-
11
Jun
-11
Jul-
11
Au
g-1
1S
ep
-11
Oct
-11
No
v-1
1D
ec-
11
Jan
-12
Fe
b-1
2M
ar-
12
Ap
r-1
2M
ay-
12
Jun
-12
Jul-
12
Au
g-1
2S
ep
-12
Oct
-12
No
v-1
2D
ec-
12
Jan
-13
Fe
b-1
3M
ar-
13
Ap
r-1
3M
ay-
13
Jun
-13
Jul-
13
Au
g-1
3S
ep
-13
Oct
-13
No
v-1
3D
ec-
13
Jan
-14
Fe
b-1
4
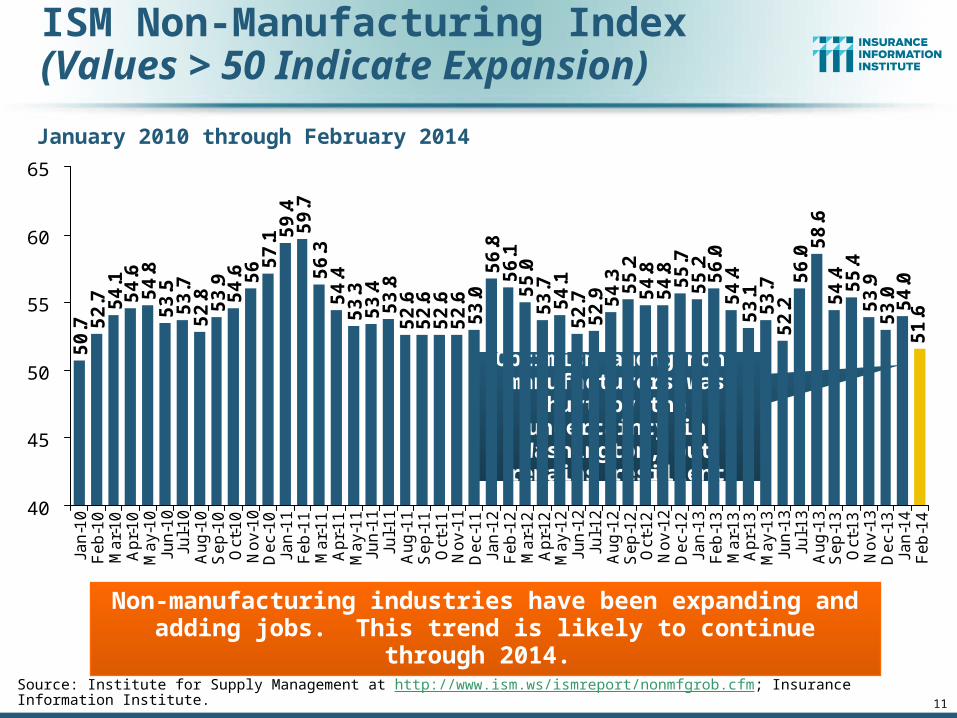
ISM Non-Manufacturing Index(Values > 50 Indicate Expansion)
January 2010 through February 2014
Non-manufacturing industries have been expanding and adding jobs. This trend is likely to continue through 2014.
Source: Institute for Supply Management at http://www.ism.ws/ismreport/nonmfgrob.cfm; Insurance Information Institute.
Optimism among non-manufacturers was hurt by
the uncertainty in Washington, but remains
resilient
11
12
43,6
9448
,125
69,3
0062
,436
64,0
04 71,2
77 81,2
3582
,446
63,8
5363
,235
64,8
53 71,5
4970
,643
62,3
0452
,374
51,9
5953
,549
54,0
2744
,367
37,8
8435
,472
40,0
9938
,540
35,0
3734
,317
39,2
0119
,695 28
,322
43,5
4660
,837
56,2
8247
,806
40,0
7533
,212
0
10,000
20,000
30,000
40,000
50,000
60,000
70,000
80,000
90,000
80 81 82 83 84 85 86 87 88 89 90 91 92 93 94 95 96 97 98 99 00 01 02 03 04 05 06 07 08 09 10 11 12 13
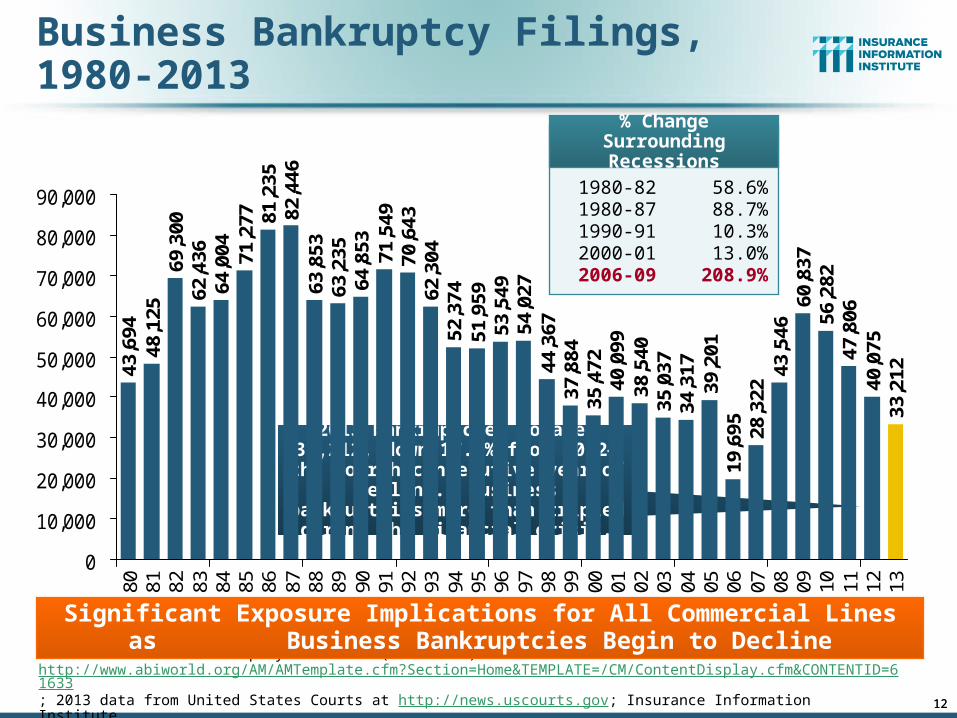
Business Bankruptcy Filings,1980-2013
Sources: American Bankruptcy Institute (1980-2012) at http://www.abiworld.org/AM/AMTemplate.cfm?Section=Home&TEMPLATE=/CM/ContentDisplay.cfm&CONTENTID=61633; 2013 data from United States Courts at http://news.uscourts.gov; Insurance Information Institute.
Significant Exposure Implications for All Commercial Lines as Business Bankruptcies Begin to Decline
2013 bankruptcies totaled 33,212, down 17.1% from 2012—the fourth
consecutive year of decline. Business bankruptcies more than tripled during the financial crisis.
% Change Surrounding Recessions
1980-82 58.6%1980-87 88.7%1990-91 10.3%2000-01 13.0%2006-09 208.9%
12
13
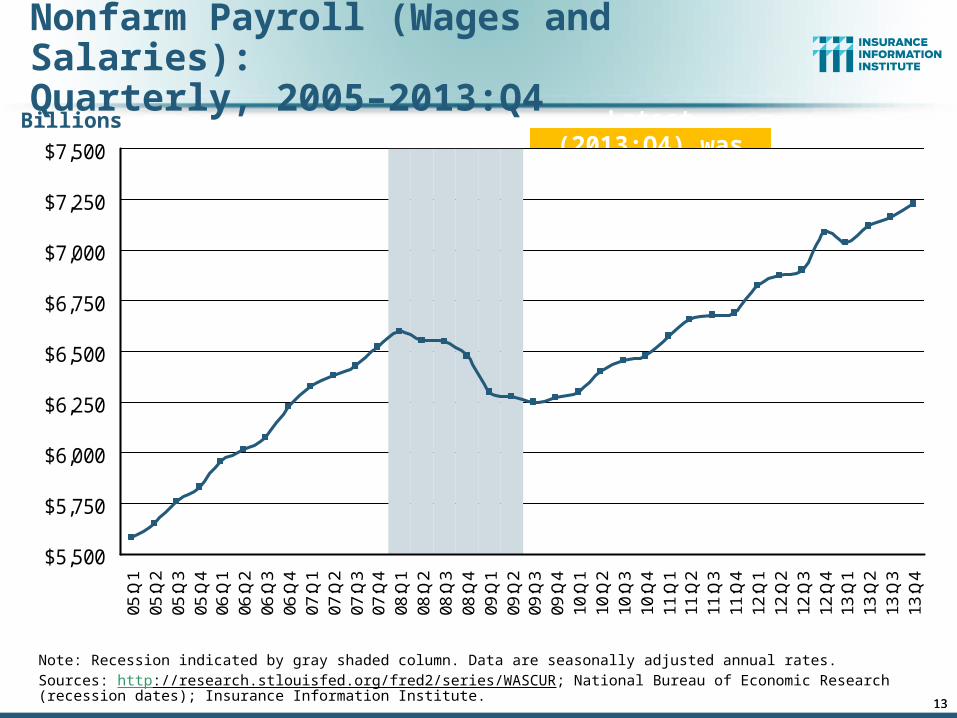
Nonfarm Payroll (Wages and Salaries):Quarterly, 2005–2013:Q4
Note: Recession indicated by gray shaded column. Data are seasonally adjusted annual rates.Sources: http://research.stlouisfed.org/fred2/series/WASCUR; National Bureau of Economic Research (recession dates); Insurance Information Institute.
Billions
$5,500
$5,750
$6,000
$6,250
$6,500
$6,750
$7,000
$7,250
$7,50005
:Q1
05:Q
205
:Q3
05:Q
406
:Q1
06:Q
206
:Q3
06:Q
407
:Q1
07:Q
207
:Q3
07:Q
408
:Q1
08:Q
208
:Q3
08:Q
409
:Q1
09:Q
209
:Q3
09:Q
410
:Q1
10:Q
210
:Q3
10:Q
411
:Q1
11:Q
211
:Q3
11:Q
412
:Q1
12:Q
212
:Q3
12:Q
413
:Q1
13:Q
213
:Q3
13:Q
4
Prior Peak was 2008:Q1 at $6.60 trillion
Latest (2013:Q4) was $7.23 trillion, a new peak--$980B
above 2009 trough
Recent trough (2009:Q3) was $6.25 trillion, down
5.3% from prior peak
Payrolls are 15.7% above
their 2009 trough and up 2.0% over
the past year
13
14
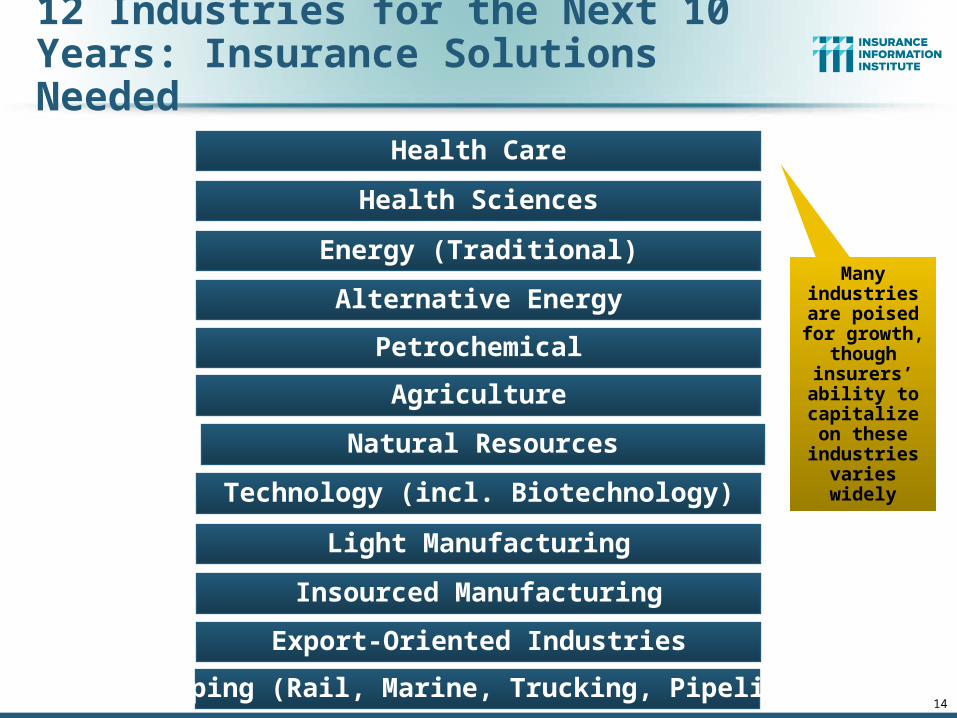
12 Industries for the Next 10 Years: Insurance Solutions Needed
Export-Oriented Industries
Health Sciences
Health Care
Energy (Traditional)
Alternative Energy
Petrochemical
Agriculture
Natural Resources
Technology (incl. Biotechnology)
Light Manufacturing
Insourced Manufacturing
Many industries are
poised for growth, though
insurers’ ability to
capitalize on these
industries varies widely
Shipping (Rail, Marine, Trucking, Pipelines)

CONSTRUCTION INDUSTRY OVERVIEW & OUTLOOK
15
The Construction Sector Is Critical to the Economy and
the WC Insurers
15
16
Value of New Private Construction: Residential & Nonresidential, 2003-2013*
Billions of Dollars
$0
$100
$200
$300
$400
$500
$600
$700
$800
$900
$1,000
03 04 05 06 07 08 09 10 11 12 13*
Non ResidentialResidential
Private Construction Activity Is Moving in a Positive Direction though Remains Well Below Pre-Crisis Peak; Residential Dominates
$298.1
$15.0
$613.7
New Construction peaks at $911.8. in 2006
Trough in 2010 at $500.6B,
after plunging 55.1% ($411.2B)
2013: Value of new pvt. construction hits $667.5B, up
33% from the 2010 trough but still
27% below 2006 peak
16
$261.8
$238.8
$311.5
$356.0
*2013 figure is a seasonally adjusted annual rate as of December.Sources: US Department of Commerce; Insurance Information Institute.
18
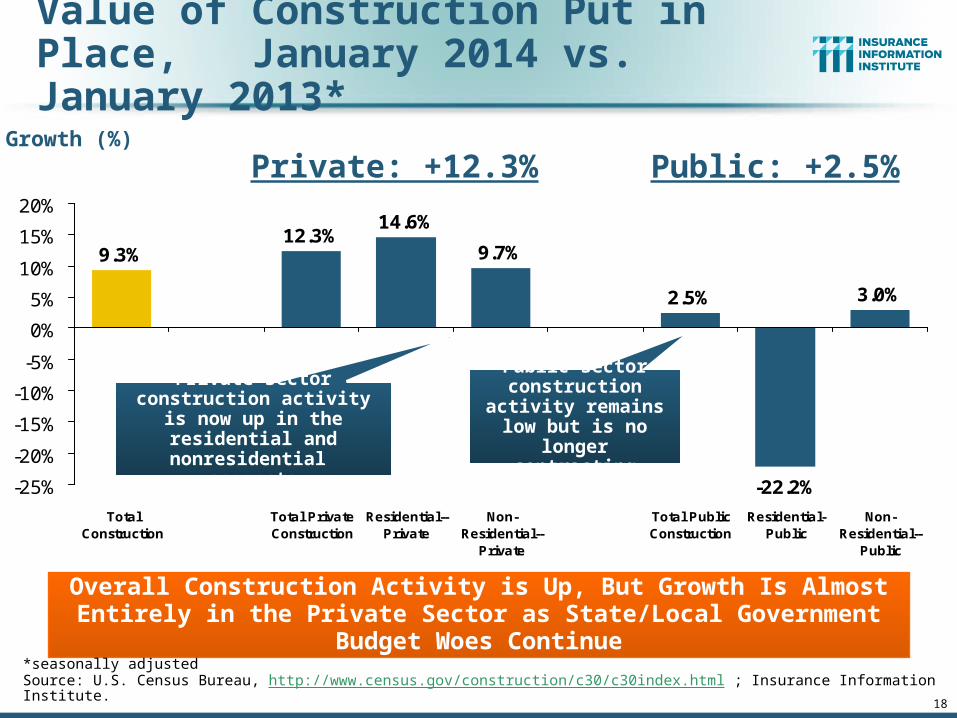
Value of Construction Put in Place, January 2014 vs. January 2013*
2.5%
-22.2%
3.0%
9.3%12.3%
14.6%
9.7%
-25%
-20%
-15%
-10%
-5%
0%
5%
10%
15%
20%
TotalConstruction
Total PrivateConstruction
Residential--Private
Non-Residential--
Private
Total PublicConstruction
Residential-Public
Non-Residential--
Public
Overall Construction Activity is Up, But Growth Is Almost Entirely in the Private Sector as State/Local Government Budget Woes Continue
Growth (%)
Private sector construction activity is now up in the
residential and nonresidential segments
*seasonally adjustedSource: U.S. Census Bureau, http://www.census.gov/construction/c30/c30index.html ; Insurance Information Institute.
Private: +12.3% Public: +2.5%
Public sector construction activity remains low but is no
longer contracting
19
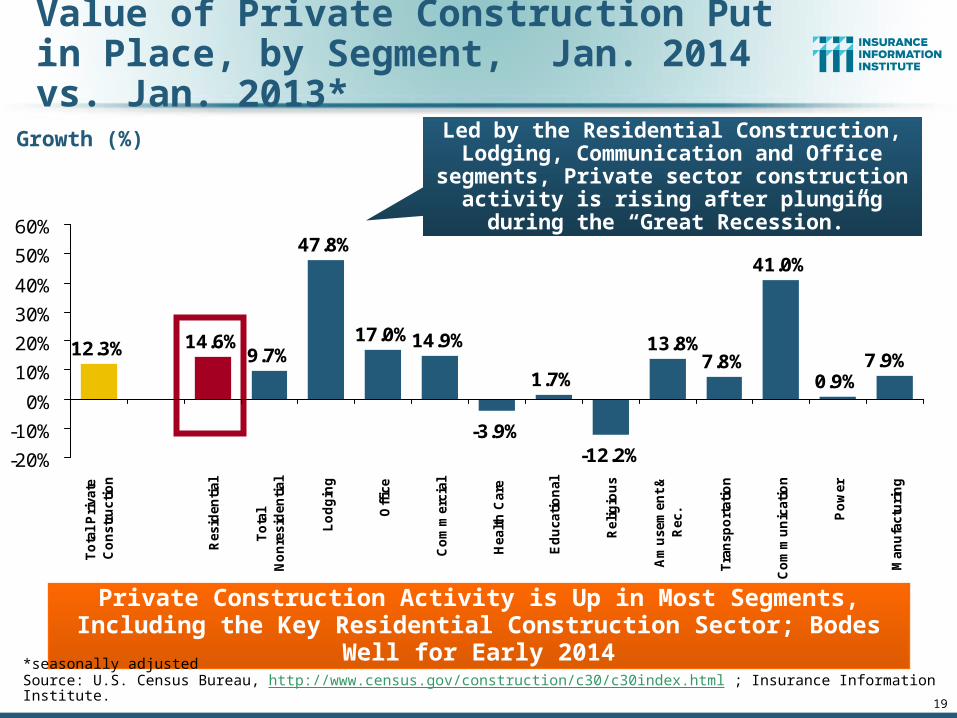
Value of Private Construction Put in Place, by Segment, Jan. 2014 vs. Jan. 2013*
14.9%
-3.9%
1.7%
-12.2%
7.8%
41.0%
0.9%7.9%
13.8%12.3% 14.6%9.7%
47.8%
17.0%
-20%
-10%
0%
10%
20%
30%
40%
50%
60%
To
tal
Pri
vate
Co
nstr
ucti
on
Resid
en
tial
To
tal
No
nre
sid
en
tial
Lo
dg
ing
Off
ice
Co
mm
erc
ial
Healt
h C
are
Ed
ucati
on
al
Reli
gio
us
Am
usem
en
t &
Rec.
Tra
nsp
ort
ati
on
Co
mm
un
icati
on
Po
wer
Man
ufa
ctu
rin
g
Private Construction Activity is Up in Most Segments, Including the Key Residential Construction Sector; Bodes Well for Early 2014
Growth (%) Led by the Residential Construction, Lodging, Communication and Office segments, Private
sector construction activity is rising after plunging during the “Great Recession.”
*seasonally adjustedSource: U.S. Census Bureau, http://www.census.gov/construction/c30/c30index.html ; Insurance Information Institute.
20
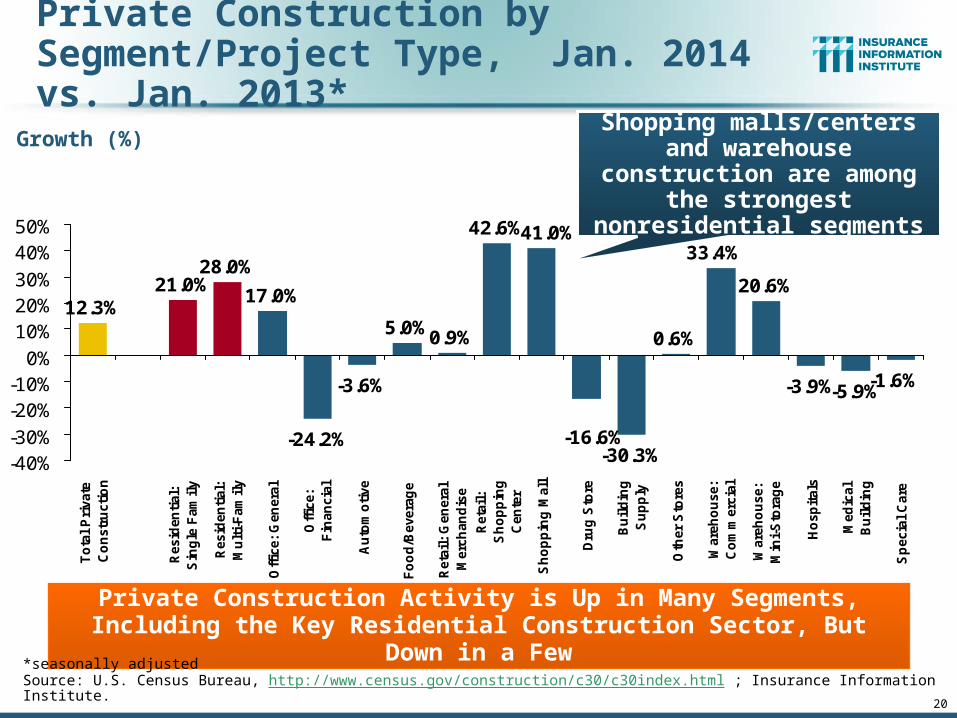
Private Construction by Segment/Project Type, Jan. 2014 vs. Jan. 2013*
-3.6%
5.0%0.9%
42.6%
-30.3%
0.6%
20.6%
-3.9%-5.9%-1.6%
-16.6%
33.4%41.0%
12.3%21.0%
28.0%
17.0%
-24.2%-40%-30%
-20%-10%
0%
10%20%30%
40%50%
To
tal
Pri
vate
Co
nstr
ucti
on
Resid
en
tial:
Sin
gle
Fam
ily
Resid
en
tial:
Mu
lti-
Fam
ily
Off
ice:
Gen
era
l
Off
ice:
Fin
an
cia
l
Au
tom
oti
ve
Fo
od
/Bevera
ge
Reta
il:
Gen
era
lM
erc
han
dis
e
Reta
il:
Sh
op
pin
gC
en
ter
Sh
op
pin
g M
all
Dru
g S
tore
Bu
ild
ing
Su
pp
ly
Oth
er
Sto
res
Ware
ho
use:
Co
mm
erc
ial
Ware
ho
use:
Min
i-S
tora
ge
Ho
sp
itals
Med
ical
Bu
ild
ing
Sp
ecia
l C
are
Private Construction Activity is Up in Many Segments, Including the Key Residential Construction Sector, But Down in a Few
Growth (%) Shopping malls/centers and warehouse construction are
among the strongest nonresidential segments
*seasonally adjustedSource: U.S. Census Bureau, http://www.census.gov/construction/c30/c30index.html ; Insurance Information Institute.
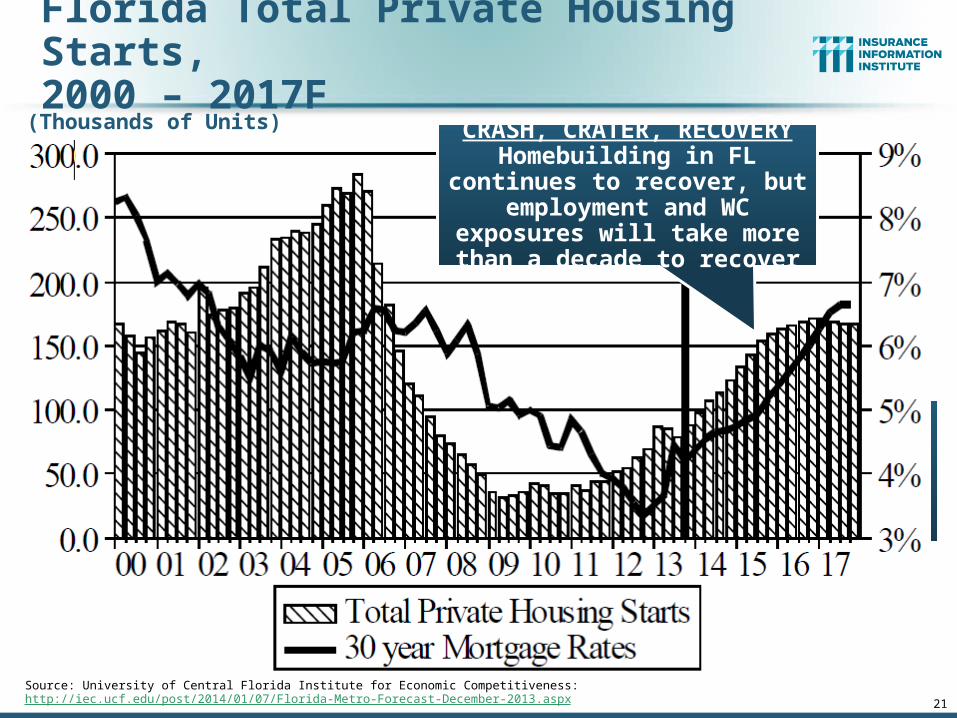
Florida Total Private Housing Starts,2000 – 2017F
21
The economic outlook for most of
the US is positive for the first time in many
years
Source: University of Central Florida Institute for Economic Competitiveness: http://iec.ucf.edu/post/2014/01/07/Florida-Metro-Forecast-December-2013.aspx
CRASH, CRATER, RECOVERY Homebuilding in FL continues
to recover, but employment and WC exposures will take
more than a decade to recover
(Thousands of Units)
22
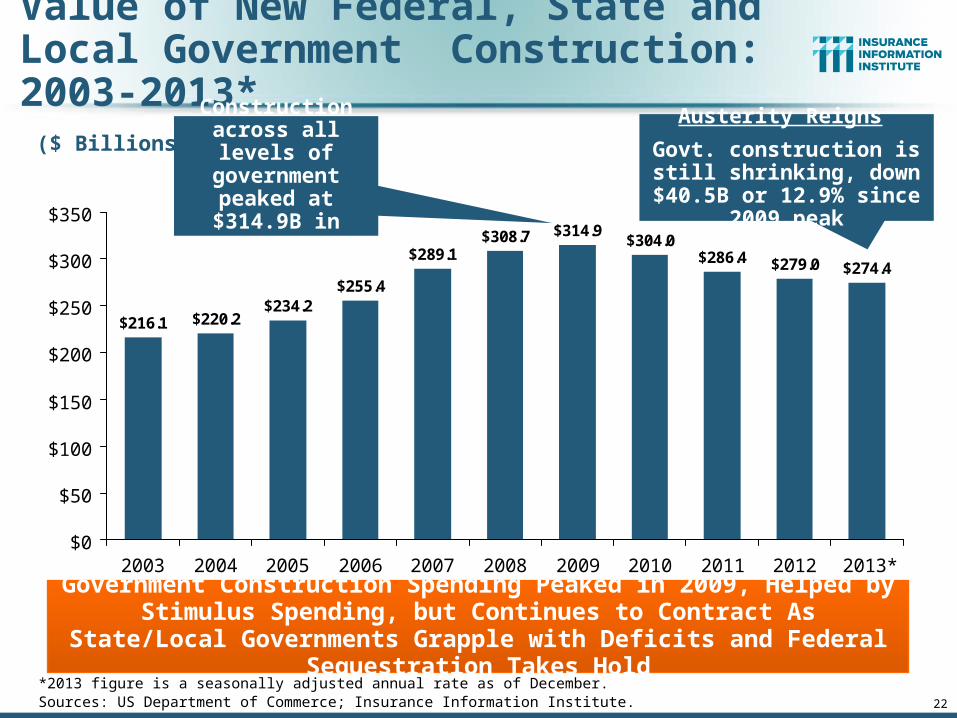
$314.9$304.0
$286.4 $279.0 $274.4
$216.1 $220.2$234.2
$255.4
$289.1$308.7
$0
$50
$100
$150
$200
$250
$300
$350
2003 2004 2005 2006 2007 2008 2009 2010 2011 2012 2013*
($ Billions)
Government Construction Spending Peaked in 2009, Helped by Stimulus Spending, but Continues to Contract As State/Local Governments
Grapple with Deficits and Federal Sequestration Takes Hold
Value of New Federal, State and Local Government Construction: 2003-2013*
*2013 figure is a seasonally adjusted annual rate as of December.Sources: US Department of Commerce; Insurance Information Institute.
Construction across all levels of government
peaked at $314.9B in 2009
Austerity Reigns
Govt. construction is still shrinking, down $40.5B or
12.9% since 2009 peak
23
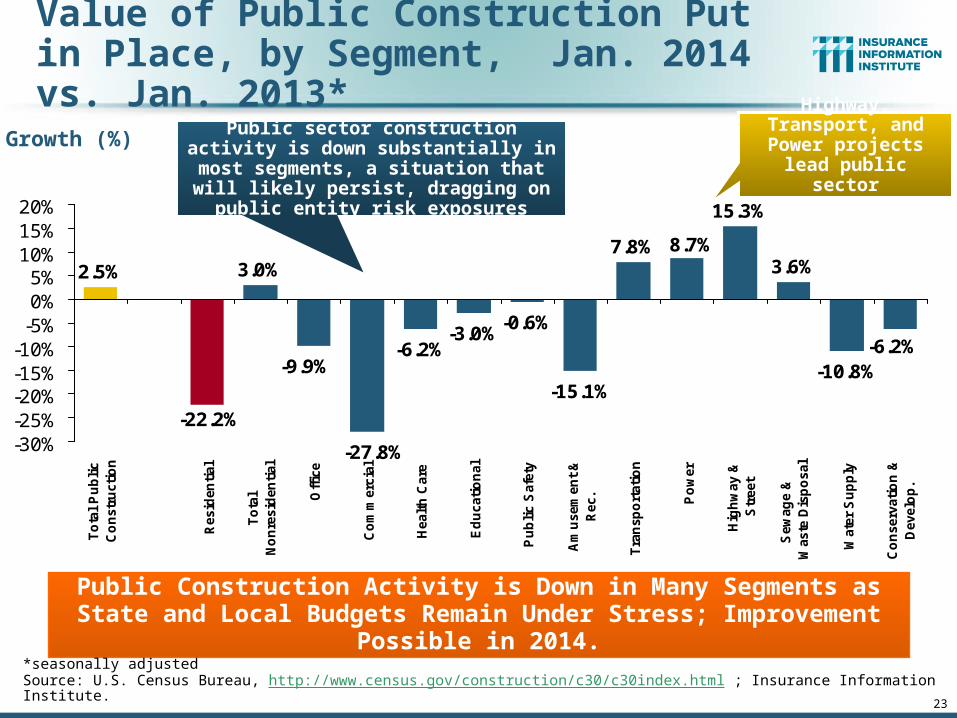
Value of Public Construction Put in Place, by Segment, Jan. 2014 vs. Jan. 2013*
-6.2%-3.0%
-0.6%
-15.1%
7.8%
15.3%
3.6%
-10.8%-6.2%
8.7%
2.5%
-22.2%
3.0%
-9.9%
-27.8%-30%-25%-20%-15%-10%
-5%0%5%
10%15%20%
To
tal
Pu
bli
cC
on
str
ucti
on
Resid
en
tial
To
tal
No
nre
sid
en
tial
Off
ice
Co
mm
erc
ial
Healt
h C
are
Ed
ucati
on
al
Pu
bli
c S
afe
ty
Am
usem
en
t &
Rec.
Tra
nsp
ort
ati
on
Po
wer
Hig
hw
ay &
Str
eet
Sew
ag
e &
Waste
Dis
po
sal
Wate
r S
up
ply
Co
nserv
ati
on
&D
evelo
p.
Public Construction Activity is Down in Many Segments as State and Local Budgets Remain Under Stress; Improvement Possible in 2014.
Growth (%)
*seasonally adjustedSource: U.S. Census Bureau, http://www.census.gov/construction/c30/c30index.html ; Insurance Information Institute.
Public sector construction activity is down substantially in most segments, a situation that will likely persist, dragging
on public entity risk exposures
Highway, Transport, and Power projects lead public sector
construction
25
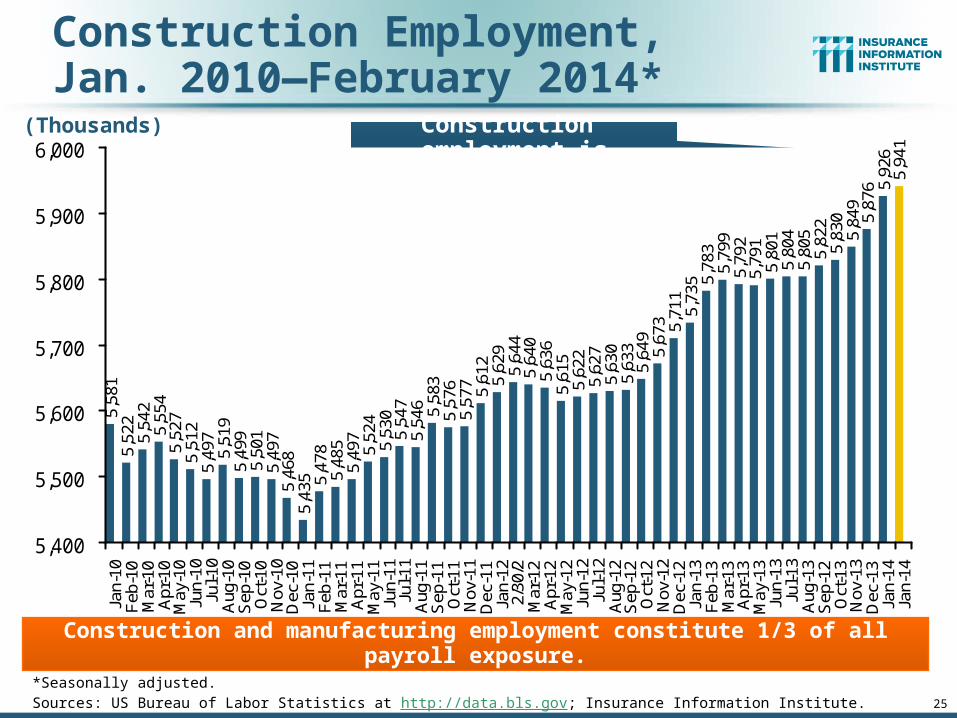
Construction Employment,Jan. 2010—February 2014*
*Seasonally adjusted.Sources: US Bureau of Labor Statistics at http://data.bls.gov; Insurance Information Institute.
5,58
15,
522
5,54
25,
554
5,52
75,
512
5,49
75,
519
5,49
95,
501
5,49
75,
468
5,43
5 5,47
85,
485
5,49
75,
524
5,53
05,
547
5,54
6 5,58
35,
576
5,57
7 5,61
25,
629
5,64
45,
640
5,63
65,
615
5,62
25,
627
5,63
05,
633
5,64
95,
673 5,71
15,
735 5,
783
5,79
95,
792
5,79
15,
801
5,80
45,
805
5,82
25,
830
5,84
95,
876 5,
926
5,94
1
5,400
5,500
5,600
5,700
5,800
5,900
6,000
Jan-
10F
eb-1
0M
ar-1
0A
pr-1
0M
ay-1
0Ju
n-10
Jul-1
0A
ug-1
0S
ep-1
0O
ct-1
0N
ov-1
0D
ec-1
0Ja
n-11
Feb
-11
Mar
-11
Apr
-11
May
-11
Jun-
11Ju
l-11
Aug
-11
Sep
-11
Oct
-11
Nov
-11
Dec
-11
Jan-
122/
30/2
Mar
-12
Apr
-12
May
-12
Jun-
12Ju
l-12
Aug
-12
Sep
-12
Oct
-12
Nov
-12
Dec
-12
Jan-
13F
eb-1
3M
ar-1
3A
pr-1
3M
ay-1
3Ju
n-13
Jul-1
3A
ug-1
3S
ep-1
2O
ct-1
3N
ov-1
3D
ec-1
3Ja
n-14
Jan-
14
Construction employment is +506,000 above
Jan. 2011 (+9.3%) trough
(Thousands)
Construction and manufacturing employment constitute 1/3 of all payroll exposure.
26
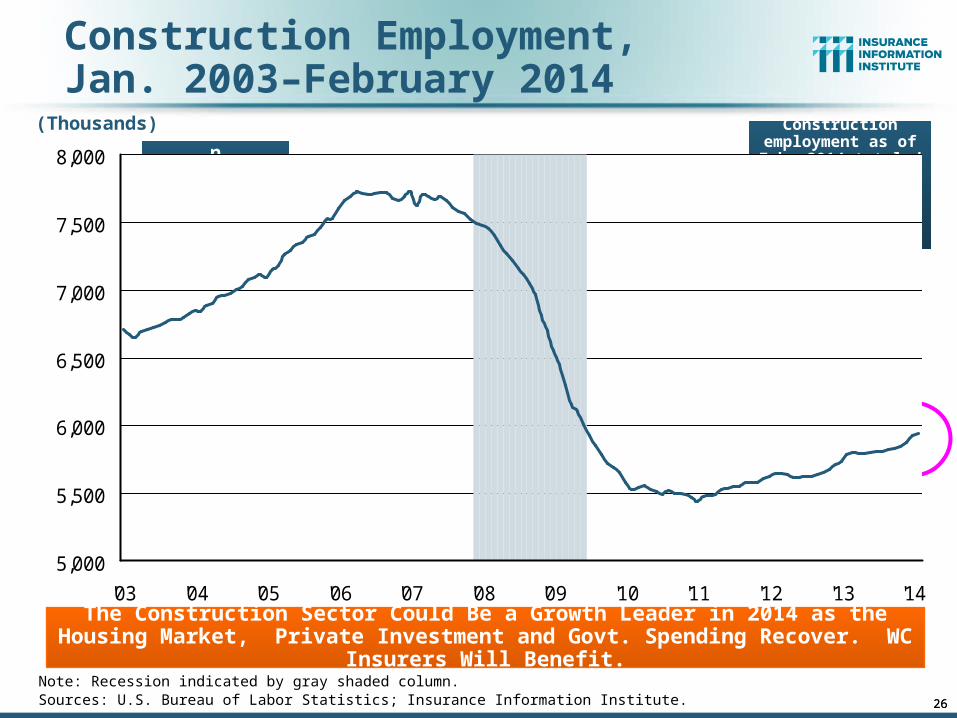
Construction Employment, Jan. 2003–February 2014
Note: Recession indicated by gray shaded column.Sources: U.S. Bureau of Labor Statistics; Insurance Information Institute.
5,000
5,500
6,000
6,500
7,000
7,500
8,000
'03 '04 '05 '06 '07 '08 '09 '10 '11 '12 '13 '14
The “Great Recession” and housing bust destroyed 2.3 million constructions jobs
The Construction Sector Could Be a Growth Leader in 2014 as the Housing Market, Private Investment and Govt. Spending Recover. WC Insurers Will Benefit.
Construction employment
troughed at 5.435 million in Jan.
2011, after a loss of 2.291 million jobs, a 29.7%
plunge from the April 2006 peak
26
Construction employment
peaked at 7.726 million in April 2006
(Thousands) Construction employment as of Feb. 2014 totaled 5.941 million, an
increase of 506,000 jobs or 9.3% from the
Jan. 2011 trough

27
The New American Labor Force
The Recovery’s Winners and Losers Are Reshaping the Sources of WC’s
Payroll Exposure Base
27
28
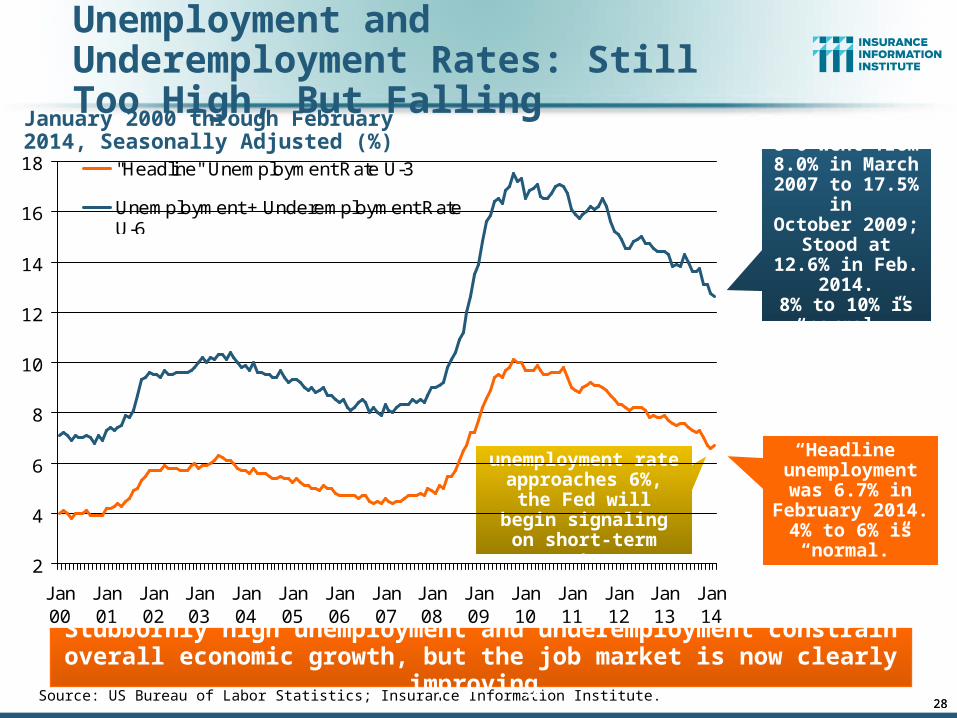
Unemployment and Underemployment Rates: Still Too High, But Falling
2
4
6
8
10
12
14
16
18
Jan00
Jan01
Jan02
Jan03
Jan04
Jan05
Jan06
Jan07
Jan08
Jan09
Jan10
Jan11
Jan12
Jan13
Jan14
"Headline" Unemployment Rate U-3
Unemployment + Underemployment RateU-6
“Headline” unemployment
was 6.7% in February 2014.
4% to 6% is “normal.”
Source: US Bureau of Labor Statistics; Insurance Information Institute.
U-6 went from 8.0% in March
2007 to 17.5% in October 2009; Stood at 12.6% in Feb. 2014.8% to 10% is
“normal.”
January 2000 through February 2014, Seasonally Adjusted (%)
Stubbornly high unemployment and underemployment constrain overall economic growth, but the job market is now clearly improving.
28
As the unemployment rate approaches 6%,
the Fed will begin signaling on short-
term rates
29
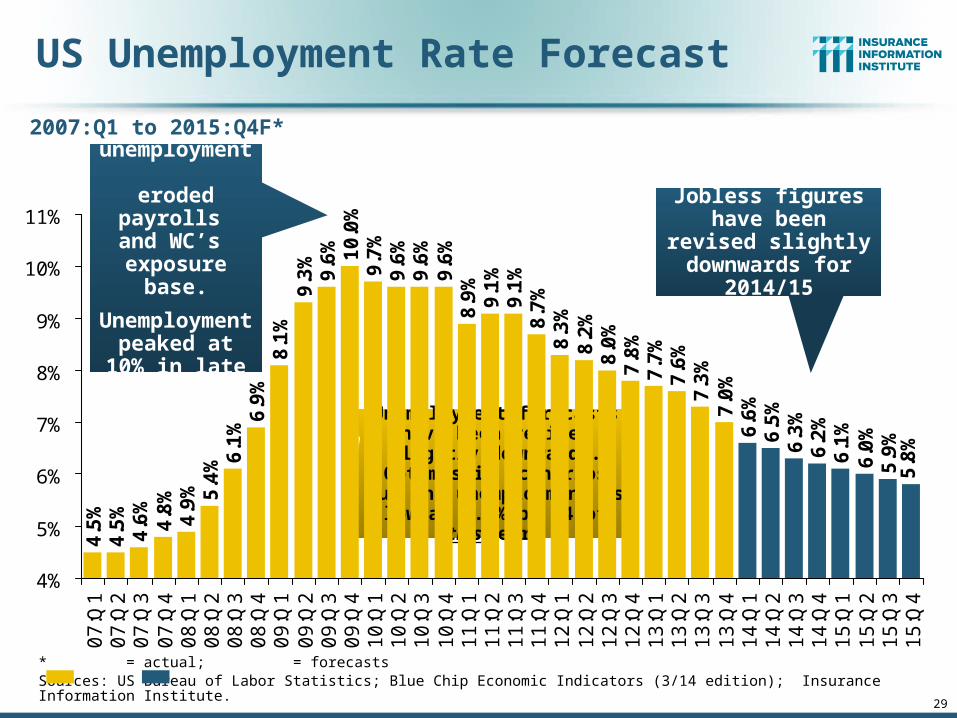
US Unemployment Rate Forecast4
.5%
4.5
%4
.6%
4.8
%4
.9% 5.4
% 6.1
%6
.9%
8.1
%9
.3%
9.6
% 10
.0%
9.7
%9
.6%
9.6
%
8.9
%9
.1%
9.1
%8
.7%
8.3
%8
.2%
8.0
%7
.8%
7.7
%7
.6%
7.3
%7
.0%
6.6
%6
.5%
6.3
%6
.2%
6.1
%6
.0%
5.9
%5
.8%
9.6
%
4%
5%
6%
7%
8%
9%
10%
11%
07
:Q1
07
:Q2
07
:Q3
07
:Q4
08
:Q1
08
:Q2
08
:Q3
08
:Q4
09
:Q1
09
:Q2
09
:Q3
09
:Q4
10
:Q1
10
:Q2
10
:Q3
10
:Q4
11
:Q1
11
:Q2
11
:Q3
11
:Q4
12
:Q1
12
:Q2
12
:Q3
12
:Q4
13
:Q1
13
:Q2
13
:Q3
13
:Q4
14
:Q1
14
:Q2
14
:Q3
14
:Q4
15
:Q1
15
:Q2
15
:Q3
15
:Q4
Rising unemployment
eroded payrolls
and WC’s exposure base.
Unemployment peaked at 10%
in late 2009.
* = actual; = forecastsSources: US Bureau of Labor Statistics; Blue Chip Economic Indicators (3/14 edition); Insurance Information Institute.
2007:Q1 to 2015:Q4F*
Unemployment forecasts have been revised slightly
downwards. Optimistic scenarios put the
unemployment as low as 6.0% by Q4 of this year.
Jobless figures have been revised
slightly downwards for 2014/15
23
15
21
70
52
12
65
73
-71
32 6
4 81
55
3-1
15
-10
6-2
21
-21
5-2
06
-26
1-2
58
-42
2-4
86
-77
6 -69
3-8
21
-69
8-8
10
-80
1-2
94
-42
6-2
72
-23
2 -14
1-2
71
-15
-23
22
0-3
8
19
29
4 11
01
20
11
71
07 1
99
14
99
47
22
23
23
1 32
01
66
18
6 21
91
25
26
81
77
19
12
22
36
42
28
24
61
02
13
17
51
72
13
61
59
25
52
11
21
52
19 26
31
64
18
82
22
20
11
70
18
01
53 2
47
27
28
6 14
51
62
11
3
(1,000)
(800)
(600)
(400)
(200)
0
200
400
600
Jan
-07
Fe
b-0
7M
ar-
07
Ap
r-0
7M
ay-
07
Jun
-07
Jul-
07
Au
g-0
7S
ep
-07
Oct
-07
No
v-0
7D
ec-
07
Jan
-08
Fe
b-0
8M
ar-
08
Ap
r-0
8M
ay-
08
Jun
-08
Jul-
08
Au
g-0
8S
ep
-08
Oct
-08
No
v-0
8D
ec-
08
Jan
-09
Fe
b-0
9M
ar-
09
Ap
r-0
9M
ay-
09
Jun
-09
Jul-
09
Au
g-0
9S
ep
-09
Oct
-09
No
v-0
9D
ec-
09
Jan
-10
Fe
b-1
0M
ar-
10
Ap
r-1
0M
ay-
10
Jun
-10
Jul-
10
Au
g-1
0S
ep
-10
Oct
-10
No
v-1
0D
ec-
10
Jan
-11
Fe
b-1
1M
ar-
11
Ap
r-1
1M
ay-
11
Jun
-11
Jul-
11
Au
g-1
1S
ep
-11
Oct
-11
No
v-1
1D
ec-
11
Jan
-12
Fe
b-1
2M
ar-
12
Ap
r-1
2M
ay-
12
Jun
-12
Jul-
12
Au
g-1
2S
ep
-12
Oct
-12
No
v-1
2D
ec-
12
Jan
-13
Fe
b-1
3M
ar-
13
Ap
r-1
3M
ay-
13
Jun
-13
Jul-
13
Au
g-1
3S
ep
-13
Oct
-13
No
v-1
3D
ec-
13
Jan
-14
Fe
b-1
4
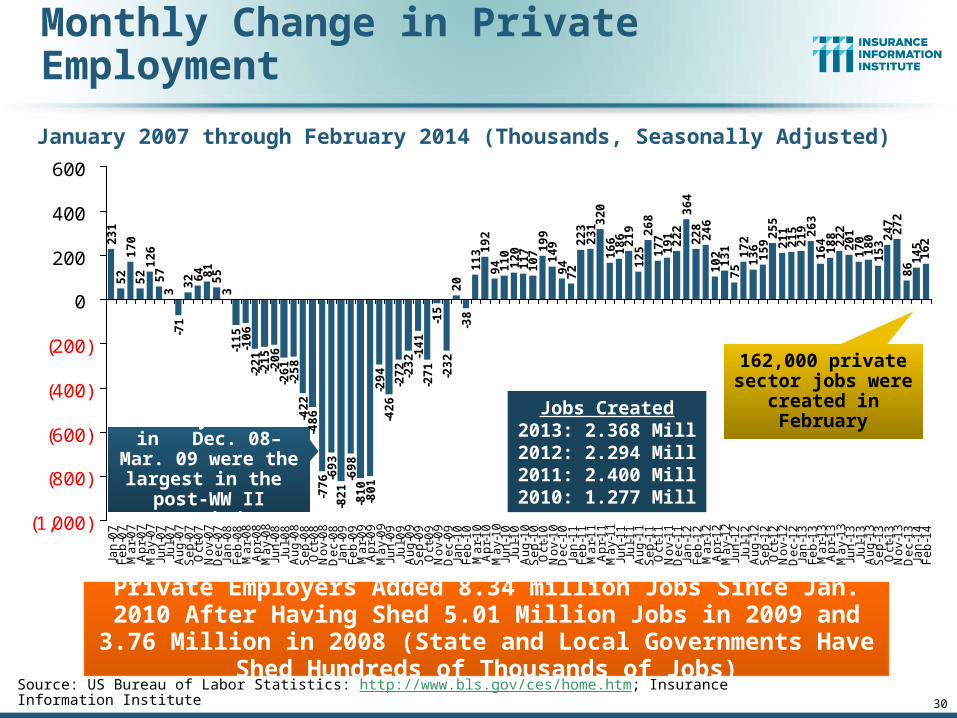
Monthly Change in Private Employment
January 2007 through February 2014 (Thousands, Seasonally Adjusted)
Private Employers Added 8.34 million Jobs Since Jan. 2010 After Having Shed 5.01 Million Jobs in 2009 and 3.76 Million in 2008 (State and Local Governments Have Shed Hundreds of Thousands of Jobs)
Source: US Bureau of Labor Statistics: http://www.bls.gov/ces/home.htm; Insurance Information Institute
Monthly losses in Dec. 08–Mar. 09
were the largest in the
post-WW II period
162,000 private sector jobs were
created in February
30
Jobs Created2013: 2.368 Mill2012: 2.294 Mill2011: 2.400 Mill2010: 1.277 Mill
0.02
0-0
.018
0.09
50.
287
0.38
10.
491
0.61
10.
728
0.83
51.
034
1.18
31.
277
1.34
91.
572
1.80
32.
123
2.28
92.
475
2.69
42.
819
3.08
73.
264
3.45
53.
677
4.04
14.
269
4.51
54.
617
4.74
84.
823
4.99
55.
131
5.29
05.
545
5.75
65.
971
6.19
06.
453
6.80
57.
027
7.22
87.
398
7.57
87.
731
7.97
88.
250
8.33
68.
481
8.64
3
6.61
7
-1.0
0.0
1.0
2.0
3.0
4.0
5.0
6.0
7.0
8.0
9.0
10.0
Jan-
10F
eb-1
0M
ar-1
0A
pr-1
0M
ay-1
0Ju
n-10
Jul-1
0A
ug-1
0S
ep-1
0O
ct-1
0N
ov-1
0D
ec-1
0Ja
n-11
Feb
-11
Mar
-11
Apr
-11
May
-11
Jun-
11Ju
l-11
Aug
-11
Sep
-11
Oct
-11
Nov
-11
Dec
-11
Jan-
12F
eb-1
2M
ar-1
2A
pr-1
2M
ay-1
2Ju
n-12
Jul-1
2A
ug-1
2S
ep-1
2O
ct-1
2N
ov-1
2D
ec-1
2Ja
n-13
Feb
-13
Mar
-13
Apr
-13
May
-13
Jun-
13Ju
l-13
Aug
-13
Sep
-13
Oct
-13
Nov
-13
Dec
-13
Jan-
14F
eb-1
4
Mill
ion
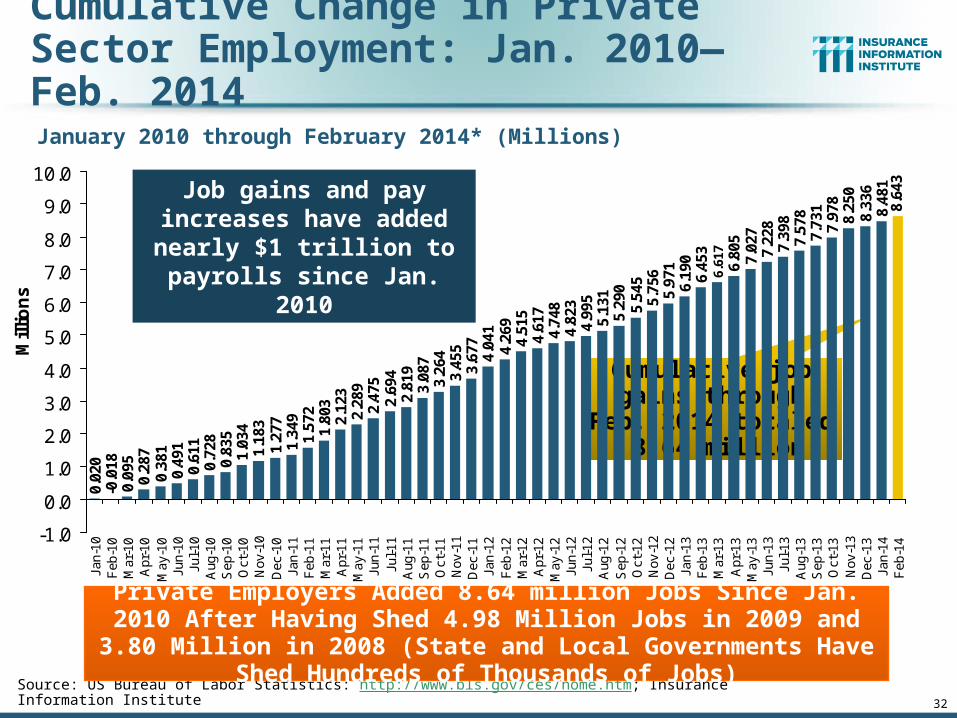
sCumulative Change in Private Sector Employment: Jan. 2010—Feb. 2014
January 2010 through February 2014* (Millions)
Source: US Bureau of Labor Statistics: http://www.bls.gov/ces/home.htm; Insurance Information Institute
Cumulative job gains through Feb. 2014
totaled 8.64 million
32
Job gains and pay increases have added
nearly $1 trillion to payrolls since Jan. 2010
Private Employers Added 8.64 million Jobs Since Jan. 2010 After Having Shed 4.98 Million Jobs in 2009 and 3.80 Million in 2008 (State and Local Governments Have Shed Hundreds of Thousands of Jobs)
4-1
033
9251
128
798
-68
-224 -1
84-1
94-2
13-2
24-2
71-2
89-2
88-3
56 -324
-452
-449
-480
-488
-511
-530
-542
-536
-539
-547
-574
-565
-589 -555
-535
-592
-601
-606
-622
-609
-610
-621
-643
-654 -623
-616
-633
-618
-631
-621
-800
-600
-400
-200
0
200
400
600
Jan-
10F
eb-1
0M
ar-1
0A
pr-1
0M
ay-1
0Ju
n-10
Jul-1
0A
ug-1
0S
ep-1
0O
ct-1
0N
ov-1
0D
ec-1
0Ja
n-11
Feb
-11
Mar
-11
Apr
-11
May
-11
Jun-
11Ju
l-11
Aug
-11
Sep
-11
Oct
-11
Nov
-11
Dec
-11
Jan-
12F
eb-1
2M
ar-1
2A
pr-1
2M
ay-1
2Ju
n-12
Jul-1
2A
ug-1
2S
ep-1
2O
ct-1
2N
ov-1
2D
ec-1
2Ja
n-13
Feb
-13
Mar
-13
Apr
-13
May
-13
Jun-
13Ju
l-13
Aug
-13
Sep
-13
Oct
-13
Nov
-13
Dec
-13
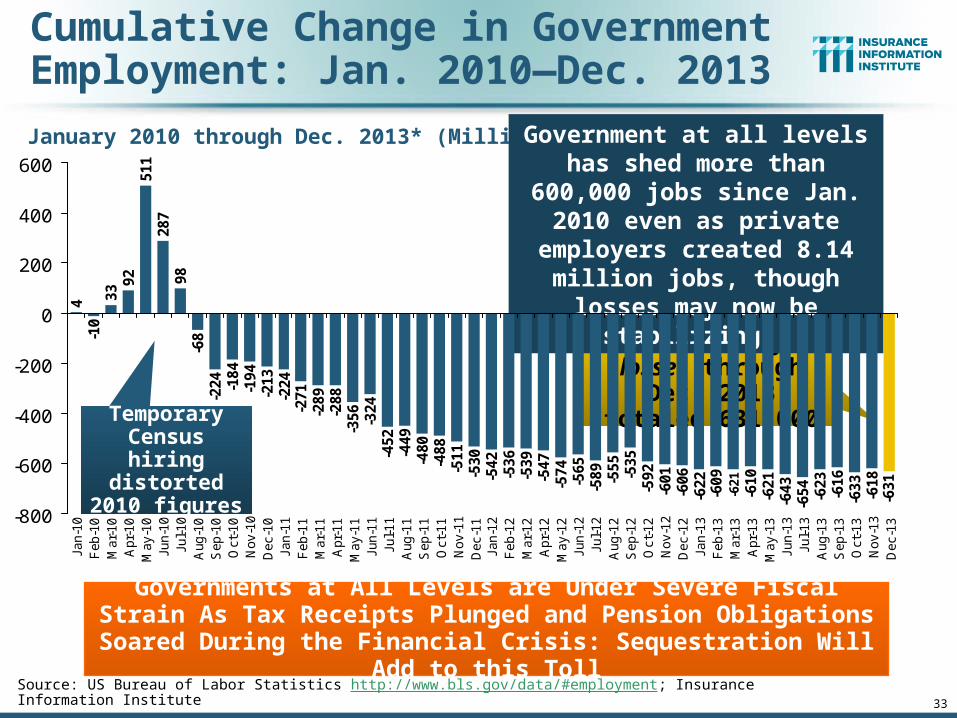
Cumulative Change in Government Employment: Jan. 2010—Dec. 2013
January 2010 through Dec. 2013* (Millions)
Source: US Bureau of Labor Statistics http://www.bls.gov/data/#employment; Insurance Information Institute
Cumulative job losses through Dec. 2013 totaled 631,000
33
Governments at All Levels are Under Severe Fiscal Strain As Tax Receipts Plunged and Pension Obligations Soared During the
Financial Crisis: Sequestration Will Add to this Toll
Government at all levels has shed more than 600,000 jobs
since Jan. 2010 even as private employers created 8.14 million jobs, though losses may now
be stabilizing.
Temporary Census hiring distorted 2010
figures
34
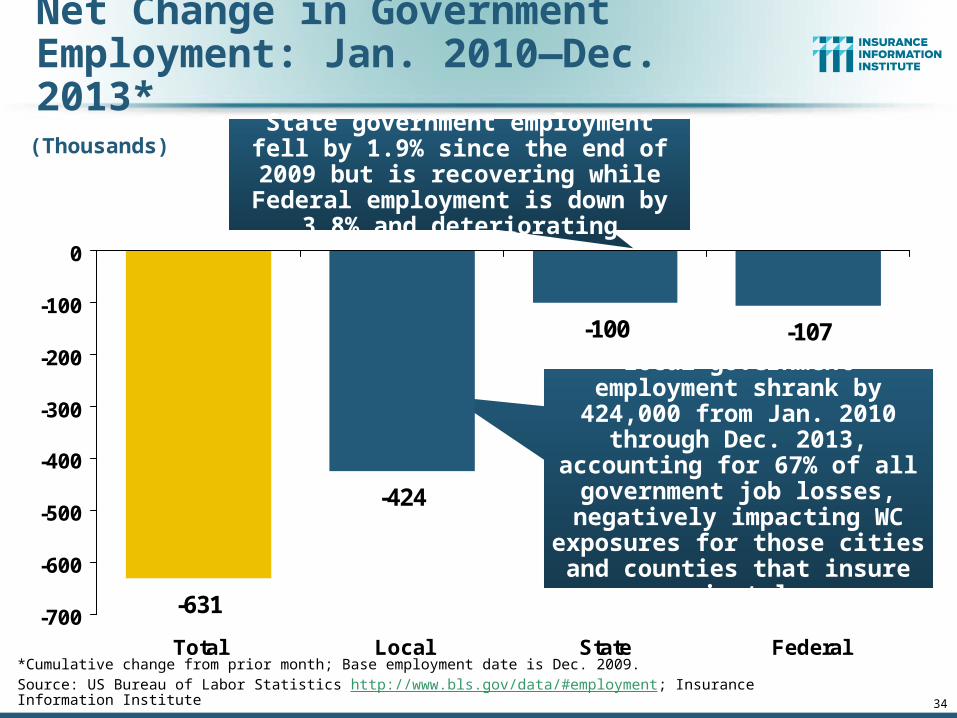
Net Change in Government Employment: Jan. 2010—Dec. 2013*
-631
-424
-100 -107
-700
-600
-500
-400
-300
-200
-100
0
Total Local State Federal
(Thousands)
Local government employment shrank by 424,000 from Jan.
2010 through Dec. 2013, accounting for 67% of all government job losses,
negatively impacting WC exposures for those cities and counties that insure privately
*Cumulative change from prior month; Base employment date is Dec. 2009.Source: US Bureau of Labor Statistics http://www.bls.gov/data/#employment; Insurance Information Institute
State government employment fell by 1.9% since the end of 2009 but is
recovering while Federal employment is down by 3.8% and deteriorating
35
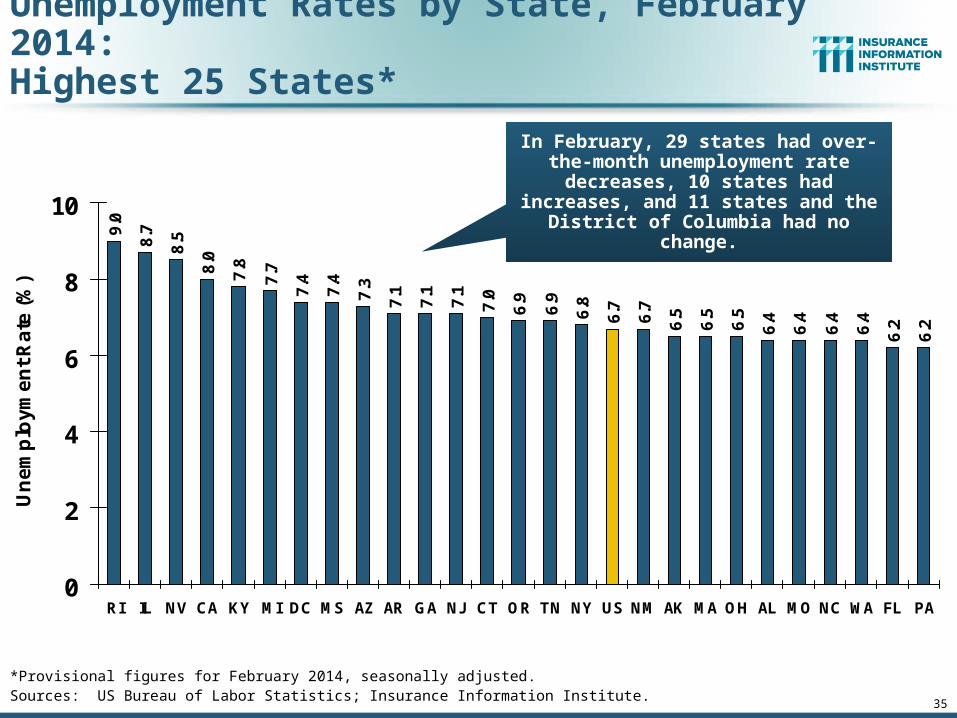
Unemployment Rates by State, February 2014:Highest 25 States*
9.0
8.7
8.5
8.0
7.8
7.7
7.4
7.4
7.3
7.1
7.1
7.1
7.0
6.9
6.9
6.8
6.7
6.7
6.5
6.5
6.5
6.4
6.4
6.4
6.4
6.2
6.2
0
2
4
6
8
10
RI IL NV CA KY MI DC MS AZ AR GA NJ CT OR TN NY US NM AK MA OH AL MO NC WA FL PA
Un
em
plo
ym
en
t R
ate
(%
)
*Provisional figures for February 2014, seasonally adjusted.Sources: US Bureau of Labor Statistics; Insurance Information Institute.
In February, 29 states had over-the-month unemployment rate decreases, 10 states had increases, and 11 states and the District of Columbia had no change.
36
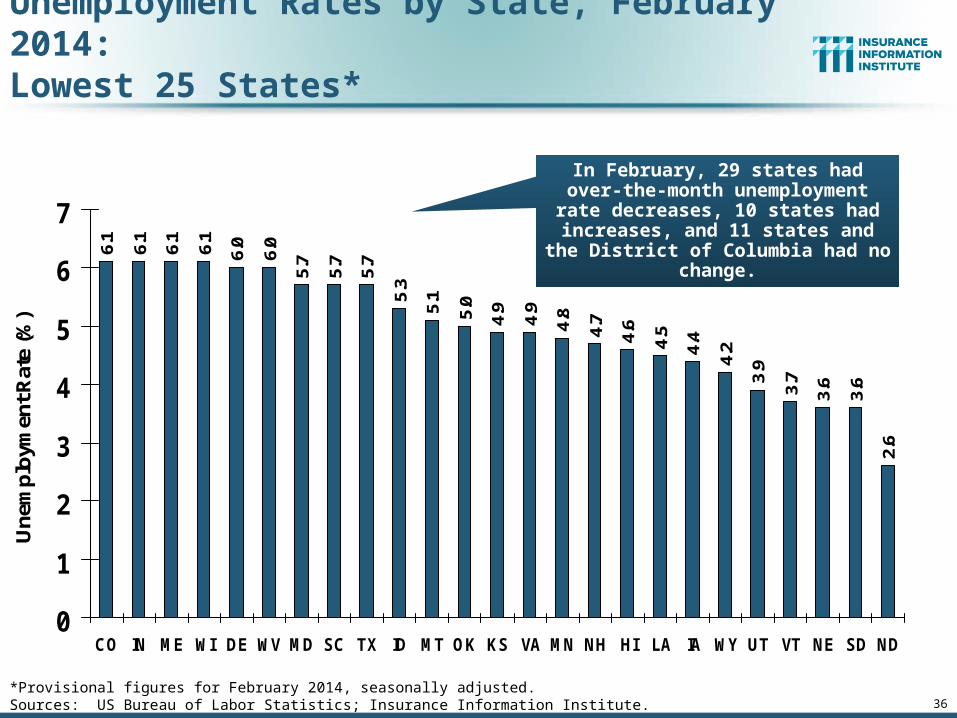
6.1
6.1
6.1
6.1
6.0
6.0
5.7
5.7
5.7
5.3
5.1
5.0
4.9
4.9
4.8
4.7
4.6
4.5
4.4
4.2
3.9
3.7
3.6
3.6
2.6
0
1
2
3
4
5
6
7
CO IN ME WI DE WV MD SC TX ID MT OK KS VA MN NH HI LA IA WY UT VT NE SD ND
Une
mpl
oym
ent R
ate
(%)
Unemployment Rates by State, February 2014: Lowest 25 States*
*Provisional figures for February 2014, seasonally adjusted.Sources: US Bureau of Labor Statistics; Insurance Information Institute.
In February, 29 states had over-the-month unemployment rate decreases, 10 states had increases, and 11 states
and the District of Columbia had no change.
$2,000
$3,000
$4,000
$5,000
$6,000
$7,000
$25
$30
$35
$40
$45
$50Wage & Salary DisbursementsWC NPW
39
Payroll Base* WC NWP
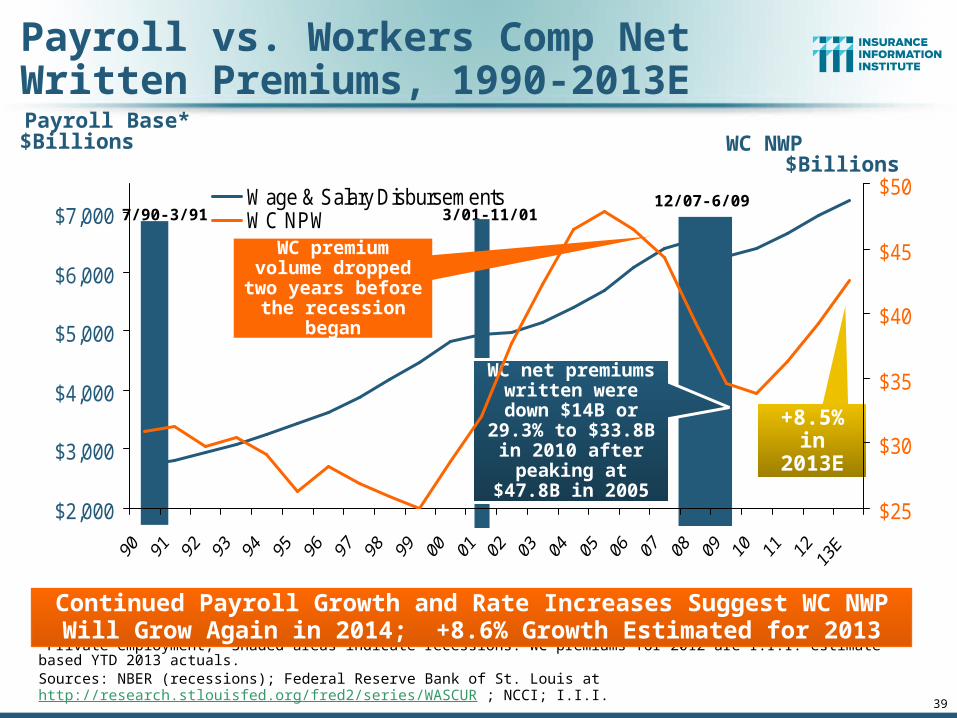
Payroll vs. Workers Comp Net Written Premiums, 1990-2013E
*Private employment; Shaded areas indicate recessions. WC premiums for 2012 are I.I.I. estimate based YTD 2013 actuals.Sources: NBER (recessions); Federal Reserve Bank of St. Louis at http://research.stlouisfed.org/fred2/series/WASCUR ; NCCI; I.I.I.
Continued Payroll Growth and Rate Increases Suggest WC NWP Will Grow Again in 2014; +8.6% Growth Estimated for 2013
7/90-3/91 3/01-11/0112/07-6/09
$Billions $Billions
WC premium volume dropped two years before
the recession began
WC net premiums written were down $14B or 29.3% to
$33.8B in 2010 after peaking at $47.8B
in 2005
+8.5% in 2013E
40
0%
10%
20%
30%
40%
50%
60%
70%
80%
90%
100%
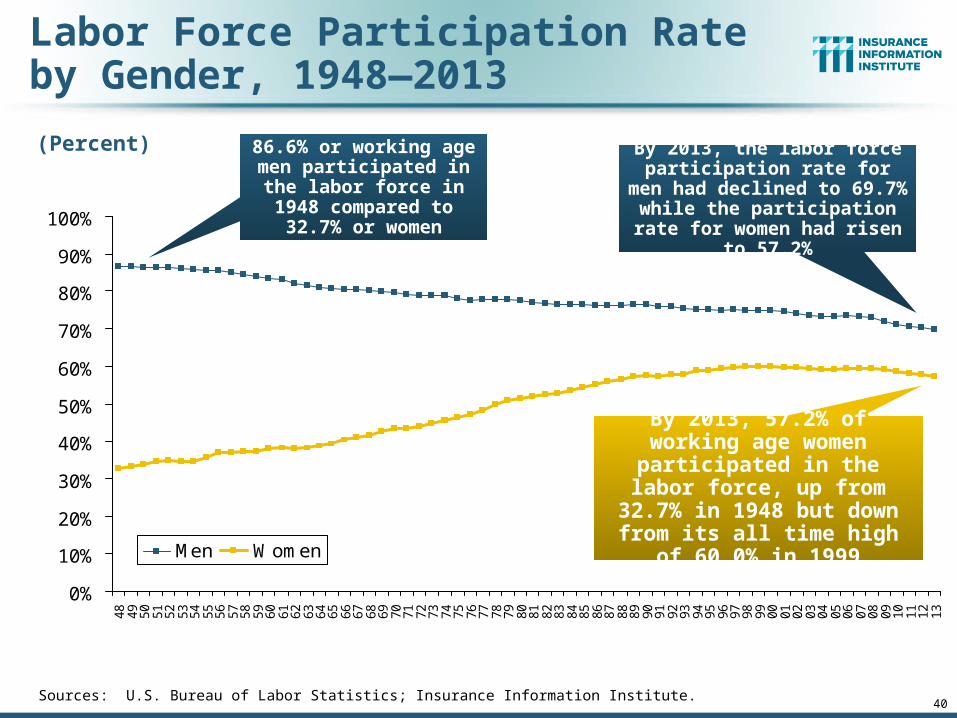
48 49 50 51 52 53 54 55 56 57 58 59 60 61 62 63 64 65 66 67 68 69 70 71 72 73 74 75 76 77 78 79 80 81 82 83 84 85 86 87 88 89 90 91 92 93 94 95 96 97 98 99 00 01 02 03 04 05 06 07 08 09 10 11 12 13
Men Women
Labor Force Participation Rate by Gender, 1948—2013
(Percent)
Sources: U.S. Bureau of Labor Statistics; Insurance Information Institute.
86.6% or working age men participated in the
labor force in 1948 compared to 32.7% or
women
By 2013, 57.2% of working age women participated in the
labor force, up from 32.7% in 1948 but down from its all time
high of 60.0% in 1999
By 2013, the labor force participation rate for men had
declined to 69.7% while the participation rate for women
had risen to 57.2%
41
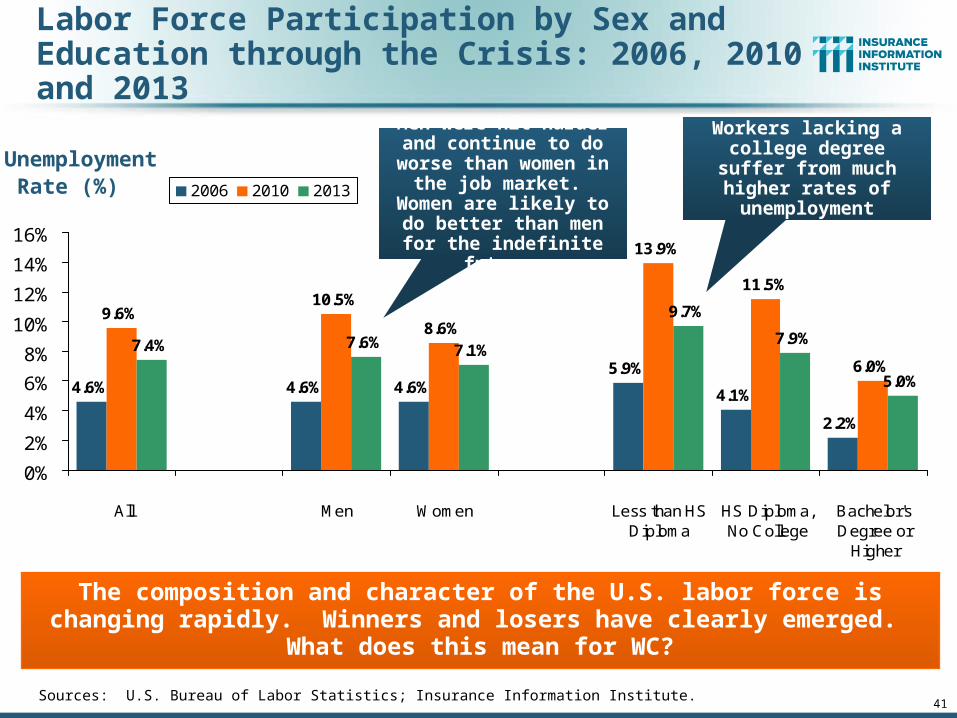
Labor Force Participation by Sex and Education through the Crisis: 2006, 2010 and 2013
4.1%
2.2%
9.6%10.5%
8.6%
13.9%
11.5%
6.0%
7.6% 7.1%
9.7%
7.9%
5.0%4.6% 4.6% 4.6%5.9%
7.4%
0%
2%
4%
6%
8%
10%
12%
14%
16%
All Men Women Less than HSDiploma
HS Diploma,No College
Bachelor'sDegree or
Higher
2006 2010 2013
The composition and character of the U.S. labor force is changing rapidly. Winners and losers have clearly emerged. What does this mean for WC?
Unemployment Rate (%)
Sources: U.S. Bureau of Labor Statistics; Insurance Information Institute.
Men were hit harder and continue to do worse than women in the job market.
Women are likely to do better than men for the
indefinite future.
Workers lacking a college degree suffer from much
higher rates of unemployment
42
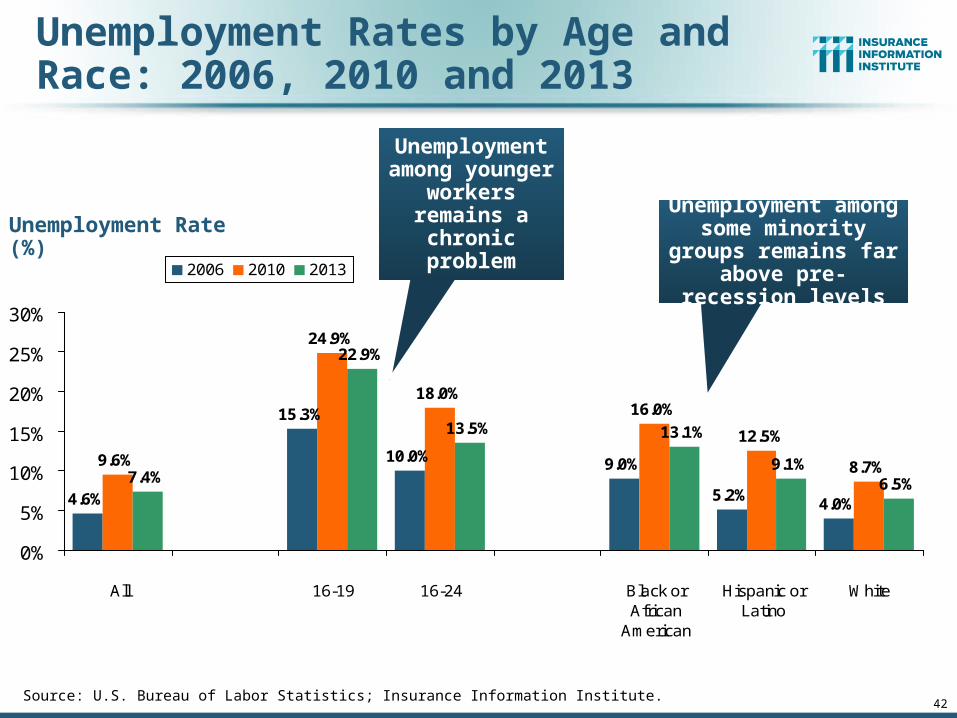
Unemployment Rates by Age and Race: 2006, 2010 and 2013
5.2%4.0%
9.6%
24.9%
18.0%16.0%
12.5%
8.7%
22.9%
13.5% 13.1%
9.1%6.5%
4.6%
15.3%
10.0% 9.0%7.4%
0%
5%
10%
15%
20%
25%
30%
All 16-19 16-24 Black orAfrican
American
Hispanic orLatino
White
2006 2010 2013
Unemployment Rate (%)
Unemployment among younger workers remains
a chronic problem
Source: U.S. Bureau of Labor Statistics; Insurance Information Institute.
Unemployment among some minority groups remains far above pre-
recession levels
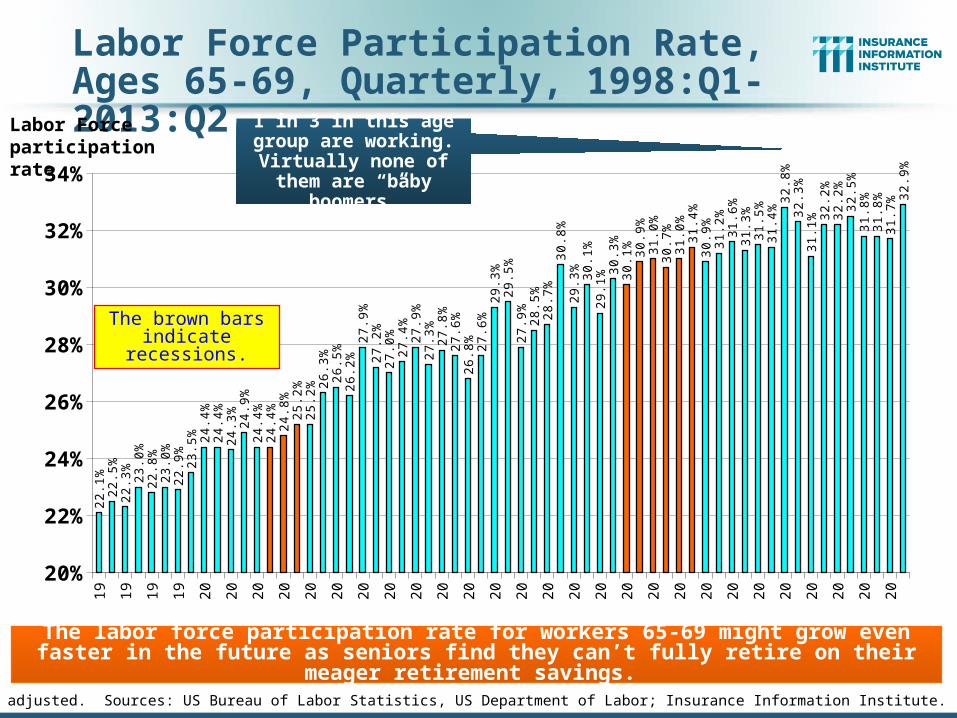
Labor Force Participation Rate, Ages 65-69, Quarterly, 1998:Q1-2013:Q21998.1
1998.3
1999.1
1999.3
2000.1
2000.3
2001.1
2001.3
2002.1
2002.3
2003.1
2003.3
2004.1
2004.3
2005.1
2005.3
2006.1
2006.3
2007.1
2007.3
2008.1
2008.3
2009.1
2009.3
2010.1
2010.3
2011.1
2011.3
2012.1
2012.3
2013.1
20%
22%
24%
26%
28%
30%
32%
34%
22.1%
22.5%
22.3% 23.0%
22.8%
23.0%
22.9% 23.5% 24.4%
24.4%
24.3% 24.9%
24.4%
24.4%
24.8%
25.2%
25.2%26.3%
26.5%
26.2%
27.9%
27.2%
27.0%
27.4%27.9%
27.3%27.8%
27.6%
26.8% 27.6%
29.3%
29.5%
27.9% 28.5%
28.7%
30.8%
29.3% 30.1%
29.1%30.3%
30.1% 30.9%
31.0%
30.7%
31.0%
31.4%
30.9%
31.2%
31.6%
31.3%
31.5%
31.4%32.8%
32.3%
31.1%32.2%
32.2%
32.5%
31.8%
31.8%
31.7%32.9%
Not seasonally adjusted. Sources: US Bureau of Labor Statistics, US Department of Labor; Insurance Information Institute.
The brown bars indicate recessions.
Labor Force participation rate
The labor force participation rate for workers 65-69 might grow even faster in the future as seniors find they can’t fully retire on their meager retirement savings.
1 in 3 in this age group are working. Virtually
none of them are “baby boomers”
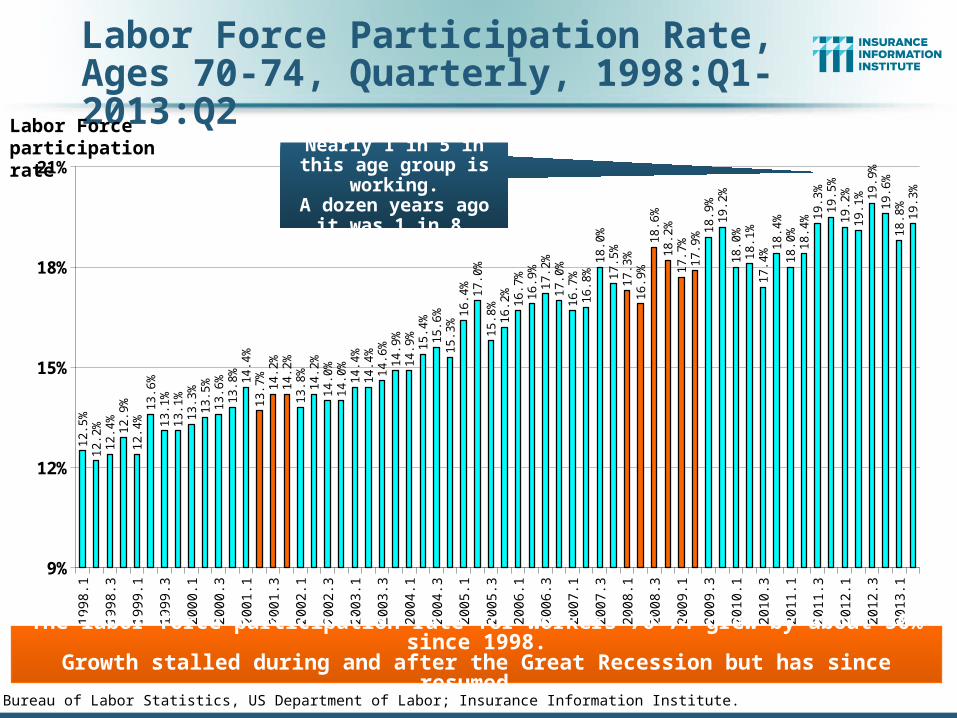
Labor Force Participation Rate,Ages 70-74, Quarterly, 1998:Q1-2013:Q2
19
98
.1
19
98
.3
19
99
.1
19
99
.3
20
00
.1
20
00
.3
20
01
.1
20
01
.3
20
02
.1
20
02
.3
20
03
.1
20
03
.3
20
04
.1
20
04
.3
20
05
.1
20
05
.3
20
06
.1
20
06
.3
20
07
.1
20
07
.3
20
08
.1
20
08
.3
20
09
.1
20
09
.3
20
10
.1
20
10
.3
20
11
.1
20
11
.3
20
12
.1
20
12
.3
20
13
.1
9%
12%
15%
18%
21%
12.5%
12.2%
12.4% 12.9%
12.4%
13.6%
13.1%
13.1%
13.3%
13.5%
13.6%
13.8% 14.4%
13.7% 14.2%
14.2%
13.8%14.2%
14.0%
14.0%14.4%
14.4%
14.6%
14.9%
14.9% 15.4%
15.6%
15.3%16.4% 17.0%
15.8%16.2% 16.7%
16.9%
17.2%
17.0%
16.7%
16.8%
18.0%
17.5%
17.3%
16.9%
18.6%
18.2%
17.7%
17.9%18.9%
19.2%
18.0%
18.1%
17.4%18.4%
18.0%18.4%19.3%
19.5%
19.2%
19.1% 19.9%
19.6%
18.8% 19.3%
Source: US Bureau of Labor Statistics, US Department of Labor; Insurance Information Institute.
Labor Force participation rate
The labor force participation rate for workers 70-74 grew by about 50% since 1998.Growth stalled during and after the Great Recession but has since resumed.
Nearly 1 in 5 in this age group is working.
A dozen years ago it was 1 in 8.
50
The Reindustrialization of America
American Industrial Might Is Making a Comeback
A Golden Opportunity for Workers Comp Insurers?
50
51
$200,000
$300,000
$400,000
$500,000
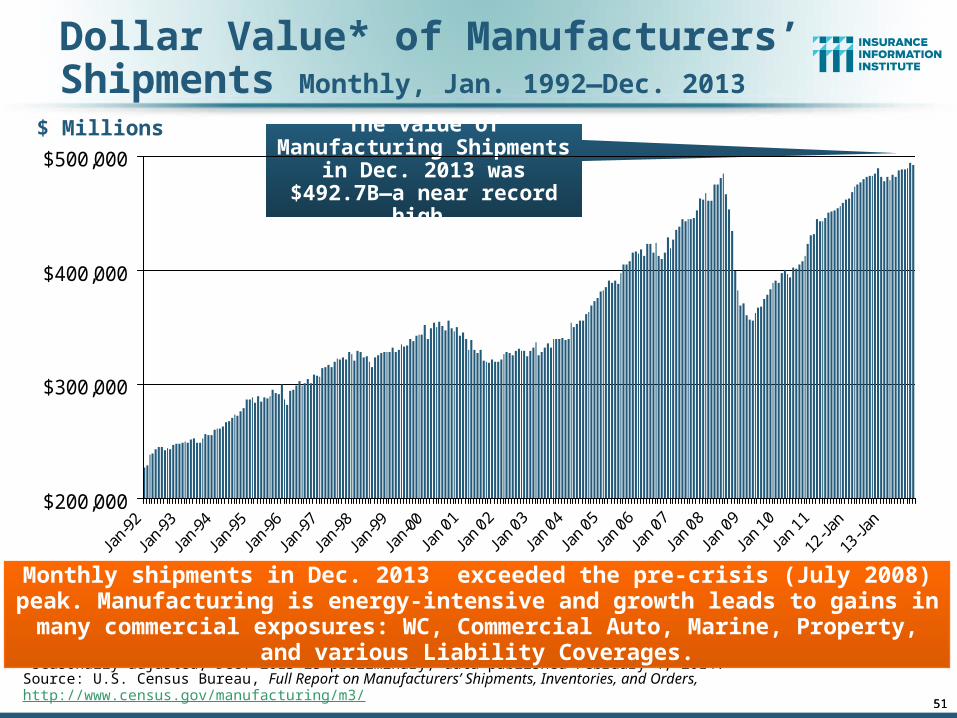
Dollar Value* of Manufacturers’ Shipments Monthly, Jan. 1992—Dec. 2013
*seasonally adjusted; Dec. 2013 is preliminary; data published February 4, 2014.Source: U.S. Census Bureau, Full Report on Manufacturers’ Shipments, Inventories, and Orders, http://www.census.gov/manufacturing/m3/
Monthly shipments in Dec. 2013 exceeded the pre-crisis (July 2008) peak. Manufacturing is energy-intensive and growth leads to gains in many commercial
exposures: WC, Commercial Auto, Marine, Property, and various Liability Coverages.
$ Millions
51
The value of Manufacturing Shipments in Dec. 2013 was $492.7B—a near record high.
58
.35
7.1
60
.45
9.6
57
.85
5.3
55
.15
5.2
55
.3 56
.9 58
.25
8.5
60
.86
1.4
59
.75
9.7
54
.2 55
.85
1.4 52
.55
2.5
51
.85
2.2 53
.1 54
.15
1.9 5
3.3 54
.15
2.5
50
.25
0.5
50
.7 51
.65
1.7
49
.95
0.2
53
.1 54
.2
50
.74
9.0 5
0.9
55
.45
5.7
56
.25
6.4 57
.35
7.0
51
.9 53
.2
51
.3
40
45
50
55
60
65
Jan
-10
Fe
b-1
0M
ar-
10
Ap
r-1
0M
ay-
10
Jun
-10
Jul-
10
Au
g-1
0S
ep
-10
Oct
-10
No
v-1
0D
ec-
10
Jan
-11
Fe
b-1
1M
ar-
11
Ap
r-1
1M
ay-
11
Jun
-11
Jul-
11
Au
g-1
1S
ep
-11
Oct
-11
No
v-1
1D
ec-
11
Jan
-12
Fe
b-1
2M
ar-
12
Ap
r-1
2M
ay-
12
Jun
-12
Jul-
12
Au
g-1
2S
ep
-12
Oct
-12
No
v-1
2D
ec-
12
Jan
-13
Fe
b-1
3M
ar-
13
Ap
r-1
3M
ay-
13
Jun
-13
Jul-
13
Au
g-1
3S
ep
-13
Oct
-13
No
v-1
3D
ec-
13
Jan
-14
Fe
b-1
4
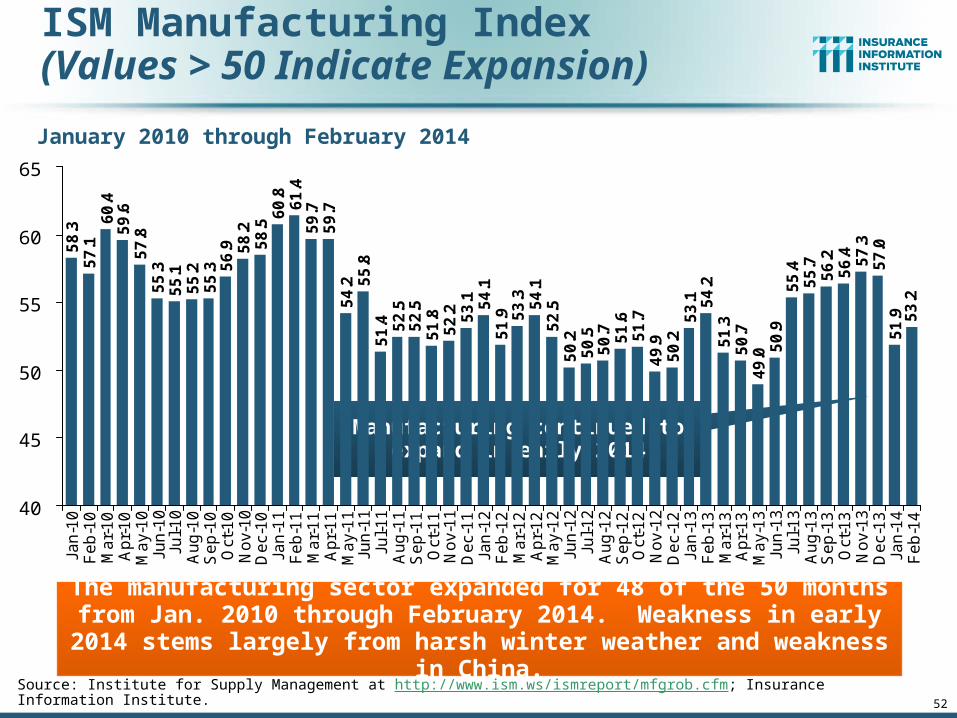
ISM Manufacturing Index(Values > 50 Indicate Expansion)
January 2010 through February 2014
The manufacturing sector expanded for 48 of the 50 months from Jan. 2010 through February 2014. Weakness in early 2014 stems largely from
harsh winter weather and weakness in China.
Source: Institute for Supply Management at http://www.ism.ws/ismreport/mfgrob.cfm; Insurance Information Institute.
Manufacturing continued to expand in early 2014
52
53
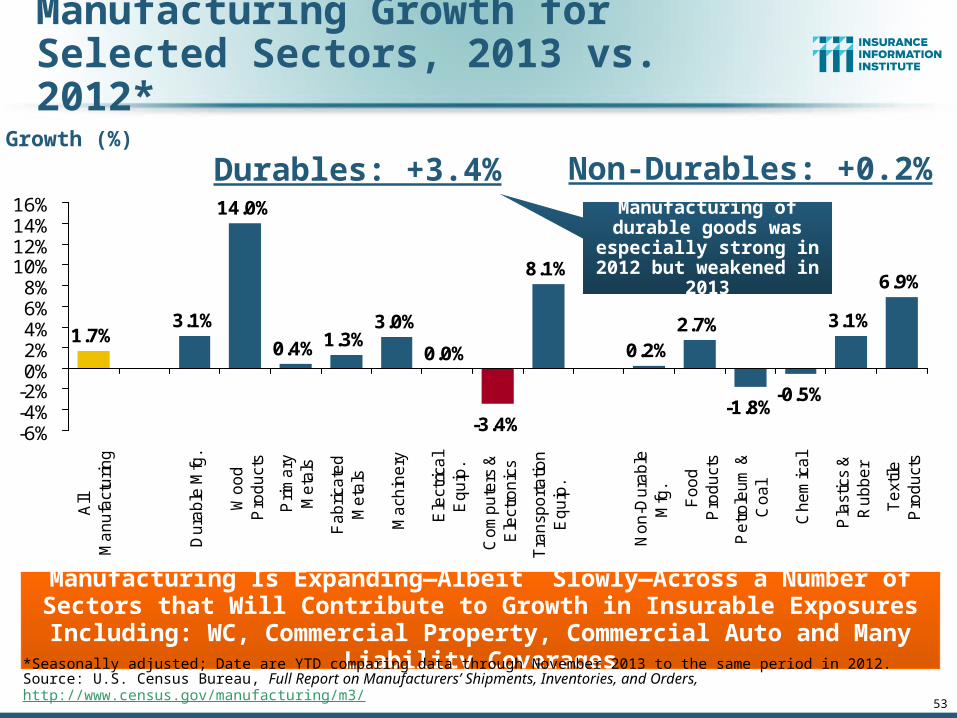
Manufacturing Growth for Selected Sectors, 2013 vs. 2012*
3.0%
0.0%
-3.4%
8.1%
0.2%2.7%
-1.8%-0.5%
3.1%
6.9%
1.7%3.1%
14.0%
0.4% 1.3%
-6%-4%-2%0%2%4%6%8%
10%12%14%16%
All
Ma
nu
fact
uri
ng
Du
rab
le M
fg.
Wo
od
Pro
du
cts
Pri
ma
ryM
eta
ls
Fa
bri
cate
dM
eta
ls
Ma
chin
ery
Ele
ctri
cal
Eq
uip
.
Co
mp
ute
rs &
Ele
ctro
nic
s
Tra
nsp
ort
atio
nE
qu
ip.
No
n-D
ura
ble
Mfg
.
Fo
od
Pro
du
cts
Pe
tro
leu
m &
Co
al
Ch
em
ica
l
Pla
stic
s &
Ru
bb
er
Te
xtile
Pro
du
cts
Manufacturing Is Expanding—Albeit Slowly—Across a Number of Sectors that Will Contribute to Growth in Insurable Exposures Including: WC, Commercial
Property, Commercial Auto and Many Liability Coverages
Growth (%)
Manufacturing of durable goods was especially
strong in 2012 but weakened in 2013
*Seasonally adjusted; Date are YTD comparing data through November 2013 to the same period in 2012.Source: U.S. Census Bureau, Full Report on Manufacturers’ Shipments, Inventories, and Orders, http://www.census.gov/manufacturing/m3/
Durables: +3.4% Non-Durables: +0.2%
54
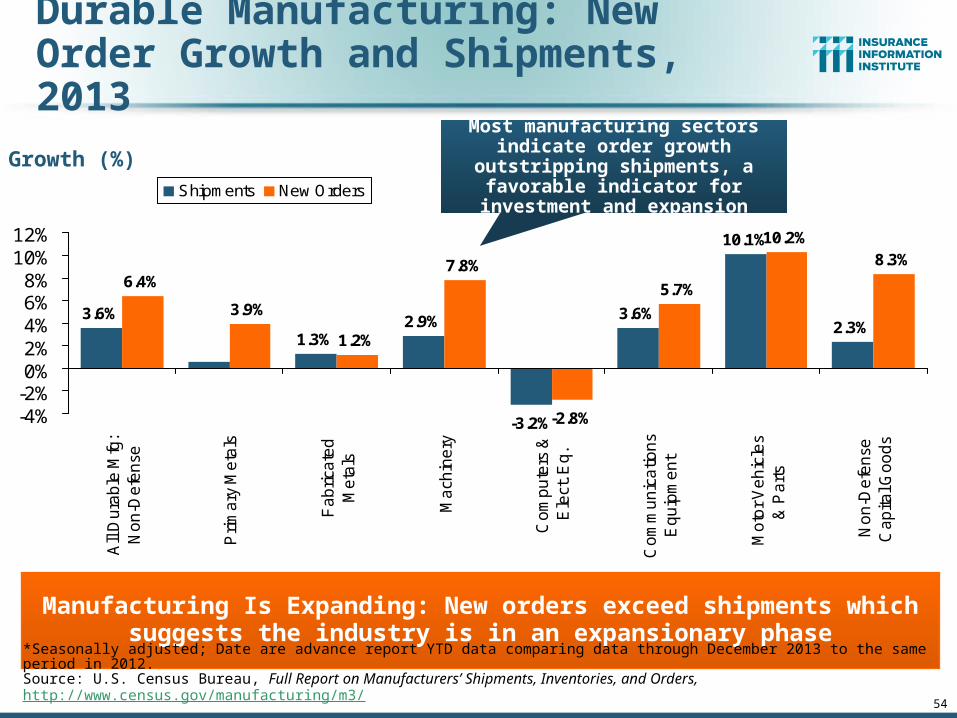
Durable Manufacturing: New Order Growth and Shipments, 2013
10.1%
2.3%
6.4%
3.9%
1.2%
7.8%
-2.8%
5.7%
10.2%8.3%
3.6%
1.3%2.9%
-3.2%
3.6%
-4%-2%0%2%4%6%8%
10%12%
All
Du
rab
le M
fg:
No
n-D
efe
nse
Pri
ma
ry M
eta
ls
Fa
bri
cate
dM
eta
ls
Ma
chin
ery
Co
mp
ute
rs &
Ele
ct. E
q.
Co
mm
un
ica
tion
sE
qu
ipm
en
t
Mo
tor
Ve
hic
les
& P
art
s
No
n-D
efe
nse
Ca
pita
l Go
od
s
Shipments New Orders
Manufacturing Is Expanding: New orders exceed shipments which suggests the industry is in an expansionary phase
Growth (%)Most manufacturing sectors indicate
order growth outstripping shipments, a favorable indicator for
investment and expansion
*Seasonally adjusted; Date are advance report YTD data comparing data through December 2013 to the same period in 2012.Source: U.S. Census Bureau, Full Report on Manufacturers’ Shipments, Inventories, and Orders, http://www.census.gov/manufacturing/m3/
66%
68%
70%
72%
74%
76%
78%
80%
82%
Mar
01
Jun 0
1
Sep
Dec
Mar
02
Jun 0
2
Sep
Dec
Mar
03
Jun 0
3
Sep
Dec
Mar
04
Jun 0
4
Sep
Dec
Mar
05
Jun 0
5
Sep
Dec
Mar
06
Jun 0
6
Sep
Dec
Mar
07
Jun 0
7
Sep
Dec
Mar
08
Jun 0
8
Sep
Dec
Mar
09
Jun 0
9
Sep
Dec
Mar
10
Jun 1
0
Sep
Dec
Mar
11
Jun 1
1
Sep
Dec
Mar
12
Jun 1
2
Sep
Dec
Mar
13
Jun 1
3
Sep
Dec
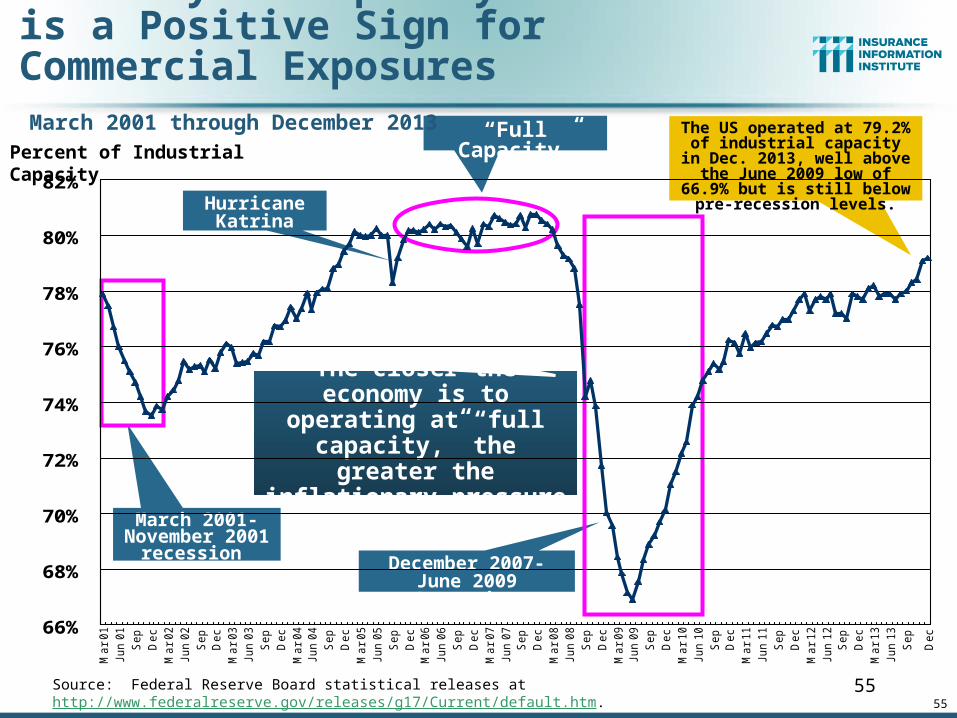
Recovery in Capacity Utilization is a Positive Sign for Commercial Exposures
Source: Federal Reserve Board statistical releases at http://www.federalreserve.gov/releases/g17/Current/default.htm. 55
Percent of Industrial Capacity
Hurricane Katrina
March 2001-November 2001
recession
“Full Capacity”
The closer the economy is to operating at “full
capacity,” the greater the inflationary pressure
The US operated at 79.2% of industrial capacity in Dec. 2013, well above the June
2009 low of 66.9% but is still below pre-recession levels.
December 2007-June 2009 Recession
March 2001 through December 2013
55
56
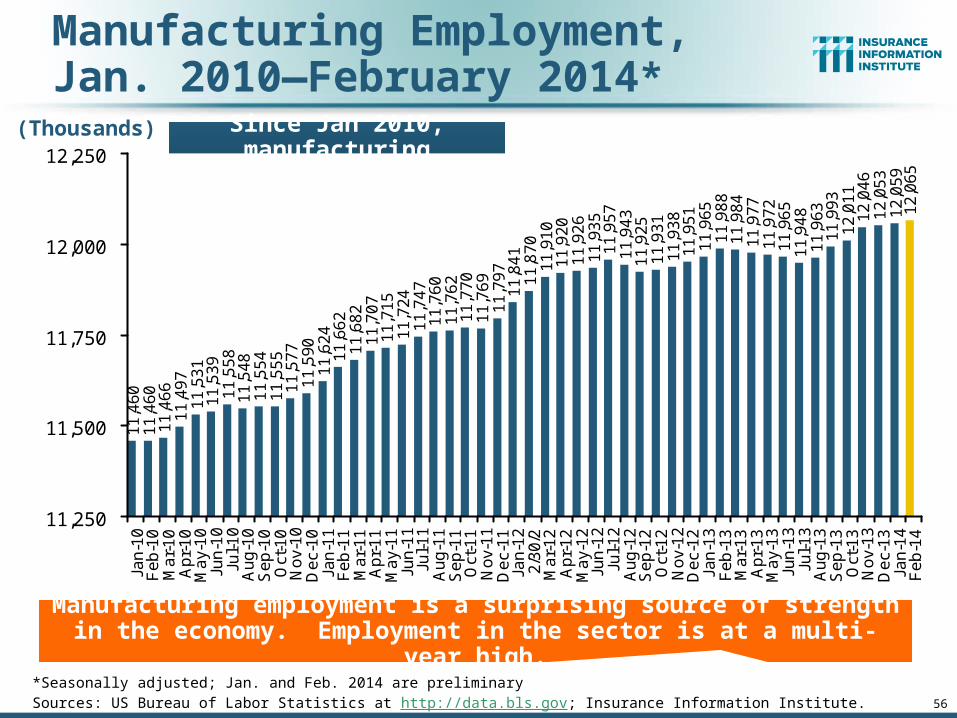
Manufacturing Employment,Jan. 2010—February 2014*
11
,46
01
1,4
60
11
,46
61
1,4
97
11
,53
11
1,5
39
11
,55
81
1,5
48
11
,55
41
1,5
55
11
,57
71
1,5
90
11
,62
41
1,6
62
11
,68
21
1,7
07
11
,71
51
1,7
24
11
,74
71
1,7
60
11
,76
21
1,7
70
11
,76
91
1,7
97
11
,84
11
1,8
70
11
,91
01
1,9
20
11
,92
61
1,9
35
11
,95
71
1,9
43
11
,92
51
1,9
31
11
,93
81
1,9
51
11
,96
51
1,9
88
11
,98
41
1,9
77
11
,97
21
1,9
65
11
,94
81
1,9
63
11
,99
31
2,0
11
12
,04
61
2,0
53
12
,05
91
2,0
65
11,250
11,500
11,750
12,000
12,250Ja
n-1
0F
eb
-10
Ma
r-1
0A
pr-
10
Ma
y-1
0Ju
n-1
0Ju
l-1
0A
ug
-10
Se
p-1
0O
ct-1
0N
ov-
10
De
c-1
0Ja
n-1
1F
eb
-11
Ma
r-1
1A
pr-
11
Ma
y-1
1Ju
n-1
1Ju
l-1
1A
ug
-11
Se
p-1
1O
ct-1
1N
ov-
11
De
c-1
1Ja
n-1
22
/30
/2M
ar-
12
Ap
r-1
2M
ay-
12
Jun
-12
Jul-
12
Au
g-1
2S
ep
-12
Oct
-12
No
v-1
2D
ec-
12
Jan
-13
Fe
b-1
3M
ar-
13
Ap
r-1
3M
ay-
13
Jun
-13
Jul-
13
Au
g-1
3S
ep
-13
Oct
-13
No
v-1
3D
ec-
13
Jan
-14
Fe
b-1
4
Manufacturing employment is a surprising source of strength in the economy. Employment in the sector is at a multi-year high.
*Seasonally adjusted; Jan. and Feb. 2014 are preliminarySources: US Bureau of Labor Statistics at http://data.bls.gov; Insurance Information Institute.
(Thousands) Since Jan 2010, manufacturing employment
is up (+605,000 or +5.3%)and still growing.
57
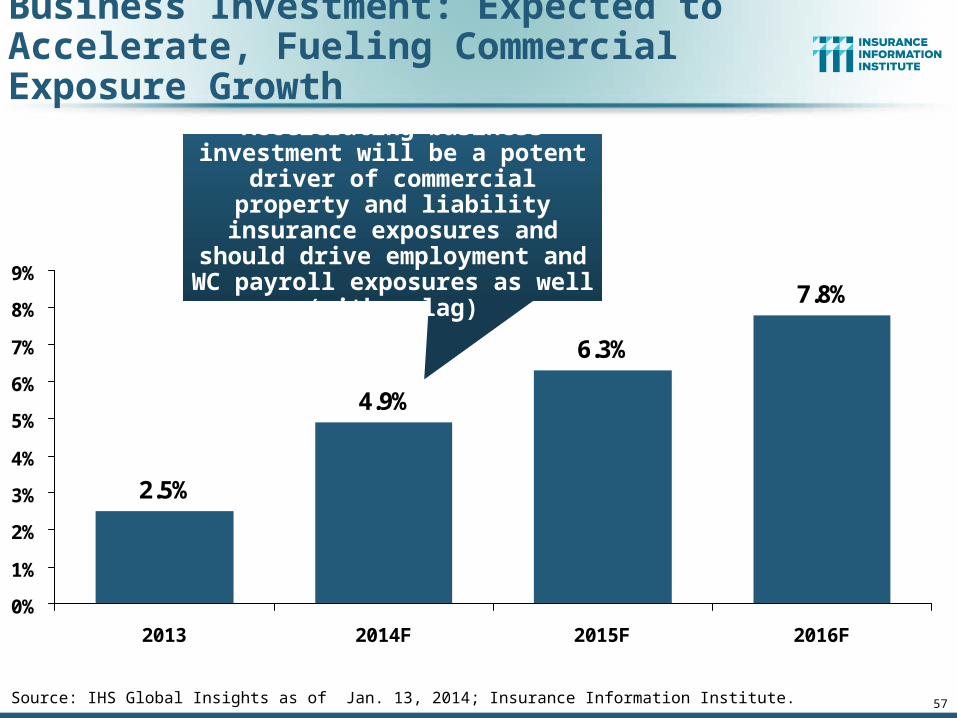
2.5%
4.9%
6.3%
7.8%
0%
1%
2%
3%
4%
5%
6%
7%
8%
9%
2013 2014F 2015F 2016F
Business Investment: Expected to Accelerate, Fueling Commercial Exposure Growth
Accelerating business investment will be a potent driver of
commercial property and liability insurance exposures and should drive employment and WC payroll
exposures as well (with a lag)
Source: IHS Global Insights as of Jan. 13, 2014; Insurance Information Institute.
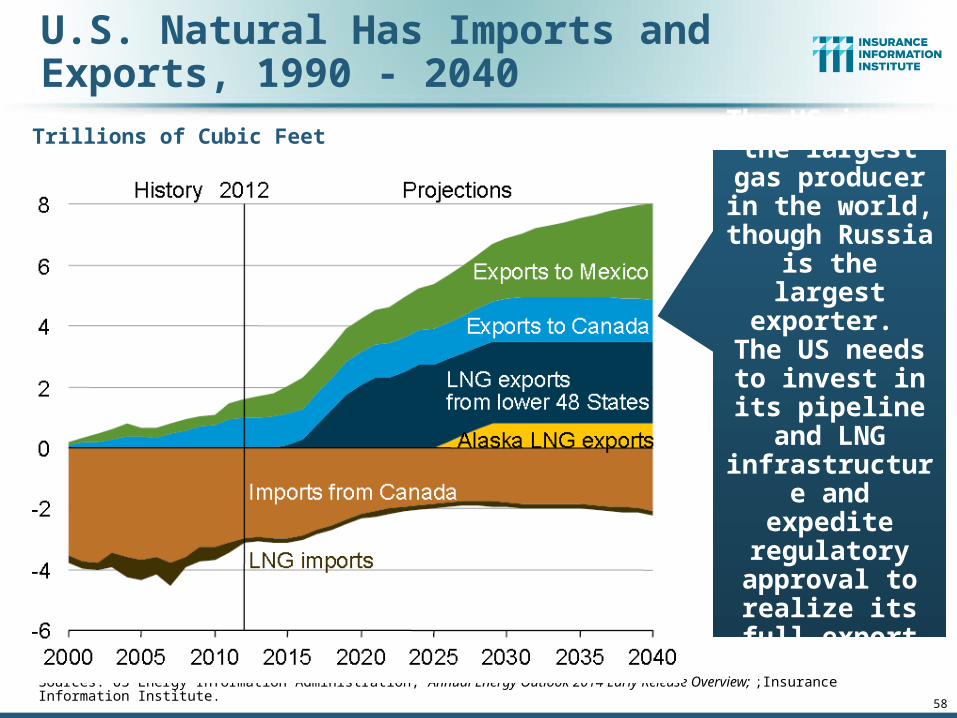
U.S. Natural Has Imports and Exports, 1990 - 2040
Sources: US Energy Information Administration, Annual Energy Outlook 2014 Early Release Overview; ;Insurance Information Institute. 58
Trillions of Cubic Feet
The US is now the largest gas producer in the world, though Russia is the
largest exporter. The US needs to
invest in its pipeline and
LNG infrastructure and expedite
regulatory approval to
realize its full export potential
59
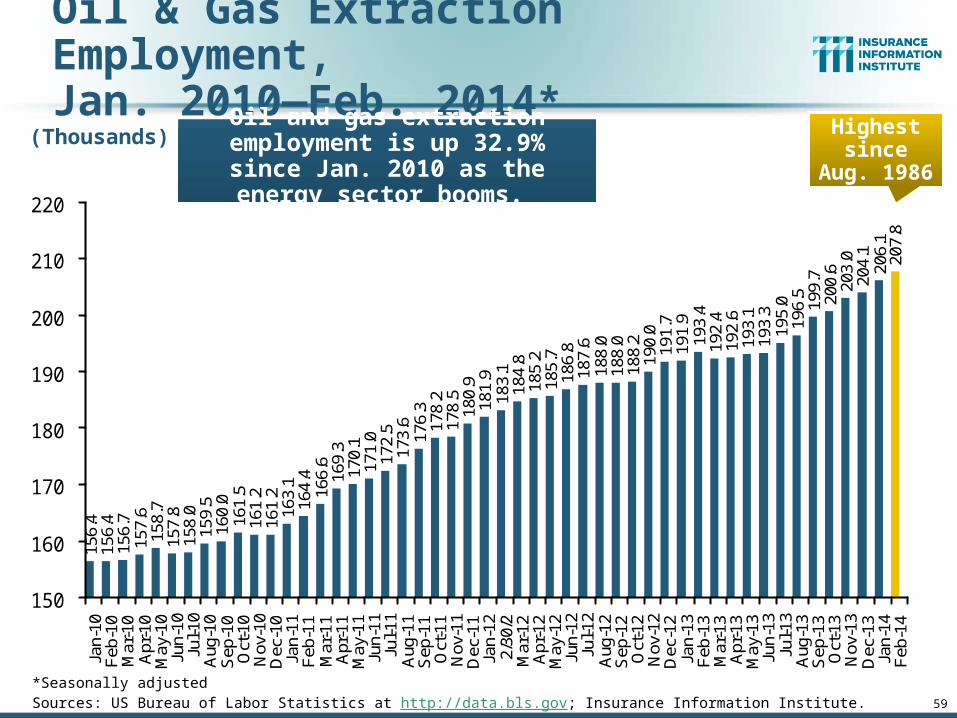
Oil & Gas Extraction Employment,Jan. 2010—Feb. 2014*
*Seasonally adjustedSources: US Bureau of Labor Statistics at http://data.bls.gov; Insurance Information Institute.
156.
415
6.4
156.
715
7.6
158.
715
7.8
158.
015
9.5
160.
016
1.5
161.
216
1.2
163.
116
4.4
166.
616
9.3
170.
117
1.0
172.
517
3.6
176.
317
8.2
178.
518
0.9
181.
918
3.1
184.
818
5.2
185.
718
6.8
187.
618
8.0
188.
018
8.2
190.
019
1.7
191.
919
3.4
192.
419
2.6
193.
119
3.3
195.
019
6.5
199.
720
0.6
203.
020
4.1
206.
120
7.8
150
160
170
180
190
200
210
220
Jan-
10F
eb-1
0M
ar-1
0A
pr-1
0M
ay-1
0Ju
n-10
Jul-1
0A
ug-1
0S
ep-1
0O
ct-1
0N
ov-1
0D
ec-1
0Ja
n-11
Feb
-11
Mar
-11
Apr
-11
May
-11
Jun-
11Ju
l-11
Aug
-11
Sep
-11
Oct
-11
Nov
-11
Dec
-11
Jan-
122/
30/2
Mar
-12
Apr
-12
May
-12
Jun-
12Ju
l-12
Aug
-12
Sep
-12
Oct
-12
Nov
-12
Dec
-12
Jan-
13F
eb-1
3M
ar-1
3A
pr-1
3M
ay-1
3Ju
n-13
Jul-1
3A
ug-1
3S
ep-1
3O
ct-1
3N
ov-1
3D
ec-1
3Ja
n-14
Feb
-14
Oil and gas extraction employment is up 32.9% since Jan. 2010 as the energy sector booms. Domestic energy production is essential to any robust economic recovery in
the US.
(Thousands) Highest since Aug.
1986
60
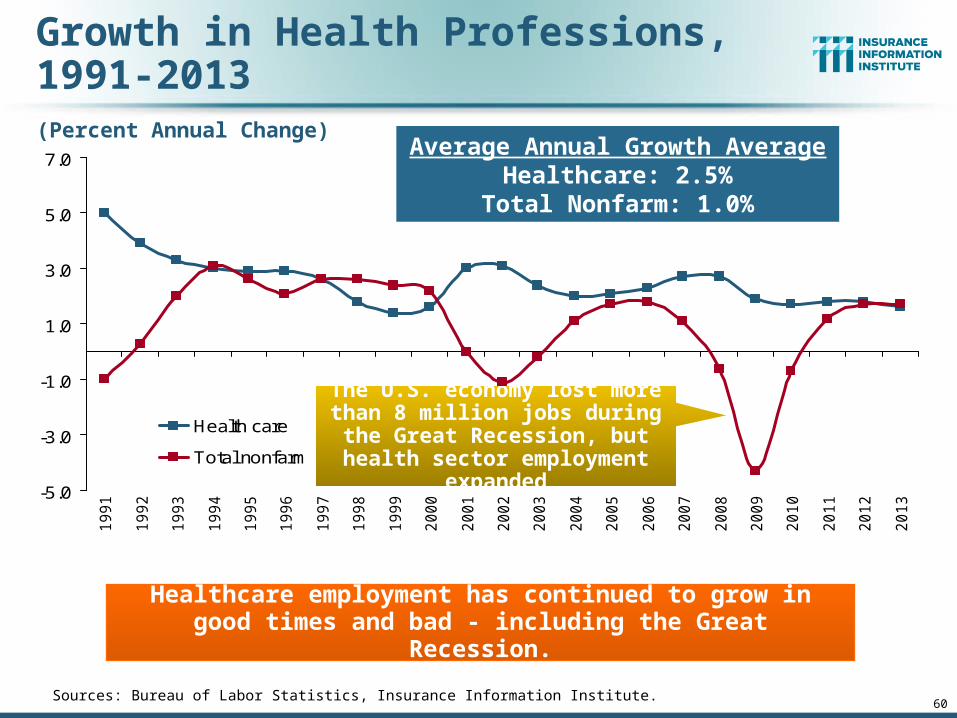
Growth in Health Professions,1991-2013
Sources: Bureau of Labor Statistics, Insurance Information Institute.
-5.0
-3.0
-1.0
1.0
3.0
5.0
7.0
19
91
19
92
19
93
19
94
19
95
19
96
19
97
19
98
19
99
20
00
20
01
20
02
20
03
20
04
20
05
20
06
20
07
20
08
20
09
20
10
20
11
20
12
20
13
Health care
Total nonfarm
(Percent Annual Change)
Healthcare employment has continued to grow in good times and bad - including the Great Recession.
Average Annual Growth AverageHealthcare: 2.5%
Total Nonfarm: 1.0%
The U.S. economy lost more than 8 million jobs during the Great Recession, but health sector
employment expanded
Healthcare Support
Healthcare Practitioners
Construction
Personal Care and Service
Computer and Math
Social Service
Business & Financial
Groundskeeping/Janitorial
Education
All Occupations
Legal
Life, Phys and Social Science
Repair
Food Preparation
Transportation
Fire, Police, Etc.
Architects and Engineers
Sales
Management
Arts and Media
Administrative Support
Production
Farming
28.1
21.5
21.4
20.9
18
17.2
12.5
12.5
11.1
10.8
10.7
10.1
9.6
9.4
8.6
7.9
7.3
7.3
7.2
7
6.8
0.8-3.4
Source: Bureau of Labor Statistics, Insurance Information Institute.
Occupations Ranked by Projected Percentage Growth, 2012-2022F (Millions)
61
Healthcare professions are expected to grow at 2 to
nearly 3 times employment growth overall
62
The Future of Healthcare in America
Workers Comp Is Increasingly Along for the Ride in the
American Health Care Saga
62
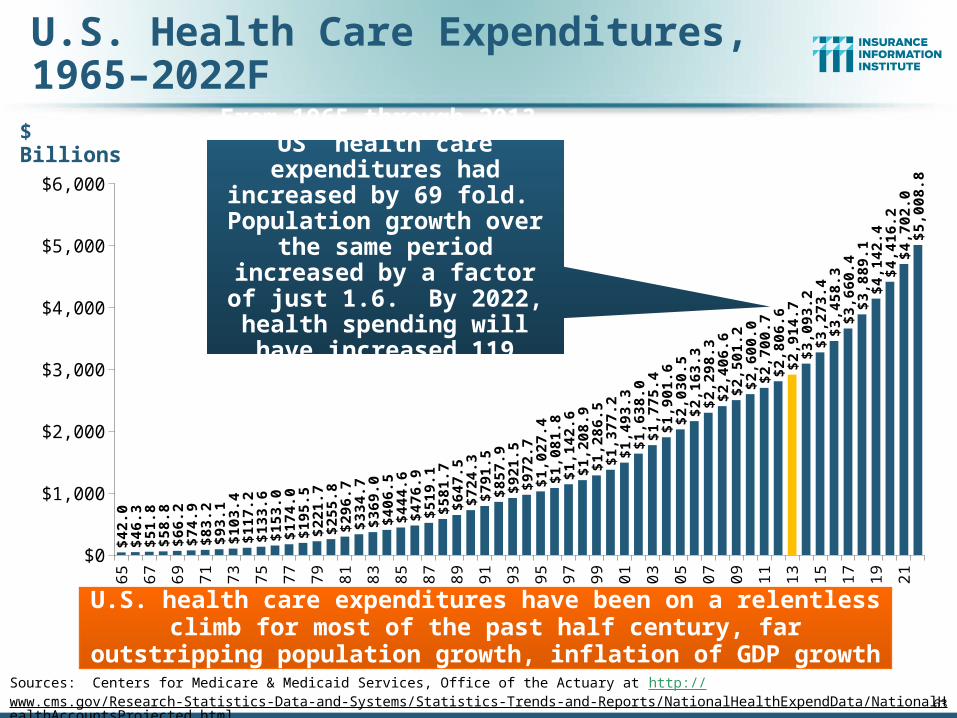
U.S. Health Care Expenditures,1965–2022F
65 67 69 71 73 75 77 79 81 83 85 87 89 91 93 95 97 99 01 03 05 07 09 11 13 15 17 19 21
$0
$1,000
$2,000
$3,000
$4,000
$5,000
$6,000
$42.
0$4
6.3
$51.
8$5
8.8
$66.
2$7
4.9
$83.
2$9
3.1
$103
.4$1
17.2
$133
.6$1
53.0
$174
.0$1
95.5
$221
.7$2
55.8
$296
.7$3
34.7
$369
.0$4
06.5
$444
.6$4
76.9
$519
.1$5
81.7
$647
.5$7
24.3
$791
.5$8
57.9
$921
.5$9
72.7
$1,0
27.4
$1,0
81.8
$1,1
42.6
$1,2
08.9
$1,2
86.5
$1,3
77.2
$1,4
93.3
$1,6
38.0
$1,7
75.4
$1,9
01.6
$2,0
30.5
$2,1
63.3
$2,2
98.3
$2,4
06.6
$2,5
01.2
$2,6
00.0
$2,7
00.7
$2,8
06.6
$2,9
14.7
$3,0
93.2
$3,2
73.4
$3,4
58.3
$3,6
60.4
$3,8
89.1
$4,1
42.4
$4,4
16.2
$4,7
02.0
$5,0
08.8
U.S. health care expenditures have been on a relentless climb for most of the past half century, far outstripping population growth,
inflation of GDP growth
63
From 1965 through 2013, US health care expenditures had
increased by 69 fold. Population growth over the same period increased by a factor of just 1.6. By 2022, health spending will have
increased 119 fold.
$ Billions
Sources: Centers for Medicare & Medicaid Services, Office of the Actuary at http://www.cms.gov/Research-Statistics-Data-and-Systems/Statistics-Trends-and-Reports/NationalHealthExpendData/NationalHealthAccountsProjected.html accessed 3/14/14; Insurance Information Institute.
0%
2%
4%
6%
8%
10%
12%
14%
16%
18%
20%
65 66 67 68 69 70 71 72 73 74 75 76 77 78 79 80 81 82 83 84 85 86 87 88 89 90 91 92 93 94 95 96 97 98 99 00 01 02 03 04 05 06 07 08 09 10 11 12 13 14 15 16 17 18 19 20 21 22
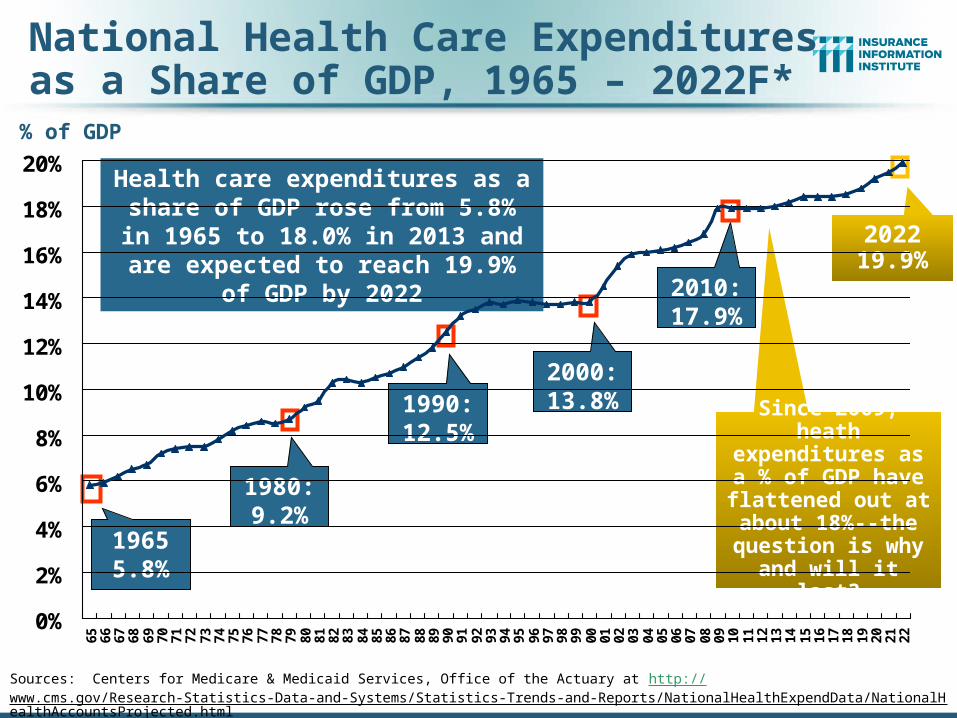
National Health Care Expenditures as a Share of GDP, 1965 – 2022F*
Sources: Centers for Medicare & Medicaid Services, Office of the Actuary at http://www.cms.gov/Research-Statistics-Data-and-Systems/Statistics-Trends-and-Reports/NationalHealthExpendData/NationalHealthAccountsProjected.html accessed 3/14/14; Insurance Information Institute.
1965 5.8%
Health care expenditures as a share of GDP rose from 5.8% in 1965 to 18.0% in 2013 and are expected to
reach 19.9% of GDP by 2022
% of GDP
2022 19.9%
1980: 9.2%
1990: 12.5%
2000: 13.8%
2010: 17.9%
Since 2009, heath expenditures as a %
of GDP have flattened out at about 18%--the
question is why and will it last?
65
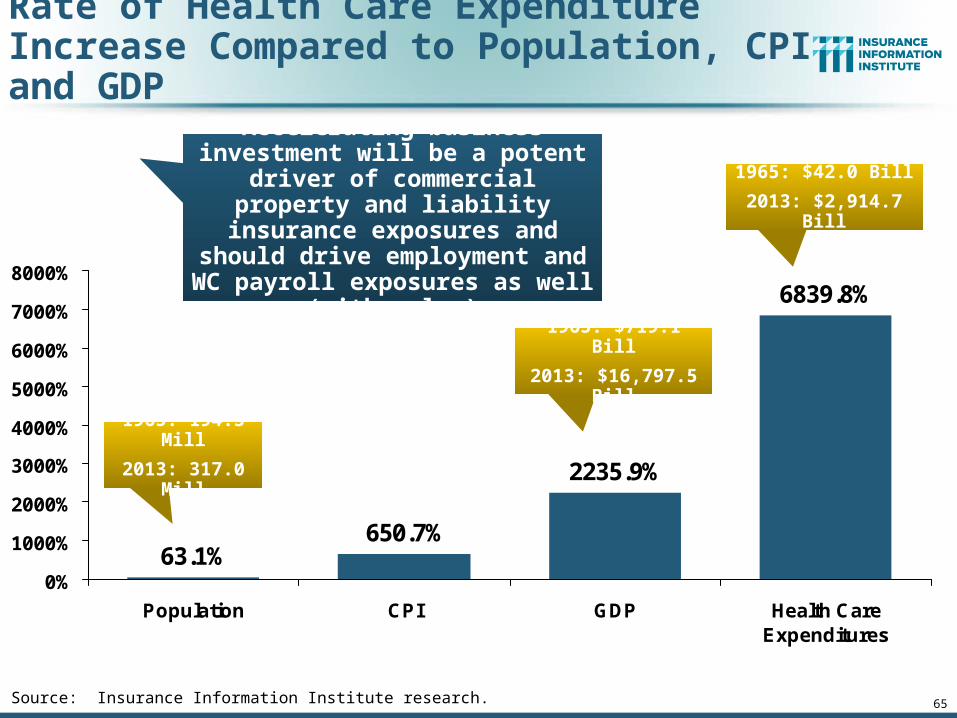
63.1%650.7%
2235.9%
6839.8%
0%
1000%
2000%
3000%
4000%
5000%
6000%
7000%
8000%
Population CPI GDP Health CareExpenditures
Rate of Health Care Expenditure Increase Compared to Population, CPI and GDP
Accelerating business investment will be a potent driver of
commercial property and liability insurance exposures and should drive employment and WC payroll
exposures as well (with a lag)
Source: Insurance Information Institute research.
1965: 194.3 Mill
2013: 317.0 Mill
1965: $719.1 Bill
2013: $16,797.5 Bill
1965: $42.0 Bill
2013: $2,914.7 Bill
-1%
0%
1%
2%
3%
4%
5%
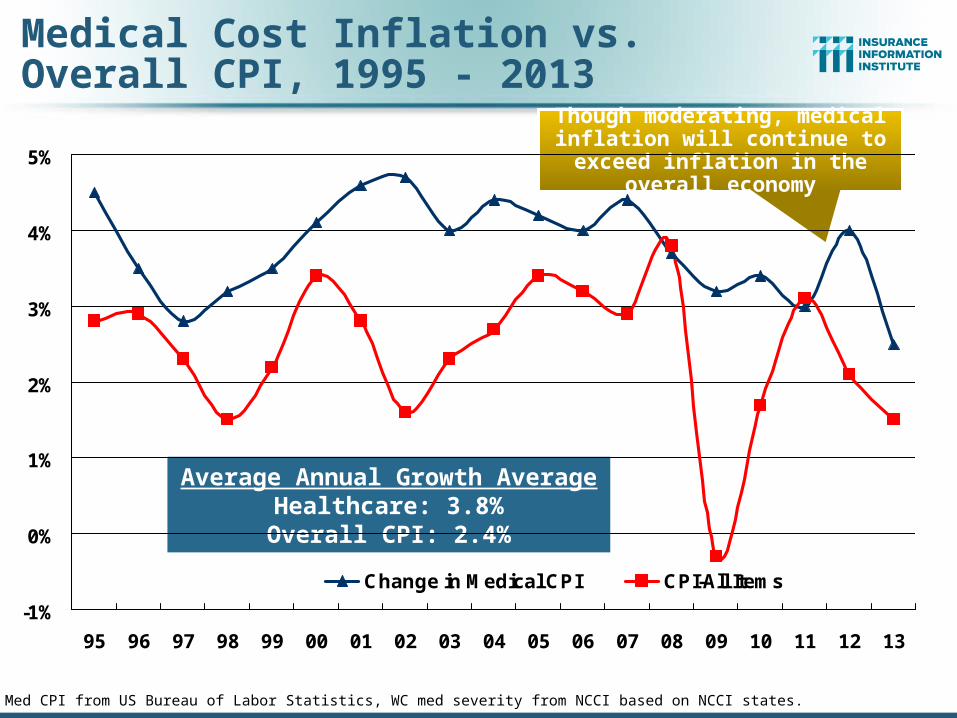
95 96 97 98 99 00 01 02 03 04 05 06 07 08 09 10 11 12 13
Change in Medical CPI CPI-All Items
Medical Cost Inflation vs. Overall CPI, 1995 - 2013
Sources: Med CPI from US Bureau of Labor Statistics, WC med severity from NCCI based on NCCI states.
Average Annual Growth AverageHealthcare: 3.8%Overall CPI: 2.4%
Though moderating, medical inflation will continue to exceed inflation in the overall economy
67
Possible Effects of the Affordable Care Act (“ObamaCare”) on
Workers Compensation
67
4.5%
3.5%2.8%
3.2%3.5%4.1%
4.6%4.7%4.0%
4.4%4.2%4.0%4.4%
3.7%3.2%3.4%
3.0%
5.1%
7.4%
10.1%10.6%
13.5%
5.4%
7.8%
6.3%6.6%
4.1%3.6% 4%
3%
1.4%
5.4%
8.8%
7.7%
7.3%
8.3%
0%
2%
4%
6%
8%
10%
12%
14%
16%
95 96 97 98 99 00 01 02 03 04 05 06 07 08 09 10 11 12
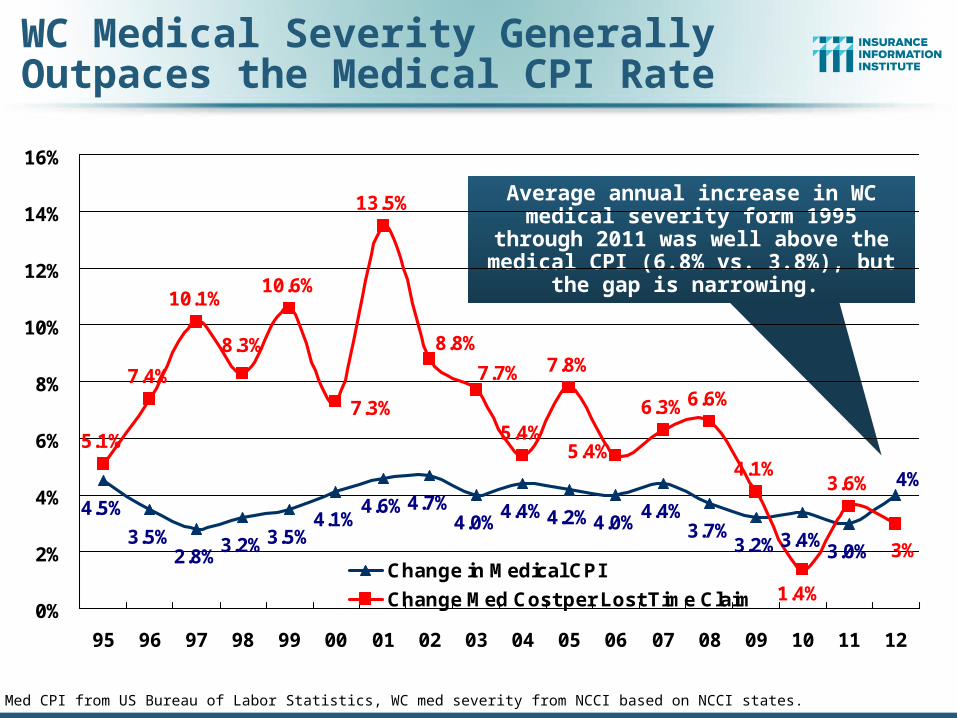
Change in Medical CPI
Change Med Cost per Lost Time Claim
WC Medical Severity Generally Outpaces the Medical CPI Rate
Sources: Med CPI from US Bureau of Labor Statistics, WC med severity from NCCI based on NCCI states.
Average annual increase in WC medical severity form 1995 through 2011 was well above the medical CPI (6.8% vs. 3.8%), but
the gap is narrowing.
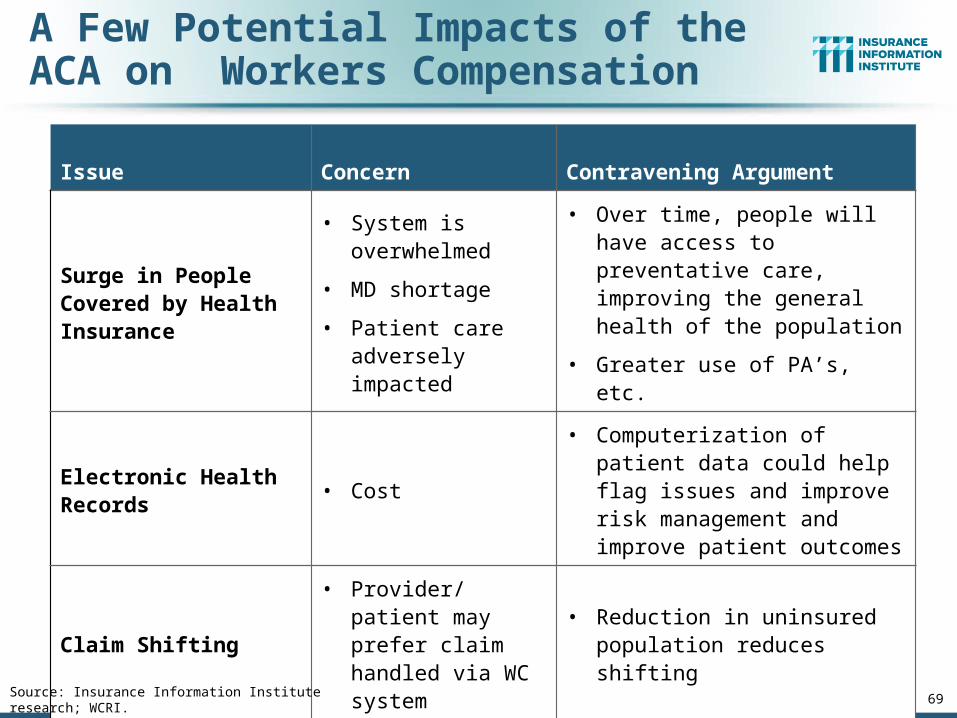
Issue Concern Contravening Argument
Surge in People Covered by Health Insurance
• System is overwhelmed
• MD shortage
• Patient care adversely impacted
• Over time, people will have access to preventative care, improving the general health of the population
• Greater use of PA’s, etc.
Electronic Health Records
• Cost
• Computerization of patient data could help flag issues and improve risk management and improve patient outcomes
Claim Shifting• Provider/patient may
prefer claim handled via WC system
• Reduction in uninsured population reduces shifting
Source: Insurance Information Institute research; WCRI. 69
A Few Potential Impacts of the ACA on Workers Compensation
0%
50%
100%
150%
200%
250%
300%
350%
MA HI
WV
MD
FL
CA
TX MI
UT
VT
NY
NC
PA
OH
WA
CO
ND
SC
KY
KS
SD
WY
AR
OK
GA
MN
ME
MO
AZ
NM
TN
LA
MS
AL
NE
CT
OR
NV ID RI
IL
AK
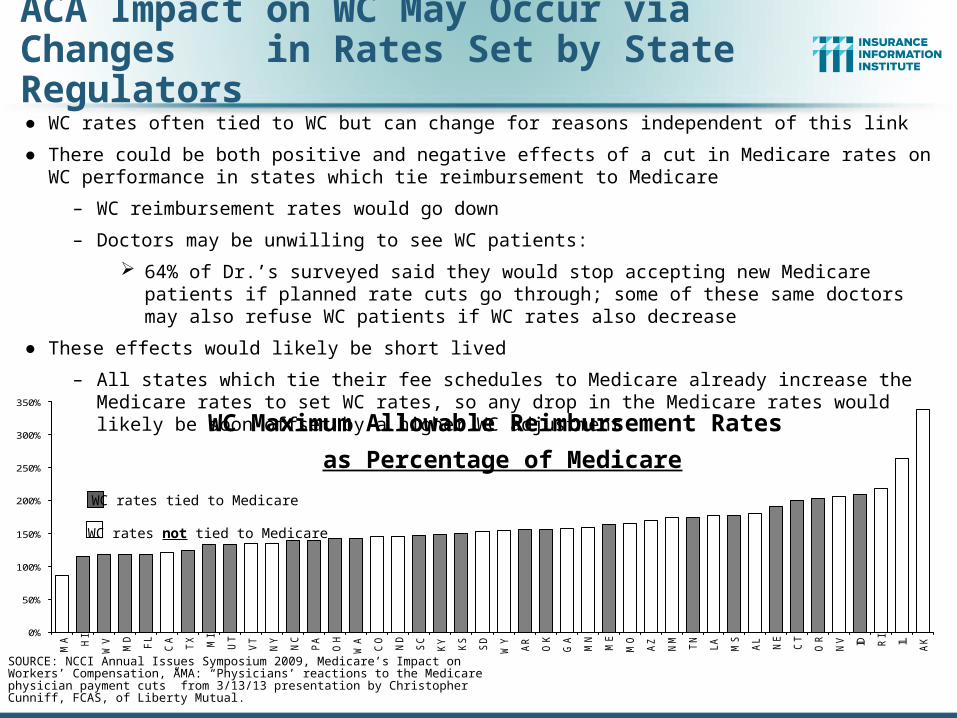
● WC rates often tied to WC but can change for reasons independent of this link
● There could be both positive and negative effects of a cut in Medicare rates on WC performance in states which tie reimbursement to Medicare
– WC reimbursement rates would go down
– Doctors may be unwilling to see WC patients:
64% of Dr.’s surveyed said they would stop accepting new Medicare patients if planned rate cuts go through; some of these same doctors may also refuse WC patients if WC rates also decrease
● These effects would likely be short lived
– All states which tie their fee schedules to Medicare already increase the Medicare rates to set WC rates, so any drop in the Medicare rates would likely be soon offset by a higher WC adjustment
ACA Impact on WC May Occur via Changes in Rates Set by State Regulators
WC Maximum Allowable Reimbursement Rates
as Percentage of Medicare
SOURCE: NCCI Annual Issues Symposium 2009, Medicare’s Impact on Workers’ Compensation, AMA: “Physicians’ reactions to the Medicare physician payment cuts” from 3/13/13 presentation by Christopher Cunniff, FCAS, of Liberty Mutual.
WC rates tied to Medicare
WC rates not tied to Medicare
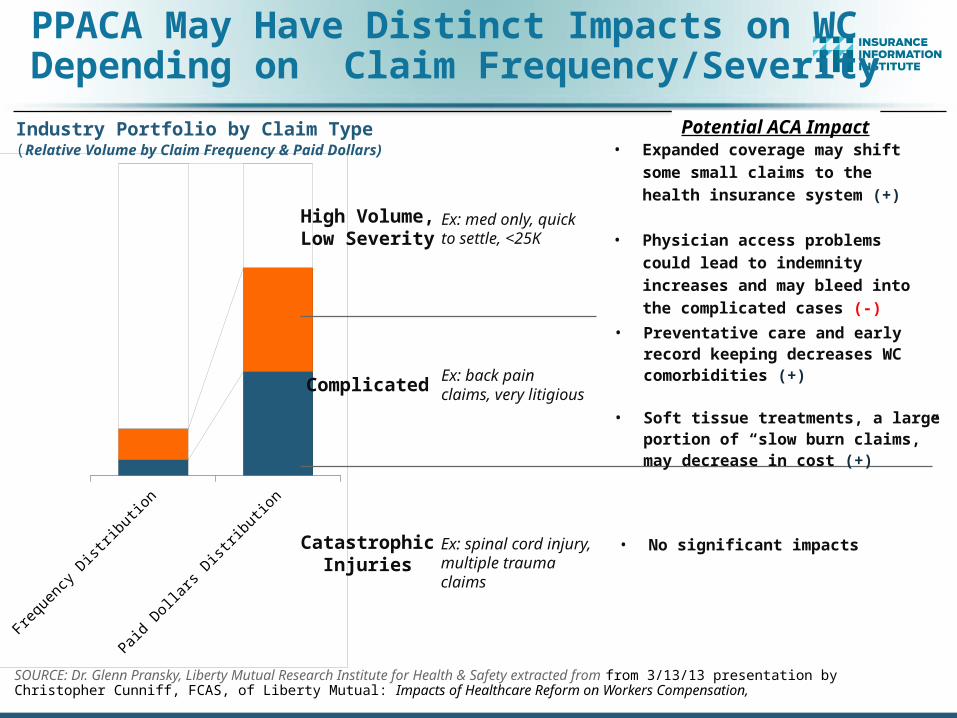
PPACA May Have Distinct Impacts on WC Depending on Claim Frequency/Severity
High Volume, Low
Severity
Complicated
Catastrophic Injuries
• Expanded coverage may shift some small claims to the health insurance system (+)
• Physician access problems could lead to indemnity increases and may bleed into the complicated cases (-)
• Preventative care and early record keeping decreases WC comorbidities (+)
• Soft tissue treatments, a large portion of “slow burn claims,” may decrease in cost (+)
• No significant impacts
Ex: med only, quick to settle, <25K
Ex: back pain claims, very litigious
Ex: spinal cord injury, multiple trauma claims
Potential ACA Impact
SOURCE: Dr. Glenn Pransky, Liberty Mutual Research Institute for Health & Safety extracted from from 3/13/13 presentation by Christopher Cunniff, FCAS, of Liberty Mutual: Impacts of Healthcare Reform on Workers Compensation,
Industry Portfolio by Claim Type(Relative Volume by Claim Frequency & Paid Dollars)
73
AK
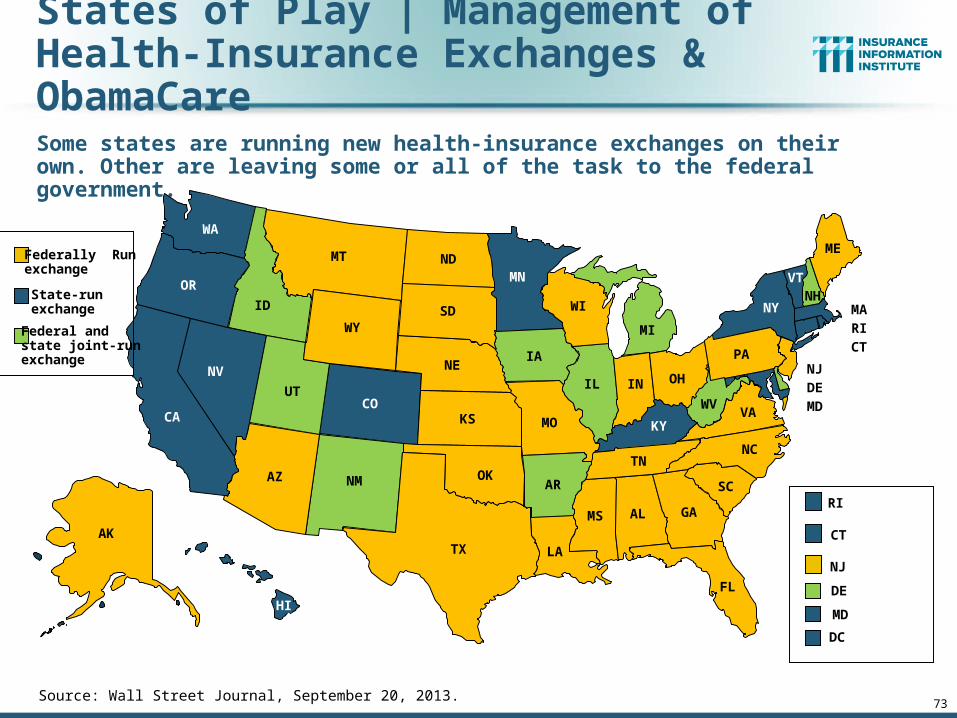
States of Play | Management of Health-Insurance Exchanges & ObamaCare
Some states are running new health-insurance exchanges on their own. Other are leaving some or all of the task to the federal government.
ME
PA
WVVA
NC
LATX
OK
NE
NDMN
MI
IL
IA
ID
WA
OR
AZ
NJ
VT
NY
SC
GA
TN
AL
FL
MS
ARNM
KYMOKS
SD WI
IN OH
MT
CA
NV
UT
WY
CO
NH
DE
MD
MA
RI
CT
HI
Source: Wall Street Journal, September 20, 2013.
Federally Run exchange
State-runexchange
Federal and state joint-runexchange
RI
CT
NJ
DE
MD
DC
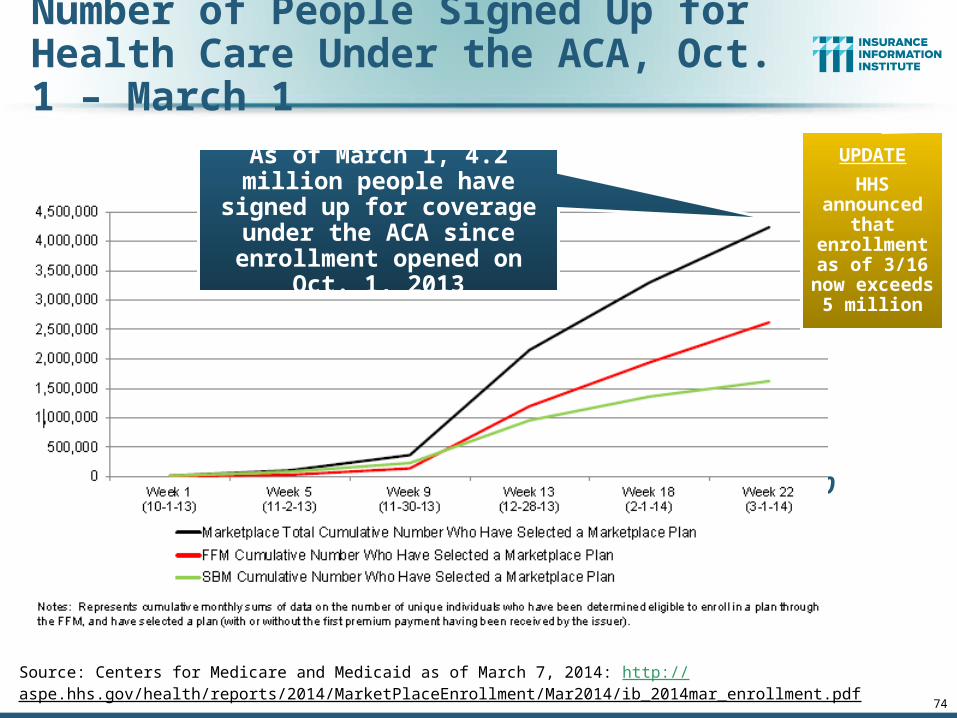
Number of People Signed Up for Health Care Under the ACA, Oct. 1 – March 1
74
759,800
Source: Centers for Medicare and Medicaid as of March 7, 2014: http://aspe.hhs.gov/health/reports/2014/MarketPlaceEnrollment/Mar2014/ib_2014mar_enrollment.pdf
As of March 1, 4.2 million people have signed up for coverage under the ACA
since enrollment opened on Oct. 1, 2013
UPDATE
HHS announced
that enrollment as of 3/16 now exceeds 5
million
75
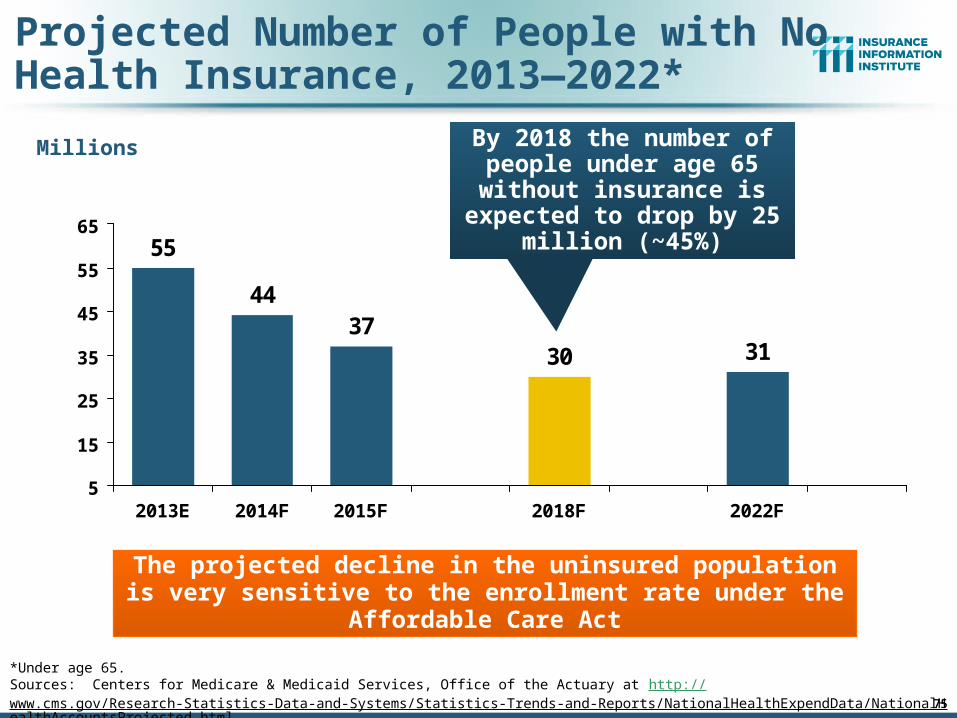
Projected Number of People with No Health Insurance, 2013—2022*
31
55
4437
30
5
15
25
35
45
55
65
2013E 2014F 2015F 2018F 2022F
Millions
The projected decline in the uninsured population is very sensitive to the enrollment rate under the Affordable Care Act
By 2018 the number of people under age 65 without
insurance is expected to drop by 25 million (~45%)
75
*Under age 65.Sources: Centers for Medicare & Medicaid Services, Office of the Actuary at http://www.cms.gov/Research-Statistics-Data-and-Systems/Statistics-Trends-and-Reports/NationalHealthExpendData/NationalHealthAccountsProjected.html accessed 3/14/14; Insurance Information Institute.
Will Skill Shortages in the Medical Field Adversely
Impact WC?
76
Concern that the ACA Will Overwhelm the Healthcare Delivery System, Harming
Outcomes76
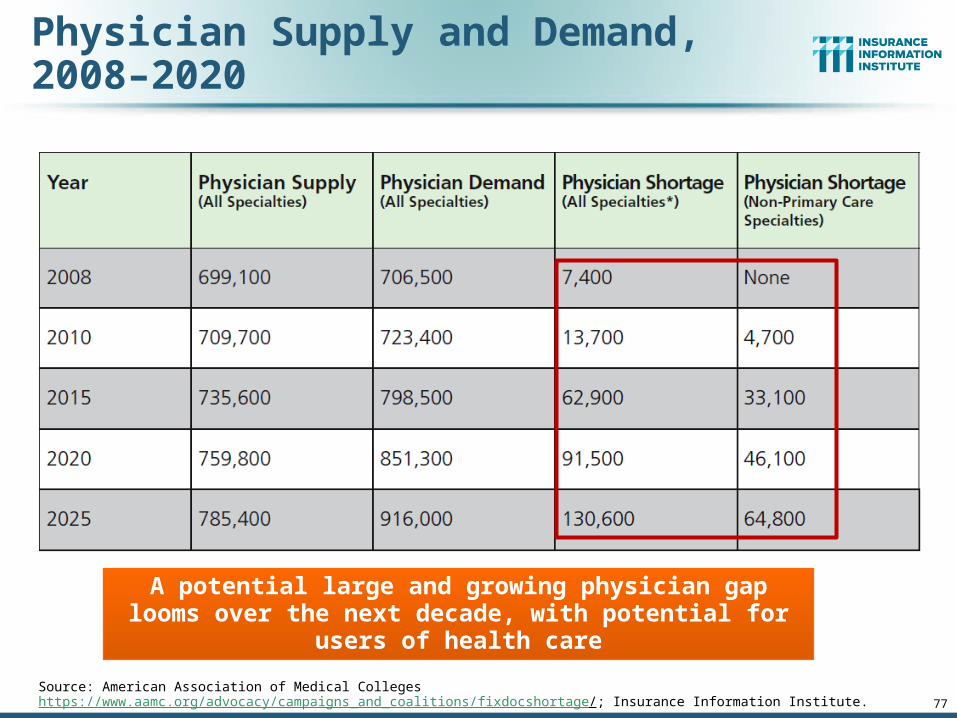
Physician Supply and Demand, 2008–2020
Source: American Association of Medical Colleges https://www.aamc.org/advocacy/campaigns_and_coalitions/fixdocshortage/; Insurance Information Institute. 77
A potential large and growing physician gap looms over the next decade, with potential for users of health care
80
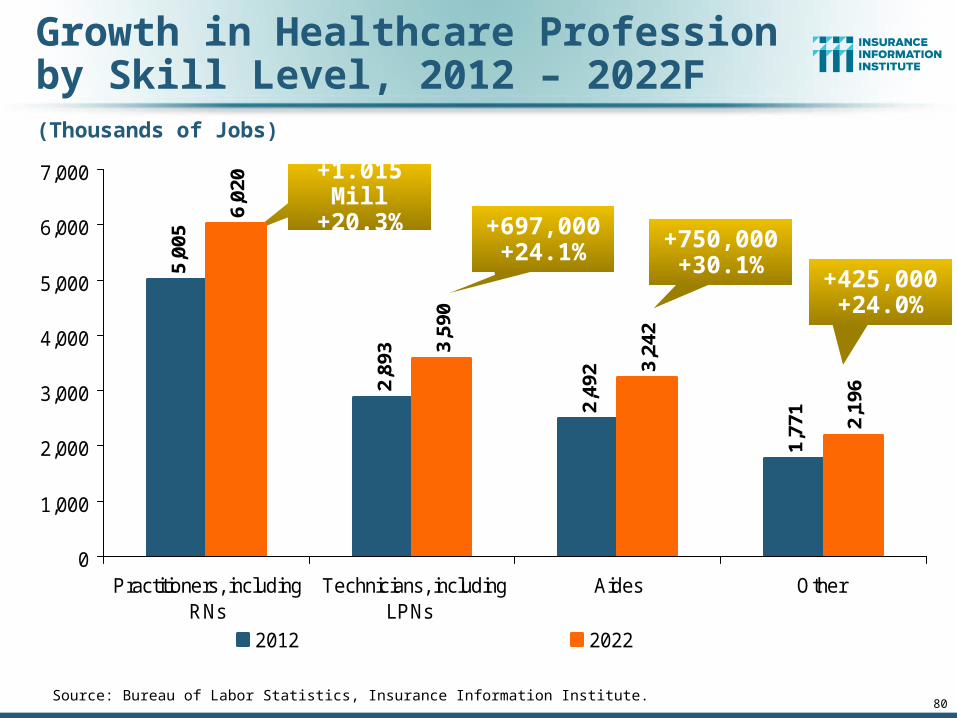
Growth in Healthcare Profession by Skill Level, 2012 – 2022F
Source: Bureau of Labor Statistics, Insurance Information Institute.
5,00
5
2,89
3
2,49
2
1,77
1
6,02
0
3,59
0
3,24
2
2,19
6
0
1,000
2,000
3,000
4,000
5,000
6,000
7,000
Practitioners, includingRNs
Technicians, includingLPNs
Aides Other
2012 2022
(Thousands of Jobs)
+1.015 Mill +20.3%
+697,000 +24.1% +750,000
+30.1%+425,000 +24.0%
Workers Compensation Operating Environment
81
The Weak Economy and Soft Market Have Made the Workers Comp Operating
Increasingly Challenging
81
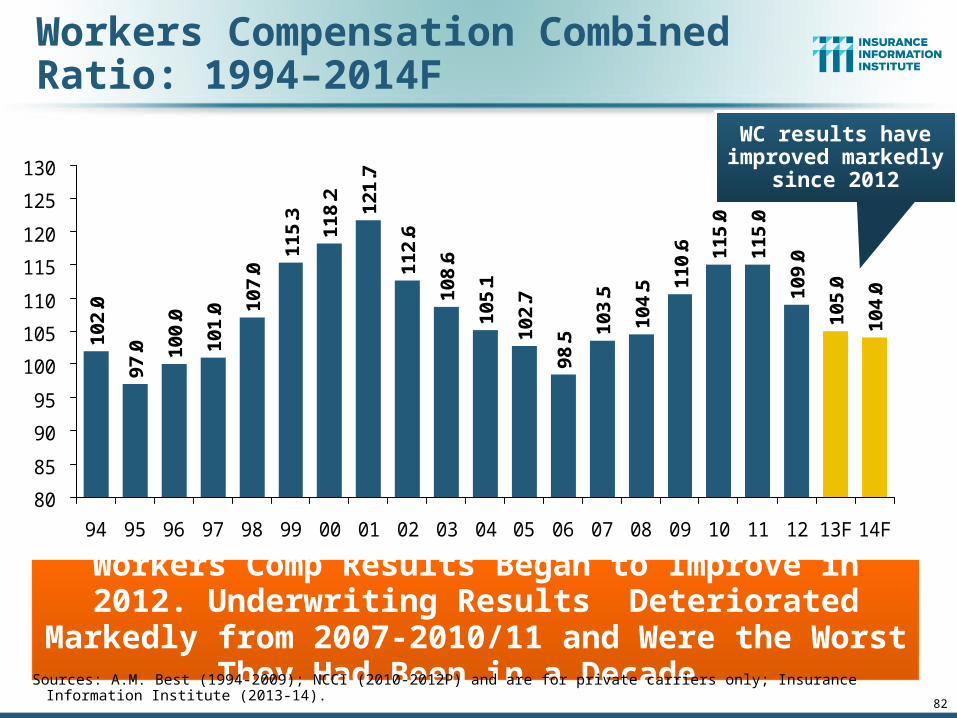
Workers Compensation Combined Ratio: 1994–2014F
102.
0
97.0 10
0.0
101.
0
112.
6
108.
6
105.
1
102.
7
98.5
103.
5
104.
5 110.
6 115.
0
115.
0
109.
0
105.
0
104.
0
121.
7
107.
0
115.
3
118.
2
80
85
90
95
100
105
110
115
120
125
130
94 95 96 97 98 99 00 01 02 03 04 05 06 07 08 09 10 11 12 13F 14F
Workers Comp Results Began to Improve in 2012. Underwriting Results Deteriorated Markedly from 2007-
2010/11 and Were the Worst They Had Been in a Decade. Sources: A.M. Best (1994-2009); NCCI (2010-2012P) and are for private carriers only; Insurance Information Institute (2013-14). 82
WC results have improved markedly
since 2012
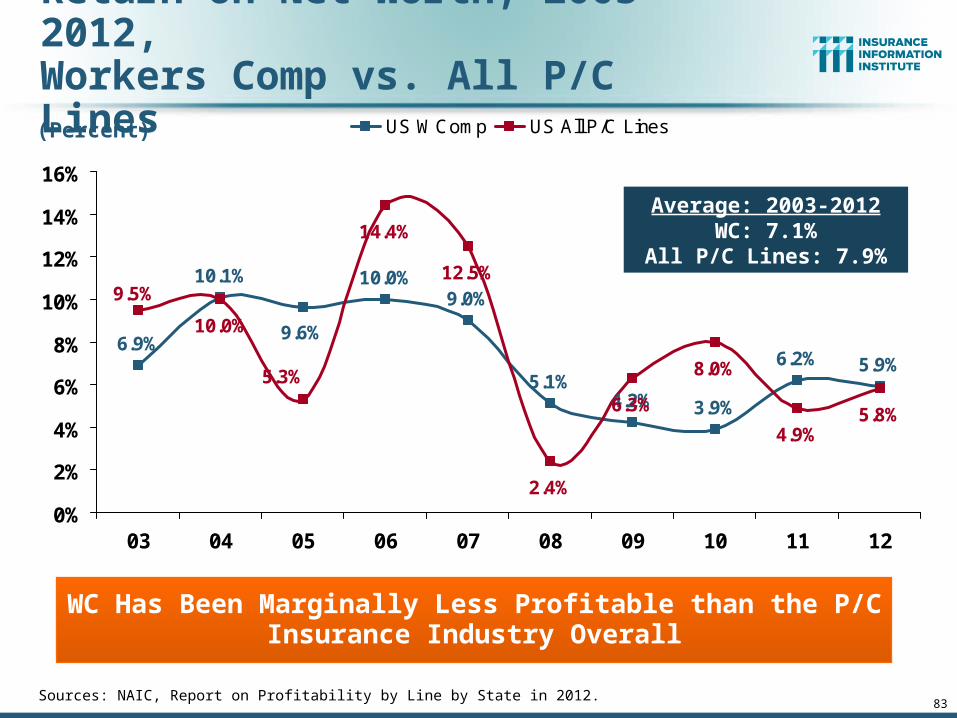
83
Return on Net Worth, 2003-2012,Workers Comp vs. All P/C Lines
Sources: NAIC, Report on Profitability by Line by State in 2012.
6.9%
10.1% 10.0%9.0%
5.1%4.2% 3.9%
6.2% 5.9%
10.0%
14.4%
12.5%
2.4%
6.3%
8.0%
4.9%5.8%
9.6%
9.5%
5.3%
0%
2%
4%
6%
8%
10%
12%
14%
16%
03 04 05 06 07 08 09 10 11 12
US WComp US All P/C Lines(Percent)
WC Has Been Marginally Less Profitable than the P/C Insurance Industry Overall
Average: 2003-2012WC: 7.1%
All P/C Lines: 7.9%
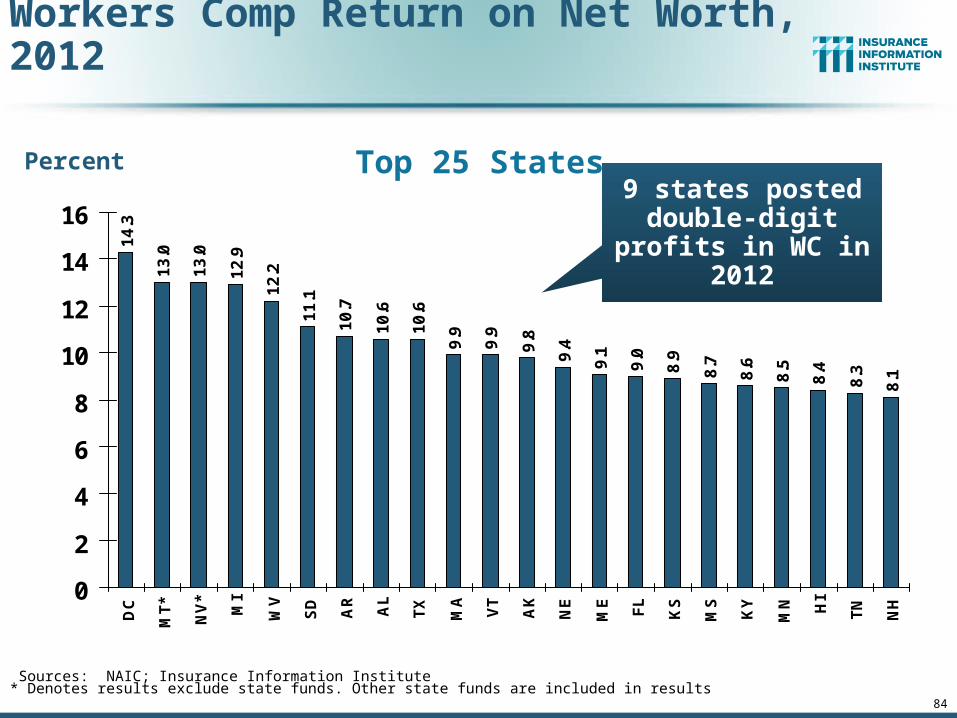
84
Workers Comp Return on Net Worth, 2012
14
.3
13
.0
13
.0
12
.9
12
.2
11
.1
10
.7
10
.6
10
.6
9.9
9.9
9.8
9.4
9.1
9.0
8.9
8.7
8.6
8.5
8.4
8.3
8.1
0
2
4
6
8
10
12
14
16
DC
MT
*
NV
*
MI
WV
SD
AR
AL
TX
MA
VT
AK
NE
ME FL
KS
MS
KY
MN HI
TN
NH
Sources: NAIC; Insurance Information Institute* Denotes results exclude state funds. Other state funds are included in results
9 states posted double-digit profits
in WC in 2012
Top 25 StatesPercent
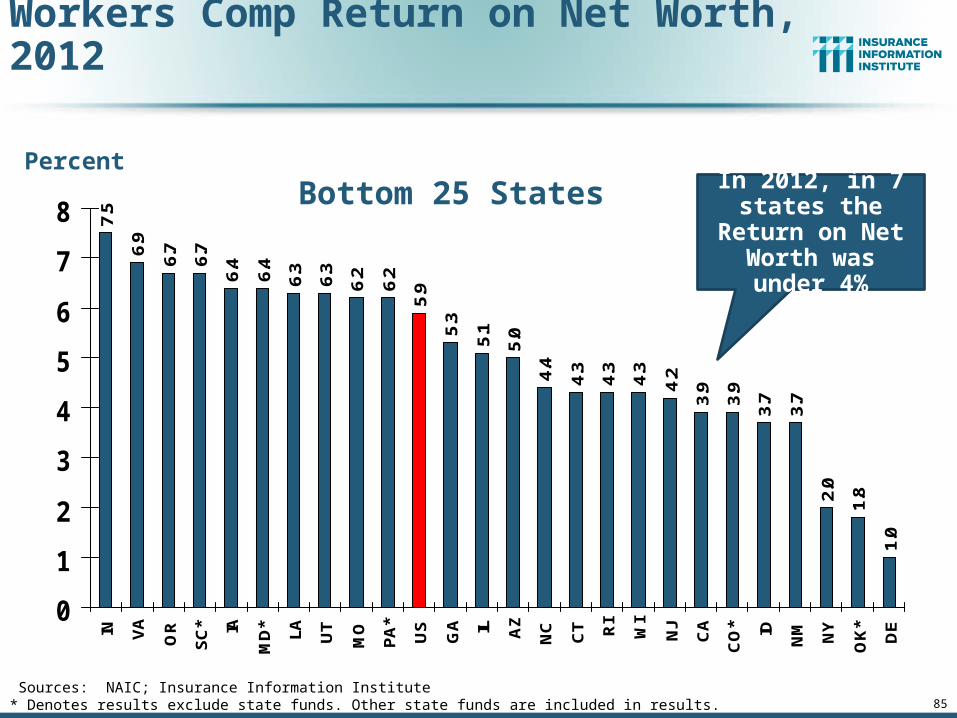
85
7.5
6.9
6.7
6.7
6.4
6.4
6.3
6.3
6.2
6.2
5.9
5.3
5.1
5.0
4.4
4.3
4.3
4.3
4.2
3.9
3.9
3.7
3.7
2.0
1.8
1.0
0
1
2
3
4
5
6
7
8
IN VA
OR
SC
* IA
MD
*
LA UT
MO
PA
*
US
GA IL AZ
NC
CT RI
WI
NJ
CA
CO
* ID
NM NY
OK
*
DE
Sources: NAIC; Insurance Information Institute* Denotes results exclude state funds. Other state funds are included in results.
In 2012, in 7 states the Return on Net Worth was
under 4%
Bottom 25 States
Workers Comp Return on Net Worth, 2012
Percent
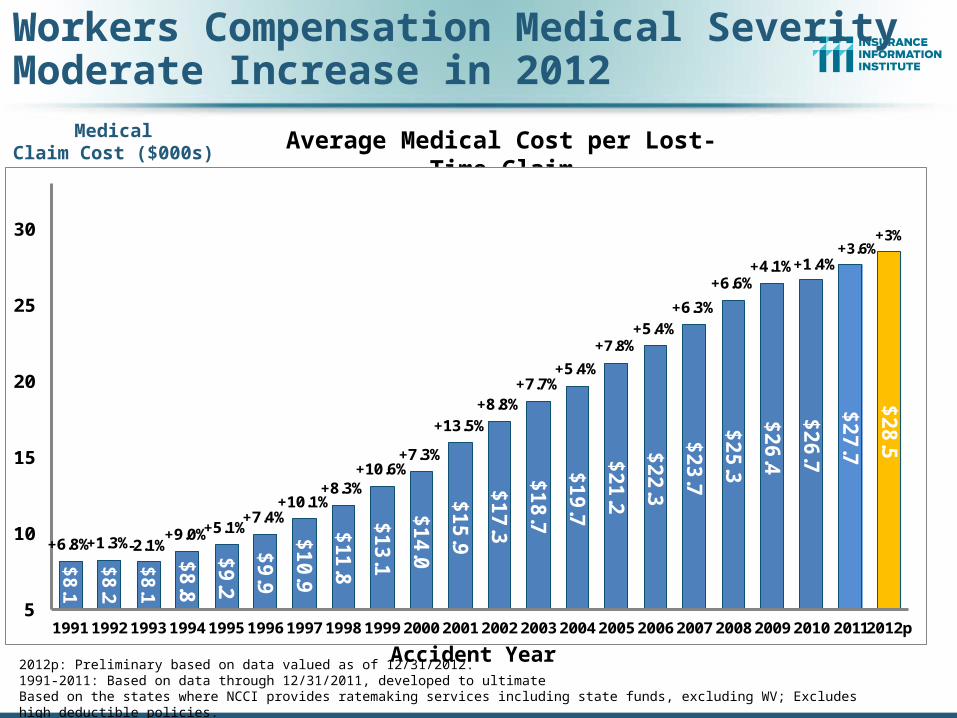
Workers Compensation Medical SeverityModerate Increase in 2012
87
Accident Year
Annual Change 1991–1993: +1.9%Annual Change 1994–2001: +8.9%Annual Change 2002–2010: +6.0%
Average Medical Cost per Lost-Time ClaimMedicalClaim Cost ($000s)
$8
.1
$8
.2
$8
.1
$8
.8
$9
.2
$9
.9
$1
0.9
$11
.8
$1
3.1
$1
4.0
$1
5.9
$1
7.3
$1
8.7
$1
9.7
$2
1.2
$2
2.3
$2
3.7
$2
5.3
$2
6.4
$2
6.7
$2
7.7
$2
8.5
+6.8%+1.3%-2.1%+9.0%+5.1%
+7.4%+10.1%
+8.3%+10.6%
+7.3%
+13.5%+8.8%
+7.7%+5.4%
+7.8%+5.4%
+6.3%
+6.6%+4.1%+1.4%
+3.6%+3%
5
10
15
20
25
30
1991 1992 1993 1994 1995 1996 1997 1998 1999 2000 2001 2002 2003 2004 2005 2006 2007 2008 2009 2010 20112012p
2012p: Preliminary based on data valued as of 12/31/2012.1991-2011: Based on data through 12/31/2011, developed to ultimateBased on the states where NCCI provides ratemaking services including state funds, excluding WV; Excludes high deductible policies.
Cumulative Change = 252%(1991-2012p)
Annual Change 1991–1993: +1.9%Annual Change 1994–2001: +8.9%Annual Change 2002–2011: +5.7%
Accident Year
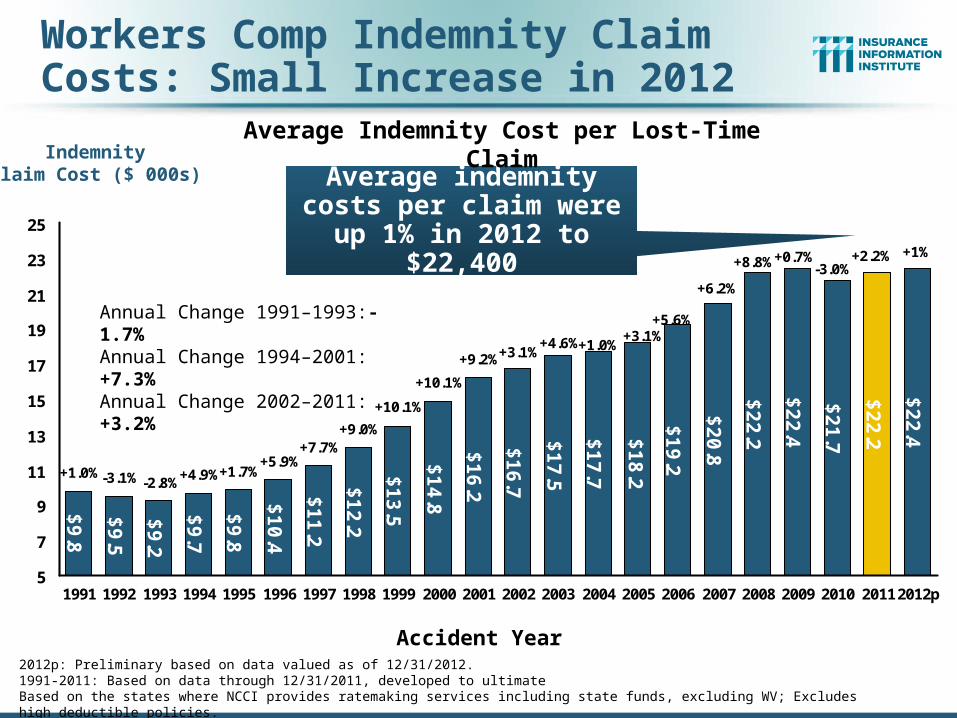
$9
.8
$9
.5
$9
.2
$9
.7
$9
.8
$1
0.4
$1
1.2
$1
2.2
$1
3.5
$1
4.8
$1
6.2
$1
6.7
$1
7.5
$2
2.2
$2
2.4
$2
2.2
$2
2.4$
18
.2
$1
7.7
$1
9.2
$2
0.8
$2
1.7
+1%-3.0%
+0.7%+8.8% +2.2%
+5.6%+3.1%
+1.0%+4.6%+3.1%+9.2%
+10.1%
+10.1%
+9.0%+7.7%
+5.9%+1.7%+4.9%
-2.8%-3.1%+1.0%
+6.2%
5
7
9
11
13
15
17
19
21
23
25
1991 1992 1993 1994 1995 1996 1997 1998 1999 2000 2001 2002 2003 2004 2005 2006 2007 2008 2009 2010 20112012p
IndemnityClaim Cost ($ 000s)
Annual Change 1991–1993: -1.7%Annual Change 1994–2001:+7.3%Annual Change 2002–2011:+3.2%
Accident Year
Workers Comp Indemnity Claim Costs: Small Increase in 2012
Average indemnity costs per claim were up 1% in
2012 to $22,400
Average Indemnity Cost per Lost-Time Claim
2012p: Preliminary based on data valued as of 12/31/2012.1991-2011: Based on data through 12/31/2011, developed to ultimateBased on the states where NCCI provides ratemaking services including state funds, excluding WV; Excludes high deductible policies.
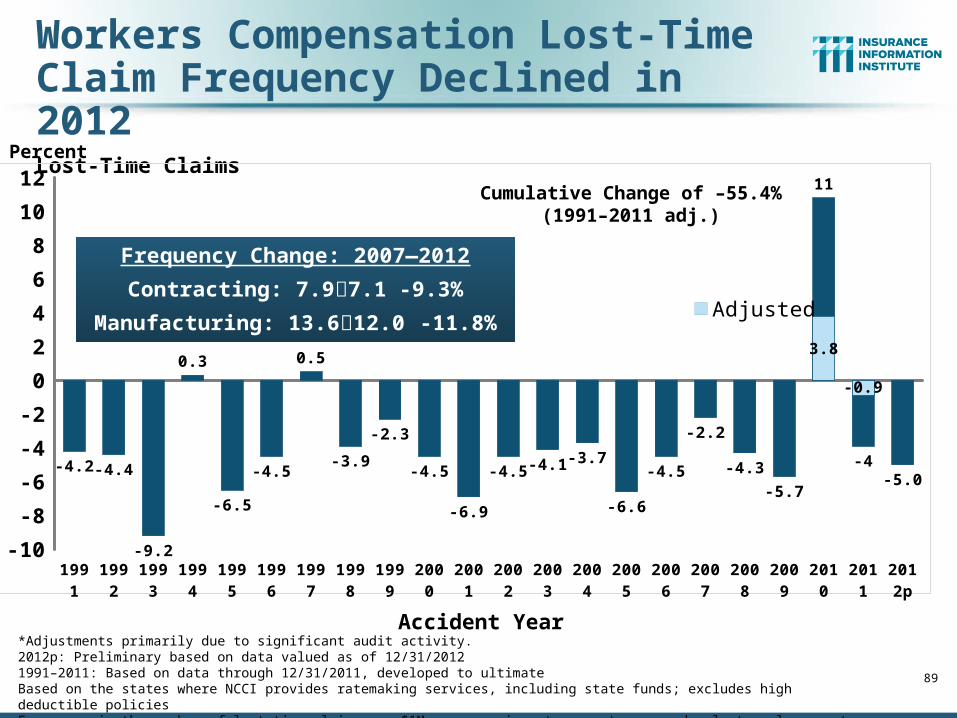
Workers Compensation Lost-Time Claim Frequency Declined in 2012Lost-Time Claims
89
1991 1992 1993 1994 1995 1996 1997 1998 1999 2000 2001 2002 2003 2004 2005 2006 2007 2008 2009 2010 2011 2012p
-10
-8
-6
-4
-2
0
2
4
6
8
10
12
-4.2 -4.4
-9.2
0.3
-6.5
-4.5
0.5
-3.9
-2.3
-4.5
-6.9
-4.5 -4.1 -3.7
-6.6
-4.5
-2.2
-4.3
-5.7
11
-4-5.0
3.8
-0.9
AdjustedIndicated
Frequency Change: 2007—2012
Contracting: 7.97.1 -9.3%
Manufacturing: 13.612.0 -11.8%
Percent
Accident Year*Adjustments primarily due to significant audit activity.2012p: Preliminary based on data valued as of 12/31/20121991–2011: Based on data through 12/31/2011, developed to ultimateBased on the states where NCCI provides ratemaking services, including state funds; excludes high deductible policiesFrequency is the number of lost-time claims per $1M pure premium at current wage and voluntary loss cost levelSource: NCCI.
Cumulative Change of –55.4%(1991–2011 adj.)
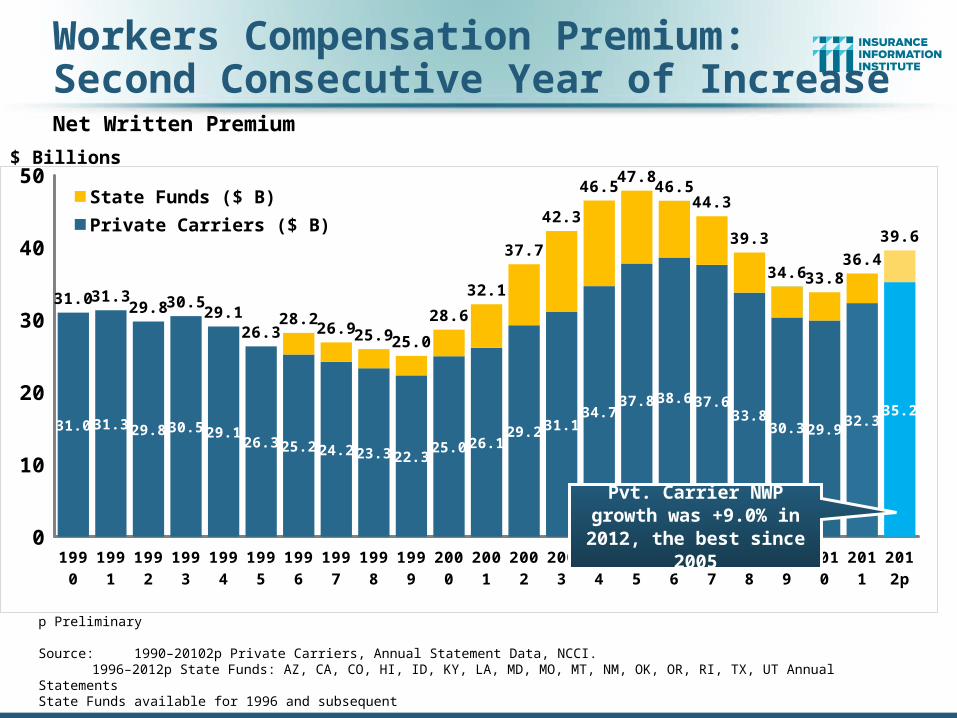
Workers Compensation Premium: Second Consecutive Year of IncreaseNet Written Premium
1990
1991
1992
1993
1994
1995
1996
1997
1998
1999
2000
2001
2002
2003
2004
2005
2006
2007
2008
2009
2010
2011
2012p
0
10
20
30
40
50
31.0 31.3 29.8 30.5 29.126.3 25.2 24.2 23.3 22.3
25.0 26.129.2 31.1
34.737.8 38.6 37.6
33.830.3 29.9
32.335.2
31.0 31.329.8 30.5
29.126.3
28.226.9 25.9 25.0
28.6
32.1
37.7
42.3
46.547.8
46.544.3
39.3
34.6 33.836.4
39.6
State Funds ($ B)
Private Carriers ($ B)
Pvt. Carrier NWP growth was +9.0% in 2012, the
best since 2005
$ Billions
Calendar Yearp Preliminary
Source: 1990–20102p Private Carriers, Annual Statement Data, NCCI.1996–2012p State Funds: AZ, CA, CO, HI, ID, KY, LA, MD, MO, MT, NM, OK, OR, RI, TX, UT Annual Statements
State Funds available for 1996 and subsequent
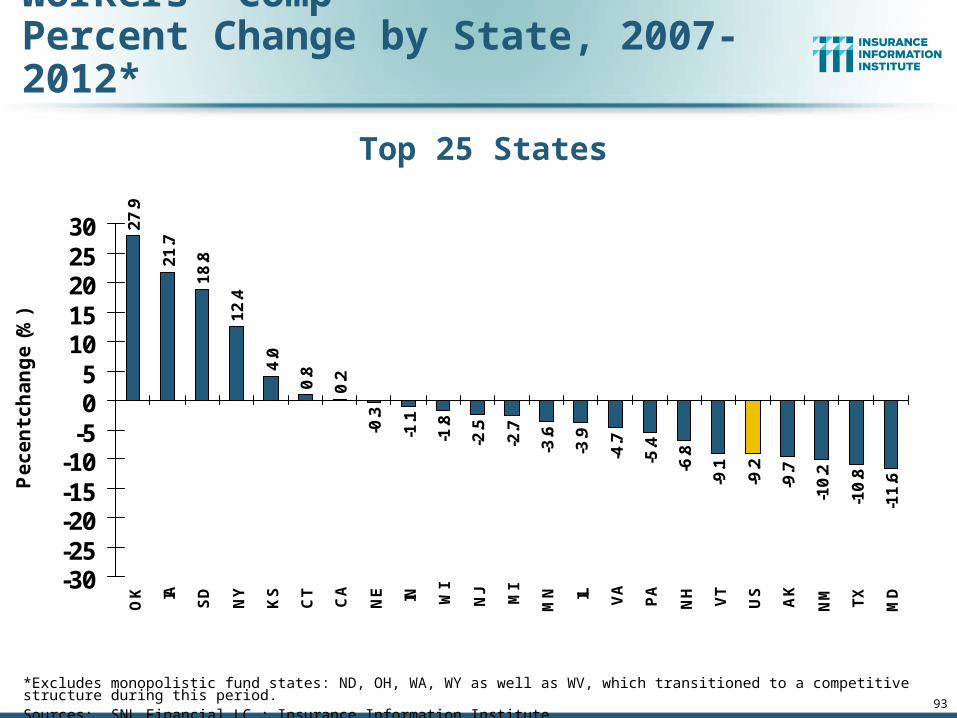
93
Direct Premiums Written: Workers’ CompPercent Change by State, 2007-2012*
27
.9
21
.7
18
.8
12
.4
4.0
0.8
0.2
-0.3
-1.1
-1.8
-2.5
-2.7
-3.6
-3.9
-4.7
-5.4
-6.8
-9.1
-9.2
-9.7
-10
.2
-10
.8
-11
.6
-30-25-20-15-10-505
1015202530
OK IA SD
NY
KS
CT
CA
NE IN WI
NJ
MI
MN IL VA
PA
NH VT
US
AK
NM TX
MD
Pe
ce
nt
ch
an
ge
(%
)
*Excludes monopolistic fund states: ND, OH, WA, WY as well as WV, which transitioned to a competitive structure during this period.Sources: SNL Financial LC.; Insurance Information Institute.
Top 25 States
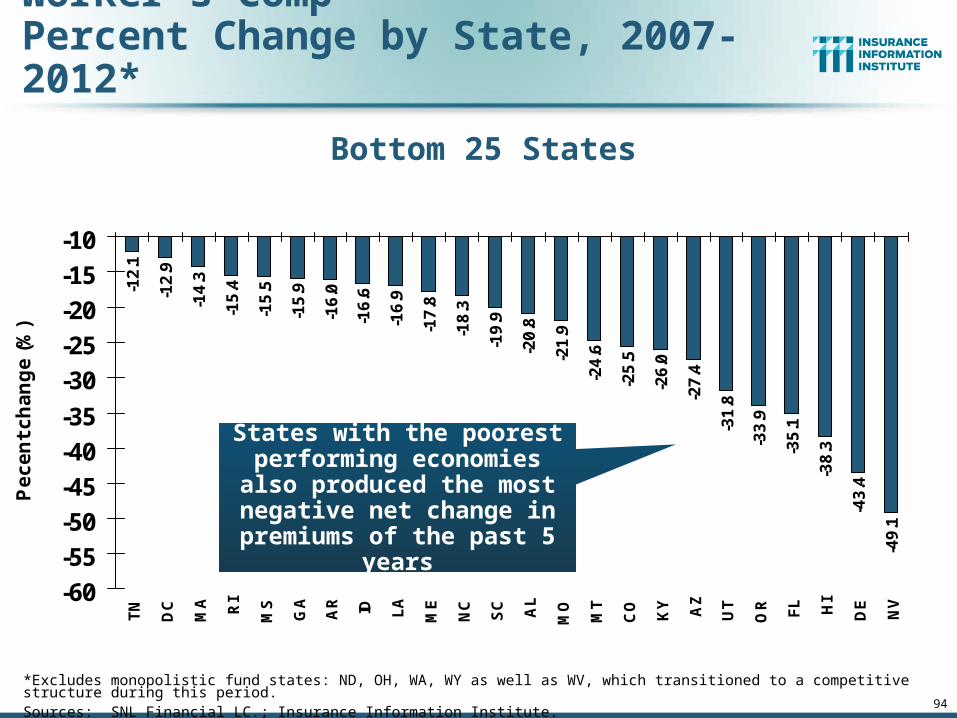
94
Direct Premiums Written: Worker’s CompPercent Change by State, 2007-2012*
-12
.1
-12
.9
-14
.3
-15
.4
-15
.5
-15
.9
-16
.0
-16
.6
-16
.9
-17
.8
-18
.3
-19
.9
-20
.8
-21
.9
-24
.6
-25
.5
-26
.0
-27
.4
-31
.8
-33
.9
-35
.1
-38
.3
-43
.4
-49
.1
-60
-55
-50
-45
-40
-35
-30
-25
-20
-15
-10
TN
DC
MA RI
MS
GA
AR ID LA
ME
NC
SC AL
MO
MT
CO
KY AZ
UT
OR FL HI
DE
NV
Pe
ce
nt
ch
an
ge
(%
)
Bottom 25 States
*Excludes monopolistic fund states: ND, OH, WA, WY as well as WV, which transitioned to a competitive structure during this period.Sources: SNL Financial LC.; Insurance Information Institute.
States with the poorest performing economies also produced the most negative net change in premiums of
the past 5 years
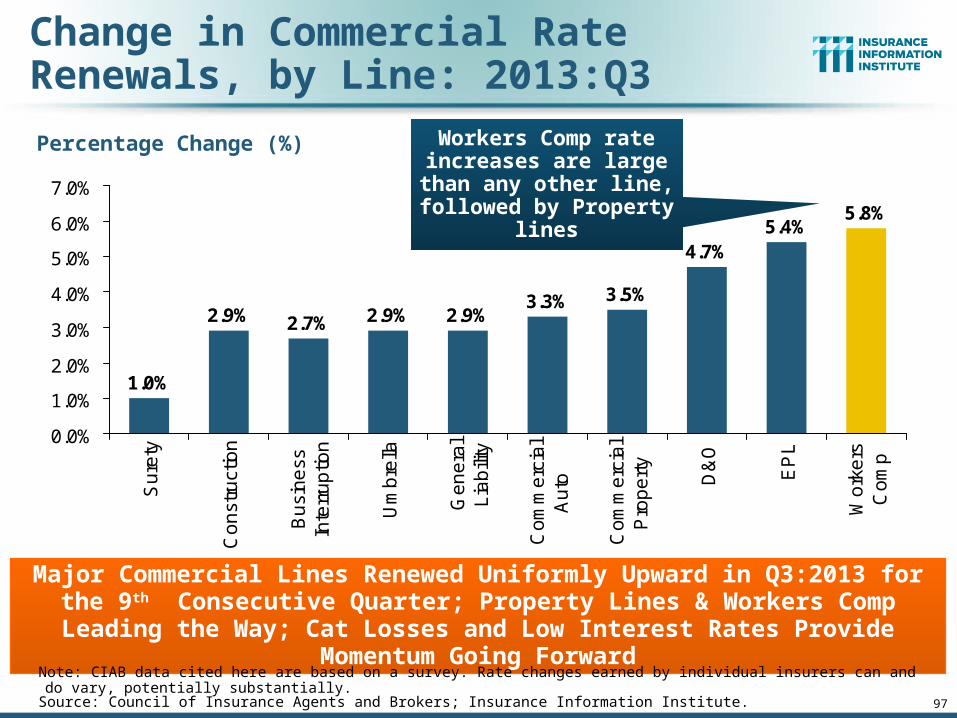
97
Change in Commercial Rate Renewals, by Line: 2013:Q3
Source: Council of Insurance Agents and Brokers; Insurance Information Institute.
Major Commercial Lines Renewed Uniformly Upward in Q3:2013 for the 9th Consecutive Quarter; Property Lines & Workers Comp Leading the Way; Cat
Losses and Low Interest Rates Provide Momentum Going Forward
Percentage Change (%)
3.5%
4.7%5.4%
5.8%
1.0%
2.9% 2.7% 2.9% 2.9%3.3%
0.0%
1.0%
2.0%
3.0%
4.0%
5.0%
6.0%
7.0%
Su
rety
Co
nst
ruct
ion
Bu
sin
ess
Inte
rru
ptio
n
Um
bre
lla
Ge
ne
ral
Lia
bili
ty
Co
mm
erc
ial
Au
to
Co
mm
erc
ial
Pro
pe
rty
D&
O
EP
L
Wo
rke
rsC
om
p
Workers Comp rate increases are large than any other line, followed
by Property lines
Note: CIAB data cited here are based on a survey. Rate changes earned by individual insurers can and do vary, potentially substantially.
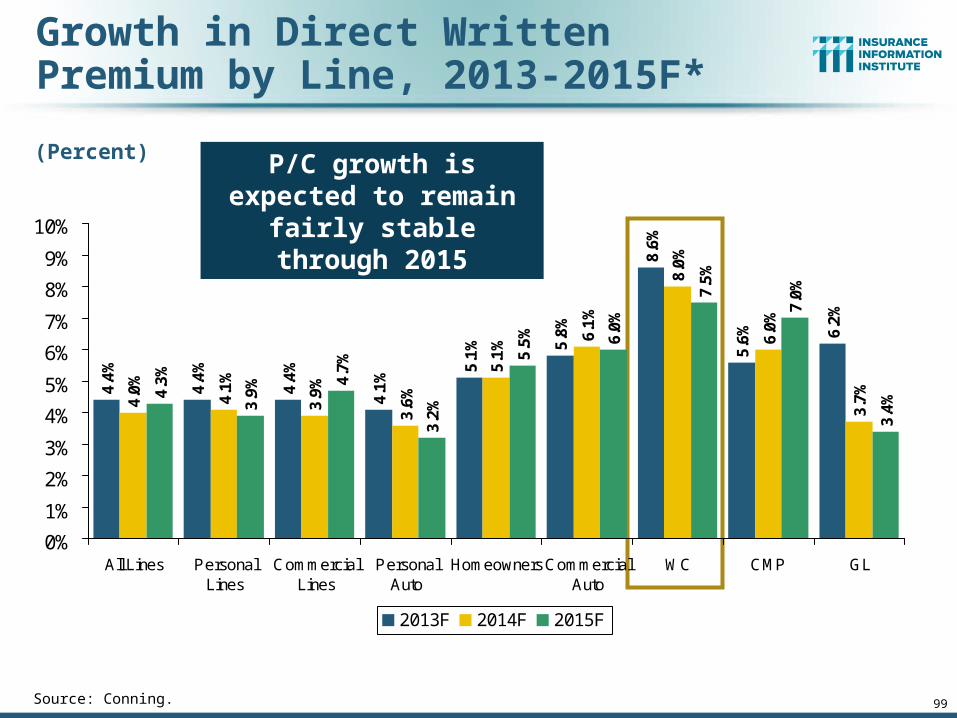
99
Growth in Direct Written Premium by Line, 2013-2015F*
Source: Conning.
4.4
%
4.4
%
4.4
%
4.1
%
5.1
% 5.8
%
8.6
%
5.6
% 6.2
%
4.0
%
4.1
%
3.9
%
3.6
%
5.1
% 6.1
%
8.0
%
6.0
%
3.7
%4.3
%
3.9
% 4.7
%
3.2
%
5.5
% 6.0
%
7.5
%
7.0
%
3.4
%
0%
1%
2%
3%
4%
5%
6%
7%
8%
9%
10%
All Lines PersonalLines
CommercialLines
PersonalAuto
HomeownersCommercialAuto
WC CMP GL
2013F 2014F 2015F
(Percent) P/C growth is expected to remain fairly stable
through 2015

INVESTMENTS: THE NEW REALITY
103
Investment Performance is a Key Driver of Profitability
Depressed Yields Will Necessarily Influence Underwriting & Pricing
103
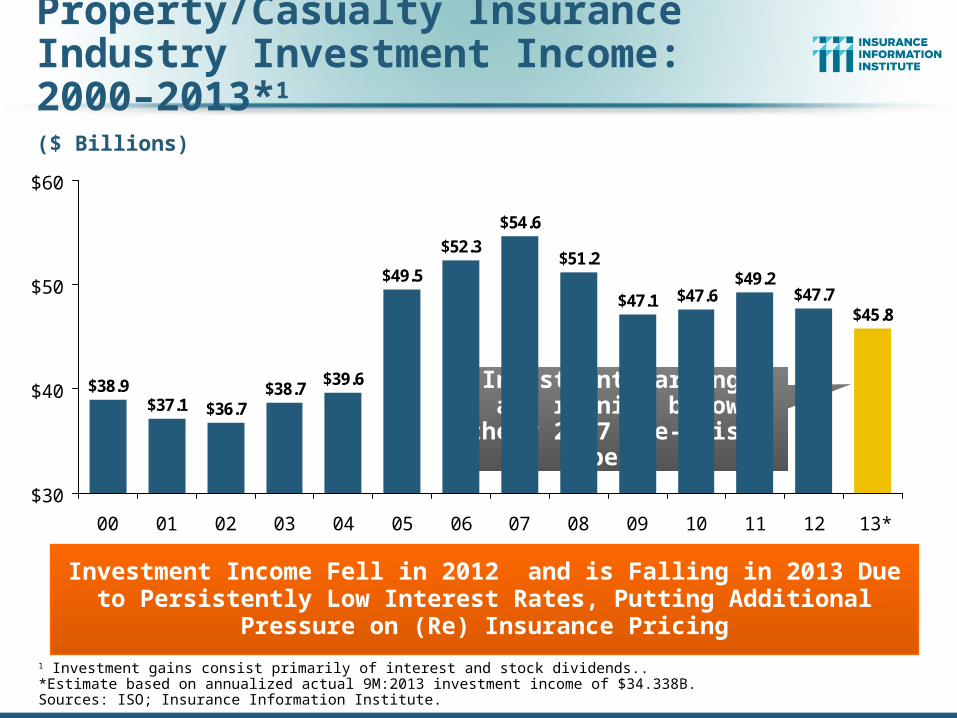
Property/Casualty Insurance Industry Investment Income: 2000–2013*1
$38.9$37.1 $36.7
$38.7
$54.6
$51.2
$47.1 $47.6$49.2
$47.7$45.8
$39.6
$49.5
$52.3
$30
$40
$50
$60
00 01 02 03 04 05 06 07 08 09 10 11 12 13*
Investment Income Fell in 2012 and is Falling in 2013 Due to Persistently Low Interest Rates, Putting Additional Pressure on (Re) Insurance Pricing
1 Investment gains consist primarily of interest and stock dividends..*Estimate based on annualized actual 9M:2013 investment income of $34.338B.Sources: ISO; Insurance Information Institute.
($ Billions)
Investment earnings are running below their 2007
pre-crisis peak
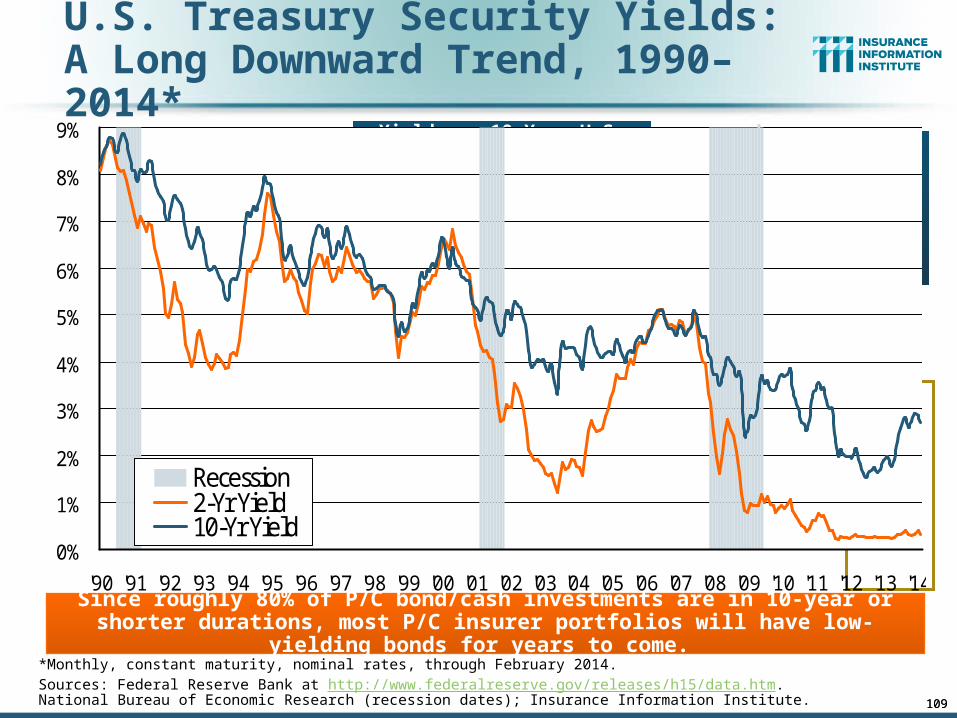
109
U.S. Treasury Security Yields:A Long Downward Trend, 1990–2014*
*Monthly, constant maturity, nominal rates, through February 2014.Sources: Federal Reserve Bank at http://www.federalreserve.gov/releases/h15/data.htm. National Bureau of Economic Research (recession dates); Insurance Information Institute.
0%
1%
2%
3%
4%
5%
6%
7%
8%
9%
'90 '91 '92 '93 '94 '95 '96 '97 '98 '99 '00 '01 '02 '03 '04 '05 '06 '07 '08 '09 '10 '11 '12 '13 '14
Recession2-Yr Yield10-Yr Yield
Yields on 10-Year U.S. Treasury Notes have been essentially below 5% for a full decade.
Since roughly 80% of P/C bond/cash investments are in 10-year or shorter durations, most P/C insurer portfolios will have low-yielding bonds for years to come.
U.S. Treasury yields plunged to historic lows in
2013. Only longer-term yields have rebounded.
109
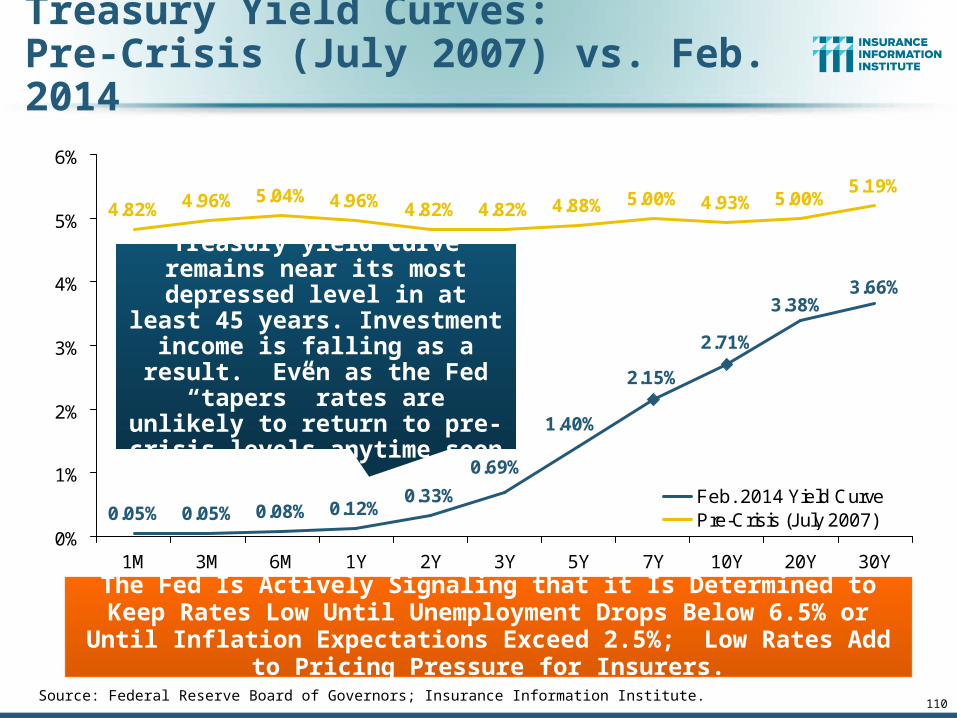
110
Treasury Yield Curves: Pre-Crisis (July 2007) vs. Feb. 2014
0.05% 0.05% 0.08% 0.12%0.33%
2.15%
2.71%
4.82% 4.96% 5.04% 4.96% 4.82% 4.82% 4.88% 5.00% 4.93% 5.00%5.19%
1.40%
0.69%
3.66%3.38%
0%
1%
2%
3%
4%
5%
6%
1M 3M 6M 1Y 2Y 3Y 5Y 7Y 10Y 20Y 30Y
Feb. 2014 Yield CurvePre-Crisis (July 2007)
Treasury yield curve remains near its most depressed level in
at least 45 years. Investment income is falling as a result.
Even as the Fed “tapers” rates are unlikely to return to pre-crisis
levels anytime soon
The Fed Is Actively Signaling that it Is Determined to Keep Rates Low Until Unemployment Drops Below 6.5% or Until Inflation Expectations
Exceed 2.5%; Low Rates Add to Pricing Pressure for Insurers.
Source: Federal Reserve Board of Governors; Insurance Information Institute.
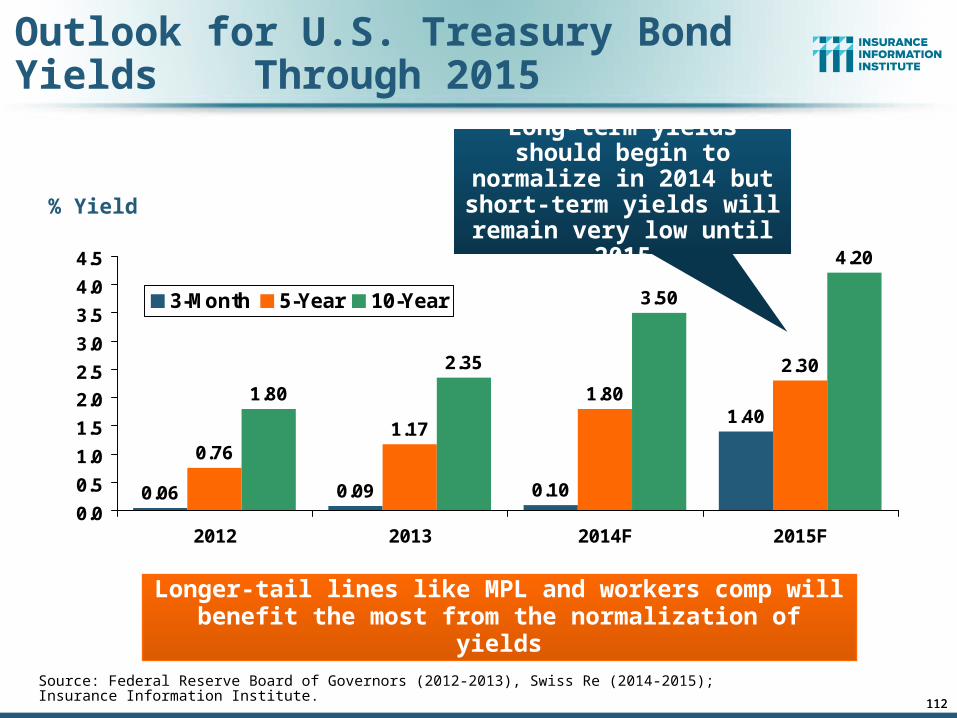
112
Outlook for U.S. Treasury Bond Yields Through 2015
0.761.17
1.80
2.30
1.80
2.35
3.50
4.20
1.40
0.100.090.060.0
0.5
1.0
1.5
2.0
2.5
3.0
3.5
4.0
4.5
2012 2013 2014F 2015F
3-Month 5-Year 10-Year
% Yield
Longer-tail lines like MPL and workers comp will benefit the most from the normalization of yields
Long-term yields should begin to normalize in 2014 but short-term yields will
remain very low until 2015
112Source: Federal Reserve Board of Governors (2012-2013), Swiss Re (2014-2015); Insurance Information Institute.

Financial Strength & Underwriting
113
History Suggests that WC, Like Other Long-Tailed Lines Is Much
More Difficult to Underwrite
113
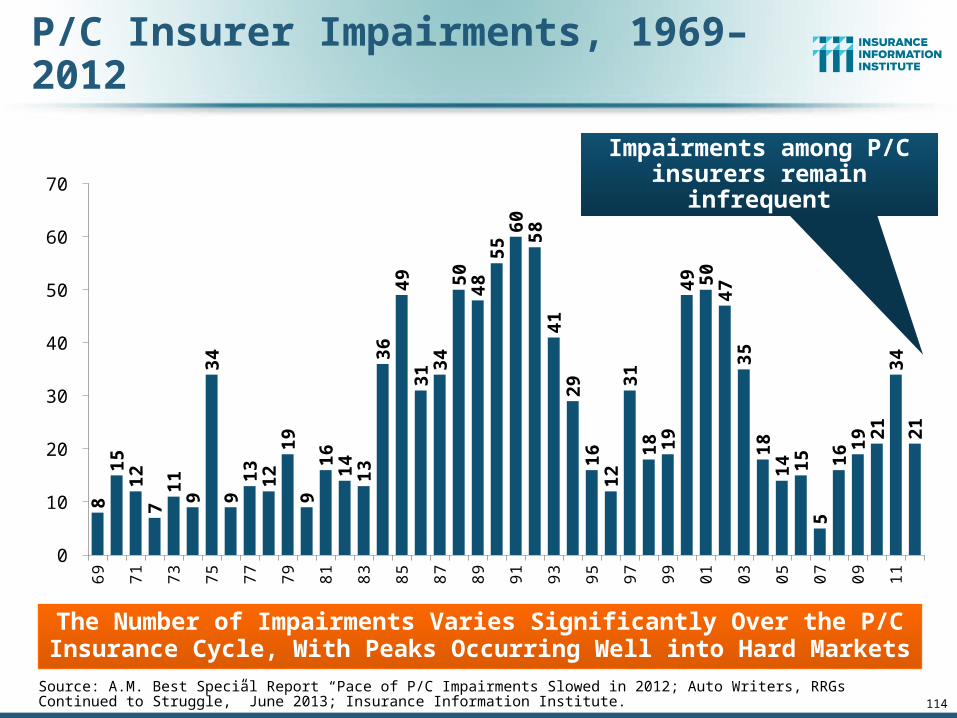
P/C Insurer Impairments, 1969–20126
97
07
17
27
37
47
57
67
77
87
98
08
18
28
38
48
58
68
78
88
99
09
19
29
39
49
59
69
79
89
90
00
10
20
30
40
50
60
70
80
91
01
11
2
0
10
20
30
40
50
60
70
81
51
27
11
93
49
13
12
19
91
61
41
33
64
93
1 34
50
48
55
60
58
41
29
16
12
31
18 19
49 50
47
35
18
14 15
51
6 19 2
13
42
1
Source: A.M. Best Special Report “Pace of P/C Impairments Slowed in 2012; Auto Writers, RRGs Continued to Struggle,” June 2013; Insurance Information Institute.
The Number of Impairments Varies Significantly Over the P/C Insurance Cycle, With Peaks Occurring Well into Hard Markets
114
Impairments among P/C insurers remain infrequent
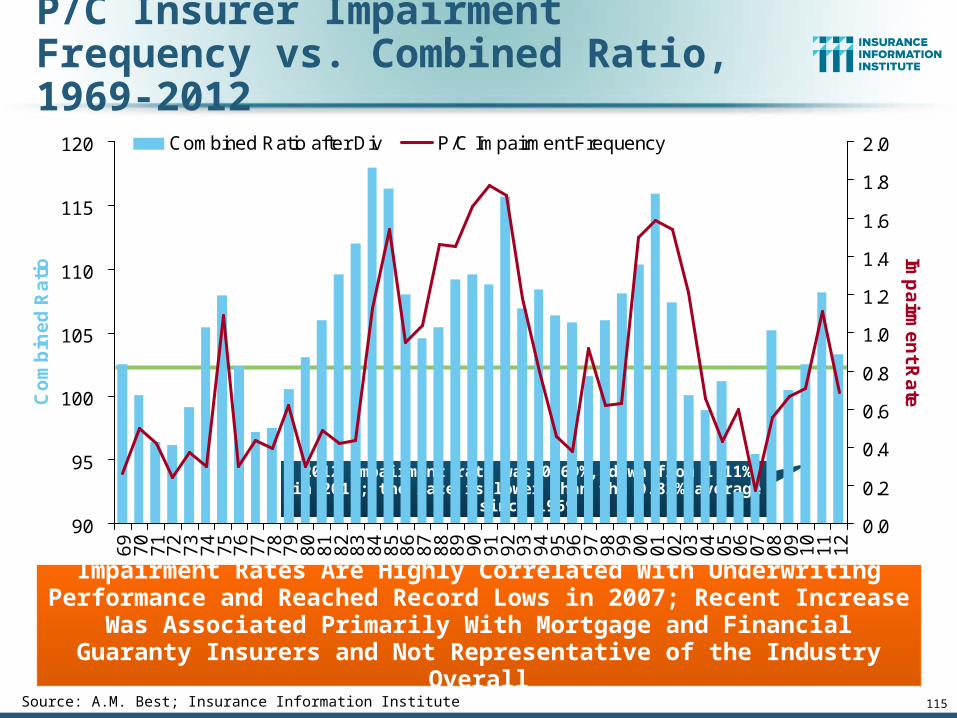
115
P/C Insurer Impairment Frequency vs. Combined Ratio, 1969-2012
90
95
100
105
110
115
1206
97
07
17
27
37
47
57
67
77
87
98
08
18
28
38
48
58
68
78
88
99
09
19
29
39
49
59
69
79
89
90
00
10
20
30
40
50
60
70
80
91
01
11
2
Co
mb
ine
d R
ati
o
0.0
0.2
0.4
0.6
0.8
1.0
1.2
1.4
1.6
1.8
2.0
Imp
airm
en
t Ra
te
Combined Ratio after Div P/C Impairment Frequency
Source: A.M. Best; Insurance Information Institute
2012 impairment rate was 0.69%, down from 1.11% in 2011; the rate is lower than the 0.82% average since 1969
Impairment Rates Are Highly Correlated With Underwriting Performance and Reached Record Lows in 2007; Recent Increase Was Associated
Primarily With Mortgage and Financial Guaranty Insurers and Not Representative of the Industry Overall
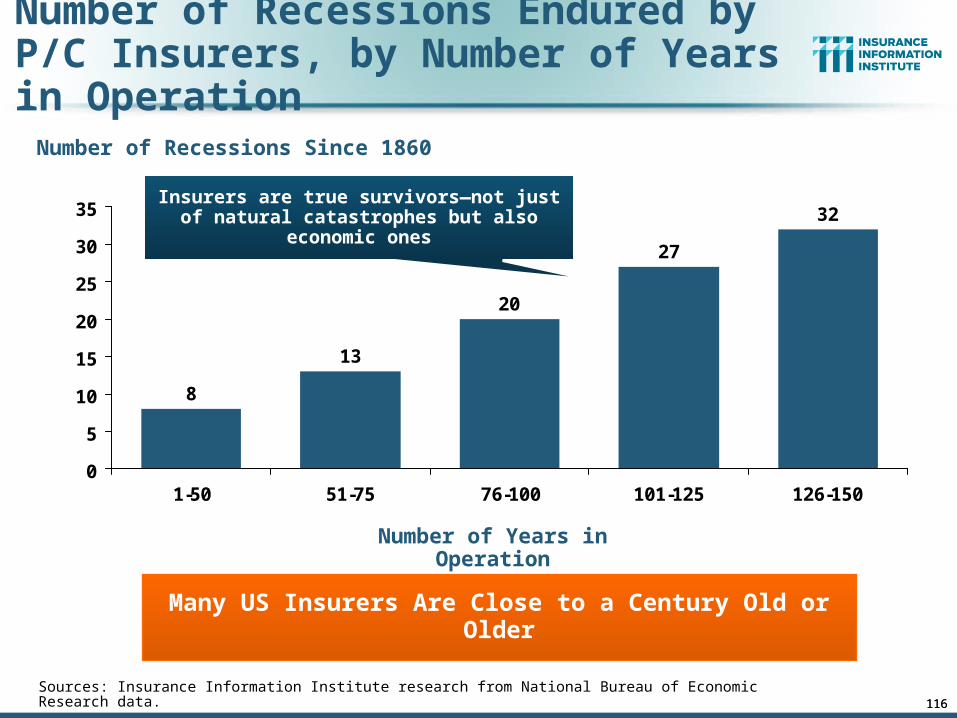
116
Number of Recessions Endured by P/C Insurers, by Number of Years in Operation
32
27
20
13
8
0
5
10
15
20
25
30
35
1-50 51-75 76-100 101-125 126-150
Sources: Insurance Information Institute research from National Bureau of Economic Research data.
Number of Recessions Since 1860
Many US Insurers Are Close to a Century Old or Older
Number of Years in Operation
Insurers are true survivors—not just of natural catastrophes but also economic ones
116
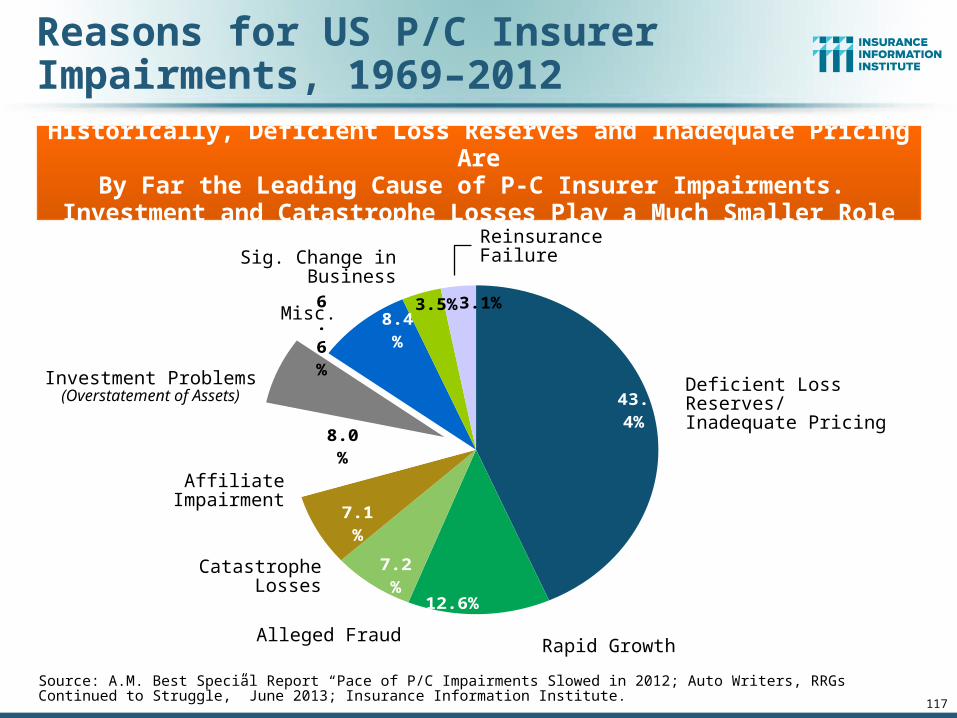
117
Reasons for US P/C Insurer Impairments, 1969–2012
43.4%
12.6%
7.2%
7.1%
8.0%
6.6%
8.4%
3.5% 3.1%
Source: A.M. Best Special Report “Pace of P/C Impairments Slowed in 2012; Auto Writers, RRGs Continued to Struggle,” June 2013; Insurance Information Institute.
Historically, Deficient Loss Reserves and Inadequate Pricing AreBy Far the Leading Cause of P-C Insurer Impairments.
Investment and Catastrophe Losses Play a Much Smaller Role
Deficient Loss Reserves/Inadequate Pricing
Reinsurance Failure
Rapid GrowthAlleged Fraud
Catastrophe Losses
Affiliate Impairment
Investment Problems (Overstatement of Assets)
Misc.
Sig. Change in Business
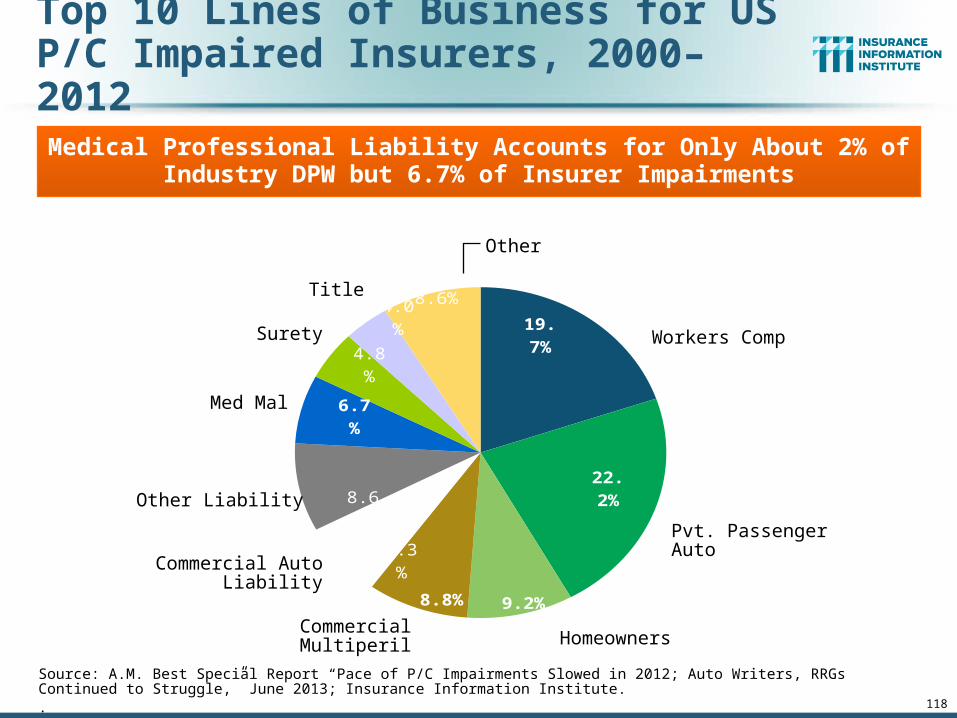
118
Top 10 Lines of Business for US P/C Impaired Insurers, 2000–2012
19.7%
22.2%
9.2%8.8%
7.3%
8.6%
6.7%
4.8%
4.0%
8.6%
Source: A.M. Best Special Report “Pace of P/C Impairments Slowed in 2012; Auto Writers, RRGs Continued to Struggle,” June 2013; Insurance Information Institute..
Medical Professional Liability Accounts for Only About 2% of Industry DPW but 6.7% of Insurer Impairments
Workers Comp
Other
Pvt. Passenger Auto
HomeownersCommercial Multiperil
Commercial Auto Liability
Other Liability
Med Mal
Surety
Title
Workers Compensation
119
The NEXT 100 Years
119
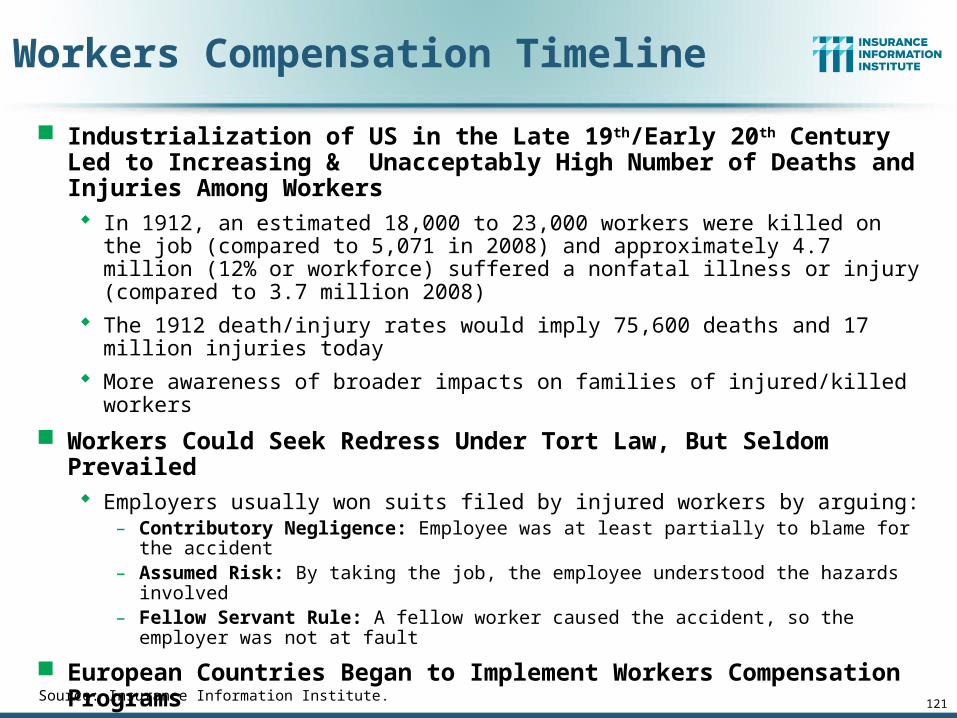
121
Workers Compensation Timeline
Industrialization of US in the Late 19th/Early 20th Century Led to Increasing & Unacceptably High Number of Deaths and Injuries Among Workers In 1912, an estimated 18,000 to 23,000 workers were killed on the job (compared to
5,071 in 2008) and approximately 4.7 million (12% or workforce) suffered a nonfatal illness or injury (compared to 3.7 million 2008)
The 1912 death/injury rates would imply 75,600 deaths and 17 million injuries today
More awareness of broader impacts on families of injured/killed workers
Workers Could Seek Redress Under Tort Law, But Seldom Prevailed Employers usually won suits filed by injured workers by arguing:
– Contributory Negligence: Employee was at least partially to blame for the accident– Assumed Risk: By taking the job, the employee understood the hazards involved– Fellow Servant Rule: A fellow worker caused the accident, so the employer was not at fault
European Countries Began to Implement Workers Compensation Programs Germany (1884); England (1897)
Insurers Began to Sell Commercial Liability Coverage in the Late 1800s Coverage for inadvertent errors became more commonplace
In the workforce, such policies became the first employer liability policies
Source: Insurance Information Institute.
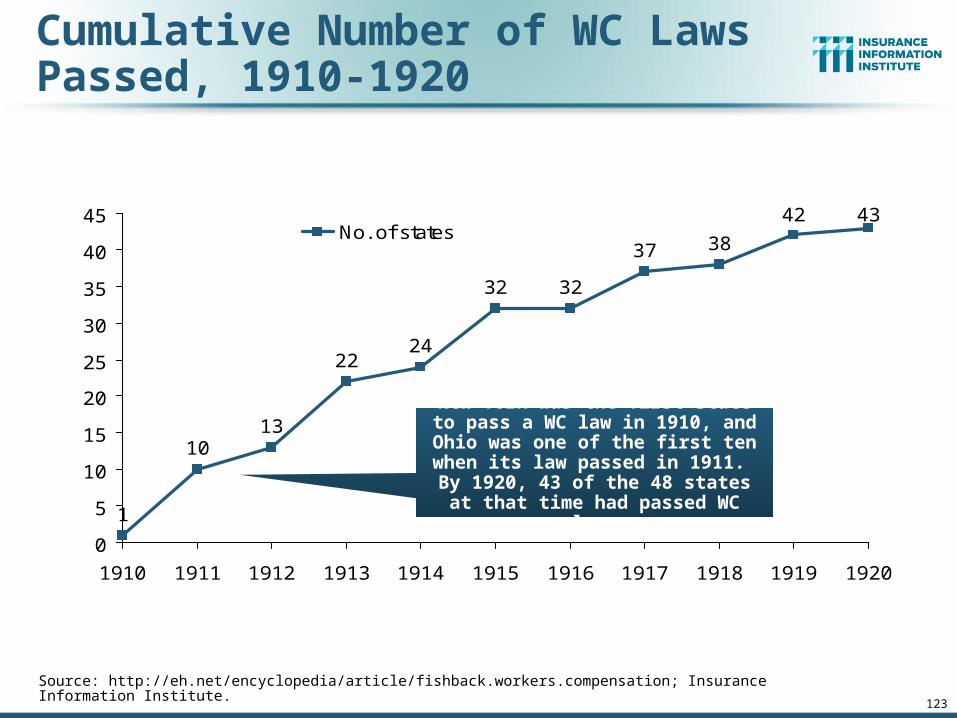
123
Cumulative Number of WC Laws Passed, 1910-1920
1
1013
2224
32 32
37 38
42 43
0
5
10
15
20
25
30
35
40
45
1910 1911 1912 1913 1914 1915 1916 1917 1918 1919 1920
No. of states
Source: http://eh.net/encyclopedia/article/fishback.workers.compensation; Insurance Information Institute.
New York was the first state to pass a WC law in 1910, and Ohio was one of the first ten when its law passed in
1911. By 1920, 43 of the 48 states at that time had passed WC laws
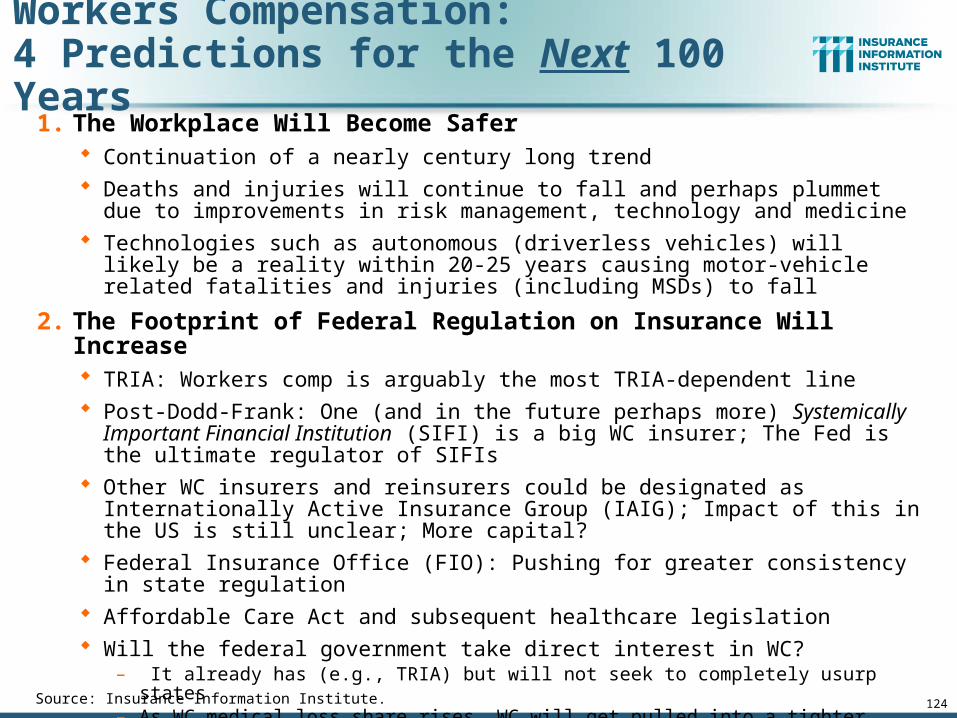
124
Workers Compensation:4 Predictions for the Next 100 Years
1. The Workplace Will Become Safer Continuation of a nearly century long trend Deaths and injuries will continue to fall and perhaps plummet due to improvements in
risk management, technology and medicine Technologies such as autonomous (driverless vehicles) will likely be a reality within 20-
25 years causing motor-vehicle related fatalities and injuries (including MSDs) to fall
2. The Footprint of Federal Regulation on Insurance Will Increase TRIA: Workers comp is arguably the most TRIA-dependent line Post-Dodd-Frank: One (and in the future perhaps more) Systemically Important
Financial Institution (SIFI) is a big WC insurer; The Fed is the ultimate regulator of SIFIs Other WC insurers and reinsurers could be designated as Internationally Active
Insurance Group (IAIG); Impact of this in the US is still unclear; More capital? Federal Insurance Office (FIO): Pushing for greater consistency in state regulation Affordable Care Act and subsequent healthcare legislation Will the federal government take direct interest in WC?
– It already has (e.g., TRIA) but will not seek to completely usurp states– As WC medical loss share rises, WC will get pulled into a tighter federal orbit
Insurers could once again resurrect the Optional Federal Charter debate Bottom Line: The federal regulatory camel’s nose is under the tent; The hump is next.
Source: Insurance Information Institute.
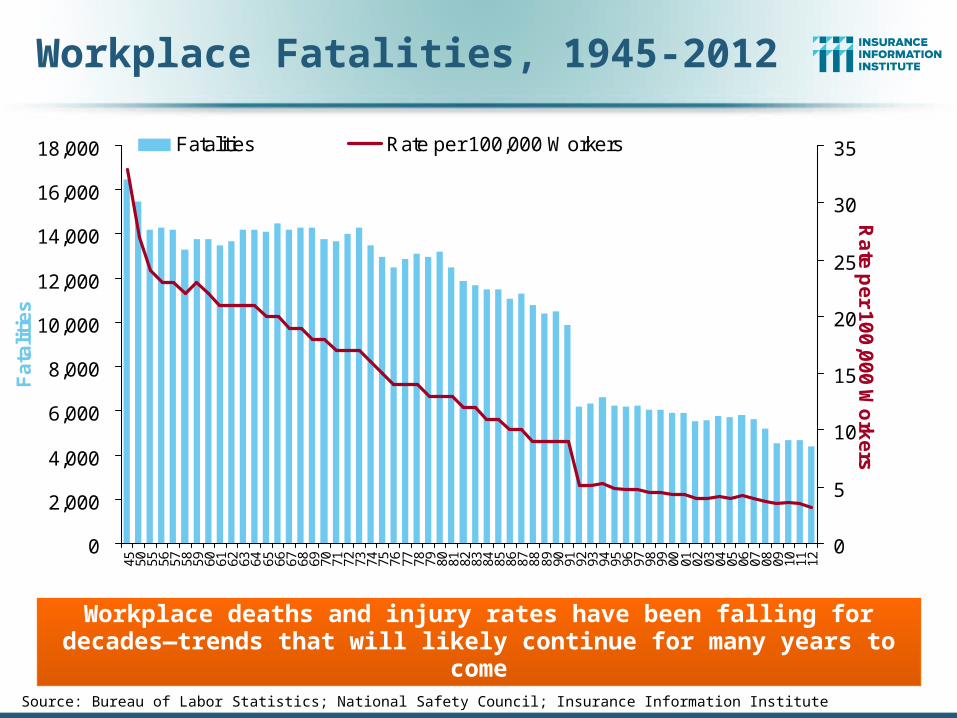
Workplace Fatalities, 1945-2012
0
2,000
4,000
6,000
8,000
10,000
12,000
14,000
16,000
18,00045 50 55 56 57 58 59 60 61 62 63 64 65 66 67 68 69 70 71 72 73 74 75 76 77 78 79 80 81 82 83 84 85 86 87 88 89 90 91 92 93 94 95 96 97 98 99 00 01 02 03 04 05 06 07 08 09 10 11 12
Fa
talit
ies
0
5
10
15
20
25
30
35
Ra
te p
er 1
00
,00
0 W
ork
ers
Fatalities Rate per 100,000 Workers
Source: Bureau of Labor Statistics; National Safety Council; Insurance Information Institute
Workplace deaths and injury rates have been falling for decades—trends that will likely continue for many years to come
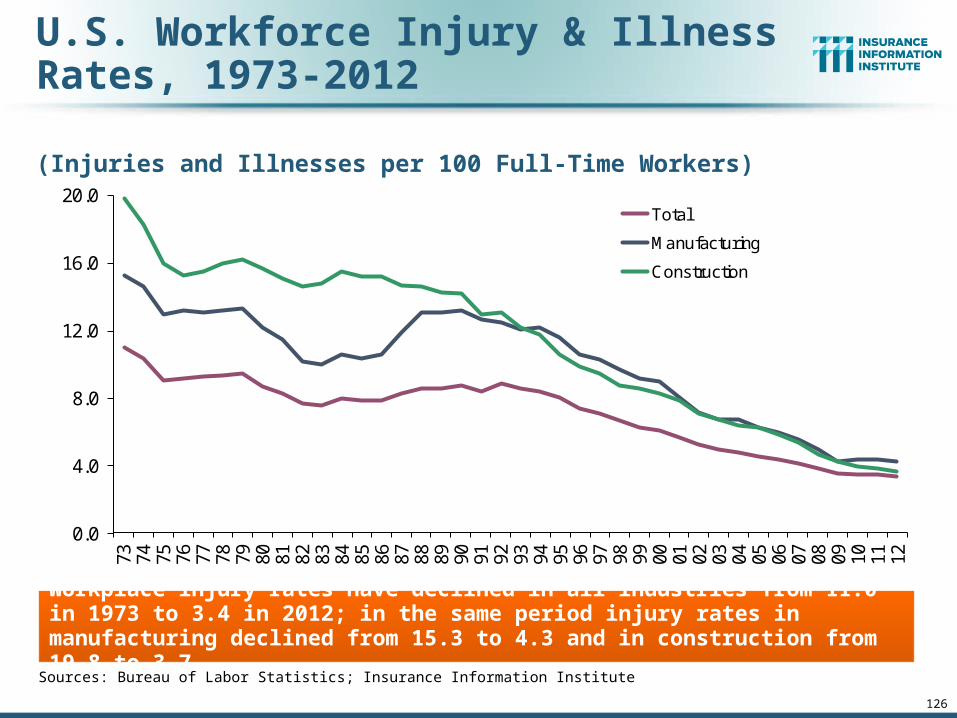
126
U.S. Workforce Injury & Illness Rates, 1973-2012
0.0
4.0
8.0
12.0
16.0
20.0
73 74 75 76 77 78 79 80 81 82 83 84 85 86 87 88 89 90 91 92 93 94 95 96 97 98 99 00 01 02 03 04 05 06 07 08 09 10 11 12
Total
Manufacturing
Construction
Sources: Bureau of Labor Statistics; Insurance Information Institute
Workplace injury rates have declined in all industries from 11.0 in 1973 to 3.4 in 2012; in the same period injury rates in manufacturing declined from 15.3 to 4.3 and in construction from 19.8 to 3.7.
(Injuries and Illnesses per 100 Full-Time Workers)
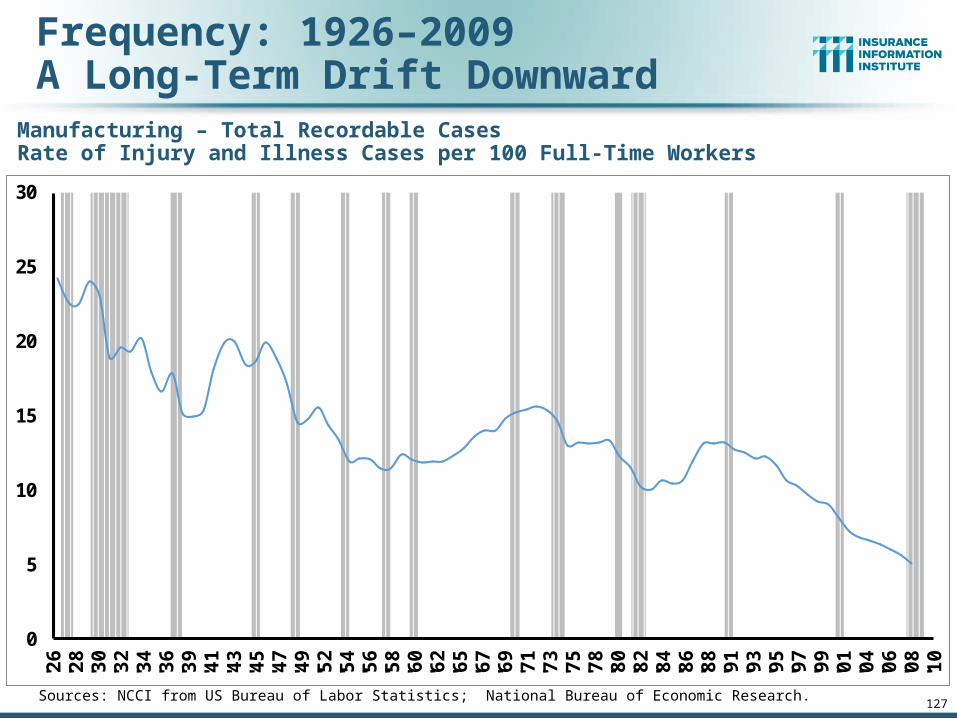
127
Frequency: 1926–2009A Long-Term Drift Downward
Note: Recessions indicated by gray bars.Sources: NCCI from US Bureau of Labor Statistics; National Bureau of Economic Research.
Manufacturing – Total Recordable CasesRate of Injury and Illness Cases per 100 Full-Time Workers
0
5
10
15
20
25
30
'26
'28
'30
'32
'34
'36
'39
'41
'43
'45
'47
'49
'52
'54
'56
'58
'60
'62
'65
'67
'69
'71
'73
'75
'78
'80
'82
'84
'86
'88
'91
'93
'95
'97
'99
'01
'04
'06
'08
'10
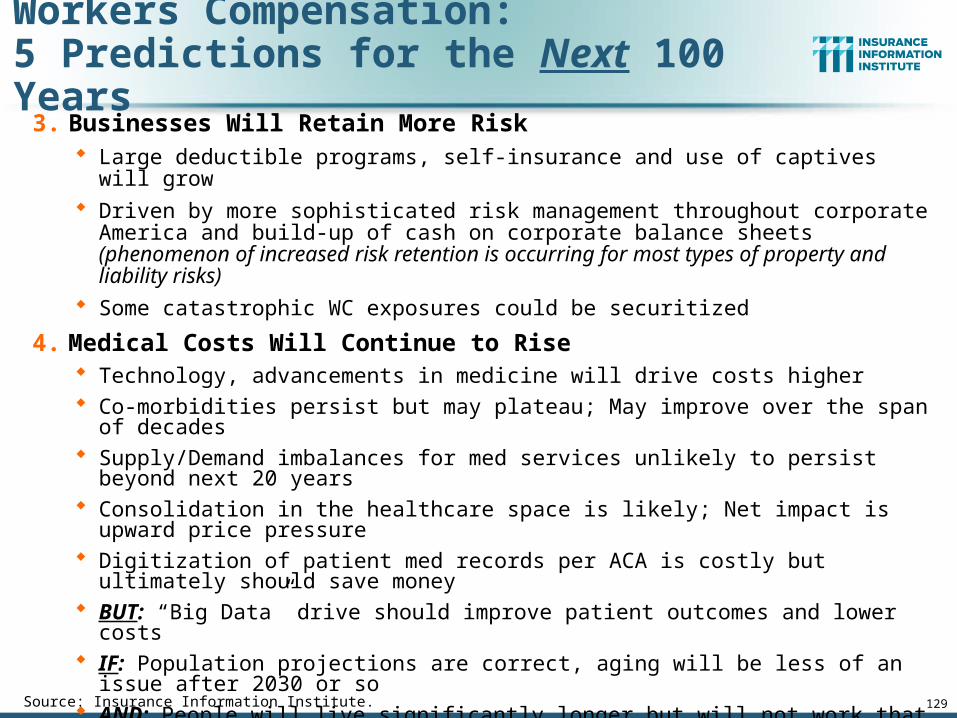
129
3. Businesses Will Retain More Risk Large deductible programs, self-insurance and use of captives will grow Driven by more sophisticated risk management throughout corporate America and build-
up of cash on corporate balance sheets (phenomenon of increased risk retention is occurring for most types of property and liability risks)
Some catastrophic WC exposures could be securitized
4. Medical Costs Will Continue to Rise Technology, advancements in medicine will drive costs higher Co-morbidities persist but may plateau; May improve over the span of decades Supply/Demand imbalances for med services unlikely to persist beyond next 20 years Consolidation in the healthcare space is likely; Net impact is upward price pressure Digitization of patient med records per ACA is costly but ultimately should save money BUT: “Big Data” drive should improve patient outcomes and lower costs IF: Population projections are correct, aging will be less of an issue after 2030 or so AND: People will live significantly longer but will not work that much longer
Source: Insurance Information Institute.
Workers Compensation:5 Predictions for the Next 100 Years
www.iii.org
Thank you for your timeand your attention!
Twitter: twitter.com/bob_hartwigDownload at www.iii.org/presentations
Insurance Information Institute Online:
130
Recommended