MEASURING THE ANGLE OF REPOSE OF GRANULAR SYSTEMS
USING HOLLOW CYLINDERS
by
Zhichao Liu
B.S, Southwest Jiaotong University, China, 2008
Submitted to the Graduate Faculty of
the Swanson School of Engineering in partial fulfillment
of the requirements for the degree of
Master of Science
University of Pittsburgh
2011

ii
UNIVERSITY OF PITTSBURGH
SWANSON SCHOOL OF ENGINEERING
This thesis was presented
by
Zhichao Liu
It was defended on
February 22th
, 2011
and approved by
Anthony Iannacchione, Associate Professor, Civil and Environmental Engineering
Department
C. Isaac Garcia, Professor, Mechanical Engineering and Materials Science Department
Thesis Advisor: Luis E. Vallejo, Professor, Civil and Environmental Engineering Department

iii
Copyright © by Zhichao Liu
2011

iv
The angle of repose of granular systems was investigated using hollow cylinders of different
diameters and lengths and bases of different degree of roughness. The cylinders contained
homogeneous samples of sand and gravel as well mixtures of sand and gravel with the sand
either thoroughly mixed with the gravel or in layered systems. From the laboratory experiments,
the following conclusions can be made: (a) the angle of repose of the granular systems was
influenced by the degree of roughness of the base on which the grains came to rest. The rougher
the base was, the higher was the angle of repose; (b) the mode of failure of the conical pile of
grains was different depending if the base was rough or smooth. For a rough base, the failure
took place on the face of the conical shape. For a smooth base, the failure took place at the base
of the conical shape; (c) the lifting velocities of the cylinders were varied between a slow
velocity (2 to 3 cm/sec) and a high velocity (7 to 8 cm/sec). The angle of repose was found to be
smaller when the high velocity of cylinder lifting was used regardless of the bases’ roughness;
(d) the angle of repose was found to decrease in value as the amount of material contained in the
cylinders increased in value; (e) the experiments on mixtures of sand and gravel indicated that
their angle of repose decreased in value as the percentage of sand in the mixture increased in
value; (f) the experiments on layered granular systems (gravel on top of sand) indicated that,
regardless of the lifting velocity of the cylinders, the angle of repose of the layered systems
decreased in value as the height of the sand layer in the composite increased in value; and (g) the
results of the tests helped to explain the angle of repose found in real rock slopes.
MEASURING THE ANGLE OF REPOSE OF GRANULAR SYSTEMS USING
HOLLOW CYLINDERS
Zhichao Liu, M.S.
University of Pittsburgh, 2011

v
TABLE OF CONTENTS
1.0 INTRODUCTION ................................................................................................................ 1
2.0 FORMATION OF LAYERED SYSTEMS IN THE FIELD ............................................ 6
3.0 THEORETICAL ANALYSIS TO EXPLAIN THE DEGREE OF CRUSHING AND
STRATIFICATION OF GRANULAR MATERIALS UNDER UNIAXIAL
COMPRESSION ................................................................................................................. 10
3.1 INTRODUCTION .............................................................................................................. 10
3.2 THE RESULTS OF THE CRUSHING TESTS AND THE ASSOCIATED
THEORETICAL ANALYSIS ........................................................................................... 11
4.0 ANGLE OF REPOSE OF NON-LAYERED-HOMOGENEOUS GRANULAR
MATERIALS ...................................................................................................................... 16
4.1 INFINITE SLOPE STABILITY ANALYSIS .................................................................. 16
4.2 SPREADING WEDGE SLOPE STABILITY ANALYSIS ............................................ 18
4.3 GRANULAR SPREADING FROM THE LIFTING OF A CYLINDER WITH
GRANULAR MATERIAL ................................................................................................ 22
5.0 DESCRIPTION OF THE EQUIPMENT USED FOR THE LABORATORY
TESTING PROGRAM ....................................................................................................... 27
5.1 GRAVEL AND SAND USED IN EXPERIMENTS ........................................................ 27

vi
5.2 THE BASES INVOLVED IN EXPERIMENTS AND THE INTERFACE FRICTION
ANGLE ................................................................................................................................ 28
5.3 THE CYLINDERS USED AND THE GENERAL SETUP FOR THE LABORATORY
EXPERIMENTS ................................................................................................................. 30
6.0 RESULTS FROM LABORATORY EXPERIMENTS ................................................... 33
6.1 EXPERIMENTS WITH CYLINDER CONTAINING ONLY SAND ........................... 33
6.2 EXPERIMENTS WITH CYLINDERS CONTAINING ONLY GRAVEL .................. 34
6.3 EXPERIMENTS USING CYLINDERS CONTAINING A MIXTURE OF SAND AND
GRAVEL ............................................................................................................................. 40
6.4 EXPERIMENTS USING A CYLINDER THAT CONTAINS A LAYERED SYSTEM
OF GRAVEL AND SAND ................................................................................................. 42
7.0 ANALYSIS AND APPLICATION OF THE RESULTS ................................................ 49
7.1 MEASURED AND THEORETICAL ANGLE OF REPOSE OF GRANULAR
SYSTEMS ON SMOOTH AND ROUGH BASES .......................................................... 49
7.2 EFFECT OF THE VELOCITY OF LIFTING OF CYLINDERS CONTAINING A
GRANULAR SYSTEM AND ITS APPLICATION ........................................................ 54
7.3 THE EFFECT OF THE WEIGHT OF A HOMOGENEOUS GRANULAR LAYER
ON THE ANGLE OF REPOSE ........................................................................................ 56
8.0 CONCLUSIONS ................................................................................................................. 58
BIBLIOGRAPHY ....................................................................................................................... 61

vii
LIST OF TABLES
Table 1. Ratio N/No for the statically increasing uniaxial compressive stress tests ..................... 12
Table 2. Ratio N/No for compressive stress tests in the centrifuge .............................................. 12
Table 3. The diameter of the particles, d, and the type of the substrate used in the experiment
conducted by Lajeunesse, et al. (2004) ........................................................................ 25
Table 4. Interface friction angle between granular particles and different bases ......................... 29
Table 5. Cylinder experiments with sand, slow velocity, about 2.0 cm/sec ................................. 34
Table 6. Cylinder experiments with sand, high velocity, about 7.0 cm/sec ................................. 34
Table 7. Cylinder experiments (5cm inner diameter) with gravel, slow velocity, about 2.0cm/sec
....................................................................................................................................... 35
Table 8. Cylinder experiments (5cm inner diameter) with gravel, slow velocity, about 7.0cm/sec
....................................................................................................................................... 35
Table 9. Cylinder experiments (12.0cm inner diameter) with gravel, both slow velocity (about
3.0cm/sec) and high velocity (about 8.0cm/sec) ........................................................... 36
Table 10. Cylinder experiments (12.5cm inner diameter) with gravel, on wood table with about
2.5cm/sec lifting velocity .............................................................................................. 38
Table 11. Cylinder experiments using mixtures with slow lifting velocity (about 2.0cm/sec) .... 41
Table 12. Cylinder experiments using mixtures and high lifting velocity (about 7.0cm/sec) ...... 41

viii
Table 13. Cylinder experiment with layered system (sand at the bottom of gravel) with slow
velocity (about 2.5cm/sec) ............................................................................................ 43
Table 14. Cylinder experiment with layered system (sand at the bottom of gravel) with high
velocity (about 7.0cm/sec) ............................................................................................ 43
Table 15. Measured and calculated angle of repose on rough and smooth surface ..................... 50

ix
LIST OF FIGURES
Figure 1 . Evolution of crushing under statically increasing one dimensional compressive loads:
(a) N (b) N (c) N (d) N (Lobo-Guerrero and
Vallejo, 2010) ................................................................................................................. 4
Figure 2. Crushing under simulated centrifuge pressure: (a) 1g, (b) 100g, (c) 600g, (d) 1800g
(Lobo-Guerrero and Vallejo, 2010) ................................................................................ 5
Figure 3. Three mainly basic forms of Craigieburn scree slopes:(a) scree sheets-island of
vegetation in middle distance; (b) scree cone-fresh debris-flow deposits on scree
surface; (c) scree gully-three example of erifying ages on far slope (dark horizontal
bands are trial plantings of pine trees). (Pierson, 1982) ................................................. 8
Figure 4. Schematic profiles of the three basic categories of slope deposits encountered on north
Carigieburn scree slopes: (a) Openwork gravel. This is a non-stratified deposit of fairly
angular fine, medium, or coarse gravel. Only a trace of fines is present, adhering to the
coarse particles. (b) Stratified gravel and fines. In these deposits a thin compact layer
of fines (a crust when dry) underlies the surface gravel. Beneath this are mixed layers
(often with indistinct boundaries) of fine gravel, gravelly sand, and sometimes sand or
silty sand. (c) Buried, truncated soil. Beneath the surface gravel and “crust” of fines
as a well developed, truncated soil that is commonly the B horizon of a mature forest
soil. It is characteristically developed in a discrete layer of silt or sandy silt that
overlies stratified fine gravels typical of Type 2 deposit. (Pierson, 1982) ..................... 8
Figure 5. Uniaxial Compression Tests (full lines obtained using Eq. 7, X represents
measurements from Table 1) ........................................................................................ 14
Figure 6. Centrifuge Induced Compression Tests ( Full lines obtained using Eq. 8, and X is value
measured and shown in Table 2) .................................................................................. 15
Figure 7. Free-falling Grain materials (sand) and the accumulated cone (Chik and Vallejo, 2004)
....................................................................................................................................... 17

x
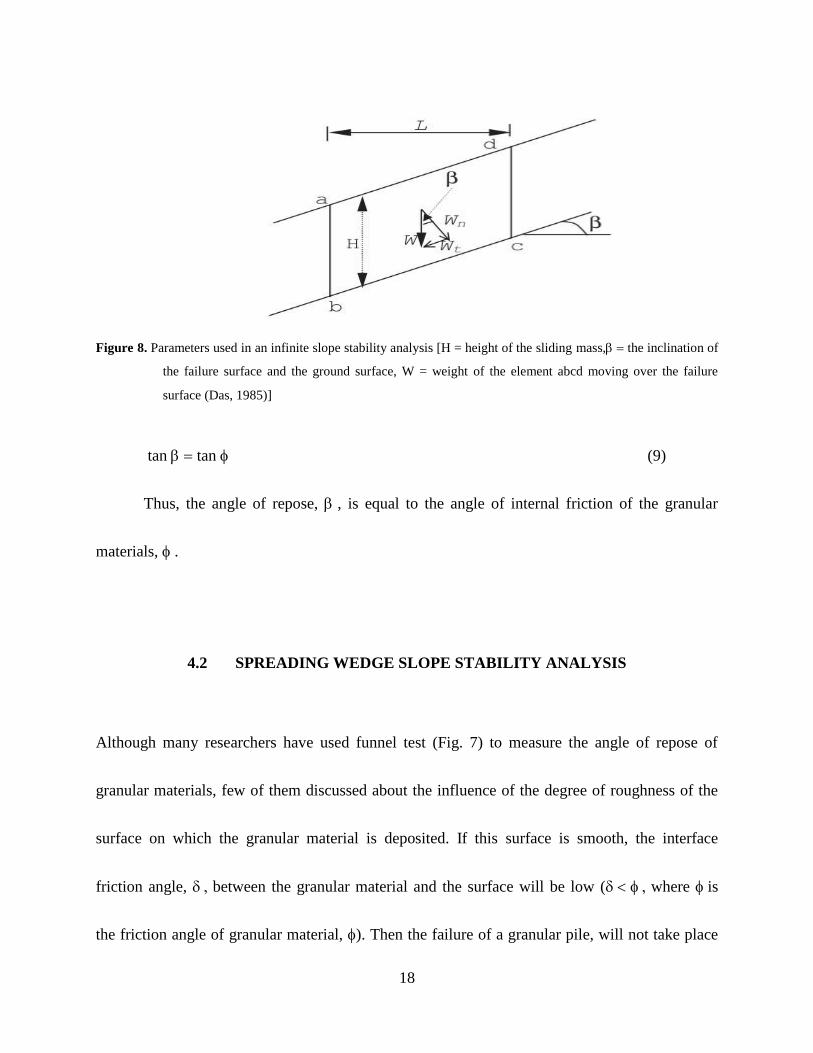
Figure 8. Parameters used in an infinite slope stability analysis [H = height of the sliding mass,
=the inclination of the failure surface and the ground surface, W = weight of the
element abcd moving over the failure surface (Das, 1985)] ......................................... 18
Figure 9. Sliding wedge used for the spreading type of slope stability analysis .......................... 20
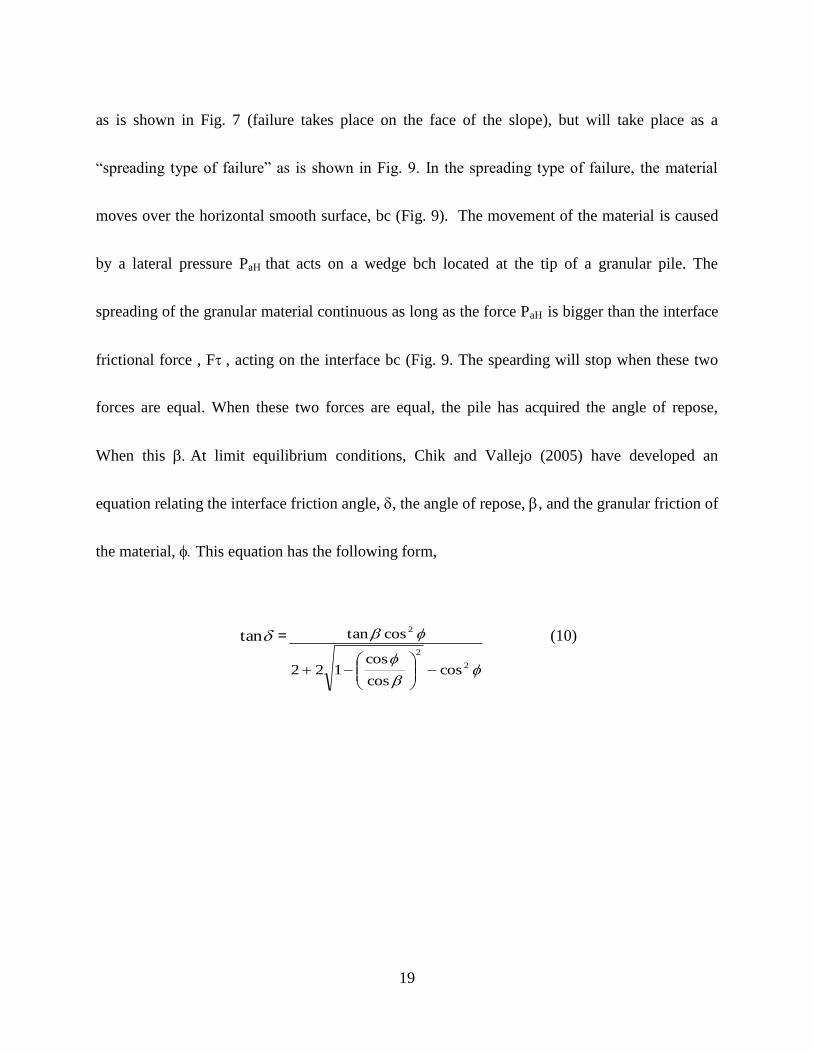
Figure 10. (A) The setup of measurement of interface friction angle using an adjustable inclined
bench (B) Schematic diagram of forces acting on the inclined bench, is the inclination
angle (Chik and Vallejo, 2005). .................................................................................... 21
Figure 11. Angle of repose for a mixture coarse-fine sand on smooth and rough bases (glass plate
and porous stone) (Chik and Vallejo, 2005) ................................................................. 22
Figure 12. A sandstone slope in Utah formed of a steep face and an accumulated material at the
toe of the slope .............................................................................................................. 23
Figure 13. Scheme of the experimental setup to investigate the flowing behavior of granular
materials on horizontal plate (Lajeunesse, et al. 2004) ................................................. 24
Figure 14. Flowing of granular material when a cylinder containing it is lifted (Lajeunesse,et al.,
2004) ............................................................................................................................. 25
Figure 15. Different bases used: (a) Glass Plate, (b) Porous Stone, and (c) Wooden table .......... 29
Figure 16. The three different cylinders used in the experimental program ................................. 32
Figure 17. Cylinder experiment (12.0cm inner diameter) with gravel (12.37N), slow velocity .. 36
Figure 18. Cylinder experiment (12.0cm inner diameter) with gravel (21.88N), slow velocity .. 37
Figure 19. Cylinder experiment (12.0cm inner diameter) with gravel (34.21N), slow velocity .. 37
Figure 20. Cylinder experiment (12.5cm inner diameter) with gravel (45.73N) on wood table .. 38
Figure 21. Cylinder experiment (12.5cm inner diameter) with gravel (92.87N) on wood table .. 39

xi
Figure 22. Cylinder experiment (12.5cm inner diameter) with gravel (142.34N) on wood table 39
Figure 23. Cylinder experiments using layered system on smooth base (2.5cm height sand at
bottom), slow velocity .................................................................................................. 44
Figure 24. Cylinder experiments using layered system on smooth base (5.0cm height sand at
bottom), slow velocity .................................................................................................. 45
Figure 25. Cylinder experiments using layered system on smooth base (10.0cm height sand at
bottom), slow velocity .................................................................................................. 46
Figure 26. Cylinder experiments using layered system on rough base (2.5cm height sand at
bottom), slow velocity .................................................................................................. 47
Figure 27. Cylinder experiments using layered system on rough base (5.0cm height sand at
bottom), slow velocity .................................................................................................. 47
Figure 28. Cylinder experiments using layered system on rough base (10.0cm height sand at
bottom), slow velocity .................................................................................................. 48
Figure 29. Comparison of results sand-gravel mixture on different bases with slow velocity (data
from Table 11) .............................................................................................................. 51
Figure 30. Comparison of results for sand-gravel mixture on different bases with high velocity
(data from Table 12) ..................................................................................................... 51
Figure 31. Comparison of results for gravel-sand layered system on different bases with slow
velocity (data from Table 13) ....................................................................................... 52
Figure 32. Comparison of results gravel-sand layered system on different bases with high
velocity (data from Table 14) ....................................................................................... 52
Figure 33. Comparison of results from testing layered system on a smooth base with different
lifting velocities of the cylinder (2.5 and 7 cm/sec; Tables 13 and 14) ........................ 55
Figure 34. Comparison of results from testing layered system on a rough base with different
lifting velocities of the cylinders (2.5 and 7 cm/sec; Tables 13 and 14) ...................... 55

xii
Figure 35. Results of cylinder experiments using gravel with different weights (different heights)
on wooden surface and slow lifting velocity (data from Table 10) .............................. 57

1
1.0 INTRODUCTION
Although many previous studies have been conducted to explain the behavior of granular
materials, few of them have been concerned about the effects of non-homogeneous layered
granular materials on the angle of repose.
This study, based on a series of laboratory experiments, primarily focuses on the angle of
repose after the failure of granular deposits made of a single and two layers of granular materials
(sand and gravel). The laboratory tests made of two layers will try to simulate the behavior of
similar systems in the field and were designed to understand the influence of such factors as the
velocity of failure, the arrangement of the layers, and the roughness of the base on which the
granular materials were deposited.
Layered systems can occur in fluvial systems. It is known that sand and gravel are
deposited in a fluvial bed. When the sand and gravel move to the bottom of the river, due to their
different settling velocities, a process called sorting, is taking place. The settling velocity is
function of the size and density of particles and is an indicator to show how quickly these

2
transported particles by water flow can accumulate in the bed. During the low velocity flow of
rivers, gravel will accumulate at the bottom of rivers, while sand will accumulate on top of the
gravel. If the river changes its course, the gravel-sand deposit will remain in place. If this layered
system experience failure, what will be the angle of repose of this system? This study again will
try to give an answer to this question.
Layered granular materials also occur in the field as a result of crushing. This crushing
takes place in the bottom section of a deposit of granular material. The overburden pressure at
the bottom of a granular material could exceed the compressive strength of the grains. If this
takes place, the grains at the bottom of the deposit will break into pieces that are smaller than the
original granular pieces. The crushing will change the original deposit from one that is made of
unbroken granular material to a deposit that is made of two different layers. The top layer will be
made of unbroken pieces, and the lower bottom will be made of smaller pieces resulting from the
fragmentation process. An example of this fragmentation takes place under glaciers. During the
process of a huge glacier advance and retreat, the particles beneath it are subjected to great
compressive loads. Some of the particles will break, some will not break. The particles that break
forming small size particles that travel to the bottom of the deposit moving through the voids of
the unbroken particles (pop-corn effect). After this takes place, the deposit will be made of a
bottom layer of broken, smaller particles, and a top layer of large unbroken particles. If this

3
layered granular deposit fails, what will be the angle of repose of the two layered system? This
study would like to give an answer to this question.
Fig. 1 and 2 shows the evolution of breakage of granular materials when subjected to
statically increasing compressive loads and centrifuge induced compressive loads respectively.
The crushing simulation was conducted by Lobo-Guerrero and Vallejo (2010) using the Discrete
Element Method (DEM). Under statically increasing compressive loads (Fig. 1), the crushed
particles are uniformly distributed in the samples. For the case of compressive loads simulated
by the centrifuge, the crushed particles are preferentially located at the bottom of the samples. If
the systems shown in the field experience failure by the removal of the confining walls, what
will be the angle of repose? This study would like to give an answer to this question.

4
(a) (b)
(c) (d)
PFC2D 3.00
Geotechnical Research CenterUniversity of Pittsburgh
Step 441400 09:22:18 Tue May 18 2004
View Size: X: -2.269e-002 <=> 7.269e-002 Y: -5.001e-003 <=> 1.050e-001
Wall
Ball
PFC2D 3.00
Geotechnical Research CenterUniversity of Pittsburgh
Step 473015 09:22:36 Tue May 18 2004
View Size: X: -2.269e-002 <=> 7.269e-002 Y: -5.001e-003 <=> 1.050e-001
Wall
Ball
PFC2D 3.00
Geotechnical Research CenterUniversity of Pittsburgh
Step 305920 09:20:47 Tue May 18 2004
View Size: X: -2.269e-002 <=> 7.269e-002 Y: -5.001e-003 <=> 1.050e-001
Wall
Ball
PFC2D 3.00
Geotechnical Research CenterUniversity of Pittsburgh
Step 322220 09:21:28 Tue May 18 2004
View Size: X: -2.269e-002 <=> 7.269e-002 Y: -5.001e-003 <=> 1.050e-001
Wall
Ball
Figure 1 . Evolution of crushing under statically increasing one dimensional
compressive loads: (a) N (b) N (c) N (d)
N (Lobo-Guerrero and Vallejo, 2010)

5
(a) (b)
(c) (d)
Figure 2. Crushing under simulated centrifuge pressure: (a) 1g, (b) 100g, (c) 600g, (d) 1800g
(Lobo-Guerrero and Vallejo, 2010)
PFC2D 3.00
Geotechnical Research CenterUniversity of Pittsburgh
Step 268320 15:42:38 Mon Jun 13 2005
View Size: X: -2.269e-002 <=> 7.269e-002 Y: -5.001e-003 <=> 1.050e-001
Wall
Ball
1g

6
2.0 FORMATION OF LAYERED SYSTEMS IN THE FIELD
It is important to understand the form and configuration of layered slope deposits in nature
because the layered system could affect both their physical and hydrological properties. The
characteristics of deposits beneath the surface of a scree slope in Northern Craigieburn Range,
New Zealand, were first studied by Pierson (1982). Before his studies, researchers of this area
paid more attention to its characteristics landform and the geomorphic processes that caused the
shape of the landform but without mentioning about the influence of the deposits beneath the
surface on the geomorphology of the area. The area where the slope studied by Pierson is located
is strongly influenced by glacial and fluvial erosion. Based on the large-scale geometry, the slope
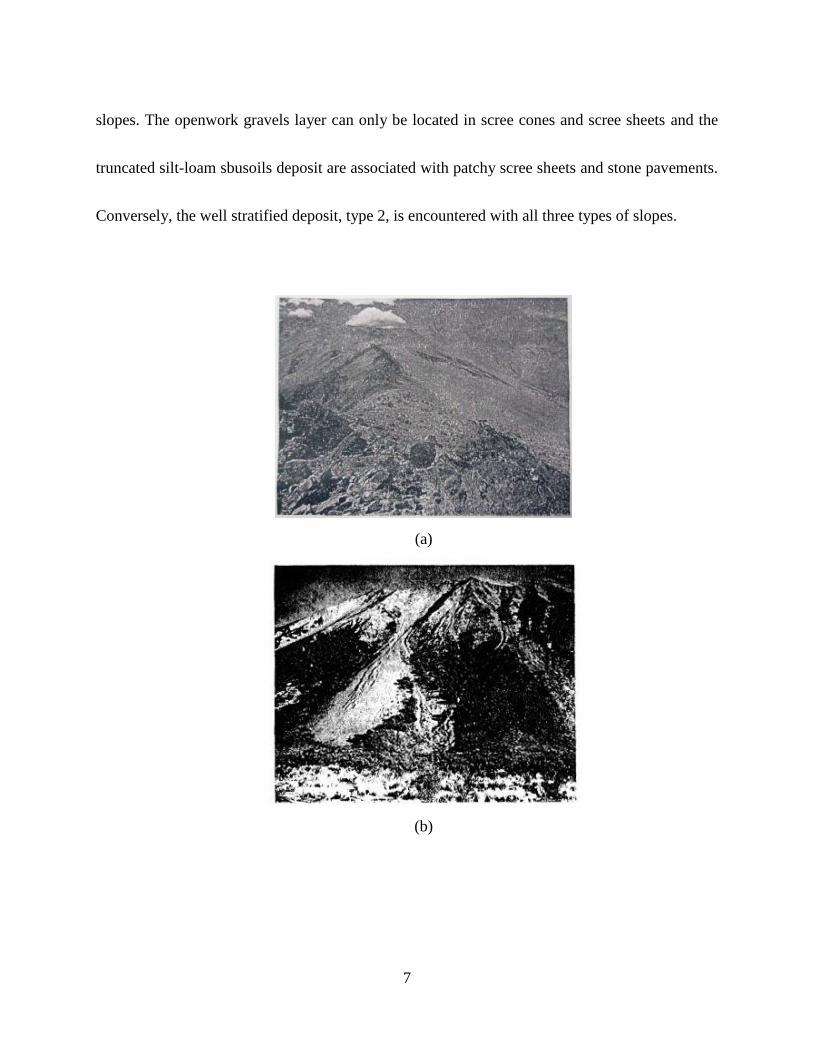
form was subdivided into three types by Pierson: (1) sheets; (2) cones and (3) gullies (Fig. 3).
And also, the deposits beneath the slope surface, which is mantled by scree deposits, were
subdivided into three types: (1) non-layered openwork gravels; (2) stratified gravels, sands and
silts; (3) truncated silt-loam sub-soils (Fig. 4). The slope form types seemly determine which
type of deposits beneath their surface, because not all deposits can be found in every each type of
7
slopes. The openwork gravels layer can only be located in scree cones and scree sheets and the
truncated silt-loam sbusoils deposit are associated with patchy scree sheets and stone pavements.
Conversely, the well stratified deposit, type 2, is encountered with all three types of slopes.
(a)
(b)

8
(c)
Figure 3. Three mainly basic forms of Craigieburn scree slopes:(a) scree sheets-island of vegetation in
middle distance; (b) scree cone-fresh debris-flow deposits on scree surface; (c) scree gully-
three example of erifying ages on far slope (dark horizontal bands are trial plantings of pine
trees). (Pierson, 1982)
(a) (b) (c)
Figure 4. Schematic profiles of the three basic categories of slope deposits encountered on north
Carigieburn scree slopes: (a) Openwork gravel. This is a non-stratified deposit of fairly angular fine, medium, or
coarse gravel. Only a trace of fines is present, adhering to the coarse particles. (b) Stratified gravel and fines. In
these deposits a thin compact layer of fines (a crust when dry) underlies the surface gravel. Beneath this are mixed
layers (often with indistinct boundaries) of fine gravel, gravelly sand, and sometimes sand or silty sand. (c) Buried,
truncated soil. Beneath the surface gravel and “crust” of fines as a well developed, truncated soil that is commonly
the B horizon of a mature forest soil. It is characteristically developed in a discrete layer of silt or sandy silt that
overlies stratified fine gravels typical of Type 2 deposit. (Pierson, 1982)

9
From this report, 70 percentages of the sites which were selected to study were well
stratified deposits (Type 2 and Type 3) beneath the surface of a thin gravel layer. This gravel
surface layer was commonly from 2 to 20 cm thick. Most of these gravel surface layers were
unstable and the deposits underlying them formed a firm and smooth surface on which the
gravels can move downward when they were triggered by forces. The slope angles in study area
range from 20 degrees to 35 degrees. The granular slopes in New Zealand shown in Figs. 3 and 4
represent slopes that are layered and have reached after failure the angle of repose.
10
3.0 THEORETICAL ANALYSIS TO EXPLAIN THE DEGREE OF CRUSHING AND
STRATIFICATION OF GRANULAR MATERIALS UNDER UNIAXIAL
COMPRESSION
3.1 INTRODUCTION
In this study a theoretical analysis was developed to evaluate the crushing and stratification
induced in homogeneous granular materials that were subjected to statically increasing
compressive stress and centrifuge induced compressive tests. These tests were developed by
Lobo-Guerrero and Vallejo (2010) and are presented in Figs. 1 and 2. These tests used the
Discrete Element Method (DEM). In these tests, the samples were first generated in a simulated
box container measuring 0.05 m in width and 0.10 m in height. This container was created by
using the software PFC2D
, which is developed by the Itasca Consulting Group (2002). The
coefficient of normal and shear stiffness of the walls of the container were set equal to 1x10⁹
N/M, and the coefficient of friction between the particles and the particles and the walls was set
to be equal to 0.7. The radius of 120 particles randomly generated inside the box container was
11
equal to 3 mm. The density of these particles was set to 2,500 kg/m3. In the statically increasing
uniaxial compression tests (Fig. 1), a moving piston plate with a velocity equal to 0.0625 mm/sec
was used to apply compression to the particles. The compression from the moving piston plate
varied from 1x10⁴ N to 1x10
5 N. In simulated centrifuge induced compressive tests (Fig. 2), the
gravity, G, applied on the particles was varied between 1g to 1800g (1g = 9.81 m/sec2).
3.2 THE RESULTS OF THE CRUSHING TESTS AND THE ASSOCIATED
THEORETICAL ANALYSIS
The main purpose of the theoretical analysis developed in this study is to develop a relationship
that reflects the degree of crushing as a result of compression in the samples depicted by Figs. 1
and 2. Using this relationship, a prediction of the level of crushing in granular materials under
any load will be obtained. The theoretical relationship will relate the percentage of particles that
have been broken in function of the applied load. This theoretical relationship will also be
helpful for our understanding how granular materials developed layers of different size particles.
Based on the results of the simulated compression tests (Fig. 1 and Fig.2), the number of
particles under a certain load were counted manually. From the simulated compression tests
under statically increasing compression stress tests (Fig. 1), the number of particles was equal to

12
120, 134, 562 and 769 when the compressive loads were equal to N, N,
N, and N respectively. For the simulated centrifuge induced compression
tests (Fig. 2), the number of particles was 120, 127, 239 and 477 when the gravity G used in the
tests was equal to 1g, 100g, 800g and 1800g respectively. If N0 is the number of the original
particles before breakage, and N is the number of particles after breakage, Using Figs. 1 and 2
one can obtain the values of N and the ratio of N/N0 related to the applied loads (Fig.1) and
gravity. This has been done in Tables 1 and 2.
Table 1. Ratio N/No for the statically increasing uniaxial compressive stress tests
N(Number of Particles)
P( N)
1 1.2
1.1 3.0
4.7 7.5
6.4 10
Table 2. Ratio N/No for compressive stress tests in the centrifuge
N(Number of Particles)
Value of the gravity, G
1 G1 = 1g
1.06 G2=600g
1.99 G3=1000g
3.98 G4=1800g
(1g = 9.81 m/sec2).
To determine whether a relationship exists between N/N0 and the load P as well as
between N/N0 and the number of g’s applied that produce different levels of crushing in the
samples the following analysis based on exponential functions is presented (von Bertalanffy,
13
1959). Let’s assume that the increment in number of particles as a result of crushing, dN, is
proportional to the original number of particles, N, multiplied by some increment of load dP,
then,
dN = dP (1)
Where is a constant.
After rearranging terms we obtain,
(dN/N) =dP (2)
The integration of Eq. (2) results in the following relationship,
ln N = P + C (3)
If the number of particles is N0 when P=0, from Eq. (3) we obtain
ln N0 = C (4)
Replacing Eq. (4) into (3) we obtain,
ln (N/N0) = P (5)
Eq. (5) is the result of taking natural logarithms of the following equation,
N/N0 = eP
(6)
Eq. (6) is the exponential function that will be used to interpret the evolution of crushing
in the simulated tests depicted in Figs. 1 and 2. For the case of the centrifuge forces induced
compressive loads, P in Eq. (6) is replaced by the gravity intensity, G Table 2).

14
The best exponential fit curve to the measured values of N/N0 and the values of P and G
in Tables 2 and 3 provides the following relationships:
From the results of Table 1:
N/N0 = 0.6728e0.2343P
(7)
From Table 2:
N/N0 = 0.847e0.0008G
(8)
The values obtained using Eqs. 8 and 9 have been superimposed on the measured values
in Figs. 5 and 6. The measured values and the theoretical results compare well. Thus, the
theoretical relationships (Eqs. 8 and 9) can be used to predict future fragmentation in the
simulations shown in Figs, 1 and 2.
Figure 5. Uniaxial Compression Tests (full lines obtained using Eq. 7, X represents measurements from
Table 1)
0
1
2
3
4
5
6
7
8
0 20000 40000 60000 80000 100000 120000
P (N)
N/No

15
Figure 6. Centrifuge Induced Compression Tests ( Full lines obtained using Eq. 8, and X is value measured
and shown in Table 2)
0
0.5
1
1.5
2
2.5
3
3.5
4
4.5
0 500 1000 1500 2000
G (Gravity)
N/No

16
4.0 ANGLE OF REPOSE OF NON-LAYERED-HOMOGENEOUS GRANULAR
MATERIALS
4.1 INFINITE SLOPE STABILITY ANALYSIS
When a dry slope made of granular materials is subjected to failure, the granular materials
accumulate at the toe of slope. The angle that the accumulated material forms with the horizontal
is called the “angle of repose.” This angle of repose has been found to be equal to the angle of
internal friction, of the granular material. This angle of repose can be measured in the
laboratory using the funnel test. This test form part of the standard tests backed up by the
American Society of Testing and Materials (ASTM) (Method No. C1444-00; ASTM, 2001). In
the funnel test, granular material is placed in a funnel and then is slowly deposited on a
horizontal surface as shown in Fig. 7. The granular material moves over the face of the
accumulated triangular pile. When the movement stops, the inclination of the pile represents the
angle of repose.

17
Figure 7. Free-falling Grain materials (sand) and the accumulated cone (Chik and Vallejo, 2004)
The relationship between the friction angle of the granular material and its angle of
repose can be obtained using an infinite slope stability analysis (Das, 1985). For the analysis, the
granular material is assumed to be dry.
Assuming the internal friction angle of the particles used in the infinite slope stability
analysis is and the angle of the accumulated material is . By using an infinite slope stability
analysis as shown in Fig. 8, Das (1985) determined that at limit equilibrium conditions, the
relationship between and can be obtained from the following relationship:
18
Figure 8. Parameters used in an infinite slope stability analysis [H = height of the sliding mass,the inclination of
the failure surface and the ground surface, W = weight of the element abcd moving over the failure
surface (Das, 1985)]
tan tan (9)
Thus, the angle of repose, , is equal to the angle of internal friction of the granular
materials, .
4.2 SPREADING WEDGE SLOPE STABILITY ANALYSIS
Although many researchers have used funnel test (Fig. 7) to measure the angle of repose of
granular materials, few of them discussed about the influence of the degree of roughness of the
surface on which the granular material is deposited. If this surface is smooth, the interface
friction angle, between the granular material and the surface will be low (where is
the friction angle of granular material, ). Then the failure of a granular pile, will not take place
19
as is shown in Fig. 7 (failure takes place on the face of the slope), but will take place as a
“spreading type of failure” as is shown in Fig. 9. In the spreading type of failure, the material
moves over the horizontal smooth surface, bc (Fig. 9). The movement of the material is caused
by a lateral pressure PaH that acts on a wedge bch located at the tip of a granular pile. The
spreading of the granular material continuous as long as the force PaH is bigger than the interface
frictional force , F, acting on the interface bc (Fig. 9. The spearding will stop when these two
forces are equal. When these two forces are equal, the pile has acquired the angle of repose,
When this At limit equilibrium conditions, Chik and Vallejo (2005) have developed an
equation relating the interface friction angle, , the angle of repose, , and the granular friction of
the material, This equation has the following form,
tan =
2
2
2
coscos
cos122
costan
(10)

20
Figure 9. Sliding wedge used for the spreading type of slope stability analysis
Using Eq. 10, one can obtain the angle of repose, , if one knows the angle of friction of
the granular material, , and the angle interface friction angle, , between the granular material
and the surface on which it spreads.
In their study, Chik and Vallejo (2005) measured the interface friction angle between
granular materials and a smooth base (glass plate) and a rough base (porous stone). The angle
was measured by putting sand in a metal ring that rested on either the glass or the porous stone.
The assembly sat on a tilting table. Then, the tilting table was raised slowly until the ring and the
granular material moved. When this took place, the angle of the tilting table represented the
interface friction angle, , between the sand and the base used ((Fig. 10).
21
Figure 10. (A) The setup of measurement of interface friction angle using an adjustable inclined bench (B)
Schematic diagram of forces acting on the inclined bench, is the inclination angle (Chik and Vallejo,
2005).
The interface friction angle between the smooth and rough bases and mixtures of fine and
coarse sand are shown in Fig. 11.

22
Figure 11. Angle of repose for a mixture coarse-fine sand on smooth and rough bases (glass plate and
porous stone) (Chik and Vallejo, 2005)
4.3 GRANULAR SPREADING FROM THE LIFTING OF A CYLINDER WITH
GRANULAR MATERIAL
Slopes can fail either very rapidly or slowly. Fig. 12 shows a sandstone slope in Utah that is
made of a steep intact face and accumulated material at its toe. The accumulated material is the
result of either rapid failure of a section of the steep face or a slow failre due to the physical

23
weathering of the slope (i.e. freezing and thawing, heating and cooling). As a result of a failure
of the steep face, the material accumulates at the toe of the slope. The accumulated material is
usually granular debris that forms an angle with the base of the slope. This angle is the angle of
repose.
Figure 12. A sandstone slope in Utah formed of a steep face and an accumulated material at the toe of the slope
A variation of the funnel test discussed before to evaluate the angle of repose of granular
materials has been developed by Lajeunesse, et al. (2004). In the test conducted by Lajeunesse
et al., granular material is placed in a hollow cylinder when in contact with a base. Then the

24
hollow cylinder is lifted and the granular material flows on the surface where before the cylinder
was resting. As the cylinder is lifted, the granular material forms a pile with an external face
inclined at the angle of repose (Fig. 13).
Figure 13. Scheme of the experimental setup to investigate the flowing behavior of granular materials on
horizontal plate (Lajeunesse, et al. 2004)
For the laboratory experiments, Lajeunesse et al. (2004) used different type of materials
and surfaces over which the materials flowed. Table 3 shows the properties of the granular
materials and surfaces used. This experimental setup shown in Fig. 13 was conducted by
Lajeunesse to study the shape of the resulting cone after the particles being released and flowing
on the surface by lifting the cylinder. From the final shape the angle of repose was obtained.
Fig. 14 shows the flow of a granular mass (950 g) made of grains with diameter d =
350m placed in a cylinder with internal diameter equal to 70. 5 mm. The base on which the

25
material flowed is made of a smooth wooden surface. Fig. 14 shows the formation of the pile at
different times after the starting of the test. The bottom section of Fig. 14 shows the final pile of
granular material that formed at a time equal to 0.54s after the initiation of the test. The angle of
repose of the granular material was found to be equal to 20 degrees.
Table 3. The diameter of the particles, d, and the type of the substrate used in the experiment conducted by
Lajeunesse, et al. (2004)
Figure 14. Flowing of granular material when a cylinder containing it is lifted (Lajeunesse,et al., 2004)

26
In the tests conducted by Lajeunesse, et al., (2004), the mass of granular material used
was a homogeneous one. Also, the influence of the velocity of lifting the cylinder on the angle of
repose of granular materials was not investigated. The lifting of the cylinder at different
velocities will allow the granular materials to be deposited at different velocities. These different
velocities of lifting of the cylinder represent the different velocities at which a material can fail
from the steep face of the sandstone slope shown in Fig. 13. In this study, cylinders similar to
the one shown in Figs. 13 and 14 were used to measure the angle of repose of granular materials
in the form of sand and gravel. The tests were conducted using homogeneous samples of either
sand or gravel, or a mixture of the two forming two layers. The influence of the velocity of
lifting of the cylinders on the angle of repose was also investigated.

27
5.0 DESCRIPTION OF THE EQUIPMENT USED FOR THE LABORATORY
TESTING PROGRAM
5.1 GRAVEL AND SAND USED IN EXPERIMENTS
In these experiments, gravel and fine sand were used in the experiments. The gravel has an
average diameter d50 = 5 mm, and the sand used was Ottawa sand with an average diameter d50 =
0.59 mm. The specific gravity of the gravel, Gs, was equal to 2.6, and for the sand was equal to
2.65. The angle of internal friction for the sand was equal to 27 degrees. The angle of internal
friction for the gravel was equal to 34 degrees. These angles were obtained by a funnel test and a
rough base where the granular materials were deposited.
28
5.2 THE BASES INVOLVED IN EXPERIMENTS AND THE INTERFACE
FRICTION ANGLE
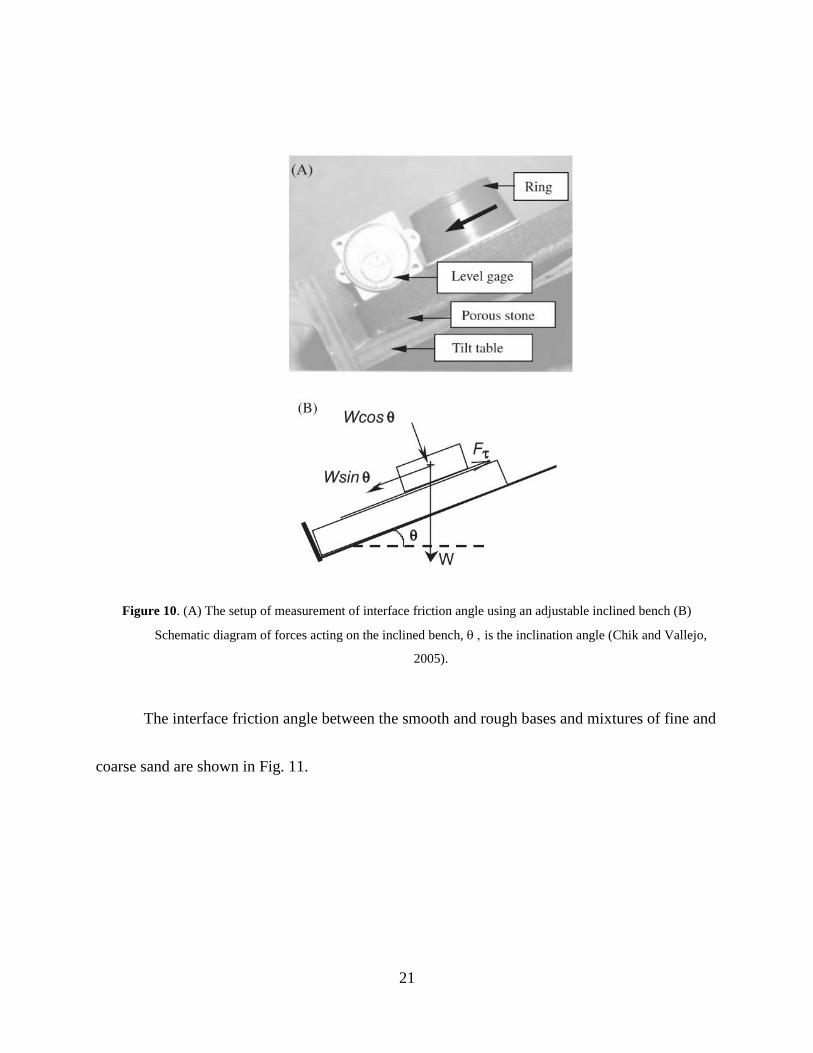
In order to simulate the smooth and rough surfaces on which granular materials could be
deposited, a glass plate was used as the smooth surface, and a porous stone and a wooden table
was used as the rough surface. Fig. 15 shows these bases with gravel being deposited on their
surfaces. Also, the angle of interface friction between the smooth and rough surfaces and the
granular materials (sand and gravel) used in the experiments were measured in the laboratory.
The equipment used for the interface friction angle experiments is similar to the one described in
Section 4.2 of this thesis (Fig. 10), and the procedure used follows that of Chik and Vallejo,
(2005).
(a)

29
(b)
(c)
Figure 15. Different bases used: (a) Glass Plate, (b) Porous Stone, and (c) Wooden table
The interface friction angles measured between granular materials used and the different
bases are shown in Table 4. Table 4 indicates that the interface friction angle, , was influenced
by the roughness of the base in contact with the granular materials. In general, it was found the
rougher the surface is, the larger is the interface friction angle.
Table 4. Interface friction angle between granular particles and different bases
Grain Type Base Type Interface Friction Angle,
(degrees)
Sand Porous Stone 25
Sand Glass Plate 16
Gravel Porous Stone 26
Gravel Glass Plate 15
Gravel Wooden table 22
30
5.3 THE CYLINDERS USED AND THE GENERAL SETUP FOR THE
LABORATORY EXPERIMENTS
In these experiments, particles in the form of sand, gravel or a mixture of the two in the form of
layers were placed in plexiglass cylinders. One cylinder has an internal diameter equal to 5 cm
and a height equal to 17.15 cm [Fig. 16(a)], , the second cylinder had an internal diameter
equal to 12 cm and a height equal to 17.15 cm [Fig. 16 (b)], and the third cylinder had a diameter
equal to 12.5 cm and a height equal to 108.6 cm[Fig. 16(c)]. The thickness of the cylinders was
equal to 5 mm. The cylinders with the granular materials were placed on top of the three
different surfaces. After this was accomplished, the cylinders were lifted manually at different
velocities. The lifting involved two operators, one lifted the cylinders and the granular material
spread over the selected surfaces, the other measured the velocity of lifting using a stop watch.
Two different lifting velocities of the cylinders were used in the experiments. One was a slow
velocity (2 to 3 cm/sec) that simulated the slow release of granular material from the top of a
rock slope and its accumulation at its toe (Fig. 12). The other was a high velocity (7 to 8 cm/sec)
that simulated the high release of granular material from the top of a rock slope and its
accumulation at its toe (Fig. 12). The experiments were conducted using in the cylinders sand
alone, gravel alone, or gravel and sand. When gravel and sand were used, one set of experiments

31
used a mixture of sand and gravel, and the other set of experiments used the gravel in sand in
layers. In the layered experiments, the sand layer was located at the bottom of the cylinder, with
the gravel being located at the top. The sand at the bottom simulated the smaller material that
usually accumulates at the bottom of a granular material and is the result of crushing [Fig. 2(d)].
(a)
(b)

32
(c)
Figure 16. The three different cylinders used in the experimental program
After the material was released from the cylinder, the angle of repose of the accumulated
granular material was measured. The angle of repose was the average of four measurements at
different locations in granular cone that formed after the lifting of the cylinders.

33
6.0 RESULTS FROM LABORATORY EXPERIMENTS
The experiments on the angle of repose formed when cylinders with granular material are lifted
on top of surfaces with varying degree of roughness include: (a) cylinders with sand, (b)
cylinders with gravel, and (c) cylinders with gravel and sand. When sand and gravel were used,
one set of experiments used a mixture of the sand and gravel; the other set of experiments used
the gravel and sand in layers. Next, the results of these experiments are described.
6.1 EXPERIMENTS WITH CYLINDER CONTAINING ONLY SAND
The cylinder with a 5 cm interior diameter and 17.15 cm in length [Fig. 16 (a)] was used for the
lifting-spreading experiments. Two different lifting velocities were used, one was a slow velocity
(2 cm/sec), and the other was a fast velocity (7 cm/sec). The surfaces over which the release of
the sand took place were a smooth, glass plate [Fig. 15(a)], and a rough, porous stone [Fig.
15(b)]. The results of the experiments are shown in Tables 5 and 6.
34
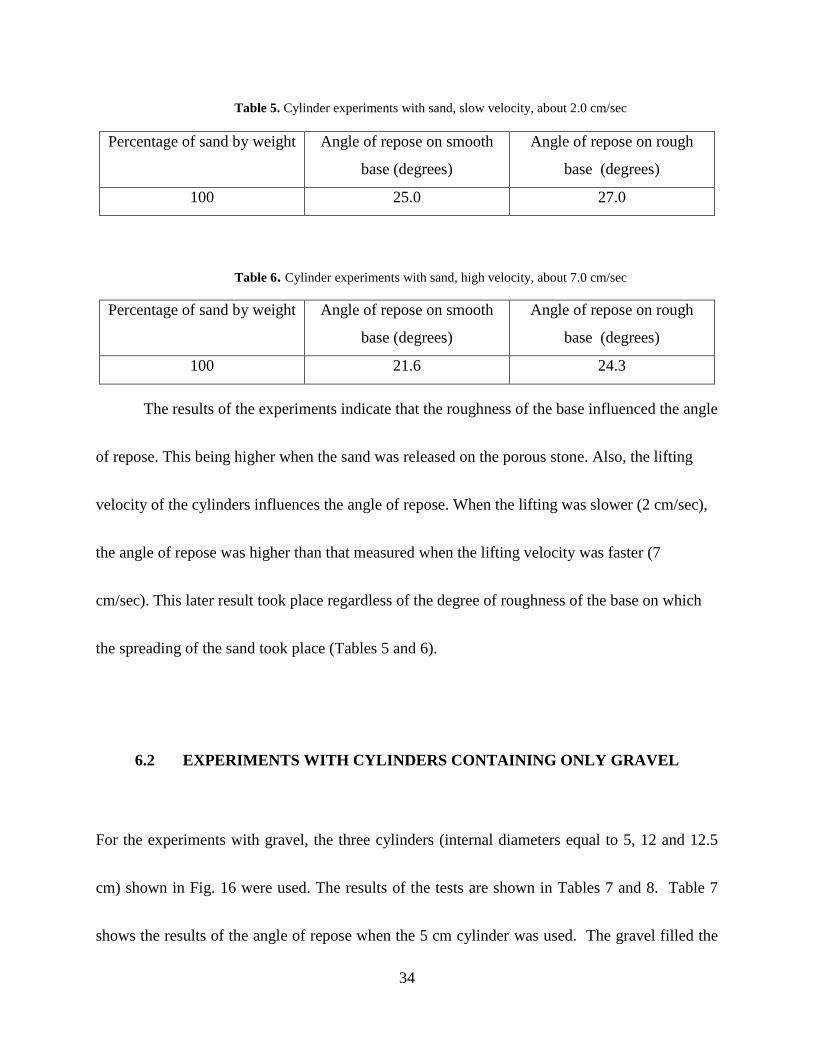
Table 5. Cylinder experiments with sand, slow velocity, about 2.0 cm/sec
Percentage of sand by weight
Angle of repose on smooth
base (degrees)
Angle of repose on rough
base (degrees)
100 25.0 27.0
Table 6. Cylinder experiments with sand, high velocity, about 7.0 cm/sec
Percentage of sand by weight
Angle of repose on smooth
base (degrees)
Angle of repose on rough
base (degrees)
100 21.6 24.3
The results of the experiments indicate that the roughness of the base influenced the angle
of repose. This being higher when the sand was released on the porous stone. Also, the lifting
velocity of the cylinders influences the angle of repose. When the lifting was slower (2 cm/sec),
the angle of repose was higher than that measured when the lifting velocity was faster (7
cm/sec). This later result took place regardless of the degree of roughness of the base on which
the spreading of the sand took place (Tables 5 and 6).
6.2 EXPERIMENTS WITH CYLINDERS CONTAINING ONLY GRAVEL
For the experiments with gravel, the three cylinders (internal diameters equal to 5, 12 and 12.5
cm) shown in Fig. 16 were used. The results of the tests are shown in Tables 7 and 8. Table 7
shows the results of the angle of repose when the 5 cm cylinder was used. The gravel filled the
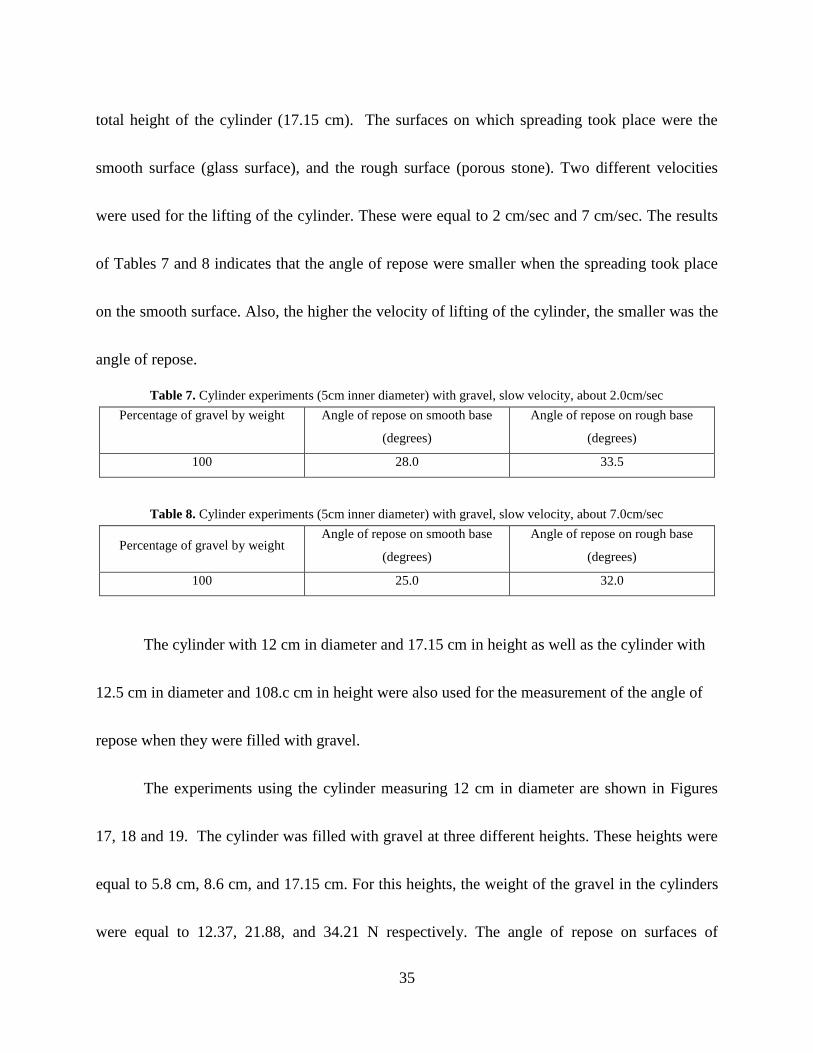
35
total height of the cylinder (17.15 cm). The surfaces on which spreading took place were the
smooth surface (glass surface), and the rough surface (porous stone). Two different velocities
were used for the lifting of the cylinder. These were equal to 2 cm/sec and 7 cm/sec. The results
of Tables 7 and 8 indicates that the angle of repose were smaller when the spreading took place
on the smooth surface. Also, the higher the velocity of lifting of the cylinder, the smaller was the
angle of repose.
Table 7. Cylinder experiments (5cm inner diameter) with gravel, slow velocity, about 2.0cm/sec
Percentage of gravel by weight
Angle of repose on smooth base
(degrees)
Angle of repose on rough base
(degrees)
100 28.0 33.5
Table 8. Cylinder experiments (5cm inner diameter) with gravel, slow velocity, about 7.0cm/sec
Percentage of gravel by weight Angle of repose on smooth base
(degrees)
Angle of repose on rough base
(degrees)
100 25.0 32.0
The cylinder with 12 cm in diameter and 17.15 cm in height as well as the cylinder with
12.5 cm in diameter and 108.c cm in height were also used for the measurement of the angle of
repose when they were filled with gravel.
The experiments using the cylinder measuring 12 cm in diameter are shown in Figures
17, 18 and 19. The cylinder was filled with gravel at three different heights. These heights were
equal to 5.8 cm, 8.6 cm, and 17.15 cm. For this heights, the weight of the gravel in the cylinders
were equal to 12.37, 21.88, and 34.21 N respectively. The angle of repose on surfaces of

36
different degree of roughness and using different lifting velocities of the cylinders are shown in
Table 9 and Figs. 17 to 19. The results indicate that the higher was the level of gravel in the
cylinder; the lower was the angle of repose, regardless of the roughness of the surfaces used and
the lifting velocities. Thus, the weight of the material released seems to affect the value of the
angle of repose.
Table 9. Cylinder experiments (12.0cm inner diameter) with gravel, both slow velocity (about 3.0cm/sec) and high
velocity (about 8.0cm/sec)
Weight of gravel
(N)
Angle of repose on smooth
base, slow velocity
(degrees)
Angle of repose on rough
base,
High velocity
(degrees)
12.37 28.6 22.1
21.88 25.0 19.0
34.21 23.0 16.9
Figure 17. Cylinder experiment (12.0cm inner diameter) with gravel (12.37N), slow velocity

37
Figure 18. Cylinder experiment (12.0cm inner diameter) with gravel (21.88N), slow velocity
Figure 19. Cylinder experiment (12.0cm inner diameter) with gravel (34.21N), slow velocity

38
The angle of repose experiments using gravel were also conducted on the large cylinder
that measured 12.5 cm in diameter and 108.6 cm in height. The heights of gravel in the cylinder
were equal to 20, 40 and 60 cm which corresponded to a weight of about 45.73, 92.87 and
142.34 N respectively. The base used for the experiments was the wooden table base. The lifting
velocity was slow (2.5 cm/sec). The results of the experiments are shown in Table 10 and Figs.
20 to 22.
Table 10. Cylinder experiments (12.5cm inner diameter) with gravel, on wood table with about 2.5cm/sec lifting
velocity
Weight of gravel
(N)
Angle of repose on wood table
(degrees)
45.73 25.0
92.87 16.0
142.34 11.9
Figure 20. Cylinder experiment (12.5cm inner diameter) with gravel (45.73N) on wood table
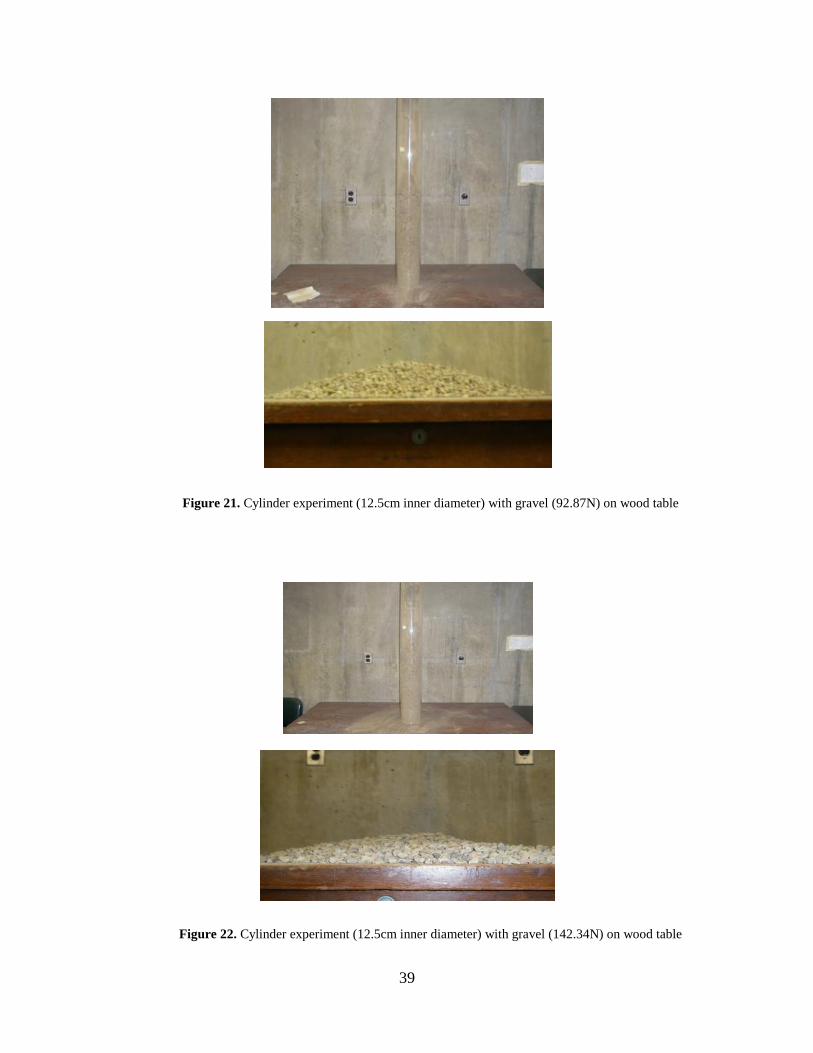
39
Figure 21. Cylinder experiment (12.5cm inner diameter) with gravel (92.87N) on wood table
Figure 22. Cylinder experiment (12.5cm inner diameter) with gravel (142.34N) on wood table

40
An analysis of the results shown in Table 10 and Figs. 20 to 22 indicates that the higher
was the level of gravel in the cylinder; the lower was the angle of repose. Thus, the weight of the
material released from the cylinders seems to affect the value of the angle of repose measured in
the experiments.
When the gravel experiments were conducted using the bigger cylinders (12.0 cm and
12.5 cm inner diameters), the rough base (porous stone) and the smooth base (glass base) were
not used because these bases were too small to hold all the gravel material released by the
cylinders. For this reason, the surface of a big wooden table was used for the experiments (Fig.
20 to 22).
6.3 EXPERIMENTS USING CYLINDERS CONTAINING A MIXTURE OF SAND
AND GRAVEL
Experiments using mixtures of sand and gravel were conducted using the small cylinder (5 cm in
diameter). Mixtures with different proportions of sand and gravel filled the height of the cylinder
(17.15 cm). The different mixtures were released on top of the smooth base (glass plate) and
rough base (porous stone) at velocities equal to 2 cm/sec and 7 cm/sec (Table 11 and 12).

41
Table 11. Cylinder experiments using mixtures with slow lifting velocity (about 2.0cm/sec)
Percentage of sand by weight Angle of repose on smooth
base (degrees)
Angle of repose on rough
base (degrees)
10 20.0 29.5
20 20.7 26.9
30 18.5 23.0
40 22.9 28.5
50 25.1 25.9
60 23.5 27.1
70 24.0 25.9
80 26.5 28.6
90 26.1 25.9
Table 12. Cylinder experiments using mixtures and high lifting velocity (about 7.0cm/sec)
Percentage of sand by weight Angle of repose on smooth
base (degrees)
Angle of repose on rough
base (degrees)
10 17.5 30.5
20 20 24.5
30 18 23.5
40 21 27
50 21.5 25
60 22 26.5
70 26 23.5
80 22.9 24
90 23.5 25.1
An analysis of the results of Tables 11 and 12 indicates that the angle of repose was
influenced by the degree of roughness of the bases used and the lifting velocities of the cylinders.
In general, the results of Tables 11 and 12 indicate that the angle of repose was higher when the
porous stone (rough base) was used. Also, the higher was the lifting velocity of the cylinders; the
lower was the angle of repose, especially for the tests that used the smooth base. Further analysis
will be conducted in Section 7 of this Thesis entitled: Analysis and Application of the Laboratory
Results.

42
6.4 EXPERIMENTS USING A CYLINDER THAT CONTAINS A LAYERED
SYSTEM OF GRAVEL AND SAND
The layered system used in experiments was set up with the 5.0 cm inner diameter cylinder,
place on both the smooth and rough bases. The sand was placed at the bottom of the cylinder
with the gravel on top in order to simulate conditions such as those shown in Figs. 2(d) and 4(b).
Two different lifting velocities were used. One was a slow (2.5 cm/sec) and the other was fast (7
cm/sec). The results of the tests are shown in Tables 13 and 14 and Figures 23 to 28. The
experiments were conducted filling the height (17.15 cm) of the 5 cm cylinder with sand and
gravel. However, three heights of the sand layer were used in the experiments. These heights
were equal to 2.5, 5.0, and 10 cm. The rest of the cylinder height was filled by gravel. The
results of the experiments indicate that the height of the sand layer influenced the value of the
angle of repose regardless of the lifting velocity of the cylinders and the roughness of the bases
used (Tables 13 and 14 and Figs. 23 to 28). The laboratory results indicate that the higher the
height of the sand layer in the samples, the lower was the angle of repose. An explanation for this
result seems to be in the amount of sand in the lower layer. As the amount of sand increases in
the lower layer, the sand controls the angle of repose. As the sand layer decrease in thickness, the
gravel seems to control the angle of repose. Also, as spreading of the grains takes place, the sand

43
grains which are smaller, allow the gravel grains to rotate during spreading. This explains why
the angle of repose of the sample with 10 cm of sand is smaller than the angle of repose
measured in the experiment when the 5 cm cylinder was completely filled with sand (Table 5).
Table 13. Cylinder experiment with layered system (sand at the bottom of gravel) with slow velocity (about
2.5cm/sec)
Height of sand at bottom
(cm)
Angle of repose on smooth
base (degrees)
Angle of repose on rough
base
(degrees)
2.5 24 25
5.0 21 22
10.0 18.5 20.5
Table 14. Cylinder experiment with layered system (sand at the bottom of gravel) with high velocity (about
7.0cm/sec)
Height of sand at bottom
(cm)
Angle of repose on smooth
base (degrees)
Angle of repose on rough
base
(degrees)
2.5 17.1 18.4
5.0 16.1 17.9
10.0 14.2 15.9

44
Figure 23. Cylinder experiments using layered system on smooth base (2.5cm height sand at bottom),
slow velocity

45
Figure 24. Cylinder experiments using layered system on smooth base (5.0cm height sand at bottom),
slow velocity

46
Figure 25. Cylinder experiments using layered system on smooth base (10.0cm height sand at bottom), slow
velocity

47
Figure 26. Cylinder experiments using layered system on rough base (2.5cm height sand at bottom), slow velocity
Figure 27. Cylinder experiments using layered system on rough base (5.0cm height sand at bottom), slow velocity

48
Figure 28. Cylinder experiments using layered system on rough base (10.0cm height sand at bottom), slow velocity
49
7.0 ANALYSIS AND APPLICATION OF THE RESULTS
7.1 MEASURED AND THEORETICAL ANGLE OF REPOSE OF GRANULAR
SYSTEMS ON SMOOTH AND ROUGH BASES
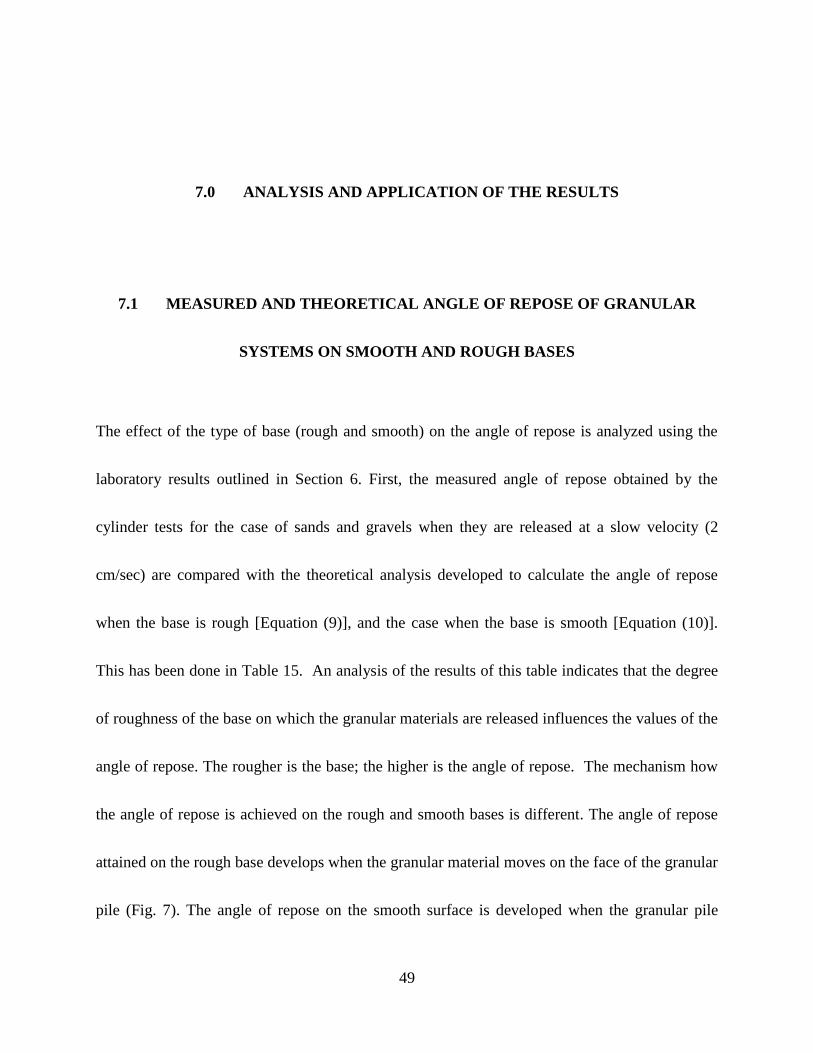
The effect of the type of base (rough and smooth) on the angle of repose is analyzed using the
laboratory results outlined in Section 6. First, the measured angle of repose obtained by the
cylinder tests for the case of sands and gravels when they are released at a slow velocity (2
cm/sec) are compared with the theoretical analysis developed to calculate the angle of repose
when the base is rough [Equation (9)], and the case when the base is smooth [Equation (10)].
This has been done in Table 15. An analysis of the results of this table indicates that the degree
of roughness of the base on which the granular materials are released influences the values of the
angle of repose. The rougher is the base; the higher is the angle of repose. The mechanism how
the angle of repose is achieved on the rough and smooth bases is different. The angle of repose
attained on the rough base develops when the granular material moves on the face of the granular
pile (Fig. 7). The angle of repose on the smooth surface is developed when the granular pile

50
spreads on the smooth surface (Fig. 9). The angle of repose measured in the experiments
compared well with the theoretical ones obtained when one uses Equations (9) and (10).
Table 15. Measured and calculated angle of repose on rough and smooth surface
Material Base Type
Angle of
Internal
Friction,
(degrees)
Interface
Friction
Angle,
(degrees)
Measured
Angle of
Repose, ,
Using
Cylinder*
(degrees)
Calculated
Angle of
Repose, .
(degrees)
Sand
Porous Stone 27 25 27 27 **
Glass Plate 27 16 25 26.5 ***
Gravel
Porous
Stone 34 26 33.5 34 **
Glass Plate 34 15 28 32 ***
* Measured when the lifting velocity of the cylinder was 2 cm/sec
** Calculated using Eq. (9)
*** Calculated using Eq. (10)
The effect of the roughness of the bases was also evaluated using the experiments on
mixtures of sand and gravel and on layered systems of gravel and sand described in Section 6 of
this thesis. The effect the roughness of the bases on the angle of repose is shown in Figures 29 to
32.

51
Figure 29. Comparison of results sand-gravel mixture on different bases with slow velocity (data from Table 11)
Figure 30. Comparison of results for sand-gravel mixture on different bases with high velocity (data from Table 12)
On different bases with slow velocity
y = 0.0015x2 - 0.1874x + 31.437
R2 = 0.4643
y = 0.0012x2 - 0.0826x + 23.68
R2 = 0.2928
10121416182022242628303234
0 10 20 30 40 50 60 70 80 90 100
Percentage of sand
Angle of repose
(Degrees)
smooth base
rough base
On different bases with high velocity
y = 0.0004x2 - 0.0123x + 20.872
R2 = 0.1631
y = 0.0014x2 - 0.1918x + 30.843
R2 = 0.6272
10121416182022242628303234
0 10 20 30 40 50 60 70 80 90 100
Percentage of sand
Angle of repose
(Degrees)
smooth base
rough base

52
Figure 31. Comparison of results for gravel-sand layered system on different bases with slow velocity (data from
Table 13)
Figure 32. Comparison of results gravel-sand layered system on different bases with high velocity (data from Table
14)
The results for the sand-gravel mixtures shown in Figs. 29 and 30 indicates that the
mixtures of sand and gravel developed higher angles of repose when the cylinder tests took place
on a base that was rough (porous stone). Also, these figures indicate that when the mixtures were
on different bases with slow velocity
10121416182022242628
0 2 4 6 8 10
Height of fine sand (cm)
Angle of repose
(degrees)
on smooth base
on rough base
on different bases with high velocity
10
12
14
16
18
20
0 2 4 6 8 10
Height of fine sand (cm)
Angle of repose
(degrees)
on smooth base
on rough base
53
released on a rough surface, the angle of repose decreased with the percentage of sand in the
mixtures. However, when the mixtures were released on a smooth surface, there is a tendency for
the angle of repose to increase with the percentage of sand in the mixtures. According to Chik
and Vallejo (2005), when measuring the angle of repose of a mixture of large (5 mm diameter
glass beads) and small (0.4 mm glass beads) glass beads by releasing them from a funnel into a
glass plate, they found that the higher the percentage of small beads in the mixture, the higher
was the total contact area of the particles with the glass plate. As the contact area between the
particles and glass plate increased, the angle of repose increased (Chik and Vallejo, 2005). The
same seems to have taken place when testing sand and gravel mixtures on the glass plate.
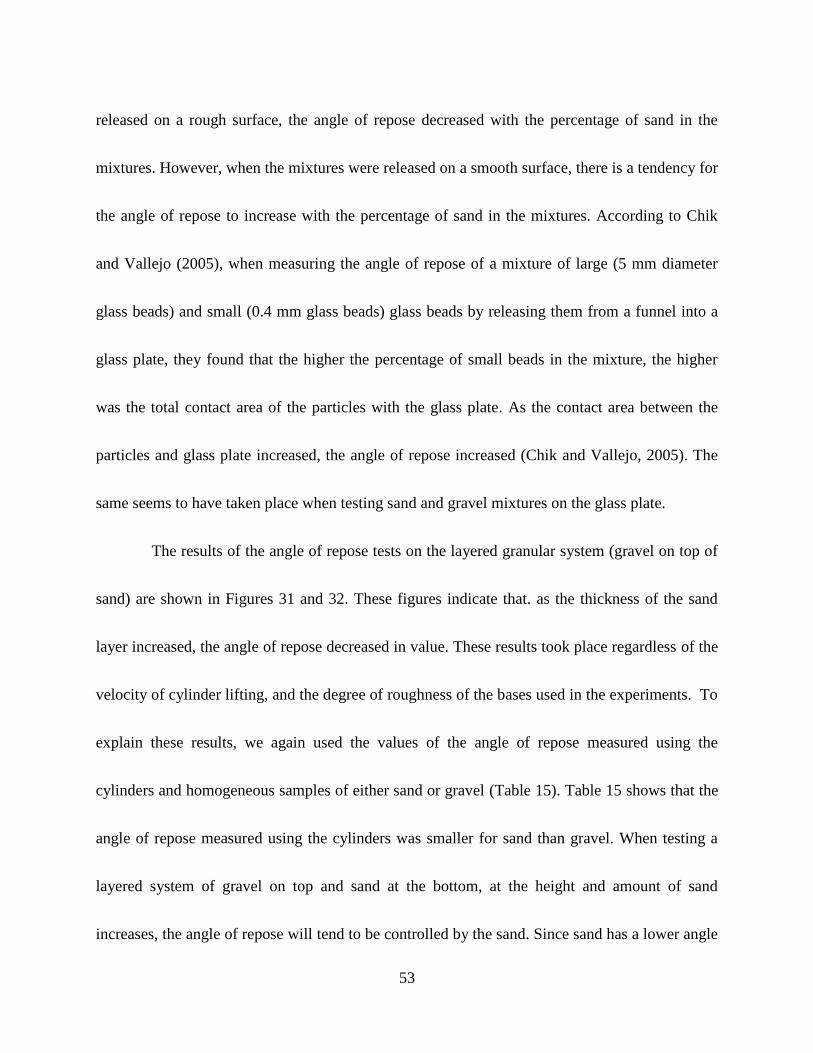
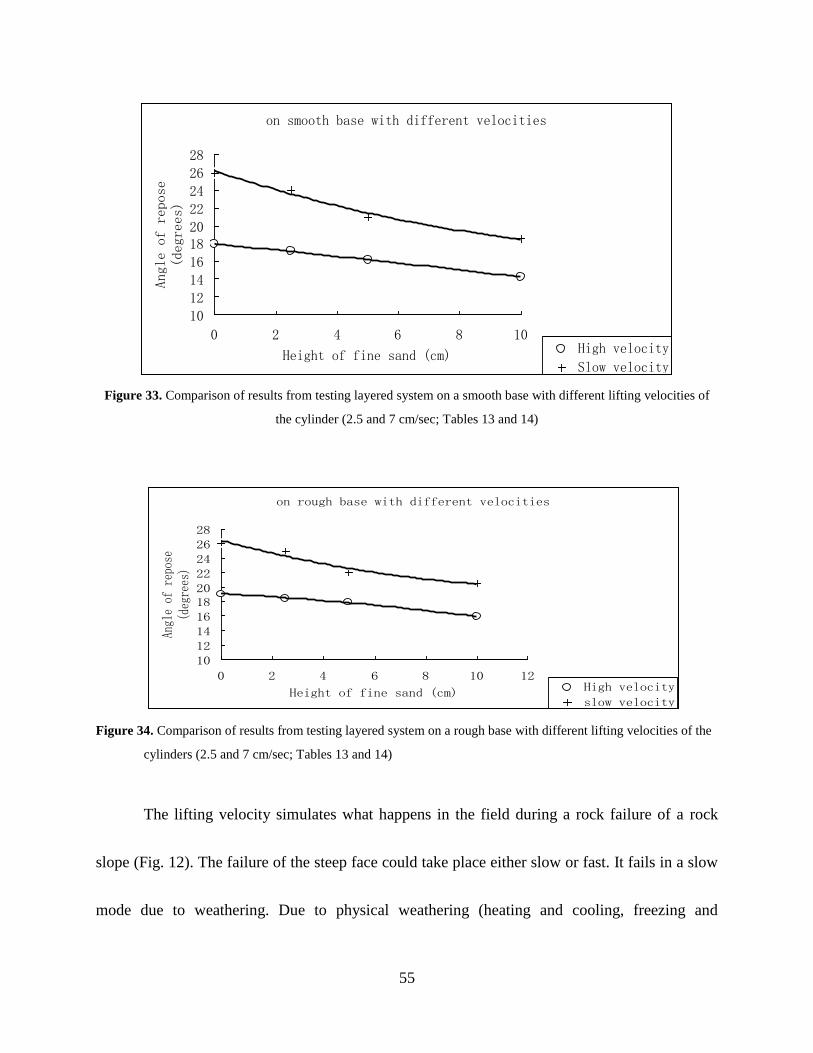
The results of the angle of repose tests on the layered granular system (gravel on top of
sand) are shown in Figures 31 and 32. These figures indicate that. as the thickness of the sand
layer increased, the angle of repose decreased in value. These results took place regardless of the
velocity of cylinder lifting, and the degree of roughness of the bases used in the experiments. To
explain these results, we again used the values of the angle of repose measured using the
cylinders and homogeneous samples of either sand or gravel (Table 15). Table 15 shows that the
angle of repose measured using the cylinders was smaller for sand than gravel. When testing a
layered system of gravel on top and sand at the bottom, at the height and amount of sand
increases, the angle of repose will tend to be controlled by the sand. Since sand has a lower angle

54
of repose than gravel, as the sand increases in height, the angle of repose decreases in value. This
is what Figures 31 and 32 indicate.
How the sand is located in the granular systems (in a mixture form or in a layered form) seems to
also have an effect on the angle of repose. The sand in a layered system (Figs. 31 and 32) has a
more marked influence on the angle of repose than when the sand is a mixture form (Figs. 29 and
30).
7.2 EFFECT OF THE VELOCITY OF LIFTING OF CYLINDERS CONTAINING A
GRANULAR SYSTEM AND ITS APPLICATION
The effect of the lifting velocity of the cylinders on the angle of repose of granular systems can
be explained with the use of Figs. 33 and 34. These figures indicate that as the lifting velocity
increased, the angle of repose decreased regardless of the degree of roughness of the bases used
and regardless of the height of the sand in the layered system.
55
Figure 33. Comparison of results from testing layered system on a smooth base with different lifting velocities of
the cylinder (2.5 and 7 cm/sec; Tables 13 and 14)
Figure 34. Comparison of results from testing layered system on a rough base with different lifting velocities of the
cylinders (2.5 and 7 cm/sec; Tables 13 and 14)
The lifting velocity simulates what happens in the field during a rock failure of a rock
slope (Fig. 12). The failure of the steep face could take place either slow or fast. It fails in a slow
mode due to weathering. Due to physical weathering (heating and cooling, freezing and
on smooth base with different velocities
10121416182022242628
0 2 4 6 8 10
Height of fine sand (cm)
Angle of repose
(degrees)
High velocity
Slow velocity
on rough base with different velocities
10121416182022242628
0 2 4 6 8 10 12
Height of fine sand (cm)
Angle of repose
(degrees)
High velocity
slow velocity

56
thawing), the steep portion of the slope could break slowly and fail at a slow pace after which
accumulates slowly at the toe of the slope (Fig. 12). The steep face of the slope could also fail
very rapidly due to earthquake forces. The broken pieces of the slope face then will accumulate
very rapidly at the toe of the slope. The results of Figures 31 to 34 indicate that the velocity of
lifting the cylinders (that simulate the velocity of failure of the steep face of the slope) has an
influence on the angle of repose for granular materials. The slower the failure (low lifting
velocity of the cylinder), the higher is the angle of repose of granular system (Fig. 12).
7.3 THE EFFECT OF THE WEIGHT OF A HOMOGENEOUS GRANULAR LAYER
ON THE ANGLE OF REPOSE
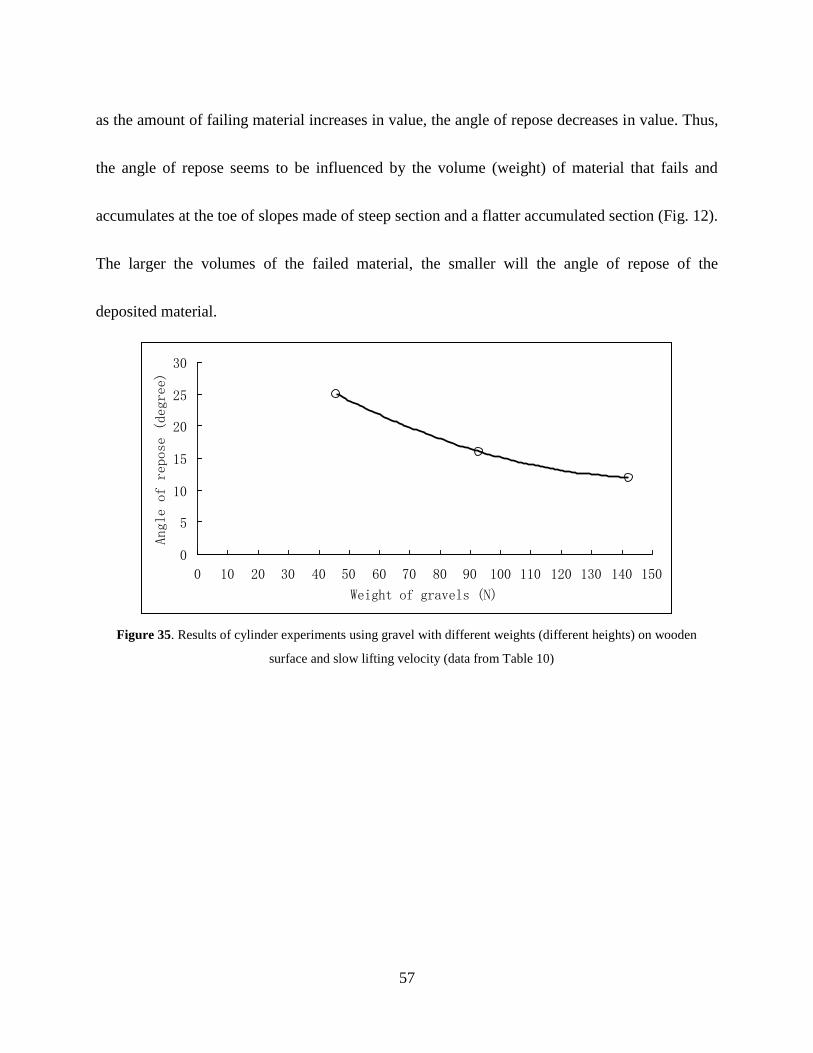
The effect of the weight (height) of the layer of gravel in a cylinder on the angle of repose is
shown in Figure 35. This figure is based on the results of Table 10. Figure 35 and table 10
indicates that as the height (weight) of the granular material increased in the 12.5 cm cylinder,
the angle of repose decreases in value.
This result will help explain what the angle of repose will be in the rock slope in
Figure 12, depending upon the amount of material that fails. Fig. 10 and Table 10 indicates that,
57
as the amount of failing material increases in value, the angle of repose decreases in value. Thus,
the angle of repose seems to be influenced by the volume (weight) of material that fails and
accumulates at the toe of slopes made of steep section and a flatter accumulated section (Fig. 12).
The larger the volumes of the failed material, the smaller will the angle of repose of the
deposited material.
Figure 35. Results of cylinder experiments using gravel with different weights (different heights) on wooden
surface and slow lifting velocity (data from Table 10)
0
5
10
15
20
25
30
0 10 20 30 40 50 60 70 80 90 100 110 120 130 140 150
Weight of gravels (N)
Angle of repose (degree)
58
8.0 CONCLUSIONS
The angle of repose of granular systems was investigated using hollow cylinders of different
diameters and lengths and bases of different degree of roughness. The cylinders contained
homogeneous samples of sand and gravel as well composite mixtures of sand and gravel with the
sand either thoroughly mixed with gravel or in layered systems. The granular materials
developed a conical pile after the cylinders were lifted at two different velocities. From the
laboratory experiments, the following conclusions can be made:
(1) The angle of repose of the granular systems was influenced by the degree of
roughness of the base on which the grains come to rest. It was determined that the rougher the
base was, the higher was the angle of repose.
(2) The mode of failure of the conical pile of grains was different depending if the base
was rough or smooth. For the case of a rough base, the initial lifting of the cylinders caused the
granular material to form first a pile of conical shape. As the lifting of the cylinders continued,
more material was released from the cylinders. This additional material moved on the face of the
59
initially formed conical shape. The conical shape increased in height maintaining, however, its
initial conical shape. For the case of a smooth base, the lifting of the cylinders caused the
granular material to form first a pile of conical shape. As the lifting of the cylinders continued,
more material was released from the cylinders. This additional material caused the original
conical shape to spread and fail over the smooth base. During the spreading, the conical pile of
granular material maintained its shape.
(3) The lifting velocities of the cylinders were varied between a slow velocity (2 to 3
cm/sec) and a high velocity (7 to 8 cm/sec). The angle of repose was found to be smaller when
the high velocity of cylinder lifting was used regardless of the degree of roughness of the bases.
The lifting velocities of the cylinders represent the velocity of failure of a granular material from
the top section of a slope of a composite shape (steep top section, semi-flat lower section).
Failure of the steep section of a slope by physical degradation is always slow. Failure of the steep
section of a slope resulting from seismic loading is always fast.
(4) The angle of repose was also found to decrease in value as the amount of material
contained in the cylinders increased in value. This result reflected field findings that indicated
that the angle of repose of material at the toe of a composite in shape failed slope decreased in
value as the amount (volume) involved in the failure increased in value.

60
(5) The experiments on mixtures of two type of granular material (sand and gravel)
indicated that the angle of repose of these mixtures, when released from the cylinders that
contained them, decreased in value as the percentage of sand in the mixture increased in value. It
seems that as the sand increased in value, it controlled the angle of repose of the mixtures (the
angle of repose of homogeneous sand is smaller than the angle of a homogeneous gravel).
(6) The experiments on layered granular systems (gravel on top of sand) indicated that,
regardless of the lifting velocity of the cylinders, the angle of repose of the layered systems
decreased in value as the height of the sand layer in the composite increased in value (the
composite had a fixed length, the height of the individual sand and gravel layers were made to
fluctuate in value). Since sand has a lower angle of repose than gravel, as the sand increased in
value in the layered system, the sand controlled the value of the angle of repose of the granular
composite.
(7) The results of the tests helped to explain the angle of repose found in rock slopes
made of a steep face and a lower section made of granular material that accumulated after the
failure of the steep section of the slope.

61
BIBLIOGRAPHY
ASTM . “Standard method for measuring the angle of repose of free-flowing mold powders.”
Method C1444-00. In: Annual Book of ASTM Standards, American Society of Testing
and Materials, Philadelphia, 2001, pp. 694-695.
Chik, Z., and Vallejo, L.E. “ Characterization of the angle of repose of binary granular
materials.” Canadian Geotechnical Journal, 2005, pp. 683-692.
Das, B.M. Principles of Geotechnical Engineering. PWS Engineering, Boston, Mass., 1985
Lajeunesse, E., Magney-Castelnau, A., and Vilotte, J.P. “Spreading of a granular mass on a
horizontal plane.” Physics of Fluids, Vol 16, No. 7, 2004, pp. 2371-2381.
Lobo-Guerrero, S., and Vallejo, L.E. “Crushing of Particles Under Simulated Static And
Centrifuge Forces.” GeoFlorida 2010, Fratta, D., Puppala, A.J., and Muhunthan, B.
(editors), Geotechnical Special Publication No. 99, 2010, American Society of Civil
Engineers, New York, CD ROM.
Pierson, T.C. “Classification and hydrological characteristics of scree slope deposits in the
Northern Craigieburn Range, New Zealand.” Journal of Hydrology (N.Z.), Vol. 21, No.
1, 1982, pp. 34-60.
Von Bertalanffy, L. General System Theory. George Braziller, New York, 1969.
Recommended