i | P a g e
2011
gck Consulting Ltd.
Patricia Area Community Endeavours
12/30/2011
MeasuringRetailMarketGravitation

ii | P a g e
Contents
1.0 Project Background and Overview .................................................................................................... 1
1.1 What is Out‐Shopping? ................................................................................................................. 1
1.2 Community Partner Profiles – Who Is Involved? .......................................................................... 2
1.2.1 Dryden ................................................................................................................................... 2
1.2.2 Sioux Lookout ........................................................................................................................ 2
1.2.3 Machin .................................................................................................................................. 3
1.2.4 Ignace .................................................................................................................................... 3
1.3 Study Objectives ........................................................................................................................... 4
2.0 The Retail Market – Where We Are Now? ........................................................................................ 4
2.1 The Effects of Out‐Shopping on the Local Economy ..................................................................... 4
2.2 Who’s Here – Consumers & Businesses ........................................................................................ 6
2.3 Existing Shop Local Incentives ....................................................................................................... 8
2.4 Trade Area ..................................................................................................................................... 9
3.0 Market Research Methodology ...................................................................................................... 12
3.1 Consumer Survey ........................................................................................................................ 12
3.2 Business Operators Survey ......................................................................................................... 13
3.3 Focus Groups ............................................................................................................................... 14
3.4 Interviews .................................................................................................................................... 15
3.5 Retail Market First Impressions Exercise .................................................................................... 16
4.0 Results – What We Heard ............................................................................................................... 16
4.1 The 5Ws of Out‐Shopping Patterns ............................................................................................. 17
4.1.1 Who ‐ Out‐shopper Profile .................................................................................................. 17

iii | P a g e
4.1.2 Why ‐ Reasons for Out‐shopping ........................................................................................ 17
4.1.3 What ‐ Out‐shopping Purchases ......................................................................................... 18
4.1.4 Where ‐ Travel, Online, Catalogue ...................................................................................... 19
4.1.5 When ‐ Most Common Times People Out‐Shop ................................................................. 19
4.2 Positive Attributes of the PACE Region Retail Districts – What Is Going Well ............................ 20
4.3 Negative Attributes of the PACE Region Retail Districts – Where There is Room for Improvement? ........................................................................................................................................ 21
4.4 Gaps in the Retail and Service Sector ......................................................................................... 22
5.0 Gap Analysis .................................................................................................................................... 23
5.1 Target Market ............................................................................................................................. 23
5.1.1 Demographic ....................................................................................................................... 23
5.1.2 Socio‐economic ................................................................................................................... 24
5.1.3 Psychographic ..................................................................................................................... 24
5.2 Competition Analysis ........................................................................................................................ 25
5.2.1 Travelling ............................................................................................................................. 25
5.2.2 Online .................................................................................................................................. 28
5.2.3 Catalogue ............................................................................................................................ 29
5.3 Retail Market Area S.W.O.T. Analysis ......................................................................................... 30
Strengths ............................................................................................................................................. 31
Weaknesses ........................................................................................................................................ 31
Opportunities ...................................................................................................................................... 31
Threats ................................................................................................................................................ 32
5.4 Shop Local Marketing Strategies and Programs ......................................................................... 32

iv | P a g e
5.4.1 Market, Communicate and Talk to your Customers ........................................................... 33
5.4.2 My Card ............................................................................................................................... 34
5.4.3 3/50 Project......................................................................................................................... 35
5.4.4 E‐Marketing ......................................................................................................................... 35
6.0 Recommendations and Conclusion ................................................................................................ 35
6.1 Establish a Shop Local Committee .............................................................................................. 35
6.2 Monthly Workshops for Business Owners .................................................................................. 36
6.3 Monitoring and Evaluation ......................................................................................................... 36
APPENDIX I – Consumer Survey .................................................................................................................. 37
APPENDIX II – Radio Advertisement ........................................................................................................... 38
APPENDIX III – Complete Results of Consumer Survey ............................................................................... 39
APPENDIX IV – Business Operator Survey ................................................................................................... 40
APPENDIX V – Complete Results of Business Operator Survey ................................................................... 41
APPENDIX VI – Focus Group Sessions Questions ........................................................................................ 42
1 | P a g e
1.0 ProjectBackgroundandOverview
The Northwestern Ontario economy has been described as an “economy in transition hit by
extraordinary shocks” (Economic Trends and Issues Analysis for Northwestern Ontario, 2009).
Statistics for 2009 indicate that unemployment figures are on the rise, real gross domestic
product (GDP) growth is down and the crisis in the forest industry continues to cause rippling
effects of economic challenges throughout the region. With 80 percent of mill capacity
shutdown, the catastrophic economic effects can be felt in almost every sector.
The Patricia Area Community Endeavours (PACE) region is not immune to the current economic
trends affecting Northwestern Ontario and, as a result, is prepared to act in support of their
struggling business sectors. The PACE region retail market is an area that has experienced
significant challenges throughout the downturn of the forest industry. Declining populations,
lack of industry and increased unemployment have all resulted in business closures and
weakening sales rendering some downtown retail districts to appear like mere ghost towns.
PACE has decided to respond to this challenge by determining if residents are out‐shopping –
making purchases in larger centres, on‐line or through catalogue sales. By partnering with and
promoting existing businesses in their service area, PACE is hopeful some initiatives can be
implemented to re‐ignite the Northwestern Ontario retail districts. According to small‐ and
medium‐size retail enterprises in the Dryden area, market gravitation is posing a serious threat
to their long term economic viability.
PACE initiated the Measuring Retail Market Gravitation project to determine who out‐shops,
what they purchase, what motivates consumers to out‐shop, where they out‐shop and how are
they out‐shopping. It is anticipated that, armed with this information, PACE can help identify
specific targeted strategies that can help reverse this longstanding trend affecting small‐ to
medium‐sized retail businesses. This project also examined reasons for such behaviour and
why consumers in‐shop to capitalize and build on existing positive attributes of the retail
sectors in the PACE region.
1.1 WhatisOut‐Shopping?
Out‐shopping, also known as market gravitation or market leakage, is the practice of going
outside the local community to buy goods. Out‐shopping is a phenomenon that particularly
affects retailers in small, rural communities. Reasons cited for such behaviour include better
prices, more stores and broader product depth.
Small businesses in rural communities face a number of problems: small market areas; aging
populations; and, limited supply sources are but a few. One of the most vexing problems is the

2 | P a g e
inclination of residents to go outside the community to buy goods. Out‐shopping is particularly
prevalent now with the explosion of big box stores, easy access to major metropolitan areas
and the ease and availability of online shopping.
Out‐shopping can be defined narrowly or broadly. A narrow definition looks only at those who
go outside their local community to make consumer purchases. This would include those who
do so regularly through short trips to communities for shopping purposes or those who travel
longer distances on an intermittent basis, such as shopping done on business or vacation trips.
A broad definition of out‐shopping would include not only in‐person trips to retail
establishments but also online, telephone and catalogue shopping.
1.2 CommunityPartnerProfiles–WhoIsInvolved?
Of the communities serviced by PACE, four out of the eight put their name forward as
interested in participating as a project partner for the Measuring Retail Market Gravitation
project. An overview of the four participating communities is included below.
1.2.1 DrydenThe City of Dryden is the second‐largest city in the Kenora District of Northwestern Ontario,
located on Wabigoon Lake. It is the smallest community in the province of Ontario designated
as a city with a population of 8,195 stretching over 125.7 square kilometres. It and Kenora are
the only two cities in Ontario located in the Central Standard Time (CST) zone. Dryden is where
the rugged beauty of Northwestern Ontario meets the bright lights of city life. It is a vibrant
urban community surrounded by the unsurpassed beauty of the boreal forest, freshwater lakes
and spectacular vistas.
Situated midway between Winnipeg and Thunder Bay, Dryden is secluded yet well connected
by highway, air and a sophisticated wireless network to meet the needs of the most demanding
businesses. Dryden boasts one of the most dynamic economies in Northern Ontario.
1.2.2 SiouxLookout
Halfway between Thunder Bay and Winnipeg, north of the TransCanada Highway, Sioux
Lookout sits nestled on the lakeshores of Pelican, Abram and Lac Seul lakes with the rugged
Canadian Shield as the backdrop. The scenic Municipality of Sioux Lookout boasts a culturally
diverse population of over 5,300 residents in the true "Hub of the North", providing essential
services to 30,000 people in 29 remote First Nations.
Sioux Lookout is a renowned year‐round tourist destination. Visitors and residents alike take
advantage of a wide variety of outdoor recreational and sporting opportunities, including water

3 | P a g e
sports, hiking, cross‐country skiing, snowmobiling and incredible fishing. Sioux Lookout is an
important service centre in the heart of the Patricia region.
Sioux Lookout is on a major growth curve with $200 million in capital projects to be undertaken
over the next five years, including a new state‐of‐the‐art hospital; train station redevelopment
and downtown revitalization; fire attack base; airport expansion; and an increase in serviced
residential, commercial and industrial land.
1.2.3 MachinThe Municipality of Machin is made up of 3 communities all located on beautiful Eagle Lake.
Eagle River, Minnitaki and Vermilion Bay are situated in the heart of Sunset Country on the
TransCanada Highway. Vermilion Bay is located at the start of Highway 105, which leads to Ear
Falls and Red Lake. Approximately 1,200 people call the Municipality of Machin home, known
for its easy living and complemented by its tranquil wilderness setting.
A wide array of services and amenities are provided to the residents, such as shopping, ice
arena, recreation centre, senior citizens activities, two public schools, a Provincial Park, a
volunteer fire department, public beaches, cross‐country ski trails, airport, a number of resorts,
hotels and service businesses and much more.
1.2.4 IgnaceThe Township of Ignace is located in Northwestern Ontario on the TransCanada Highway, 250
kilometres west of Thunder Bay and 450 kilometres east of Winnipeg, Manitoba. Ignace is
located in the heart of what is referred to as Ontario’s Sunset Country, surrounded by an
abundance of lakes, rivers and forest, renowned for their natural beauty and spectacular
scenery. The proximity of the Township to this natural environment provides significant
outdoor recreational opportunities. Many local businesses support tourism, mainly focused on
outdoor activities such as fishing, hunting, canoeing and snowmobiling.
Ignace is recognized as an important business centre in the area, offering a range of general
services supporting the local industry, as well as those travelling through the township. A
number of small businesses, located along the TransCanada Highway corridor, play an
important role in the local economy. Recent announcements from the forest and mining
sectors are providing very positive signals that opportunities for growth exist for the Township.
Announcements regarding the reopening of the local sawmill, establishing a wood pellet
manufacturing plant and the development of an iron ore mine have provided the Township
with a renewed sense of optimism.

4 | P a g e
1.3 StudyObjectives
The purpose of the study was to determine the extent of out‐shopping in the PACE Region, the
types of goods that were out‐shopped, the reasons for out‐shopping and some demographic
indicators that are important to predicting out‐shopping behaviour. Equally important is the
examination of the existing retail and service environment and then measuring the regional
appeal regarding in‐shopping. A thorough analysis of both trends and gaps is an effective tool
that can be used for new business attraction, existing business retention and future investment
in the PACE region.
The study objectives include determining market leakage, collecting baseline data, aggregating
existing data, identifying gaps and examining seasonal trends. The research was then compiled
into a report outlining consumer shopping practices and patterns to be shared with businesses
and the community at large to assist in the diversification of the economy and to strengthen
the local retail market.
2.0 TheRetailMarket–WhereWeAreNow?
The Canadian economy as a whole has been forced to endure many elements given recent
global economic events. The financial crisis of 2008‐2009 has left many people still uncertain
about the future of the economy and now the additional challenge of a steadily increasing
inflation rate just further hampers economic confidence. Other factors that have had an impact
are a surging Canadian dollar and low commodity prices. Based on this information, it is now
more important than ever to pay attention to customer data; carefully collecting, analyzing and
responding to consumer behaviour.
2.1 TheEffectsofOut‐ShoppingontheLocalEconomy
The impact of out‐shopping on local communities has been measured in two ways: based on
the number of shopping trips outside the community in a given year; or, based on the
proportion of shopping income spent outside the local community in a given year, regardless of
the number of trips. While the number of trips was utilized in early research, proportion of
expenditures towards goods and services is the more popular and useful data collection
method for determining extent of out‐shopping today.
The reasons to shop local are powerful and plentiful. The results of a new study suggest that
the key to reversing the long‐term trend of stagnating economies lies in nurturing small, locally‐
owned businesses and limiting further expansion and market consolidation by large
corporations. The research indicates that large firms and corporations consistently and
statistically depress economic growth rates while small, locally‐owned firms have a significant
and relatively large positive effect on income growth and the local economy.

5 | P a g e
Locally‐owned businesses generate as much as two to three times the local economic activity as
do chains (Study Finds Local Businesses Key to Income Growth, 2011). Small‐ and medium‐
sized retail enterprises are defined as those with fewer than 100 employees and large firms as
those with over 500 employees.
The following diagram illustrates how spending your money locally will have a substantial
impact in the betterment and sustainability of your community. This indicates that when you
spend a $100 at a local business, 58 percent more money on average stays in the community
compared to what would have happened if the hundred dollars were spent at a national chain
store.
In addition to an injection of cash back to the local economy through direct, indirect and
induced spending, the chart below shows what could be possible in terms of employment
statistics through a small shift in consumer behaviour to shopping at locally‐owned stores.
This chart was taken from a study conducted by Civic Economics for the Local First Business
Group of West Michigan. The results of the study are quite significant. The chart indicates that
if people in West Michigan shopped just 10 percent more often at local businesses that an
additional 1,600 jobs could be created with wages of $53 million being added to local payrolls if
such a swing in purchasing behaviour could be achieved. The 1,600 additional jobs created
would have been enough to increase employment by one‐half of one percent in 2007. Output
for the county could be increased by $137 million, as well and this benefit would be spread
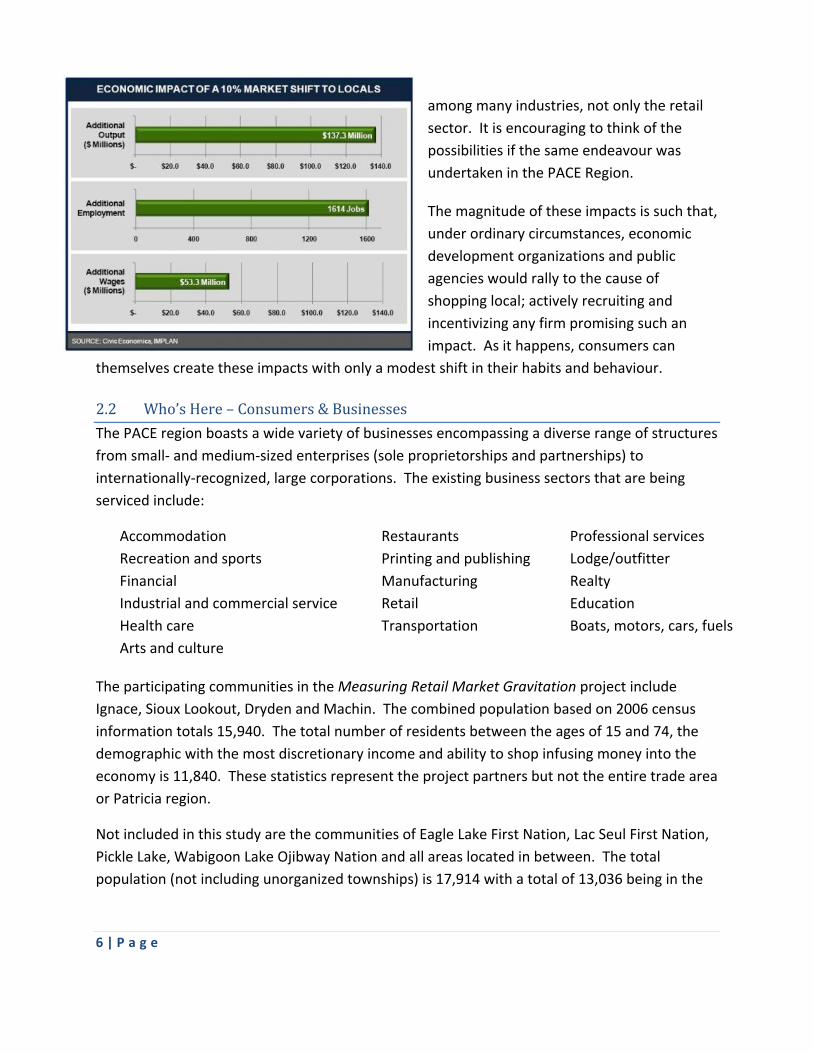
6 | P a g e
among many industries, not only the retail
sector. It is encouraging to think of the
possibilities if the same endeavour was
undertaken in the PACE Region.
The magnitude of these impacts is such that,
under ordinary circumstances, economic
development organizations and public
agencies would rally to the cause of
shopping local; actively recruiting and
incentivizing any firm promising such an
impact. As it happens, consumers can
themselves create these impacts with only a modest shift in their habits and behaviour.
2.2 Who’sHere–Consumers&Businesses
The PACE region boasts a wide variety of businesses encompassing a diverse range of structures
from small‐ and medium‐sized enterprises (sole proprietorships and partnerships) to
internationally‐recognized, large corporations. The existing business sectors that are being
serviced include:
Accommodation Restaurants Professional services
Recreation and sports Printing and publishing Lodge/outfitter
Financial Manufacturing Realty
Industrial and commercial service Retail Education
Health care Transportation Boats, motors, cars, fuels
Arts and culture
The participating communities in the Measuring Retail Market Gravitation project include
Ignace, Sioux Lookout, Dryden and Machin. The combined population based on 2006 census
information totals 15,940. The total number of residents between the ages of 15 and 74, the
demographic with the most discretionary income and ability to shop infusing money into the
economy is 11,840. These statistics represent the project partners but not the entire trade area
or Patricia region.
Not included in this study are the communities of Eagle Lake First Nation, Lac Seul First Nation,
Pickle Lake, Wabigoon Lake Ojibway Nation and all areas located in between. The total
population (not including unorganized townships) is 17,914 with a total of 13,036 being in the

7 | P a g e
15‐74 age categories. This provides a significant catchment area for business owners to market
local goods and services.
The average annual median household income for the participating communities is $62,000.
Although this figure is slightly lower than the provincial median total income of $69,790, when
cost of living is factored in, the two figures are very relative. Trade area personal income,
disposable income and discretionary income are important pieces of information for business
owners to familiarize themselves with as they will help define consumer base and target
market:
Personal income is the sum of all incomes received by residents, including returns for
labour and investments and transfers from the government and other sectors (including
old age security payments and employment insurance); and,
Personal disposable income is the amount left over after payment of personal direct
taxes, including income taxes, contributions to social insurance plans (such as the
Canada Pension Plan contributions and Employment Insurance premiums) and other
fees.
Discretionary income is derived from disposable income and is the amount of an
individual's income that is left for spending, investing or saving after taxes and personal
necessities (such as food, shelter, and clothing) have been paid.
On a current dollar basis, personal disposable
income per capita has increased in every
province and territory over the past decade. It
is a measure of the funds available for personal
expenditure on goods and services and personal
savings for investments, as well as personal
transfers to other sectors of the economy. On a
per capita basis, personal disposable income has
remained relatively constant over the past
decade in most provinces and territories relative
to the national level as shown in the chart to the right. Most provincial and territorial residents
have similar amounts to spend on goods or services or to invest in savings on a relative basis.
Discretionary income includes money spent on luxury items, vacations and non‐essential goods
and services. Higher discretionary income typically leads to higher consumer spending, which
in turn can generate economic activity. Discretionary income is the most difficult of the three
to define as it is a highly subjective concept. What some might consider a necessity is a luxury
8 | P a g e
for others. For example, a car may be a necessity for a mother with young children living in the
suburbs but a luxury for a single woman living and working downtown.
Consequently, any definition of discretionary income in precise statistical terms will be
arbitrary. For the purposes of this report, based on a Statistics Canada document entitled
“Tracking down Discretionary Income,” the definition is that a household has discretionary
income if its after‐tax income is at least 30 percent higher than the average family expenditures
on goods and services. For Ontarian households in 2002, personal disposable income equalled
$23,692.
2.3 ExistingShopLocalIncentives
During the primary research stage of this study, a concerted effort was made to determine
what initiatives and campaigns are currently occurring to promote residents to shop locally.
The consulting team met with local and regional Chambers of Commerce to understand what
programs were already in place. The resounding result was not very much.
There was one popular holiday campaign that the Dryden, Sioux Lookout and Augasabon
Chambers of Commerce did organize in November – Moonlight Madness or Midnight Madness
event. The purpose of this event is to kick‐off the holiday shopping season with local retailer
incentives. Although each one is organized slightly different, the theme, goals and general
layout are the same. Local retailers in the region register with their respective Chamber for a
fee to be a part of the event. Their commitment with registration is that they are agreeing to
stay open late the day of the event and also donate a gift card to their business for a draw. The
role of the Chamber is to address the organizational, advertising and promotional needs of the
event and ensure customers are encouraged to visit their local retail stores.
Shop local events surrounding the Christmas season are the only consistent efforts
concentrating on promoting residents to spend their money in their community. Other
initiatives that the Chambers will support are free annual advertising in their newsletter or
member‐to‐member discounts. Although there are not many campaigns that include multiple
businesses, there are quite a few individual shop local business incentives occurring in the PACE
region. During interviews with various business owners, it was evident that they take it upon
themselves to encourage customers to support their business. These initiatives include:
Excellent service;
Random free coffee days;
Open late for Christmas hours of business;
No sales tax days;

9 | P a g e
Discount days;
Customer loyalty cards; and,
Various other small initiatives.
Other Northwestern Ontario shop local incentives were also researched to understand what
competing communities are doing to help keep their dollars local. At this time, the Thunder
Bay Chamber of Commerce does not organize any events to promote in‐shopping; however,
they also do member‐to‐member discounts and advertising in the newsletter for businesses.
Intercity Shopping Centre invests in various shop local incentives throughout the year. The
most recent being a “Shop Thunder Bay Pays” campaign promoting how it ‘pays’ to shop local.
This promotion encouraged people to be in Intercity Shopping Centre beginning November 24,
2011 holding specific shopping bags for the chance to be chosen by a secret shopper to win
either a $200 or $500 gift card.
Small and easy to implement shop local incentives and promotions can have a big impact on
total sales and the local economy. By taking a more proactive approach and reminding your
customers about the benefits of keeping their dollars local will go a long way in the community.
2.4 TradeArea
Defining trade areas is sometimes more of an art than a science and no one method is always
correct. When deciding how to define trade area, there are questions that must first be asked.
First of all, who are you defining it for? Different businesses have different trade areas. A
neighbourhood store may not have a large trade area while an IKEA location will draw people
from all over.
Even in the same category, different companies will draw from a different trade area. A locally‐
owned food market may serve a district, while people may drive 100 kilometres to shop at a
Wal‐Mart store. Trade areas often extend beyond city or neighbourhood boundaries and come
in a variety of shapes and sizes, depending on the pulling power of a community and local
geography. A business district may serve a number of different trade areas depending on a
variety of factors such as types of products sold or customer market segments served.
Various factors determine trade area(s) including the population of the community and its
proximity to other competing business districts (see Reilly’s Law below). These factors include:
Population of the community: Generally the larger the population of a community, the
bigger the trade area is.

10 | P a g e
Proximity of other competing business districts: Typically, there is a cut‐off point where
customers are drawn to the competing centre instead of the local community.
Mix of businesses in your community: A critical mass of businesses pulls customers
from a further distance than a more limited mix of businesses.
Destination attractions: A significant destination business such as a large discount
department store or a community attraction can expand the local trade area—drawing
customers from a long distance; however, do not assign the trade area of a single
business to the whole community. Rarely do other businesses match the pull of a
prominent destination business.
Traffic patterns: Each region has distinct traffic patterns strongly impacted by its
network of streets and highways.
One popular method of defining market trade area dates back to 1931: Reilly’s Law of Retail
Gravitation, inspired by William J. Reilly. Reilly's Law of Retail Gravitation states that larger
cities will have larger spheres of influence than smaller ones, meaning people travel farther to
reach a larger city. The limitations of the Law are that it presumes the geography of the area
will not alter a consumer's decision of where to travel to buy goods. It also assumes consumers
are indifferent between the actual cities.
The theory explains that the larger a city, the larger a trade area it would have and thus it
would draw from a larger vicinity around the city. Two cities of equal size have a trade area
boundary midway between the two cities. When cities are of unequal size, the boundary lies
closer to the smaller city, giving the larger city a larger trade area.
*distance in the equation is in miles
Reilly called the boundary between two trade areas the breaking point (BP). On that line,
exactly half the population shops at either of the two cities. One can determine the complete
trade area of a city by determining the BP between multiple cities or centers.
We can use Reilly’s equation to determine the breaking point or trade area for the Municipality
of Sioux Lookout to the City of Dryden, two of the project partners. Based on his theory, the

11 | P a g e
trade area for Sioux Lookout is the municipal boundaries plus an additional 27.23 miles or 43.82
kilometre radius outside the boundaries.
Trade areas business districts fall under two major categories: convenience trade areas; and,
destination trade areas. Most small communities encompass only one type of trade area
(primary trade area); however, communities with over 10,000 residents may find it useful to
define both a convenience and a destination trade area.
A convenience trade area is based on the purchase of products and services needed on a
regular basis, such as gasoline, groceries and hair care. Because these purchases are relatively
frequent, people usually find it more convenient to buy these products and services from
businesses located close to their home or workplace. The trade area of a grocery store can
often be used to represent the convenience trade area of a community.
A destination trade area is based on the purchase of ‘major’ products and services, such as
appliances or furniture, or of products and services that are distinctive, such as deeply
discounted products and services. People are willing to travel longer distances to do
comparison shopping and purchase these kinds of items. The trade area of a large discount
department store can often be used to represent the destination trade area of a community.
In addition to differing by types of goods and services, a business district differs in the types of
customers who shop there. Three common market segments are:
Local residents within the trade area, as they reside locally year‐round, they provide the
majority of spending potential for most businesses.
Daytime employees who may live in the trade area or others who commute from other
communities have the potential to make purchases within the trade area during the
workday.
Tourists and second‐home owners can offer a large amount of spending potential.
While they are not permanent residents, tourists obviously shop while visiting the area.
To determine the trade area for the project partners, a more recent recommendation is to
collect address or postal code information from each customer. Trade areas based on actual
customer data have a number of distinct advantages. Combining actual customer addresses or
postal codes with a geographic information system (GIS) allows a business or community to
uncover relationships and perform calculations unavailable with tabular data. A GIS can visually
display where customers are coming from, show how customer concentrations are related over
an area and perform advanced distance‐based calculations.

12 | P a g e
Addresses or postal codes data can be collected using a variety of methods and sources;
however, regardless of how the data is obtained, this method offers a number of advantages,
including:
Collecting information from customers allows the trade area to be based on real
business data, instead of computer models or estimates;
Comparing the trade area maps of different businesses can identify opportunities to
increase market size and penetration. For instance, the trade areas for businesses that
primarily sell convenience items can be compared with each other to identify variation.
These differences could indicate potential market expansion opportunities for some
businesses; and,
Trade areas for different market segments can be compared. Businesses serving
residents can be compared to the origins (or home address) of employees at a major
employer. Furthermore, addresses or postal codes are ideal for tracking the origins of
tourists.
While using customer addresses or postal codes to analyze a trade area has the ability to
capture trade area variability, an appropriate sample of customer lists from participating
businesses must be incorporated. For instance, stores that serve both convenience and
destination shopping segments must understand the local market.
Businesses that serve tourists must be incorporated into the analysis to examine the tourist
market segment. Employee lists from major employers are necessary to explore the daytime
population market segment. This process requires a more significant investment of time and
energy in data collection and analysis; however, the outcomes will provide valuable trade area
and business information for the PACE region.
3.0 MarketResearchMethodology
To obtain a comprehensive and realistic impression of the PACE region retail districts, multiple
modes of primary and secondary research were employed. It was very important to the project
partners to collect a vast array of input and comments from the residents residing in the project
partner communities to ensure relevant and current results. Descriptions of the research
methods employed during the project are described below.
3.1 ConsumerSurvey
The principal goal of the Consumer Survey was to reveal an accurate representation of the
consumer buying habits and trends in the project area. The survey was developed, distributed
and analyzed through SurveyMonkey, the top online survey provider in North America
13 | P a g e
(Appendix 1). In addition to online distribution, the survey was also inserted in the AdBag and
directly delivered to every house in the project area.
The survey was distributed to ensure a proper sampling of surveys was returned from a variety
of distribution outlets. Some of these include:
Online link to the survey from numerous community‐based websites;
Utilization of social media tools such as Facebook;
Paper copy included in the AdBag; and,
Promotional reminders on the radio (CKDR) (Appendix 2).
The survey was 4 pages in length and had 16 questions. The information that was solicited
through the Consumer Survey included:
Demographic information;
Primary shopping habits (e.g. stores in the project area, stores outside the project area,
if so where – online, catalogue or other municipality);
Primary reasons are for their shopping method of choice (price, convenience,
merchandise selection, other);
One thing they would change or add to the local retail environment;
One thing they enjoy about the local retail environment;
What the municipality could do to better promote shop local;
When they shop local, list the main items they are shopping for;
When they out‐shop, list the main items they are shopping for; and,
State how often they shop.
The total number of survey submissions through the various outlets was 561. This represents a
3.5 percent response rate, which did not meet expectations of the project partners. Although
response rates were lower than anticipated, the results solicited through the consumer survey
provided much valuable information and insight into the shopping choices of residents.
3.2 BusinessOperatorsSurvey
The Business Operators Survey was developed, distributed and analyzed solely through
SurveyMonkey (Appendix 3). The survey was designed to gather background information from
businesses on their needs and opportunities, business characteristics and market and
marketing data. The overall goal of the survey was to learn how to make Ignace, Sioux Lookout,
Dryden and Machin a more profitable place to do business.

14 | P a g e
Questions were grouped in the following categories:
Background information on each business;
Satisfaction with their downtown core and future plans;
Business sales patterns, seasonality and events;
Importance of various consumer segments;
Advertising and promotion effectiveness;
Preferences for new businesses in the PACE region; and,
Ways to improve downtown as a place to do business.
The survey was distributed through a targeted approach in a direct email to business owners.
To achieve better response rates, the Dryden and Sioux Lookout Chambers of Commerce and
the Ignace Area Business Association (IABA) were approached to garner additional direction
and support. Additional surveys were also completed one‐on‐one with business owners during
the interview method stage.
The survey was 5 pages in length and consisted of 21 questions. The survey was still very easy
to complete as the first 7 questions were demographical in nature regarding the business. The
survey was emailed directly to approximately 65 different businesses in the study area and 30
surveys were submitted representing a good sample of the businesses that were approached.
3.3 FocusGroups
A focus group is an interactive session with a group of approximately 8‐10 people where
participants are asked about their perceptions, opinions, beliefs and attitudes towards a
product, service, concept or idea in an open discussion forum. Focus groups were part of the
project methodology to candidly engage in dialogue with the participants and business owners,
gather feedback on their perspective of the local retail market, their personal buying habits and
their suggestions on what to improve and how to improve it.
Focus groups are most successful with a diverse audience to participate in providing comments
and feedback from a variety of demographics. In an attempt to achieve this, seven different
organizations and more than 50 businesses were personally contacted and invited to
participate in a focussed session regarding out‐shopping in their region. Unfortunately,
response rate was low.
Of the 50 businesses contacted, only one business responded and of the seven organizations,
only 3 were able to accommodate the request; therefore, three focus groups were completed
with the Ignace Area Business Association, Dryden Chamber of Commerce and Sioux Lookout
15 | P a g e
Chamber of Commerce. The focus group was designed to minimize the time commitment from
participants and maximize the knowledge and resources gained by asking them to wear two
hats: one as a business owner (all participants were small business owners); and, the other as a
consumer. To view the questions posed during the focus groups sessions, see Appendix 4.
Although focus group response rates were lower than anticipated, the information collected
was very valuable and well‐thought.
3.4 Interviews
One‐on‐one interviews were conducted with various local small business owners to collect their
perception of conducting business and the business environment in their community.
Approximately ten businesses were randomly approached with six being able to accommodate
an on the spot interview. The interview was guided in a manner that the following information
would be gathered:
Who their consumers are;
Trends they have witnessed regarding out‐shopping and in‐shopping;
Promotions and tools they have used to encourage in‐shopping and success rates of
those programs;
Who they believe their main competitors to be and why;
Current versus demand hours of operation; and,
Identification of what can be improved.
One‐on‐one interviews were a great way to collect information directly from the people who
work in the PACE region business environment. For the most part, business owners were very
receptive to participate in an interview and provide feedback that was sincere and honest.
Business owners and managers that graciously provided their time for the purposes of this
report were as follows:
Harvey and Linda, owners of the Bootlegger retail store in Sioux Lookout;
Nancy Roy, owner of Roy Lane coffee shop in Sioux Lookout;
David Durance, owner of Kano Reid coffee shop in Dryden;
Christine Hoey, owner of Sioux Travel, travel agency in Sioux Lookout;
Lesley Starrat, manager of Cheers! Gift store in Sioux Lookout; and,
Linda, clerk at Bragg’s retail store in Ignace.

16 | P a g e
This method of information gathering is the most time consuming but also the most
worthwhile. Businesses truly appreciated being approached for input and were provided with
an outlet to voice their opinions concerning the local business environment.
3.5 RetailMarketFirstImpressionsExercise
This form of market research is classified as an observation technique. The Retail Market First
Impressions exercise mimics the provincially‐approved program entitled First Impressions
Community Exchange. First Impressions Community Exchange is a structured process that
reveals the first impression a community conveys to outsiders, including tourists, potential
investors and retirees. It offers a fresh perspective on the appearance of the community,
services and infrastructure and helps communities learn about their strengths and
shortcomings.
Although similar, the Retail Market First Impressions exercise was modified to suit the needs of
the project. Similar to a ‘secret shopper’ approach, a member of the consulting team who was
relatively unfamiliar with the project partner communities travelled through the retail districts
documenting first impressions based on previously identified criteria. The goal of the exercise
was to get a completely unbiased perspective on what new consumers to the community see
when they are in your retail districts.
The experience was ranked in five different categories consisting of:
Infrastructure and ease of navigation;
Facilities, services and amenities provided;
Visual appeal and sense of welcome;
Community spirit and safety; and,
SWOT analysis.
The second goal of this exercise was to get a candid view of service levels, price points, hours of
operation and merchandise selection provided by the stores. By simply walking into stores as a
consumer and observing the surrounding environment, a true picture comes together on what
is being done well and what areas need improvement. The results from this exercise can be
found in Section 5.3.
4.0 Results–WhatWeHeard
Following the extensive information gathering stage, an in‐depth analysis of the data was
conducted. The analysis process consisted of trend spotting, cross‐tabulation and finding and
17 | P a g e
interpreting patterns. Below is the input provided by the residents that participated in the
research stage.
4.1 The5WsofOut‐ShoppingPatterns
4.1.1 Who‐Out‐shopperProfile
Through data analysis of survey responses, 43 percent indicated they shop outside the PACE
region at least once a month. From that data, the following profile of who they are can be
derived. The typical out‐shopper tends to be between the ages of 25 to 44, affluent with an
annual household income of greater than $75,000 and mainly reside in the Dryden area (60
percent of total respondents identified themselves as Dryden residents). The last point can also
be attributed to the higher population in Dryden compared to the other project partners and
the likelihood that more residents from Dryden completed the survey.
Although not directly asked within the survey, a research paper conducted by Frostburg State
University in Maryland entitled ‘The Effects of Out‐shopping on a Small Rural Community: The
Importance of Relationships’ indicates that in addition, the typical out‐shopper is likely to be
more self‐confident and physically fit, have a less positive image of the local area and be an
opinion leader in the community. The impact of home ownership, size of household, number of
children, education and tenure in the community on a person’s propensity for out‐shopping is
mixed, and, consequently, not conclusive. Gender was almost split down the middle; therefore,
been found to be insignificant in predicting such behaviour. Research reports that older
consumers tend toward higher levels of in‐shopping due to stronger ties to their local
community.
Although this person is most commonly an out‐shopper in your community, this same profile
encompasses the person who is also most often in‐shopping. Of the people who identified
themselves as out‐shopping at least once a month, that same group of people identified
themselves as shopping within the Patricia District almost every day, generally in Dryden. The
information provided through the consumer survey suggests that the typical out‐shopper can
be persuaded to spend their money locally with the right marketing mix, as they are already in‐
shopping on a regular basis. The elements of the local shopping experience they enjoy the best
are convenience and the opportunity to support local business.
4.1.2 Why‐ReasonsforOut‐shoppingThe number one reason for out‐shopping includes lack of shopping options in the community
and minimal product depth and breadth of those retail establishments that do exist with 85
percent of respondents agreeing across every category. There is no variance in responses

18 | P a g e
between males and females with only a point‐ or two‐difference in every reason category or in
age brackets. The second and third top reasons for out‐shopping were price and service,
respectively. Some specific comments that were made regarding this question are as follows,
“my size of clothing is hard to find”, “items not available locally” and “prices are much lower
elsewhere”.
4.1.3 What‐Out‐shoppingPurchases
Out‐shopping purchases tend to be for higher visibility, higher status shopping and specialty
products. Research indicates that clothing and footwear for both males and females are the
most commonly sought after items while out‐shopping to all destinations; however, housing
goods were also ranked very high for people when they are travelling to the United States to
shop. Respondents from the Township of Ignace also identified electronics as tied for clothing
in the number one item purchased while out‐shopping. Other common items that were stated
as generally out‐shopped for include housing goods, building supplies and specialty items.

19 | P a g e
4.1.4 Where‐Travel,Online,Catalogue
Of the 98 percent of respondents that identified themselves as shopping outside the PACE
region at least once per year, the most common method in doing so was travel, followed by
online shopping and lastly catalogue shopping. Winnipeg is the city that is visited most often
for shopping and purchasing clothing is the most popular reason for wanting to shop there. The
out‐shopper was identified as female 75 percent of the time. These statistics are true for all
out‐shoppers who identify themselves as out‐shopping anywhere from monthly to yearly.
For the respondents that identified themselves as out‐shopping weekly, the data changes.
Firstly, there is an even split between male and female and this out‐shopper falls within a
younger demographic. The most preferred method of out‐shopping is online with electronics
as the top item purchased. Of the people that did indicate travel as their preferred method of
out‐shopping, the preferred location is Thunder Bay. Selection was the leading factor for all
out‐shoppers but the weekly out‐shoppers also had price tied in the top spot.
4.1.5 When‐MostCommonTimesPeopleOut‐Shop
Overall, travelling to shop within another region was selected 88 percent of the time as the
most common method of out‐shopping. The purpose for travel was primarily identified as the
travel experience followed by business purposes. This out‐shopper is most often female,
resides in Dryden and is between the ages of 45 and 64. The travel generally occurs several

20 | P a g e
times per year, is not specifically to out‐shop but when shopping, the most common items to
purchase are clothing. Besides travel for experience or business, the other common times
people are shopping outside the region are when they have to travel to visit family and friends,
for medical appointments or Christmas shopping.
4.2 PositiveAttributesofthePACERegionRetailDistricts–WhatIsGoingWell
Although the majority of survey respondents identified themselves as out‐shopping at least
yearly, there were many positive results about shopping habits and environment that were
solicited from the survey. People in the PACE region understand how shopping locally benefits
the economy and community as a whole. When asked the questions, “How important is it to
you shop local?” and “How would you rate
the overall economic benefits of shopping
local to your local community?”; the top
responses were important and very
important, respectively.
In addition to this point, one of the leading
reasons indicated by respondents for in‐
shopping is to support the local economy with
the other being convenience. Ninety percent
of respondents also indicated that if some
improvements concerning merchandise
selection, price and service were made; they would be more likely to shop local more often. It

21 | P a g e
is important for business owners and municipal leaders to understand this data as it indicates
that increased shop local campaigns and events would most likely have a positive impact on
consumers.
During the focus group and interview sessions, when participants had an opportunity to
specifically identify stores where they routinely receive sub‐par customer service, the
businesses most often mentioned national and international corporations. Businesses such as
Canadian Tire, Wal‐Mart, Tim Horton’s and A&W were all brought up as not meeting service
standards.
The comments regarding service in the local businesses were mostly positive. Service is one
component of the shopping experience that local businesses have the opportunity to excel in.
Consumers understand that, as a small local business owner, it is sometimes not always
possible to carry the largest merchandise selection or be able to charge discount store prices;
however, excellent service throughout the shopping experience is enough to persuade the
customer to continue to shop local.
From the perspective of the business owner, 50 percent of respondents indicated that in the
previous 12 months their sales had increased with an additional 20 percent indicating sales had
remained the same. Figures like this renew optimism in the economy and may even encourage
entrepreneurs to open a new business and for consumers to open their wallets.
Another positive point that surfaced from business owners was their perception of support
received from community leaders. During the interviews and focus groups, business owners
were asked “How can community leaders better support the long term success of your
business?” The majority of business owners responded by saying they feel they received
adequate support from their municipal leaders. This fact helps to establish a positive business
environment, which is a great selling feature when trying to attract new businesses and
investment to the community.
4.3 NegativeAttributesofthePACERegionRetailDistricts–WhereThereisRoomforImprovement?
Although many strengths of the PACE region retail districts were identified in the previous
section, there unfortunately are also some weaknesses that need to be directly addressed in
order to progress. Although consumers have adequate knowledge and understanding of the
benefits of shopping local, there needs to be a better appreciation of it based on their shopping
habits.

22 | P a g e
The majority of respondents indicated that even though they know the benefits of shopping
local, when they are going to out‐shop; it is not important to them to shop within Northwestern
Ontario. Another alarming result from the survey is that when asked “What do you like best
about your local retail district?”, a total of 20 people indicated that there is “absolutely nothing
good about their local shopping area”.
As for a positive attribute, it was indicated that people would be willing to shop local more
often if there were improvements made to selection, price, service and hours of operation.
Although the latter part of that statement is a positive, the fact that a third of respondents
indicated all those factors as needing improvement is not a positive sign. Also distressing is the
fact that merchandise selection, price, service and hours of operation are the most essential
factors that go into making the shopping decision. Making the required improvements to all
these areas in meeting the satisfaction of the consumer will be a daunting challenge.
Another element identified as an area for improvement that will be easier to address is
business support. Some business owners expressed interest in having grants or loan
opportunities made more available. It was suggested that further incentives should be
provided to business owners regarding expansion or store front improvements and reducing
the red tape in the process of starting a new business. For example, some municipalities have
business license requirements that may hinder a home‐based business from initiating
operations.
The final area for improvement identified by both business owners and consumers is to invest
more care into the business, customers and community. The lack of spirit and energy felt by
residents in the PACE region in regards to the business environment is affecting all areas of the
shopping experience and, in turn, prompting people to out‐shop. Consumers want to be
communicated with, listened to and felt valued by their local businesses. Having a business
community that is proud and excited to be there could alone improve the consumer complaints
regarding service and hours of operation and, in the end, put more money back into the
business.
4.4 GapsintheRetailandServiceSector
With selection being the primary reason people choose to out‐shop; it was necessary to
determine more specifically what they are looking for in selection and how that could be
achieved. In other words, the gaps in the retail and service sector needed to be identified from
the local consumer perspective. While directly meeting with area consumers during the
primary research stage of the study, the question was asked “Merchandise selection was
identified as the number one reason for out‐shopping by consumers. If you could add three

23 | P a g e
new stores to your local retail district, what would they be?” The most popular responses
were:
Plus size women’s clothing store;
Petit size women’s clothing store;
Craft store;
Fine dining;
Organic and specialty foods;
Big chain retail stores and restaurants (e.g. Winners, Home Depot, etc.); and,
Dollar store.
Another interesting gap that was identified several times was the lack of existing stores having
a website or online purchasing capabilities. Along these same lines is lack of online store and
product reviews on merchandise available for consumers. With the Internet being the fastest
growing shopping outlet in the world, it is imperative that merchants in the PACE region offer
this feature to their consumers. The Internet is beginning to pose the greatest competition to
traditional stores (addressed in more detail in section 5.2) and opportunities will be missed if it
is not built into the businesses within the PACE region.
5.0 GapAnalysis
The primary and secondary costs to local communities of residents out‐shopping are vast. To
mitigate some of those costs, a gap analysis has been conducted to begin developing a strategy
to combat some of the effects. The information presented within this section can be utilized in
the future development of a strategic marketing plan for a shop local campaign.
5.1 TargetMarket
A target market can be defined as a segment of consumers that is most likely to purchase the
products and services offered by a particular retailer. When defining the target market, retail
organizations generally identify demographic, socioeconomic and psychographic
characteristics. This data is then utilized to focus and guide marketing, advertising, promotion
and merchandising efforts. Each individual business will have a unique and distinct target
market based on product or service selection. This section will try to identify who the target
market is to run a successful shop local campaign in the PACE region.
5.1.1 Demographic
The demographical target market for the retail districts and markets within the communities of
Ignace, Sioux Lookout, Dryden and Machin are comprised of the almost 16,000 people that

24 | P a g e
currently reside there. A shop local campaign would target people within the region; classifying
these individuals as the primary target market. A primary target market is the segment of a
marketplace that a business believes will give it the best chance to sell.
The secondary target market includes future primary buyers, which are those buying at a higher
rate within a small market segment and are those who influence primary buyers. Their
characteristics and buying behaviours usually differ from those of the primary target market.
The secondary target market, in the case of a shop local program, would be tourists, young
people, transient workforce, seasonal residents and high‐use local out‐shoppers.
5.1.2 Socio‐economic
Through survey analysis, the typical socio‐economical description of the PACE out‐shopper is
between the ages of 25 and 44, affluent with an annual household income of greater than
$75,000 and mainly resides in the Dryden area. Additionally, research points that the typical
out‐shopper is likely to be more self‐confident and physically fit, have a less positive image of
the local area and be an opinion leader in the community. The impact of home ownership, size
of household, number of children, education and tenure in the community on a person’s
propensity for out‐shopping is mixed, and consequently, not conclusive. Gender was almost
split down the middle; therefore, is insignificant in predicting such behaviour.
5.1.3 PsychographicPsychographic variables are any attributes relating to personality, values, attitudes, interests or
lifestyles. Some of this data can be derived from the primary research analysis, including shop
local values and attitudes. The majority of people in the PACE region understand the benefits
of shopping local; however, when deciding where to out‐shop, remaining in Northwestern
Ontario is mostly unimportant. Many of these communities also have relatively large transient
and seasonal populations making it difficult to instil local values and pride in them for the short
period they are residing within the community. It is these values and attitudes that must be
addressed and modified in order to see great success with a shop local program.
Effective diagnosis of the target market is the key to success for any business or shop local
event. People are not going to buy from a business or attend a shop local event if they don’t
know about it. Target market analysis and identification can be completed in several ways. As
is the case with this project, a survey can be utilized to collect data. Another method that may
be more valuable for determining primary and secondary target markets along with
demographic, socioeconomic and psychographic factors is postal code input. Maintaining an
online database of the postal code for every person who enters a business provides access to

25 | P a g e
additional data such as household spending and frequency, most common items purchased and
more.
The organization most suited to take the lead on a shop local initiative is PACE. With a mandate
and commitment to promote economic growth within the Patricia region of Northwestern
Ontario, PACE has unprecedented access to the markets, regional data and statistics, resources
and vision that will lead to a successful shop local campaign. Through the formation of an ad
hoc committee involving interested members, PACE has an opportunity to be the driving force
in implementing a region‐wide shop local program.
An example of how a similar program has been successfully implemented in another
Northwestern Ontario district is with the Rainy River Futures Development Corporation
(RRFDC). Rainy River area municipalities recently launched a campaign to stimulate local
spending and protect local jobs. With support from Northern Ontario Heritage Fund
Corporation, the RRFDC is working with local business partners on a 'Go Local' campaign to
keep economic activity and jobs in the region. The marketing initiative will promote themes
such as Eat Local, Shop Local and Play Local, and will include a rewards card program to
encourage local spending. Local consultant Tanis Drysdale explained how the program will
encourage local spending, “it’s really a program that can provide market research information
to small‐ and medium‐sized businesses, and can help local and independent retailers compete
in the big world of the Internet and out‐shopping and massive corporate retail giants,”
5.2CompetitionAnalysis
The communities encompassing the PACE region are all considered small rural towns based on
population figures and are in proximity to larger centres; therefore, the competition facing local
retailers is fierce. In many cases, the ability to attract large box stores or carry a wide collection
of merchandise is not feasible as the revenue potential is not there. The top areas of
competition for the local retail districts identified during the research stage of the study
consists of travelling to shop in a larger city centre, online shopping and catalogue shopping.
The competitive factors for these three methods are discussed below.
5.2.1 TravellingThe PACE region borders the Thunder Bay District to the east, the Manitoba border to the west
and the Minnesota border to the south. Shopping options in all three destinations offer a much
greater range of stores and merchandise selection at a variety of price points, which are
appealing to a larger market.
26 | P a g e
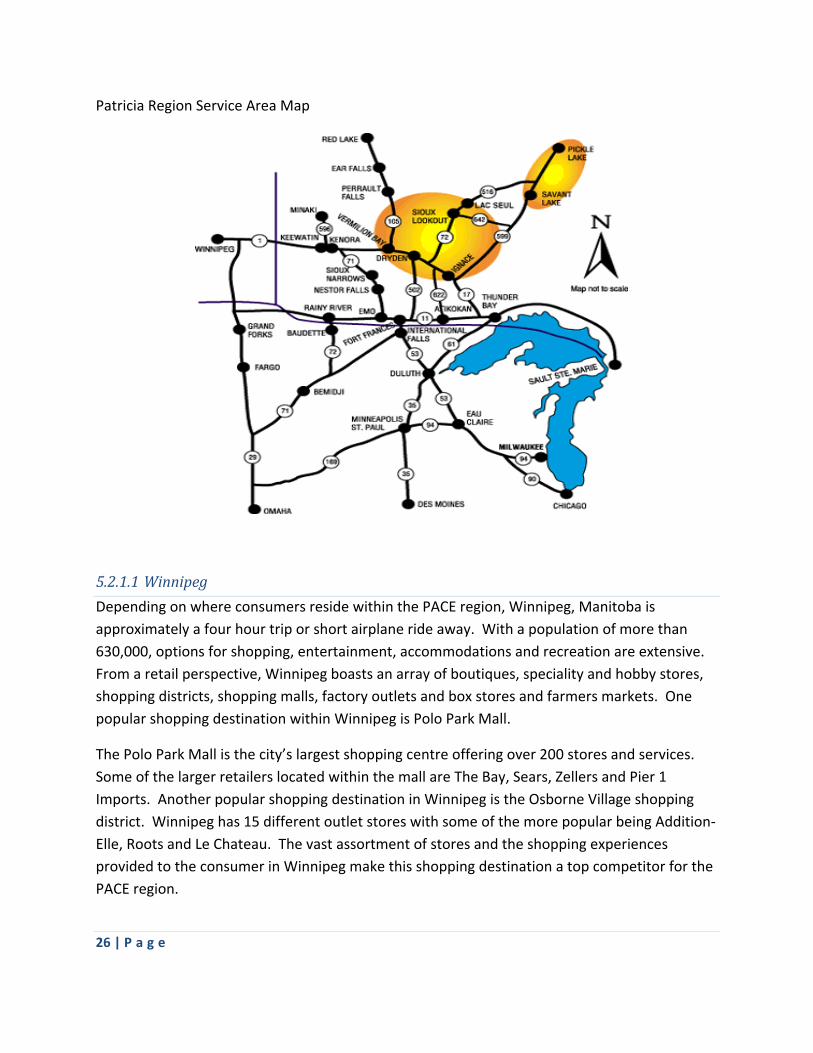
Patricia Region Service Area Map
5.2.1.1Winnipeg
Depending on where consumers reside within the PACE region, Winnipeg, Manitoba is
approximately a four hour trip or short airplane ride away. With a population of more than
630,000, options for shopping, entertainment, accommodations and recreation are extensive.
From a retail perspective, Winnipeg boasts an array of boutiques, speciality and hobby stores,
shopping districts, shopping malls, factory outlets and box stores and farmers markets. One
popular shopping destination within Winnipeg is Polo Park Mall.
The Polo Park Mall is the city’s largest shopping centre offering over 200 stores and services.
Some of the larger retailers located within the mall are The Bay, Sears, Zellers and Pier 1
Imports. Another popular shopping destination in Winnipeg is the Osborne Village shopping
district. Winnipeg has 15 different outlet stores with some of the more popular being Addition‐
Elle, Roots and Le Chateau. The vast assortment of stores and the shopping experiences
provided to the consumer in Winnipeg make this shopping destination a top competitor for the
PACE region.
27 | P a g e
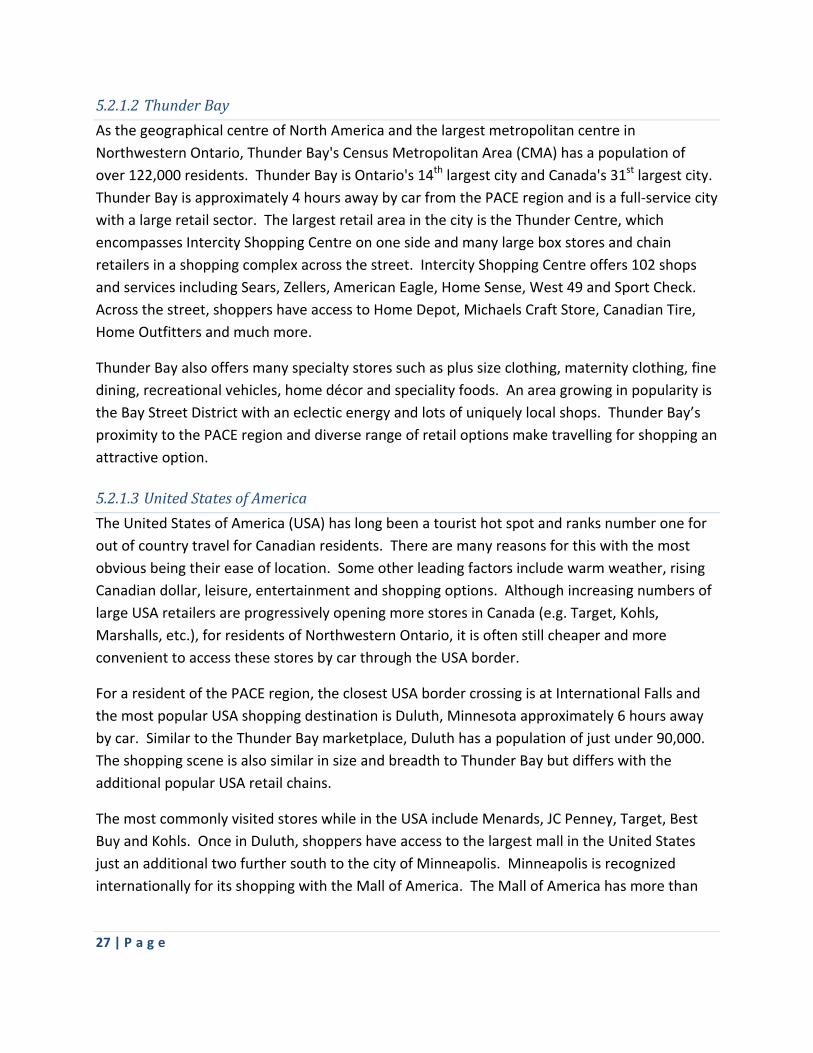
5.2.1.2ThunderBay
As the geographical centre of North America and the largest metropolitan centre in
Northwestern Ontario, Thunder Bay's Census Metropolitan Area (CMA) has a population of
over 122,000 residents. Thunder Bay is Ontario's 14th largest city and Canada's 31st largest city.
Thunder Bay is approximately 4 hours away by car from the PACE region and is a full‐service city
with a large retail sector. The largest retail area in the city is the Thunder Centre, which
encompasses Intercity Shopping Centre on one side and many large box stores and chain
retailers in a shopping complex across the street. Intercity Shopping Centre offers 102 shops
and services including Sears, Zellers, American Eagle, Home Sense, West 49 and Sport Check.
Across the street, shoppers have access to Home Depot, Michaels Craft Store, Canadian Tire,
Home Outfitters and much more.
Thunder Bay also offers many specialty stores such as plus size clothing, maternity clothing, fine
dining, recreational vehicles, home décor and speciality foods. An area growing in popularity is
the Bay Street District with an eclectic energy and lots of uniquely local shops. Thunder Bay’s
proximity to the PACE region and diverse range of retail options make travelling for shopping an
attractive option.
5.2.1.3UnitedStatesofAmerica
The United States of America (USA) has long been a tourist hot spot and ranks number one for
out of country travel for Canadian residents. There are many reasons for this with the most
obvious being their ease of location. Some other leading factors include warm weather, rising
Canadian dollar, leisure, entertainment and shopping options. Although increasing numbers of
large USA retailers are progressively opening more stores in Canada (e.g. Target, Kohls,
Marshalls, etc.), for residents of Northwestern Ontario, it is often still cheaper and more
convenient to access these stores by car through the USA border.
For a resident of the PACE region, the closest USA border crossing is at International Falls and
the most popular USA shopping destination is Duluth, Minnesota approximately 6 hours away
by car. Similar to the Thunder Bay marketplace, Duluth has a population of just under 90,000.
The shopping scene is also similar in size and breadth to Thunder Bay but differs with the
additional popular USA retail chains.
The most commonly visited stores while in the USA include Menards, JC Penney, Target, Best
Buy and Kohls. Once in Duluth, shoppers have access to the largest mall in the United States
just an additional two further south to the city of Minneapolis. Minneapolis is recognized
internationally for its shopping with the Mall of America. The Mall of America has more than

28 | P a g e
2,768,400 million feet of retail space, over 520 stores and 50 restaurants; making this shopping
destination very attractive to shoppers from all over Canada and the USA.
5.2.2 Online
Online spending for Canadians has been steadily increasing for years and it shows no sign of
abating. Before the Internet was launched commercially in 1993, few people outside of the
scientific and academic communities knew anything about this new technology. Commerce has
since changed in unimaginable ways, as it is now
possible to search, purchase and sell just about
anything over the Internet (Rowland, 2006). Some of
the expected impacts of electronic commerce (e‐
commerce), such as the potential detrimental effects on
traditional retail, have not yet come to fruition (Sciadas,
2006). It appears that the impact of the Internet on
retail shopping depends on the specific product
category, as well as other factors such as consumer
behaviour and concern for online security (Statistics
Canada).
By 2007, the Internet was utilized to make almost 70
million orders by about 8.4 million Canadian individuals
aged 16 years and older. The value of online orders
made by Canadians in 2007 was $12.8 billion. The
number of online consumers aged 18 years and older
grew by 18 percent over the two years. And in 2007,
these online consumers reported an average of 8.4
orders worth $1,554, up from 7.2 and $1,150 in 2005, a
16 percent and 35 percent increase, respectively.
Despite this growth, online sales continue to represent
just a fraction of total consumer expenditures on goods
and services. To illustrate, total retail sales in Canada
were about $412 billion in 2007.
The reasons for this inexorable growth can be summed
up in one word: convenience. For a whole category of
purchases, it is simply easier and faster to buy online
and prices are often lower. Comparing prices, finding
29 | P a g e
discounts and promotions, having your loyalty rewarded and not having to travel to get the
exact product are saving money in the downturn. But above all consumers love the
convenience.
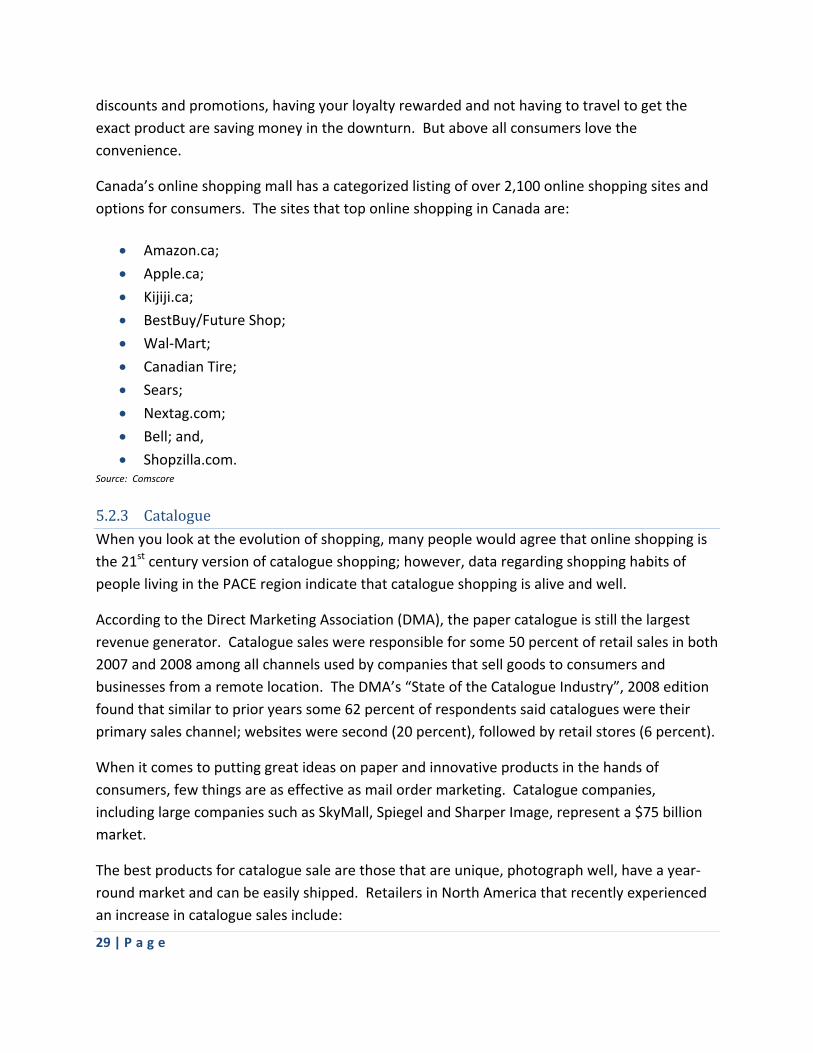
Canada’s online shopping mall has a categorized listing of over 2,100 online shopping sites and
options for consumers. The sites that top online shopping in Canada are:
Amazon.ca;
Apple.ca;
Kijiji.ca;
BestBuy/Future Shop;
Wal‐Mart;
Canadian Tire;
Sears;
Nextag.com;
Bell; and,
Shopzilla.com. Source: Comscore
5.2.3 CatalogueWhen you look at the evolution of shopping, many people would agree that online shopping is
the 21st century version of catalogue shopping; however, data regarding shopping habits of
people living in the PACE region indicate that catalogue shopping is alive and well.
According to the Direct Marketing Association (DMA), the paper catalogue is still the largest
revenue generator. Catalogue sales were responsible for some 50 percent of retail sales in both
2007 and 2008 among all channels used by companies that sell goods to consumers and
businesses from a remote location. The DMA’s “State of the Catalogue Industry”, 2008 edition
found that similar to prior years some 62 percent of respondents said catalogues were their
primary sales channel; websites were second (20 percent), followed by retail stores (6 percent).
When it comes to putting great ideas on paper and innovative products in the hands of
consumers, few things are as effective as mail order marketing. Catalogue companies,
including large companies such as SkyMall, Spiegel and Sharper Image, represent a $75 billion
market.
The best products for catalogue sale are those that are unique, photograph well, have a year‐
round market and can be easily shipped. Retailers in North America that recently experienced
an increase in catalogue sales include:

30 | P a g e
Pottery Barn;
Cabela’s;
JC Penney; and,
Victoria’s Secret.
Competition for small retailers is inevitable and looms everywhere. So the question surfaces, is
there a future for small retailing? The answer is yes. The future for the small retailer is in what
the box stores and online merchants do not and cannot do well; offering a full selection of high
quality, specialty goods coupled with the state‐of‐the‐art product knowledge and outstanding
service that customers need and expect. Customers are willing to pay a premium for these
goods and services; however, it is not enough to merely stake out a niche. Successful small
retailers in the future will need to continually improve their skills and performance to maintain
a leadership position in the market.
Here are some strategies a small business can implement to thrive against the big box stores:
Provide exceptional customer service;
Pamper existing customers;
Consider collaborating with similar and complementary businesses;
Use ‘loss leaders’ – A ‘loss leader’ is defined as a product on which a business loses
money but through which it also generate sales of other products in their mix;
Develop a niche and focus on it;
Present a very professional image;
Take care of employees;
Use technology to an advantage;
Emphasize the uniqueness of products; and,
Give storefront character.
Small retailers may not be able to fight big box stores independently, as they do not possess the
required resources; however, they can often steal a march on them by being more agile,
creative and committed.
5.3 RetailMarketAreaS.W.O.T.Analysis
The key issues and opportunities Ignace, Sioux Lookout, Dryen and Machin retail districts raised
through the business and resident surveys, interviews, focus groups and the Retail Market Area
First Impressions exercise are summarised in the following SWOT analysis:
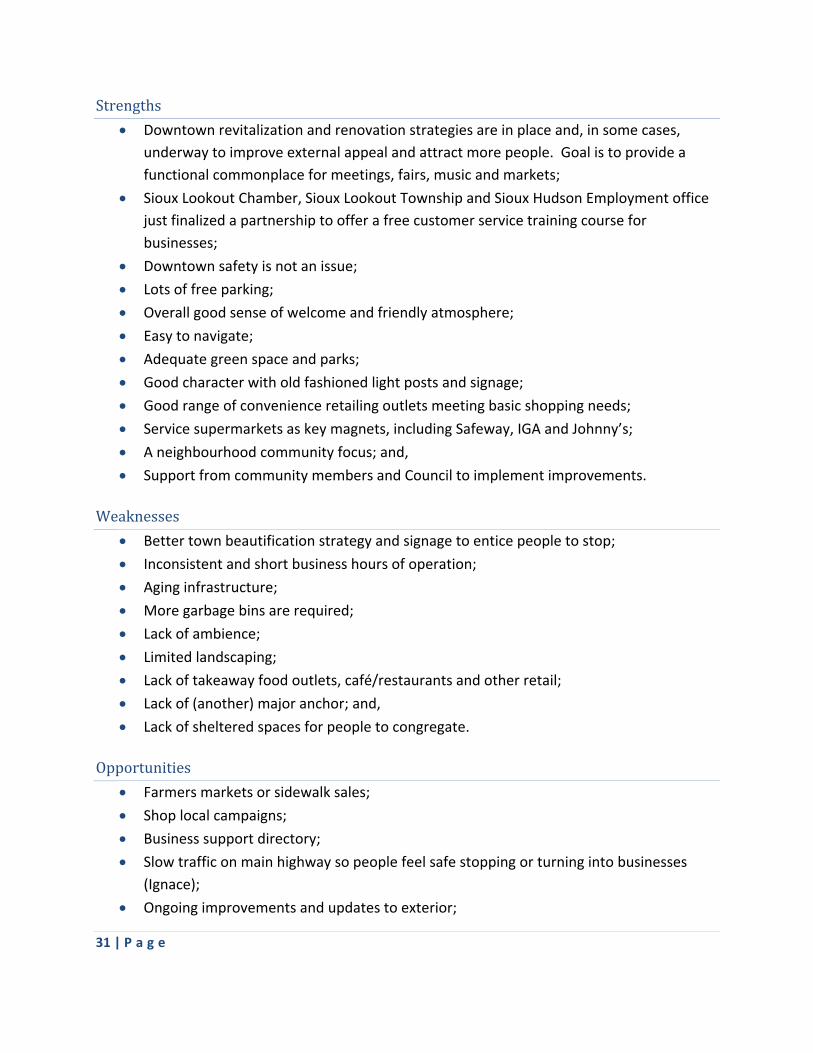
31 | P a g e
Strengths
Downtown revitalization and renovation strategies are in place and, in some cases,
underway to improve external appeal and attract more people. Goal is to provide a
functional commonplace for meetings, fairs, music and markets;
Sioux Lookout Chamber, Sioux Lookout Township and Sioux Hudson Employment office
just finalized a partnership to offer a free customer service training course for
businesses;
Downtown safety is not an issue;
Lots of free parking;
Overall good sense of welcome and friendly atmosphere;
Easy to navigate;
Adequate green space and parks;
Good character with old fashioned light posts and signage;
Good range of convenience retailing outlets meeting basic shopping needs;
Service supermarkets as key magnets, including Safeway, IGA and Johnny’s;
A neighbourhood community focus; and,
Support from community members and Council to implement improvements.
Weaknesses
Better town beautification strategy and signage to entice people to stop;
Inconsistent and short business hours of operation;
Aging infrastructure;
More garbage bins are required;
Lack of ambience;
Limited landscaping;
Lack of takeaway food outlets, café/restaurants and other retail;
Lack of (another) major anchor; and,
Lack of sheltered spaces for people to congregate.
Opportunities
Farmers markets or sidewalk sales;
Shop local campaigns;
Business support directory;
Slow traffic on main highway so people feel safe stopping or turning into businesses
(Ignace);
Ongoing improvements and updates to exterior;

32 | P a g e
Expansion through redevelopment;
Greater range of convenience retailing facilities;
Development of a Business Improvement
Association or Shop Local organization;
Creation of marketing activities; and,
Development of Downtown Master Plans.
Threats
Difficult to find qualified staff for evenings and weekend shifts;
Large transient population that are not invested in the community;
Major regional competition prompting out‐shopping;
Online revolution; and,
Reluctance by property owners to invest in improvements
From this SWOT analysis, the key opportunities for the future of the PACE region shopping
districts are:
Achieving higher standards of presentation, merchandising and customer service in
existing businesses;
Implementing a new brand for the region, getting all businesses behind the branding,
and making the wider community more aware of it;
Continuing to organize and implement a strategic marketing program;
Facilitating improvements in the region with the business owners and Council; and,
Development of a Business Improvement Association or Shop Local Organization.
5.4 ShopLocalMarketingStrategiesandPrograms
If the businesses and retail districts want to keep local consumers, they have to provide
incentives or reasons why consumers should spend their money locally. Then, businesses need
to ensure incentives and reasons are being communicated and marketed correctly to reach
their target audience. The best way to do this is to develop a comprehensive, regional shop
local campaign that offers something for everyone and appeals to the entire larger
demographic in the primary target market. Understanding that not everyone is the same with
different socioeconomic and psychographic backgrounds, a cookie cutter approach will not
work.
Shop local campaigns experienced success in many other communities and can yield positive
results in the PACE region. The 2011 Independent Business Survey has found that, for the
33 | P a g e
fourth year in a row, those communities with an active shop local campaign have experienced
markedly stronger revenue growth compared to those located in areas without such a
campaign. Business owners in cities with active shop local campaigns reported a wide range of
positive impacts on their business.
Almost half reported that the campaign had brought new customers to their business and 55
percent indicated it had made existing customers more loyal. More than two‐thirds stated that
local media coverage of independent businesses had increased and 51 percent said that local
government officials were now more aware and supportive of the needs of independent
businesses.
It is very difficult for retail establishments in small communities to compete with larger stores
and discounters located in major metropolitan areas on price. For those shoppers whose main
motivation is securing a better deal, small town retailers will be at a disadvantage; however, as
the research suggests, price is just one of the many variables consumers consider when
purchasing products and it does not sway a majority of shopping decisions.
Small town retailers can capture a large percentage of sales to local shoppers if they stock the
goods people want to buy and if the shopping experience is convenient for the buyer. In
addition, establishing a personal relationship with shoppers, where the shopping experience is
seen as an interaction between friends and not just as a financial transaction; goes a long way
towards making local buyers more inclined to shop local.
Through primary research methodologies, it has been determined who the out‐shopper is, what
they are out‐shopping for, primary methods of out‐shopping, why they are out‐shopping and
most common locations to out‐shop. This valuable information provides a strong base to begin
building a marketing campaign that will appeal to the greater demographic. The following are a
few strategies that can be implemented within the PACE region to encourage increased local
shopping.
5.4.1 Market,CommunicateandTalktoyourCustomers
This strategy sounds relatively simple and straight forward and numerous businesses would
probably even state they are already doing this; however, local research indicates not well
enough. Personal appeals should be made to customers that a business needs their patronage
with each point of contact. Nobody has better access to their customers than the business
owner; utilize every opportunity to the maximum. Communicate the benefits of shopping local
through all marketing outlets and ensure customers know businesses truly appreciate their
patronage. Some ways of doing this are:

34 | P a g e
1. Record a new on‐hold message. When a customer is on‐hold, they hear the business
thanking them for their support.
2. Upload a shop local video to raise shop local awareness and engage existing and
potential customers. Post the video to the business website, in the store and to all
social media outlets.
3. Post a durable sign at the store entrance or by the roadside
sharing the message.
4. Ask all customers to sign the Shop Local I Pledge form
committing them to shifting at least $100 of their monthly
spending to locally owned stores to make the PACE region
economy stronger. In doing so, their name will also be entered
into a draw for monthly local prizes.
5. Spend business and personal dollars with locally owned businesses.
5.4.2 MyCardFirst introduced in Europe, My Card is an area‐based (City, Town, Neighbourhood and
Settlement) loyalty program card to reward residents for rediscovering their local businesses.
Fully embracing technology, My Card introduces ‘non‐payment cards’, mobile technology and
‘near field communication’ solutions to deliver incentives and cash rebates. The unique
proposition My Card offers to local municipalities, town partnerships, Downtown Revitalization
plans and Chambers of Commerce enables them to deliver a program that will unite
communities, re‐circulate local wealth and create significant income for local businesses.
Each My Card has the user’s personal information built into the card and with every purchase at
a participating local retailer, the card is swiped and the user is rewarded with loyalty points that
can be used to be re‐invested back into the community. The card is also a useful market
research tool for business to determine shopper trends and habits. The key benefits of the card
include:
Residents rewarded for spending with local merchants;
Local merchants rewarded with greater foot traffic, greater sales and transaction data;
Local area benefits by becoming the local destination for residents who, as well as
spending more money, spend more time enjoying all the other activities the area has to
offer;
Strengthen existing town branding and community spirit; and,
Retailer resource outlet to share best practices.

35 | P a g e
5.4.3 3/50ProjectThe 3/50 project is about choosing three favourite local businesses or service providers that
you would miss if they were gone and committing to spend a total of at least $50 each month
with them; not $50 each but $50 total. This kind of effort and mindfulness can help keep local
businesses in business during these challenging economic times.
Local businesses can further support this initiative by providing a discount or incentive to the
patron at their business when they show a receipt that they have purchased a service or
product from any business within the PACE region on that same day. The going wisdom is that
for every $100 spent in local stores, $63 returns in taxes, payroll and other revenue streams.
5.4.4 E‐MarketingSmall, local retailers can tap into the e‐marketing, e‐commerce and social media frenzy by
adapting to changing sales and marketing strategies. Fuelled by new technology, the retail
industry has an opportunity to expand in directions it would have been difficult to predict even
five years ago. With daily deals delivered via Twitter feeds, mobile friendly sales sites and
locate local businesses iPhone applications; the options of avenues to communicate with
customers are endless. This new age of marketing is no longer an option for local businesses.
To be able to compete effectively, the Internet and online marketing tools must be utilized.
6.0 RecommendationsandConclusion
To effectively address the regional growing trend of out‐shopping and implement strategies and
programs to deter its expansion, some long term recommendations have been developed. The
success of these programs is the responsibility of a variety of stakeholders ranging from local
government, small business owners and residents. Everyone in the PACE region needs to take
ownership of shopping local and investing in the community first to realize change.
6.1 EstablishaShopLocalCommitteeThrough a collaborative partnership with PACE, local Chambers of Commerce, Northwest
Business Centre and local business owners, a shop local committee needs to be formalized to
address the ongoing issue of out‐shopping. The shop local committee will be responsible for
promoting and supporting locally‐owned, independent businesses year round and fuelling the
local economy.
The committee will develop a shop local slogan and unified message that can be used on all
marketing materials for businesses, further communicating the importance of keeping local
shopping dollars in the PACE region. By creating a marketing campaign such as ‘keep the cheer

36 | P a g e
here, ‘spend it at home, ‘get more of it back’ or ‘I pledge to shop local’ will keep shopping local
on the minds of consumers.
The marketing materials available can range from post cards and window stickers to blog posts
and Facebook icons. This type of marketing support to small businesses and the constant
reminders to consumers about how their shopping choices affect the community will slowly
begin to result in positive outcomes.
6.2 MonthlyWorkshopsforBusinessOwnersThrough the committee, monthly workshops for business owners will be available focussing on
combating out‐shopping challenges. Some themes that will be specifically addressed are shop
local incentives and campaigns, how to sell to the online generation, competing with big box
stores and communicating with the target market to name a few. Specialized training seminars
that provide retailers with useful, easy to implement strategies and tools will make the entire
local business community more aware and prepared to deal with the out‐shopping
phenomenon.
These workshops will also arm businesses with the proper tools and knowledge to create their
own shop local incentives unique to their business culture. In addition, training centres will be
set up for employees, teaching the value of excellent customer service and product knowledge
stressing the importance of their role to create a great customer experience with every point of
contact.
6.3 MonitoringandEvaluation
The degree of achievement of the actions undertaken by the committee must be evaluated at
regular intervals throughout each financial year. Key performance indicators to be included in
the evaluation are:
Level of business participation in activities and promotions;
Business and customer perceptions about the success of individual promotions and
advertising campaigns;
Business perceptions about changes in the overall profile and trading performance; and,
Financial impacts of activities and promotions to local businesses.
It is recommended that an evaluation report be prepared for each community Council at the
end of each fiscal year. The report is to address the degree of achievement with the
performance indicators outlined above. The report will guide the activities undertaken by the
committee in the following year and may assist in the development of a business plan to guide
the long term efforts of the committee.

37 | P a g e
APPENDIXI–ConsumerSurvey

Page 1
Measuring Retail Market GravitationMeasuring Retail Market GravitationMeasuring Retail Market GravitationMeasuring Retail Market Gravitation
Patricia Area Community Endeavours Inc. (PACE) is a Community Futures Development Corporation committed to encouraging local community and economic development by assisting community groups and entrepreneurs. For the purposes of this study, PACE services the communities of Dryden, Sioux Lookout, Ignace and Machin. In a continuous effort to fullfill their mission, PACE has secured funding to undertake a study focused on Measuring Retail Market Gravitation and outshopping. This survey will help to determine consumer shopping practices and patterns for the development of a strategy to strengthen the local retail market. Upon completion, surveys can be dropped off at your local municipal office, Enterprise Dryden, Dryden Development Corporation and the PACE office. If you prefer to mail in the survey, please send to: P.O. Box 668, Dryden, ON P8N 2Z3 For your convenience, this survey is also available online and we encourage submission through this method. Please visit your municipal website and look for the PACE logo to access the link. We very much appreciate you taking the time to complete this survey and supporting your community.
Demographic Information
1. Please indicate your gender.
2. What community do you reside in?
3. Please identify the age bracket that corresponds with your age.
Male
nmlkj
Female
nmlkj
Dryden
nmlkj
Eagle Lake First Nation
nmlkj
Ignace
nmlkj
Lac Seul First Nation
nmlkj
Machin
nmlkj
Sioux Lookout
nmlkj
Wabigoon First Nation
nmlkj
Other (please specify)
16 24
nmlkj
25 44
nmlkj
45 64
nmlkj
65 +
nmlkj

Page 2
Measuring Retail Market GravitationMeasuring Retail Market GravitationMeasuring Retail Market GravitationMeasuring Retail Market Gravitation4. What is your average annual household income?
Shopper Attitudes
5. Please answer the following questions based on their importance to you.
Shopping Habits
6. How often do you shop within the Patricia Area Region (Ignace, Sioux Lookout, Dryden and Machin)?
7. When shopping locally, in which community do you shop most often?
Not at all important Somewhat important Important Very important
How important is it to you to shop local?
nmlkj nmlkj nmlkj nmlkj
How would you rate the overall economic benefits of shopping local to your community?
nmlkj nmlkj nmlkj nmlkj
If you are forced to outshop, how important is it to you to shop within Northwestern Ontario?
nmlkj nmlkj nmlkj nmlkj
$10,000 $24,000
nmlkj
$25,000 $44,000
nmlkj
$45,000 $74,000
nmlkj
$75,000 $100,000
nmlkj
More than $100,000
nmlkj
Other (please specify)
Almost daily
nmlkj
Once a week
nmlkj
Every two weeks
nmlkj
Once a month
nmlkj
I seldom shop in the Patricia Area Region
nmlkj
Dryden
nmlkj
Ignace
nmlkj
Machin
nmlkj
Sioux Lookout
nmlkj

Page 3
Measuring Retail Market GravitationMeasuring Retail Market GravitationMeasuring Retail Market GravitationMeasuring Retail Market Gravitation
8. How often do you shop outside of the Patricia Area Region?
If you answered 'never' to question #8, please skip to question #12.
9. When shopping outside the Patricia Area Region, what shopping method(s) do you most commonly use?
10. If you chose "Travelling to shop in another Region" as one of your answers from question #8, please indicate your most frequent destination.
11. What is/are your primary reason(s) for outshopping?
Weekly
nmlkj
Once a month
nmlkj
Twice yearly
nmlkj
Yearly
nmlkj
Never
nmlkj
Travelling to shop within another Region
gfedc
Online shopping
gfedc
Catalogue shopping
gfedc
Other (please specify)
Kenora
nmlkj
Thunder Bay
nmlkj
Winnipeg
nmlkj
U.S.A.
nmlkj
Other (please specify)
Convenience
gfedc
Price
gfedc
Selection
gfedc
Service
gfedc
Hours of operation
gfedc
Travel experience
gfedc
Travel required for business
gfedc
Other (please specify)

Page 4
Measuring Retail Market GravitationMeasuring Retail Market GravitationMeasuring Retail Market GravitationMeasuring Retail Market Gravitation12. What product(s) do you generally outshop for?
13. What do you like best about your local retail district?
14. If you could add or change something about your Regional shopping district(s) what would it be (click all that apply)?
15. Would you consider buying locally first if your addition or change idea from question #14 was implemented?
16. Additional comments
55
66
Women's clothing
gfedc
Men's clothing
gfedc
Children/Teen's clothing
gfedc
Footwear
gfedc
Books/CDs
gfedc
Dining
gfedc
Groceries
gfedc
Sporting goods
gfedc
Electronics
gfedc
Furniture and appliances
gfedc
Housing goods
gfedc
Entertainment products/services
gfedc
Vehicles
gfedc
Recreation vehicles and related products
gfedc
Other (please specify)
Convenience
gfedc
Price
gfedc
Merchandise selection
gfedc
Quality of Service
gfedc
Supporting the local community
gfedc
Social outing
gfedc
Hours of operation
gfedc
Other (please specify)
Better prices
gfedc
Merchandise Selection
gfedc
Quality of Service
gfedc
Hours of operation
gfedc
Other (please specify)
Yes
nmlkj
No
nmlkj
Less often
nmlkj
Maybe
nmlkj

38 | P a g e
APPENDIXII–RadioAdvertisement
Ph. (807) 223-2355 Fax (807) 223-5090
Toll-free (800) 465-7200 Web www.ckdr.net
Today’s hits, yesterday’s favourites! 122 King St. • Dryden, ON • P8N 1C2
11/8/2011 1:26 PM C:\Users\User\AppData\Local\Microsoft\Windows\Temporary Internet Files\Content.Outlook\HUVC7DY7\9 19 PACE Out Shopping Survey.doc
© 2 0 1 1 C K D R , A N AC A D I A B R O A D C A S T I N G S T A T I O N . N O T F O R R E - B R O A D C A S T W I T H O U T E X P R E S S W R I T T E N P E R M I S S I O N .
Client: GCK Consulting Title: Out Shopping Survey Writer: Chris
Starts: 9/21/2011 Ends: 9/27/2011 Cart #: DE218 Category: DRS/EAS/WES
Background: /CD Library/evo126/EVO126_38.mp3
Save to: /Spots/GCK Consulting/11.8.11 GCK Consulting-Out Shopping Survey (30).mp3
Additional Instructions:
You’ve said it plenty of times.
“I’d shop locally if only … ”
Well, businesses in Dryden, Sioux Lookout, Ignace, and Machin are listening – so make
your opinions heard! PACE invites you to take a quick out-shopping survey. Tell them
why you go out of the area to shop – and what could be done to keep you shopping
locally.
Visit Dryden.ca and click the link in the lower right corner to take the survey online.
No computer? Get a printed copy from the Ad Bag, or your municipal office.
Take the survey.
Make your opinions heard!

39 | P a g e
APPENDIXIII–CompleteResultsofConsumerSurvey
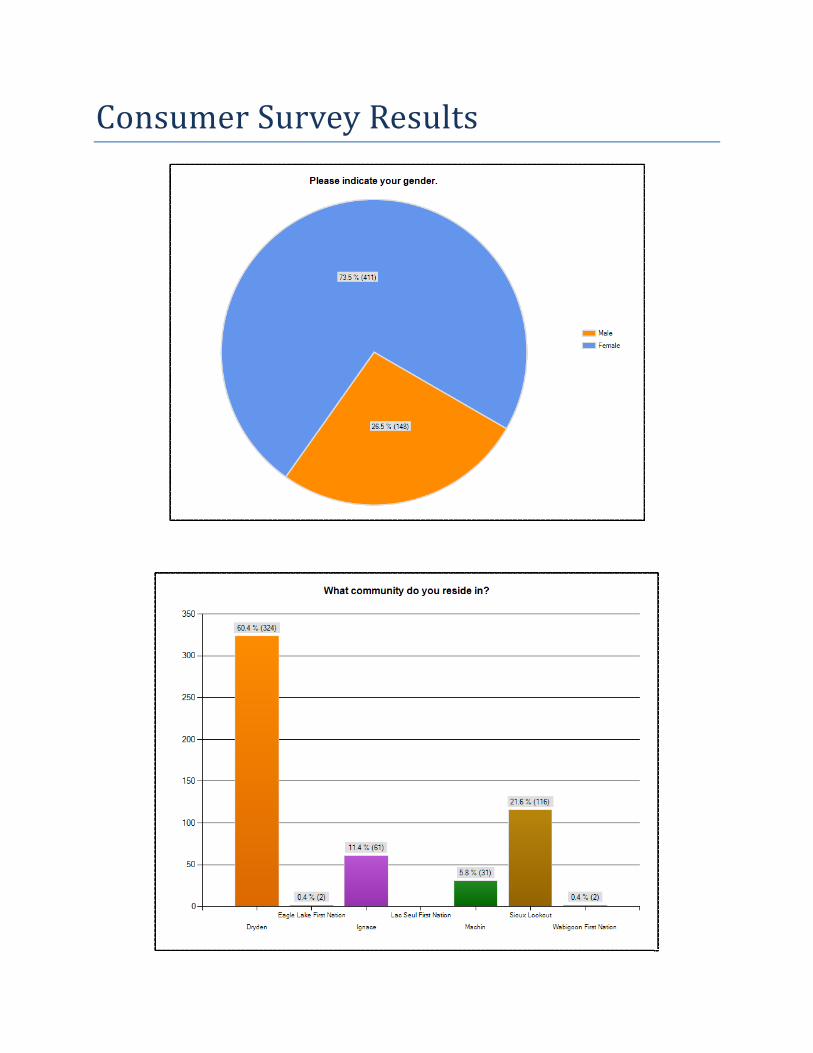
ConsumerSurveyResults
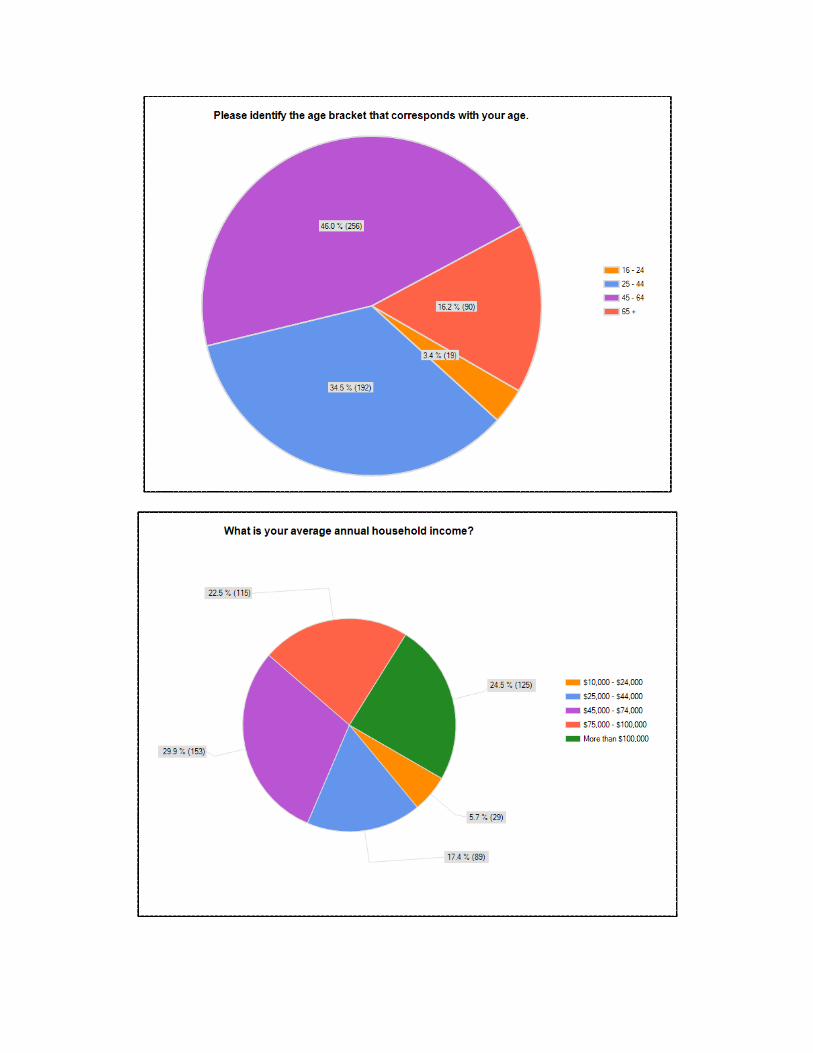


40 | P a g e
APPENDIXIV–BusinessOperatorSurvey

Page 1
Business Operators SurveyBusiness Operators SurveyBusiness Operators SurveyBusiness Operators Survey
1. Business name:
2. Business owner:
3. Contact person (if different):
4. Business address:
5. Business phone number:
6. Business email address:
7. Business website:
8. Regarding your business:
55
66
55
66
55
66
55
66
55
66
55
66
55
66
Under 1 year 1 5 years 6 10 years 11 20 years Over 20 years
How long have you been in operation (at this or previous location)?
nmlkj nmlkj nmlkj nmlkj nmlkj
How long has your business been at present location?
nmlkj nmlkj nmlkj nmlkj nmlkj
How long have you been the operator of your business?
nmlkj nmlkj nmlkj nmlkj nmlkj

Page 2
Business Operators SurveyBusiness Operators SurveyBusiness Operators SurveyBusiness Operators Survey9. Does your business own or lease the space in which it is located?
10. To the best of your knowledge, what are the three busiest and three slowest months of the year for your business?
11. What are your hours of operation?
12. How many people, including owners, does your business employ in each of the following categories?
Busiest Slowest
January nmlkj nmlkj
February nmlkj nmlkj
March nmlkj nmlkj
April nmlkj nmlkj
May nmlkj nmlkj
June nmlkj nmlkj
July nmlkj nmlkj
August nmlkj nmlkj
September nmlkj nmlkj
October nmlkj nmlkj
November nmlkj nmlkj
December nmlkj nmlkj
Monday
Tuesday
Wednesday
Thursday
Friday
Saturday
Sunday
Full time year round (32+hours/week)
Part time year round
Seasonal
Own
nmlkj
Lease
nmlkj
Lease, want to purchase
nmlkj

Page 3
Business Operators SurveyBusiness Operators SurveyBusiness Operators SurveyBusiness Operators Survey13. What are your thoughts on your store hours (check all that apply)?
14. How important are the following consumer segments to your business? (mark one on each row)
15. In the previous 12 months, would you say your sales have:
16. If you identified your sales as decreasing, what do you attribute the primary reason(s) to be?
Very Important Important Not Important Not Sure
Males nmlkj nmlkj nmlkj nmlkj
Females nmlkj nmlkj nmlkj nmlkj
Age under 18 nmlkj nmlkj nmlkj nmlkj
Ages 18 24 nmlkj nmlkj nmlkj nmlkj
Ages 25 44 nmlkj nmlkj nmlkj nmlkj
Ages 45 54 nmlkj nmlkj nmlkj nmlkj
Ages 55 64 nmlkj nmlkj nmlkj nmlkj
Ages 65 + nmlkj nmlkj nmlkj nmlkj
Downtown residents & staff nmlkj nmlkj nmlkj nmlkj
Tourists & Visitors nmlkj nmlkj nmlkj nmlkj
I am open all the hours I need to be
gfedc
I can't be open more hours for personal reasons
gfedc
I would like to be open more hours, but can't afford the staff
gfedc
I would like to be open more hours, but can't find good staff
gfedc
I would be open more hours if I were sure of sales
gfedc
I would be open more hours if everyone else was
gfedc
Increased
nmlkj
Decreased
nmlkj
Stayed the same
nmlkj
Not sure
nmlkj
Increased local competition
nmlkj
Increased regional competition
nmlkj
Not enough marketing and/or promotional materials
nmlkj
Economic decline
nmlkj
Staffing issues
nmlkj
Customer service
nmlkj
Increased online shopping
nmlkj
Other (please specify)
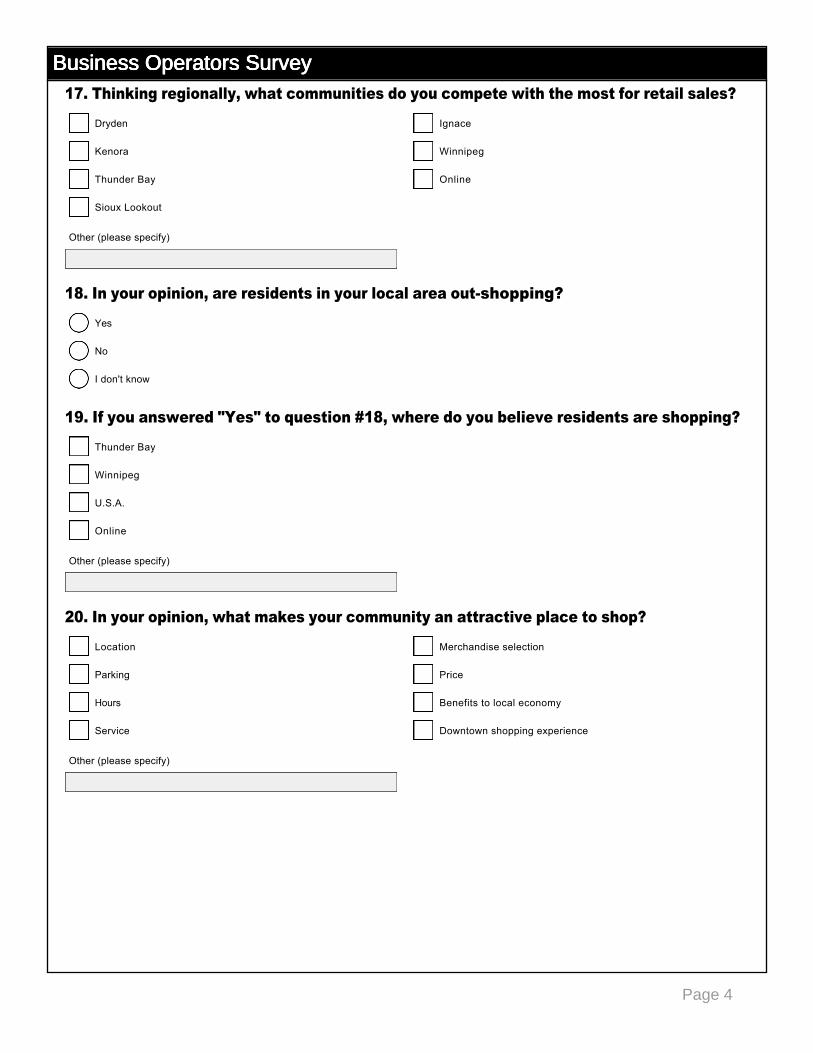
Page 4
Business Operators SurveyBusiness Operators SurveyBusiness Operators SurveyBusiness Operators Survey17. Thinking regionally, what communities do you compete with the most for retail sales?
18. In your opinion, are residents in your local area outshopping?
19. If you answered "Yes" to question #18, where do you believe residents are shopping?
20. In your opinion, what makes your community an attractive place to shop?
Dryden
gfedc
Kenora
gfedc
Thunder Bay
gfedc
Sioux Lookout
gfedc
Ignace
gfedc
Winnipeg
gfedc
Online
gfedc
Other (please specify)
Yes
nmlkj
No
nmlkj
I don't know
nmlkj
Thunder Bay
gfedc
Winnipeg
gfedc
U.S.A.
gfedc
Online
gfedc
Other (please specify)
Location
gfedc
Parking
gfedc
Hours
gfedc
Service
gfedc
Merchandise selection
gfedc
Price
gfedc
Benefits to local economy
gfedc
Downtown shopping experience
gfedc
Other (please specify)

Page 5
Business Operators SurveyBusiness Operators SurveyBusiness Operators SurveyBusiness Operators Survey21. Where do you currently focus your marketing efforts?
Newspapers
gfedc
Radio
gfedc
Television
gfedc
Direct mail
gfedc
Window displays
gfedc
Billboards
gfedc
Internet
gfedc
Giveaways
gfedc
Yellow pages
gfedc
Social media
gfedc
I don't advertise
gfedc
Other (please specify)

41 | P a g e
APPENDIXV–CompleteResultsofBusinessOperatorSurvey

BusinessOperatorSurveyResults


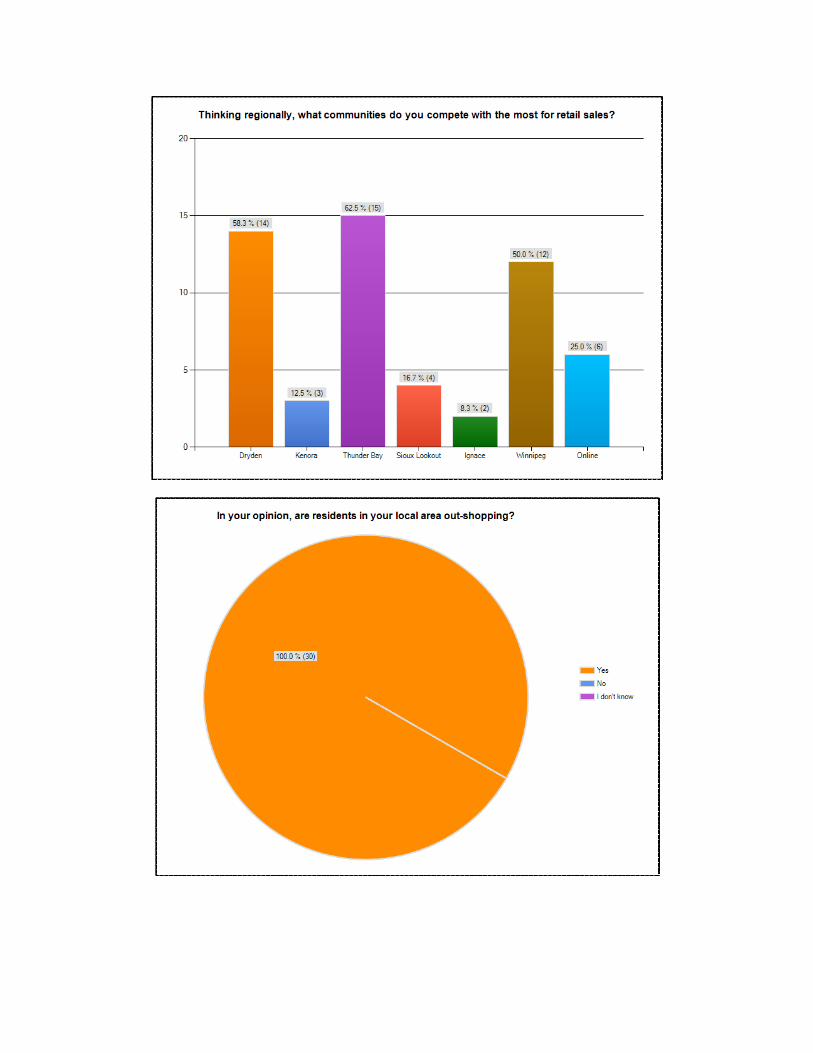


42 | P a g e
APPENDIXVI–FocusGroupSessionsQuestions
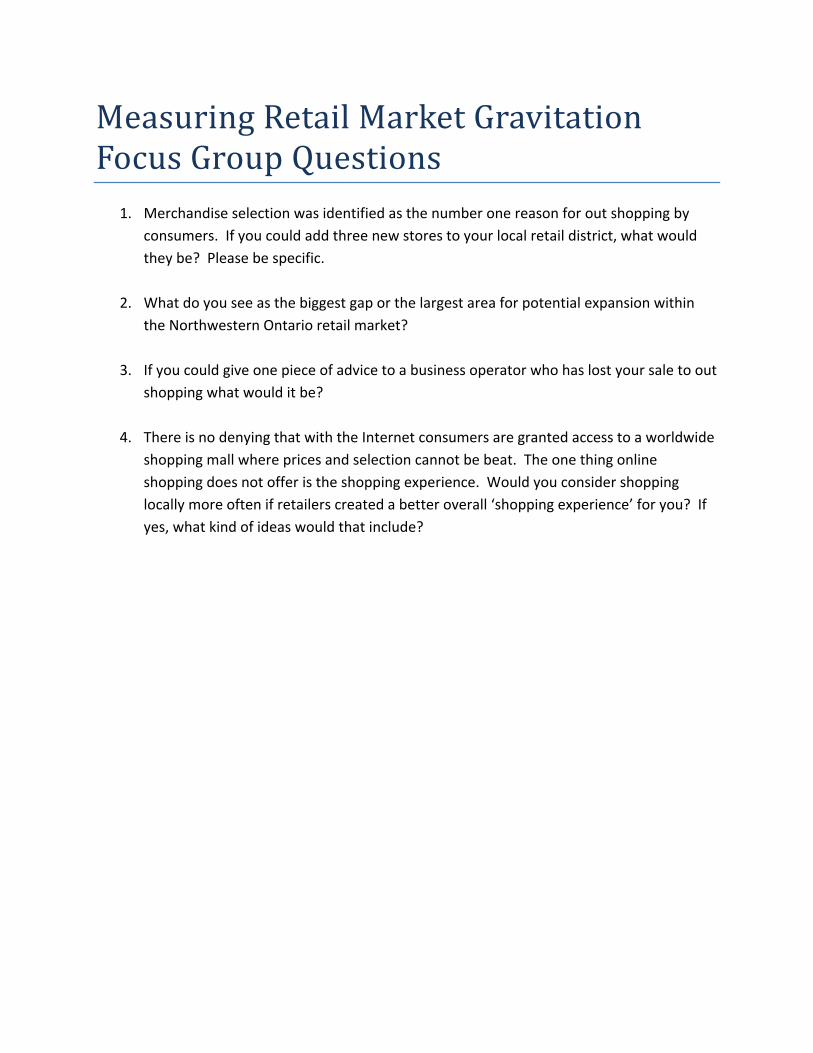
MeasuringRetailMarketGravitationFocusGroupQuestions
1. Merchandise selection was identified as the number one reason for out shopping by
consumers. If you could add three new stores to your local retail district, what would
they be? Please be specific.
2. What do you see as the biggest gap or the largest area for potential expansion within
the Northwestern Ontario retail market?
3. If you could give one piece of advice to a business operator who has lost your sale to out
shopping what would it be?
4. There is no denying that with the Internet consumers are granted access to a worldwide
shopping mall where prices and selection cannot be beat. The one thing online
shopping does not offer is the shopping experience. Would you consider shopping
locally more often if retailers created a better overall ‘shopping experience’ for you? If
yes, what kind of ideas would that include?
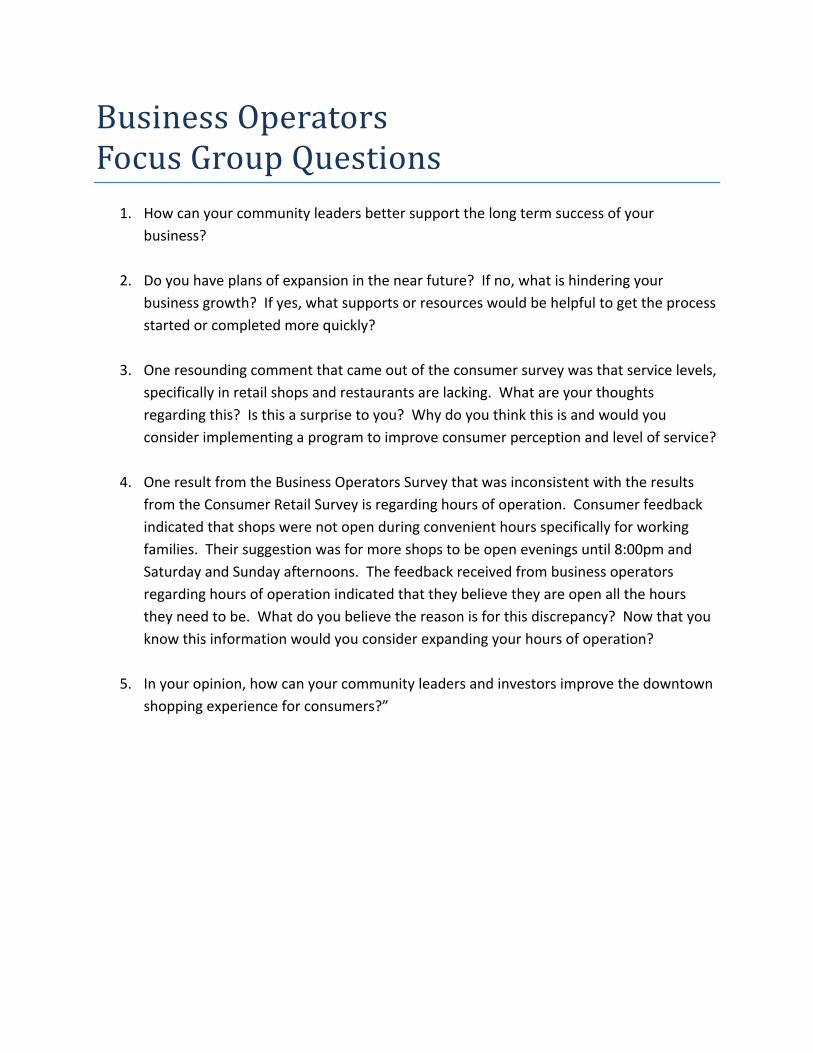
BusinessOperatorsFocusGroupQuestions
1. How can your community leaders better support the long term success of your
business?
2. Do you have plans of expansion in the near future? If no, what is hindering your
business growth? If yes, what supports or resources would be helpful to get the process
started or completed more quickly?
3. One resounding comment that came out of the consumer survey was that service levels,
specifically in retail shops and restaurants are lacking. What are your thoughts
regarding this? Is this a surprise to you? Why do you think this is and would you
consider implementing a program to improve consumer perception and level of service?
4. One result from the Business Operators Survey that was inconsistent with the results
from the Consumer Retail Survey is regarding hours of operation. Consumer feedback
indicated that shops were not open during convenient hours specifically for working
families. Their suggestion was for more shops to be open evenings until 8:00pm and
Saturday and Sunday afternoons. The feedback received from business operators
regarding hours of operation indicated that they believe they are open all the hours
they need to be. What do you believe the reason is for this discrepancy? Now that you
know this information would you consider expanding your hours of operation?
5. In your opinion, how can your community leaders and investors improve the downtown
shopping experience for consumers?”
Recommended