McLagan Life Insurance Compensation Survey
Our team understands that compensation market data is critical to awarding your talent appropriately and the success of your business. We offer a comprehensive compensation survey suite for life insurance companies looking to assess their employee pay levels and manage their overall compensation spend.
We’re here to empower results
Contact our team today to learn more about our solutions for insurance.
Kaitlyn [email protected]
Ryan [email protected]
For more information on McLagan, visit mclagan.aon.com
We provide competitive market benchmarks for compensation and data across virtually all positions, from the receptionist to the CEO, found within the life insurance industry. Today our survey spans:
• 48 Companies • 40,000 Employees
Our industry compensation data is critical to your firm’s successFunctional coverage includes:
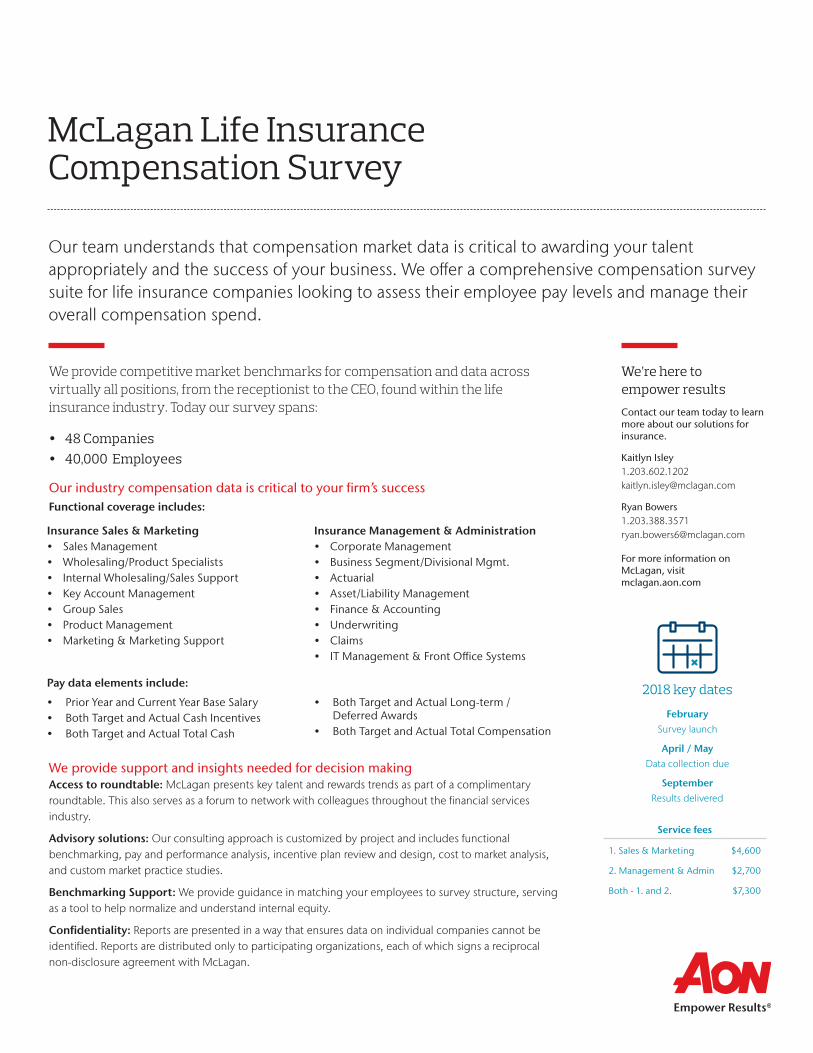
2018 key dates
FebruarySurvey launch
April / MayData collection due
SeptemberResults delivered
Service fees
1. Sales & Marketing $4,600
2. Management & Admin $2,700
Both - 1. and 2. $7,300
Insurance Sales & Marketing• Sales Management• Wholesaling/Product Specialists• Internal Wholesaling/Sales Support• Key Account Management• Group Sales• Product Management• Marketing & Marketing Support
Insurance Management & Administration• Corporate Management• Business Segment/Divisional Mgmt.• Actuarial• Asset/Liability Management• Finance & Accounting• Underwriting• Claims• IT Management & Front Office Systems
We provide support and insights needed for decision making Access to roundtable: McLagan presents key talent and rewards trends as part of a complimentary roundtable. This also serves as a forum to network with colleagues throughout the financial services industry.
Advisory solutions: Our consulting approach is customized by project and includes functional benchmarking, pay and performance analysis, incentive plan review and design, cost to market analysis, and custom market practice studies.
Benchmarking Support: We provide guidance in matching your employees to survey structure, serving as a tool to help normalize and understand internal equity.
Confidentiality: Reports are presented in a way that ensures data on individual companies cannot be identified. Reports are distributed only to participating organizations, each of which signs a reciprocal non-disclosure agreement with McLagan.
• Prior Year and Current Year Base Salary• Both Target and Actual Cash Incentives• Both Target and Actual Total Cash
• Both Target and Actual Long-term / Deferred Awards
• Both Target and Actual Total Compensation
Pay data elements include:
2017 participant list (48)
AegonAIGAllstateAmerican National InsuranceAmeriprise FinancialAXABrighthouse FinancialCIGNADelaware LifeFidelityGenworth FinancialGlobal Atlantic Financial GroupGreat American InsuranceGreat-West FinancialGuardian LifeGuggenheim Partners
HartfordHorace MannJackson National LifeLegal & GeneralLiberty Mutual GroupLincoln Financial GroupManulifeMassMutual Life Insurance CompanyMetropolitan Life Insurance CompanyModern Woodmen of AmericaMutual of OmahaNational Life GroupNationwideNew York Life Insurance CompanyNorthwestern Mutual Life InsurancePacific Life Insurance Company
Penn Mutual Life InsurancePrincipal Financial GroupPrudential FinancialRaymond, James & AssociatesResolution LifeSecurian Financial GroupSecurity Benefit CorporationStanCorp Financial GroupSun Life FinancialSymetra FinancialTexas LifeThrivent FinancialTIAAUSAAVOYA Investment ManagementZurich North America
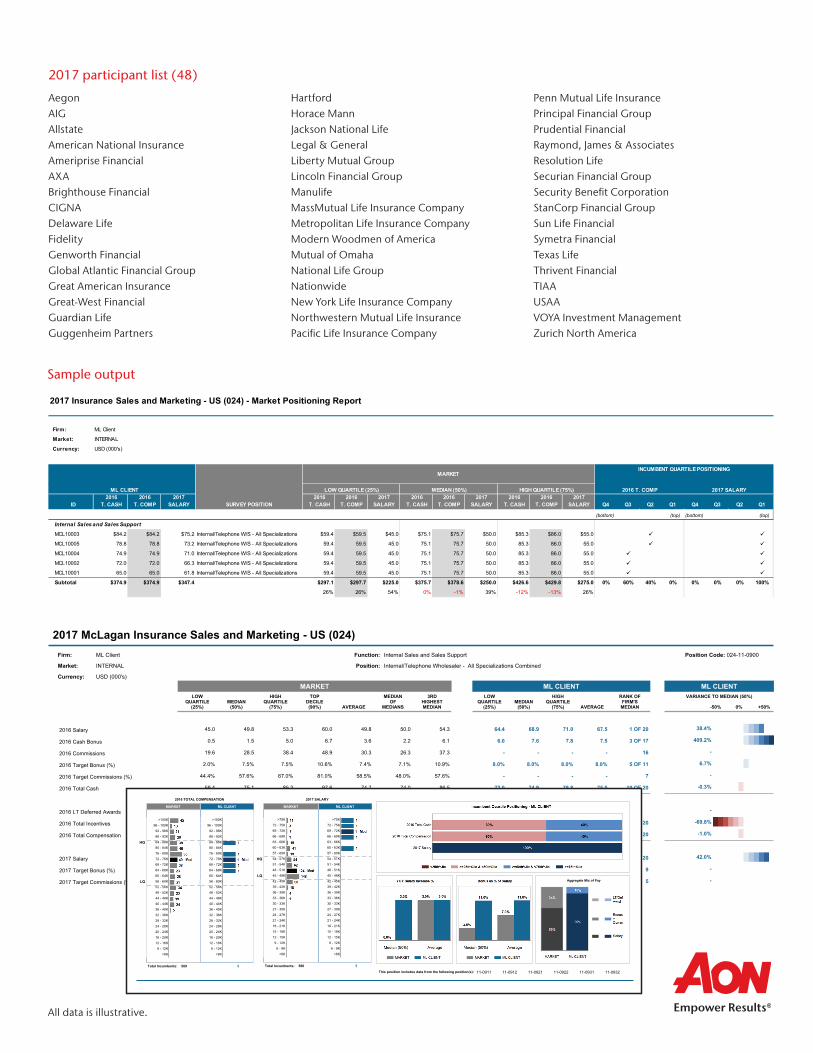
Sample output
All data is illustrative.
ID 2016
T. CASH 2016
T. COMP 2017
SALARY SURVEY POSITION 2016
T. CASH 2016
T. COMP 2017
SALARY 2016
T. CASH 2016
T. COMP 2017
SALARY 2016
T. CASH 2016
T. COMP 2017
SALARY Q4 Q3 Q2 Q1 Q4 Q3 Q2 Q1
MCL10003 $84.2 $84.2 $75.2 Internal/Telephone W/S - All Specializations $59.4 $59.5 $45.0 $75.1 $75.7 $50.0 $85.3 $86.0 $55.0
MCL10005 78.8 78.8 73.2 Internal/Telephone W/S - All Specializations 59.4 59.5 45.0 75.1 75.7 50.0 85.3 86.0 55.0
MCL10004 74.9 74.9 71.0 Internal/Telephone W/S - All Specializations 59.4 59.5 45.0 75.1 75.7 50.0 85.3 86.0 55.0
MCL10002 72.0 72.0 66.3 Internal/Telephone W/S - All Specializations 59.4 59.5 45.0 75.1 75.7 50.0 85.3 86.0 55.0
MCL10001 65.0 65.0 61.8 Internal/Telephone W/S - All Specializations 59.4 59.5 45.0 75.1 75.7 50.0 85.3 86.0 55.0
Subtotal $374.9 $374.9 $347.4 $297.1 $297.7 $225.0 $375.7 $378.6 $250.0 $426.6 $429.8 $275.0 0% 60% 40% 0% 0% 0% 0% 100%
26% 26% 54% 0% -1% 39% -12% -13% 26%
2017 Insurance Sales and Marketing - US (024) - Market Positioning Report
Firm: ML Client
Market: INTERNAL
Currency: USD (000's)Client Data Detection: SUCCEEDED
MARKETINCUMBENT QUARTILE POSITIONING
2016 T. COMP 2017 SALARYML CLIENT LOW QUARTILE (25%) MEDIAN (50%) HIGH QUARTILE (75%)
(top)
Internal Sales and Sales Support(bottom) (top) (bottom)
Recommended
![CERTIFICATE OF INSURANCE B - Specime… · WORK INJURY COMPENSATION ACT (Chapter 354) WORK INJURY COMPENSATION INSURANCE REGULATION 1975 CERTIFICATE OF INSURANCE [REGULATION 3(1)]](https://img.pdfslide.us/doc/110x75/60545b7bf269092c650f5324/certificate-of-insurance-b-specime-work-injury-compensation-act-chapter-354.jpg)