www.foranmining.comNovember 2014
McIlvenna Bay Deposit
Preliminary Economic Assessment

Forward Looking Statements
2
This presentation contains "forward-looking information" (also referred to as "forward looking statements") which may include,but are not limited to, statements with respect to the future financial or operating performance of the Company, its subsidiariesand its projects, the future price of metals, the estimation of mineral reserves and resources, the realization of mineral reserveestimates, costs and timing of future exploration, the timing of the development of new deposits, requirements for additionalcapital, foreign exchange risk, government regulation of mining and exploration operations, environmental risks, reclamationexpenses, title disputes or claims, insurance coverage and regulatory matters. Often, but not always, forward-looking statementscan be identified by the use of words such as "plans", "hopes", "expects", "is expected", "budget", "scheduled", "estimates","forecasts", "intends", "anticipates", or "believes" or variations (including negative variations) of such words and phrases, or statethat certain actions, events or results "may", "could", "would", "might" or "will" be taken, occur or be achieved.
Forward-looking information involves and is subject to known and unknown risks, uncertainties and other factors which maycause the actual results, performance or achievements of the Company and/or its subsidiaries to be materially different from anyfuture results, performance or achievements expressed or implied by the forward-looking information. Such factors include,among others, general business, economic, competitive, political and social uncertainties; the actual results of currentexploration activities and feasibility studies; assumptions in economic evaluations which prove to be inaccurate; fluctuations inthe value of the United States dollar and the Canadian dollar relative to each other; future prices of metals; possible variations ofore grade or recovery rates; accidents, labour disputes or slow downs and other risks of the mining industry; climatic conditions;political instability, insurrection or war; arbitrary decisions by governmental authorities; delays in obtaining governmentalapprovals or financing or in the completion of development or construction activities. Although the Company has attempted toidentify important factors that could cause actual actions, events or results to differ materially from those described in forward-looking information, there may be other factors that cause actions, events or results to differ from those anticipated, estimatedor intended. Forward-looking information contained herein is made as of the date of this presentation and the Companydisclaims any obligation to update any forward-looking information, whether as a result of new information, future events orresults or otherwise. There can be no assurance that forward-looking information or statements will prove to be accurate, asactual results and future events could differ materially from those anticipated in such information or statements. Accordingly,readers should not place undue reliance on forward-looking statements.
Dr. Fiona Childe (Ph.D., P. Geo), VP of Corporate Development for the Company, is a Qualified Person as defined in NationalInstrument 43-101 and has reviewed the disclosure of a technical or scientific nature contained in this presentation. Mr. RogerMarch (B.Sc. (Hons.), P. Geo), VP Project Exploration for the Company, is a Qualified Person as defined in National Instrument 43-101 and is the Qualified Person for the McIlvenna Bay Deposit.

McIlvenna Bay Location
3
McIlvenna Bay
& the Hanson
Lake Camp
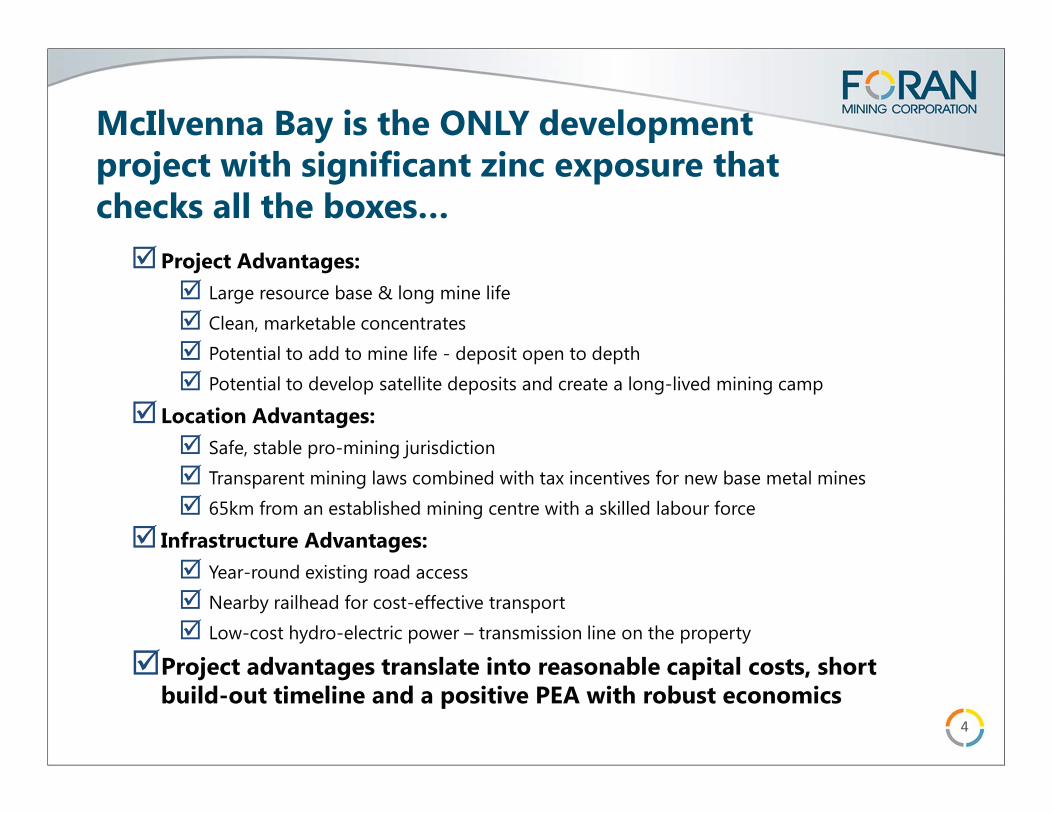
McIlvenna Bay is the ONLY development project with significant zinc exposure that checks all the boxes…
4
�Project Advantages:
� Large resource base & long mine life
� Clean, marketable concentrates
� Potential to add to mine life - deposit open to depth
� Potential to develop satellite deposits and create a long-lived mining camp
� Location Advantages:
� Safe, stable pro-mining jurisdiction
� Transparent mining laws combined with tax incentives for new base metal mines
� 65km from an established mining centre with a skilled labour force
� Infrastructure Advantages:
� Year-round existing road access
� Nearby railhead for cost-effective transport
� Low-cost hydro-electric power – transmission line on the property
�Project advantages translate into reasonable capital costs, short build-out timeline and a positive PEA with robust economics

McIlvenna Bay PEA Highlights
5
� Estimated pre-tax NPV7% of $382M & IRR of 22%
� Estimated post-tax NPV7% $263M & IRR of 19%
� 14 year mine life, 4.1 year payback
� Pre-production CapEx of $249M (incl. 20% contingency )
� Sustaining capital of $150M (incl. 20% contingency)
� Payable metal production:
� Zinc: 58.9 Mlbs. pa; 805 Mlbs. LOM
� Copper: 37.6 Mlbs. pa; 513.7 Mlbs. LOM,
� Gold: 16,000 oz. pa; 218,000 oz. LOM
� Silver: 398,000 oz. pa; 5.4 Moz. LOM
� Cash cost of production (net of by-product credits) of $(0.37) per pound of zinc, or $0.84 per pound of copper
� The deposit is open to depth, highlighting potential to increase mine life
All figures are quoted in CDN$ unless otherwise noted; base case metal prices and exchange rate of US$3.08/lb. Cu, US$1.06/lb., Zn, US$0.93/lb. Pb, US$1,238/oz. Au and US$17/oz. Ag based on spot as at Oct. 15, 2014. The PEA is considered preliminary in nature and includes mineral resources, including inferred mineral resources that are considered too speculative geologically to have the economic considerations applied to them that would enable them to be categorized as mineral reserves. Mineral resources that are not mineral reserves have not yet demonstrated economic viability. Due to the uncertainty that may be attached to mineral resources, it cannot be assumed that all or any part of a mineral resource will be upgraded to mineral reserves. Therefore, there is no certainty that the results concluded in the PEA will be realized.

0.00
0.05
0.10
0.15
0.20
0.25
0.30
EV
/NP
VMcIlvenna Bay Comparables
6
Based on post-tax project Net Present Values; Enterprise Values estimates as at November 11, 2014; Sources: company websites
Foran is undervalued relative to its peer group

Mineral Resources1
7
2013 McIlvenna Bay Indicated Mineral Resource Estimate (US$60t/ NSR cut-off)
Zone Tonnes(kt)
Cu(%)
Zn(%)
Au(g/t)
Ag(g/t)
CuEq(%)
ZnEq(%)
Main Lens – Upper West Zone 2,148 1.66 4.10 0.88 31 2.79 18.75
Main Lens – Zone 2 3,386 0.31 7.15 0.24 24 1.51 10.19
Lens 3 756 1.23 2.55 0.30 15 1.79 12.03
Copper Stockwork Zone 7,610 1.60 0.30 0.50 11 1.90 13.10
Total Indicated 13,900 1.96 13.19
1 Effective date Dec. 31, 2012; Metal prices for 2013 Resource are US$3.25/lb. Cu, US$1.10/lb. Zn, US$1,400/oz. Au & US$25/oz. Ag; The base case uses a US$60/t NSR cut-off using provisions for metallurgical recoveries, smelter payables, refining costs, freight, and applicable royalties; see appendices for full footnotes; for additional information see the Foran news release dated March 26, 2013 at www.sedar.com
2013 McIlvenna Bay Inferred Mineral Resource Estimate (US$60t/ NSR cut-off)
Zone Tonnes(kt)
Cu(%)
Zn(%)
Au(g/t)
Ag(g/t)
CuEq(%)
ZnEq(%)
Main Lens – Upper West Zone 2,913 1.63 3.68 0.51 19 2.47 16.62
Main Lens – Zone 2 2,796 0.51 7.13 0.38 26 1.79 12.04
Lens 3 124 1.61 2.67 0.51 18 2.31 15.52
Copper Stockwork Zone 5,478 1.56 0.47 0.42 12 1.87 12.59
Total Inferred 11,311 2.01 13.52
McIlvenna Bay has a large resource base & is open to depth

Metallurgy
8
Zone Cu Concentrate Zn Concentrate Pb-Cu ConcentrateCopper Stockwork
Zone
Composite Head
Grade: 1.45% Cu, 0.34
g/t Au, 8 g/t Ag
Grade:
29% Cu, 6.4g/t Au, 126g/t Ag
Recoveries:
94% Cu, 85% Au, 77% Ag
NA NA
Main Lens:
Upper West Zone
Composite Head
Grade: 3.97% Zn,
1.61% Cu, , 0.55 g/t
Au, 25 g/t Ag
Grade:
24% Cu, 6.5g/t Au, 216g/t Ag
Recoveries:
84% Cu, 60% Au, 50% Ag
Grade:
54% Zn
Recovery:
76% Zn
NA
Main Lens:
Zone 2
Composite Head
Grade: 7.25% Zn,
0.30% Cu, 0.19 g/t Au,
16 g/t Ag
NA Grade:
55% Zn
Recovery:
85% Zn
Grade:
12% Cu, 14% Pb, 5.3g/t Au, 332g/t Ag
Recoveries:
56% Cu, 59% Pb, 42% Au, 33% Ag
1 Testwork conducted by G&T Metallurgical Services (Stewart Group) on three composite samples prepared from core drilled by the Company; for additional information see the Foran news release dated June 20, 2013.
Clean, marketable concentrates amenable to conventional grinding & flotation

Summary of Key Parameters1
9
Mine Life 13.7 years
Plant Throughput (LOM ave.) 4,761 tpd
Revenue $2,504.9M LOM
OpEx $1,211.3M LOM
$51.03/tonne milled
Net Pre-tax Cash Flow $894.6M LOM
$65.5M/year
Net After-tax Cash Flow $646.2M LOM
$47.3M/year
Cash Cost (Net of By-Product)1
Cu
Zn
US$0.84/lb.
(US$0.37/lb.)
Pre-Tax NPV7%
Pre-Tax IRR
Pre-Tax Payback
$381.7M
21.9%
4.1 years
After-Tax NPV7%
After-Tax IRR
After-Tax Payback
$262.6M
18.9%
4.1 years
1 Includes all TC/RC, operating costs & royalties.
Capital Expenditures
Ave. OpEx Per tonne milled LOM
Mining $33.54 $796.2M
Processing $13.39 $317.7M
G&A $4.10 $97.4M
Total $51.03 $1,211.3M
Base Contingency
(20%)
Total
Pre-Prod.
CapEx
$207.3M $41.5M $248.8M
Sustaining
Capital
$125.2M $25.0M $150.3M
LOM $332.5M $66.5M $399.1M
Operating Costs
Estimated costs & design are in-line with existing mining
operations in the region
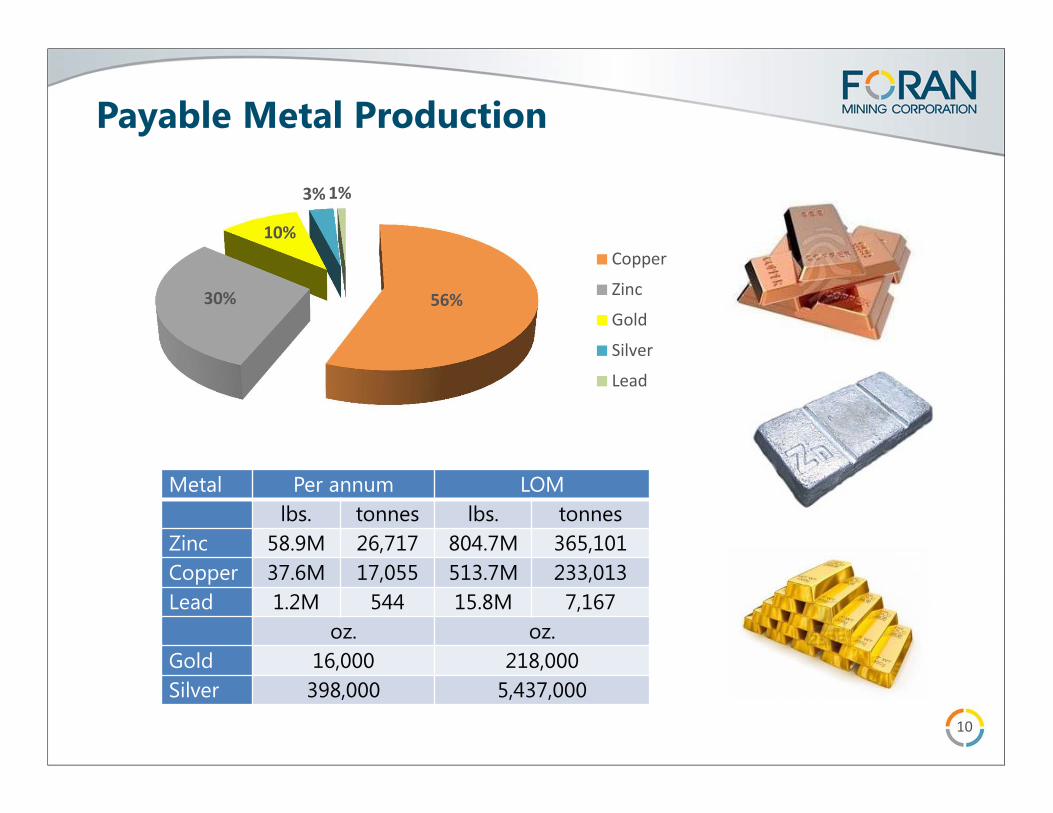
Payable Metal Production
10
Metal Per annum LOM
lbs. tonnes lbs. tonnes
Zinc 58.9M 26,717 804.7M 365,101
Copper 37.6M 17,055 513.7M 233,013
Lead 1.2M 544 15.8M 7,167
oz. oz.
Gold 16,000 218,000
Silver 398,000 5,437,000
56%30%
10%
3% 1%
Copper
Zinc
Gold
Silver
Lead

Sensitivity Analysis
11
$0
$50
$100
$150
$200
$250
$300
$350
$400
$450
0.9 1 1.1
After-Tax NPV
Metal Price Head Grades Operating Costs Capital Costs F/X Rate

Conceptual Mine Design
12
� 5,000 tpd underground mine
� Ramp & shaft to optimize resource extraction
� Broad thicknesses & steep dip of mineralization amenable to longhole stoping
� Structural backfill provided by cemented paste fill & ROM waste
Mine, Concentrator & Infrastructure
13
� Similar to existing mining operations in the region, with cost structure based on existing operations
� The majority of mine construction in 18 months, with a further 6 months for underground mine development
� On-site concentrator with conventional milling and flotation to produce marketable copper, zinc and bulk lead-copper concentrates
� Standard flow-sheet: crushing, milling, grinding, pre-float, batch floatation
� McIlvenna Bay is linked to Flin Flon, Manitoba by 85 km of highway followed by 18 km of unsealed secondary road.
� The PEA envisages a drive-in operation, with workers having a home base in Flin Flon and Creighton
� Existing hydro-electric power line on property would require upgrading to support the mine and concentrator

The Road Ahead
14
� Positive PEA results demonstrate that McIlvenna Bay should advance to a feasibility study
� Foran will continue to advance new discoveries & historic resources to delineate satellite deposits close to McIlvenna Bay
� Foran’s objective is to evaluate the economic potential of McIlvenna Bay and potential satellite deposits to develop a long-lived mining camp at Hanson Lake

Contacts
15
Patrick SoaresPresident & CEO904-409 Granville Street,Vancouver, BC, V6C 1T2
Fiona ChildeVP, Corporate Development2000-199 Bay St., P.O. Box 285Toronto, ON, M5L 1G9

Appendices
16
Disclosures & Qualified Persons
17
DisclosuresThe PEA is considered preliminary in nature and includes mineral resources, including inferred mineral resources that are considered too speculative geologically to have the economic considerations applied to them that would enable them to be categorized as mineral reserves. Mineral resources that are not mineral reserves have not yet demonstrated economic viability. Due to the uncertainty that may be attached to mineral resources, it cannot be assumed that all or any part of a mineral resource will be upgraded to mineral reserves. Therefore, there is no certainty that the results concluded in the PEA will be realized.
Qualified Persons & Technical ReportThe PEA for McIlvenna Bay summarized here was led by JDS Energy & Mining and will be incorporated into a National Instrument 43-101 (“NI 43-101”) technical report which will be filed on SEDAR and the Company’s website within 45 days of this release.
The portions of this presentation pertaining to engineering and financial estimates was reviewed and approved by Mr. Michael Makarenko, P.Eng., Senior Project Manager at JDS. Financial estimates for processing was reviewed and approved by Mr. Matt R. Bender, MBA, P.E., Director of Metallurgy at Samuel Engineering. The portions of this new release pertaining to the mineral resource estimate was reviewed and approved by Mr. David Rennie, P. Eng, Principle Geologist at RPA Inc., and the portions of this news release pertaining to metallurgical test work was reviewed and approved by Mr. Ken Major, P.Eng., Consulting Metallurgist. Messers Makarenko, Bender, Rennie and Major are all Qualified Persons as defined by NI 43-101. JDS, Samuel Engineering, RPA Inc. and Mr. Major are all independent of Foran. A full list of Qualified Persons contributing to the PEA will be summarized in the NI 43-101 technical report.

0
5
10
15
20
25
30F
lin
Flo
n
Lalo
r
McI
lve
nn
a B
ay
Tro
ut
Lak
e
77
7
Sta
ll L
ak
e
Ch
ise
l
Str
atm
at
Ca
llin
an
Ch
ise
l U/G
Co
ron
ati
on
Osb
ou
rne
Re
ed
An
de
rso
n
Ko
nu
to
Sp
ruce
Po
int
Sch
ist
Lake
Ce
nte
nn
ial
We
st A
rm
Co
ron
ati
on
Wh
ite
La
ke
DIc
kst
on
e
Ro
d
Dic
kst
on
e
Ph
oto
La
ke
Gh
ost
& L
ost
Cu
pru
s
Fle
xar
Bir
ch L
ak
e
No
rth
Sta
r
Ha
nso
n L
ake
Ma
nd
y
Do
n J
on
VMS Deposit Size Comparison
18
� VMS deposits form in clusters
� Majority of the deposits in each VMS cluster are 3-5 Mt, with potential for 1-2 large (+20Mt) to very large (+50Mt) deposits
� This clustering of VMS mineralization is being outlined at McIlvenna Bay
Dep
osi
t Siz
e(M
t)
VMS Deposits: Flin Flon – Snow Lake – McIlvenna Bay
Sources: Galley et al. (2007), company websites
62.5
McIlvenna Bay13.9Mt indicated11.3Mt inferred

McIlvenna Bay Resource Footnotes
19
1 Effective date January 1, 2013; CIM definitions were followed for Mineral Resources; CuEq = copper equivalent; ZnEq = zinc equivalent; NSR = Net Smelter Return.2 The base case mineral resource is estimated based on 178 diamond drill holes and a NSR cut-off grade of US$60/t. NSR grades were calculated and high grade caps were applied as per the discussion in Estimation Methodology and Parameters below and include provisions for metallurgical recovery and estimates of current shipping terms and smelter rates for similar concentrates. Metal prices used are US$3.25/lb. Cu, US$1.10/lb. Zn, US$1,400/oz. Au, and US$25/oz. Ag. Specific gravity was interpolated for each block based on measurements taken from core specimens.3 Mr. David Rennie, P.Eng., of RPA, prepared this mineral resource estimate. Mr. Rennie is independent of Foran and is a “Qualified Person” within the meaning of NI 43-101.4 Mineral resources which are not mineral reserves do not have demonstrated economic viability. The estimate of mineral resources may be materially affected by environmental, permitting, legal, marketing or other issues.5 CuEq and ZnEq values were estimated based on $53.94 per % Cu, $8.11 per % Zn, $31.16 per g/t Au and $0.03 per g/t Ag.6 For additional information see the Foran news release dated March 27, 2013 atwww.foranmining.com & www.sedar.com

McIlvenna Bay Metallurgy
20
Testwork conducted by G&T Metallurgical Services (Stewart Group); for additional information see Foran June 20, 2012 news release
Copper Stockwork Zone (1o grind of 100 µm K80, regrind of 35 µm K80)
Product
Assay Distribution
Mass
(%)
Cu
(%)
Zn
(%)
Ag
(g/t)
Au
(g/t)
Cu
(%)
Zn
(%)
Ag
(%)
Au
(%)
Feed 100 1.57 0.16 8 0.38 100 100 100 100
Cu Concentrate 5.1 29.2 1.05 126 6.38 94.4 33.8 76.9 84.6
Cu First Cleaner Tail 3.9 0.79 0.57 14 0.81 2.0 14.1 6.8 8.3
Cu Rougher Tail 91.0 0.06 0.09 2 0.03 3.7 52.1 16.4 7.1
Upper West Zone (1o grind of 100 µm K80, regrind of 12 µm K80 for Cu & 14 µm K80 for Zn)
Product
Assay Distribution
Mass
(%)
Cu
(%)
Pb
(%)
Zn
(%)
Ag
(g/t)
Au
(g/t)
Cu
(%)
Pb
(%)
Zn
(%)
Ag
(%)
Au
(%)
Feed 100 1.75 0.18 4.02 26 0.66 100 100 100 100 100
Prefloat 2.8 0.86 0.13 1.44 23 1.16 1.4 2.1 1.0 2.5 4.9
Cu Concentrate 6.0 24.2 1.3 6.40 216 6.50 83.4 43.4 9.6 50.3 59.7
Zn Concentrate 5.6 1.87 0.24 54.3 63 0.81 6.0 7.5 76.3 13.6 6.9
Zn First Cleaner Tail 7.7 0.69 0.14 2.39 22 0.53 3.0 6.0 4.6 6.6 6.2
Zn Rougher Tail 77.8 0.14 0.10 0.44 9 0.19 6.2 41.0 8.5 27.0 22.2
Zone 2 (1o grind of 73 µm K80, regrind of 16 µm K80 for Zn)
Product
Assay Distribution
Mass
(%)
Cu
(%)
Pb
(%)
Zn
(%)
Ag
(g/t)
Au
(g/t)
Cu
(%)
Pb
(%)
Zn
(%)
Ag
(%)
Au
(%)
Feed 100 0.33 0.41 6.96 15 0.21 100 100 100 100 100
Prefloat 3.5 0.20 0.32 5.89 11 0.11 2.1 2.8 3.0 2.6 1.9
Bulk Concentrate 1.6 11.9 15.4 9.18 332 5.27 56.0 59.1 2.1 34.4 38.5
Zn Concentrate 10.8 0.63 0.46 55.0 38 0.29 20.5 12.2 85.4 27.3 14.6
Zn First Cleaner Tail 17.8 0.16 0.15 0.96 10 0.15 8.4 6.5 2.5 11.6 12.7
Zn Rougher Tail 66.3 0.07 0.12 0.74 5 0.10 13.1 19.5 7.0 24.1 32.3
Overall Metallurgical Response locked cycle testing of composite samples
Recommended