Mazda’s Approach for Developing Engines from a Perspective of Environmental Improvement
Mazda’s Approach for Developing Engines from a Perspective of Environmental Improvement
2015 ERC Symposium
Mitsuo HitomiMazda Motor Corporation
• Improving thermal efficiency of ICEs
• Goal of SKYACTIV engines
• SKYACTIV engines: 1st step
• SKYACTIV engines: Next step
• Investigation results of boosted downsizing enginesand future strategy for engine displacement
Contents

3
Energy losses of ICE
Improving thermal efficiency of ICEs
Fuel Economy Improvement=Loss reductionAll technologies for improving fuel economy must overcome these seven controlling factors.
Effective work
Exhaust loss
Hea
t Ene
rgy
Bal
ance
(%)
Heat Energy Balance vs. Load
0
20
60
80
100
20 40 60 80 100Load (%)
40
Radiation, Misfiring loss
Cooling loss
Control factors
Pressure difference
between In. & Ex.
Mechanical friction
Specific heat ratio
Heat transferto wallPumping loss
Mech. friction loss
Combustionperiod
Combustion timing
Compression ratio

Gasoline engine Diesel engine
Further reduction
LeanHCCI
Adiabatic
Higher CR
LeanHCCI
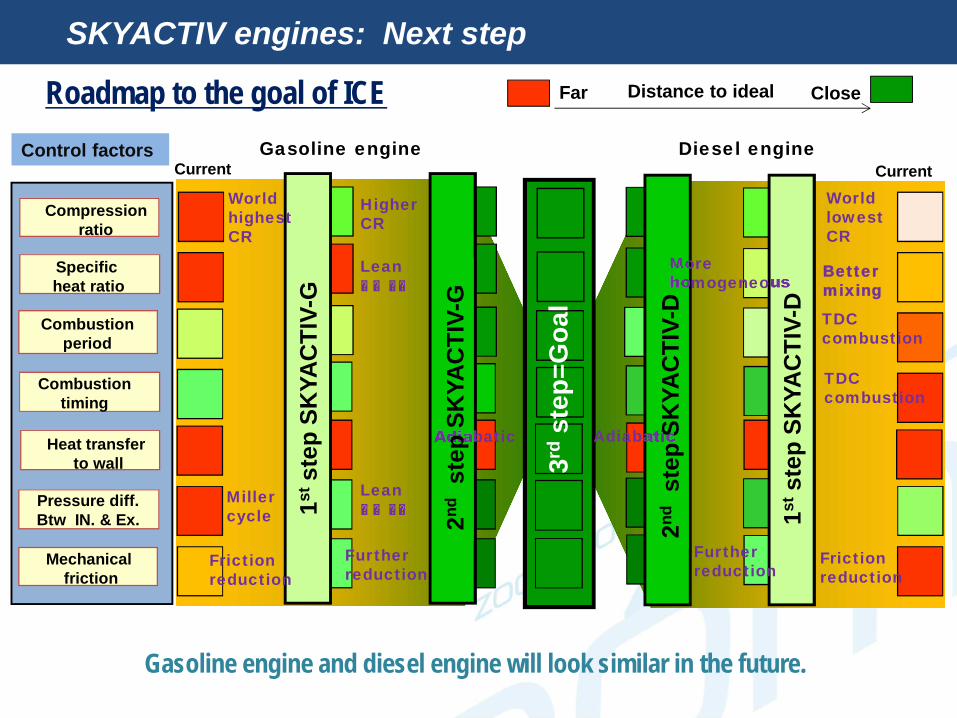
Roadmap to the goal of ICE Distance to idealFar Close
Specificheat ratio
Heat transferto wall
Compression ratio
Combustion period
Control factors
Combustiontiming
Pressure diff.Btw IN. & Ex.
Mechanicalfriction
Gasoline engine and diesel engine will look similar in the future.
Adiabatic
Further reduction
Friction reduction
More homogeneous
World lowest CR
TDC combustion
TDC combustion
World highest CR
Friction reduction
Miller cycle 1stst
ep S
KYA
CTI
V-G
1stst
ep S
KYA
CTI
V-D
2ndst
ep S
KYA
CTI
V-G
2ndst
ep S
KYA
CTI
V-D
3rd
step
=Goa
l
Current Current
Better mixing
4
Improving thermal efficiency of ICEs

• Improving thermal efficiency of ICEs
• Goal of SKYACTIV engines
• SKYACTIV engines: 1st step
• SKYACTIV engines: Next step
• Investigation results of boosted downsizing enginesand future strategy for engine displacement
Contents

After 2011 big earthquake in Japan
0.97
0.80
0.520.470.450.430.39
0.170.09
(kg-CO2/kWh)1.2
1.0
0.8
0.6
0.4
0.2
0France Canada Japan Italy UK Germany USA China India
0.52
Specific CO2 emission from electric power generation is assumed to be 0.5kg-CO2/kWh.
Specific CO2 emissions of electric power generation
6
Goal of SKYACTIV engines

A carB car
C car average15%
30%
45%
0%
Electric power consumption of C car in the real world: 21.2kWh/100km.Fuel consumption of Mazda 2L C car in the real world: 5.2L/100km
10 12 14 16 18 2010
12
14
16
18
20
22
24
26
28
30
Specific electricity consumption at NEDC (kWh/100km)
3
4
5
6
7
3 4 5 6 7
I2 0.9L
I3 I.0L
I3 0.9L
1.4L
I3 1.0L
1.2L
1.4L
A 1.8L1.6L
1.4L1.6L1.6L
1.2LI3 1.0L
1.4L1.6L
1.2L
1.6L
2.0L
1.4L
1.6L
1.4L
*Source : ADAC EcoTest NEU ab März 2012
1.4L
1.2L
Mazda3 2.0L SKYACTIV-G
Note I3I.2L
1.2L
F/E at NEDC (L/100km)
A car
B car
C car
7
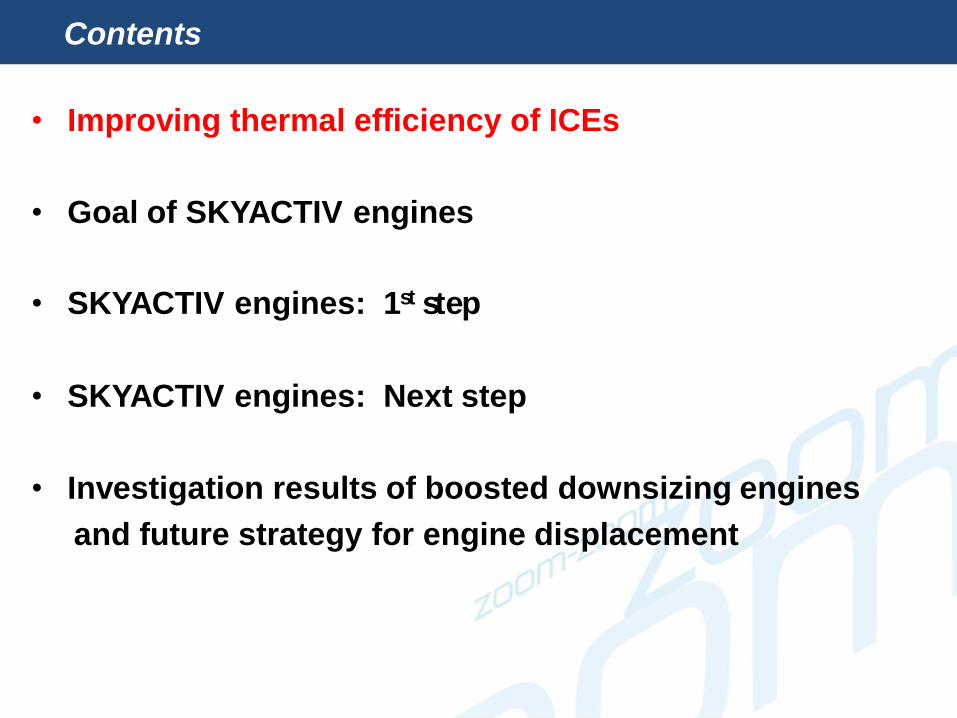
Fuel consumption reduction target for ICE powered vehicle in real world
21.2kWh/100km
Goal of SKYACTIV engines
0 0.1 0.2 0.3 0.4 0.5 0.6 0.7 0.8 0.9 1.00
20
40
60
80
100
120
140
Specific CO2 emission of electric power generation kg/kwh
Wel
l-to-
Whe
el_C
O2
(g/k
m)
4L/100km
3L/100km
Average
21.2kwh/100km=C car in the real world
Fuel consumption reduction target for ICE powered vehicle in real world
LCA considering just Li-ion Battery manufacturing2 ton (minimum estimation ever found)CO2 for 20kWh batteryLifetime mileage assumed 200,000km
Mazda3 2.0L = 5.2L/100km
Target for Mazda 3 5.2L/100km 4L (3.8L-4.2L)/100kmAround 25% fuel consumption reduction required
3.8L/100km
8
4.2L/100kmTarget; 4L/100km
Goal of SKYACTIV engines
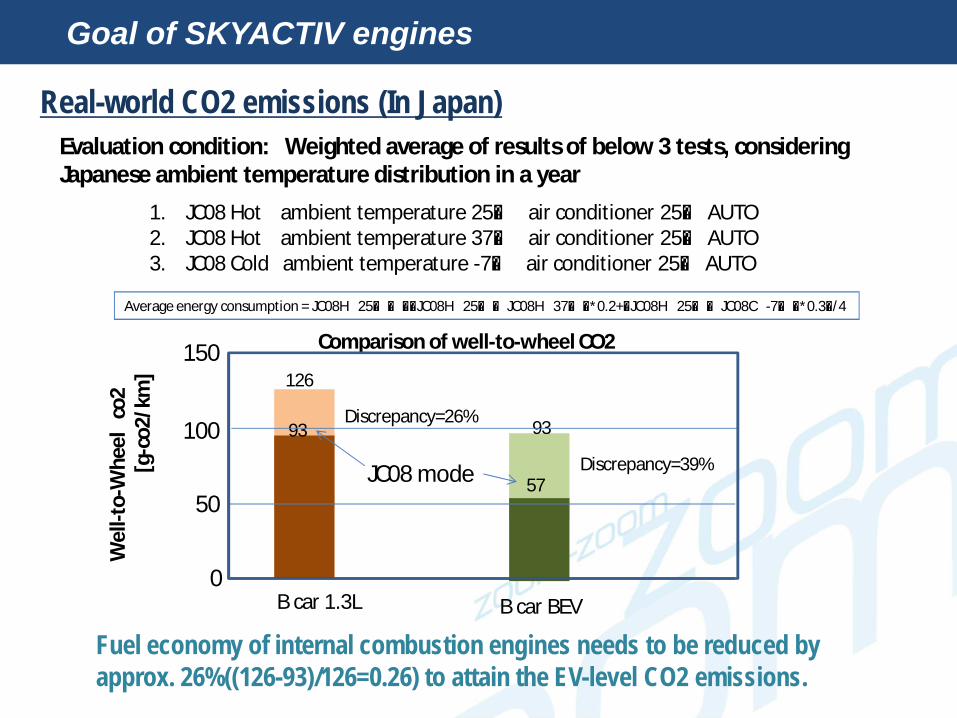
Comparison of well-to-wheel CO2
Wel
l-to-
Whe
elco
2[g
-co2
/km
]
B car 1.3L B car BEV
126
93 93
57Discrepancy=39%
Discrepancy=26%
1. JC08 Hot ambient temperature 25℃ air conditioner 25℃ AUTO2. JC08 Hot ambient temperature 37℃ air conditioner 25℃ AUTO3. JC08 Cold ambient temperature -7℃ air conditioner 25℃ AUTO
Real-world CO2 emissions (In Japan)Evaluation condition: Weighted average of results of below 3 tests, considering Japanese ambient temperature distribution in a year
0
50
100
150
Fuel economy of internal combustion engines needs to be reduced by approx. 26%((126-93)/126=0.26) to attain the EV-level CO2 emissions.
9
Average energy consumption = JC08H 25℃-((JC08H 25℃-JC08H 37℃)*0.2+(JC08H 25℃-JC08C -7℃)*0.3)/4
JC08 mode
Goal of SKYACTIV engines

• Improving thermal efficiency of ICEs
• Goal of SKYACTIV engines
• SKYACTIV engines: 1st step
• SKYACTIV engines: Next step
• Investigation results of boosted downsizing enginesand future strategy for engine displacement
Contents
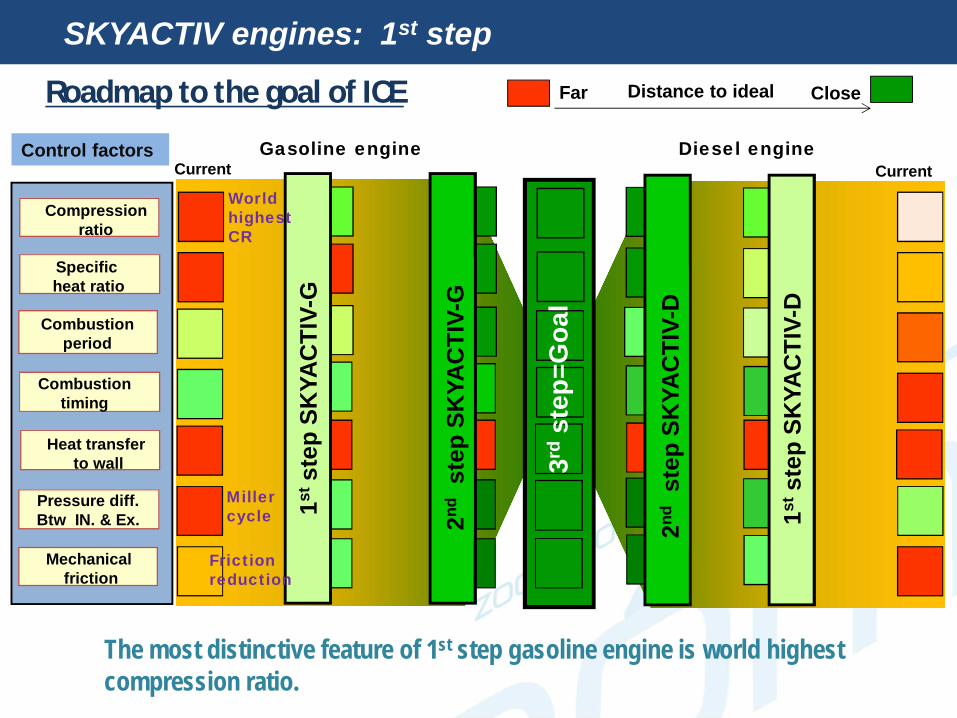
Gasoline engine Diesel engine
Roadmap to the goal of ICE Distance to idealFar Close
Specificheat ratio
Heat transferto wall
Compression ratio
Combustion period
Control factors
Combustiontiming
Pressure diff.Btw IN. & Ex.
Mechanicalfriction
The most distinctive feature of 1st step gasoline engine is world highest compression ratio.
World highest CR
Friction reduction
Miller cycle 1stst
ep S
KYA
CTI
V-G
1stst
ep S
KYA
CTI
V-D
2ndst
ep S
KYA
CTI
V-G
2ndst
ep S
KYA
CTI
V-D
3rd
step
=Goa
l
Current Current
11
SKYACTIV engines: 1st step

1212
Full load Performance
Competitors scatter band
EU B 2.0LEU B 2.0L
Improve low- and-mid end torque in spite of a high compression ratio and achieve superior driving
0 1000 2000 3000 4000 5000 6000 7000
Engine Speed (rpm)
Torq
ue (N
m)
95RON
圧縮比=14
15% improved to current 2.0L
SKYACTIV-G 2.0L CR=14SKYACTIV-G 2.0L CR=14
former2.0L GEformer2.0L GE
20Nm
SKYACTIV engines: 1st step

13
20Nm
1000 2000 3000 4000 5000 6000 7000Engine Speed (rpm)
Torq
ue (N
m)
SKYACTIV-G(4-2-1)95RON CR=14
Performance enhanced together with high compression ratio
former DI 91RONCR=11.2
former PFI 91RONCR=10
Compression ratio vs. RON
SKYACTIV-G(4-2-1)91RON CR=13
SKYACTIV engines: 1st step

14
50g/kWh
0 200 400 600 800 1000 1200 1400
BMEP(kPa)
1500rpm
D 2.0L
B 2.0L DIlean burn
A 2.0LDI T/C
E 2.0L DI
C Downsizing
SKYACTIV-G surpasses competitors’ all new engines including 30% downsized engines in fuel efficiency.
BSFCB
rake
spe
cific
fuel
co
nsum
ptio
n(g/
kWh)
SKYACTIV-G 2.0LSKYACTIV-G 2.0L
SKYACTIV engines: 1st step
15
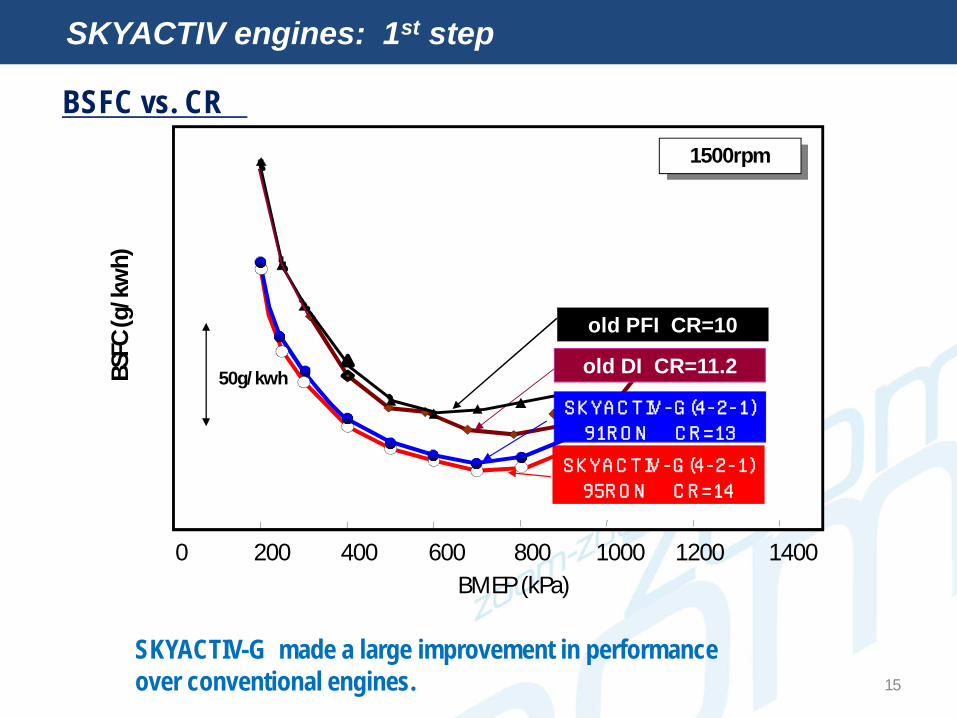
SKYACTIV-G made a large improvement in performance over conventional engines.
50g/kwh
0 200 400 600 800 1000 1200 1400BMEP (kPa)
BSFC
(g/k
wh)
1500rpm
old PFI CR=10
SKYACTIV-G(4-2-1) 95RON CR=14
SKYACTIV-G(4-2-1) 91RON CR=13
old DI CR=11.2
BSFC vs. CR
SKYACTIV engines: 1st step
• Improving thermal efficiency of ICEs
• Goal of SKYACTIV engines
• SKYACTIV engines: 1st step
• SKYACTIV engines: Next step
• Investigation results of boosted downsizing enginesand future strategy for engine displacement
Contents
Gasoline engine Diesel engine
Further reduction
LeanHCCI
Adiabatic
Higher CR
LeanHCCI
Roadmap to the goal of ICE Distance to idealFar Close
Specificheat ratio
Heat transferto wall
Compression ratio
Combustion period
Control factors
Combustiontiming
Pressure diff.Btw IN. & Ex.
Mechanicalfriction
Gasoline engine and diesel engine will look similar in the future.
Adiabatic
Further reduction
Friction reduction
More homogeneous
World lowest CR
TDC combustion
TDC combustion
World highest CR
Friction reduction
Miller cycle 1stst
ep S
KYA
CTI
V-G
1stst
ep S
KYA
CTI
V-D
2ndst
ep S
KYA
CTI
V-G
2ndst
ep S
KYA
CTI
V-D
3rd
step
=Goa
l
Current Current
Better mixing
17
SKYACTIV engines: Next step
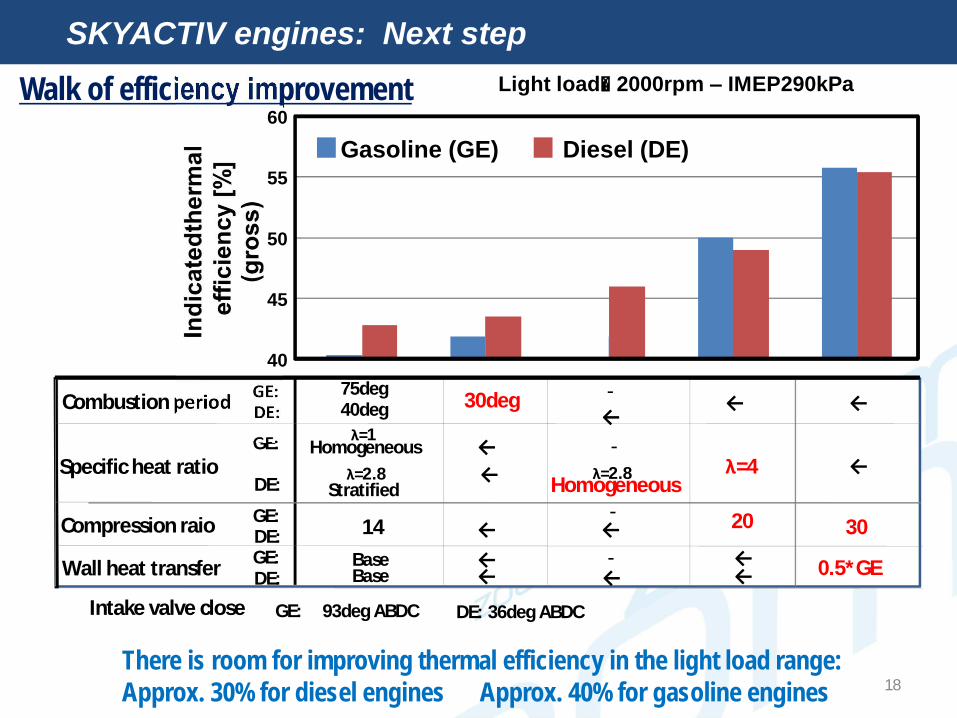
There is room for improving thermal efficiency in the light load range:Approx. 30% for diesel engines Approx. 40% for gasoline engines 18
Light load: 2000rpm – IMEP290kPaWalk of efficiency improvement
Combustion period GE:DE:
Specific heat ratioGE:
DE:
Compression raio GE:DE:
Wall heat transfer GE:DE:
Intake valve close GE: DE:93deg ABDC 36deg ABDC
Base ← ←Base ← ← ←
40deg 30deg←
← ←
Homogeneous
Stratified
←← Homogeneous
←
14 ← ← 20 30
-λ=1
λ=2.8 λ=2.8 λ=4
0.5*GE
40
45
50
55
60
Gasoline (GE) Diesel (DE)
75deg -
-
-
SKYACTIV engines: Next step
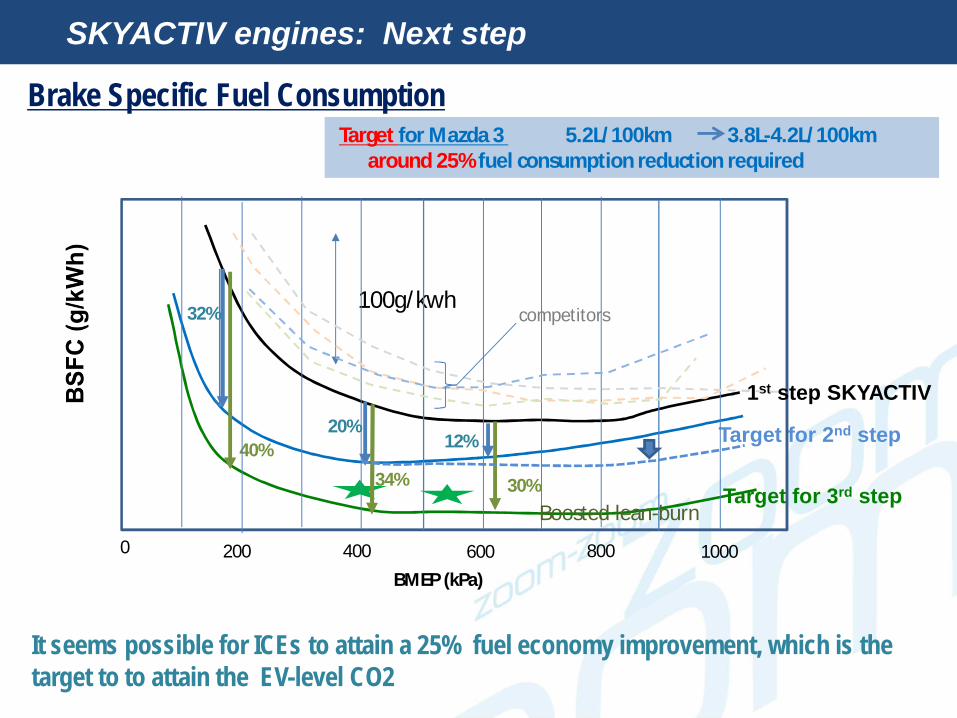
It seems possible for ICEs to attain a 25% fuel economy improvement, which is the target to to attain the EV-level CO2
Brake Specific Fuel Consumption
19
Target for 2nd step
100g/kwh
0
Target for 3rd step
200 400 600 800 1000BMEP (kPa)
32%
40%20%
34%
12%
30%
1st step SKYACTIV
Boosted lean-burn
Target for Mazda 3 5.2L/100km 3.8L-4.2L/100kmaround 25% fuel consumption reduction required
SKYACTIV engines: Next step
competitors
20
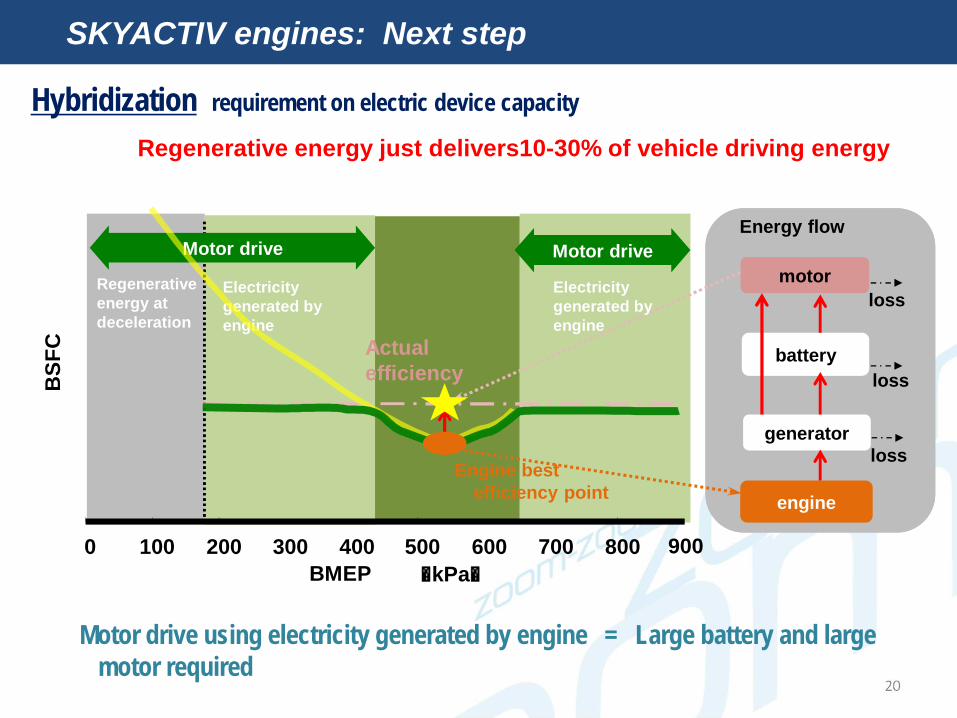
Motor drive using electricity generated by engine = Large battery and large motor required
generator
battery
engine
Energy flow
motorloss
Hybridization requirement on electric device capacity
Regenerative energy just delivers10-30% of vehicle driving energy
loss
loss
0 100 200 300 400 500 600 700 800BMEP (kPa)
BSF
C
Engine best efficiency point
Actual efficiency
900
Regenerative energy at deceleration
Electricity generated by engine
Motor drive Motor drive
Electricity generated by engine
SKYACTIV engines: Next step

21
When Mazda’s next-generation engines are hybridized, small-sized motor and battery are sufficient enough to power engines.
Hybridization requirement on electric device capacity
0 100 200 300 400 500 600 700 800BMEP (kPa)
BSF
C
900
by engine
Motor drive
Brake energy at deceleration
Motor drive
Current Hybrid
2nd step engines
Where motor drive electricity generated
Motor drive
SKYACTIV engines: Next step

• Improving thermal efficiency of ICEs
• Goal of SKYACTIV engines
• SKYACTIV engines: 1st step
• SKYACTIV engines: Next step
• Investigation results of boosted downsizing enginesand future strategy for engine displacement
Contents
0 20 40 60 80100120140160180200220240
Torque (Nm)
4000rpm 95RON
2.5L NA ε=13
1L T/C ε=10
180200220240260280300320340360380400
0 20406080100120140160180200220240
BSFC
(g/k
Wh)
Torque (Nm)
2000rpm 95RON2.5L NA ε=13
1L T/C ε=6
1L T/C ε=10
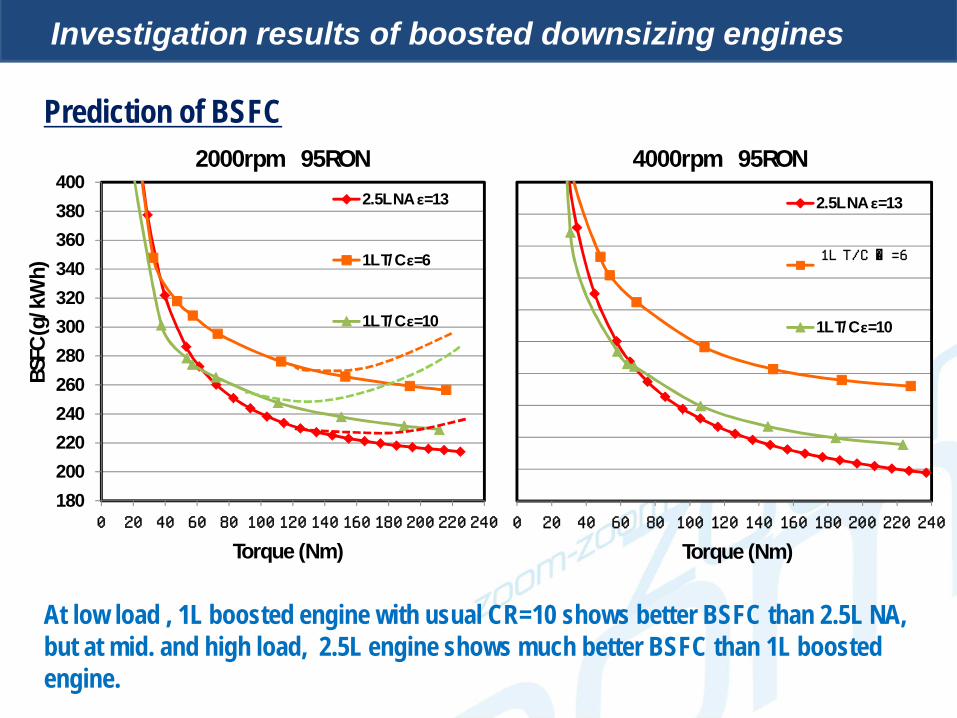
Prediction of BSFC
1L T/C ε=6
At low load , 1L boosted engine with usual CR=10 shows better BSFC than 2.5L NA, but at mid. and high load, 2.5L engine shows much better BSFC than 1L boosted engine.
Investigation results of boosted downsizing engines
24
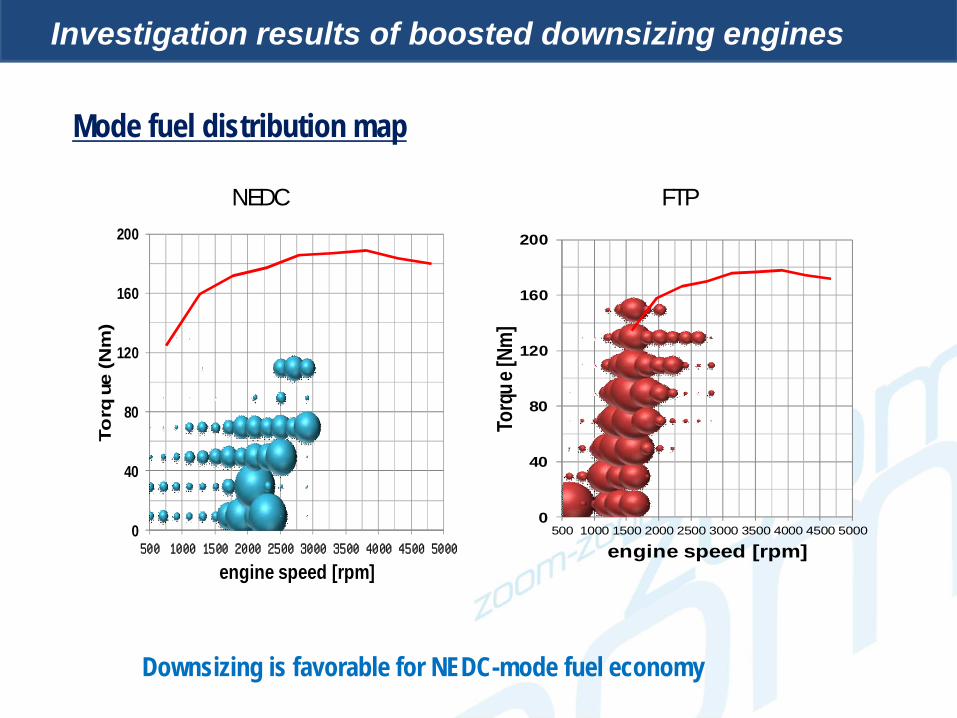
Downsizing is favorable for NEDC-mode fuel economy
0
40
80
120
160
200
500100015002000250030003500400045005000
Torq
ue (
Nm
)
engine speed [rpm]
0
40
80
120
160
200
500 1000 1500 2000 2500 3000 3500 4000 4500 5000
Torq
ue [N
m]
engine speed [rpm]
Mode fuel distribution map
NEDC FTP
Investigation results of boosted downsizing engines
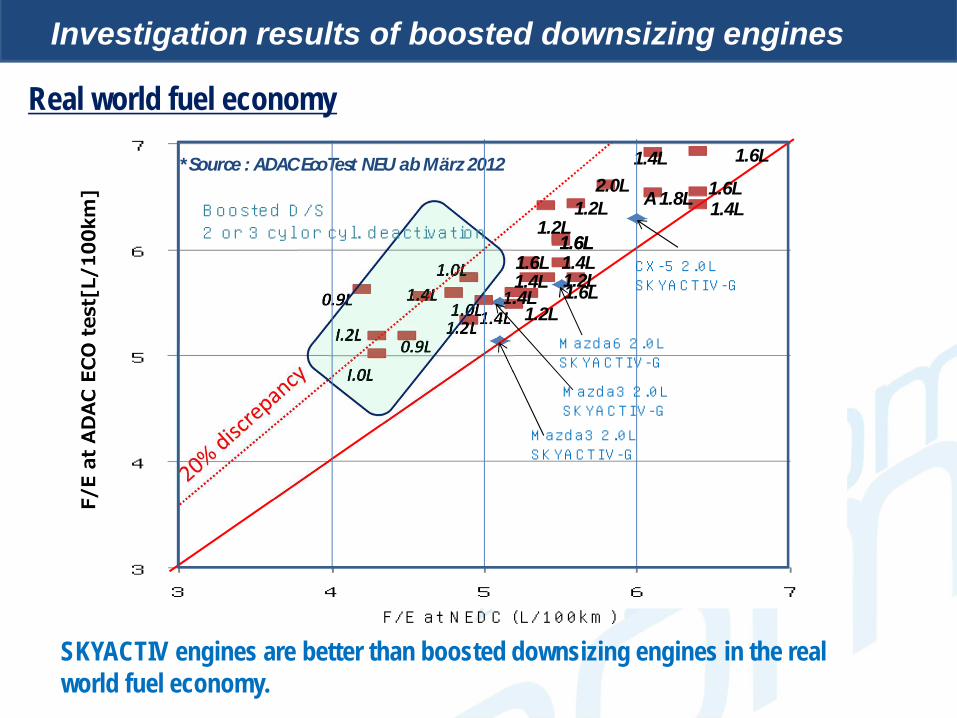
Real world fuel economy
SKYACTIV engines are better than boosted downsizing engines in the real world fuel economy.
3
4
5
6
7
3 4 5 6 7
0.9L
I.0L0.9L
1.4L 1.0L
1.2L
1.4L
A 1.8L 1.6L
1.4L1.6L1.6L
1.2L1.0L1.4L1.6L
1.2L
1.6L
2.0L 1.4L
1.6L
1.4L
*Source : ADAC EcoTest NEU ab März 2012 1.4L
1.2L
Mazda3 2.0L SKYACTIV-G
I.2L
1.2LBoosted D/S2 or 3 cyl or cyl. deactivation
F/E at NEDC (L/100km)
Mazda6 2.0L SKYACTIV-G
CX-5 2.0L SKYACTIV-G
Mazda3 2.0L SKYACTIV-G
Investigation results of boosted downsizing engines
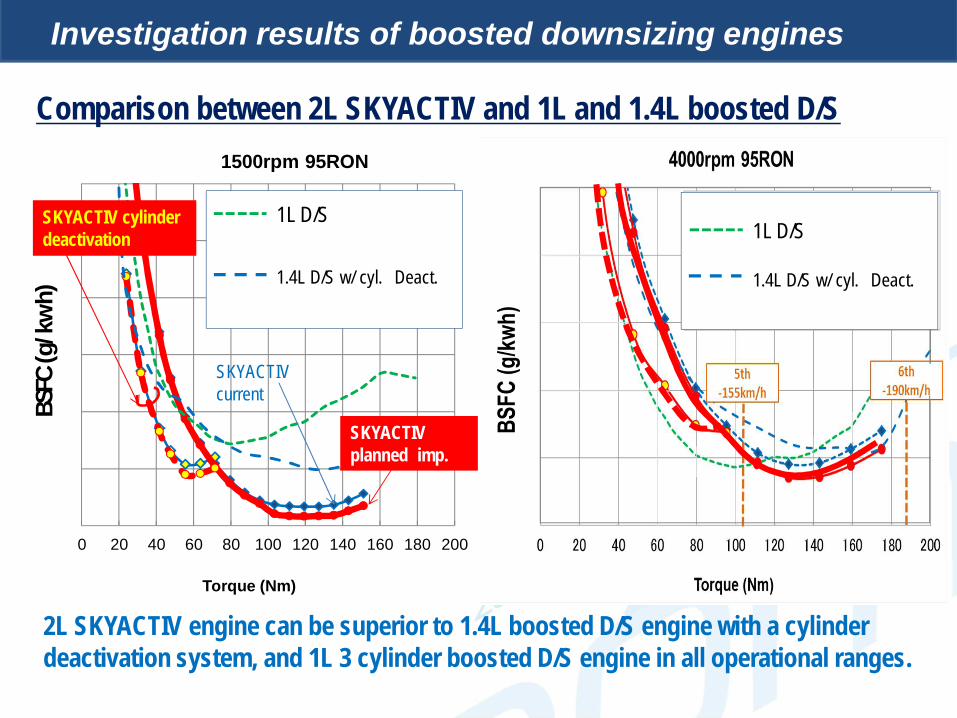
Comparison between 2L SKYACTIV and 1L and 1.4L boosted D/S
2L SKYACTIV engine can be superior to 1.4L boosted D/S engine with a cylinder deactivation system, and 1L 3 cylinder boosted D/S engine in all operational ranges.
0 20 40 60 80 100 120 140 160 180 200
BSFC
(g/k
wh)
Torque (Nm)
1500rpm 95RON
1L D/S
1.4L D/S w/ cyl. Deact.
SKYACTIV current
SKYACTIV cylinder deactivation
1.4L D/S w/ cyl. Deact.
1L D/S
SKYACTIV planned imp.
Investigation results of boosted downsizing engines
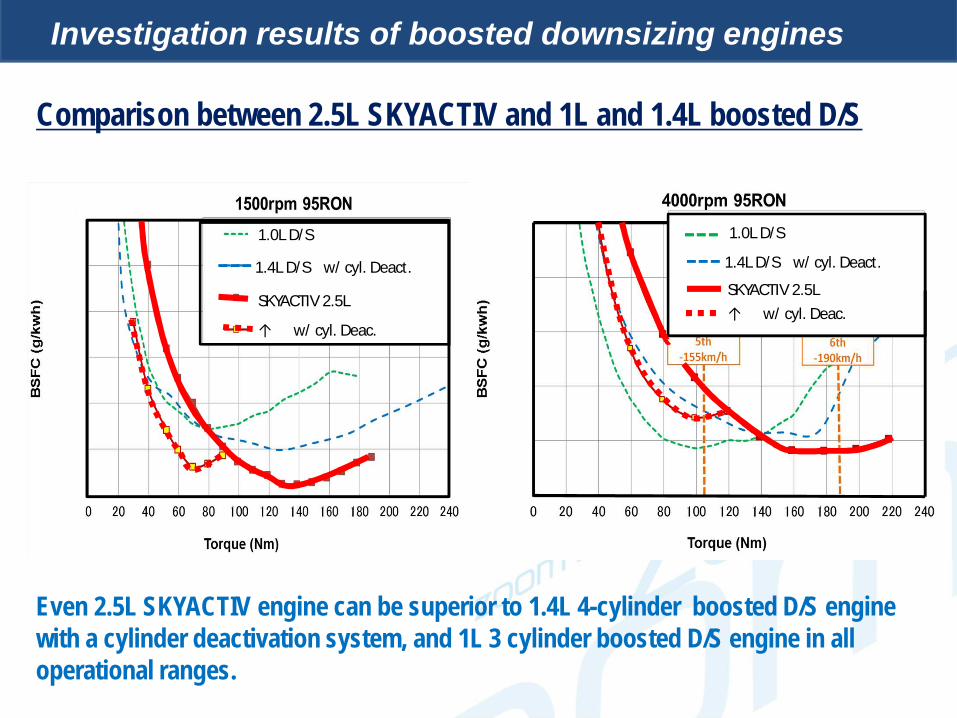
Even 2.5L SKYACTIV engine can be superior to 1.4L 4-cylinder boosted D/S engine with a cylinder deactivation system, and 1L 3 cylinder boosted D/S engine in all operational ranges.
1.4L D/S w/ cyl. Deact.
1.0L D/S
SKYACTIV 2.5L
↑ w/ cyl. Deac.
1.4L D/S w/ cyl. Deact.
1.0L D/S
SKYACTIV 2.5L↑ w/ cyl. Deac.
Comparison between 2.5L SKYACTIV and 1L and 1.4L boosted D/S
Investigation results of boosted downsizing engines
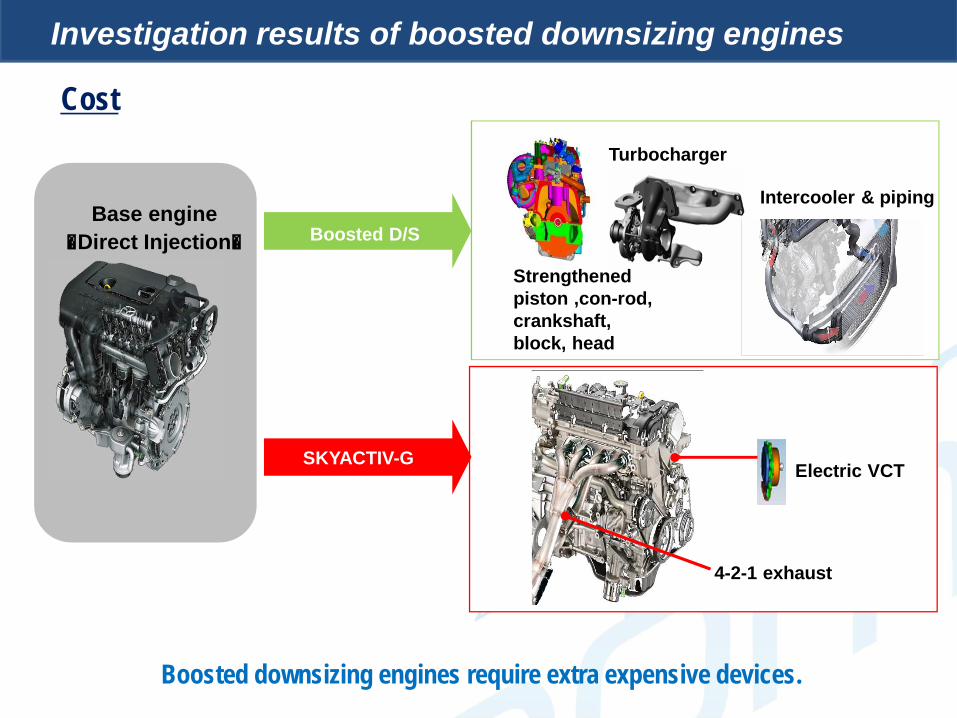
Base engine(Direct Injection)
Strengthened piston ,con-rod, crankshaft, block, head
Turbocharger
Intercooler & piping
Boosted D/S
Electric VCT
4-2-1 exhaust
SKYACTIV-G
Cost
Boosted downsizing engines require extra expensive devices.
Investigation results of boosted downsizing engines
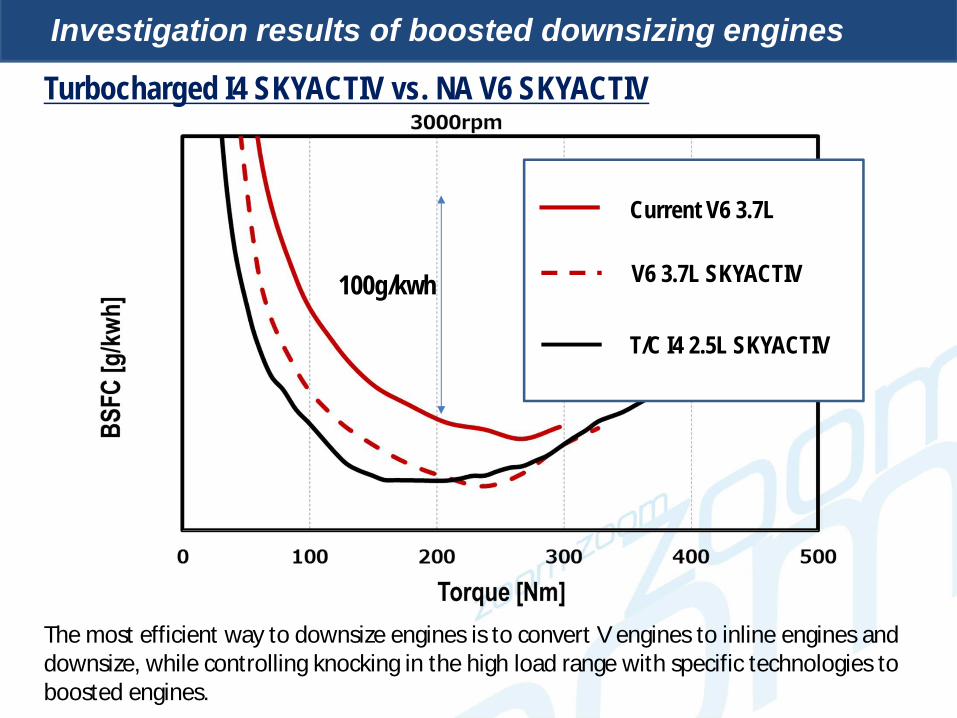
100g/kwh
Investigation results of boosted downsizing engines
Current V6 3.7L
V6 3.7L SKYACTIV
T/C I4 2.5L SKYACTIV
Turbocharged I4 SKYACTIV vs. NA V6 SKYACTIV
The most efficient way to downsize engines is to convert V engines to inline engines and downsize, while controlling knocking in the high load range with specific technologies to boosted engines.

0.6
0.8
1.0
1.2
1.4
1.6
1.8
0 1000 2000 3000 4000 5000
Frict
ion
ratio
Displacement [cc]
6 cylinders4cylinders
2.5L 3.7L
V6⇒V6
I4⇒I4V6⇒I4
Effect of friction reduction by downsizing and cylinder number reduction
Mechanical friction reduction due to downsizing 3.7 L V6 to 2.5 L I4 is 1.6-times greater than downsizing 3.7 L V6 to 2.5 L V6 or 3.7 L I4 to 2.5 L I4. As a result, fuel economy is significantly improved.
Mechanical friction reduction due to downsizing 3.7 L V6 to 2.5 L I4 is 1.6-times greater than downsizing 3.7 L V6 to 2.5 L V6 or 3.7 L I4 to 2.5 L I4. As a result, fuel economy is significantly improved.
Investigation results of boosted downsizing engines

Cost comparison between NA V6 SKYACTIV and Turbocharged I4 SKYACTIV
T/C I4 SKYACTIVNA V6 NA V6 SKYACTIV
Investigation results of boosted downsizing engines
• To convert a NA V6 engine to a T/C I4 SKYACTIV engine with 4 cylinders, costs of some devices, such as an electric VVT, a high-pressure fuel rail and others will be halved than to convert a V6 engine to a V6 SKYACTIV engine.
• The cost of an injector and coils will be reduced to two-thirds.• When an inlet 4-cylinder engine is converted to a inlet 4-cylinder SKYACTIV engine, the cost of
additional devices are unchanged. The cost is raised due to a turbocharger.• In the case of a 3-cylinder engine, only costs of parts for one cylinder are saved.
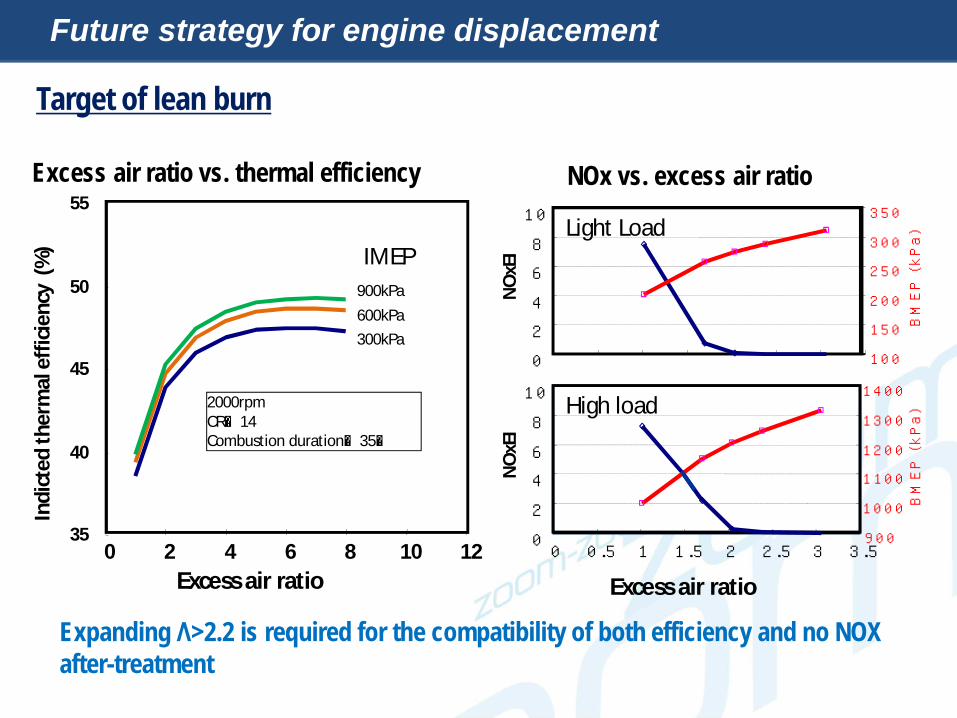
Excess air ratio vs. thermal efficiency NOx vs. excess air ratio
Expanding Λ>2.2 is required for the compatibility of both efficiency and no NOX after-treatment
0246810
0 0.5 1 1.5 2 2.5 3 3.5
NO
xEI
90010001100120013001400
BMEP (kPa)
0246810
NO
xEI
100150200250300350
BMEP (kPa)Light Load
High load2000rpmCR=14Combustion duration=35°
35
40
45
50
55
0 2 4 6 8 10 12Excess air ratio
Indi
cted
ther
mal
effi
cien
cy (
%)
300kPa600kPa900kPa
IMEP
Excess air ratio
Future strategy for engine displacement
Target of lean burn

2000rpm
180200220240260280300320340360380400
0 20 40 60 80 100 120 140 160 180 200 220 240
BSFC (g/kWh)
Torque (Nm)
50403020100 1L turbo CR=10 λ=1
1L turbo CR=10 lean 2.5L NA CR=13 λ=1 2.5L NA CR=13 lean
Λ=2.2
Λ=1 EGR
Λ=1 EGR
Lean burn capable area against displacement
Large Disp. NA can enlarge lean-burn area wider than boosted downsizing.Boosted Upsizing for wide lean-burn area is recommendable
32
01
-1
Future strategy for engine displacement
Examination of fuel economy

Examination of fuel economy
July 2008
Averaged mileage/year is somewhere between 10,000 and 15,000 km. (US excluded.)
Average mileage /year
Country
Japan
United States
England
Germany
France
Vehicle age(years)
9,896
18,870
14,720
12,600
5,84
8,30
6,20
6,75
14,100 7,50
Ref.)report from investigative commission on c lean diesel passenger car growth・future prospect
Mileage/year (km)

1 Ford Fusion SE Hybrid 39 35 412 Toyota Camry Hybrid XLE 38 32 433 Volkswagen Passat TDI SE 37 26 514 Hyundai Sonata Hybrid 33 24 405 Mazda6 Sport 32 22 446 Nissan Altima 2.5 S (4-cyl.) 31 21 447 Honda Accord LX (4-cyl.) 30 21 408 Chevrolet Malibu Eco 29 20 419 Toyota Camry LE (4-cyl.) 27 19 4110 Hyundai Sonata GLS 27 18 39
11 Subaru Legacy 2.5i Premium 26 18 35
12 Chevrolet Malibu 1LT 26 17 3813 Toyota Camry XLE (V6) 26 17 3714 Honda Accord EX-L (V6) 26 16 39
COMBI CITY HWY
Midsized cars
Real world fuel economy (US)
Fuel economy (mpg)
Consumer report 2013
Fuel economy of HEV is superior , however,…
1 Honda Civic Hybrid 40 28 50
2 Volkswagen Jetta Hybrid SE 37 29 45
3 Volkswagen Jetta TDI 34 25 45
4 Mazda3 i Touring sedan 33 23 45
5 Chevrolet Cruze Turbo Diesel 33 22 49
6Mazda3 i Grand Touring hatchback 32 24 41
7 Toyota Corolla LE Plus 32 23 438 Ford Focus SE SFE 31 21 43
9 Volkswagen Jetta SE (1.8T) 30 21 39
10 Nissan Sentra SV 29 21 3811 Honda Civic EX 29 20 4012 Hyundai Elantra GLS 29 20 3913 Dodge Dart Rallye 29 19 41
COMPACT CARS Overall mpg = 29 or higher
COMBI CITY HWYFuel economy (mpg)
Examination of fuel economy

0500
100015002000250030003500400045005000
0 10 20 30 40 50 60 70 80 90 100
14001150
mpg
Mid size cars 1400-1150=250$/year
Compact cars1358-1121=237$/year
Mid size conventionalMid size HEV
Examination of fuel economy
Fuel cost / yearassuming 19,000km /year gasoline price; 3.8$/gallon
Average drive cannot payoff the price increase by HEV by superior fuel economy

Summary
38
• We created roadmaps toward the ideal ICE and are steadily advancing developments accordingly.
• We introduced the world’s highest compression ratio into the gasoline engines at the first step.
• We believe that our approach is more reasonable than the boosted downsizing approach from a perspective of real-world fuel economy and cost.
• We believe that hybrid-level fuel economy is achievable with just improving ICE technologies and that EV-level CO2 emissions is also achievable with improved ICE and simple hybrid technologies.
• We believe that the EV-level of well-to-wheel CO2 emissions is achievable with approx. 25% improvements from that of the current SKYACTIV. Once EVs have held a large share of the market, tremendous amount of electricity will have to be generated. As a result, EVs will be unable to obtain benefits from the current electric price due to the electric price increase.
• We regard large engine displacement as a cost free turbocharger, and plan to maximize its advantage and increase engine displacement.
• If expensive technologies which only improve fuel economy are offered to our customers, they cannot pay off high vehicle prices. Therefore, we continuously offer technologies together with additional values, such as driving pleasure.

Thank you for your attention!
ConclusionConclusion
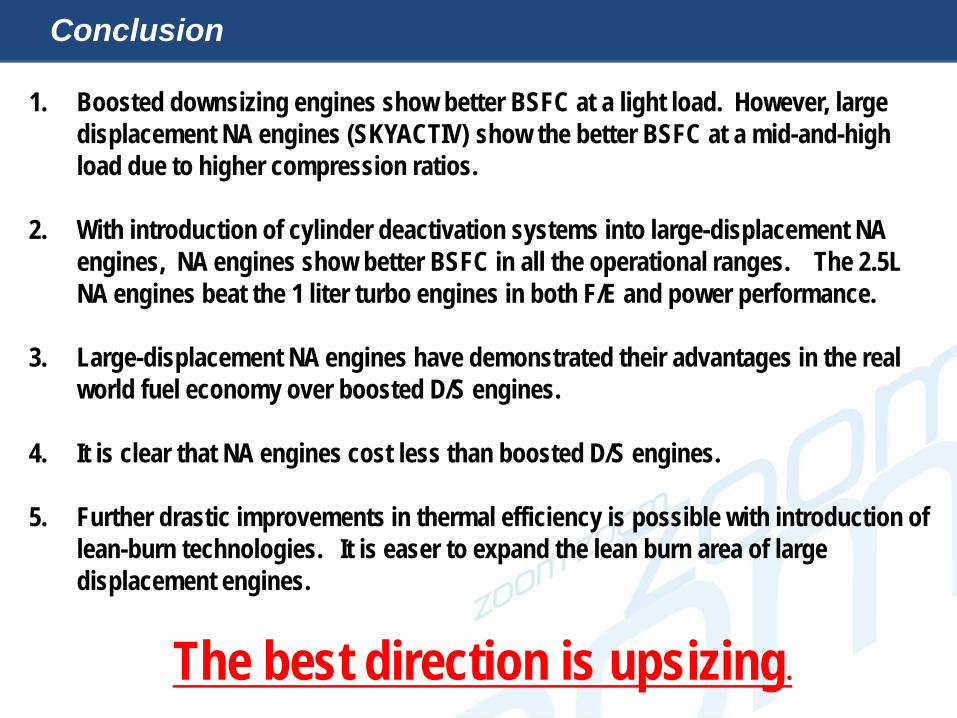
1. Boosted downsizing engines show better BSFC at a light load. However, large displacement NA engines (SKYACTIV) show the better BSFC at a mid-and-high load due to higher compression ratios.
2. With introduction of cylinder deactivation systems into large-displacement NA engines, NA engines show better BSFC in all the operational ranges. The 2.5L NA engines beat the 1 liter turbo engines in both F/E and power performance.
3. Large-displacement NA engines have demonstrated their advantages in the real world fuel economy over boosted D/S engines.
4. It is clear that NA engines cost less than boosted D/S engines.
5. Further drastic improvements in thermal efficiency is possible with introduction of lean-burn technologies. It is easer to expand the lean burn area of large displacement engines.
The best direction is upsizing.

• Fossil fuel reserve production said to be more than 170 years. (Source: World energy outlook 2011)
• Please assess CO2 on the well-to-wheel basis.• Please bear in mind that establishing low CO2 electric power
generation must come first before giving much incentives and prepare many electric chargers to expand EV use. This is the same for FCVs (fuel cell vehicles)
• It is possible to improve ICEs to achieve the well-to-wheel CO2 equal to that of EVs.
Drastic improvements of ICE efficiency are the most realistic way to improve the environment until a sustainable new energy source is developed.
Additional message

The 2nd step engine targets higher CR & leaner CAI.
Further thermal efficiency improvement
SKYACTIV engines: Next step
42
10 14 18 221
2
3
4
5
6
7
8
圧縮比ε
空気過剰率 λ
48%
48%
46%
46%
44%
44%42%
42%
2000rpm/200kPa
Compression ratio
Excess air ratio λ
SISI
CAICAI
λ=2.0
λ=2.5
SI lean-burn is not feasible at λ>2
NOx=0 λ>2.2
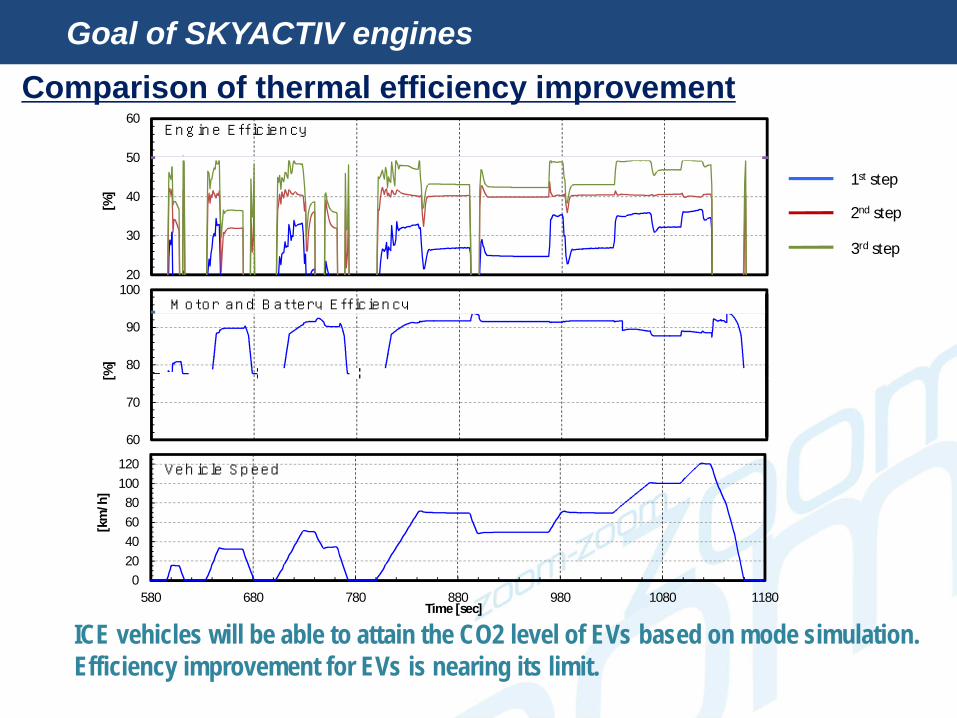
Comparison of thermal efficiency improvement
20
30
40
50
60[%
]
Engine Efficiency
020406080
100120
580 680 780 880 980 1080 1180
[km
/h]
Time [sec]
Vehicle Speed
1st step
2nd step
3rd step
60
70
80
90
100
[%]
Motor and Battery Efficiency
ICE vehicles will be able to attain the CO2 level of EVs based on mode simulation. Efficiency improvement for EVs is nearing its limit.
43
Goal of SKYACTIV engines
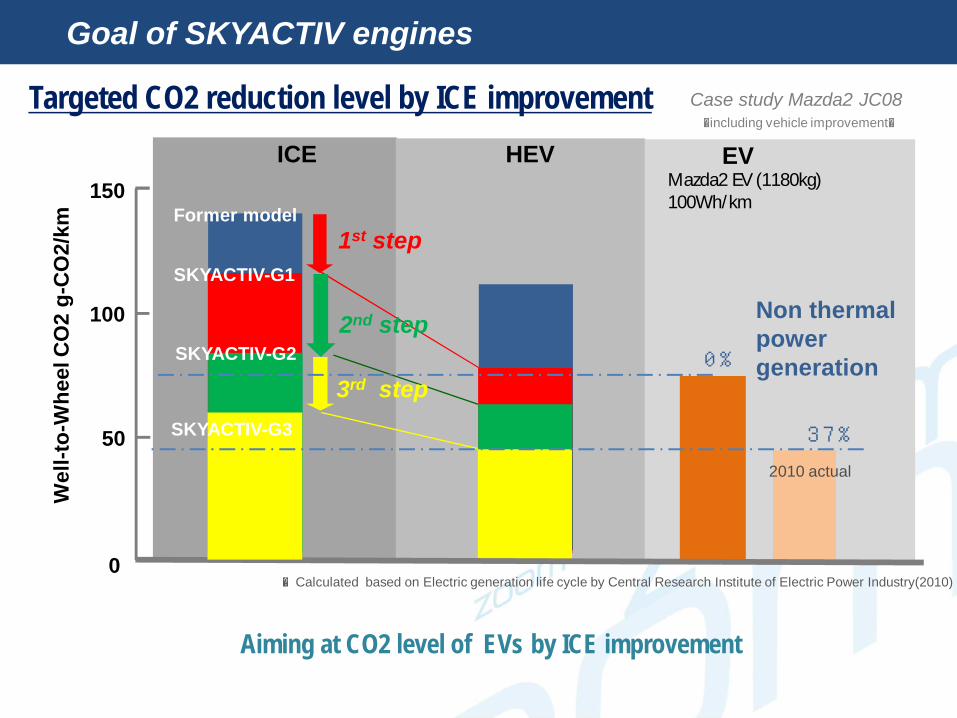
Targeted CO2 reduction level by ICE improvement
Aiming at CO2 level of EVs by ICE improvement
※Calculated based on Electric generation life cycle by Central Research Institute of Electric Power Industry(2010)0
50
100
Wel
l-to-
Whe
el C
O2
g-C
O2/
km
HEV150
EVICE(including vehicle improvement)
1st step
2nd step
3rd step
SKYACTIV-G1
Former model
Non thermal power generation
37%
Mazda2 EV (1180kg)100Wh/km
2010 actual
0%
Case study Mazda2 JC08
44
SKYACTIV-G2
SKYACTIV-G3
Goal of SKYACTIV engines

0
50
100
150
Wel
l-to-
whe
el C
O2
-g/k
m
EPA
CARB
1st step
Wel
l-to-
whe
el C
O2
-g/k
m
ICE HEV EV
US CombiC-Segment including vehicle improvementCO2/Gasoline 2.32kg/L
Targeted CO2 reduction level by ICE improvement
US average level of CO2 is achievable.
SKYACTIV-G1
SKYACTIV-G2
SKYACTIV-G3
Goal of SKYACTIV engines
Recommended