MAY 1937
SURVEY OF
CURRENT BUSINESS
UNITED STATES DE.PARTMENT OF COMMERCE 'BUREAU OF FOREIGN AND DOMESTIC COMMERCE
WASHINGTON VOLUME 17 NUMBER 5

A New Index of Grocery Chain Store Sales
is presented in the article by Reba L. Osborne of the Market
ing Research Division. This index is another in the series
of retail sales indexes developed by the Bureau of Foreign
and Domestic Commerce to measure the flow of goods
into the hands of consumers. Previously, indexes of
variety store sales, rural sales of general merchandise,
and new passenger automobile sales had been developed
and presented in the SURVEY, while in the issue of Sep
tember 1936, page 14, regional indexes of rural sales of
general merchandise were presented.
The grocery chain store sales index is based on the
sales of 10 companies, operating in 1935 more than 30,500
stores, or 65 percent of the grocery chain stores reported
in the 1935 Census of Retail Trade. Total sales of the
reporting chains in 1935 amounted to $1,641,000,000, or
5 percent of the total retail sales for the year.
The method of computing the index is set forth in full
in the article, and the accompanying table presents index
numbers for the period January 1929 to March 1937.

UNITED STATES DEPARTMENT OF COMMERCE DANIEL C. ROPER, Secretary
BUREAU OF FOREIGN AND DOMESTIC COMMERCE ALEXANDER V. DYE, Director
SURVEY OF CURRENT BUSINESS
Prepared in the
DIVISION OF ECONOMIC RESEARCH
ROY G. BLAKEY, Chief M. JOSEPH MEEHAN, Editor
Volume 17 MAY 1937 Number 5
CONTENTS SUMMARIES AND CHARTS Pa~e
Business indicators................ . • . . • . • . • . . . . .. • . . • . . . • . . • . • . . . . . . 2 Business situation summarized...................................... 3 Graphic comparison of principal data...... . . . . . . . . . . • . . . . • .. .. • . . . . . 4 Commodity prices................................................... 5 Domestic trade...................................................... 6 Employment........................................................ 7 Finance............................................................. 8 Forei~n trade. .. .. . . .. .. .. . . .. . .. . .. .. . . .. .. .. .. . . .. . .. . .. .. . . .. . . .. 9 Real estate and construction........ . . . . . . . . . . . . . . . . . . . . . . . . . . . • . . . . 10
Survey of individual indus tries: Automobiles and rubber......................................... ll Iron and steel................................................... 12 Textile Industries............................................... 13
SPECIAL ARTICLE
Index of ~rocer y chain store sales...... . • . . . • . . . . . . . . . . . • . . . . . . . . . . . • 14
STATISTICAL DATA Revised series:
Table 19. World stocks of foodstuffs and raw materials (quantity), 1920-27 ..................................................... 17, 18
Table 20. Manufactured ~as: Customers, sales, and revenues, 1929-36 ....................................................... 19
Table 21. Natural ~as: Customers, sales, and revenues, 19.!9-36.. 20
STATISTICAL DATA-Continued
Monthly business statistics: Pa~e
Business indexes................................................ 22 Commodity prices....... . . . . . • . • . . . . . . . . . . . . . . . . . . . . . . . . . . . . . . . . 23 Construction and real estate. . . . . . . . . . . . . . . . . . . . . . . . . . . . . . . . . . . . 24 Domestic trade.................................................. 25 Employment conditions and wa~es.............................. 27 Finance......................................................... 31 Forei~n trade................................................... 37 Transportation and communications............................ 37
Statistics on individual industries: Chemicals and allied products... . . . . . . . . . . . . . . . . . . . . . . . . . . . • 39 Electric power and ~as. . . . .. .. .. . .. • . . . .. . . . .. .. .. .. . . . . . .. . 41 Foodstuffs and tobacco.. . . . . . . . . . . . . . . . . . . . . . . . . . . . . . . . . . . . . 41 Fuels and byproducts....................................... 45 Leather and products....................................... 46 Lumber and manufactures........ . . . . . . . • . . . . . . . . . . • . . . . . . . 47
Metals and manufactures: Iron and steel... .. .. . • .. . . . . .. .. . . . . . . .. .. . . . . .. . .. . .. . • 48 Machinery and apparatus............................... 49 Nonferrous metals and products......................... 50
Paper and printin~ ....•..........................•..... ,.... 51 Rubber and products.... . . . . . • . . . . . . . . . . . . . . . . . . • . . . . . . . . . . . 52 Stone, clay, and ~lass products.............................. 53 Textile products..... . . . • . . . . . . . . . . . . . . . . . . . • . . . . . . . . . . . . . . . • 53 Transportation equipment.................................. 55
Canadian statistics...... . . . . . . . . . . • . . . . . . . . . . . . . . . . . . . . . . . . . . . . . 56
Weekly business statistics throu~h April 24.......................... 21 General index ......................................... Inside back cover
Subscription price of the monthly and weekly issues of the SuRVEY oF CuRRENT BuSINESS is $1.50 a year. Single-copy price: i\.1onthly, 10 cents; weekly, 5 -:eut:;.
1~1nG.tt-:17--1
Foreign subscriptions, $3. Prtce of the 1936 Supplement is 35 cents. Make remittances onlr to Superintendent of Documents, \Vashington, D. C.
1

2 SURVEY OF CURRENT BUSINESS May 1937
Business Indicators 1923-25=100, except as noted
INDUSTRIAL PRODUCTION RURAL SALES OF GENERAL MERCHANrnSE ~ 15 0 .--------,
12 5 1-------l
1 0 0 t--;:-------,jL-j
7 5 1--------+~::::.__-l
50 1-------l
2 5 1-------l
0 '--'-.J....J--'--'---'-'---'
~ /" ~
- Ad;vs fpd
I I. I I. I
150
125
1 0 0 r--'1:-------,.-t
7 5 f--~~'-------1
501-----
FREIGHT CAR LOADINGS DEPARTMENT STORE SALES 125.----------. 125
100 100~~---t
L.C.L.(4~
;::__~-TOTAL (Ar(;usferl) ~
75 75r--;-~~-~
50 50
25 251-----------j
------Ar(;usled o/0
---------
I I I I I 0 0 1--L--'---'----'---L--'--'-' I I I .I I '
FACTORY EMPLOYMENT & PAYROLLS • CASH INCOME FROM FARM MARKETINGS ... '12 5 12 5.--------,
100 100~------j
75 751---~--~
50 501--------+~'----~
25 251----------t
0 0 '--'--'--'----'--L--'--'-'
CONSTRUCTION CONTRACTS A WARDED WHOLESALE PRICES 125 125
ALL CO#NOOIT/£.{7 ...,¢ 1 0 0 10 0 f-".c-----i
t_fA',f;, Ph'OOf/CTS
7 5 1---~----:.~=J
5 0 50 1-------'\,.-'-------l
25 251---------~
0 0 '--'--'--'---'--l.--'--.__. I I 'I I I
FEDERAL RESERVE MEMBER BANK LOANS* BANK DEBITS OUTSIDE NEW YORK CITY
125 125 ~----1
100 100 ~---~----!
7 5 1-----~---1 -50 1---------i 50 1---------l
0 1--L-.1.-L.-L-L-L-1~ I I I , I I 0 '--1-..l....J---'--'---'---L--'
1930 1935 1935 1936 193 7 1930 1935 1935 1936 1937 0 ADJUSTED FOR SEAS()'iAl VARIATI()'i e REVISED *REPORTING MEMBER BANKS _.. 1929-31 = 100 -1924- 29 = 100
NOTL Indexes are based on dollar ligures, except induslrial production, freight-car loadings, and factory emolo,ment DD. 90J9.M

May 1937 SURVEY OF CURRENT BUSINESS 3
Business Situation Summarized I NDUSTRIAL activity has expanded more than sea
sonally this spring. Manufacturing output has increased steadily, while the sharp rise and subsequent decline in mineral output has reflected, in the muin, the fluctuations in coal production. The expansion in industrial and trade activity has resulted in a gnin in employment and earnings which has in turn stimulated retail sales. Farm income has benefited from the rise in prices of the major farm commodities prior to April.
Increased industrial activity is evident over a brond front. Steel-mill output, indicative of conditions prevailing in a variety of industries, has advanced above 00 percent of capacity. Machinery, electrical equipment, office equipment, agricultural implements, railroad equipment, and other like products are being produced in increasing volume. Automobile assemblies, which fell just short of lwlf a million cars in March, exceeded 135,000 cars a •veek in the latter part of April. Output of building materials has expanded in response to the seasonal and cyclical improvement in the building industry.
Output of consumer goods continues at a high rate. Rayon mills are producing to the limit of nvailable facilities, while cotton mills are operating nearly 50 percent above single-shift capacity. Paper production is approaching practical capacity, and petroleum refining is expanding under the influence of the strong demand for gasoline and other products.
Distribution of commodities (other than coal) by the railroads increased in both March and April. Coal loadings, which were unusually large in March, declined rapidly in April after the prompt renewal of the labor contracts eliminated the possibilities of a prolonged interruption of mining operations.
According to the Department of Labor, the number of persons employed in nonagricultural pursuits from February to March increased by 500,000. This gain was nccompanicd by a lnrge increase in pay rolls; a further rise in both employment nnd pay rolls is indicnted for April. Despite the further improvement, the number unemployed still remains large, a condition nrising mainly from the failure, up to the present, of per capita business volumes to reattain predepression levels.
The rapid advance in commodity prices at \vholesnle, which had extended over a period of 5 months, wasterminated early in April, coincident with the issuance of official statements warning against too rapid price advances and the subsidence of speculative activity in domestic and foreign markets. Prospects of increased yields of agricultural products also influenced the movement of farm prices.
Stock prices have declined since early in March, with particularly sharp recessions in industrial shares. Bond prices have also moved lower, although the April decline was not so sharp or so persistent as that in March.
MONTHLY BUSINESS INDEXES
I Factory em- Frelght-('ar I Rt'tail sales, I J<'oreign II:
ployment loadings 'alue, 1
trade, value, ~ 1and pay rolls adjusted I i adjusted •
1-------,-------1
., --,.,M=erc-- 1 [
Unadjusted 1 Adjusted 1 .S _ = .. Q Total ch.an- ., 1:1 __ cc--~-l-----c~~c-- - d1se, :: S
s~ ~~ __ _!.__{':!:_ .s _, Q,)~ =--= .: t:a '""= ~:; .. .. 5 c = :i 1oi ~ ~ , a ~~ ~! ~ 6 = ~ 1 f' i ! ~ ~ ~ ~
Year and month
Industrial production
Monthly average, 1923-25=100 I 1929~-, ~ 1 =IOO Monthly average,1923-25=100
1929: March_______ _____ 124 1932: March____ __ ______ 68 1933: March______________ 60 1934: March_____________ 87 1935: MarciL____________ 91 1936:
March----····-·····- 96 ApriL-·-·-···--·--·- 104 MaY--··-··-----·-··- 105 June----····-·--··--· 104 July·-·---·-----·--·- 105 August .. ---·-·--··-· 106 September __ ··-·-···· 108 October---·-·---·--·· 111 November___________ 115 December.·······-.. 114
1937: January·-·---·--·-·-- 112 FebruarY----·---·-·-· 117 March_______________ 122
First-quarter average: 1929·-·------········· 121 1933__·-------·····-·- 63 1934__________________ 82 1935----------··----·· 90 1936__________________ 96 1937___ -------------- 117
126 (i6 58 86 91
97 105 105 105 105 106 107 110 115 114
113 118 122
122 61 81 90 95
118
101 118 78 67 74 59 91 84 90 88
90 93 95 101
101 101 101 104 102 108 104 108 110 109 115 IJO 115 ll4 111 121
105 114 111 116 118 118
110 ··----74 89 92 99
111
120 109 (\4 85 56 81 82 100 87 97
93 97 100 106 101 102 105 100 109 101 110 99 110 102 111 105 115 112 121 117
115 109 116 115 117 127
104.2 98. 6 69. I 53. I 61.4 37.9 84.0 65.6 85. 7 71. 7
87.7 77.6 88.6 79.3 89.8 80.8 90.4 81.1 92.8 80.2 93.4 83.5 93.8 83. 6 94.4 89.0 96.2 90.7 98.6 95.1
98.8 90.6 99.7 95.8
100.8 101.2
102.5 62.6 80.7 84.5 87.2 98.8
107.8 39.7
60.51 68.9 75.0 95.9
105 61 50 66 65
66 69 70 70 73 70 72 73 80 86
80 80 83
97 50 61 60 63 73
1051 75 62 66 64
62 63 64 66 67 67 67 66 67 71
68 68 68
!01 64 66 63 61 63
113 138. 8 73 65.6 58 47. 5 76 79.6 79 97.4
84 106.7 84 109.9 87 113.3 87 112.. 91 114.7 86 111.9 88 123.6 90 127. I 94 122.6 92 131.0
93 106.7 95 103.7 93 126.2
96 108.9 49 47.4 63 71.0 64 81.7 69 87.8 79 99.9
128 40 28 50 48
51 53 56 55 54 51 55 57 52 57
57 67 67
116 28 44 51 60 62
107 142.4 37 69. 6 26 -·-----44 71.4 49 79.9
55 90.6 58 88.7 58 86.2 62 95.7 65 D4. 4 62 86.7 70 89.1 64 102.1 61 93.7 76 117.8
74 103.3 87 89.3 86 95.2
125 136. 3 29 ------· 46 66.0 46 74.1 50 86.4 85 95.9
121 26 14 33 26
47 47 46 52 59 62 59 57 58 66
63 62 55
107 16 37 24 47 54
Cash farm Income•
., ., ft ... .,
" ::: _£ :; ., .. ::: ;§ :;
<II
Monthly average,
1924-29= 100 86.5 102.5 43.0 51.5 33.0 38.0 49.0 57. 5 52.0 59.0
59.5 67.5 58.5 69.5 64.0 72.5 69.5 80.0 84.0 88.0 75.0 74.5 89.0 77.5
104.0 76.0 88.5 77.5 86.0 78.5
75.5 75.0 59.5 70.5 70.5 81.5
92.7 ------34.8 ------48.0 ------51.0 ------59.2 ------68.5 ------
I Adjusted tor number or working days. 'Adjusted for seasonal variation. a From marketlnp of farm products.
~ ~~ -;z Q,):a ~s =-s .;g ~
~ Monthly average, 1926=100
96.1 66.0 li0.2 73. 7 79.4
79.6 7g. 7 78.ft 79.2 80.5 81.6 81.6 81.5 82.4 84.2
85.9 86.3 81.8
95.8 60.3 73. 2 79. 2 80.3 86.7

4 SFRVEY OF CVRRENT BUSINESS May 1937
Graphic Comparison of Principal Data --FIRST .3 MONTHS P?VZJ REMAINDER OF YEAR
BANK DEBITS OUTSIDE NEW YORK CITY (BILLI.ONS or DOLLARS) 0 50 100 ISO cOO 250 300 350
1937 1936 1935 z 1934 .LL ./ ./
1933 .//A
1929
CASH INCOME FROM FARM MARKETINGS *(BILLIOOS OF DOLLARS) 0 2 4 6 8 10 12
1937 1936 1935 1934 1933
I 1929
CONSTRUCTION CONTRACTS AWARDED (BILLIONS OF DOLLARS) 0 I 2 3 .4. 5 6
193 7 I 1936 1935 1934 1933 -/// / / /
1929
STEEL INGOT PRODUCTION (MILLIONS OF TONS) 0 10 20 30 40 50 60
1937 I 1936 1935 / / /// / /// /////// LLLJ
1934 / /
1933
1929
AUTOMOBILE PRODUCTION (MILUOOS OF CARS)
0 I 2 3 4 5 6
1937 1936 // / //// // // / //
1935 1934 1933
1929
FREIGHT CAR LOADINGS (MILLIOOS OF CARS) 0 10 20 30 40 50 ~
1937 I I 1936 1935 1934 L
1933
1929 _L _L
7111111111~
* INCLUDES BENEFIT PAYMENTS BEGINNING AUGUST 1933, AND AGRICULTURE CONSERVATION PAYMENTS BEGINNING OCT. 1936 OD.90Z8

May 1937 SPRYEY OF CURRENT BUSINESS 5
Commodity Prices W HOLESALE price::: reneted sharply during the
first half of April, after a strong and almost continuous advance of several months' duration. March had witnessed an unusual accelerntion of the long advance, particularly in price::: of ra\Y materials needed by countries making extensiw military preparations so that the situation was promptly altered by official warnings and suggestions of Government action to prevent rapid price advances, or to bring about a downward readjustment in some commodities.
:March, and advaucrs were made also by all component indexes shown in the table below, excepting those for the fuel and lighting and chemical and drug groups. Indexes for the weeks ended April 3 and April 17, however, showed a decline of 0.8 percent in the combined index for the 2 weeks, and much larger declines in the indexes for farm products, foods, and raw materials.
Aecording to the Bureau of Agricultural Economics' monthly data, prices received by farmers for products marketed were higher in mid-April than a month earlier. The Department stated that the outlook for the more important farm produets during the next few months indicntes no mnrked dwnges in the general level of fnrm prices. Some Inter wenkening is expected, however, ns new crops exert grenter influence.
::\1oody's daily index of spot prices of 15 "sensitive" commodities which had adY!mced 11 percent from February 20 to April5 declined 8.4 percent by April30.
Among the individual commodities whose prices advanced rapidly during :!V!arch and then broke sharply in the first half of April wpre the nonferrous metals, steel scrap, rubber, raw cotton, wheat, and butter. Important commodities which made large or substantial advances from March 1 to mid-April included steers, beef, hides, leather, and textile products, but marked declines occurred during tlw same prriod in the prices of hogs, lard, cottonseed oil, wool, and anthracite.
The cost of liYing rose shnrply, 0.8 percent, from February to March and was 5.6 pereent higher than a year earlier, nccording to the National Industrial Conferenee Board. Fairchild's index of retail priees of department-store articles eontinued the uninterrupted advnnce which begun last July, and on April 1 was 0.9 pereent higher than a month earlier nnd 7.3 pereent above a year ago.
The Bureau of Labor Statistics' monthly index of 784 price series advanced 1.7 percent from February to
Year and month
929: March ___________________ _ 932: March_. _________________ _ 933: March __ ------------------934: March--------·--···------935: March .. -----------·------936:
March------··-·--·---------ApriL ________ ··-----------· MaY---------·-·---------··· June __ ··---·-------·-----·-JniY-------·---·----·-·---·-August _ .. __ . _. _. __ ·- ·-. _. __ September __________ . _____ ._ October·-·-------------·--·November---·----------·--December -· _ ---------------
937: January ____ ---·-·------·---February ___ ----------------March_··-·------·--·------
First-qwntcr average: 1929_. ______________________ _
1933·--------------··----·---1934-------------------··----1935 __ . _____________________ _
1936.---·-----·--------------1937 _______________ ---------
INDEXES OF COMMODITY PRICES I ,_.I
Wholesale Prices (U. S. Department of Labor) "' ........ Retail Prices :I ~:; ""~ "'~
Groups and subgroups
;j C'C """' ~--J ..... . s= ... "' ;;~ c ~ ~"' !!Economic <'lasses: I ,._ = 'I I .. s .......
..,«~
""~ co .. ;r
~~ .:-g .Qe ee oo O'-'
96.11' 66.0 60.2
73.71 79.4
79.61 79.7 78.6 79.2
~HI! 81.5 82.4
::::11 86.3 87.8
95. s1
(·o 31 1 ) • 1[ 73.211 79. 21'1_ 80.3 I 86. 7[
:; ., :I
"" 0 .. ~
"" ., .c: .:!1 c
' 94.8 71. 5 65.7 77. 2 81.7
I
I
I
81.31 81.61 80.51
iHI! 82.3 82.0
~~:~1 84.9 1
85.41 SUi
94.61 66.01 7(), 'i: 81. 3' 82.0 8.1. til
"' 0! ·;:: .£ <I e 1!: <I Ill
99. 0[ 56.11 49.4 65.9 76.61
77.4 77.0 75.8 77.6 79.8 81.5 81.8 82. 1 83.1 85.6
~~JI 90.1 98. 6i 49. 3' ()5. 31 76.91
1
iR. 2 8H. 8,
1 Middle of month.
'C .a; ., I~ - I
c= <>oo .. s '=
·= I~ ~B .5 • :I .. :a .c: e
I
<IQ .Q~::: <1-f~ ., ~., e~e ~~
"' ., ... ~.! ., .. .2=
I~,;~""~ ., ., o,- =.8 .,., .. "'.C: = :I ~= rtE~ .<S J,<.>
i z g ;-g "" 0 ~IS 00 .. c.:: 0 ., 8'=c. .. I
c 8-= o><l
"r ~ •• 0 0 e~ ~
.l1 '¢~ ~;.e ... ... 1., - '0) ees "' .. ':I <I '= r~
...... "" <I
io "t .. I
., :;8e 0 ~
= ~ "' IS 0 ., .. flo flo = [---------:1 Mo. Mo. Mo. f9~~
"' ., .. .a ., ~ :: c <I
~ <II 00
I I e.,! I "'
I
~
""" "' :I
I ~0 I ;; .. ~
~ "" .e "' ·;::
..... c"" I .£ "" := ., c
= I
<~c <I <I i1P "" =~ e "'
I
! 0 ;; "" I .. ~ ~
II
., ~ c ., = e c .,
II "' ... :c; 8 <I
"" -; "'"" .. ;; 0 .co '§ "' '0)
i r: .. 0 "' ..... .c: = II "' I flo ~ 0~ = i 0 flo I
Monthly average, 1926= 100 average, average, average, (J 1 1923= 1909-14 1923-25 19~~).:
96. I 1107. 21 98. 81 60. 8 50. 2 43. 5 56. 9 42. 8 36. 0 74. 3 61. 3 62. 3 71.8[ 78.3 82.8,
74.4 76.5 75.6! 74. 5 76.9 73. 91 74. I 75. 2 70. 6 73. 9 78. 1 73. 0 75. 2 81. 3 88. 9 75. 6 83. 8 102. 4 75.9 84.0 102.0 76. 2 84. 0 102. 1 78. 6 85. 1 102. 9 82. 3 88. 5 109. 0
85. 4 91.3 ll3. 0 85. 51 91. 4 lll. 5 89.6 94.1 113.2
95. 1 106. 2 99. 7 56. 7 42. I 33. 9 73.71 60.4 63.1 71. 6178. 3 86. 31 74.6 78.1 77.6 8tl.8 92.3 112.f>
100 = 100 = 100 100
98.3 108.51 92.1 96.7195.3; b2.1108.2' 93.1:11102.3 92.4f82.4 ----oo:21---wl------w1.4--62. 3 61. 4 70. 9 73. 2 75. 3107. 9 77. 3 77. I I 80. 8 58. 0 64. 7 l:!O. 0 69 70. 7 79. 2 5~. 6 50.5165.8 7~. 3 Z!·! ~2. 9 !iS.~ -_.2. 21 77.2 51. :l 58.9 71.8 55 59.8 69.7 61.3 56.5 78.5 86.4 "'·' 11.4 gg_, 81.4 87.1 76.5 69.3 78.81 84 72.8 89.6 81. 9 91. 6 77. 3 84. 9 81. 51 73. 0 85. 4 80. 7 85. 7 69. 4 69. 2 82. 0 108 79. 6 86.3
80. 1 89. 7 78.9 85. 3 79. 3176. 2 94. 9181. 4 86. 6 70. 8 68. 3 83. 2 104 79.5 88. 1 80. 2 91. 0 78. 9 85. 7 78. 5 76. 4 94. 6 81. 5 86. 6 70. 2 68. 6 83. 4 105 79. 7 88. 1 78.0 85. I 78.8 85.8 77. 7 76. 0 94. 0 81. 5 86. 3 69. 8 69. 2 83. 8 103 79.9 88. 1 79.9 85. 1 78.8 85. 8 78. 0176. I 93. 8 81. 4 86. 2 69. 7 69. 7[ 8.>. 1 107 83. 8 87. 9 81.4 84.9 79.5 86. 7 79.4 76. 2 93.4 81. 2186.9 70. 5, 71. 0' 85.2 115 84.0 88. 1 83.1 86.4 79. 7 86.9 79.8 76.3 93.6181.4 87.1 70.91 71.5 85.6 124 84.0 88.5 83.3 87.3 79.6 87.1 81. 71176. 1 94.6 81. 7 86.8 70. 9f 71.3 85.9 124 84.31 89.3 82.6 84.4 80. 1 87.3 82.2 76.8 95. 6, 82. Oi 86.9 71.6171.5 85.7 121 82.8 90.0 83.9 85. 2_ 81.0 87.7 82.5 ~6. 8 97.21 82.31 87. 9; z3. 5 73.4 85.8 120 82.5 90.8 85.5187. 2, 82.2 89.5185.3 .6. 5 99. I I 83.2\ 89. 6i .6. 3 74.5 86. 1 126 82.9 91.7
87.11_ 90.61 83. 4. 91. 3, 87. ~~- 76.6 101. •
1~ 86. 5! 90. 9l 77. 5. 76.2
1
86.9 131 84.6 93. o 87. 0 90.3 84. 1j 93.:11 87. Xi 7H. 8 102.7 87. 9! 91.7 77.5 77.3 87.2 127 84. 5 93.7 s7. s I 92. ol 85.5! 95. 9187. 51 76. ~ 104. ~ ss. 4196. o 78. a 79. 5 87.9 12sl 85.4 94. 5
98.4
1~105.51 92.1[196.0 95.51 83.1110.2 9:l.8jl01.0 92.4 82.6
1
1 99.6 146 102.1_. _____ _ 54. 7 50. I 66. 41 70. II 71. 41 64.2 68. 31 72. f> 77. 6 51. f, 59.8 72.6 57 60.8 70.2 66.1 52. 9!178. 5
1
86.4 75. 2l' 72. :; 89. o\81. 11 8.6. s 7tl. ti GS. 4 78.3 81 11. gl 8n. 2 s1. .5 87. o 11. 5 84.91 so. 4 72.8 85.9 ~o. 9\ 85. s1 ti9. 9 70. o[ s1. 71 1on[ 78. gl s10. n 82. ill 92. 2 78.91 85. 51 80.01 75.8 96.0 81. 4 St\.71 71.2
1
68. 1 83. 51[ 107 80.6 88.2 87. 2 91.0 84. 3 93. 5 8<. 7! 76.;; 102. 9 87. li 92. 9 77. 8 77. 7 ' 87. 3 129 84. 8 !13. 7
' Index is as of the 1st of the following month.

6 SURVEY OF CURRENT BUSINESS May 1937
Domestic Trade W ITH consumer income still expanding, as evi
denced by the increase in pay rolls, rents, and security incomes, the volume of both wholesale and retail trade has continued to exceed last year's totals by substantial margins. The expansion in retail trade 80 far during the spring buying period, however, has not exceeded seasonal proportions, and in some lines, consumer resistance to price advances has developed.
Reports now being issued by the large corporations covering first-quarter operations reveal substantial sales increases in comparison with the results a year ago. Distributors generally have experienced a substantial rise in both volume and profits so far in 1937. The mailorder companies, for example, have experienced large increases in sales volumes this year, notwithstanding that sales of these organizations in 1936 made a very good showing.
With the March figures now available, it is estimated that the increase in aggregate sales for the first quarter of 1937, in comparison with the opening quarter of 1936, '\Vas approximately 15 percent, or somewhat more than indicated by the early returns. For department stores the gain was 13 percent and for variety stores 8 percent, after allowance for the enrlier date of Easter this year. The increase in rural sales of genernl merchandise, as indicated by the Bureau's index, was 14 percent, while dollar sales of new passenger C[lrs, notwithstanding such interruptions to de-
liveries as may have been experienced as a result of strikes, were up one-third. Sales of chain grocery stores increased 4 percent.
Data for a large sample of independent retail stores located in 14 States indicate a sales increase for this type of store in the first quarter of 1937 as compared with the corresponding period a year ago, approximating the average gain for the country. The largest gains were reported by the North Central States. In Ohio sales of independent stores increased 22 percent; in 'Wisconsin, 19 percent; and in Illinois, 17 percent. For March alone, the gain for the 14 States over the corresponding month a year ago amounted to 16 percent, with gains in excess of 20 percent reported for the combined sales of the States just mentioned in the quarterly comparison, and also for Indiana. The largest gain in 1farch over a year ago was one of 35 percent reported for jewelry stores. This was followed by increases ranging from 20 to 26 percent in department stores, apparel shops, and lumber and buildingrna terial dealers.
The favorable marketing conditions prevailing have been reflected in a continued decline in the number of commercial failures. Dun and Bradstreet report 2,352 failures during the first quarter, about 90 percent of which were firms with liubilities of $25,000 or less. In the first quarter of 1936 the number was 2,879.
DOMESTIC TRADE STATISTICS
Year and month
Retail trade I' j Wholesale ·' trade
Commereial failures
---D-ep_a_r-tm-en--t-s-to-r-es--c---C-h_a_i_n_-s_to_r_e_s_al-es-----.-R-u-ra-1-sa-1-es_o_f.------~~! i I ----~- general mer- New passen- I' 1: i
Sales Stocks' Com- Variety stores chandise ger-car sales Em- Pay ~~ F 'I l11 Ill bined ploy- I aJ - ' ' a 1 -
------·-- index -·- I\ mcnt rolls ures I ities {1nad-, Ad- Unad-~ Ad· (Ch . llnad-~ Ad- Unad-~ Ad· Unad-, Ad• I just- just• just- just- IStore~~e) just- just- just- just- just- just- II
~-~-' __ ell_' ed ed' ~'-----~~ ed• edl ed' __ e~-~-~i 1 • __ :_, ~ IIA\g.samej 1' Monthlyaver· 1 Num-1 'lhou
192!1: March _______ -----------------1932: March __________ ·-------------1933: March _____________ ------------1n34: MarciL _________ . _____________ _ 1\J:l.o: March _________________________ , 19311
karch _________________ --------_ .. I ApriL _____________ ·-------------May_--------------------------June __ ·--------------------------July _____________ ------ ____ -----_ August.. _____ -· _________________ _ September ______________________ _
Octo her ___ ----------------------November ______________________ . December_------_---------------
1937: January-------------------------
~~~~~~:-~::::: :::::::::::::::---! Firsf~~~~~~:~~~~~·:a~c: _______ ._. _____ I
1933 .. ---------------------------·1
1~i~~ ~ ~ ~ ~:: ~: ~: ~: ~::: ~: ~ ~: ~ ~:: J
Monthly average, 1923-25=1CO ' 1 mo. 1929- Monthly average, 1929-31=100 1 ' ··,ge 1gzg=JOO 1 er sands 31=100 1 )I ' ' _'_(of dolls
107 ILl I 102 !19~----------- 99.0 Hl:i 3112\l.O 13~ 81 11>8.~ J.-,:l 51 ll7.3 \JS.5 -------- --------o9 i3 n ;o ,4.4 79 3 ol 4 e1.o B5.o 58.4 3fi.O 7S.tJ 1.s.s _______________ _ 50 58 51) .34 70. 2 fl4. 7 73 2 4-t 2 47. 5 32 5 30. 5 71.3 53 5 1, 912 44,806 73 7ii G7 G5 91 4 87. 2 94. 8 7 4. 0 79 G 68. 4 fi4 5 81. 8 f>2. 0 I, 009 24, 002 71 79 li0 G3 95. 6 78. I 93. 0 1 90. 6 97. 4 100. ~ 94. 5 84. 0 65. 2 940 15, 3GI
77 85 89 84 63 68 94
100 105 161
72 7!) 90
84 84 87 87 91 86 88 90 94 92
~~ li 93
~~ :::::::: I tn ________ I
1)4 --------,1 ~~ --------11
67 1 65 101.3 68 I 65 102. o 67 flU 103.0 62 64 I 108. o 59 B4 lOll. 6 M 67 , 109.0 11 6s 1 110. o 76 69 I 109.5 so 71 I 111. 0 67 71 I 113. o
66
1
74 I 1o6. 4 72 70 I 110.0
~; 1:::::~:: 1 _____ :;:·: ::·; '::::::::, ~u fi21-------- i 99.1 72 . _.__ ___ lOS. ,i ,
80.3 93.3 95.7 95.2 96.8 96.8 98.8 104.0 97.2 1r9. 2 86.5 97.7 97.8 102.4
100.4 98.9 104.5 103.0 195.7 106. 1
70.3 94.4 Rl. :J !17. 4 97,1 103,3
Sfl.fi r.;l.9 --------1 70.8 13. 7
~~: ~ 1:::-::--!
99.2 106.7 117.8 105.5 109.9 142.3 106.5 113.3 138.6 106.2 112.4 139.3 88.3 114.7 117.3 96.2 111.9 92.9
122.3 123 6 71.0 155.1 127. 1 56.5 150.8 122.6 113. 1 186. I 131.0 130.4
88.6 106.7 90. 1 93.8 JtJ:l. 7 85.5
117,4 126,2 H5.4
108. g , ________ 120. i 47. 4 1-------- 2\l. 5
~t:~ [:~~::::: 4~. f)
74.8 s-1.2
107. n
101.0 85.6 69 0 946 16,271 93.5 85.7 67.9 830 14. 157 93.5 R4. 6 68.2 8.~2 15,375
lOll. 5 84.6 68.4 773 9,177 104. 5 85.4 69.0 639 9,904 Q2.0 86.3 69.7 655 8, 271 83.0 . 88.0 70.5 586 9, 819 85.5 89,0 71.5 611 8, 266
151.0 89.7 73.1 688 11,532 175.0 91.0 72.8 692 12,288
129.5 90.8 ~;: b I 811 1 8, 661
189.51 92.2 121 9. 771 122.5 91,9 75,0 s2o I 10,922
97.3 97.2 -------- --------72.4 55.6 2, 389 61.855 Sl. 2 61. I 1,134 2::1.270 84. 3 64.6 1, 014 15, OflO b5. 4 67.4 960 lf>, 15fi
--------' 91. fl 73.9 784 9. 7~5
'Adjusted for number of working days. r Adjusted for seasonal variations. • End of month.

May 1937 SURVEY OF CURRENT BUSINESS 7
Employment I MPROVED business conditions have lifted employ
ment and pay rolls this spring to the highest level of the recovery period. According to an estimate made by the Bureau of Labor Statistics, the number of persons employed, exclusive of those in agriculture and on work relief, was 34,100,000 in March. This number, the largest so employed since the middle of 1930 except in December 1936, when the total was slightly larger, represents an estimated gain of more than 8,000,000 since the low point of the depression in March 1933.
About 60 percent of the total gain has occurred in the manufacturing and nonmanufacturing industries surveyed each month by the Bureau of Labor Statistics. These industries, which employ slightly less than onehalf of all nonagricultural workers, have reported steady gains in employment for more than a year, except for a seasonal recession last January. Factory employment in :March increased more than seasonally, the adjusted index recording a gain of about 1 point to 100.8 (1 923-25=100). Factory pay rolls have continued to expand at a more rapid rate than employment, so that by March, weekly pay rolls were back up to the level of employment relative to the 1923-25 base period. Thus, per capita factory weekly earnings were equivalent to tlwse paid in 1923-25 and, moreover, they were only 3.8 percent below the 1929 average. "Wage-rate in<:>reases have been numerous. The Bureau of Labor Statisti<:>s reported that 300,000 individuals in manufncturin9: industries received \Yage increases between
mid-February and mid-March, according to incomplete data received from reporting concerns.
Of the 89 manufacturing industries regularly surveyed, 78 reported increases in the number at work in March as compared with February, while 80 reported larger pay rolls. Employment in the agriculturalimplement industry recorded a contraseasonal rise, and more than seasonal gains were reported in numerous other durable-goods industries. Declines reported were largely seasonal; all were less than 5 percent, except in the cottonseed oil, cake, and meal industry.
Fourteen of the sixteen nonmanufacturing industries reported employment gains in March as compared with February, the largest absolute increase being in retailtrade establishments, where a number of temporary workers were engaged to handle the seasonal increase in business. In these industries, as in factories, wagerate increases have been numerous, nearly 43,000 wage earners being granted increases in the period from midFebruary to mid-March, according to incomplete returns.
The amount of time lost by workers as a result of industrial disputes continued large in March. The Chrysler strike, which was the most important from the standpoint of the amount of time lost, was settled on April 6. In the bituminous-coal industry, operations came to a standstill on April 1, 2, and 3, while negotiations were in progress for a new wage agreement which, however, was promptly signed.
STATISTICS OF EMPLOYMENT, PAY ROLLS, AND WAGES -~···- -- ,_
t'actory employment II Nonmanufacturing employment and pay rolls
Trade-~ and payrolls (U.S. Department of Labor) Wages
Employment I Pay I' Ant~r.acite
I
Electric light 'l'elephone
[ ~-~etail trade
l<'actory Com-Bituminous and power and tete- union <National Indus- moo rolls mmmg ~oalmining and manu- graph mem- trial Conference labor
factur<•d gas bersem- Board) rates Year and month I Unad-1 Ad- 1-unad-1 Em- I Pay Em- [ p Em-~ Em-~
ployed I Average I Average (road Pay Pay I 1<-m-~ Pay ploy- ay ploy- ploy- I ploy- rolls weekly hourly build-I''"'"' '"'''''I ~~'"'[• ::!:r.; ro"• ment l rolls rnent . rolls ml'nt rolls ment earnings; earnings in g) Percent Cents Monthly average, 11 Monthly average, 1929= 100 of total Dollars per 1923-25= 100 members hour
929: March _________ ~-164.1" 104.2 lll.<i ~8. 0 ~0. 8 :I 10f>.8 108.6 U2.8 ~·-51 DU. 5 ~8. 7 97.4 97.3 --80- 28.79 . 586 37 932: March__ __ __ __ _ (i9. 3 69. I 53. I 73. 7
61. 21! 75.2 46.8 85.5 85.4 81.7 88.2 78.6 68.5 70 18.59 . 522 34 933: March __ ,______ !51.5 61.4 37.9 54.() 48.8 67.6 30.7 76.9 71.9 73.2 71.6 118.9 49.0 66 14.53 . 459 32 m4: March_________ 84.4 84.0 65.6 67.5 82.4 77.8 58.9 81. 7 75. fj 70. 0 70. 4 81.5 59.8 75 20.54 . fl81 42 935: March_________ 86.2 85.7 71.7 51.4 38.9 81.6 67. 5 82.3 79.41 69.8 75.3 80.2 60.4 78 21.79 . 597 :l9 936: March ___________ 87.9 87.7 77.6 52. 5 42.6 80.4 70.2 86.8
85.91 70.2 77.2 81.9 63.5 79 23.67 .611 37
ApriL ........... 89.1 88.6 79.3 49.8 28.6 77.5 62.6 88.0 86.2 70.8 76.0 85.2 65.3 82 24.33 . 613 38 May ............. 89.8 89.8 80.8 54.9 56.3 76.2 62.2 89.0 87.0 71.6 78.5 85.0 65.8 83 24.41 . 616 42 Jnne ..••••.••..•• 90.1 90.4 81.1 51.2 42.0 75.7 , 61.5 90.4 88.1 72.1 77.4 85.5 66.4 83 24.45 • 617 42 Jnly •••••.•••..•.• 91.2 92.8 so. 2 48.4 37.2 75. 5 62.6 91.7 89.8 73.1 79.9 83.2 65.1 83 24.20 • 617 42 August .•..•.••••• 93.5 93.4 83.5 41.1 31.4 1 76.9 65.4 93.1 89.8 73.5 81.2 82.4 64.4 86 24.76 • 616 41 September ••.••.. 95.5 93.8 83.6 47.6 34.91 78.2 71.0 93. 5 91.4 73.7 78.8 86.6 66.6 87 25.18 . 619 42 October .•..•••••. 96.7 94.4 89.0 49.9 48.5 81.1 79.2 94.0 92.7 73.8 83.1 88.7 68.3 88 25..~1 .619 42 November _______ 96.9 96.2 90.7 51.5 40.3 82.3 80.7 93.5 91.8 73.7 81.6 90. 1 70.1 88 211.98 .624 41 December ........ 98.1 98.6 95.1 54.8 55.4 83.9 84.9 93.2 94.1 73.6 82.4 100.0 75.6 86 26. (\3 . 636 39
937: January __________ 96.5 98.8 90.6 54.1 42.7 84.4 80.0 92.1 92. 1 74.4 84.0 86.3 68.0 85 26.11 . 638 39 Fehru:n·y _ ~ ______ 99.0 99.7 95.8 52. 7 41.0 84.8 82.4 91.9 92.5 74.8 82.2 84.9 fi7. 7 86 21\.68 .ll42 --------Mareh --- 101.0 100.8 101.2 48.9 37.8 85,9 88,4 92.1 95.6 75.3 87.1 88.2 70.6 86 27.49 .659 --------
~irst-quartE'r- -- <lYer-age:
1\)29 .. ------------ 102. 5 -------- 107.8 103.2 104.5 107.0 110.4 92.8 92.7 95.4 95.4 96.7 96.1 8.\ 28.80 . 58() --------w:J:l ______________ 62.6 -------- 39.7 55. a 49. f> 68.9 34.7 77.3 72.2 n_g 71.7 70.5 51.8 66 15. t)(i . 41i2 -- -----1934---------- -· -- 80.7 -------- 60.5 64.9 7:l.8 7(). 6 54.9 81.7 74.6 70.0 69. 1 80.3 59.2 74 lU. 72 • DRR 1935 .. _ ----------- 84. 5 ------·- 68.9 59. (i 53.6 80.9 64.4 82.4 78.6 70.1 74. 0 79.6 59.8 76 21.84 .59:i ~-------1936 ____ -- -------- 87.2 -------- 75.0 57.6 57. g 80. I 73. l 8~. 3 85.1 70. I 70.1 80. 7 62.4 78 23. 40 ,li09 --------19;)7 -------------- 98.8 -------- 95.9 51. g 40.5 85. 0 83. 6 92.0 93.4 74.8 84.4 86. 5 68.8 86 26.76 .646 --------
l
I Adjusted for seasonal variatiors.

8 SURVEY OF CURRENT BUSI~ESS May 1937
Finance FOLLO"\YING n period of declining prices of Gov
ernment bonds during March and the early daj'S of April, the Board of Governors of the Federal Reserve System announced through its Open Market Committee that the Federal Reserve bunks were prepared to purchase rnited States Government securities in the open market. This step was designed to prevent erratic fluctuations in Government bonds resulting in part from the readjustments made necessary hy the increase in reserve requirements effective May 1. Government securities subsequently firmed; and after the middle of April, corporate-bond prices, which had declined over a period of about 2 months, experienced some recovery.
After marked weakness during the second half of March, the movement of stock prices becanw erratic, with sharp declines predominating. Market influences have been of a mixed character, with external factors of some importance, as evidenced by the fact that price movements on the leading European exchanges have also been highly uncertain. In the latter half of the month the decline persisted despite the settlement of several important industrial disputes and the fayorable earnings reports covering first-quarter operations. Standard Statistics has estimated that the earnings of the 161 corporations included in its quarterly index of profits were nearly one-third higher during this period than in the opening quarter of 1936.
Unsettlement in the bond market affected the Yolume of new corporate security offerings during Murch, causing the withholding of some contemplated issues until it could be determined whether the rise in bond yields would necessitate readjustment of offering terms.
Net purchases of Government securities by the Reserve banks during the week ended April i amounted
to $29,000,000, the result of net purchases of approximately $65,000,000 by four banks and net sales of about $36,000,000 by the remaining eight Reserve institutions. During the following week net purchases amounted to $28,000,000, \vhich represented the aggregate of net purchases varying in individual amounts from slightly less than $1,000,000 to roughly $11,000,000 by each of the 12 Reserve banks.
Coincidental with the resumption, for the first time since November 1933, of substantial net purchases of Government securities by the Federal Reserve banks, the reporting member banks showed during the first 2 weeks of April a. net increase of $61,000,000 in their holdings of such issues, as compared with a net decline of $432,000,000 during the 2-\Yeek period immediately preceding. The net decline since the end of January has been three-quarters of a billion dollars. The reduction in holdings of Governments, together with recessions of $59,000,000 in security loans and $61,000,000 of investments in other than Government securities, accounted largely for the decline of $405,000,000 in their reported loans and investments during the period from March 17 to April 14. The so-called loans to business or "other loans" continued to expand at a gradually increasing weekly rate, the total increase for the 4-week period being $145,000,000.
The revised Federal budget transmitted to Congress on April 20 revealed the need for additional funds before the end of the fiscal year because of the largerthan-estimated excess of expenditures over receipts. Funds required in connection with the additions of gold to the inactive account-that is, for purchases of all newly mined and imported gold by the Treasury-have passed the half-billion-dollar marie
FINANCIAL STATISTICS I Net
I I I
Aver-Reporting member F~deral gold I Bond I
banks, Wednesday Reserve Excess im- Savings Stock prices, age Interest Bank reserves dlvl· debits, closest to end of bank of ports Money deposits prices New dend rates,
month credit in- (419) York New com-outside out- mem- eluding in Stand- Stock capital rate mercia I New
Loans I"Oth-~~ In-stand- ber gold eircu- ard Ex- issues per paper Year and month York banks, lation share
City ing, end of released I New I Postal Statis- change (600 (4-6 on er" vest- end of from York Sav- tics (do- months)
securl· loans 1 ments month month ear- I State lngs mestlc) com-ties I mark' panics)
--- --- --- ---Tho us. Millions of dollars 1926=100 Dollars of dollars Dollars Percent
5,\178 ' 4, 422 4, 4(;6 I !55 ~ ~ 996, 847 --- 5%-6 1929: MarciL _________ 28, 0\JU
--------1 1, 5:~n --------- 32.3
1932: March ___________ 13,729 5, ~~~ -------- 7. 143 l, 5Ui 87 33.6 5, 244 5, 2tl:3 706 .17. 8 FO. 57 162,442 1. fi7 :l)i--3% 1933: March ___________ 7, 897 2, .)~:) 249 -113.3 6, 711 5, 220 1, 114 4:l, 3 I 78.-18 16,517 ].]\ 1~2--4~/2 --------- 3, ,,,} 1934: March ___________ 14,077 3, 704 9,8f>8 2, 545 1, 444 23fl. 5 5,3(\8 .1, 122 I, 200 77. 2 91.09 99,314 I !.If> I-I% 1935: March ___________ 15, 754 3, 219 3, 300 1 11, 70U 2, 471 1,846 12.3 5, 4i7 5.185 1, 203 (i4. 11 91.79 105, 023 I. 29 %' 1936: March ____________
17,8671 3,313 3, 495 13, 229 2,473 2,305 6. 4 5, 857 1 5, 204 1, 216 108. 7 97.26 127,5431 1. 46 % ApriL ___________ 17,497 3,304 3, 485 13,452 2, 475 2, 66411
27.9 5,892 5,175 1, 215 108.9 96.69 176,677 1. 47 % May ______________ 16,998 3, 486 3, 586 13,522 2,474 2,866 166.7 5, 918
I
5,165 I, 214 101.0 97.38 112,587 !.50 ~i June __ ----- _______ 18,882 3, 319 3, 619 14,159 2,473 2, 717 2f~:~ I 6,062 5, 210 1, 232 105.611 97.63 219,686 1. 51 % July-------------- 18,617 3,173 3,600 14, 08i 2,452
1: ::I 6, 203 5, 197 1, 244 109.2 98.19 103,164 1. 58 ~4' August_ __________ 17,106 3,177 3, 749 13,809 2, 470 55.51 6,191 5,197 1, 249 113.0 I 98.81 218,074 1.64 % September ________ 17,586 3, 242 3, 949 I 13,929 it 2, 473 1,8·10 143.0 6, 258 5, 223 1, 251 114. 1 99.27 179,487 1.671 %
October _____ -----_ 20, 142 3, 179 4, 033 13,79611 2,476 2, 175 207.6 I 6, 321 5, 210 1, 255 118. 7 99.41 189,512 I. 70 ~4 November ________ 18,475 3, 205 4, 06811 13,647 2, 453 2, 236 78.8 1 6, 401 5, 201 1, 257 124.2 100.55 158,071 :::II % December_ _______ 23, 23s I 3, 326 4, 290 13, 742 i 2, 500 1, 984 56.3 It 6, 563 I 5, 246 1, 260 122.8 I 100. 76 265. 850 I % 1937:
4.100 II II 2, 4971
I 6, 400 II I
January---------- 20 383 i 3, 2381 13, 638 II 2, !52 73.0 il 5, 244 1, 2661 126.0 I 100. 05 I I 248, 526 2. 041 % February._------- 17:620 II 3, 280 4,191 2,465 2,078 112.3 I 6,369 II 5, 248 1 1, 270 129.5 I
99.83 1168,188 2.04 3J.. 13,597 I i March ______ ~---- ~l.66.l 3,356 ~. 362 ' 12,907 ' 2. 458 1,398 t.;a. 9 I f), 391 i ,j, 27!-1 I I, 271 I 129.9 ,I 96.86 ' 184,.194 2. Oi , %
I Net exports of gold and deficiencies in reserYes indicated by (- ).

Ma.v I!.l37 SURVEY OF CURRENT BUSINESS
Foreign Trade BOTH exports and imports increased about 10 per
cent in value from February to ~larch, a rise of approximately seasonal proportions. This increase followed the unusual advance in February, but whereas the increase in exports in that month was mainly through West coast ports where traffic had been tied up by the maritime dispute, a majority of the customs districts reported an increase in exports for March. The West coast districts showed only a slightly larger percentage gain in March exports than did all other districts combined.
General imports during the first quarter of 1937 amounted to $824,869,000, compared with $578,957,000 in the first quarter of 1936. Exports, including reexports, during the same period totaled $710,910,000, or $135,210,000 more than in the corresponding period of 1936.
The value of our foreign trade through March, and pal ticularly that of the import trade, continued to reflect the rising trend of commodity prices. While the value of exports of United States merchandise and of imports for consumption was 23 and 38 percent larger, respectively, in the first quarter of 1937 than in the initial quarter of 1936, the volume of exports was 16 percent and the volume of imports 23 percent larger on the same comparative basis.
Exports of finished manufactures and semimanufactures continued to increase during March. The value of finished manufactured exports was $354,000,000 in the first quarter of 1937, the highest value for any
quarter since the final period of 1930. Semimanufactured exports, amounting to $125,000,000, were the highest since the second quarter of 1930. In comparison with the first quarter of 1936, the increase in the value of these classes of exports was 28 and 40 percent, respectively. Among the leading products which have found an expanding market abroad this year are iron and steel manufactures; machinery, including electrical apparatus; agricultural implements; and automobiles, including parts and accessories.
Exports of crude material so far in 1937 were 8 percent higher in value than in the first quarter of 1936, mainly because of the increase in exports of unmanufactured cotton. Exports of unmanufactured tobacco declined nearly one-third in value. Exports of foodstuffs were also larger than a year ago, mainly by reason of increased shipments of wheat flour and the carryover shipments of dried and canned fruit that ordinarily would have moved to foreign markets in the preceding quarter.
All classes of imports showed large percentage gains for the first quarter over the same period of 1936, although nearly half of the increase in the value of total imports was accounted for by a $54,000,000 advance in imports of vegetable food products (over $23,000,000 in grain and feeds) and a $50,000,000 increase in the value of textile fibers and manufactures. The value of crude-rubber imports was $21,000,000 larger and that of metals and manufactures $17,000,000 larger in January-March 1937.
EXPORTS AND IMPORTS ----------··
Indexes i I !
:Value Value I of of total total ex- im-Year and month : ports, ports, ad- ad·
;Justed> justed'
i Monthly aver· ;ag-e. 1923-25=100
92V: March ____________ -- ~- 1~~ I 107 932: March _________________ 37 933: MarciL. ______________ 28 2(i 934: March _____________ 50 44 935: MarciL. ............... 48 49 936: March __________________ : 51 M
ApriL------------------: 53 58 MaY--------------------~ 56 58 June ____________________ ' 55 62 July-------------------- 54 65 August._--------------- 51 62 September ______ --------: 55 70 October _________________ 1 57 64 November--------------1 52 61 December------------ __ 57 76
937~anuary ____________ . __ -I 57 74 February ______________ ., ti7 87 March __________________ , 67 85
umulative first qu:.Hter: I 1929 _____________________ 1 3 125 3 116
1933 _________________ -- --i J 291
3 28 19:l4 _______ ----------- ---i ) 4fi '44 19:]5 _____________________ :J 4tl 3 51
J~~L::::::::::::::::::I J 50 J 60 3 62 ; J 85
c
I Adjusted for seasonal variations. 139641-37--2
Export• of United States merchandise Imports •
Ex-!I
Crude II '! Finished I ports, materials manufactures in·
Total II Semi-
11 1 Auto- Semi· Fin-
clud- Food· mo- Crude lshed ing Total Raw stuffs, man-
I Total Ma-~ biles, Total rna- Food- nlan- man• ufac- stufJs ufae-reex• cot- total tures chin- parts terials tures ufae-
ports II
ton ery and tures
i' I :~~~:; I. !I Millions nf dollars
489.9 481.7
I
86.4 59.8 ~UII ti6. 911 2ti3. 7 il 59.0 I 76.0 I 383.81! 138.6 ~3. 3 70. v 81.0
154.9 151.4 50.4 36.5 17.9
~U1I 13. 5 I 9. 3 131.2 . 36.0 42.4 20.0 32.8 108.0 10fi. 3 29.4 18.1 13.4 1~ Hi. 5 1 9. 4 6. 9 94.9 I 23.6 33.6 14. 7 22.9 190.9 187.4 5.5. 3 34.7 20.1 II :n. 4 , I ~0. 7 I 18.31 20.6 154.0 45.2 48.7 29.6 29.9 185.0 181.7 40.4 21.8 16.2 I 30. s lr
U4. 2 I 23.7 25.0 175.51 30.3 59.4 35.2 30.5
194.8 192.1 44.5 26.3 16.81 ~~:~ 11
98.71 27.9 ' 24.0 194.:; 57.7 63. G 36.1 36.8 192.6 189.4 40.4 22.8 14.2 101.0 30.7 23.0 199.8 62.1 65.7 37.6 34.4 200.7 196.9 42.6 22.9 15.9 35.1 il 103.2 29.6 22.5 18S.4 55.1 55.8 38.5 39.1 184.9 180.6 39.3 19.7 14.5 34.1 ! i 92.7 26.0 19.1 193.6 54.6 59.0 43.1 37.0 179.8
176.41 30.4 10.8 15.0 33.3 'I 97.7 29.3 16.9
I 196.5 56.0 59.3 42.7 38.6
178.3 175.6 38.1 12.4 19.7 32.311 85.5 25.2 12.4 200.1 61.7 56.3 40.8 41.4 220.1 217.5 72.8 3S. 2 23.3 31 9 i 89.5 27.3 12.5 218.4 69.4 64.2 40.8 43.9 264.7 262.0 100.4 58.4 24.9 36:711 100.0 31.8 15.8 213.21 62.8 61.3 40.5 48.6 225.8 223.3 82.2 47.0 13.7 32.8 94.6 26.4 21.2
~:II 61.2 58.3 40.6 40.2
229.7 226.61 67.4 I 40.2 13.1 34. 91[ 111. 21
30.8 28.8 75.4 73.3 49.0 42.2
221.6 217.9 37. 51i
13.1 34.2 I !10.1 31. 5 27.6 228.7 77.0 68.4 46.5 36.7 60.6 232. 5 229. 1 1 54.4 34. 1 22.5 37.9 'I 114.2 31.5 2~. 0 I 21l0. :; I 90.9 76.3 52.2 40.9 %56.4 %5%.3 52.2 34.31 17.5 5a.o I 1~9. 6 37.0 28.8 295.9 91.6 97.4 ! 57.9 49.0
1, 419. 611, 396. 61 181.81 1 ~. 122. 2 1 299.4 208.8 205.6 195.6 696. 1 154.4 418.7 256.7 212.3 234.4
330. 1 I 324. 3! 103.5 68.4 42.4 I 45. u[ 132.8 27. 1 19.81274.6 71.9 94.3 44.5 63.9
525. 9 516. 6 HiV. 8 113.8 C2. 3
I 80.9 203.6 I 47.0
44. 0 407.4 1 118.2 126.3 78.3 84. 7 524.3 515. 5 141.3 81.0 48. 7 83. 51! 242. 1 ()0. 7 fi2. sf 496. 2 I 138.4 176.9 94.0 86.9 574. 61 566. 4 154.3 88.6 47.5 89. o I 275. 5 78.0 68.2 570.2 174.8 179.1 115.9 100.4 710.4 699.3 167.1 105.8 I 53. I 125. 1 I 354.0 100.0 82.4 784.9 259.6 242. I ]56.6 I 126.7
' General Imports through December 1933; imports for consumption thereafter. 'Monthly average.

10 SURVEY OF CURRENT BUSINESS May 1937
Real Estate and Construction R ECENT developments in the construction field
have included a sharp advance in building costs, a further rise in rents, a continuation of the decline in foreclosures, a slackening in the volume of public construction placed under contract, and a further marked increase in the amount of private work initiated. The 1\farch recession in the seasonally corrected index of contracts awarded compiled by the Federal Reserve Board was occasioned by the decline in public construction. Private projects increased seasonally from February to March, the comparative totals reported by the F. W. Dodge Corporation for 37 States being $118,583,900 and $164,890,000 respectively.
of the total, the proportion being about the same last year.
Public-utility contracts were more than 50 percent larger this year than in the first quarter of 1936; they were about three-fourths of the comparable 1929 total, whereas contracts for other types combined were not much more than half of the 1929 figure. Both the railroads and the electric light and power industry have made much larger construction commitments this year. Contracts for the first-named group increased from $13,869,000 in the first quarter of 1936 to $24,072,000 in the first quarter of this year; the increase in electric light and power plants was from $7,675,000 a year ago to $29,337,000 this year. For the first quarter of 1937 the value of privately
owned contracts in these 37 States amounted to $413,958,000, an increase of 80 percent over the comparable total for the first quarter of 1936. Publicly owned projects for the quarter were valued at $248,-371,000, or nearly one-fourth less than in the opening quarter of last year. Thus, the increase in total awards for the quarter was reduced to about 19 percent.
The largest increase among the various types of construction so far this year has been in the residential field. Contracts for such construction amounted to $231,578,000 in the opening quarter, or nearly double the comparable 1936 total. Large increases were reported for apartments, dwellings for sale or rent, and dwellings for occupation by the owner. The value of large housing developments made up less than one-fifth
Shipments of building materials from the manufacturers so far this year have increased sharply, as is indicated by the following percentage increases for the first quarter in comparison with the opening quarter of 1936: Cement, 24; oak flooring, 52; lumber, 20; structural steel, 19; fabricated steel plate, 44; and track work, 90. Common-brick shipments han more than doubled.
The number of real-estate foreclosures in large urban centers has continued to decline during 1937, although the number is still abnormally high. Since the first half of 1935 the number of foreclosures has steadily receded, the Federal Home Loan Bank Board index dropping over this period of nearly 2 years from a bout 400 to 200 (1926=100).
Building :Materials, Construction, and Real Estate Construction contracts awarded I j Building-material shipments ] Con- Loans outstanding Real-
', I struc- estate
II I i I tion Federal · f
~~~:::~ Public' ! Com Oak costs, Sa lings Home 0Home, I ~~e_-
index All types.of Resl_de!'tial 1 utili- ] Public j mon" Lum- floor- Ce- Eng. and Loan" Lownaenrs 1 sures ad- construction bmldmg I, ties : works 1 brick ber ing ment . Nl'ws-~ Loa!' Bank Corp
3 1. (non-l"l'ar and month . t d 1 1 1 1 II Rec- Assoc.a- . r )
JUS e 1 , i, : , ord '
1
tions a i arm Mhl N I '11\I'l 'II :,-------.--,:Month- :\Ionth-
?nt Y nm- 1\fil- .- 1 - 1\fil- , 1 • • :! , 1' 1\Iills. Thous.l Thou- ll ly av- ]1 ly a\·-a\ erag'2 her ?f lions of II lwn~ of lions of ]I l\II!lwns of : .. '· fhou-
1 of ft. of ft. sands of 1 erage, I Thousands of dollars erage.
1923-25- pro]- dollars I square dollars 'I dollars ; , sands I b m b m I barrels 111913= I 1934= 100 I ects I feet 1_ :1 , · · · • 1 100 100
c::u~~u-: "'M;c-a-rc7h ________ -__ -_1--1-2C 15,g~i4f485ji-41T 199.9 Ill 21.0 ,, 5~.61!==-:-:.~.~-=-~ 44~82-l 10.1~3 ! 11-2q7.~8 1
1 __________ 1.---------1---~~ ~=-:-: 9.l2. March ________ ] 26 6,646 J121 8.5 33.2 7.8 !II 2-.0 .
1
. _________________ , 13,360 I 3,9,3 I. 1o7.2 .~---------- _________ -------------------IJ:l:l: MarciL_______ 14 6,303 60 4.8 !6.0
1
2.5 II 15.1 i _________ · _______ _! 7,573 1 3,510 I! 158.4 1----------' 22,698 ----------- _______ _ ()34: March ________ ! 33 7,924 178. 7.0 28.1 21.0 1 71.9 I• 48,168 i 1,440 i 13,7Jll 4,618 1[ 194.1 11 __________ : ()0,025 435,778 99.8 !J:l5: March ________ i 26 8, 928 123 ]I 8. 8 32. 2 6. 5 'I 39. 8 '.j' 60,987 I 1, 488 i 14, 606 4, 878 l• 1 194. 3 :1 112. 609 [ 72, 637 2, 539, 408 1 109. 8 9:l6: I '. I ' i I I 'I' .
MarciL. ........ ! 47 10,514 19911 15.6 55.3 'I I?. I i 44.2 i 109,641 11.8.53, 28,479: 7,18611 201.2 11 366,405 1 103.354 3,040,137 i 83.2 Apni__ _________ j 47 13,338 235
1
19.7 (i7.21 23.8 •
1
. 49.711154,473 2,09:l • 29,4831 9,182 ii 202.2 1 390,810 105,969 3,060,029 I 83.9 l\Iay ____________ ! 46 13, 242 216 20. 5 ~o. 3il 12. s ! ~o. 8 11 1 ~~. 418 I, 9~2 ! 28, 579 1 11, 240 jl 203. 4 1 404, 722 110,922 3, os:l, 312 i 82. 6 June ____________ l 52 13,352 233 20.6 t3.6 9.3 1 11.1 1 !t2.892l 1,9,2 31,617 12,521 i 204.6, 442,027 118,580 3,092,871 81.7 Ju]y ____________ l 59 13,890 295 'i 20.5 72.0 r 2
1z, .. s
9 't' 99.11 170,135 2,056 30,123 11,823 1 204.411 465,682 122,094 2,920,739 82.7
August_ ________ ] 62 12,912 2751 24.4 100.5 ,! 76.4 '1!72,748[ 2,005 30,408 12,62~ 208.1 497,852 125,211 2,897.367 78.3 September.-- __ -~ 59 12, 056 234 21. 2 80. 7 1· 15. 7 1 68. 8 173, 723 , 2, 122 33, 432 12, 619 208. 1 ! l 507, ,;74 129, 752 2. 869, 660 85. 7 October_________ 57 12,966 226 21.6 79.7 11 ~ .. 021. 52.9 189,1041 2.327 33,935 13,089 211.5ji 532,064 134,929 2,883,503 1 77.8 Ko\'emher_ _____
1
58 11,269 208 20.0 68.41 " 55.8! 16:J,246 1,751 29,988 8,942 212.7 ,, 531.078 137,250 2,801,827 75.1
937;Jecember. ..... , 66 9,605 200
1 19.0 65.5
1
19.1 I 42.1 :1
141,080! 1.899! 35,8781
6,246l 220.7 ~~~ 544,107 145,39412,765,098 84.~
January ________ -I 63 8, 731 243 18. 4 78.4 1' 21. 8 I 1 46. 7 I! 108, 169 I 1, 722 ) 38, 847 I 4, 680 ! ! 223. 5 1 576, 299 143, 7381 2, 7.11. 451 1
69. 9 Fetmiary _______
1
62
1
9,746 1881' 18.7 63.0 • 32.41.
1
' 27.3,113,5931 2,0471 34,3911' .5,1631[ 223.51 611.212 I. 141,198 2,680,230 65.1 . ~larch ___ ---·-- 55 13,355 231 24.2 90.21] 20.3 32.~ i'---------'--------1 31i,H1 7,81911 22.}.3 1 62ti,907, 142,716,2,642,611 7:~.
F1~:~~quarter aver- I 1 ' i ! : ; 1 ! I ! !
mt::::::::::: 11~ 111~:8~~ ;g919I 1,! 3H 11U 'i~lr :n Ill ~H !l!::~~-=i~~:l--~~~~ril3~:~~; II im Iii. HU li::::::::::'i'i~n~rll:::i&~:~~~: ::::~~:6 1935_____________ 24 1 7,174 6.3 23.7 6.4 . 33.11 45,853 1,426 10,766 3,558 196.3 1jro4,436 77,064 2,457,325 ro5 .. 2
i~~?::::::::::::: ~I ~~~:m ~~~ r ~6:; iU 1 ~~:~,I ~u i --~~~~~~- __ :~~ 1 ~- §~:m ~:~~~ .1 ~~n 1 ~~~:~g~ i~~:~~f 1 ~:~~~:~~~' ~~·~ I Based on 3-month moving average of values and adjusted for seasonal variations. 'Index is as of 1st of month; index for Apr. I, 1937, is 230.3.
' See footnote marked "*"on p. 25.

May 1937 SURVEY OF CURRENT BUSINESS 11
Automobiles and Rubber AUTOMOBILE production again turned upward in
£1 the middle of April with the settlement of the industrial disputes which had temporarily halted the assembly operations of Chrysler, Hudson, and Reo plants. By the end of the month, production of cars and trucks was at thtl highest level since 1929 with 1:39,000 vehicles produced in the week ended ~fay 1, according to Cram's reports. Total output for April in the United States was considerably in excess of 500,000 units, a figure which has been exceeded previously in only 6 months, 5 of these in 1929 and the other being April of last year, when domestic production, or factory sales, reached 503,000 units.
All reports indicate a favorable market for both passenger cars and trucks. ·while factory sales for the first quarter fell short of the 1929 record for the same period, retail sales totaled 1,030,000 units, as compared with 938,000 in the same 3 months of the earlier year. Sales of General Motors to consumers during March were nearly four times as large as in February, with the first-quarter total of 340,700 comparing with 351,079 in the corresponding period of 1929. Total sales to United States dealers by this producer in March exceeded deliveries to consumers for the first time since December, but the difference was not sufficient to replenish depleted dealer stocks.
Operations in Chrysler plants were quickly resumed following the settlement of the dispute. All Chrysler assembly lines were closed during the week ended April 10, but Cram's reported production of 22,000 cars and trucks in the following 7 -clay period and of 28,500 in the week ended April 24.
Tire manufacturers and producers of other rubber goods continued to operate at a high level during March. Crude-rubber consumption has been at a very high rate for the last several months; for the first quarter it was 19 percent higher than a year ago. With the settlement of the Chrysler strike, the Goodyear tire plants resumed full-time operations, after having been on a 4-day basis for several "\Veeks. The Firestone dispute was also settlrd in the latter part of the month.
The present period of improving operations in automotive centers followed the termination of the serious industrial disputes which had an indeterminable effect on aggregate production during the first quarter. Notwithstanding the erratic fluctuations in weekly production figures, output for the quarter approximated n~ million units, the largest first-quarter production on record except for 1929, when 1,453,000 units were produced.
Crude-rubber prices have been sharply reduced since the 1st of April. During March, crude advanced about 5 cents per pound to 27% cents, the highest price reached since before the depression. The subsequent drop canceled most of this rise.
Yt>arand month
AUTOMOBILE AND RUBBER STATISTICS
Automobile production Crude rubber II
Automobile Registrations I New passenger- II Pneumatic exports car sales I 1 tires 1
------~L~Tn~it~e~d~S~ta-t-es------~C~a-n-a--da ----~-----II----~----- I Do·
Do· mestic mestlc conship- sump
ments tion, total'
Total _F. R.11 II Pas-mdex, Total sen· Trucks
ad· ger jJusted 'I cars
1j9~r~· Thousands
New New
ger cars cars
Pro· duetion
Im· ports
World stocks, end of month
Passen- I com· Unad· Ad· ger ears Trucks passen· merclal ljusted' justed'
----~----- 1---~----' ----~----~---. i
Number Long tons :Month- I
_______ 1..c..:25_=..:.1o'-'-o 1
! i M ~~~~~1".:f6gge,, Thousancls 11 'I '; ________ [~----~----,..----
46, 2381 i lf>S. 8 !53. 5 71, 7991 40, i\21 51, 504 I 24,88:1 °1378, OG9 1929: March ...... .. 1932: March ....... . 1933: Mnrch _______ _ 1934: Mnrch ....... . 1935: March .. _____ _ 1936:
March •........ April.. ________ _ May __________ _ June .......... . July ___________ _ August ..•...... September _____ [ October _______ _ November ____ _ December ____ _
1937: January _______ _ Fc•brunry ______ _ March _______ ..
First-quarter, av-crnp:e:
H129 _____ ------19:l:L .. ________ _ 1\l:\4 ___________ _ 103!i ___________ _ HJ:)(j ___________ _
143 27 80
106 107
107 122 117 118 124 Ill 107 93
105 122
120 120 119
585 119 115 338 426
421 503 461 453 441 271 135 225 395 499
380 364 494
514 99 97
279 359
344 417 386 376 372 210 91
191 341 42G
310 2\17 404
19,560 8,318 5,548 3,183 112,1!J2 160 874 38. 4 36.0 17, so3 6, 6:12 5, 52s 2, 528 I ~~0 7 49 9. 113~ 32. 5 30. 5 59, 160 14, 180 IG, 142 JO, 05G 17a, 2~7 :1:l, SS4 ' GS. 4 64. 5 66,503 21,981 20,984 8, 821 261,477 41, jll 100.2 94. 5
77,448 18, 021 I 180 921 9, 999 301,239 .12, 43n ~oo ~m ~m &~ m~ ~~ ~~ ~~ ~m ~~ -~ ~~ 77,061 16,400 14,987 9, 055 369,423 56,851 68,597 10,475 12,714 9, 811 357,490 63, (i95 61, 537 4, 660 8, 323 7, 405 262, 912 59, 222 44, 533 4, 655 4, 564 6, 375 208,896 54, 611 33,940 5, 361 9, 894 6, 826 171,319 41,207 ~w ~m ~~ ~M ~~ ~m 72,702 20,411 24, 788 10, 501 327,303 42,205
117.8 142.3 138.6 139.3 117.3 92.9 71.0 56.5
113. 1 130.4
101.0 93.5 93.5
109.5 104.5 92.0 83.0 85.5
151.0 175.0
7,156 3, 690 2,041 5, 180 4, 293
3, 638 4,854 4, 971 5,610 5, 465 5,014 4, 981 5,125 4,969 5, 311
6,096 2, 8-65 2,023 4,089 4, !flO
3, 784 °
4,836 5, 752 5, 711 5, 678 4, 911 3, 768 4,012 4,162 40 926
-:4,501 29,506 17, gg{ 47, OG9 42,338
42,703 51, 897 50,482 52,636 48,127 46,657 46,330 49,509 50,303 49, 626
50,610 45, 588 28,475 42,253 46, 5GO
34,874 45,830 37,050 38,273 39,843 41,788 50,033 40,965 38,414 51,382
700 249 19, f\83 200 099 12,592 0 2800 615 47,609 90.1 129.5 4, 980 4, 421 48, 744 43, 339
90,241 2J,i01 22633 ll,mi 1 3G6,81i7 58000 HH 122:5 :::::::::::::::: 52,938 40,898
298,383 614,894 6:18,428 6fl6, 382 678,809 ..... 583,318 507,172 541,871 520,255 519.074 500,520 493, 585 4S6, 159 4GG, 491 466, 576
454,249 435,26 448, ti79
67,230 19,707 17.014 I 10,514] 214,97:1 41081D II 85.5 13\151 50,2~2 44,715
' ! il ' i · I 1~06 484 422 (>]08231 31,1361
1 3004!;2 II 19,240 I! 277,(;98 36,208 II 12:3.7 ~--------- -------·· ---· ·-il 42,888 57,402 299,:100
lu:n __________ _
117 99 170371' 4,429 (i,031l 2,!115[1 711,022 10,450 II 29.5 -------- -------- -------I 20,801\ 27,3fi9 633,1fi1 73 241 193 4R,518
1
. 9,8851 !1,5r.n 7,sss, 10\J,ROG 27,oss I 45.6 I____ __;, ________ , -------~42,305 42,187 GG3,87!1 1os 349 1 287 620444 16,901 15,tio91 7,3!12III8!1,o71l 37,022 8744 ._~ ! ___ -_-_-_-__ .. _i:-_-__ --_·_-___ :_--__ --_-__ --__ - 44~0-~ •• :0~ 4344 ,0 ",\,1~,2 fi87o:lst; 108 :~4 •1Bs3•
1
• 28\l 6S. osr; 14,81\4 w. 944 u. uoo I 2:n. 2:Jo 4.io 497 _
1
_ " _ o 6000 305
---------'--I-21-i c...i ~-----"---3-:J7-'---7-''·_9_1:l-'l-'---2-1,_3_3o_lcc_I_9_, 9_15-'---I-1,_4_12....!!___2s_7,_4_s5-'--4-9,_I4_1_.!'-l--l_G7_. r_1_ ,_-_--_--_-_---':_._i_-__ . _--_--_._;_-________ .--"--5-o,_"_"'.'_ :...4_2_, 9_84-'--4-41-io _131
1 Data are raised to industry totals; see note in the 1936 Supplement. 'Adjusted for seasonal yariations. ' Adjusted for num her of working days.

12 SURVEY OF CURRENT BUSINESS May 1937
Iron and Steel FURTHER expansion in production and shipments
of finished steel products occurred during April, although the volume of new orders declined from the exceptionally high total of March.
Increased consumption of steel has been reflected in the steady increase in the weekly rate of ingot production. Ingot output during ::\1arch amounted to 193,700 tons on a daily-average basis, only slightly lower than the 1929 peak of 196,000 tons reached in June of that year. The April rate will exceed that of the preceding month.
Steel requirements of the machinery, agriculturalimplements, railroad, building, office-equipment, and household-equipment industries have all increased markedly so far this year. Machine-tool orders, for example, again increased sharply in March, business for the month being the best of the recovery period with the exception of last December. Orders for machine tools during recent months have been about twice as large as the monthly average shipments in 1926. Likewise, orders for electrical equipment have been far in excess of those of the corresponding months of 1936, and, so far as the two largest manufacturers of general equipment are concerned, first-quarter business was the largest on record for this period. Orders booked by these corporations amounted to $179,990,000, an increase of 76 percent over the first-quarter total of 1936.
Unfilled orders increased during the quarter, as new business was considerably larger than shipments.
With automobile production again expanding rapidly, steel is moving to the vehicle manufacturers in larger quantities than in February or March. So far during 1937, automobile manufacturers.have required approximately 10 percent more steel than in the corresponding period of 1936.
Indicative of the high rate of finished-steel shipments in recent weeks was the report of the United States Steel Corporation that March shipments were less than 4 percent below the March 1929 total. Shipments for the month were 80 percent larger than in 1936, while for the first quarter the increase was 70 percent. April shipments are expected to exceed the March results by a substantial margin, not only for this corporation but for the entire industry.
The rate of ingot production of the United States Steel Corporation is still below that of the independent group, according to the Dow-Jones estimates, which placed the comparative rates at 877f and 95 percent of capacity in the middle of April. This spread has narrowed very materially during the past 3 years, as the broad recovery in the demand for heavier steels was of particular benefit to the leading steel corporation with its heavy investment in production facilities for this type of equipment.
IRON AND STEEL STATISTICS
I General operations \Iron a,nd II Pig iron lj Steel Ingots Steel sheets •I[' United 1
1
Prices stee '' II ' States j
I
11 ' Steel '----,---.,------
1 1 • I i '' Corpo- 'I :
I Em- I '' 1 ration, II Iron ~teel 1 Fin-
1
Produc- ploy- Pay I 'I Pro- ' Fur- I Pro- I New l'llnished 't and billets, Steel llshed Year and month tion, ment rolls, I Ex- Im-11 due- I n':'ces I due- or- I Ship- I prod- I steel reroll- &Crap steel
justed • ad- justed' ' tion blast tlon I cent ' ders 1 I uc 8' 1 com- (Pitts- cago) com. ad- 1 • unad- ports ports . I m Per- ments t ' log (Chi- '
I [justed' I ',
1 of , ship- I poslte burgh) poslte
' ' ' •I II I capac- ,I ments I 'I
I Monthly average, 1 Thousands of long Num- II sands Thousands of , Long Dollars per long ton per 100 l I ' ~-- Thou-~ ity• ----~~---:I ' Dollars
I 1923-25= 100 tons ber 11 oflong ' short tons 1 tons 11 I pounds I 1 tons 'I' ----------'------.-- ---,:---~-- ----,[-- ~---,---,------1--
1929: ?\Iarch .................... 1 J.lO 1110 •t I lOU •I 271 ,):l !i :J.7141 212 I, 5,06:'\ 1 \!91 41>4[ lo4 •
1
, _____ .. 1
35 98 34.00 I lfi.5tll 2.55 1932: 'V!arch ____________________ .. l. :;.) lio.l : :;n.4, 50 ~~ 11 9!\7 "'.J 11 J,4:J:J '. 25 1 H.l2 IIR I :Jss •. :.79il' 2u 2R ~~ g
0o
1
7.1:3 1 2.17
19:34: March ........ ·-·----------·' li7 =.·~.~ r. 54.1i: 2HI :1811 l.t;2o \Jii I 2,7981 47, 108 1 201 , :188.209 1 31.38 26 00 12.13l 2.31 1933: March·------------------··--: 22 !i1.9 25.0 1 ~~ •• , 042
1
:;s I' 898; 15 i Wl 75 2.oli,i93 27.92 5.251 2.10
1935: March ... ______________ -·-1 72 "o G4.1 I :12:J 21 ,, I. 770 \Js 2,8()5 50 1\J:J, z:J:J l'.lli6~,056 11 :J2.3!i 27 oo I 10.50 2. 44 1936: : I I . . ' I '
March ••..................... ' 83! 85.3' 75.41 264 57 Ill 2.040 I 1261 1 3,343 59 252! 210 I 783,552:1 33.21 28.20 I 14.75[ 2.37 April.. •..•......•..•...•..•.. i 100: 87.1i 79.7 302 49[ 2,404•
1
144!1 3,942 69! 190, 25211979,9071133.10 28.0011
14.341 2.36 May ...................•.•... ; 105! 89.0 83.0 I 315 59 1 2,648 146 '· 4,046 71' 192 210 •I 984,097 32.92 28.00 12.88 1 2.36 June-------------------------1 113 i 90.8: 84.6] 295 60 i: 2,586 145 I! 3,985, 70 261, 204 ~~ 886,065 32.79 28.00 12.85 I 2.36 July.......................... 119 93.5 I 81.8 1 2
299I 48 11 2,594 I 146[11 3,923 I 69
219038 1
213 ii 950,851 1
1 33.49 30.00 13.38 I 2.43 August. .•.................... [. 121, 95.3' 86.81 " 61 !, 2,112 1 1
14585
•I 4,1951 74 2561
!97ll' 923,703,
1
33.881 30.00 15.19: 2.43 September •.....•.•..•...•... : 119' 96.8: 87.1· 236 60;; 2,730
1
4,161 73 .04 961,8031 34.15130.40, 16.15·1 2.41 October ..............•..••... i. 127 98.4: 93.2 i 262 65 11 2,992 1
1664
1 i'i, 4,545; ": 223' 224111,007,417 I' 34.63 32.00 116.25 2.46 November •.••..........•.... : 138 99.6 1 95.8, 203 62 I' 2,947 4,3371 79 294, 212 1 882,643 .1 34.65 32.00 16.50
1 2.46
Decemher .•.•...•.......••.•. 1
143 101.0: 102.0! 244 52 1! 3,115 I 170 1 4,432: 78 337' 244 !1,067,3651'1 35.15. 32.40 17.15 1 2.52
1937: I I i ' i ' I I I I January...................... 139, 102.3 i 99.41 202 1 43 i' 3,212 1
IiO 1
1 4,737, 83' (') (') ;1,149,9181 36.55 34.00 18.06 2.57 February ..................... : 129 I 103.7' 103.9[ 291 421: 2,9991 176 1 4,425' 84 (') (S) '1,1313,724 1' 36.74 34.00 19.44 2.58
. MarciL _____________________ ; 1~7 I 106.4 [ 11~.9 571 5~ 1 3,4.59 1 182 11
5 •·•9: S8 •'J ' i'' :t,414,399 i' 39.92 36,40 20,8.) "!.83 F1rst-qunrteravernge: j I i .. I . 1' _ [i ., •• I :nt j: _____ I
iggt:::::::::::::::::::::J li~ li lg,;:g i ~~~:31 ~B~ ~~ . ::~~~ i 2tt !i ::~H. i§ I :~~' 1~~ 1: ;~;:~~~I' ~~:g1 ~g:gg :~:~~ ~:~l 19:J5 __________________________ : 77 ~n I' f•l.'l 271 2.4 1,1)]9, g,, 1: 2,8,, ~6 1· 2313, 2113
11 595,083 ~1 . 32.49 27.00 11.18. 2.44
m¥::::::::::::::::::::::::::1 ~~~ 1~1:~ tb~:~ 1 ~~g 1g , ~:~~~ 1 m li ~:m, ~~ ,~,~8 1 ,,\98 1!/i{i~~i) ~ ~n: ~~:lg iU1 · u~ t Black, blue, galvanized, and full finished. • See footnote marked .. , .. on p. 48.
' With adjustment for seasonal variations. 'See footnote 1 on p. 49.
: Without adjustment for seasonal variations,
May 1H37 SVRYEY OF CURRENT BUSINESS 13
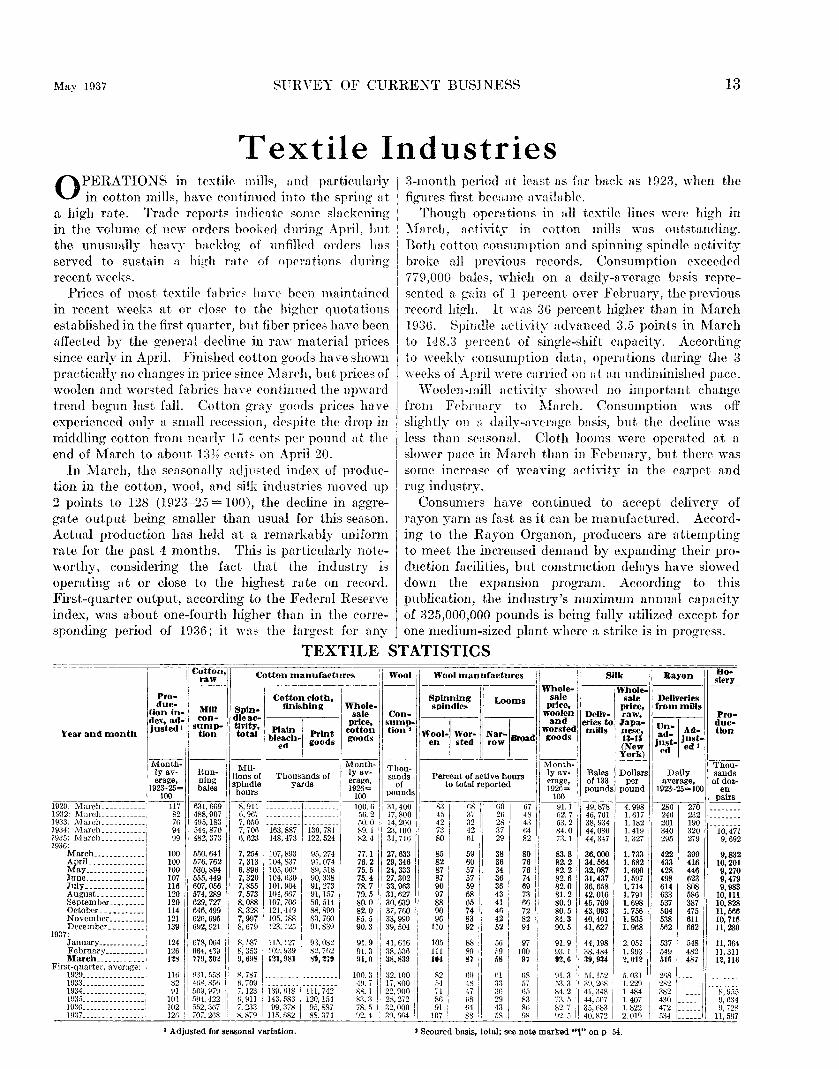
Textile Industries OPERATIONS in trxtil1' mills, nnd particularly
in cotton mills, have continued into the spring at a high rate. Trade reports indic>:ttP some slackrning in the volume of new orders bool.;wl during April, but the unusually heavy backlog of 11nfilled orders has served to sustnin a hig-h rnte of operntions during reecnt werks.
Prices of most textil(' fa bries haw b('en maintained in rreent week; at or dose to the higher quotations established in the first quarter, bnt fiber price;; have been affected by the genernl decline in raw material prices since early in April. Finished eotton goods have shown praetically no ehanges in price sinee :VInrch, bnt prices of woolen and worsted fn brics hnn' continued the up>Ynrd trend begun last fnll. Cotton grny goods prices have experienced only n small recession, despite the drop in middling cotton from ne:ul.'· lEi cents per pound nt tlw end of March to about 13 1,f cent:;; on April 20.
In l\farch, the seasonally adjllsted index of production in the cotton, wool, and silk industries moved up 2 points to 128 (1923-25 = 100), the decline in aggregate output being smaller than usual for this season. Actual production has held at a remarkably uniform ra.te for the past 4 months. This is pa.rticularly noteworthy, considering the fact that the industry is operating at or close to the highest rn te on record. First-quarter output, according to the Federal Reserve index, was about one-fourth higher than in the corresponding pf'riod of 1!136; it wno:. thf' lnrgf'st for nny
3-month period itt least as far back as 1923, when the figures first became available.
Though operations in all textile lines \H're high in l\fareh, activity in cotton mills was outstanding. Both cotton eonsumption and spinning spindle activity broke nll previous records. Consumption exceeded 779,000 bales, which on a daily-average b:>sis represented a gttin of 1 percent over February, the previous rf'eord hig:h. It was 36 percent higher than in l\'fa.reh 103Li. Spindle ltctivity advanced 3.5 points in March to 148.3 percent of single-shift capacity. Aecording to weeklv consumption datn, OJWrn.tions during the 3 weeks of April WNe enrried on nt :m undiminished pace.
\Yoolen-mill activi1.'r sho\H''l no important change from Ff'brunr,v to l\Iareh. Consumption was off slightly on n dnily-average basis, but the decline wns less than S(•asonal. Cloth looms were operated at a slower pace in J'vfareh than in February, but there was some increase of wea,·ing activity in the carpet and rug industry.
Consumers have continued to ac<'ept delivery of rayon yarn as fast as it cnn be mnnufnctured. According to the Rayon Organon, producers are attempting to meet the inereased demand by expanding their production faeilities, but construetion delays have slowed down the expansion program. Aceording to this publication, the industry's maximum annual cnpaeity of 325,000,000 pounds is being fully utilized except for one medium-sized plant where a strike is in progress.
TEXTILE STATISTICS lj Cotton,lj Cotton manufactures II Wool 'I. Wool manufactures ij 11 Silk 11 Rayon 1 Ho• ~' raw i· __ l 1 ;[ ' siPr;y
1·~--- I 1 ' I ' 'I Whole-:• ·Whole-Pro· Cotton ~loth, I j
1 Spinning Looms sale I sale Deliveries
ti du-;- ! I Mill Spin• finishing Whole- I spindles I price, I price, from mills on m-~ sale Con- woolen I Dellv· raw, Pro-
dex, ad- con- d!eae- I 1 price, sump- I I and eries to .Tapa- un-~ Ad· duc-j usted I sump- tlvit;y, PI 1 tto ti • I wor ted ill t• I tion total an Print co n on Wool· Wor- N s m 8 nese, d 10n 1 1
bleeadch- goods I goods 1 I en sted ar- Broad , goods 13·15 j~st- just-row II I (New ed ed I
I I ' 1
I 11 I 1 :.'---1 ___ York)
1
-J'v-lo-n-th-- '---~-M-il·-'1 _M_o_n_th-· ITb~ou~. 11 1 Month- 1 Thou-ly av· Run- . , ly av- I ly av- I Bales Dollars Daily sands
I erage. nl'ng ho.ns of rhousands of erage, sands jl Percent of active hours I f 133 f d dl d f t t t 1 t d erage, o per average, o oz·
1
1923-25= hales spm 0 yar 8 1926= 0 0 0 a repor e 1926= 1 pounds pound 1923-25=100 en ~---cc----- 100 hours 100 pounds I ~~ ---- ---- pairs
1929: March ___________ --1-1-7 631,669 [R:0111~=-:-:-:- ~~I 31,400 S:J I ~;~~~·· .1·1, 60 I 67 I \!1.1 49,878 4.998 2so 210 ·-----·
19:l2: March___________ 82 488,907 5,967 ____ ____ _________ 56.2 117,800 45 _ 2fi 481 fi2.7 4{i,761 1.617 246 232 ______ _ 1933: March.----------1 7ti 495,1831 7,050 ------------------ 50.0 114,200' 421 32!'1 28 • 431 53.2 38,934 1.182l' 201 190 ______ _ 1934: l\farclL __________
1
. 94 544,870 7,706 163,887 130,781 89.1 2il,IOO I 731 42!' 37 64 j 84.0 44,080 1.419 340 320 10,471
~~~~;MarciL ________ ,_: 99 482,373 6,623 148,473 122,524 ~2.4 I 31,716 88051 Ill 29 82 : 8733 .. 81 1'13464,,003407 11 .. 73323711422925 329799 99,,863922 Macch ............. ·1
1 100 550,641 I 7,254 107,893 95,274 77.1 127,633 1 59~·~ 38 80 '1'1
1
ApriL. ____________ 1
wo 576,762 7,313 104,837 91,074 76.2 29,346 82 56o7
'·· 36 76 . 82.2 34,564 1.682 433 416 10,201 May............... 100 530,894 6,~96 105,06~ 89,MS 75.5 24,333 87 34
1
76 II 82.2 32,087 1.600 I 428 446 9,270 June_·----------·-·[ 107 555,449 7,320 104,630 90,338 75.4 27,302.
9807j 5
579
'[1. 36 74! 82.6
1
31,437 1.597 498 623 9,479 July............... 116 607,0561 7,855 101.904 91,273 78.7
133,9631 36 691: 82.0 36,658 1.714 614 808 9,983
August._ •.•.••...•
1
1 120 574, 289 1 7, 573 104.667 91, 157 79. 5 . 31, 627 97 68 . i 43 I 73 i i 81. 2 42, 016 1. 791 ' 633 586 10,111 September......... 120 629,727 lj 8,088 107.706 86,514 80.0 l 30,6391 1 88 6511 41 66 'i 80.91' 45,70911.6981 537 387 10,828 October........... 114 646,4991 1 8,328 121,419 88.S90 82.0 jl 37,760 I[ 90 74 ,I 46 1 72 li 80.5 43,093 1.756 504 475 11,566 November......... 121 626,695 fl' 7,997 105,188 S3,7GO 85.5,1
1 33,990 96 83
1
; 5422
I.· 894
21 1.• 84.3 40,401 1.935 538 611 10,716 December.._______ 139 692,921, 8,679 123,125 91,839 90.3 1 39,504 II· 1!0 92 1 90.5 i 41,627
1
1.968 .162 662 11,280 1937: I ' I' I 1 I 'i
January .•.......... l· 12411678,06411 8.587 110,127 93,082 91.9::41,61611 105 8811 56 i 9711 91.91144,198 2.051 537 5481' 11,364 Februarv 126 .
1 r.64, 4'l9 'I s, 353 109, \J39 R2. 7n2 m. 3 ! 1 38, 536 :I 111 89 :I 59 1 100 11 93 1 1 38 4S4 1 993 549 482 11 311
March_·:.-::·:=:::11, 1281 779,30~ I 9,6!18 121,981 89,279 9!.0 1,: 38,839 II 104 I 87 '.'I 58 I' 97 I, 92:6 [, 39:9:u 2:012 516 487 12:ll6 First-quarter, average: I 'i I ' '1 'j I
1929---·------------1 1l~ 1jl' ~(;},~~~I! ><.787 _________ 100.3 If 32,1001 s2l r .• n 1
1
. til
1
1 GS i' 91.3 ·~~~M,152
11
5.031 [1 268 ------! ~-----~-1933________________
1 tL709
1_________ _________ 41•. '/' 17,soo 1 541 4s, :n ,,7 i 5:J.3 . :1u,2os 1.22n l21-2 _-_--_-_-_-_
11 ___
0,_
11,;,r,
1934_______ 1 91i,WIJ,97\l 1 7,123 1:W,GI8 111,742 ss.1 122,9001
71 47[ :;n ti5i ~4.2[41,:!48 1.484l 382 o ..
11):{5________________ 10\ II [)04,42211 fi,911 r' 143,583 120,154. ~:1.3 'I' ~S,272 I 8fi 1·8 29 83: d.5 I 44,n07 1.407 I 430 ------1 9,n:J.j 1\JilfL ______________ I 102 .\52,:Jn71 7,233 99,378 95,8871 ,R.5j 32,000 i 91 M 11 431 sr; 1 ~2.; 1135,1i~31 1.822j 472 ______ \1.72S Hm _______________ ~ 12r. 1: 707.2iiS ,· ~<.879 !1.1.582 88.374 '12.4 I 39,no4 · 101 ss , 5S ns 1 .12 ..• , 4o.s,2 2.o1n .. 5.l4 ______ 11,5117
Year and month
I Adjusted for seasonal variation. I Scoured basis, total; see note marked "1" on p 54.

14 SURVEY OF CURRENT BUSINESS May 1937
Index of Grocery Chain Store Sales By Reba L. Osborne, Market Data Section, Marketin!l. Research Division
T HE index presented herewith is the most recent of the series of retail sales indexes constructed by the
Bureau of Foreign and Domestic Commerce to provide more adequate current data on the movement of retail trade. For some time the Bureau has been publishing monthly statements of percentage changes in chain grocery sales based on a sample which represented sales of an identical group of retail units each month. A homogeneous sample for all firms for a period of years was not readily available for use in constructing the index of sales. This index, therefore, has been constructed from total dollar sales of the contributing firms without consideration of the change in the number of store units and reflects the growth or decrease in grocery chain-store business, rather than variations in sales of an identical group of chain units.
The dollar sales figures from which the index ·was constructed have been furnished by a group of chain organizations doing about 75 percent of the total grocery chain-store business. Although the index is representative of grocery chain-store sales, it is not designed to measure the sales of all grocery stores, since the trend of sales by independent grocers varies somewhat from that of chain organizations. (See table 1.) The 1935 Census of Business reveals a higher rate of increase from 1933 to 1935 in sales by independent grocers than that by grocery-store chains. From 1929 to 1933 the relative decline of the independents was greater than that of the chains.
INDE.X 120
Table 1.-Grocery Store Sales by Types of Operation
1929 1933 1935
Item
---------------------Total sales ______________________ 7, 353 100.0 5,004 68.0 6, 352 86.4
Percent of totaL_---------- 100.0 100.0 100.0 Independent stores _____________ . 4, 488 6!. 0 2, 776 37.7 3,849 52.4
Percent of totaL ____________ I 61.0 55. 5 60.6 Chain stores ___________________ . 2. 833 38.6 2, 209 30.0 2, 467 33. 5
Percent of totaL ______ ----- -I 38.6 44.1 38.8 Other outlets ____ ----- __________ 1 32 0. 4 19 0. 3 36 0.5
Percent of totaL _________ --I 0. 4 0. 4 0. 6 I
Source: Census of Business, 1935.
Character of the sample.
The chain organizations which have supplied material for the sample on which the index is based sell both groceries and meats. They operated more than 30,500 stores in 1935. The number of units operated \Yas about 65 percent of the chain grocery stores reported by the census for that year and gives representation to all regions of the country in remarkably similar proportion to the census distribution (table 2). The firms cooperating in supplying monthly sales figures are as follows: American Stores Co.; Daniel Reeves, Inc.; First National Stores, Inc.; Great Atlantic & Pacific Tea Co.; H. G. Hill Co.; Kroger Grocery and Baking Co.; National Tea Co.; Red Owl Stores, Inc.; Safeway Stores, Inc., and Southern Grocery Stores, Inc.
Sales of these 10 firms amounted to $1,641,000,000 in 1935, as compared with $2,209,000,000 for all grocery
110 J11ifhot.1f Seasonal Ar!Jusfmenf
----j'f------t-
-~----~----r----~------~------~---~-----~---~70
0~LULULU~~~~~~LULULU~~~~~~~~LULU~~~~~ULUL~WULULULU~~Q
1929 1330 19}1 1332 1333 1934- 1935 1937 (9080-11
Fi!).ure 1.-lndex of Dollar Sales of Grocery Chain Stores

May 1937 SURVEY OF CURRENT BUSINESS 15
chain stores and with $6,352,000,000 for all grocery store sales, both the latter figures being from the Census of Business for that year.
Table l.-Grocery Chain-Store Distribution by Geographic Divisions, 1935
Geographic division I Store units All ~rocery I All grocery in sample ch~~t~t?re J~l~~~-s~~sel
-----------------------:1-------1-------------i
Total United States.-------------------1
~1;~-dTe~~\~~gtic:::::::::: ::::::::::::::::::::I East North CentraL _________________________ i West North CentraL _______ -------------- ----1
&~}fti~~~:.~;~, • •••• • ••• • •••• • •••••••1 1 Computed from Census of Business, 1935.
Method of Computing the Index.
100.0
15.8 30.6 25.8
5. 1 9. 7 3.1 2. 5 1.5 5. 9
100.0
13.2 33.9 22.1
5. 6 9. 9 3. 9 3. 4 1.4 5. 5
100.0
12.4 29.9 22.7 6. 2 9. 8 3. 6 4. 1 2. 4 8. 9
The monthly index numbers are based on average daily sales. After converting the sales figures of each firm to a basis of average daily sales per calendar month, the figures of the 10 firms were combined for the respective months of the year and the index numbers computed, using the monthly average for the years 1929-31 as 100.
This conversion of the sales of each company to a daily-average basis was necessary, as the sales figures are not reported on a uniform basis because of the difference in accounting periods employed by the several companies. Some organizations record their sales by straight calendar months, others by periods of 4 or 5 weeks, while still others employ a 4-week accounting period, fitting into the 13-month year. Sales reported on an alternating 4- or 5-week basis usually conformed closely enough to the calendar month, but those reported on the 13-month-year basis required an adjustment by prorating the sales figures to the C'alendar months in which the different periods fell_!
A compnrison of these figures with those of all groeery dmin-store sales reported by the Census of Business revenled that the trend of snles ns represented by the index followed closely that of the country's total grocery chain-store sales. The decline in sales from 1929 to 1933, as measured by the index, was 22.6 percent, or only slightly more than the deerease of 22 percent reported by the census. From 1933 to 1935 the index showed an increase of 9.3 pereent, eompnrecl with a gain of 11.7 pereent reported in the census. The index here presented has been corrected for this bias b:\- adjusting to the census trend. To accomplish this, the montltlv figures, beginning with January 1930, were adjusted by means of arithmetic interpolation. The process inYolvecl the application of a cumulative unit, which, when applied over the months of the intervening periods, resulted in bringing the ayernges for those years
'Sales for the 4 weeks were converted to average daily sales by dividing by 24. If 18 weekdays of May fell in the fifth reporting period and 8 days fell in tbe sixth report.ing period, the total sales for May were calculated by adding 18 times averag€ dnily sales in the fifth period to 8 times average daily sales in the sixth period.
corresponding with census years into adjustment with the census figures. 2
Reduction to Average Daily Sales.
Not all months have an equal number of working clays, nor are sales of grocery chains evenly distributed throughout the week. According to information supplied by some of the contributing firms, nearly 40 percent of the weekly business of chain grocery stores is normally done on Saturday. For the purpose of converting the sales figures to an average daily sales basis per calendar month, the number of working days in each month has been calculated for the years 1929 to 1937 inclusive (table 3). The days of the week were evaluated from the sales experience of the firms and the following weights assigned: Monday, 0.6; Tuesday, 0.7; Wednesday, 0.7; Thursday, 0.7; Friday, 1.0;
INDEX NUMBERS (1929-31 = 100) 120 '
110 {\
lv 1\ 100
' 90 1\
i\ ~ v
lfV 80 . 1;\
1\ (\ 70
" ~ 60
0 $ 1
1929 1930 1931 1932 1933 1934 1335 19}6 1931' (!JOBO·IJ)
Figure 2.-Retail Prices of Food. (See table 4 for source of data.)
Saturday, 2.3; total, 6.0. The number of working days in any one month was then ealculatecl by adding the vveights of all the business days in that month. No allmvance was made for holidays, except as noted below, it being assumed that food for consumption on holidays is bought on the preceding day and that the total sales are not affected. However, when a holiday falls on the first working day of a month, six-tenths of a clay, the weight of ·Monday, is subtracted from that month and added to the preceding month. The sales figures on a calendar-month basis were then divided by the calculated number of working days in the
'A detailed description of this method appears in U. S. Bureau of Labor Statistics Bulletin, No. 610, Revised Indexes of Factory Employment and Pay Holls, 1919 to 1923, p. 14.

16 SURVEY OF CURRENT BUSINESS May 1937
respective months to arriye at the average daily sales I for the different months.
Table 3.-Number of Working Days in Each Month, 1929 to 1937, for Calculating Avera!).e Daily Sales of Chain Grocery Stores
I I ' I I ' . ' :!11onth 11929 I 1930 ~ .. 1931 11932 i 19331. 1934 ! 1035 ~ 1~3G ', 1937 --- 1·-~---~---·-'-'
January ..........•...•. 25 .• 5 25.8\' ~7.41' ~6.7 24.712".411 ~5.512~.8 [ 26.7
February ............... 24.0 24.0 .4.0 d.6 24.0 2~.0 d.O 25.3 21.0 March .................. 27.3 \ 26.9
1 25.3 26.1 2G. 4 28. o I 27. :l 1 25.31 26.0
ApriL ................. I 2.5. 3 25.4 I 25.4 t' 27.3 26.3 1 24. G _ 25.3 1 25.4 z,;_ 7 1\iaY--------------------126.4\2~.0 27.3 2.i.3 2G.O 1 2ti.l 26.-t 1 27.:3, 2G.9 June ....................
126.3 24.fi ]25.3, 20.4 25.7127.3 26.3 12.1.3 I ~5.4
July ..................... 26.0 I 26.1 126 .. 4127. 3121>. 9 1 2.5. 3 26.0 i 26.4 ' 28. o August. ________________ l28.t1l 27.9 20.9 26.0 26.1 126.4 2S.d I 26.9' 2-i3 September.. __ .. _ .. __ .. _ : 24. o 1 24. 7 25. 4 25. 7 1 27. 3 2(i. 3 21. o I 2-5. 4 1 2o. 4 October ................ ; 26.1 i 2(i.4 128.0126.9125.3 2().0 26.1 1 2,_(1 · 27.3 Novernher ______________ l 27.3. 20.:3 i24.t). 25.4 2.\4 25.71 27.3I2~.G :. 2:1.:J December_ _____________ [ 25.H 126.() 120.7 '. 28.6 27.9. 27.5\25.9: 2t3.7: 27.0
1--~---,,----i-_ --I---I--TotaL ___________ :312. 7 :312.7 ,J12. 7 ,:)1.1. :l
1
312.0 f312. G 1312.7 !3J:l. l , 313.0
Adjustment for Seasonal Variation.
Seasonal fluctuations in grorery-store trade, although not pronounced, are sufficient to Heeessitate adjustment. Correction factors, therefore, were romputed using the "ratio to moving average" method, with some further refinements. The adjustment factors inclirate that minor peaks are reached in April and December, while the low point for the year is reached in August .3
Trend of Sales.
Although the quantity of food sold did not full so low during the depression as did the volume of sales in other major lines, nevertheless the marked drop in prices was reflected in the dollar volume of sales (fig. 1 ). Sales of cha.in grocery stores in 1933 were only about three-fourths as large as in 1929, the index figure for the year having receded to 80.3 on the basis of the avera.ge for the years 1929-31 as 100, from 102.9 for 1929. The greatest decline for any one year occurred from 1931 to 1932, when sales decreased about 11 percent. Accompanying the increase in general business activity and with rising prices, sales increased about 3?~ percent in 1934 over those of 1933; in 1935 there was a gain of 77f percent over 1934, and in 1936 there was a further yearly gain of about 57f percent. The index figure for the year 1936 was 94.4, indicating a recovery of more than 60 percent of the dollar volume lost between 1929 and 1933. Sales during the first quarter of 1937 indicate a continuation of this improYement.
Comparison With Price Index.
The influence of price changes on the volume of sales is not readily ascertainable, owing to the lack of a price index comparable with the sales index. A rehtil food price index is compiled by the Bureau of Labor Statistics. This index, presented in figure 2, provides an indication of the influence of price changes on chain grocery sales. However, no attempt has been made to adjust the sales index by the prire series, because the variations in the items included and the weights involYed render the validity of such procedure doubtful.
3 The seasonal adjustment factors follow: January, 97; February, 100.5; :!\farrll, 101; April, 103; May, 101.5; June, 101.5; July, 98; August, 96; September, 98; October, 100.5; November, 100; December, 103.
Table 4.-Retail Food Prices
[1929---31 = 100]
II I i I ' .
'-fonth 1 1\!29 1
1930 1g31 : 1932 ; 1933 I 1934 19:3.1 ; 19:lG j 19:l7
--~--~--~-~ __ , __ --~-:--
J~nuary ______________ i 107.5 109.!i 1 93.4 i 7tl.2 65.5 73.8 1 81.1 85.5 8~.fi ~ ebruary ___________ ..
1
107. 1 108. 3 90. o 73. 8 r.z. 9 7.1. 9 i So. 4 84. 1 ss. 5 '-_f arch ________________ , JOG. 1 106. 8 89 .. I 74. 0 62. 6 76. 2l8.3. 3 S:l. 2 89. 4 ApriL_ _______________ ! 10.5.5 108.2 87.8 73.fi fl2.9 75.5 80.0 83.7 May __________________ ~ 107.2 107.4 Sf\.5 71.7 65.4 7(i.4 8.1.2 87.7 June _______________ ..
1108 .. 1 10fl.O 84.4 70.8 68.0 77.0 b.\.3 87.9
JulY------------------1 111..0 102.1 8!.5 71.5 74.3 I 77.1: R4.0 87.9 A up:ust ____ : 113. 2 HI!. 1 84. 7 70. 3 75. 4 I 77. 8 I s:l. :l 87. 9 ~eptemher ___ ; 113. 1 1(12. \! ~l. 4
1 f>\1. 8 ' 7.1. 3 80. 7 i 83. 9 88. 3
O~e:t~)her_~-------------: 112.~ 102.~ ~:).7: fJD.~ I74.Y i z~!.5 i 8i.:J ~~.i 1\o\emher_ ___________ l 111., 99., kl.9 1 fiS.' 1 74.1 · ,Kfi I 80.3 R6.4 Deeembrr __ ---------, 110.7 1!6.1 • 79.8 1 67.7 • 72.5: 78.0 I 85.9 sc.~
' I : I I
Source: Computed from the C. S. Bnreau of Labor :Statistic-s index, which is reported on a 1n:l-2o base.
Indexes To Be Issued Monthly.
The index figures shown in table 5 will be shown regularly in monthly stat0ments issued by the Burenu in mimeogrnplwd form, and the figures will also appear with the retail-trade series published each month on page 26 of this publication. It is the intention to drop the index of sales of chain grocery stores as reported by the Chain Store Age, no-w shown on that page. Movement of Index.
This index may be accepted as representing accurately the movement of chain grocery-store sales over the period coyered, in Yiew of the slight variation from the census returns. However, in the future the accuracy of the index will depend upon the extent to which the sales of the 10 companies reflect correctly any shifts in distribution which may take place in the grocery chain-store field. "Whether changes that may occur from now on in the field of distribution will destroy the validity of the sample is a question for the future to determine; but, if such tendencies do develop, they will be revealed by the periodic census enumerations covering the retail field.
Table 5.-Index of Average Daily Sales of Grocery Chain Stores, Dollar Volume Basis
Month
--------------ry- -----------
Januar~ Februa Marcb. ApriL. May __
--------------------------------------------
June .. ·--------------July __ _ , ______________
---------------ber.. _________
1929 ----
95. I 107.5 101.3 101.4 101.8 100.6 98.5 98.2
101.6 r_ _____________ l her. __________ ber ____________
---------------
August Septem Octo be Novmn Decem Annual
109.0 108. I 1!2. 4
102.9
[1929-11=100]
\Vithout adjustment for seasonal Yariation
1930 1931 1932 1933 1934 193;') 1936 1937 ----------------
103.3 95.2 88.5 74.5 78.4 85.3 91. 5 95.0 104.8 100.3 87.9 77.8 84.4 89.8 95.6 97.9 103.6 101.6 90.3 77.9 86.0 89.6 94.1 v 99. G 105.3 103.8 91.3 79. 1 83.4 91.8 95.1 ------102.5 99.9 91.2 79.9 84.5 90.4 92.0 ------101.2 98.2 86.1 82. I 85.0 90.4 96.7 ------95.7 94.6 82.8 82.3 81.3 86.1 94.9 ------96.3 \11.5 80.5 78.7 80.6 83.9 92.1 ------97.1 91.9 81.8 80. f) 82.1 89.6 9:l.O ------
100.1 94.2 83.4 82.8 83.5 91.5 94.2 ------99.3 93.5 80.9 81.6 84.0 91.6 95.8 ----
101.6 92.3 83. I 8.5. 9 86.9 95.4 9(i. 4 ------100.9 96.5 85.7 80.3 83. 3 89.6 I 94.4 ! -
\Vith adjustment for seasonal ,-ariation 1\Ionth i . .
i 1929 11930 19:n 1193211933 1934 1935 1 193o i wa7 --- ,----------------1---;--January ______________ i 98.1
1
10f>.!i 99.1 91.3 76.8 80.8 87.9 I 94.3 'I 97.9 February ____________ ! 107.0 104.3 99.8 87.4 77.4 83.9 89.3 95.1 97.i March ... -------------! 100.2 102.6 100.6 89.4 i 77.1 85.1 88.8 9:1.2 > 98.6 ApriL_ _______________ ! 98.41102.2 100.8 88.7[76.8. 81.0189.1 93.3 1 _____ _ May _________________
1
10o.2 100.9 98.4 89.8 78.7 s;u 89.1 91.7 i------June __________________ 1 99.1 99.7 96.7 84.9180.9, 83.8189.1 95.3 1 ......
JulY------------------1 100.5 97.7 96.5 84.51
. 83.9\s:l.O \87.9 9G.8 ~------August. ______________ ! 102.3 100.3 95.3 S:J.9 82.0 i 84.0 87.3 95.9 i------Septemher. ___________ l103.7 gg_1 93.8 ~3.4! 82.31 ~3.8 1
1
91.4 94.9 1 ...... October. _____________ , 108.5 99.6 93.8 S:l.O 1 82.4 8:l.1 91.0 93.7 I _____ _ November. ___________ 108.1 99.3 93 .• o 80.9 i 81.6 81.0 91.6, 95 81 Deremlwr ____________ i 109.1 98.fl 8fl.6 80.7! 83.4! h4.3, 92.7 \ 93:r; ,::::::
11 Preliminary.

May 1937 SURVEY OF CURRENT BUSINESS 17
NEW OR REVISED SERIES
Table 19.-WORLD STOCKS OF FOODSTUFFS AND RAW MATERIALS, QUANTITY [Monthly average 1923-25=100]
:.J ~ *-= ~ ~., *-= ~.,I,; I~ I! t *-= '*-= ~ ~-= '*-= ~.~ ~~-;~ ~~ i~ j ;i~ ~~ I §.~ I ;~ 11
Year and month :;~ <>~ §~ i~ .~ .:~ "'- I ··~ :;: . .., .::....., - ..... '1 QIJ • ...., Q;l·~ I .... -. ~ ,:: ... '"'l I s.s ~.a ... = '5- =~ ~-a = = = :I :: :I ~ I ·= I ,.... I = = ~...... - :I
Year and month
0 f, 0 0 i:l:l 1TJ 1TJ "" i ""' I ::: , 0 0 "" ~ 1TJ 1TJ lUZO --~
1--------,----·--,---,f .------------------
t:::t~:~:;;y~::::::::::.::-1 i711
1,. ~~g gb !::::}:::J::::: m /;e! 1
' ~f 1
1/ ~~~~~~~/~~~:::::::::: 11 i?? 1
:
1 n~ g~ ~~ m /I m il~ m ;g~ March _________________ , 1~1
1
117 1~8 ______ ------ ------~lH> 88 Z2 I Marcn_________________ 10~. 1;0 11? zs 114 lll llo 94 107 ApriL-----------------~1 LO ~~ 11 01 62 1.>3 ------ ------ ------ 114 93 1 ,g !1 Apnl___________________ lOti 1 L3 1.13 ,3 119 114 114 87 99 May___________________ 131 . 164 ______ ------ ------ l.ll lUI 9! 'I May ___ ---------------- 10-1 1 110 106 73 123 118 111 100 95 June___________________ 1041 11)4 170 ____________ ------j 144 90 97 I June ___________________ f 9£• I 1C3 93 75 1291115 115 95 92 July____________________ 141
1
105 184 ------ ------ ------ 157 89 941 July ____________________ , 96 103 ~8 69 113 119 115 95 86 Augnst.._______________ 1:J5 Ill 182 ------ ------ ------ 15fi 9.1 78 , Au~ust. ________________ , 97 100 92 71
1
, 115 124 117 96 SO September _____________ ,
1
116 .1115 143 ------~------~------ 148 91 74~.~ September. ____________ ; 10~ I 107 1?2 71 11~ 126 121 85 9~ October._______________ 1061
11
1142 123 ------ ------ ------ 114 99~ 72f October ____________ ~--- 110 117 123 70, 11o 132 117 z
7n So
November______________ 108 129 ------•------ ------ 137 " 71 • :-.J'ovember. _ 11:l 120 129 7fi 1 117 1 137 114 o 85 December______________ 1061
1 117 128 ------,'------ ------ 122 93 69 i! December_~_::::::::::: 121 123 139 75 114 142 110
1
1 87 103
Monthly average _______ , 119 11 110 148 ------ ------~------ 134 95 79 il Monthly anrage_______ 107 111 114 74 117 121 115 94 95
JanurtrY -~~~: __________
1
1 109~~~119 137 ______ ' _____ _!______ 115 1
91 65
1
;1 JanuarY~-~~:~---------- 121 117 140 87 106 135 ! 110 ! 81 109
ii~icl;"."~-~:::::::::::::: 109 I m m ------ ------~------ m ~~ 66 February_______________ m m m ~1 m 136 ~~; ;,~ 1~~
f;£j\~~~~~~~~~~~~~~/ m1
1i tH ~ :~ _:_i ~~ H ~I ff~m:::~-- : m ~~ ~~ ~~ !i! ~~. :~ !! ~ August.________________ 105 I 129 232 ___________ J_____ 139 93 94 1 August.________________ 12o 127 131 111 115 153 i 110 64 110 September.-------~---- 140 II 124 182 ------ ------~------ 128 102 91 1 September_____________ 127 135 13± 123 123 152 117 69 10:!
~~s;~r,l~:~-~~:::::::=::: 1. tlt ,, m m :::::: =:::::1:::::: m i~~ ~g 1 R~~:~~l~:E:::::::::::: m m m m m m m 1 ~~ ~~7 Monthlr average_______ 129 124 169 ------ ------)------ 126 95 77 1; Monthly R\Wage ... ~--- 125 126 142 110 117 144 107 74 101
.January __ ~~~~---------- 111 123 131 ______ ------1------ 110 134 7311
January __ ~~~~---------- 140 I, 128 li5 134 123 128 113 7! 125 February_______________ 109 127 128 ___ --_-_-_-__ -_-_--__ -_- 114 124 72 February_______________ i~D1 121 11 ~1 31 138 125 136 10
9I 68 122
l\larch_________________ llU 126 128 111 111 76 March·-------------~-- 115 142 126 149 " 74 121
tR~~~~~::::::::::::::::: m g~ m ------ =-==========!====---_====== m m ~~ 1 tg~1_-::::::::::::::::::, i!~ igl i~i i~i gg i~8 g~ ~g m
June___________________ 120 129 143 _ _ 109 116 84 June___________________ 145 122 !SO 152 135 137 97 75 115 JulY------------~------- 118 128 144 109 112 79
1
July _____ ~-------------- l!i4 152 201 154 14o 1:m 101 74 125 August.________________ 110 126 129 ------ ______ ______ 100 121 75 Au~ust._ ___________ ~--- 161 177 207 159 !Hi 151 106 70 127 September_____________ 103 118 114 ______ ______ ______ 102 110 80 September_____________ 1.\2 193 17.5 H\1 1H 160 109 72 113 October________________ 107 113 118 ______ ______ ______ 98 113 89
1
October ___________ ~---- 146 203 154 163 142 155 1!5 70 114 No,·omber______________ 104 108 110 ____________ ------ 95 125 92 November_____________ J.lf\ 221 151 1.19 142 155 125 70 118 December______________ 100 103 104 ----~- ------ ------ 94 120 91 ! December______________ 1H il 231 HO 1.36 142 148 128 76 125
Monthly average_______ 111 122 127 ------ ______ ------ 106 119 81 1 i Monthly average________ I l6 157 175 151 135 146 107 72 120
January________________ 100 103 102 ______ 104 91 98 124 99 January________________ 148 234 138 1R3 127 172 125 73 134 1923 1: 1928
February_______________ 94 101 97 ------ 94 85 91 121 94 February_______________ 147 243 133 152 120 173 12.5 85 129 March_________________ 92 95 94 ______ 92 84 93 118 92 March_________________ J45 248 136 147 124 157 123 75 132 ApriL_________________ 87 86 85 ------ 80 82 88 106 951 ApriL _________________ , 118 267 150 144 137 13S 121 72 140 May___________________ 85 80 82 ------ 86 84 84 107 89 MaY-------------~-----~151 275 161 142 143 HO 124 82 145 June___________________ 84 80 77 ______ 87 84 81 102 90 June___________________ 161 287 170 144 136 145 12-1 78 158
~~~~list::::::::::::::::: ~~ ~~ ~~ i :::::: ~~ ~~ ~~ ~g ~ll ~~[u:s't::::::::::::::::: i~~ ~~ i~g J!~ Ji~ m g~ ~z m September_____________ 83 80 88 ------ 40 77 90 95 94 September.____________ 15-l 268 134 140 136 175 129 96 153 October________________ 87 75 90 ______ 75 72 95 99 101 October________________ J;,g 252 150 136 135 171 129 100 166 November______________ 91 70 91 ______ 88 85 92 94 104 , November______________ 157 245 149 142 127 165 129 106 161 December______________ 93 70 92 ------ 95 91 94 101 102 1 December __________ ~--- 160 240 146 149 131 164 126 118 178
Monthly average_______ 89 84 88 ------ 82 84 89 104 95 jl ?.Ionth!y average_______ 151 261 149 145 134 159 126 88 150
1924 i January________________ 98 78 93 113 97 91 96 117 109 I February--------------- 99 83 97 107 101 88 96 105 Ill MarciL._______________ R8
8 1 85 92 106 101 88 97 112 115
1 ApriL-----------------1 " 99 88 102 98 97 99 91 11.5
.f~~L:::::::::::::::::I ~~ g~ ~~ i8g i86 i26 ~~ ~g i8~ July____________________ 96 113 82 110 90 96 85 97 107 AngusL_______________ 96 118 78 112 99 84 89 102 117 September_____________ 93 119 90 101 99 73 91 97 100 October________________ 100
1
117 101 96 102 90 95 91 106 ~ovomber______________ 106 113 111 92 111 104 104 101 107 December. ... __________ 108 110 113 85 112 114 110 120 99
Monthly average_______ 99 II 106 93 103 101 94 102 109
1 See footnote on p. lS.
130641-37--3
1929 J annan' _________ -------~
~i,~:ct;i~:~~::::::::::::: ApriL ________ ---------~ May.-----------------June. __ .-----~--------~ July-------------------_, August_ _____ -----------1 September __ -----~-----1 October_--------------- i November----------- -~-j December----------- __ _
Monthly average _______ !
162 163 165 Hl3 lt\6 168 173
i~~ I 196 I 191
191 tl 176
236 234 227 217 217 213 z:J7 2.\! ~S2 309 317 33!
256
149 146 149 148 146 148 145 1.)7 146 163 !57 15-t
1[.1
1.51 156 !53 154 1ii7 160 !G4 IGO 176 185 1~6 194
167
126 125 135 135 1:l7 1~8 1.\1 !51 157 171 177 185
119
169 175 173 164 173 173 182 195 225 219 210 207
189
124 126 134 133 137 140 151 150 146 1-18 146 148
140
116 127 128 126 119 114 11-l 127 118 123 121 135
122
181 182 187 193 198 202 210 223 217 216 209 198
201

18 SURVEY OF CURRENT BUSINESS May 1937
Table 19.-WORLD STOCKS OF FOODSTUFFS AND RAW MATERIALS, QUANTITY-Continued
Year and month
1930 January _________ -------February ________ -------March _____________ ----ApriL ________________ _ May __________________ _ June_------- __________ _ July ___________________ _ August ________________ _ Sept~mber ____________ _ Octolwr _______________ _ November ____________ _ December--------------
Monthly a\-era;c''-------
Jg3l January _______________ _ Fehruary _____________ _ l\{arch _________ --------~ Apr:L _________________ _ May ___________________ _ June __ ------- ______ ----
~u~~ii;,t;~:::~:: :::::: :::~1 September_------------Cctober ___ -------------Kowmr;er ____________ _ December--------------
Monthly average ______ _
JU;l2 Janunry _______________ _ February ______ --------1\.iarch ____________ -----ApriL ________________ _ May __________________ _ June __ ----- ___________ _ July ___________________ _ August ________ ---------Septeml)cr __ ----------Odoher __ -------------Novemher _ -----------December--------------
Monthly _avemp:e _____ _
1933 January----------------February ____ ----------March ________________ _ ApriL _________________ _ May __________________ _ June _______ -------_-_--July ___________________ _ August ____ ----- _______ _ September __ ----------October_---------------November ____________ _ December ________ ------
Monthly average ______ _
19.1 197 201 208 215 228 230 2:16 2!2 2:::2 2:H 2:37
221
~~~ l'i' 2tH 2G:)
25511
2f>2 2fi! 207 266 267 266 263 262 2(;4 2!l2 261 261
264
264 262 200 259 2fi7 256 252 248 248 249 248 245
254
350 3{i8 31'9 423 444 474 450 446 43>' 42:J 427 427
422
433 43f> 433 42'1 42~ 420 443 461 474 477 -1bf1 407
450
48S 4\ll 496 497 489 478 477 4.56 435 433 426 414
465
391 376 357 345 3~3 341 334 330 333 347 349 356
351
164 165 167
168 I 175 184 11'7 H)( 210 20tl
!86
210 216 220 226
::::?5 2tS 210 220 225 223
220
225 226 229 2'27 231 234 242 248 244 237 237 235
235
~~~ I 237 241 239 23t3 231 225 223 227 221) 226
232
202 210 216 221) 22--\ 2:l7 2l'i
2;)9 263
239
2flfl 273 2~4 2SG 294 209 308 309 309 :l20 ::32!) 3Z7
301
329 32~)
327 332 330 3:34 327 331 330 331 331 336
331
33;i 337 3!D 342 337 340 343 34:l 343 350 3!10 349
342
189 183 196 218 2clS 28/l 2~[1 2\JO 301 21iG 257 235
2!7
281 321 279 28S 30:l 323 2~1 2~2 2S(l
203
305 :321 320 319 29(j 295 ~04 254 255 245 25~)
253
282
21l9 2R4 285 2S5 27.5 280 270 282 300 304 :n2 2\!4
287
202 199 205 204 210 220 22i z:Js 239 2361 238 2M
223
276
2Rl I 2Gl 2(11 2(i2 2()1 2G8 270 274 270 27-! 2Gtl
207
258 2fl8 270 270 27-i '277 277 278 279 2~0 275 275
273
292 277 275 270 270 266 261 254 253 2,\0 250 24(1
264
[Monthly average 1923-25= 100]
141 147 141 145 !50 J;i8 161 1()4-
1.57 1fi;) 140 1-18 '
151
148 14\} 1!1 I 131 ' 14-l 1f>2 1.)(\ l;j5
J:l5 133 132 137
143
133 131 123 JO!I J0-!35 141 14~ !54 155 !59 157
!39
!59 !59 160 171] 1R3 183 179 IGS 162 lfiS 152 !50
166
139
~Ul :2.ill' EJ;J! 190 1!16 ~04
185
20\t
240
2!0 :!J6 ~-!4 24:l 2-l:l 235 236 22f) 22~ 226 228 ' 220 I 235 I
212 207 209 20-l 201 192 183 !51 145 134 125 114
174
I
185 180 178 175 177
JG2 1()2
172 Ji7 178 179
174
I Revi~ed series. Represents a general revision of the data on world stocks of foodstuffs and raw materials originally prepared by Dr. Robert F. Martin of the Division of Economic H.esearch and published in the Survey of Current Business. The re,-ision, which was made by Herman Lasken of the Division of Economic Eesearch. was occasioned by the recomputation of the seasonal adjustment factors. For each series (except tin, for which there is no measurable sea.sonal tendency) chnncing seasonal factors are now used. These adjustment factors are computed by the "ratio to moving average" method, the basic data used for any I year being that of the p•·ecedinr 5 years, in most instances. Certain exceptions were made where it was deen1ed advisable. At the same time these revisions w·ere being made, it was found conYenient to incorporate certain adjustments in the basic data, the most important of which was that made in the base for the su~ar series. This adjustment is mainly responsible for the considerable spread between the old and new indexes subsequent to 1930. Figures shown are for the end of the month.
The present index consists ofS ccn,modities with a total weight of30, distributed as follows: co1Iee, 2; cotton, 9; rubber, 3; silk, 2; sugar, u; tea, I; tin, I; and wheat, 6- The combined index is a simple weighted avernge of the indexes shown.
Except. for the series on sugar, the basic data used in the index are shown in the 1936 Supplement to the Survey and in subsequent monthly issues. However, certain adjustments have been necessary; also, estimates have been made in the months for which no data are available.
Sources of the data used, and a brief discussion of the adjustments and estimates made, are given below: Coffee.-Supplies reported by the Netr York Coffee and Sugar Exchange, Inc., for the linited States, Europe, Brazilian ports, afloat for the United States and Europe, and
interior stocks of Brazil. Became of irregularity in the reporting of the la,t-mentioned item, estimates have been made for this purt of the stock~ for November and December, 1933; all months of 1934except April, May, June, and December; all months of 19:36 except March, April, and June; aud 1937 to date.
Cotton.-World visible supplies of raw cotton as reported by the Commercial and Financial Chronicle. Stocks held at principal European ports, afloat to Euro!>l', at shipping ports of Egypt, India, and the United St,ltes, at United States interior towns, and United States exports on the day of the report. Cotton afloat to and at ports of the Orient, and at Lo' Angeles, are excluded.
Rubber.-Compiled by the U.S. Department of Commerce, Bureau of Poreign and Domestic Commerce. Consists of stocks of crude rubber in public warehouses, factories, in bands of dealers, at ports, etc.
Silk.-Reported by the Commodity Exchange, Inc. Includes visible stocks of raw silk in New York and Hoboken warehouses, Japan, and in transit. Sugar.-Eeported by lVillet and Gray in the Weekly Statistical Sugar Trade Journal, except as follows: Lamborn's TVorld Sugar Supplies: llolland, 1923 and 1924; and Poland,
August 1923. Die Deutsche Zuckerindustrie: Java previous to June 1930 except January aud February, 1926, and January and February, 1927- Estimated hy the Survey of Current Business: Germany, September !923and September 1924; Czechoslovakia, October 1923and October 1924; Poland, all months of !923except Angust and September, and March 1924; and Java, base, 1923-25, January and February 1926, and January and February 1927. The figures represent stocks in a varying number of countries as follows: !923-25, 9; 1926, 10; January 1927 through July 1928, 14; August 1928 through Jnne 1929, 14 (one added and one dropped); July 1929 through March 1931, 15; Apri11931 throuvh June 1933, 16; July 1933 to date, 17. Adjustments were made to keep the series comparable throughout. Seasonal indexes were computed sep)'lrately for Java, because of the opposite seasonal movement from that evidenced in countries in the Northern Hemisphere.
Tea.-Eeported in Accounts Relating to the Trade and Navigation of the t'nited Kingdom, except that figures for March 1929 through December 1932 are estimates based on returns supplied by the Tea Brokers' Association of London, whose members handle approximately 90 percent of the total tea imports of the linited Kingdom. Stocks are those in all United Kingdom bonded warehouses.
Tin.-Compiled by Commodity Erchanqe, Inc., and published by the American Metal :Market. Includes stocks in the United States, United Kingdom, Europe, and all known wpplies afloat.
Wheat.-Rep.,rted in Broomhall's Corn Trade News (American ed.). Visible supply of wheat and flour in second bands, and flour conYerted to terms of wheat; includes stocks in the United States, Canada, United Kingdom, Australia (after August 1925), Argentina, "ftoat lor Continent and afloat for orders.

May 1937 SURVEY OF CURRENT BUSINESS 19
TABLE 20.-MANUFACTURED GAS 1
I Customers I
1
.---,-----------,------, -c----1 -~-~. I
Sales to consumers Revenue fron1 sales to consumers
Year and month I 1
Indus- I Indus-
tic heating com- tic heating com- tic
IndusHouse trialand
heating comml'rcial
Total I Domes-~' House tl·ialand 'fotal Domes- House trial and Total
1
Domes-
) / mercia! nlQrcial ------ l------~----~1------~-----l------~----~------~-----
Thousands l\tiillions of cubic feet Thousands of dolhlrs
-i~-~r-) :-~-~~-il-:1·~--::-.~-~~-~-~-~:-:_:_: :-:-: --_ :-:-: :-:-::-:-::-:-:: ~---~:-~£-~--ci-;-1--~-: ~-~-~----·~-~--,---:-1-~ -~--~-8-: -~~-~~-~c--~-l-: ~-~-.g--;1--i-:-!-~~---;---~-: ~-.~-~ l---~-::-~-~;-;1' ~--~~-.:-~0-2~--;-1--1.-~-~-~ ..,.1---z-: ~-~-l 1931monthlyavera~:~~------------------- 9,782 II 9,273 50 453 29,89211 21,089 I 1,594 7,040 33,7441 2:i,m,sl 1,2831 6,343
hnuary _____________________ --------·---- 9,626 ·I 9,117 56 415 30,8lll 1 21,507 2,840 6,3!5 35,315 27,003 2,2021 5,960 l''ebnmry_________________________________ 9,608 9,126 57 417 29,409 II 19,967 2,\J03 6,32~ 33,54il 25,181 2,241 5,979 MarciL___________________________________ 9,579 9,097 56 418 30,924 , 21,114 :J,131J 6,41):; 35,tHG I 25,3931 2,40~ 6,101 ApriL_____________________________________ 9,~?,5 9,113 56 418 30,230.' I[ 21,2S'i 2,529 6,2:34 34,0!13 25,658 1,93<> I 5,921 MaY-------------------------------------- 9,o,,o 9, 081 55 4HJ ~s. !5~ I, 21, IJIJI) 1, 270 5, 71JG 32, 97•1 26,3H 1,018 5, 479 June-----------------··-------------------- 9, 523 U, 048 50 417 -G, u1•1 I' 20,575 45·1 5,·l2U 31,784
1
zr,, 101 383 I 5,177 July_______________________________________ 9,460 8,994 43 415 2·1,l!!J I 18.8]() 203 4,l">'l 29.17:l 24,120 I Wl ·~ 4,754 August____________________________________ 9,412 8,917 H 412 22,:195 1 17,354 15·1 4. Ti9 27,3:11 I 22,513 148 4,561 Scplcmbcr________________________________ 9,406 8,9!3 46 410 24,6G71 19.431 19! 4,881 29,788 24,8114 1~1 4,683
Nu~"e,~~c~~-b,'l:,;r,b.,-e.;r;:_~.:_:._:: ___ -:_:_:_:_:_:_:_:_:_:_:_: ___ --_--_--_-:_:_: ___ -: ___ -_:: ___ --_-, ~:m ~:~~~ ~3 :;;~ ;~:~~'!II z11~:.~~og1 1,n~ ~:m ~l~:~~~ I ~1:U~ I.~~~ I 1:g~~ ' 9, 261 8, 732 (;9 410 -2''~· :4;~~ II " vv I 2, 830 5. 086 31,937 24,420 2, 015 5,:550
Monthlyaver,;;(c• ___ 1 _9~1~-------------------- 9,47711 9,0U2 53 411 • ,, "'
11
20,0H 1,0S2 ~ 5,63·1 31,988 II 25,291 1,2181 •i.01G
JanuarY-----·----------------------·------ 0.1~G I 8,t>o3 ~~ 40G ~s·n~ li 19,870 2,98.\ 5,623 32,ons 1 :;1·~~~ 2,!JUO 5.2'3
~~~~r~~-r-~T---~~~-~~::~===~===:======-======== ~; iV~ ~:E~! 58 !~i~ 2~:4~~ I i~;~~~ ~:~l~ o5
5 •• '!.~,·.,,i,: ~g:~!~ II 2:3:531 ~;g~~ ~;~~!~
ApriL ______________________ -------------- n, 120 8,G49 .58 403 :.?ii,H~~l li 19,((i\J 2,232 d 30,0V5 I :;:~.0!7 1,617 5,002
t:~-~:::::::-:::::::::::::: ::::::::::::: ~:m .1 ~:r:~~ !~ !8~ ~~:m i'llH8~ 1
·~~~ I ~:m ~gJ~g 11 ~H~;, f~~ H~~ Augu<t ____ --· ··---------·--·---------- 9,172ll S,712 43 410 22.~V~ 11\,49·1 17G 5,5021 2G.HO [I 2l.2<:t 167 4,ti71
October__________________________________ 0.240, S, 755 67 409 2.5,,\!1 19,2G1 8\1~ 5,1\44 2~,122 1i 24,1!4 GO:i 4,o'i7 Scptewbur_ __ _____________ _____________ 9,220 )), 7fi0 48 409 21.1-1~ II 18,3:)5 243 5,427 2S.21iS 23,2·Li 217 4,(\~l:..
November_ ____________ .·-·-·---------·--- ,1',~!1\ ![ 8,722 77 409 2t1.!!53 18,4~11 2,:l98 5.874 29,80·1 [I' 2:l,O:JV 1,5\JO 5, 10·1 D(Wcrnbcr_ ________________________________ J,~14i 8,71-1 79 41:2 28.D21 lb,7:.U 3,525 6,07G ::10,821 2:;,212 2,2H3 5,2:2
Monthly average__________________________ 9,1G2 ~~~ 8,688 58 407 26.01ll I 18,593 1,670 5,632 29,556 I' 23,274 1,176 4,USO
19:14 1
JanuarY-------·-------------·------------- 9,2011
1
8,000 87 413 29,7071
19,2:ill 4.105 6,159 32,01.81 2o,7R5 2,7R9 5,302 February_________________________________ 9,230 I 8,721 ss 4lll 29,9G7
1
19,0JG 4,083 6,040 31,697 za,HJG: 2,~92 5,470 March____________________________________ 9,211 8,6P7 8;) 41G :30,356 19,308 3,8S6 G,973 31,946 2:1,4\iO' 2, 743 5,1i!J<i ApriL ____________________________________ 9,252 8,736 91 414 28,ti05 18.2:J5 3,218 6,981 30,485 22,8.i0 2.067 .1,421j May______________________________________ 9, 3:ll 8, 815 93 412 27,242 I 18, 3~5 1, 9:l6 r,, 772 30, OH2 z:J, 453 1, z5~o7 5, 271 June _____________________________________ 9,348 8,835 89 413 25,783 18,30:i 705 G,,l78 29,2tH 23,·!6f> _ 5,110 JGIY-----------------------------------·-- 9,:J:J2 8,842 85 414 22,Sf>li 1G,2W 372 6,081 2fi,349 2!.2110 2
2(1!144 4,756
An:;nsL __________ ----------------·--- __ 9,381 8,81i3 S7 415 22,2SO I 1.1,792 327 6,03.5 2.1,713 20,tl80 4,G\l4 September______________________________ 9,432 8,915 9:1 414 21,fJD7 18,272 437 6,043 2~,66G 23,34G :mn 4,824 Oetober______________ ___________________ 9,437 8,909 10•1 41.5 26,39~ I 18,790 1,15:3 6,275 29,843 23,7f>G 883 5,079 November________________________________ 9,405 8,8fl9 112 415 27,178 17,381J 3,227 G,:l84 29,807
1 22,578 1,881 5,221
December_________________________________ 9,3S5 8,843 115 418 29,026 17,4401 4,732 6,648 30,698 22,388 2,840 5,327
Monthly average ________________________ _
1935 January _______________ ------------· _____ .-February __ -------------------------------~
~~~w~-~::::: •::::::::::::::::::::::::::::: f~ff ~~:::::::::::::::::::::::::::::::::::I August_ ___ ----------------------------_--September __________ ------------------ __ _ October _____________________ ------- ______ _ November ___ ---·-----·-------------------December __________ . ----------------- ___ _
Monthly average ___ -----------------------
1936 January _______ ----------------------------February __ ------------------------- _____ _ March ___________________________________ _ ApriL ___________________________________ _ May, ____________________________________ _ June _____________________________________ _ July _____________________________________ _
August ______________ ---------------------September ______ -----------·-- ___ ---------October-----------------------------------November ___ --------------·---·-·--------December ______ --------·------------·-·---
Monthly average _____ ·----------·-·------
' See footnote to table 21.
9, 330 8, 812 94 414 27,026 18,042 2, 348 6, 46! 29,712 22, 84G I, 569 5, 174
9, 36611 \J, 378 9,389 9,415 9, 479 9, 492 9,491
~: ~~~ I 9, 572 9,535 9,545
9, 477
9, 503 9, 515 9, 514 9, 551 9, 634 9, 616 9, 641 9, 654 9, 730 9, 782 9, 737 9, 754
9, 634
R, 821 8,R36 8, 847 8. 869 8, 932 8, 951 8, 957 8, 969 9, ll:ll 9,025 8, 980 8, 985
8, 934
8, 896 8, 910 8, 907 8, 9'.10 9,023 9,012 9,041 9,056 9,121 9,142 9,103 9,110
9,022
120 1')')
1H 117 120 115 106 104 107 121 128 131
117
133 135 130 133 136 130 125 127 139 155 165 172
140
416 411 416 418 416 416 417 415 416 41() 418 420
416
464 460 450 467 464 464 464 463 462 453 460 462
463
31,oog 30, :JSO 28.657 28,558 27, 9G1 26, 6fJ9 23, 754 22, 59'! 25,377 27, 597 27,829 30,910
27,608
33,172 33,807 31,483 30,473 28,912 27,255 25, 163 23,743 25,753 28,863 30,824 33,853
29,442 I
18,022 17,671 17,317 17,090 17,520 18,198 16, 259 15,409 17, 722 18, ·108 16, 92G 16, 910
17, 288
17,975 18,190 17,423 17, 107 17,266 17,465 15,967 14,939 16.682 18, 156 16,335 16, 502
17,001
5, 694 5, 365 4,114 3, 749 2, 996 1, 258
543 382 543
l, 552 3, 189 5, 656
2, 920
6, 598 6, 977 5, 228 4,179 2, 775 1, 021
629 484 541
1,580 4, 965 7,458
3, 536
7, 081 7, 1C.O 7,0:18 7, 540 7, 280 7,072 6, 778 6, 074 6, 960 7, 454 7, 523 8, 121
7, 222
8, 374 8,418 8, 632 9, 000 8,699 8. 622 8, 390 8,183 8,378 8, 934 9, 323 9, 660
8, 718
31,969 31,084 29,916 29,668 30,093 29,491 26, 765 25, 667 28,500 30,022 29, (i33 31,226
29,503
32,683 32, 763 31,094 30,352 30,097 29,028 27,121 25,748 27,824 30,213 30,700 32,425
30,004 "
22,638 21,784 21,489 21,663 22,927 23,347 21,378 20, 411 22,859 23,360 22,150 21,992
22, 1G6
22,397 21,914 21,412 21,598 22,508 22,437 20,956 19,772 21,583 22,946 21,639 21,579
21,728
3, 686 3, 670 2,896 2, 392 I, 677
885 414 310 471
I, 138 1,831 3, 258
1,886
4,069 4, 564 3,478 2, 558 1,537
765 493 398 497
1,184 2, 683 4, 157
2,199
5,502 5,49fl 5, 394 5,170 5,3t12 5,157 4, 871\ 4, s:Js 5,0(\] 5,4\l(J 5, 522 5,835
5, 32G
6,071 6, 1~q 6,0()5 6,049 5,923 5, 721 5,569 5, 467 5,640 5,959 6, 236 6, 547
5,949

20 SURVEY OF CURRENT BUSINESS
TABLE 21.-NATURAL GAS 1
Year and month
1929 monthly average __ ----------------------------------- ______ I 1930 monthly average __ ------------------------------------- ____ 1
1931 monthly average_ ... --------------------------- ____________ :
1932 l January __ ..•.•. ______ . ______ .• ___ ... _. ____ ........ _ ... __________ [ l'ebruary _. -----------------------------------------------------March._ .. ___ . _____ •...••..... ________ . _____ . ___ . __________ •. _ .. :
tfit::::::::::::::::::::::::::::::::::::::::::::::::::::::::::! July----- .• __ -- .......• ____ .... _--._._ .•....... ___ ....... _______ _
~~J\;~~~!ler~~=:: :::::::::::::::::::::::::::::::::::::::::::::::::I October------------·-· __ -------------------------- _____________ _ N oven1ber ______ ---------- _________ ----------------- ___________ _ December _____ . ____________________ . ___________________________ _
\tlont!Jly average------------------ ________ ------------ _________ _
1933 January ________________________________________________________ _
February_ .. ----------------------------------------_ ..... _____ _
~:~~~~=:::::::::::::::::::::::::::::::::::::::::::::::::::::::::: ~t~iisi~:::::::::::=:::::::::::::::::::::::::::::::::::::::::::::l Zl"tt~t~r~~~::::::: :::::::::::::::::::::::::::::::::::::::::::::::I November ... ___ -------------------------------------------- ____ ; December ___ • __ ... ___ .. ___ .. _ ........ __________ ... --------_--_- .1
Monthly average ____________ • ____ ....... __ ...... _ .... ___________ i
1934 i January------ _______ -------- ______ --------- _____________ -------_ r
:[l~:c'tar:: ~ ~:: ~:: ~ ~ ~: ~:: :: ~ ~ ~ ~ ~ ~ ~=~ ~~ ~~~ ~ ~ ~ ~: ~:: ~~~ :~ ~= ~ ~::::::::! ~;~~~~~~:: ~:: ~: ~: ~: ~:: ~ ~ ~: ~~~==~ ~: ~ ~ ~ ~ ~~~ ~ ~ ~ ~ ~: :: ~ ~ ~ ~~: ~::~::::~I June .. _________ ._._. ________ .. _._._._ ... ___ . ___ ..... -.-_-.-.----' July .. _. _______ ._----------------------------------- ____________ I
~~~t~~~~ ~:::::::::: :::::::::::::::::::: =: :::::: =:::::: :::::::: i November ______________ ---------- _______ ----------- ____________ : December _____ ------ _____ ---------_---------------- ___ -.------- -1 Monthly average ____________ .. __ .. _. ___ --------- .. _____________ _
1935
~ae't~~'?ry ~::::::::::::::::::::::::: :::::::::::::::::::::::::::::I ~;;iy~-~:::::::::-:::::::::::::: ::::::::::::::::::::::::::::::::: i May-------_--- ___ . ____ .------------------------------- __ -------1 June·-----------------------------------------------------------1 July---------------------------------------------------------- ---1 August. ___________________ ----------------------------------- ---1
ITfyJg;;~~~~ ~ ~~~ ~ ~ ~ ~ ~~ ~~: ~ ~ ~: ~ ~~ ~~ ~ ~ ~ ~=:: ~ ~ ~ ~ ~ ~ ~: ~ = ~: ~ ~ ~ ~ ~ ~ J
;~,~~"c"'~··········· •'t•••····· •••••••• •••••••••••••• ' ~r:~~_-::::: ~ ~: ~:::::: ~ =~ ~:: ~~ ~: ~ ~:::: ~: ~ ~::: ~:: ::: ~:::: =~:::: ~:: ~ 1
June _____________________ ------------ ___________________________ ~
July ____ --------------------------------------------------------:
~\~r~~~r:::=:::::::::::==:::=:::::::::::::::::::::::::::::::::: ~~~:r~;ee:_-_~::::::::::::::::::::::::::=:::::::::::::::::::::::::1 :\fonthly average _____ .. _ .. ___________________ ....... ___________ _
I
Customers
Total I Domes-1 tic
I! Thousands
5, 655 6. 073 6,1-13
6, 202 6, 185 6,179 6,140 6, 0~)9 6, 0.54 5, 975 5, 970
~· 00~ o, 05.) 6, G99 6, 057
6, 085 I~
5, 970 II 5. 971 1i 5, 973 1' 5, 937 ';
5, 92511 5,889 l 5,856 I 5, 874 :: 5, 934 ~' 6, 006 l
6. 083!' I 6,109
5, 961 il !'
6, 081 II 6, 116
6, 13-1 II
6.121 6, 133
6.118 I 6,089 6,112 6.1fi2 6, 227 i fl, 292 ,, 6, 321 !I
6, !59 1! II
6. 301 1~~ ~:~~g II 6. 338 I'
G, ~57 o,:H7 :
g~~ 1'1 6, 395 6,468 6, 546 II
6, 568 II
:: ~:: I· I 6, 529 i o. 5112
1
1
o. 5~,o I
~: ~~~ I i 6• ·~~~: ii r, ,)o,) ·1
{\(;'()'I
fi:6no I
6, 78~ 6, 805
6, 604
5, 317 5, 707 5, 705
5, 742 5, 724 5, 716 5, 687 5, 661 5, 629 5, 561 5, 562 5, 590 5, 619 .5, 644 5, 604
5,645;
5, 52! 5, 52() 5, 524 5,497 5, 499 5, 486 5, 455 5, 475 5. 533 5. 588 5, 633 5, 650
5, 5:32
5,6:31 5,664 5, 676 5,670 5, 695 5,696 5,676 5, 700 5, 744 5, 792 5, 830 5, 844
5, 718
5, 826 5, 846 5, 871 5, S08 5, 894 5, 901 5,895 .1, 919 5, 91)4 6,011 6, 008 6, 070
5, 927
6, 017 6, 0:37 6, 066 6,007 6, OS5 f>, 087 6, 093 6, 120 6, lf>2 fi, 208 6, 2f>8 6, 2S2
6,124
Industrialand
COillmercial
337 365 436
458 459 461 451 436 4::!3 412 406 411 431 453
::: I 445 414 447 438 425 402 399 397 399 416 448 457
426
449 450 45G 449 436 420 412 410 416 433 4ti0 475
439
472 472 476 4ti8 461 445 434 426 430 455 48fl 49!3
460
492 491 494 487 474 449 442 4H 446 4SO 514 521
478
Sales to consunters
Total Domestic
Industrial and
commercial
J\lillions of cubic feet
82,2871 82,210 75,401 I
91.70611 88, 4fl7 II S4. 978 , , :-~, ?8~ ! I 6,, o!. II .57, 067 I 49,010 49,176 52. 249 58,M6 72. 767 so, 473 I 69,223 II
II 88,23711 87,636 I ill, 38811 72, }7} 1
64, 6\16 I 58.510 II 56.620 57.479 !
59.799 I 67, 102 so. 333 87,206 II
,I
71,598 I I
9~, 9591 91,489 li
~~: 8~~ i 74,625 68, f>90 63, 728 64, 603 67,911 73,M2 8.5, 716 99,04.5
81,078
105,.121 104,4.19
\)(), 922 ss. gr,o 82,272 73, 567 fl7. 835 71,020 74,841 Bl, 502 99, 0-D
112, G33
88,465
122,954 13'>, 296 113, 121 105, 534
92,001 84,385 R2, 166 84,735 87,869 95, 107
112, 410 125,409
103, 416
27,695 28,742 28, 130
41, 515 40, 562 38,402 33,066 23,886 17,.102 13,881 12,864 13.913 18,201 26,554 37, 291
26,470
41.485 38,481 34,913 28,995 23, 226 16, 743 13.085 12,252 13,828 17,040 25, 188 32, 117
24,782
38,307 38,127 37,797 30, 135 21,993 16, 64.1 13,220 12,379 14, 271 17,636 24,847 35,092
25,037
40,679 40,136 31\,658 29, R38 25,712 19,988 14,711 13,080 14, 77.5 19,380 27,919 37,929
20,651
45, 648 52,327 40, 764 33, 266 2!, 720 17,592 14, 348 13,256 13,980 19,105 30,403 40,988
28,866
53,618 52, 602 46,464
49, 345 47,184 4.1, 521 42,591 39,109 39,067 34, 632 3,1, 780 37, 953 39,489 45,172 48,077
41,993
45,970 48,432 43,824 42,519 40,727 41, 195 32, 976 44,574 45, 119 49,407 54. 392 53, 966
46,092
55, 798 58.314 57, (\16 54, 9til 51,641 51,213 49,,\60 51, 256 52, A82 55, 227 59, 996 62,957
55, 101
63,803 63,190 60,147 58, 165 55, 529 52,415 52, 278 57,022 59,181 63, 944 69, 874 73,340
60,741
76, 259 81.582 70,967 70,760 65, 93.5 6:., 805 67,007 70,271 72,637 74, D56 so, 938 R3, 016
73, 344
May 1937
Revenue from sales to consumers
Total Domestic
Industrial and
commercial
Thousands of dollars
31, o6s I 31.877 I 30,241
!H~~ Ill 26, 3:)8
21,6881 1s. 464 I li, 989 19, 109 I 22.367 1
2~. 612 •
1 35, 5021'
28,284 I i[
38 o-1 il ~~: ~t~ li II 29,153 25, 362 21,472 '
19,1851 18,792 19,904 23,074 28, 532
33. 107 I 27,235
38,052 37,570 37, 192 31,824 26,285 22,845 20, 161 19,748 21,228 23, 705 29,072 36,366
28,671
40,887 39, 955 36,896 32,941 29,546 25, 405 21,973 21,638 23,055 26,898 33,426 40,440
31,088
I
46,183 50,124 41,395 36,982 30,481 25,840 23,857 23,722 24,667 1
28,64511
~~: ~~~ Ill 34,387
I 18,372 1
19,548 I 19, 567 I
2~. 9461
~5: ~6~ i 22, 586 17,542 13, 669 11, 372 10, 787 11,417 13, 8iJ4 18,601 24,320
18, 766
27, 231 ~5. 503 2:3,U2 19, 770 16,777 13,194 10,875 ](), 306 11,318 13,426 17,641 21, 582
17,564
25, 713 24,827 24,447 20, 271 15, 905 12, 930 10,926 10,378 11, 559 13, 394 17,423 23, 161
17,578
26,922 25,982 23, 675 20,472 18,097 14,939 11, 893 10,9.53 11,960 14, 536 19,441 25, 108
18, 665
29,714 32,482 26,258 22,342 17,462 13, 501 11,597 10,992 11, 4;)6 14, 330
20.501 I 2fJ, 328
19,747 I
12, 497 12.145 10, 563
11, gr,3 11, 651 11, :;&; 10,153 8, 700 7, 941 7,023 7,128 7, 621 8, 341 9, 857
11,018
9, 397
10,895 lJ, 03~ 10, O:l6 9, 260 8, 463 8,179 8, 216 8, 383 8, 461 9, 548
10,764 11,344
0, 5·18
12,167 12, f,50 12, 543 11, 3S2 10,214 9, 777 9, 074 Q 2''0 9: 5i7
10,180 11, 506 13,035
10,930
13, 808 13,779 13,026 12, 305 11,281 10,305
9, 936 10, 545 10,954 12, 191 13, 793 15,122
12, 254
lG, 299 17,402 14,918 14,417 12, 833 12,210 12, 132 12, 570 13, 047 14,172 Hi, lfl;) 17, 3&9
14,463
t Compiled by the American Gas Association. These data, representing practically complete coverage of the industries, supersede those shown in all previous issues of the SURVEY. The revisions resulted from the reclassification of gas companies according to the kind of gas they were distributing at the beginning of 1936. F'or example, data for former distributors of manufactured gas who changed to the distribution of natural gas have been excluded from the manufactured-gas figures for all years and have been included with those for natural gas. N oto that when the monthly re\'isions for 1U35 and earlier years were gi,·en (see the June and August 1936 issues, pp. 20 and 14, respectively, also pp. 86 and 87 of the 1936 Supplement), data prior to 193.1 covered companies classified according to the kind of gas they were distributing at the beginning of 1934, and not at the beginning of the latest year shown, which is the method followed in compiling the above figures_ Data for companies selling mixed manufactured and natural gas are included with those for manufactured gas. Figures for natural gas do not include natural gas used in field operations and in the manufacture of carbon black. or vas used by distributing companies in the conduct of their g-as operations. Natural gas nsed for house heating is included with that used for domestic purposes. For 1937 figures, co\'ering data for companies classified according to the kind of gas they were distributing at tbe beginning of 1937, seep. 41 of this issue of the SrRVEY.
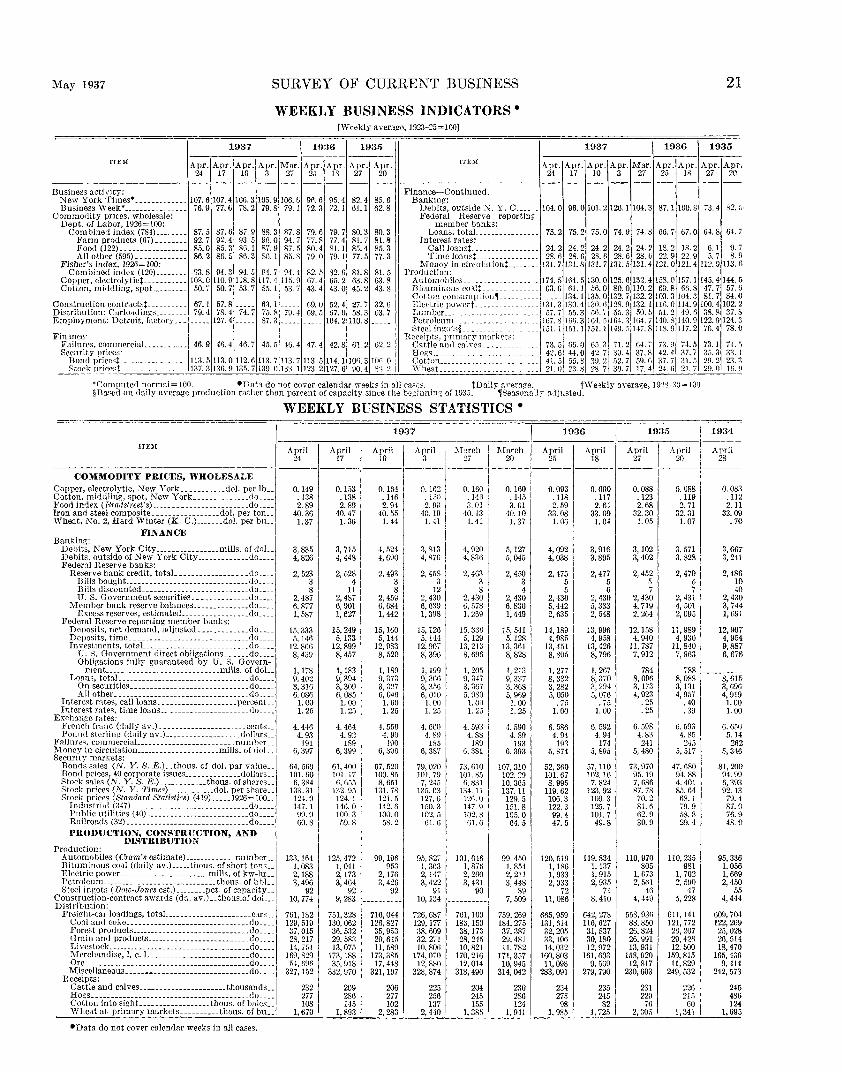
May 1937 SURVEY OF CURRENT BUSINESS 21
WEEKLY BUSINESS INDICATORS • [Weekly average, 1923-~5=100)
1937 1936 193.') 1937 1936 1935
ITEM Apr. Apr. Apr. Apr. Mar. Apr. Apr. Apr. Apr. ITE)f Apr. Apr. Apr. Apr. Mar. Apr. Apr. Apr. Apr. u u 10 3 ~ ~ lli ~ w 24 17 10 3 27 25 18 27 20
-----------1----------------11------·------1·-- ------------Business activity: Finance-Continued.
:New York rrimes*------------- 107.6 107.4 106.3 105.9 106. 6 9f>. 6 95.4 82.4 85.6 Banking: Business \Veek* ________________ 76.9 77.6 78.2 79.8 79.1 72.3 72.1 61.1 62.8 Debits, outside~. Y. C. ____ 104.0 96.0101.2126.1104.3 87.1100.8 73.4 S2.J
Commodity prices, wholesale: Federal Reserve reportinf!" Dept. of Labor, 1926= 100: nwm bcr banks:
Combined index (784) .... ____ 87.5 87.6 87.9 88.3 87.8 79.6 79.7 so. 3 80.3 Loans,totaL ______________ 75.2 75.2 75.0 74.9 74.8 06.7 67.0 64.8 64.7 Farm products (67) ________ 92.7 92.4 9~t 5 96.0 94.7 77.8 77.4 81.7 81.8 Interest rates' Food (122). ________________ 85.0 85.3 SG. 1 87.9 All other (595) _____________ 86.2 86.5 SG. 3 813.1
87.5 80.4 81. 1 85.8 79.0 79.1
85.4 77.5
8.5. 3 77.3
Ca!lloanst----------------- 24.2 24.2 24.2 2,1.2 24.2 18.2 1R.2 6.1 9.7 Timeloanst.--------------- 2S.6 28.6 2S.fo 28.6 28.6 22.9 22.9 5.7 8.9
Fisher's index, 1926= 100: l\f oney in circnlationt ..... ___ 131. 7 131. 8 131. 7 131. 5 131. 4 121.0 121. 4 112. 9 113. 6 Combined index (120) ....•. __ 93.8 94.3 94.5 94.7 94.4 82.5 82.6 81.8 81.5 Production:
Copper, clectrolytict----------- 10R.O llO 9 118.8 117.4 11.1. 9 67.4 65.2 63.8 63.8 Automobiles .. __ ----------- _ 174.5164.5130.0125.6132.4158.01.17.1145.4144.5 Cotton, middling, spot. ........ 50.7 50.7 53.7 55. 1 53.7 43.4 43.0 45.2 43.8 llit.uminouscoll!----- ________ 63.0 61.1 50.0 80.0110.2 69.8 6G.S 47.7 57.6
Cott.on consmHpii,m1----------1----- 134.1 135.0 132.7 132.2103.3 104.3 81.7 84.0 Constructioncontractst---------- 67.1 57.8 ..... 63.1 ..... 69.0 52.4 27.7 32.G Distribution: CarlorrdinRS .... _ __ _ 79.4 78. 4 74. 7 75. 8 79. 4 69 .• 1 67. 0 58. 3 63. 7 ~;;~\~~~-l:O'":r~::::::::::::::::I'~U 1~~:~ 1~g:~ 1~~:~ 1~~:~ 'f,~:g ~~~:~ '~J:~ 1~~:~ Employment: Detroit, factory __ . _____ 127.4 _____ 87. 3 _____ ---· _ 104.2 110.8 ____ _
Finance· Failure,, commerciaL ......... 46.9 4~. 4 46.7 45.5 -16.4 47.4 42.8 61. 2 62. 2
1
Scenrity prices·
Petroleum ------------ _______ ,
1
107.8156 31G4 5164 31Gl.7140 8140 P 122.9124.3 8tcelin~ots§ _________________ 1511151.1151.1149.r.li7.S1189117.2 76.4 78.0
Il ·reir>ts, l'fllll.:l.ry markr>ts CattleandralY"S------ _ 73.5 66.0 65 ~ 71.2 64 7 73.0 7-1.5 73.1 7l.j Hoes _______ ------------ __ 42.6 44.0 42 7 30 4 37.8 42.4 37.7 35.3 33.1
Bonrl price't----------------- 113.5 113.0 112.6 113.7 113.7 ll3. 5 114.1 100.3 JOR. 0 2trwk pricest----------------- 137.3 136.9 135.7 13\l. 0 133. I 123.2 127.6 00.4 S•i. ~
Cotton ___________________ ---141.5 r.s.s :10.2 f>2.7 59.6 37.71 :n.s 2D.2 23.:l Wheat_ ___________________ ... 21.0 28~ 28.7 30.7 17.4 24.6 :ll. 7 20.0 Hi.!l
*Con1puted normal= 100. •Data do not cover calendar weeks in All rn~::s. tDaily f\verave. t\Ve~kly ayerage, 19'2~-30= l(rrJ. §llased on d3.ily average production rather than per('ent of capacity since the beginning of 1935. ,Seasonally adjusted.
WEEKLY BUSINESS STATISTICS •
1937 1936 19::15 1934
ITE1I April I April April I April ' :\fcrch i J\Iarch April I April April I April April
u u 10 a I ~ 1 m ~ lli ~ w 28
Copp~r~:=r~l~:i~,y~::~~~:·.~~-~-~~~:o~1~~r lb.. -::-=-= ~~~~~--=--= 0.0~8 ~-- 0. 088 0. OS? Cotton, middling, spot, New York ______________ do.... .138 .138 .146 .. .5cl 1 .J,j,, 1 .14a .118 .117 . L3 .119 .ll~ Food index (Bradslreet's) ________________________ do.... 2.89 2.89 2.94 2.991 3.01 1 3.01 2.59 2.64 2.68 2.71 2.11 Iron anct steel composite _________________ dol. per ton__ 40.36 40.47 40.55 40.19 40.13 40.10 33.08 33.09 32.30 32.31 33.09 Wheat, No.2, Hard Winter (K. C.) ....... dol. per btL 1.37 1. 36 1. 44 1. 41 , I. 41 1. 37 1. or; 1. 04 1. 05 1. 07 • 70
~D~ i Banking: I
Debits, New York City ________________ mills. of doL 3,835 3, 715 4, 524 3, 8131 f.:J~;~\ ~J;!~~eo~~~~:York City _____________ do.... 4,826 4,448 4,690 4,876,
Reserve bank credit, totaL-------------- __ .do.... 2, 523 2, 528 2, 493 2, 458 I Bills boughL _____________________________ do.... 3 4 3 3 1'
Bills disconntcd ___________________________ do.... 8 11 8 12 U.S. Govermnentsecnrities .............. do.... 2,487 2,487 2,459 2 430
Member bank reserve ba!ances .............. do.... 6, 877 6, 901 6. 684 6; 639 Excess reserves, estimated _________________ do.... 1, 587 1, 627 1, 442 1, 398
Federal Reserve reporting member banks: j Deposits, net demand, adjusted ............. do.... 15,333 15,249 15,160 15,126 Deposits, time ______________________________ do.... n,146 5,133 5,144 5.14-l I Investments, totaL .. ______ ----- ____________ do____ 12, Sf>6 12,899 12, 983 12; 907
U. S. Government direct obligations. _____ do.... 8, 439 8, 457 8, 520 8. 396 Obligations fully guaranteed by U. 8. Govern·
ment__ ___________________________ mills. of doL 1,178 1,183 1,189 1,199 Loans, totaL ________________________________ do____ 9. 402 9, 394 9, 373 9, 3f.6
On securitics ______________________________ rlo.... 3, 316 3, 309 3, 327 3, 35G All other. ...... ---------.-------- _______ .. do __ .. 6. 086 6, 085 6, 046 6, 010
Interest rates, callloans ____________________ percent._ 1.00 1.00 1.00 1.00 Interest rates, time loans __ ~ ___________________ .do.___ 1. 25 1. 2.5 1. 25 1. 25
Excham!c rntes: Frenc'h franc (dai1y av.) ______________________ cents __ Ponn<l sterling (daily av.) ___________________ dollars __
Failure~. corumerciaL ________________________ numher __
4.446 4. 93
4. 464 4.9:l
4. 600 li 4. 89
4. 556 4. 90
l\foney in circulation _____________________ mills. of dol __ Security markets:
Bonds sales (N. Y. S. E.) .• thous. of dol. par value __ Bon<l prices, 40 corporate issues ______________ dollars __ Stock sales (N.Y. S. E.) ____________ thous. of shares .. Stock prices (N. Y. 1'ime.•). __________ dol. per share __ Stock prices (Standard Statistics) (419) ..... 1926~ 100 ..
I ndnstrial (:J47) ___ .. __ .. ___ . ___ ... __ .. _____ .. do. __ _ Public utilities (40). _________________________ do ... . Railroads (32) _------------------------------do ... . PRODUCTION, CONSTRUCTION, AND
DISTRIBUTION Production:
191 6, 397
64. 560 101.60
fi. 384 133.31 124. g 147.1 99.9 6o. 8 I
I
189 6, 399
61.400 101.17 6, 5;15
132.95 124. 1 146.0 100.3 59.8 '
1(10 6, 395
67,520 100.85 8. 651
131.78 121.5 142.6 100.0 58.2
1S5 6, 387
79,020 101. 79
7, 24.1 135. 03 127.6 150.3
102.51 Gl. 6
'
4, 920 4, 836
2,463 3 8
2, 430 6, 578 I. 259
15, 33() 5.129
13,213 8,696
1, 205 9. 347 3, 3ti7 5, 980 1.00 l. 23
4. 593 4. 88
189 G, 381
73,610 101.85 ~. 831
134. 11 12il. 0 147. g 102.8 ()1.0
5, 127 5, 045
2, 450 3 4
2, 430 6, 830 1,449
1.0, 541 5,128
13,361 8,828
1, 213 9. 337 3, 368 5, 969
1.00 1. 25
4. 590 4. 89 193
6. 393
107,310 103.29 10. 36.j 137. 11 12\). 5 151.8 105.0 64.5
4, 092 4, 038
2, 475 5 5
2,430 5,442 2, 635
14,1891 4, 985
13,451 8, 805
1, 277 8, 332 3, 282
5, ?~~ 1.00
6. 586 4. 94 193
5, 874
52,360 101.67 8. 99,)
119. 62 106.3 122.3 99.4 47.5
3, 916 3, 895
2,477 5 6
2, 430 5, 333 2, 548
13,996 4, 958
13,426 8, 796
1,267 8,370 3, 29± 5, 076
. 75 1.00
6. 592 4. 94 174
5, 8951
57, 110 102.16
7. 824 123. 92 109.3 125. 7 101. 7 49.8
Automobiles ( Cram'.• estimate) ............. nnmber.. 133, 1fi4 125, 472 09, 196 95, 827 101. 0~16 99,450 120, 519 119, 834 Bituminous coal (daily av .) ..... thous. of short tons__ 1. 083 1, 041 953 1, 353 1, 87G 1, 854 1, 186 1, 137 Electricpower. _____________________ mills.ofkw-hr.. 2,188 2,173 2,176 2,147 2,200 2,211 1,933 1,915 I'etrolcum _____________________________ thous. of bhL 3, 496 3, 464 3, 426 3,122 3, 431 3, 448 2, 933 2, 935 Steel ingots (Dow-Jones est.) ________ pct. of capacity__ 92 92 92 91 90 89 72 71
~~~tsr\'b~{lg~:contract awards (da. av.) .. thous.of doL. 10, 774 9, 283 10.134 7, 509 11,086 8, 410 I
3,102 3,402
2,452 .5 7
2, 430 4, 719 2, 264
12, 158 4, 940
11, 787 7, 912
784 8,096 3, 173 4, 923
. 25
. 25 i 6. 598 4.83
241 5, 480
73,970 95.19 7, 686 87.78
70.2 81.6 62.9 30.9
110, 970 805
1, 673 2, 561
46 4, 449
Freight-car loadings, totaL ____________________ cars.. 761, 182 7.11, 328 716,0-14 726,687 701, 109 759,269 665,959 642,278 ' 558, 93fl Coal and coke _______________________________ do.... 129,,5\9 130,062 126,827 129, 177 183.150 184,275 131, ~14 116,627 88,850 Forest products ____________ ------------------do.... 37.015 36. 532 35, 9,53 38, 609 38, 173 37, 387 32, 205 31, 537 26, 824 Grain and products _________________________ .do____ 28,217 29,583 29,645 32, 271 28, 245 2\l, 481 33, 106 30, 180 26,991 LiYestock ____________________________________ do.... 14,754 13,075 ll, 589 10,806 10,821 11,782 11,032 12,972 13 931 Merchandise, I. c. L ________________________ do____ 169,829 173, 188 173,385 174,070 170,216 171,357 1130,803 161,603 158; 920 Ore __________________________________________ do.... 5·1, GU6 35,918 17,448 12, SSO 12,014 10,945 11,098 9, 569 12,817 Miscellaneous _______________________________ do.... 327,152 332,970 321, 197 328,874 318,490 314,042 283,091 279,790 230,603
Receipts:
3, 571 3. 828
2, 470 5 7
2, 431 ·l, 501 2, 095
11,989 4, 930
11, 840 7, 963
788 8,088 3,131 4, 957
.40
. 39
6. 593 4. 85
245 5,517
47,680 94.88 4, 401 85.64 68.1 7D. 9 58.8 29.4
110,235 981
1, 702 2,590
47 5, 228
6ll,H1 121,772 26, 267 29,4211 12.500
159,815 11,829
249,532
Cattle and calves ______________________ thousands.. 232 209 206 225 204 2.'l0 234 235 231 226 Hogs ..... -----------------------------------do.... 277 286 277 256 245 286 275 245 22\1 21.1 Cotton into sight. _________________ tbous. of bales.. 108 145 102 137 155 124 08 82 76 60
---'~'~'h~e~.a~t~a~t~p~r~im~ar~y~lll~a~rk_·e~t~s~--~-~-~--~-~--~-~t~ho~u=s~·~o~f~b~u~--~--1~·~6~70~--1~,=8~93~--=2~,=28~3~--~2~,4=4~0~--~1~,3~8=5 ____ ~1,~9~41~--~1~,9=8=5 ____ ~1,~7=2~5~~2~·=3=05~--~1,341
•Data do not cover calendar weeks in all cases.
3,667 3, 241
2, 486 10 40
2, 430 3, 744 1,691
12,907 4, 954 9,887 6, 678
8,615 3,696 4,919 1.00 1.00
6. 650 5.14
2fi2 ·'· 3·16
8l,WO 94.99 6, 393 92.13
79.4 87.9 76.9 48.9
95,336 1, 056 1, 6fi9 2,450
55 4, 444
609, 70<1 122,269 25,028 26,514 18,470
16.1, 436 9, 414
242,573
245 486 124
1,695

22 SURVEY OF CURRENT BUSINESS May 1937
Monthly Business Statistics The following table represents a continuation of the statistical series published in the 1936 Supplement to
the Survey of Current Business. That volume contains monthly data for the years 1932 to 1935, inclusive, and monthly averages for earlier years back to 1913 insofar as available; it also provides information as to the sources of the data and sufficient descriptive material for a proper interpretation of each series. These notes also indicate the source from which monthly figures prior to 1932 may be obtained. It is essential that all users of the SuRVEY have this base book which may be secured from the Superintendent of Documents, Government Printing Office, Washington, D. C., for 35 cents per copy.
A few series have been added or revised since the 1936 Supplement went to press. These are indicated by an asterisk (*) for the added series and by a dagger (t) for the revised series. A brief footnote accompanying each of these series provides a reference to the source where the descriptive note may be found.
The terms "unadjusted" and "adjusted" used to designate index numbers refer to the adjustment for seasonal variation. Data subsequent to March will be found in the Weekly Supplement to the SuRVEY.
Monthly statistics through December 1935, to· gether with explanatory notes and references to the source of the data may be found in the 1936 Supplement to the Survey.
UUSINESS ACTIVITY (Annalist)
Combined index ..... computed normal=lOO .. Automobile production ............... do .... Boot and shoe productiont ............ do .... Car loadings, freight. .................. do .... Cement production ................... do ..... Cotton consumption .................. do .... Electri~ power production ............. do .....
1
Lead productwn ....................... do ..... Lumber production .................... do .... Pig iron production ................... do .... R>tyon consumption .................. do .... Silk consumption ..................... do ..... Steel ingot production ................ do .... Wool consumption .................... do ..... Zinc production ...................... do ....
INDUSTRIAL PRODUCTION (Federal Reserve)
1936
June II July ~~ Au"ust i' Septern-11 October I Novem·l Decem· o her ber ber
' I
1937 I March March I April \ May I
BUSINESS INDEXES
97.61
I 10<1. 9 89.5 94.1 95. g 102. 41 105. 1 109.9 117.6 112.6
112.51 118.9
--------- 119.9 114.8 115. 0 108.1 129.2 100.2 87.4 91.0 93. 1 92.3 95.1
--------- 52.8 63.3 I
66.21 62.9 tl4. 2 145. & 107.6 112.4 105.4 118.8 I 141.5 lOll. (l 96.2 98.3 1~g: g I 09.71 102.1 88.8 71.5 79.7 84.7 87.3 Sl. 1 77.6 75.3 82.8 ~i: ~ I
84.6 110.9 68.0 80.8 85.7 95.5 112.0 96.3 105.3 10·!. 5 129.8 145.4 7l. 4 rs. s 70.2 68.6 70.3 77.2
tM3 70.2 95.6 91.3 97.0 100.3 107.2 86.2 89.3 108.4 112.9
92.3 74 0 g[. 7 84.3 88.0 89.8
961 104 105 104
105 I 9' !05 i~~ I 105 105 124 149 13·1 !23
42 70 88 93 91 SG 85 82 87 90
JD4 2:)5 231 196 JUS 94 ]11 \14 113 111
l12 1[[: 104 99 113 168 178 1/\) 181 182 85 Jl3 121 130 124
... ;ia2·1-----~o3- ------------------107 100 101
___ JH ... J~-H71 161 167 !OJ 101 102
77 62 57 G7 66 72
120 157 164 60 I 69 73 70 68
145 150 150 149 147 99 97 ss 101 85 90 fl5 95 99 97 93 101 101 101 108 93 100 iOl 105 109
107 122 1 ·-" us 124 58 72 74 75 75 87 90 84 88 92
JS4 213 220 218 220 83 !IJO 105 113 119
108 112 113 103 114 168 178 180 181 11)3 85 113 121 130 124
100 107 116 H5 Jo17 154 102 100 101 77 72 69 76 74 79 80 80 81 75 69 71
149 146 144 91 103 101 94 103 104
102.5 107.3 128.1 9:3.0 71.8
133.3 104.9 71.3
1~8: g I 126.7 83.2
108.9 112. 1 83.4
!OfJ 106 82
100 87
226 118
)~~ I 119
----ii:i'l 1581 104
~i I 177 58
152 88 93
lOS 110 111 77 91
226 121 11.5 186 119
120 147 99 51 76 87 60
149 88
100
102.9 91.7
132. 5 94.7
69.91 137.2 104.9 70.9 ' 87.7
107.5 100.3 87.2
108. Q 112. 1 81.1
103.3 96.3
148.4 97.2 75.7
12·!. 3 104. 1 78.3 86.6
114. 1 107.3 79.2
112.4 98.2 84.2
107.1 1 100.6 138.1 102.8 82.3
129.2 104.7 86.1 74.5
117.2 121.9 82.8
121.6 127.2 •84. 0
1937
Janu- I Febru-ary ary
104.81 103. 1
• 154.6 95.1 80. 1
133.9 !07. 0
8.1. 0 G8. 0
119.8 106.1 78. 5
109.9 111.8 71. 6
, 105. 7 • 116.8
142. 0 103. 1
r 75, 1 139.6 105.9 81. 4 71.0
, ]1.). 3 93. 7 76.0
li\2. 5 1!0. 0
r 73. 3
• Preliminary. • Revised. t Data revised for 1936. For revisions of the Annalist index, boot and shoe production, Federal Reserve indexes, leather and leather products, unadjusted and adjusted
combined index of minerals, unadjusted and adjusted, anthracite, unadjusted and adjusted, see p. 22 of the March 1935 issue.

May 1937 SURVEY OF CURRENT BUSINESS 23 Monthly statistics through December 1935, to
gether with explanatory notes and references to the source of the data may be found in the 1936 Supplement to the Survey.
MARKETINGS Agricultural products, combined Index
(quantity)-------.------ ..... 1923-25= 100 .. Animal products ..••.•.....•.....•.... do ....
Dairy products .•••.•.••.••. _____ •••• do .••. Livestock •.................•.•.••.•• do .•.. Poultry and eggs .•.........•.•...... do ... . WooL ••..•.•...••..•••.............. do ... .
Crops •... _ •....••.•••.•... _._ ......... do .. _. Cotton ..•.•..•..•..•.•....•..•...... do ..•• Fruits •...• __ ._ .......•. __ ..•.•.... __ do __ •• Grains •.... -------_------- .......... do ... . Vegetables .. _._._ ... ___ . _____ ....... do .•..
Agricultural products, cash income from farm marketings:
Crops and livestock, combined index: Unadjusted .•.... _ •...• _. __ .. 1924-29= 100 .. Adjusted •... _ .. ___ ._ ..... _ •••.. _._ .. do._ .• Crops, adjusted ...... __ • __ •. _. ___ ... do .•.• Livestock and products, adjusted .... do ...•
Dairy products, adjusted .......... do ...• Meat animals, adjusted ........•.. do .... Poultry and eggs, adjusted ...•••.• do .•..
COMMODITY STOCKS Domestic stocks, combined index (quantity)
1937
March
66 79 87 69
106 58 54 58 74 29 89
70.5 81.5 74.5 88.5 90.5 89.5 85. 5
1923-25=100.. 109 Manufactured goods .................. do.... 10~
Chemicals and allied products .... do.... 155 Food products ...................... do.... 103 Forest products ..................... do.... Ill Paper, newsprint_ __________________ do____ 73 Rubber products .................... do.... 120
Raw materials ........................ do.... 120 Chemicals and allied products .... do.... 77 Foodstutis .• ---------- .............. do.... 83 Metals ... ____ ......... __________ . __ .do .... l ~5 Textile m~terials .................... do.... 174
World stocks of foodstuffs and raw materials combined iwlex (quantity)t .. l923-25=100 .. --------·
Co!Tee .. ~djustedt ______________________ do .... l 405 Oot.ton, "djnstert t .................... do..... 163 Ruhher, adjuster! t .................... do .... l 244 Silk. adjusted t ________________________ do .... l 189 Su~nr, adjuster! t. ..................... do .... _______ __ Te•1, adjnsted L-----------·--- ........ do .••. __ ...... . 'l'iu, unadju~ted t-~-------------------do____ 97 'Vhe:tt, adjnstNl t __ ------------- ______ <io ____ ! ________ _
I COST OF,lUVING I
' u-:atio·~al Ind~strial Conference Bo"ar~ I C omhmed tndexes .................. 19.3-100 ..
!~£~~"~···-••••••-• H.!!l PRICJ<;S RECEIVED BY FARMERS !
1
.
( U. S. Department of Agriculture)§ Combined inr!ex.~----- ________ .. 1909-14= 100 __ 1
Chirkens and egg:s _____ ~------- ________ do ___ _ Cotton anrl cottonseed ________________ do. __ _ Dairy products _______ -------------- .. do ____ ; Fruits ___________ ---------- ____ ------ ~do ___ _ Grains .. ___ ... _______ ---------- ...... do .... Meat animals. __ --------------- ____ .. do .. __ •rruck c:rops _____ ------ ________________ flo. __ _ Miscellaneous ..... ____ . ___ ... __ ...... _do ... _
RETAIL PRICES U. S Department of Labor indexes:
Coa 1 , _____________________________ 1913= 100 .. --Food t ...... ~ .................. 1923-25=100 ..
Fairchild's index: Combined index. __________ ~ Dec. 1930= 100 ..
Apparel: Infants' wear. .................... do ... . Men's. _-------------------------.do .. .. 'V omen 's _________ ~ _______________ do ___ _
~i~~e:~~.j'~~~~~~~ :~~ :: ::~: ::: =~~~ ~=~~: ::: WHOLESALE PRICt:S
U. S. Department of Labor indexes: Combined inde.x (784) ............ 1926=100 ..
Economi(• classes: Finished products ................ do .. .. Raw materials .................... do .. .. Semimanufactures .. ___________ ... do ... .
•Revised.
128 ](12 JlC ]:?;)
133 ]1,) 12\) 131 140
85.4
94.5
95.3 89.4 93.0 9"1. 7 88.2
87.8
86.4 90. I 89.6
1936 I 1937
March I April I May I June I July I August I Se~~~m-1 October I N~~m-1 D't":rm- January! F~~~u-
BUSINESS INDEXES-Continued
67 77 95 65
108 37 56 41 72 51 98
59.5 67.5 55.5 80.0 84.5 79.5 79.5
11.5 104 133 62
109 70
115 123 81 96 84
194
65 80 98 64
120 46 50 35 79 43 84
58.5 69.5 56.5 83.0 83.5 87.0 II 75.0
109 102 128 62
108 65
115 115 76 93 72
177
68 84
114 60
128 164 51 31 82 48 94
64.0 72.5 67.0 78.5 79.0 77.0 80.5
106 102 125 66
107 61
115 108 73 9.5 73
156
•203 •198 '103 ' 40.5 ' 395 ' 409 r 1()4 r 165 r 161 '317 •312 •205 r217 r2!3 r207 T 21.5 T 203 T 19~}
' HO ' HS ' 14o '77 r(i4 r77
_'_1:.:.·".::~ __ ,_1:.:.4:.:.!) __ '_;1:);~
74 94
142 66
114 380 53 25 64 68 99
69.5 80.0 77.0 83.0 77.0 84.0 86.5
103 105 119 78
111 80
112 102
71 94 84
137
r 18() r 423 r L17 T :286 r 190 r l\-}2 r 1~2
'68 '\19
89 90
113 70 89
485 88 16 87
172 66
84.0 88.0 89.5 86.0 81.5 88.5 86.5
104 100 118 85
113 76
114 106 69
120 83
119
'185 I '438 T 154 '282 '194 T 1i7 '139
r(i(j
'131
80 81 94 75 80
152 78 71 78 93 57
75.0 74.5 61.5 87.5 87.0 89.5 89.0
109 102 122 88
114 82
114 113
75 128 93
126
'183 '436 r 1,1.1 '272 r 190 r l(it)
'140 '73
'1;;:;
COMMODITY PRICES
83.2 74.0 81.0 87. I 74.7 94.4
J04 ' 99 93
Jl8 94 92
122 77 91
79.5
88.1
92.9 87.3 89.5 89.2 84.5
79.6
81.3 77.4 74.4 1
I !
83.41 73.8
81.0 I 86.7 75. g 94.4
1051
1
97 96 I
1~~ ! o9[
1251 107 94
164 79.7
88.1
92.8 87.4 89.8 89.2 84.5
79.7
81.6 77.0 74.5
I
I
83.81 73.6
~nil 94.4
103 1 101 96
106 103 88
118 105 97
73.3 85.6 84.5 77.6 94.3
107 103 96
106 IJ5 87
120 99
120
79.9 83.8
88.1 87. 9
92.8 92.6 87. 5 87.4 89.9 90. 2 89.3 89.2 84.6 84.9
:::: I.
75.8 74.1
79.2
80.7 77.6 73.9
85.2 73.0 85.8 84. 7 78.1 94.4
115 106 105 116 117 109 119 115 131
157 84.0
88.1
92.6 87. 5 90.4 89.4 85.0
80.5
81.6 79.8 75.2
85.6 73.2 85.8 85.0 79.3 94.51
124 112 103 125 10~ 129 123 134 152
84.0
88.5
94.4 87.6 90.4 89.4 85.2
81.6
82.4 81.5 75.6
110 80 90 80 72 99
140 259 89 47 95
89.0 77.5 65.0 90.0 91.0 92.5 81.0
121 101 125 86
112 67
120 136
95 128 96
181
'191 i r 4;-,,~ ,. JR2 T 2flS , IS7 '157 '140
r 65 '130 I
85.9 73.6 86.1 85.6 R0.3 94.5
124 1W 106 !28 105 130 123 153 141
84.3
89.3
94.5 87.7 90.7 89.9 85.4
81.6
82.3 81.8 75.9
127 89 96 93 73 91
165 304 104 58
112
104.0 76.0 60.0 93.0 94.0 95.5 77.5
131 101 123 90
•112.2 63
120 153 107 132 lOG 220
'HJI I , .. jgg T 179 '2ti4 '1~3 r 172 '136
T 119 r 122
85.7 73.S 84.6 81\.2 80.8 91.9
121 127 104 125 104 128 120 131 133
82.8
90.0
94.5 87.8 90.9 90.3 85.6
81.5
82.0 I 82.1 76.2
106 95 82 91
115 117 116 200 78 54 77
88.5 77.5 61. .5 94.0 91.5 99.0 80.5
134 102 121
9(1 113
61 120 158 110 127 103 210
'195 r ;121 '1~0 r 2.)6 '1S7 '18:\ r 135
T 93 rlHi
85.8 no 84.3 k6. 5 81.4 95. 1
120 141 103 126 97
127 118 104 133
82.5
90.8
94.6 87. g
91. o I 90.9 8fi. 7
82.4
82.6 83.1 78.6
83 89 80 82
120 46 77
106 71 49 72
86.0 78. 5 64.5 92.5 91.5
100. 5 77.5
132 106 131 112 116
55 121 150 104 118 107 232
'101 r .)27 r 174 '251 rH)fi r 177 r 12-! '100 '116
86. 1 74.1 84. 7 86.6 81.8 95.3
126 1:33 105 127 93
134 122 99
108
82.9
91.7
94.9 88.1 91.4 91.8 86. 1
84.2
83.8 85.6 82. :l
66 74 76 73 81 39 57 57 78 42 79
75.5 75.0 G3. 5 87.0 89.5 89.0 78. 5
126 108 143 113 111
71 122 13\1
D3 111 101 2H
'187 r 474 r 17fi r 242 '1H8 r 173 r 11()
'101 '120
81\.9 74.3 86.4 86.4 82.2 95.8
131 110 107 1~~ Jnii 143 12~ llfi 182
84.6
93.0
94.9 88.4 H2. 2 93. 1 87.0
85.9
84.9 88.1 85.4
56 62 75 59 67 18 51 54 68 31 80
59.5 70.5 63.0 78.5 84.5
'83.0 59.5
119 108
'153 109 110 61
122 127 , 84 103 89
195
184 434 174 2-37 188 1S2 107 95
118
87.2 75.0 86.3 86.5 82.8 96. l
127 101 108 126 127 14G 126 143 147
84.5
93.7
95.1 89.0 92.5 94.0 87.6
86.3
85.4 88.3 85.5
, Not available subsequent to July 1936. A new index, based on weighted average prices, rather than unweighted prices as in the present series, will be shown in a subsequent issue.
§ Data for Apr. 15, 1937: Total130, chickens and eggs 104, cotton and cottonseed 117, dairy products 120, fruits 142, grains 154, meat animals 130, truck crops 127, mis· cellaneous 139.
t Revised Series. Retail food prices, for monthly data for period, 1923-3fl see table 9, p. 20 of the February 1937 issue. World stocks of foodstuffs and raw materials revised for period 1920-37. For revisions see t~ble 19. pp. 17 and IS, of this issue.

24 SURVEY OF CURRENT BUSINESS
Monthly statistics through December 1935, to- 1937 1936 gether with explanatory notes and references
March I I I
I to the source of the data ma.y be found in the
March April May I
June July I August I Septem·i October I Novem-1 Decem-1936 Supplement to the Survey ber ber ber
COMMODITY PRICES-Continued
WHOLESALE PRICES-Continued U. S. Department of Labor indexes-Con.
Farm products.------------ ____ .. 1926= 100 .. Grains ............. ---------- ........ do .. .. Livestock and poultry ............... do .. ..
Foods _______ ----------------------._ .. do ... . Dairy products ...•.. ------ .. -----._ .do .... . Fruits and vegetables ................ do .. .. Meats ............................... do ... .
94.1 113.2 93.7 87.5 90.2 86.5 92'0
Commodities other than farm products and foods .......................... 1926= 100.. 85. 5
Building materials .................. do .... 95.9 Brick and tile ..................... do.... 91.8
r~~~'b~~--~~~~~==::::::::::::: ::::::3~:::: 1
16~: ~ c~:~i~~~n~-~~~~~:::::~~~~~~~~~~~~~~~~~ I ~;: ~
Drugs and pharmaceuticals ........ do .... l 83.0 Fertilizer materials ................ do .... 1 70.3
Fuel and lighting ................... do .... I 76.2 Electricity-------------------- .... do ....
1
: .. _____ __ Gas.----------------·--- ......... .do ......... ___ . Petroleum products ............... do.... 58.6
Hides and leather ................... do.... 104.2 Boots and shoes ................... do.... 102.3 Hides and skins ................... do .... , 118.5 Leather ........................... do.... 97.1
House-furnishing goods ............. do.... SS. 4 Furniture ......................... do.... 85. 0 Furnishings ....................... do.... 91.7
Metals and metal products .......... do.... 96. 0 Iron and steel. .................... do.... 97.5 Metals, nonferrous ................ do.... 101.1 Plumbing and beating equipment
-------------------------- .. 1026= 100 •• Textile products ..................... <lo .. ..
Clothing .......................... <lo .. .. Cotton goods ...................... do .. .. Knit goods ....................... do .. .. Silk and rayon .................... uo .. .. Woolen and worsted goods ........ do .. ..
Miscellaneous ............ ___ ....... .do .. .. Automobile tires and tubes ....... do .... . Paper and pulp ................... do ___ _
Other wholesale price indexes:
77.6 78.3 84.8 94.0 Gel.9 33.6 92. 6 79. 5 .55. 0 90.2
Bradstreet's (96) ...................... do.... 91.4 Dun's (300) ........................... do.... 109.0
World prices, foodstuffs and raw materials, combined index ............. 1923-25= 100 ..
Coffee ................ --------- ........ do .. .. Cotton ................................ do ... . Rubber ............................... do .. .. Silk ........ _ .... _ ............... _ ..... do .. .. Sugar ................................. do .. _. Tea ................................... do .. .. Tin ................................... do ... . Wheat ................................ do .. ..
Wholesale prices, actual. (See under respective commodities.)
PURCIIASING POWER OF THE DOLLAR
61.2 55.4 53.3 56.4 28.1 64.6 78. 0
124.8 86.5
Wholesale prices ................. 1923-25=100.. 114.7 Retail food prieest ....................... do.... 117.1 Prices received by farmers .............. do.... 114.8 Cost of livingt .......................... do.... 115.7
76.5 75.6 88.3 80.1 80.3 65. 1 89.7
78.9 85.3 88.9 95.5 82.6 79.3 85.9 73.0 64.8 76.2 s.!.4 84.4 56.0 94.9
100.4 91.0 85.0 81.4 77.9 84.9 86.6 86.3 69.9
73.8 70.8 80.7 77.1 62.1 30.9 83.8 68.3 45.0 80.3
76.3 92.1
51.3 44.5 41. g 37.2 24.2 65.8 70. 1 95.5 58.7
126. fi 125.8 141.4 122.2
76.9 73.9 88.3 80.2 78.8 67.8 91.0
78.9 85.7 89.0 95.5 83.2 78.5 85. 5 73.2 64.6 76.4 82.8 84.8 57.9 94.6
100.3 90.1 84.5 81.5 78.0 85.0 86.6 86.3 70.~
73.8 70.2 80.8 76.2 62.0 30.1 82.2 68.6 45.0 80.5
76.0 92.0
52.1 43.0 43.0 37.4 23.5 71.0 70.9 93.4 56.6
126.4 125. 5 140.1 122.0
75.2 70.6 82.5 78.0 75.0 72.3 85.1
78.8 85.8 88.8 95.5 83.0 77.7 84.1 73.2 64. 7 76.0 84.2 ' 87.3 58.2 94.0
100.2 87.3 84.4 81.5 77.9 85.0 86.3 86.3 70.7
73.8 69.8 81.1 75.5 60.6 29.1 82.2 W.2 47.5 80.5
75.4 91.3
51.3 42.li 43.0 36.5 22.4 70.3 68.0 92.1 55.2
128.1 125.2 142.7 121.4
78.1 73.0 83.2 79.9 77.6 82.0 85.1
78.8 85.8 89.2 95.5 82.1 78.0 84.3 73.:? 64.0 76. 1 83.4 88.0 57.7 93.8 99.7 89.0 83.2 81.4 77.5 85.2 86.2 86.3 70.0
73.8 69.7 80.9 75.4 60.3 29.3 82.6 69.7 47.5 80.6
76.3 94.5
54.7 43.5 44.1 37.1 22.3 71. 1 64. 1 8·1. 0 54.6
127.2 119.3 137.4 119.5
81.3 88.9 82.0 81.4 83.8 79.7 84.9
79.5 86.7 89.2 95.5 83.7 79.4 85.9 73.0 65.2 76.2 83.4 87.9 58. 1 93.4 99.3 87.8 83.0 81.2 77.2 85. 1 86.9 87.6 70.4
76.5 70.5 80.7 78.7 59.3 30.7 82.0 71.0 47.5 80.6
78.5 96.4
54.8 46.0 48.5 38.6 23.9 69.8 64.8 85.5 63.5
125.1 119.0 127.9 119.3
83.8 102.4 84.5 83.1 87.6 76.1 86.4
79.7 86.9 89.1 95.5 83.8 79.8 86.2 73.3 66.7 76.3 82.5 86.1 .57.9 93.6 99.3 00.0 82.4 81.4 77.6 85.2 87.1 87.9 70.8
76.5 70.9 80.8 79.5 60.3 31.6 81.2 71.5 47.5 80.6
78.9 96.8
55.9 47.9 45.2 38.2 25.0 69.3 6S. 6 84.7 73.3
123.4 119.0 118. s 118.8
84.0 102.0 83.8 83.3 89.5 71.5 87.3
79.6 87.1 89.0 95.5 84.9 81.7 88.6 75.3 67.6 76.1 83.2 87.2 57.5 94.6 99.3 93.3 84.2 81.7 78.0 85.4 86.8 88. 1 71.4
76.5 70.9 80.8 80.0 60.8 30.2 80.9 71.3 47.5 80.7
79.5 97.1
55.2 47.5 45.2 38.4 23.7 66.1 72.3 89.0 72.2
123. 4 118.6 118.5 118.3
CONSTRUC'l'IO~ AND REAL ESTATE
CONSTitUeTION CONTRAeTS I
.,1 I
AWAR»Jm I J Value of contracts awarded (Federal Hesen·e indexes):
Total, unadjusted ............. 1923-25=100. -~ 56 56 60 65 65 60 Residential, unadjusted ............. do ... _ -17 28 35 ! 38 39 45 46 47
Total, adjusted.---------------------- do .... 55 47 47 46 1 52 59 62 59 Residential, adjusted ................ do .... J 45 26 30 32 36 44 46 47
F. W. Dodge Corporation (37 States): 1 Total, all types:
1 13,355 10, 514 13, 338 13. 242 12,056 ProJects .. --------------------- .. number .. • 13, 352 13,890 12, 912 Valuation ................... tbous. of doL. 231,246 •199, 0281234, 632 216,071 233,055 294,735 275, 281 234,272 Nonresidential buildings:
Projects ....................... number .. 3,361 3,106 3, 792 3, 436 3, 411 3, 626 3, 504 3, 079 Floor space .............. thous. of sq. ft.. W, 75D 15, 098 17, 343 15, 629 15,916 17, 543 15,504 13.639 Valuation ................. tbous. of doL. 88,602 81,460 94,068 82,252 79,079 96, 125 80,380 69,099
Public utilities: Projects ....................... number .. 195 205 221 176 W7 229 188 224 Valuatlon ................. thous. of doL. 20, 266 18,106 23,753 12, 773 9, 264 27, 512 17, 945 15, 735
Public works: Projects ....................... number --I G04 1,123 1, 092 1,102 1,330 1, 782 1,238 1,169 Valuation ................. thous. of doL. 32,221 44, 191 49,660 50,792 71,107 99,103 76,435 68,767
Residential buildings all types: Projects ....................... number .. 9,195 6,080 8, 233 8, 528 8, 444 8, 253 7, 982 7, 584 Floor space ............. tho us. of sq. ft.. 24,244 15, 604 19, 736 20,547 20,624 20,501 24,393 21, 181 Valuation ................. thous. of doL 90,168 r 55,271 67,151 70,253 73,605 71,994 100,523 80,671
Engineering construction: Contract awards (Engineering News Record),
thous. of doL. 156,788 147,697 195,458 141, 257 183,917 226,595 192, 317 197,372
I
84.0 102.1 81.2 82.6 87.4 73.8 84.4
80.1 87.3 88.3 95.5 86. 1 82.2 89.0 76.5 67.4 76.8 82.8 86.0 57.9 95.6 99.3 97.2 85.4 82.0 78.3 85.6 86.9 88.8 71.7
76.6 71.6 81.2 82.0 61.1 31.1 80.5 71.5 47.5 80.8
79.1 97.8
55.0 48.4 45.2 38.6 24.5 . 61.6 67.7 89.5 75.8
123.6 120.8 121.5 118.6 1
54 41 57 43
12, 9f;6 225, 767
3, 319 14,361 79, 071
214 14, 171
1, 143 52,861
8, 290 21,553 79, 664
220, 142 • Revised. , Data for April, July, October,aud December 1936 are for 5 weeks; other months, 4 weoks.
85.1 102.9 79.7 83.9 88.2 74.8 85.2
81.0 87.7 88.8 95.5 86.6 82.5 89.2 77.9 68.0 76.8 82.7 81.9 58.1 97.0 99.3
101.2 88.4 82.3 78.8 85.7 87.9 88.9 75.4
76.7 73.5 81.5 85.5 61.2 33.4 84.3 73.4 50.1 81.5
83.5 102.3
56.9 50.9 44.9 42.2 27.0 68.3 68.0
102.1 73.2
122.3 121.2 122.5 118.5
[11
39
581 40
11, 269 208,204
2, 997 14.623 65,895
222 18,029
870 5.1,839
7,180 19,985 68,441
162,743
88. 5 109.0 85.0 85.5 88.9 75.4 87.2
82.2 89.5 88.5 95.5 89.6 85. 3 93.3 77.4 68. 6 76. 5 82.7 83.1 58.0 99.7 99.4
110.4 92.6 83.2 79.4 86.9 89.6 90.9 78. 6
76.7 76.3 83.1 90.3 63.0 33.8 90.5 i4.5 50.1 82.9
86.2 109. 5
60.6 54. 9 47. 1 4G. 8 27.5 71.3 66.9
103. 1 81.8
119.6 120.6 116. 7 118.1
53 38 66 45
9. ()05 199,696
2, 467 14.370 72, 956
167 19, 117
582 42,135
6, 389 18, ge,u 65,487
266,301
May 1937
1937
I Janu· Febru-ary ary
i 1!H II 1ru 87.1 87. 0
!HI !U 83.4 84.1
~HI ~H 93.0 99.0 87. 7 87. 8 96.41' 95.6 79.0 83. 0 70.61 70.7 76.6 76.8 81.0 ---------
~u 1 ~g: I 101. , 1 102. 7 99.7 101.4
116.0 I 114.9 94. 31 9f. 5 8fl. 5 87. 9 84.0 84.5 89.0 91.2 90. 9 91. 7 91.7 92.0 84.8 89.4
77.1 77.5 b3. 9 91.9 64.4 3-1.5
~u I' 5l.B 84.8
86.91 107.7
62.3 55.9 1 47.8 ' 50. 1 1
~~· 7 i 1u.S 1
70.8 '
84. 2 101.21
I
117. 21! 118. 2 112. 2 117. 1
I I I
51 ~ O• I
&11 45
s. 731 I 2·12, 827
2, 029 ' 14, !>Dl ! 95,069
181 21,788
515 46,664 1
5,406 18,427 78, 407
173,077 I
77.4 77.5 84.2 91.3 64.7 33.7 93.1 77.3 53. 1 87.:3
87.8 108.8 60.3 58.3 48.2 49.9 27.8 66.3 74.0
103. 3 7!J. 5
116.7 llS. 3 ll5. 7 116. 7
r)\ •. •6 2
7 4
9, 74 l~.\:!.51
2, 92 10,70 05, ti2
20 32,36
39
2 1 6
27, 26·
6, 22 18,73 G3, 00
IS9,19
4 9 4
t Revised series. For data on purchasing power of the dollar, retail food prices, for period 1923-36 and cost of llvin~ for period 1914-36 see tables 5 and G, p. 19 of the February 1937 issue.

Ma~- 1937 SURVEY OF CURRENT BUSINESS 25
Monthly statistics through December 1935, to-,19371 1936 I 1937 gether with explanatory notes and references ___ ---,------,,------.----.---.-----===:--: to the source of the data may befoundinthe March March j April j May j June July j August j Septem-j October jNovem-j Decem- Januaryj Fehru-1936 Supplement to the Survey - ber ber ber ary
CONSTRUCTION AND REAL ESTATE-Continued HIGHWAY
Concrete pavemen TotaL--------
Roads only ___
CONSTRUCTION t contract awards:
____________ thous. of sq. yd •. _______________________ do. ___
ade crossing projects admin· Highways and gr istered by Bur
Highways: eau of Roads:
Approved lor construction: Mileage ___ _ ___________ number of miles .. Allotments: total _________ thous. of doL
ederal aid _____________ do ____ Regular F 1934-35 Po Works Pr
blic Works funds ..... do ____ ogram funds ___________ do ____
Under eonstru ction: Mileage ___ _ ___________ number of miles .. Allotments: totaL-------- thous. of doL
edera1 aid _____________ do .... Regular F PublicW
1934-35 f Federal
Works Pr
orks Program: unds __________________ do ____ aid ___________________ .do. ___ ogram funds ........... do ____
Estimated t Grade crossings
otal cost _______________ do ....
'construction: and reconstructed* .number __
Approved for Eliminated Protected b Works Prog
y signals* _____________ do .. __ ram funds alloted
thous. of doL Estimated t otal eost. _____________ do ....
ction: and reconstructed* .number ..
Under eonstru Eliminated Protected b Works Prog
y signals* _____________ do ____ ram fonds allotted
thous. of doL Estimated t otnl cost. _____________ do ____
ION COST INDEXES CONSTRUCT Aberthaw (indust American Apprais Associated General
rial building) ..... l914=100 •. al Co. (all types) .. 1913=100 ..
Engineering News
E. H. Boeckh and
Contractors (all types) 1913=10(L
Record (all types) ~ 1913=100 ..
Associates, Inc.: Apartments, ho tels, and office buildings:
crete: _____ u.s. av., 1926-29=100 .. Brick and con
Atlanta. ___ New York. San Francis St. Louis ___
__ .. ________________ ... do. ___ co. ____________________ do .. __
----------------------.do.---Commercial and factory buildings:
crete: 1 _____ u.S. av., 1926-29=100 •• Brick and con
Atlanta .... New York. San Francii!C St. Louis ___
--------------------.. .do .. --o. ---------- __________ do .... _______________________ do .. __
Brick and stee 1: Atlanta __ __ -----------------------do .••• _______________________ do .... New York. San Francis St. Louis. __
co _____________________ do ____ ______________________ do .. __
Residences: Brick:
--------- ______________ do .... Atlanta .... New York_ San Francisc St. Louis ...
_______ .---- ____ -- ____ .do. ___ o. ____________________ do ....
_______ -.. - ____ ---- ____ do ____ Frame:
_______ --- _- _- ________ .do. __ . ________ -- ___ ---- ______ do. ___ co ... __________________ do. ___
Atlanta .... New York_ San Francis St. Louis ...
_______________________ do ____
RE AL ESTATE Fire losses ______ __ ______________ thous. or doL. Foreclosures:
ies• ______________ 1926=100 .. Metropolitan cit Nonfarm real es
Loans of Federal a Federal savings Associ~tions, t Associations re
Total mortg
tate* _____________ 1934= 100 .. gencie.~: and loan associations: otaL ________ ...... number .. porting .... ___________ do .. __
age loans outstanding• thous. of doL.
Federal Home L Outstanding lo ans to member institutions
3,352 2,564
3,323 46, 743 36,315 2,883 7, 545
8,041 139,683 76,168
12,540 0
50,975 214,697
!50 396
12,842 13,257
969 341
98,464 100,718
203 176.0
184
225.3
9LS IlL 3 109.4 110.6
95.3 113. 3 113.8 113.5
94.0 113.9 110. 7 114. 4
84.3 109.6 99.8
105.4
78.1 104.9 94.0 97.6
29.319
2:JO 73.6
], 24~ 1, 157
626,907 oan Bank: I
thous. of doL. 142, 7Ir. oan Corp.: Home Owners' L
lJoans outstan ding• _________________ do .... 12,642,611
-···------A"'D"'V;mE..,.RTISING Printer's Ink Indexes (adjusted for seasonal
variation): Combined index _______________ 1928-32= 100 ..
Farm papers ... _____________________ do ... _ Magazines._---------- ______________ do .. .. Newspapers .... _____________________ do. __ _ Outdoor_----------- ________________ do ... _ Radio ....... ------ •• ___ ••• ----------do ••• _ r Revised.
94.1 72.0 97.8 90.1 75.7
228.6
2,662 1, 579
6, 693 82,577 22 238 7,623
52,716
10,514 176,148 44,586
55,085 569
75,908 222,517
506 17
40,283 42,287
518 1
46,197 47,019
178 159
178
201.2
84.8 105.4 99.7
104.4
88.3 109.1 104.7 105.9
85.7 106.2 100.6 105.9
76.6 100.8 94.0
100.3
69.3 96.3 85.9 92.1
29,177
302 83.2
1,078 980
366,405
103,354
3,040,137
84.8 66.6 86.8 81.5 71.1
192.8
3,835 5, 235 2, 767 3,621
6,181 5, 383 73,574 62,963 21,297 20,692 7,382 5, 975
44,894 36,297
11,829 13, 163 196,841 210,482 50,949 57,019
52,005 45,693 467 248
93,420 107,523 250,203 271,452
479 488 29 35
42,011 40,561 43,526 41,983
679 827 1 2
b8, 645 72,923 59,667 74,064
--------- ---------159 161
178 178
202.2 203.4
I 84.8 84.8
106.0 106.0 99.2 98.3
104.4 104.6
88.3 I 86.7 109.7 109.7 104.3 103.3 105.9 106.0
85.7 85.3 107.0 107.0 98.5 97.4
105.9 106.0 I
76.6 76.1 101.9 101.9 94.0 92.9
100.3 101.0
69.3 63.9 96.9 96.9 85.9 84.9 92.1 93.0
25,787 21,479
302 279 83.9 82.6
1,102 1,114
4,188 2, 942
4, 231 53,090 20,577 4, 631
27,882
13, 631 217,441 59,808
38,975 195
118,463 280,758
488 317
40, 217 41,313
1,117 5
90,465 92, 211
183 162
178
204.6
83.7 107.0 99.0
104.6
86.6 110.9 104.3 106.0
85.1 107.7 98.2
106.0
74.9 103.0 93.4
101.0
67.5 97.4 85.2 93.0
20,407
1,135
7,91 6, 20
3 8
4,14 3 0 50,40
22,604 4, 345
23,451
13, 185 212,546
61, 714
33,397 195
117, 241 278,978
425 502
34,081 35,305
1, 221 12
101,014 102,667
--------163
178
204.4
83.3 107.0 99.0
104.5
86.2 110.9 104.3 105.9
84.6 107.7 98.2
105.9
74.1 103.0 93.4
100.4
67.1 97.4 85.2 92.2
22,357
279 82.7
1,165
.~I 1, 006 1, 006 1, 006 : 1, 025
390, 810 404, 7221442, 027 i 465, 632
105, 969 1110, 922 1118, 580 1122, 094
a,o60,029_~.Q~~2 ~~.87~ '~30· 7_3 9
DOMESTIC TRADE
87.7 72.8 89.2 85.0 70.6
185.2
88.5 76.5 87.6 86.5 70.2
184.4
90.9 73.5 88.2 88.9 73.5
202.1
90.6 73.4 90.3 87.1 74.3
2U.7
5, 903 4, 648
3,686 50,476 27,929 4, 248
18,299
12,812 202,765 65,213
26,680 147
110,725 270,622
350 581
29,026 30,367
1, 246 33
108,272 110,161
---------163
178
208.1
83.3 108.4 106.1 104.5
86.2 112.0 114.4 106.0
84.6 109.3 106.4 106.2
74.1 104.0 98.3 99.2
67.1 98.4 87.8 90.9
21,714
259 78.3
1,175 1,076
497,852
125, 211
12,897,367
.5
.2 7.2
88 80 8 8 7
230
4.9 2.3 .o
7, 613 5,196
3,173 49,123 30,601 4,044
14,479
11,949 194,477 69,488
22,929 32
102,028 266,528
289 624
26,575 27,817
1, 238 33
110,865 112,930
183 165
179
208.1
83.3 108.4 107.3 104.5
86.2 112.0 114.5 106.0
84.6 109.3 107.7 106.2
74.5 104.0 98.6 99.2
67.6 98.4 88.3 90.Q
20,414
278 85.7
1,183 1,062
507,574
129,752
2,869,660
91.0 76.8 111.6 86.9 68.5
268.2
6,082 4,482
2, 750 46,103 29,360 4,148
12,595
10,335 174,781 70,586
20,379 32
83,784 248,024
254 620
23, 615 24,185
1,192 30
111, 326 113,915
---------166
180
211.5
84.8 108.4 107.8 105.2
87.0 i 112.0 114.9 106.6
85.6 109.3 108.1 106.8
76.1 104.0 99.0 98.8
68.0 98.4 88.7
91.51
20,439 '
259 77.8
1,192 1, 080
532,064
134,929
2,883,503
94.1 71.7 89.6 90.6 81.5
253.7
3, 769 5,468 3, 385 2, 371 2, 550 4, 026 2, 836 1, 456
2, 574 2, 635 2,880 2,993 42,093 42,090 43,899 44,472 27,034 29,059 32,710 34,247 3,809 3,671 3, 291 2, 902
11,250 9,360 7, 898 7, 323
8,881 8, 003 7,617 7, 923 158,537 141,009 133,553 136,039 69,368 65,664 65,222 69,809
17,206 13,461 12,561 12,491 32 11 0 0
71,931 61,934 55,770 s:J,ns 229,527 207,315 199,498 205,239
228 206 17:1 157 615 542 542 41!1
20,233 17,971 16,037 13. 5~6 20,826 !8, 606 16,621 14,049
1,149 1, 081 !, 039 1. 0\4 42 98 100 309
109,016 104,876 101,381 100,59:1 111,614 107,645 103,808 102,8,13
--------- 195 ----------- -- ---167 169 171 174
180 I 180 181 184
212.7 220.7 223.5 223.5
85.1 1 85.2 86.9 88. 1 108.3 108.4 109.5 110.1 Jr~ ~ , 108.2 111.8 !OS. 4 1U6. 2 I 106.2 108.4 109.8
87.2 87.3 88.6 ~0. 5 ll2.0 112.1 l!L7 ll2. 0 115.2 115.2 !18.1 ll3. 0 107.4 107.4 112. 1 ll2. 9
8.1.8 86.0 88.3 89.2 108.5 108.7 lll. 1 l12. 2 108.9 108.9 112.7 108.8 107.6 107.6 109.7 112.8
76.3 77.0 80.1 82.0 104.1 104.8 106.5 108.5 99.2 99.2 102.4 98.1
100.6 100.6 104.1 105.0
70.0 77.7 75.0 76.6 98.4 99.1 10L 1 103. !i 88.9 8R 9 92.2 92.2 92.3 92.3 96.1 97.2
22,808 30,134 25,070 28,6.1.1
235 268 22'2 "\\)1)
75.1 84.4 '69. 9 6.1. 1
1,206 1, 212 1, 228 I, 240 1,046 1, 065 1,143 'I' 1, 1.~7
531,078 544,107 576,299 '611, 212
137,250 145, 394 143,738 141, 198
2,801,827 2,765,098 '2,711,4.11 2,680,2:10
95.4 99.2 '86. 5 91.9 75.3 92.9 70.3 7fi. 7 97.1 101.1 R9. 3 94. :l 91.1 95.2 81.4 88.:J 80.0 75.6 '74. 8 fiR. .1
239. ~ 244.4 241. 5 234.8
*New series. Data on number of grade crossing projects represent a breakdown of the total projects shown in the 1936 Supplement. }'or the foreclosures indexes, earlier data, together with a complete description of the indexes, see table 18, p. 20 of the April 1937 issue. Total mortgage loans outstanding of Federal Savings and Loan Associations represent the combination of loans of "new associations" anq "converted associations" which were shown separately in the 1936 Supplement to the Survey. The Home Owners' Loan Corporation data are for loans closed through June 12, 1936, when lending operations ceas~d. and for loans outstanding thereafter. The June 1936 figure repre-sents the total of all loans made during the full period of lending operations. §Index as of Apr. I, 1937, is 230.3.
lR964l-37--4

26 SURVEY OF CURRENT BUSINESS May 1937
1937 1930 1937 Monthly statistics through December 1935, together with explanatory notes and references to the source of the data may be found in the 1936 Supplement to the Survey March March I April I May I June I July I August I Seb~~m-1 October I Nobe~m-j D'b"::n- January I F~~~u-------------------------~---2----~--~------
DOMESTIC TRADE-Continued
ADVERTISING-Continued
Radio advertising:• Cost of facilities, totaL •••••••. thous. of doL ........ .
Automotive ••.••••••••.•.•.•.•••••.. do.... . _ ...... . Clothing ....•••••.•••••..•.•.....•.• do ............ . Electric home equipment •••..•••.•. do ..•• ________ _ FinanciaL ••••••••••••...•.•••.•.•.. do .••.......... Foods ....••••••••••.•••.••.•.•..•••. do .•........... Home furni~hings, etc ••.••.•.•.•.••. do ............ . Soap, cleansers, etc ....•..•...••..••• do ......... _ .. . Office furnishings, supplies •..••..... do ........... _. Smoking materials .....••••••••.•... do ..•. ---------Drugs and toilet goods •.••.•••..••.. do ............ . All other ..••.•.•.••••••.••.•.•...••. do ........... ..
Magazine advertising:• Cost, totaL •..••.•••.•••••••..••••.••• do ........... ..
Automotive •.••••••••.••••••••••.••• do ..•. __ .. _ ... _ Clothing ..••.•••.•.•...••.••••.•••.. do .......... . Electric home equipment. .•••••••.. do ........... .. FinanciaL ..••••.••••......•••.•••.. do .•.. ________ _ Foods ••......•••...••••.••.•.•...••. do ........ ____ _ Home furnishings, etc .•.••...•••..•. do ..•......... _ Soap, cleansers, etc ..•...•....•.•••.. do ..•. ________ _ Office furnishings, supplies •..•.•.••. do .•.. ________ _ Smoking materials .................. do .•.. ---------Dru~s and toilet goods ••••.••••..... do ............ _ All other ...••••.•..•••••.•..••.•••.. do .•..
Lineage, totaL ....•••.•....•. tho us. oflines.. 2, 7fl2 Newspaper advertising:
Lineage, total (52 cities) .•........•••. .do ... . Classified .....••.••••..••.........•. do ... . Display, totaL ••••.•.••••••••••.••.. do ..•.
Au tom oti ve ••..•.•.•.•.•••.••••••• do .... FinanciaL.------------ .•.•...••.. do .•.. General .••.•.••.••.••••••.••..•.•. do ... . RetaiL •••....•..••••••••••••.•..• do ... .
GOODS IN WAREHOUSES
Space occupied, merchandise in public warehouses ......•••.•••.... percent of totaL.
NEW INCORPORATIONS
126,131 21,032
101, !)02 !), 413 2, 390
H40f> C>9, 292
5,402 876
43 16 53
1, 501 89
267 100 3~0
1,606 471
13, 458 2, ?49
588 516 4].1
2,307 567 495 210 560
2, 485 3, 066 2,511
116, 443 21,991 94,452
5, 453 2. 773
22,899 63,327
61.8
4,833 742
29 4
33 1,432
85 265
36 398
1, 443 366
14,498 2, 574
751 805 411
1, 909 813 529 175 580
2,501 3, 449 2,860
121,887 22.548 99,339
7,813 2, 488
21,812 67,227
62.1
4, 441 731 31
0 36
1, 257 77
279 33
395 1, 263
339
14,907 2, 747
805 723 390
1, 938 882 593 234 593
2, 375 3, 627 2,852
127, 182 24, 172
103, 010 8, 493 1, 933
23,498 69,086
61.2
3, 931 626 26
9 37
1, 174 70
291 8
373 1,01lll
251
12,299 2, 147
646 531 330
1, 877 534 459 180 578
2,158 2, 859 2, 637
117,029 24.,843 92,1R6
7, 645 I, 988 I
20, 802 1
61,751 I
61. 3
3, 832 492
5 45 33
1, 290 23
285 0
423 982 254
8,891 1, 528
257 298 240
1, 670 148 366
75 483
1, 790 2,036 1, 967
98,499 21,232 77, 266
6, 593 2, 219
18,287 50,167
61.0
Business incorporations (4 States) ... number.. 2, 608 2, 506 2, 297 2, 2n I 2, 285 2, 182
POSTAL BUSINESS
Airmail: Pound mile perrormance ••...... thousands •• _________ 902,749 885,274
I I 920,629 1919,828 ·1,0.55,015
1,444,013 1,476,459 :1,616,191 Amount transported ... ------------Pounds ........... l,396,977 1,355,200 Money orders:
Domestic, issued (50 cities): Number ••........•........... thousands.. 4, 638 Value ....................... thous. of doL 44,581
Domestic, paid (50 cities): I Number ••••.••...•.....•...... thousands.. 15, 374 Va!ue.:·'--------------------thous. of doL I 116,518
Fore1gn, 1ssued-va!ue •..•............ do ........... .. Receipts, postal:
50 selected cities ..•.•...••.... _thous. of doL 33, 7G:l 00 industrial cities .••.................. do____ 3, 882
RETAIL TRADE
Automobiles: New passenger automobile sales:
4,123 38,676
13,291 99,739
3, 055
28,839 3, 318
Unadjusted •••.•............. l929-1! =100.. 14o. 4 117.8 Adjusted ... _________________________ do.... 122. 5 101.0
Chain-store sales: Chain Store Age Index:
Combined index (20 chains) av. same month 1929-31 = 100.. 109. 0 ' 101. 3
Apparel chains av. same month 1929-31=100.. 126. o 119.0
Grocery chains av. same month 1929-31=100.. 103. o 94.0
Variety store sales: Combined sales or 7 chains:
Unadjusted •• -•....•..•...... 1929-31=100.. 97.1 80.3 Adjusted ............................ do.. .. 103. 3 93.3
H. L. Green Co., Inc.: Sales ..•••.••...•.••••• -••••• thous. of doL 2, 77-1 2, 043 Stores operated •..•...•.•...•.... number.. 136 130
S. S. Kresge Co.: Sales ........................ thous. of doL 12, 63.5 10,043 Stores operated .................. number.. 731 739
S. H. Kress & Co.: Sales ........................ thous. or doL 7, 447 6, 314 Stores operated .......•....•• -•.• number.. 235 235
McCrory Stores Corp.: Sales ........................ thous. or doL 3, 556 2, 893 Stores operated __________________ number.. 194 200
G. C. Murphy Co.: Sales .......•... _____________ thous. of doL 3, 379 2, 320 Stores operated ••....••......••.. number.. 195 190
F. W. Woolworth Co.: Sales .•... ·------------------ thous. of doL 24,815 19, 677 Stores operated .•••••••••••...••• number.. 2, 003 1, 980 • Revised.
3,950 37,884
3, 834 4, 091 3, 764 36, 405 40, 994 38, 354
13, 122 99, 510 2,450
28,944 3, 320
12, 735 96,032
2,048
27, R74 3,124
142.3 138.6 93.5 93.5
102.0 103.0
115.4 116.8
94.4 93.0
95.7 96.8 95.2 96.8
2, 522 2. 514 131 131
12, Oil 11,925 737 726
6,873 6, 552 235 235
3, 284 3, 057 200 199
3, 001 3, OS9 190 190
23, 072 22, 622 1, 983 1, 986
13,153 102. 407
2, 385
28,288 3, 214
139.3 109.5
108.0
117.8
95.8
98.8 104.0
2, 62.5 130
12, 182 725
7,027 235
3,443 197
3,183 191
23,398 1, 989
12,598 103, 085
2,482
26,673 a, 192
117.3 104.5
109.6
125.0
100.0
97.2 109.2
2, 412 130
11, 169 729
6, 525 235
3,002 195
2, 974 191
22,861 1, 990
3, 777 488
4 36 38
1, 207 33
249 0
397 976 369
8, 493 1, 548
229 86
249 1, 414
99 337 136 545
1, 757 2, 093 1, 695
99, 166 n,546 713,620
4, 908 1, 646
16, 186 53,880
61.3
1, 910
4,894 770 24 27 44
1,333 29
314 6
439 1,273
635
11, 104 1, 365
695 191 358
1, 585 665 446 286 593
I, 938 2, 982 2, 084
114,387 22, 521 91,860 4, 2.57 1, 641
21,053 64. 916
61.7
2, 026
6, 723 1,164
51 1
53 1, 55!)
65 400
17 359
1, 475 1, 579
14,285 1,364
895 477 425
2, IPS I, Ool
531 304 657
2, 6-12 3, 741 2,637
136, 635 23,984
112,652 6,183 1, 860
27,411 77, 198
61.8
2,156
1,051,115 998,894 1,060,488 1,623,239 1,528,942 1,629,711
3,633 36,655
11, 573 94,696 2, 741
26,037 3,022
92.9 92.0
109.0
118.6
102.0
86.5 97.7
2,430 132
11, 353 729
6, 652 235
3,010 195
2, 922 192
23,186 1,991
3, 665 37,237
12, 772 103,480
2, 720
29,294 3, 242
71.0 83.0
110.0
117.2
99.8
97.8 102.4
2, 501 132
11, 753 728
6, 785 235
3,096 195
2,907 192
23,434 1,993
4, 071 40,616
14.921 119,437
2, 319
32,880 3, 678
56.5 85.5
109.5
123.0
99.2
100.4 98.9
3, 027 133
13, 540 730
7, 307 235
3, 511 194
3, 637 194
26, 733 1,994
6,126 I, 031
56 22 70
1,670 91
410 13
391 1,659
713
14,758 2,290
696 325 421
2,452 798 501 2fi3 648
2, 9~6 3,438 2, 736
131,986 22,546
109,340 9,812 1, 848
24,227 73, 452
61.7
2,114
I I 6, 1851--------J ........
9~4 ~---------!---------
'·:!! ~ ! : : 6 _________ ! ________ _
404 1---------1---------1, 7521 _________________ __
GlO ---------~---------
12. 2031 _________ 1 ________ _
1, 419 --------- ---------535 --------- ---------
~161:::::::::1 :::::::: I, ~77 ________ J_ ______ _
~~~ :=:::::::!=:::::::: 2. ni :::::::::1::::::::: ~:m --·:~:o:i!·l---2.-~iiil
130,762 99,.588 103, 1}02 22, 9-!5 21, li21 1 20. ol.o
107,817 78,0f,t) 1 b2.477 4, 2"!6 3, 848 i il, 895 2, 151 2, U70 I I, 9S6
18, IS6 17,176
1
22, S14 83, 234 54. .572 53, 7SI
I 61. 6 62. 0 : 02. I I
2, 489 2,620 2, 22S
984, 288 i I, 16G,914 1,511,11711,778,912
907,001 ~---------1,410,974 ---------
1
a. 907 I 4. 596 4,1lfi 40,019 38, 315 43, 849
13,316 105, 703
2,633
Ill, 221 122,826
5, 712
12, 596 95,752
2,429
29,217 41,345 •27,892 3, 226 4, 8413 3, 418
113. 1 151.0
111.0
127.0
100.0
104.5 103.0
2, 905 134
12,214 731
7,321 235
3, 209 194
3, 268 194
23,891 1, 995
130.4 90. 1 175.0 129.5
113. 0 106.4
130. 0 112.0
100.0 100.0
195. 7 70. 3 106. 1 94. 4
.1, 8\7 2, 017 I:l5 135
24. 35 J 9, 349 734 729
14,748 5, 109 235 235
6, 714 2, .110 19G 195
6, 379 2, 519 195 195
45, 506 1 18, 649 1, 997 • 1, 993
4, 041) 38,353
11, R26 90, 413
2, ,)02
27,7,14 3, 312
'85. 5 'Jijg_ 5
' 110.0
117.0
'103. 0
81.3 97.4
2, 018 136
9, 843 729
5, 591\ 23fi
2, 062 194
2,.5.50 195
19,758 2,000
• New series. Data on radio and magazine advertising cost are compiled by the Publishers Information Bureau, Inc., successors to National Adrertising Records, and are not comparable with data published prior to those shown in the January 1937 issue. Earlier figures, when available, will be publisheq In a SJll:>~equent issue.
• Receipts for Louisville not included.

May 1937
Monthly statistics through December 1935, to-gether with explanatory notes and references to the source of the data may be found in the 1936 Supplement to the Survey
RETAIL TRADE-Continued
Restaurant chains (3 chains): Sales __________________________ thous. of doL. Stores operated ____________________ number __
Other chains: W. T. Grant & Co.: Sales ________________________ thous. of doL.
Stores operated .. _.--------- _____ number __ J. C. Penney Co.:
Sales ________________________ thous. of doL. Stores operated. ___ -----·----- ___ number __
Department stores: Collections:
Installment aceount pereent of accounts receivable ..
Open account _______________________ do ____ Sales, total U.S., unadjusted .• 1923-25=100 ••
Atlanta.----------- ________________ do ____ Boston .. __ ------------------ --------do ____ Chicagot ----------------------------do ____ C!e ve land ___________________________ do ____
Dallas. ____ -------------.---------_ .do ...• Kansas City ____________________ 1925= 100 .. Minneapolis ••. ________________ .1929= 100 __ New York ___________________ 1925--27=100 __ Philadelphia .. __ ------- ______ 1923-25= 100 .. Richmond. _______ ------------ _____ _cto ____ St. Louis ____________________________ do. ___ San Francisco .••.•. __ . ________ ---- •• do ____
Sales, total U.S., adjusted ____________ do ____ Atlanta _____________________________ do. ___ Chiragot ------------------ __________ do ____ Cleve land ___________________________ do ____ Dallas ____ ---------------------- ___ . do. ___ Minneapolis ______________ ----- .1929= 100 .• New York ___________________ l925--27= 100 ..
Philadelphia. ---------------1923--25= 100 .. San Francisco _________________ . _____ do ____ Installment sales, New England dept. stores
percent to total sales Stocks, total U.S., end of month:
Unadjusted ______________ •.•• 1923-25= 100 .• Adjusted ____________________________ do ____
Mail-order and store sales: Total sales, 2 companies ....•.. thous. of doL.
Montgomery Ward & Co ___________ do ____ Sears, Roebuck & 00---------------do ....
Rural sales of general merchandise: 'l'otal U.S .. unadjusted .•••... 1929--31=100 __
Middle West• _______________________ do ____ East* __ ------------------------ ___ .. do ____ South*--------- __ -----------------_ .do .. __ Far West•. -------------------------do ____
Total U.s .. adjusted __________________ do ____ Middle West* ----------------------do .•.. , East• _ --------- __ ------ ___ ---------.do ____ South* ____________________ -------- .. do .. __ Far West*. -------------------------do ____
EMPLOYMENT
Factory, unadj. (B. L. S,)t ______ l923-25=100 __ Durable goods grouvt-----------------do ____
Iron and steel and productst _______ _cto ____ Blast furnaces, steel work<, and rolling
mills. __________________ .1923-25= 100 __ Structural and ornamental metal work
1923-25= 100 .. Tin cans. etc ______________________ do ____
Lumber and products _______________ do ____ Furniture •. _______________________ do ____ Millwork. ______ ------ __________ •. do ____ Sawmills __________________________ do. ___
Machineryt ________________ ------ ___ do ____ Agricultural implementst _________ do ____ Electrical machinery, etc _________ do ____ Foundry and machine-shop products
1923-25= 100 .. Radios and phonographs _________ .do ____
Metals, nonferrous __ -------- ________ do.---Aluminum mfrs ___________________ do ____ Brass, bronze, and copper products
1923--25= 100 .. Stamped and enameled ware ______ do ____
Railroad repair shops ______________ .do ____ Electric railroad ___________________ do ____ Steam railroad ____ ------ __________ do ____
r Revised.
SURVEY OF CURRENT BUSINESS
1937 1936 ----
April I I
March March I May I June I July I Augu·t I Septem-1 October I Novem-1 Decem-, ber ber ber
DOMESTIC TRADE-Continued
--------- 3, 509 3,4951 3,442 3,363 3, 510 3,490 3,655 --------- 350 348 349 350 349 349 349
7, 616 •6.476 7,649 8,328 8, 371 7,075 6, 925 7,443 477 472 472 472 473 473 472 472
19,823 r 16,283 19,759 20,640 21,475 18,475 19,369 22, 529 1, 500 1,481 1,483 1,483 1,484 1,488 1,489 1, 491
--------- 17.6 17.4 16.9 18.0 16.2 16. 2 16.5 ------90- 43.9 45. 1 45.8 47.6 45.6 42.1 42.8
77 85 89 84 63 68 94 135 95 100 103 92 78 96 116
74 66 74 74 76 54 54 82 102 82 89 90 88 65 75 97 95 68 89 93 84 63 72 89 \)8 87 90 95 92 71 77 109 92 80 80 82 77 5g 70 92
79 88 87 85 61 75 95 78 7l 78 80 so 62 63 87 74 66 70 74 71 52 56 71
113 95 103 no ]04 79 78 104 89 73 78 76 72 55 60 86 97 80 88 86 84 77 88 97 93 84 84 87 87 91 86 88
116 103 96 102 103 111 123 123 lo-1 89 86 90 89 91 91 95 103 78 79 87 86 83 85 86 98 91 92 91 100 102 107 103 90 84 82 86 88 81 86 88 85 83 80 85 83 82 81 84 80 73 70 76 74 70 73 79
102 88 00 90 94 94 92 93
96 9. 7 8. 5 8.9 7. 5 11.5 14.9 10.8
78 67 68 67 62 59 6.'; 71 76 65 65 66 64 64 67 68
78,025 60,926 69,413 75,219 76, 689 65,270 66,325 80,974 34,931 24,845 30,403 30,295 30,330 25,636 27,422 33,357 43, G94 36,081 39,011 44,923 46,359 39,634 38,903 47,617
117. 4 99.2 105.5 106.5 106.2 88.3 96.2 122.3 107. 1 92.8 99.2 102.3 100.1 81.0 88.6 107.0 120. 4 100.7 109.2 107.9 105.1 85.5 97.9 112.0 1-17. 5 118.4 117.6 113.6 114.0 97.9 103.3 160.6 119.0 100. 1 110.7 1!2. 8 122.7 107.7 113.3 147.7 12fi. 2 106.7 109.9 113.3 112.4 114.7 111.9 123.6 119. () 103. 1 100.7 105.4 102.6 103.9 101.3 107. 5 128.1 107.2 109.7 110.7 107.8 108.9 110.6 119. 7 158. f> 127.4 127.2 127.6 132.5 140.9 136.0 156. 7 13G. 0 114.4 119.6 I 125.4 129.8 129.8 123.1 126.3
EMPLOYMENT CONDITIONS AND WAGES
I
101.0 87.9 89.1 89.8 9o.o 80.2 82.3 84.0
106.8 85.6 87.8 90.1
117.1 92.8 95.5 98.5
74.3 57.4 60.8 65. I 100. 5 92.3 94.1 96.9 69.6 61.3 62.8 64.1 87.4 71.6 71.3 72.2 56.6 45.2 46.6 47.8 52.2 48.8 50.6 51.9
121. 4 96.9 99.6 102.4 134.9 128.8 131.1 129.1 110.8 82.1 85.5 87.5
lOG. 8 84.4 86.7 89. 1 163.0 153.8 155.8 178.0 114. 6 94.6 94.4 94.7 124.3 104.3 103.2 103.6
124.0 98.8 98.7 99.7 165.3 134.6 139. 1 136.8 62.4 58.0 57.8 58.0 64.0 62.2 62.5 62.3 62.3 57.7 57.4 57.7
00.1 I 91.2 84.7 84.6 91.4 93.0
99.7 102.8
68.4 71.0 100.9 102.4 64.8 65.6 73.6 76.9 49.7 49.5 52.0 51.9
103.6 104.0 123.6 l!O.l 89.7 91.8
90.0 91.2 200.4 193.5 95.5 94.5
107.2 110.5
99.9 100.1 138.6 135.0 58.5 56.9 62.0 62.2 58.2 56.5
I 93.51 84.7 95.3
105.7
74.8 109. 1 66.6 81.7 52.2 50.9
104.4 9.5. 7 92.4
92.5 210.7 98.4
111.0
102.7 138.4 58.4 62.4 58.1
95. 85. 97.
107.
75. 111. 68. 85. 52. 51.
107. 93. 96.
94. 21G. 102. 111.
107. 143. 59. 62. 59.
5 7 2
2
3 6 2 0 6 9 5 9 5
3 3 9 5
1 4 3 4 1
3,800 3, 542 3, 943 346 346 346
9, 333 8, 492 16,867 474 477 4i7
28,952 26,072 37,133 1, 494 1, 496 1, 496
17.8 17.0 17.3 48.4 47.1 47.0
100 105 161 119 120 187 92 85 138
104 101 164 98 100 !58
120 113 175 101 90 151 112 89 139 97 106 156 84 91 !36
137 120 204 103 89 143 98 101 171 90 94 92
100 105 110 95 93 98 92 95 96
104 97 108 94 91 94 85 90 88 74 79 76 95 95 100
10.9 9. 7 6. 3
76 80 67 69 71 71
103,590 85,993 118,222 45, 455 36, 979 51, 789 58,135 49,014 66,433
155.1 150.8 186.1 137.7 136.0 150.5 149.6 154.8 !95. 0 225.0 195.4 212.4 148.4 150.4 208.7 127. 1 122.6 131. 0 116.2 110.5 106.0 126. 2 135.1 137.5 163.6 146.9 153.9 126.8 124.8 134.2
96.7 96.9 98.1 89.2 91.0 92.7 98.9 99.3 100.4
107.9 107.7 109.3
74.9 73.2 70. I 102.7 95.8 94.4 69.2 67.8 67. 1 86.9 88.3 87.8 53.4 53.4 54. I 52.4 49.9 49.0
109.6 111.4 114.1 97.5 93.2 !02. 9 99.6 103.0 !05. 8
95.6 97.0 99.4 218.3 210.6 202.7 108.3 110.0 111.6 117.2 l!8. 8 117.7
111.3 112.9 116.2 154.3 156.0 162.4 60.4 60.6 61.2 63.4 63.3 63.4 60.2 60.4 61.0
27
1937
January I Febru-
3, 581 346
5, 626 477
15,928 I, 498
16.4 47.4
72 85 70 78 69 78 64 71 69 54 79 62 80 93
107 97 91 93 79 89 75 98
10.6
66 74
54,427 22,578 31,849
88.6 81.0 88.4
107.5 95.6
106.7 98.7
105.3 129.5 128.3
96.5 90.3
100.0
111.5
70.8 95.8 64.8 85.9 53.9 46.6
114. g 110. 5 104.0
101.3 186.8 107. 0 118.9
118. 5 154.8 61.2 63.4 61.0
ary
3,368 347
5, 617 477
14,244 1, 499
16.4 44. u
76 95 57 78 82 89 68 64 72 57 77
'63 81 95
108 97
101 105 r 86
85 75 96
12.0
72 76
53,831 22,161 31,671
93.8 85.2 95.2
123. 1 92.0
103.7 98.5
104.1 123.1 116.4
'99. 0 93.2
r 103.4
'113.
r 71.
6
8 r 98.4 '65. 8 r 8fi.l r 55. u
6 '47. 6
r 118. r 119.0 r 109.3
r 104.4 r 170.6
111.5 r 122. 2
121.7 r 159. 1
r 61.6 '63. 3 '61.5
• New series. See pp. 14-17 of the September 1936 issue for fignres for period Jan. 1929-July 1936. t Revised series. For factory employment revisions beginning January 1934, see table 12, p. 19, of the March 1937 issur. Indexes of department store sales in the Chicago
l•'ederal reserve district, both unadjusted and adjusted, were revised for the period 1923-36. Revisions not made on p. 27 of the April1937 Survey will appear in a subsequent issue.
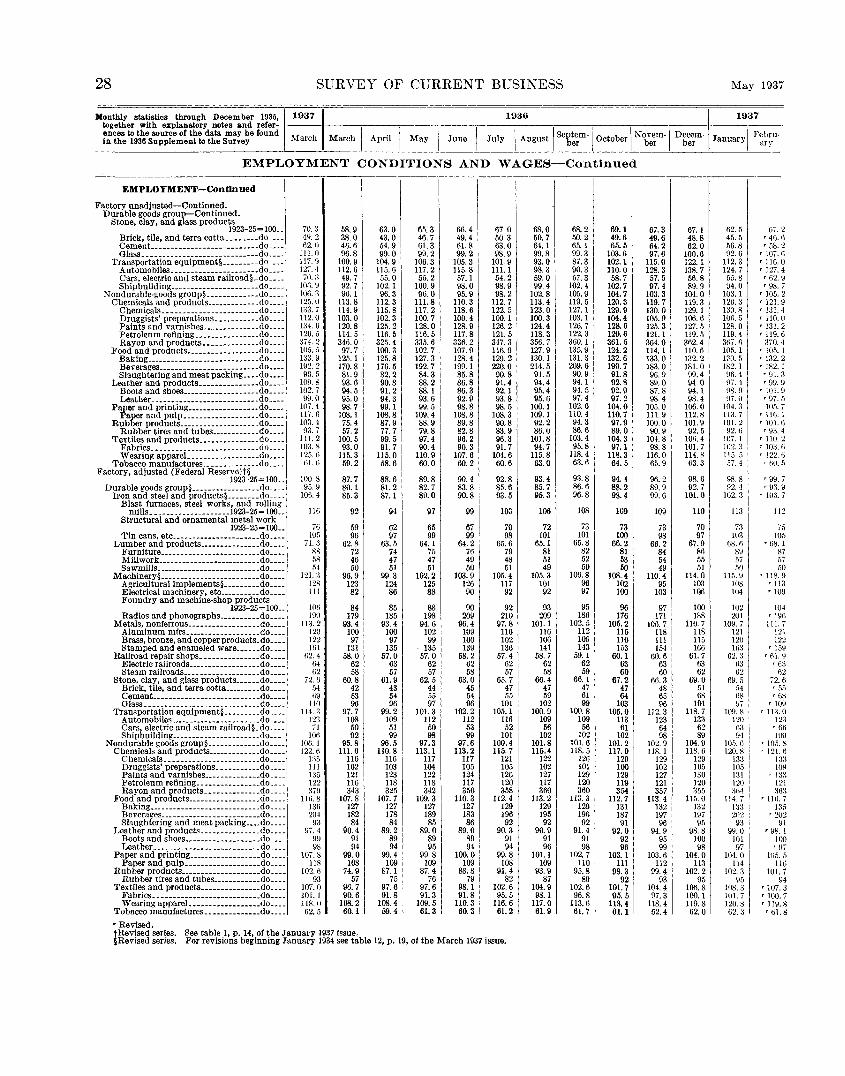
28 SURVEY OF CURRENT BUSINESS May 1937
Monlhly statistics through December 1935, 1937 1936 1937 together with explanatory notes and refer-
i:~h~ ~9~~es~:;l:~~!f~ ~~: s~;e~e found March March I April I May I June I July I August I Se~~~m-1 October I Nbe~m-1 D~~~m January I F~~~u-EMPLOYMENT CONDITIONS AND WAGES-Continued
EMPLOYMENT-Continued
Factory unadjusted-Continued. Durable goods group-Continued.
Stone, clay, and glass products .1923-25=100 ..
Brick, tile, and terra cotta •.••••.. do ___ _ Cement .•• _ ••• ____ .• __ ••. -•• -- •• --do-.--Glass •••• ________________ -------- .do.---
Transportation equipment§ .••••.... do ___ _ Automobiles •.•.•. ----------------do ___ _ Cars, electric and steam railroad§_do ___ _ Sbipbuilding ______________________ do ___ _
Nondurable-goods group§ __________ .•. do ___ _ Chemicals and products __________ ... do ___ _
Chemicals. _______________________ do.---Druggists' preparations ••.. -------do ___ _ Paints and varnishes ••.•.•.•.•.... do ... . Petroleum retining ________________ do ... . Rayon and products ••...••..•.•.. do ___ _
Food and products. ________________ _cto ___ _ Baking _____ • ____ •• _. __ •••...•• --.-do .. --Beverages .•. ___ • _____________ ••.•. do ••.. Slaughtering and meat packing .••. do •••.
Leather and products •••••••..••.••• do ___ _ Boots and shoes ___________________ do .... Leather ________ ----------- __ ----- .do .• __
Paper and printing __________________ do ...• Paper and pu!p ___________________ do .•.•
Rubber products ____________________ do ••.. Rubber tires and tubes ••••••..•••. do ••.. Textiles and products _______________ do ___ _ Fabrics. __ ------------------------ do .. --Wearing appareJ. _________________ do ••..
Tobacco manufactures .. _ -----------do ___ _ Factory, adjusted (Federal Reservelt§
1923-25=100 .. Durable goods group§ _________________ do .•..
Iron and steel and products§ ........ do ... . Blast furnaces, steel works, and rolling
mills._-----. ____________ 1923-25= 100 .• Structural and ornamental metal work
1923-25= 100 .• Tin cans, etc ______________________ do .•.• Lumber and products .•••••••.•..••. do ..•• Furniture _________________________ do .••.
Millwork •• _ ••• __ •• __ ._------- ____ .do. __ • Sawmills.----- _________ • ____ • ____ .do. __ _
Machinery§_ •• _. __ .•• _ ••••.•••.••••• do •••• Agricultural implements§ ••••••••• do ..•• Electrical machinery, etc .•...•••.• do .••• Foundry and machine-shop products
1923-25=100 .. Radios and phonographs. _________ do ___ _
Metals, nonferrous .••••••••..• ____ .• do ... . Aluminum mfrs ___________________ do .... l Brass, bronze, and copperproducts.do •••. Stamped and enameled ware ______ do .•••
Railroad repair shops •••.•••••••••.• do .•.• Electric railroads _______________ ••• do .••• Steam railroads .•.. __ ---- ________ .do ••••
Stone, clay, and glass produrts .••... do .••• Brick, tile, and terra cotta ••••••.. .do .••. Cement •.•• --••..•. --•. --. ___ ..•.. do .... Glass. ____ • ______ • ____________ •• __ do._._
Transportation equipment§ .••..... .do ..•• Automobiles _____ ----- •••• _ .•.•• ___ do .••• Cars, electric and steam railroad§.do ... . Shipbuilding ______________________ do .. .
Nondurable goods group§ _____________ do ..•. Chemicals and products .•.•..•..••.• do ....
Chemicals. __ .------ ____ -------- .. do .. __ Druggists' preparations. __________ do .• __ Paints and varnishes •..••..••••••• do ____ , Petroleum retining ________________ do ___ _ Rayon and products ______________ do ___ _
Food and products __________________ do ___ _ Baking _______ • _______ ._. ______ • __ .do ___ _ Beverages ... -- ____ ... _---- __ --- ..• do ... _ Slaughtering and meat packing .••• do ___ _
Leather and products _______________ do .•.. Boots and shoes ___________________ do ___ _ Leather_ •• __ •• _ •••••• _ ••• ______ •• _ do_. __
Paper and printing __________________ do .••. Paper and pulp ___________________ do ___ _
Rubber products ___________________ .do .•. _ Rubber tires and tubes ••.••••••••. do ___ _
Textiles and products _______________ do ____
1
Fabrics. __ ------------------------do ___ _ Wearing appareL.---- ___________ _do ___ _
Tobacco manufactures .• ---- ________ do ••..
'Revised.
2 I )
,)
70.3 4\1. 62.1
Ill.( 117.9 127.4
70. 106. lOll. 125. l:J3. 112. 134. 120. :l/4. 105. 133. 1\12. 90.
1011. 102. 99.
101. 117. 103. 93.
111. 103. 125. 61.
100. 95.
106.
11 .
9 3 ()
7 \1 6 [l 2 5 9 2 5 8 7 0 4 6 4 7 2 8 6 il
8 9 4
(j
6 1\1 5
71. 8 5 5
121. 12 11
10 19
3 8 s 4 3 8 1
(i
0 113.
12 12 ](l
2 0 2 1
62. ()
()
4 4 2
i2. 5 6
11
6 4 9 (I
:l 114. 12 7
106
3 I )
I (j
101i. 122.
1:1 11 J:l 12 :17
5 I 5 2 II 8 llfi.
13 20
9 97.
9 9
107.
6 4
11 102.
9 107. 101. 118. 62.
3 4 9 8 8 8 (i
3 0 I 0 5
58.9 38.0 46.6 96.8
100.9 112.6 49.7 92.7 96.1
113.8 114.9 103.0 120.8 114. 5 346.0 97.7
125. 1 170.8 81.9 93.6 94.5 95.0 98.7
108.1 75.4 57.2
100.5 93.0
115.3 59.2
87.7 80.1 85.3
92
59 96
62.8 72 46 50
96.9 123 82
84 179
93.4 100 97
131 58.0
62 58
60.8 42 53 96
97.7 108 50 92
95.8 Ill. 6
116 102 121 116 343
107.8 127 182 84
90.4 91 94
99.0 108
74.9 57
96.7 90.6
108.2 60.1
63.0 65.3 43.0 46.7 54.9 61.3 99.0 99.2
104.9 106.3 115.6 117.2 55.0 55.2
102.1 100.9 96.3 96.0
112.3 111.8 115.8 117.2 102.3 100.7 125.2 128.0 116.5 116.5 325.4 335.6 100.3 102.7 125.8 127.3 176.5 192.7 82.2 84.3 90.8 88.2 91.2 88. 1 94.3 93.6 99. 1 99.5
108.8 109.4 87.9 88.9 77.7 79.8 99.5 97.4 91.71 90.4
115.0 110.9 58.6 60.0
88.6 89.8 81.2 82.7 87.1 89.0
94 Q7
62 65 97 99
63.5 64.1 74 75 47 47 51 51
99.3 102.2 124 125 86 88
85 88 185 198
93.4 94.6 100 102 97 99
135 135 57.0 57.0
63 62 57 57
61.9 62.5 43 44 54 55 96 97
99.2 101.3 109 112 51 50 99 98
96.5 97.3 110.8 113.1
116 117 103 104 123 122 118 118 325 342
107.7 109.3 127 127 178 189 84 85
89.2 89.0 89 89 94 95
99.4 99.8 109 109
87.1 87.4 75 76
97.6 97.6 91.8 91.3
1~g:: I 109.5 61.3
66. 49. 61. 99.
105. 115. 57. 98. 95.
110. 118. 100. 128. 117. 336. 107. 128. 199. 85. 86. 86. 92-98.
108. 89. 82. 96. 90.
107. 60.
90. 83. 90.
4 4 8 2 3 8 1 0 9 3 6 4 9 8 2 9 4 1 8 8 3 9 8 8 8 8 2 3 6 2
4 8 8
6
99
7 9 2 6 9 0 9 6 0
9 64.
7 4 5
103. 12 9
9 20
0 9 4 9 0 9 2 2 8 0 5 4 6 2 2 3 9 6 2 7 5
96. 10 10 13
58. 6 5
63. 4 5 9
102. 11 5 9
97. 113.
11 10 1 11 24 7 0 3 7 3 6 0 9 4 0
35 110.
12 18 8
89. 8 9
100. 1
88. 09 8 9 1 8 3 3
7 98. 91.
110. 60.
67.0 50.3 63.0 98.9
101.9 111.1 54.2 98.9 98.2
112.7 122.5 100.1 126.2 121.5 347.3 116.9 129.2 220.0 90.8 91.4 92.1 93.8 98.5
108.3 90.8 83.9 96.3 91.7
104.6 60.6
92.8 85.6 93.5
103
70 98
65.6 79 48 51
105.4 117 92
92 210
97.8 116 102 136
57.4 62 57
65.7 47 55
101 105.1
116 52
101 100.4 115.7
121 105 126 120 358
112.4 129 196 92
90.3 91 94
99.8 108
91.4 82
102.6 95.5
116.6 61.2
tRevised series. See table!, P- 14, of the January 1937 issue. §Revised series. For revisions beginning January 1934 see table 12, p. 19, of the March 1937 issue.
68.0 68.2 69.1 50.7 50.2 49.6 64.1 65.1 65.5 99.8 99.3 103.6 93.0 87.3 102. 1 98.3 90.3 110.0 59.0 57.3 58.7 99.4 102.4 102.7
102.8 105.9 104.7 113.4 119.5 120.3 123.0 127. 1 129.9 100.3 103. 1 104.4 124.4 126. 7 128.6 118.3 122.3 120.6 356.7 360.1 361.5 127.9 135.9 124.2 130.1 131. 3 132.6 214.5 209.6 190.7 91.5 90.9 91.8 94.4 94.1 92.8 95.4 94.5 92.9 95.6 97.4 97.2
100.1 102.6 104.0 109.1 110.4 110.7 92.2 94.3 97.9 86.0 86.6 89.0
101.8 103.4 104.3 94.7 95.8 97.1
115.8 118.4 118.3 63.0 63.6 64.5
93.4 93.8 94.4 85.7 86.6 88-2 95.3 96.8 98-4
106 108 109
72 73 73 101 101 100
65.1 65.8 66.2 81 82 81 51 52 53 49 50 50
105.3 106.8 108.4 101 96 102 92 97 100
93 95 96 209 186 176
101.1 102.5 105.2 116 112 115 106 109 110 141 143 153
58.7 59. 1 60.1 62 62 63 58 59 60
66.4 66. 1 67.2 47 47 47 59 61 64
102 99 103 100.9 100.8 105.0
109 109 113 56 56 61
102 102 102 101-8 101.6 101.2 115.4 118. 5 117.9
122 126 129 102 101 100 127 129 129 117 120 119 360 360 354
113.2 113.3 112.7 129 129 131 195 196 187 92 92 91
90.9 91.4 92.0 91 91 92 96 98 96
101.1 102.7 103.1 109 110 111
93.9 95.8 98.3 87 89 92
104.9 102.61 101.7 98.1 96.8 95.5
117.0 113.6 113.4 61.9 61.7 61.1
67.3 67. I 62.5 67. 2 49.6 48.8 45.5 '46. 6 64.2 62.0 56.8 '58. 2 97.6 100.6 92.6 r 107.6
115.0 122. 1 112.3 '116. 0 128.3 138.7 124.7 r 127.4 57.5 56.8 55.8 r 62. \:) 97.4 89.9 94.0 ,. 98. j'
103.3 104.0 103.1 ' 105. 2 119.7 119.3 120.3 '121. g 130.0 !29. 1 130. s '131. 4 105.9 106.6 106. ,) ' 110. (I 125.3 127. 5 128.0 '131. 2 121. 1 119.5 119.4 ' 119.6 364.0 362.4 3()/. f) :J70. 4 114.1 110.6 105. 1 , 10.1. 1 133.0 132.2 130.5 '132. 2 183.0 181.0 1S2. I • 1H2.1 96.9 99.4 96.4 '91.3 89.0 94.0 97.4 '99. 9 87.8 94.1 98.9 '101. 9 98.4 98.4 97. () r 97. [l
105.0 106.0 104.3 lfl5. 7 111.9 112.8 ll:l. 7 rllt),]
100.0 101.9 101.2 '101. 6 90.9 92.5 92. (j '93. 4
10{.8 106.4 107. 1 ' 110. 2 98.8 101.7 102. :J ' JO:l. (j
116.0 114.8 115. 5 ' !22. (j 65.9 63.3 57. 4 ' fill •• )
96.2 98.6 98.8 r 99.7 89.9 92.7 112.4 r 93.9 99.6 101.0 102.3 '103. 7
109 110 113 112
73 70 7:l 7.~
98 97 10:> 105 66.2 67.9 68.6 '68.1
84 86 89 87 54 55 57 57 49 51 50 50
110.4 114.0 115.9 ' 118.9 95 103 108 '113
103 106 104 '109 I
97 I 100 I 102 104 171 I 188 201 '19ti
106.7 110.7 109. 7 111. 7 118 118 121 121 111 115 120 122 !54 166 w:; r 15Y
60.6 61.7 62. :l , 01. y 63 63 ()3 'C:l 60 62 62 62
66.3 69.0 t19. 5 72. f)
48 51 fi-t r [J!'"I
65 68 (j~ '58 96 101 Hi ' 109
112.3 118.7 109.8 ' 11~. 0 123 133 120 12:! 64 62 63 'fiti 98 89 94 lOU
102.9 104.9 !().)_ 6 • 10.1. s 118. 1 118.6 120.8 r 121. t)
129 129 133 13:l 102 105 105 109 127 130 131 • 13:l 121 120 1211 121 357 355 :Jii~ 36:l
113.4 115.0 114. 7 ,. l1tt 7 132 132 n:J 135 197 197 202 '202 96 9ii 9:) 91
94.9 98.8 99. () '98. I 95 100 101 100 99 98 97 r 97
103.6 104.0 104. 0 ](15. 5 112 113 114 116
99.4 102.2 102.3 101.7 93 95 95 94
104.4 106.8 108.3 '107. 3 97.3 100.1 1111.7 '100. 7
118.4 119.8 120.8 '119. 8 62.4 62.0 ll2. 3 rt)l,J;
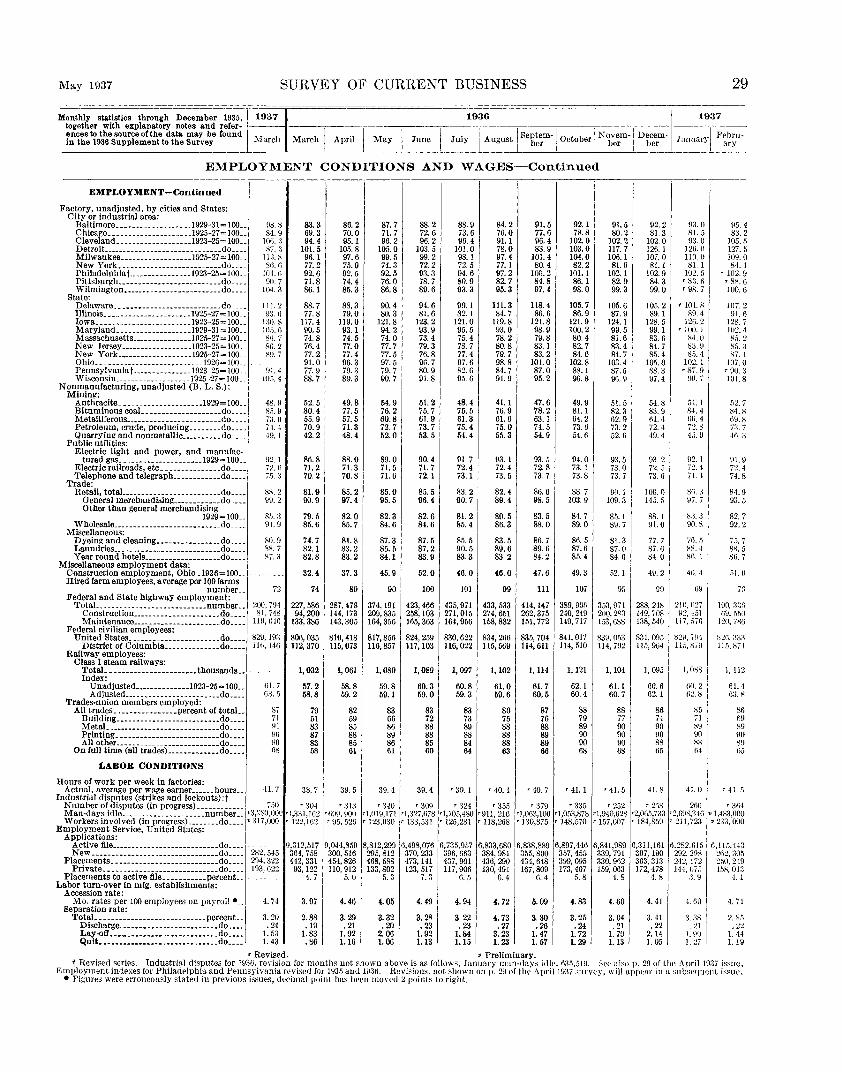
May 1937 SURVEY OF CURRENT BUSINESS
Monthly statistics through December 1935, 1937 1936 together with explanatory notes and refer- --- ---------~---------------
i::~'i.~~9~~ess:;~1!:fet:tet:~~~su"fv~efound :VIarch March I April I May I June I J~ly I August \Seb~~m·loctoheriNbe~m-1 D'bc:rm-
EMPLOYMENT CONDITIONS AND WAGES-Continued
29
1937
I Ft'llru· January ary
-----------------~----~----~----~----~----~-----.-----,-----,-----,-----.----~--------
EMPLOYMENT-Continued
Factory, unadjusted, by cities and States: City or industrial area:
Baltimore ••••.•... ------ •... 1929-31 = 100 .• Chicago •...•....•. ------ ..•. 1925-27 = 100 .. Cleveland._ •••••••.•.••...•• 1923-25= 100 .. Detroit.. ......•.•....•.•..... _._ .... do ... _ Milwaukee ...•.•••.••....••. 1925-27 = 100 .. New York •...••..•..•.••..•....•... do .... Philadelohia t ____ -·--------- .1923-25= 100. _ Pittsburgh •..•.•....••.•.•..•..•.... do_ .. . Wilmington ••••.••..•••.••••..••.... do ... .
State: Delaware ..•••••.......•. ------ ..... do._ .. Illinois •• ·------- ..•..•.•••.. 1925-27 = 100 .. Iowa ••...•..•..•............ 1923-25= 100 .• Maryland .....•....•........ l929-3! = 100 .. Massachusetts ....•.......... 1925-27 = 100 .. New Jersey •.•.•..•.•..•..... 1923-25= 100. _ New York .••••.•..•......... 1925-27= 100. _ Ohio ........ ------·--------- ... 1926= I 00 .. Pennsylvania t ............. _ .1923-25= 100 .. Wisconsin ... _ ...... __ ._. ___ .1925-27 =I 00. ~
Nonmanufacturlng, unadjusted (B. L. S.): Mining:
Anthracite .......•....•.•.....• 1929= 100. _ Bituminous coal ••••••..•••..•••..•. do .... Metalliferous .••..............•.•.•.. do_ .• _ Petroleum, crude, produciug .•..•..• do ... . Quarrying and nonmetalllc .•.•.•.••. do ... .
Public utilities: Electric light and power, and manufac
tured gas ..•..•.••.•.......•.• 1929= 100 .. Electric railroads, etc_ .•.•..••..•... do .... Telephone and telegraph ............ do ___ _
Trade: Retail, total ......................... do ..••
General merchandising ............ do .. .. Other than general merchandising
1929=100 .. Wholesale ........................... do ... .
Miscellaneous: Dyeing and cleanlng ................ do .. .. Laundries ..... _ ................... _ .do __ •. Year round hotels ................... do ... .
Miscellaneous employment data: 1
Construction employment, Ohio .1926=100 .. 1
Hired farm employees, average per 100 farms I number ..
Federal and State highway employment: TotaL ........................... number .•
Construction .•... _ .. __ ... __ ..... _. do ___ _ Maintenance ...................... do ... .
Federal civilian employees: United States ....................... do .. ..
District of Columbia .............. do .. .. Railway employees:
Class I steam railways: TotaL ...................... thousands .• Index:
Unadjusted .•••..••.•••.. 1923-25-100 .. Adjusted ________________________ do ....
Trades-union members employed: All trades ................ percent of totaL
Building .......................... do .•.. MetaL ............................ do. __ _ Printing_·······---------------- .. do .... All other __________________________ do .•.•
On full time (all trades) ............. do .. ..
LABOR CONDITIONS
Hours of work per week In factories: Actual, average per wa~e earner ______ hours __
Industrial disputes (strikes and lockouts) :t
as. 8 84.9
!(1(;. :l ~7. 3
113. X so. (l
104. (i 90. 7
10~. 3
Ill. 2 p;t 0
l:lil. 8 105. (\ ~ti. 7 86.2 :-)tl,'j
(II. 4 10.5. 4
48.ll S.l. 9 73. (I
7-1.-1 49. I
92.1 7:Z. fi 7.1. :;
~X. 2 99.2
85. ;~ 91.9
72
200, 7H4 HI, 748
11!J,(Hfi
829, 19:l Jll;, 146
01. 7 6:3. ,)
87 71 91 90 90 fi8
41. 7
83.3 69.3 94.4
101.5 96.1 77.2 92.6 71.8 86.1
88.7 77.8
117.4 90.5 74.8 76.4 77.2 91.0 77.9 88.7
52.5 80.4 55.9 70.9 42.2
86.8 71.2 70.2
81.9 90.9
79.5 85.6
74.7 82.1 82.8
32.4
74
86.2 70.0 95.1
10.5. 8 97.6 75.9 92.5 74.4 85.3
88.3 79.0
119.0 93.1 74.5 77.0 77.4 96.3 79.3 89.3
49.8 77.5 57.5 71.3 48.4
88.0 71.3 70.8
85.2 97.4
82.0 85.7
81.8 83.2 83.2
37.3
89
87.7 71.7 96.2
105.0 99.5 74.3 92.5 76.0 86.8
90.4 80.3
121.8 94.2 74.0 77.7 77.5 97.5 79.7 QO. 7
54.9 76.2 60.8 72.7 52.0
89.0 71.5 71.6
85.0 95.5
82.3 84.6
87.3 85.5 84.1
45.9 I 90!
227, 586 287,478 374, 191 94, 200 144. 173 209, 835
133, 386 143, 305 164, 356
88.2 72.6 96.2
103.5 99.2 72.2 93.3 78.7 89.6
94.6 81.6
123.2 93.9 73.4 79.3 76.8 96. 7 80.9 91.8
51.2 75.7 61.9 73.7 53.5
90.4 71.7 72. 1
85.5 96.4
82.6 84.6
87.5 87.2 83.9
52.0
100
88.9 73.6 96.4
101.0 98.1 72.5 94.6 80.9 93.3
99.1 82. I
121.0 95.5 75.4 78.7 77.4 97.6 82.6 95.6
48.4 75.5 61.3 7.5. 4 54.4
91.7 72.4 73.1 1
83.2 ) 90.7
81.2 85.4
85.5 90.5 83.3
(6. 0
10!
84.2 76.0 91. 1 78.0 97.4 77. I 97.2 82.7 95.3
111.3 84.7
119.8 93.0 78.2 80.8 79.7 98.8 84.7 91.9
4Ll 76.9 61.6 75.0 55.3
93.1 72.4 73.5
82.4 1 89.4
80.5 86.3
83.5 89.6 83.2
(6.0
99
423, 466 435, 971 433, 533 258, 103 271,015 274, 651 165, 363 164, 956 158, 882
91.5 77.6 96.4 83.9
101.4 80.4
100.2 84.8 97.4
118.4 86.6
121.8 98.9 79.8 83.1 83.2
101.0 87.0 95.2
47.6 78.2 63.1 7l.5 54.9
93.5 72.8 73.7
8!). 6 g8. 5
83.5 88.0
86.7 89.6 84.2
47.6
111
414,147 262,375 151,772
92. 1 78.8
102.0 103.0 104.0 82.2
101.1 86. 1 98.0
105.7 86.9
121.9 100.2 80.4 82.7 84.6
102.8 88.1 96.8
49.9 81.1 64.2 73.6 54.6
94.0 73. I 73.8
88.7 103.9
84.7 89.0
86.5 87.6 85.4
49.3
107
389, 96o 240, 249 149,717
806,035 810,418 817,8561' 824,259 830,622 834,266 835,704 841,017 112, 370 115, 073 116,857 117, 103 116, 022 115,569 114,611 114, 510
1,032
57.2 58.8
79 51 83 87 83 58
38.7
1, 061
58.8 59.2
82 59 85 88 85 61
:l9. 5
1,080
59.8 59.1
83 66 86 89 86 61
39.4
1,089
60.3 59.0
83 72 88 88 85 60
39.4
1, 097
60.8 59.3
83 73 89 88 84 64
'39. I
1,102
61.0 59.6
86 75 88 88 88 63
'40.1
1, 114
61.7 60.5
87 76 88 89 89 66
'40. 7
1, 121
62.1 60.4
88 79 89 90 90 68
'41. 1
91.5 80.2
102.2 117. 7 106.1 81.9
102.1 82.9 99.3
105.6 87.9
124.1 99.5 81.6 83.4 84.7
103.4 87.5 96.9
51.5 82.3 62.9 73.2 52.6
93.5 73.0 73.7
90.1 109.3
85.1 89.7
8l. 3 87. (I 84.6
52.1
353,971 200, 2~3 153,688
839, 0f>3 114,792
1,104
6Ll 60.7
88 77 90 90 90 68
r 41.5
92.2 81.3
102.0 126.1 107.0 81.1
102.9 84.3 99.0
105. 2 89.1
128. 5 99.1 83.6 81.7 85.4
105.0 88.3 97.4
54.8 83.9 64.4 72.4 49.4
93.2 7'2. 5 73. G
100.0 145.5
88. I 91.0
77. 7 87.6 8-1.0
49.2
90
288, 248 149,708 138,540
831,095 115,964
1, 095
60.6 62.1
86 74 90 90 88 6.5
41. 8
93.0 81.5 9:l. 0
12(). 0 JIO. 0 81. I
102.5 '83. (j '98. 7
' lOt. H 89.4
120.2 '100.1
8-1.0 K~t V 85.4 10~.1
r 87.9 ~19. 7
54. 1 84.4 flli. 4 7'2. :-:. 45. u
Sli. :l 97. 7
83. 3 90.8
70.5 8~ .. j 8(i.l
41), 4
)):.m,i\11 ll5, 8/0
1,088
()0. 2 ti2. 8
H.o 71 89 uo S8 f).!
41. 0
95.4 83.2
105.5 127.5 109.0 84.1
'102. 9 '88. 6 100.6
107.2 91. ti
128.7 l02. 4 85.2 :-)[), ~{
~7. I 107.0 '90. 3 101.8
52.7 84. ~ HV.H 73.7 4tl.:;
91.9 72.4 74.8
84.9 93.5
82.7 92.2
7.1. 7 8S. 5 go. 7
.11. 0
190, :;:Jr. mJ,5Ml
120, 78()
X2l;, 3:J:l 115,871
I, 112
61.4 u:;. s
X6 69 89 90 XH {)5
T 41. .')
Number of disputes (in progress)............ 750 '304 ':313 Man-days idle ..................... number .. I•3.~SO,OOO •1,331,1112 •mJV. 900
r 340 r 309 r 324 r 355 r 379 r 33fi T 252 r 2ti8 2(ii) r 3fH
Workers Involved (in progress) ________ do .... • 317,000 '122,162 '95, 526 Employment Service, United States:
Applications: Active file ........................... do .... -New ................................ do.... 282,545
Placements ........................... do .... 294.322 Private ............................. do..... 193,622
Placements to active file ........... percent .. Labor turn-over in mfg. establishments:
Accession rate: Mo. rates per 100 employees on pavroll •--
Separation rate: · I TotaL ........................... percent ..
Discharge ............... _ .•••. __ •• do •••• Lay-<Jff _____________ .............. do ... . Quit ................... __ .......... do._ ..
4. 74
3. 20 . 24
1.53 1. 43
9,312,b!7 364,758 442,331 93, 122
4. 7
3. 97
2.88 .19
1. 83 .86
9,044,859 300,516 454,826 110,912
5. 0
4.46
3. 29 . 21
1.92 1.16
rJ,OH.I,171 rJ,:~27,678 rJ,l05,-l80 '911, 216 rJ,063,100 rl,Q53,878 '1,940/128 r2,055,7~{3 r2,G9S,34ii P 1,4R3,000 '123,030 '133,531 '125,281 '118,268 '1:30,875 '148,570 '157,007 '184,859 '211,723 p 233,000
8,812,299 295,812 468,588 133,802
5. 3
4.05
3. 32 .20
2. 06 1.06
6,498,076 370,233 473, 141 123, 517
7.3
4.49
3.28 .23
1.92 1.13
6,735,957 396,663 437,901 117,906
6. 5
4. 94
3. 22 .23
1.84 1.15
6,833,680 384,981 436,290 130,491
6. 4
4. 72
4. 73 . 27
3. 23 1. 23
6,838,889 355, 800 434, 648 167,809
6. 4
5.09
3.30 .26
1. 47 !.57
6,897,446 6,841,989 357, 455 339, 791 399, 095 330, 962 173, 407 159, 063
5. 8 4. 8
4. 83
3. 25 .24
1. 72 1.29
4.60
3. 041 . 21 1. 70 1.13
6,311,161 307, 190 303, 313 172,478
4. 8
4. 41
3.41 . 22
2.14 1. 05
6,282,615 292. 2(1>\ 242, 172 144. 075
:l. 9
4.1i0
3. :Js . 21
1.90 L :!7
6,ll.'l,44:1 21\2, 30.1 250,249 1.18, (il:l
4. I
4. 71
2.S!i . 22
I.H L 19
'Revised. • Preliminary. t Revised seri~s. Industrial disputes for H/36, revision for months not shown above is as follows, January man-days idle, 6:l5,519. Se<' alsop. 29 of the April1937 issue.
Employinent indexes for Philadelphia and Pennsylvania revised for HJ35 and uno. Revisions, not shown on p. 2~ of the Aprill9:H ~III'VPY, will appear in a subsNtuent issut~. • Figures were erroneously stated in previous issues, derimal 11oint has lwen moved ~ points to right.

30 SURVEY OF CURRE~T BUSINESS
Monthly statistics through December 1935, to- 1937 1936 gether with explanatory notes and references ---
I I i
I I August I Septem-1 Ortot er I Novem-1 Decem-to the source of the data may be found in the :vi arch 1936 Supplement to the Survey March April May I June July
1 lber J
1ber ber
EMPI,OYMENT CONDITIONS .A.ND WAGES-Continued I '
PAY ROLLS
Factory unadjusted (B. L. S.)t .• 1923-25=100 .• 101.2 77.6 79.3 80.8 81.1 80.2 83. 5 83.6 89.0 90.7 95.1 Durable goods groupt-----------------do .•.. 99.8 71.8 76.0 78.5 79.0 75.9 77.0 77.2 85.3 88.9 93.1
Iron and steel and pro<luctst •...••.. do .•.. 112.9 75.4 79.7 83.0 84.6 81.8 86.8 87.1 93.2 95.8 102.0 Blast furnaces, steel works, and rolling
mills .. ---------- __ ...... 1923-25=100 .• 127.8 83.1 89.1 92.9 94.5 92.5 98.1 97.7 101.8 105.0 115.4 Structural and ornamental metal work
1923-25= 100 .. 72.6 46.3 50.7 56.3 60.4 61.3 65.5 66.0 68. 5 65.5 65.7 Tin cans, etc ______________________ do .•.. JO:J. s 90.8 90.6 94.8 98.1 98.4 108.8 112. 5 97.2 92.2 93.5 Lumber and products .•••..•••••••.. do .•.. l 64. 1 50.3 52.3 54.4 55.8 5i. 5 58.9 60.3 63. 5 60.8 60.5
Furniture ___________________ ••.•.• do ..•.
1
70 4 55.1 55.6 56.1 58.7 59.9 68.4 71.1 76.9 77.6 78.3 Mill work. ------------------------do .•.. ,12. f) 37.6 39.5 42.0 44.0 42.3 46.9 46.5 49.8 49.6 50.7 Sawmills ..• _ •• __ •• ________ •• _. __ •• do .••• 47. 3 40.4 42.9 45.1 45.4 43.3 44.8 45.8 47.1 42.7 41.6
Machineryt •..... ----------------- .• do ..•. 1
125. !1 86.R 9!. 2 94.7 95.8 92.8 93.9 94.7 102.7 105.6 113.6 Agricultural implementst .•••••... do .... 1G9." 143. g 145.9 142.4 131.4 108.3 91.5 87. 1 105.9 102.0 121.5 Electric machinery, etc ____________ do ..•• 111.9 72.7 78.3 81. l 83.3 82.9 82.6 84.3 92.7 96.8 103.1 Foundry and machine shop products
111.6 75.4 82. ,) 83.7 1923-25= 100 •. 79.4 81.4 83.9 85.0 90.2 93.3 100.2 Radios and phonographs __________ do •••• 127.1 104.9 112.8 135.6 154 9 143.3 1M. 7 160.9 177.9 169.4 167.5
Metals, nonferrous .••••.•• __ ------- .do .•.• 111.8 77.6 77.8 79.0 79.9 77.4 82.9 88.0 99.7 102.0 105.5 Aluminum mfrs ___________________ do .... 130.5 93.2 91.8 91.8 94.3 96.1 100.4 98.9 110.6 114.9 114.7 Brass, bronze, and copper products
1923-25= 100 .. 127.7 80.0 81.1 83.9 83.8 82.8 89.4 95.2 102.9 103.8 111.6 Stamped and enameled ware ••••.• do .•.. J(i~l. 0 121.5
127.41 122.6 124. 6 115. G 123.5 12:3.0 154.4 155.0 1M. 2
Railroad repair shops •........•..•.. do ..•. t/5. 8 60.9 5R. 6 59.5 60.1 56.0 57.7 59.2 63.9 65.2 65.5 Electric railroads .••.• ----------- .• do .. __ 67. 2 63.6 62.5 62.7 61.9 61.7 61.3 61.3 63.5 65.5 67.4 Steam railroads ___________________ do ..•. 65.9 60.8 58.4 59.4 60.1 55.7 57.5 59.1 64.0 65.4 65.6
Stone, day, and glass products ...... do ...• 65.' 48.2 52.4 55.6 55.8 55.3 58.3 58.2 62.5 61.1 59.1 Brick, tile, and terra cotta ________ do .... 42.6 28.0 32.3 36.91 39.3 39.1 40.3 39.4 41.3 41.1 40.9 Cement..-·---------------. ___ ••.. do ..•. 5:1.6 39.3 47.3 54.5 56.3 58.0 60.2 61.0 62.0 63. 1 58.8 Glass. ___ . ______________________ •• do .••• 1l1i. 0 87.7 90.7
91.61 90.5 87.7 92.8 91.2 103.0 99.4 95.1
Transportation equipment i ......... do .••. UZ.O 87.0 99.9 101.6 9.). 7 92.6 81.0 if>. 3 95.8 113.4 120.9 Automobiles ______________________ do ••.. 130.1 94.4 109.1 111.1 107. 1 99. ,; 83.4 77.3 101. ,; 125.8 135.7 Cars, electric and steam rallroadt_do .••• 79. (l 46.0 52.4 51.6 51.0 50.5 55.3 52.6 59.7 57.6 59.9 Shipbuilding------ __ .• ____________ do ...• !IIi. 4 90.9 102.2 102.3 98.1 99.0 97.8 99.4 103.2 97.3 90.6
Nondurable goods groupt------------·do .••• !1)1.1 84. g 83.5 83.8 83. g 85.6 91.8 91.6 93.7 92.9 97.6 Chemicals and products __________ .. do ..•. l2q. 4 104.5 103.8 105.4 105.4 106.4 108. 1 112.0 114.4 114.7 118.3
Chemicals ________________________ do ___ . 140. g 107.1 109.1 111.3 113.3 114.9 117. 7 120. 1 124. 7 127.5 132.5 Druggists' preparations. __________ do .••. 121.4 106.5 104.3 102.1 99.4 100.8 105.2 107.2 112.6 112.7 112.5 Paints and varnishes _____________ _cto .••. 1:32. R 108.7 114.2 120.2 120.9 113.8 113.5 111.0 119.6 116.8 121.6 Petroleum refining __ --------------do ____ 125.8 109.6 108.2 110.0 112.3 114.7 112.2 116.3 115.9 119. 1 119.5 Rayon and products •••....••••.•• do ..•• 350.4 282.0 269.0 273.3 276.8 287.8 300.1 302.4 307.6 298.2 321.3
Food and products __________________ do ..•• 104. 1 90.2 go. a 95.7 98.9 107.0 114.0 116.5 111.5 lOS. 3 105.7 Baking .. ---------- __ •• ___________ do .••• 124.5 109.5 1118.9 112.9 115.1 116. 1 116.2 117.9 119.0 120.4 119.8 Beverages ... _______ • _________ •.•• _ do. __ • 210.7 180.5 186.7 214.3 220.7 266.4 237.1 227.1 198.9 191.3 187.6 Slaughtering and meat packing .•. do ____ 91.4 75.0 74.6 78.6 81.2 86.7 87.5 85.1 88.7 99.8 101.5
Leather and products _______________ do ____ 92.5 73.1 67.7 63.8 64.6 74.2 80.3 75.7 74.0 67.3 78.3 Boots and shoes ___________________ do .••• 89.1 69.2 62.0 56.5 57.8 70.3 77.2 70.7 67.4 58.2 71.4 Leather_. ____ ---- ______________ ••• do •••• 107.4 89.0 89.7 91.0 89.8 89.9 94.0 95.5 99.0 100.8 105.0
Paper and printing _________________ do ____ 104 3 89.3 89.8 90.7 89.2 86.6 89.4 92.0 96.5 98.6 102.6 Paper and pulp ___________________ do .•.• 116. 3 94.2 95.5 96.3 9.).1 92.5 96.9 95.2 101.9 104.5 108.6
Rubber products ... _________ • ______ • do ___ • 10~. g 66.7 82.8 86.4 89.0 87.1 90.8 92.2 96.8 101.2 104.8 Rubber tires and tubes ••.••••••••. do ..•. 105.4 55.6 79.8 86.1 89.5 88.5 91.6 91.9 93.8 98.9 99.7
Textiles and products ..•..•.•..••.•. do ..•. 103.2 85.7 81.3 78.2 76.8 ' 77.3 87.4 83.9 88.5 87.2 91.6 FabricS----------------------------do .... 97.5 78.7 77.2 75.2 75.2 77. 1 83.0 80.5 85. 1 86.7 96.8 Wearing appareL -----------------do .••• 110.2 96.0 86.2 80.9 76.6 74.3 92.4 87.0 91.5 84.6 86.3
Tobacco manu!actures .......•.•..•. do •••. 53.1 46.5 44.0 48.5 50.1 51.0 53.5 53.3 54.7 54.8 55.4 Factory, unadjusted, by cities and States:
City or industrial area: 92.9 Baltimore •• _______ .-----•••. 1929-31 = 100. _ 118.5 80.9 85.4 91.3 92.7 85.3 96.9 99.8 101.9 104.0
Chicago_ --------------------1925-27 = 100 .. 70.6 52.2 52.3 54.2 55.7 56.4 58.5 58.4 61.2 62.7 65.0 Milwaukee •• _ •• --------------------do ____ 118.1 87.0 89.3 89.5 9!.5 87.6 89.5 90.3 103. 1 103.6 103.9 New York._. _________________ ...... do ..•. 81.0 69. 1 65.0 63.4 61.2 62.4 68. 1 69.0 71.5 70.9 72.4 Philadelphiat _ •• __ ------ .... 1923-25= 100 .. 103.0 80.6 77.4 80.5 82.0 83.0 89.2 88.8 94.1 94.3 96.9 Pittsburgh._.----_. ____ • ________ •.•. do .• __ 123. 4 75.5 88.7 90.3 94.4 93.3 96.6 98.3 105. 1 101.0 110.9 Wilmington._._. ______ ----- __ • __ ._. do ___ • 104. 7 75.6 76.5 79.1 82.\l 84.8 89.8 90.5 93.6 96.4 98.\l
State: Delaware .•... ---- ------------- __ ... do .•.. 97. I 69.9 70.8 73.5 76.9 79.4 86.9 90.5 87.3 89.2 91.4 Illinois. ___ ------------------1925-27 = 100 .• 81.2 60.8 61.3 62.8 64.4 63.8 66.4 66.9 70.4 71.9 74.6 Maryland. __ ···<---- ________ 1929-31 = 100 .. 110. 3 R4.4 88.4 93.2 9<1.3 94.2 89.4 100.2 103.1 103.0 106.0 Massachusetts ....•• _ •••• ___ .1925-27 = 100 .. R5. 3 65.3 66.0 65.4 64.0 66.6 70.1 70.3 71.4 73.6 79.9 New Jersey ____ ------------ .. 1923-25= 100 .. 84.4 66.4 67.4 68.8 70.0 69.4 72.0 71.8 75.5 77.3 81.6 New York .• ________________ 1925-27= 100.- Sti.l 67.2 66.4 66.6 66.3 67.5 71.0 72.3 75. 2 75.1 79.1 Pennsylvania t ____ ••. ---- ••.• 1923-25= 100 •. 97.7 69.1 73.0 74.6 76.4 76.8 81.7 82.6 87.7 86.4 91.1 Wisconsin. _________________ .1925-27 = 100 .. 105. !J 79.2 79.0 80.4 81.8 79.7 82.6 82.7 91.7 92.7 93.7
Nonmanufacturing, unadjusted (B. L. S.): Mining:
56.3 42.0 37.2 34.9 Anthracite •... ___ • ____ ._._ .• __ •. 1929 = 100 ... 37. s 42.6 28.6 31.4 48.5 40.3 55.4 Bituminous coaL ___________________ .do .••. 88.4 70.2 02.6 62.2 61.5 62.6 65.4 71.0 79.2 80.7 85.0 Metalliferous .•••. _. __ • ___ ..•• _. ___ ••. do .••. 71.3 45.1 45.5 47.7 48.2 46.1 48.2 50.0 53. 7 54.6 57.7 Petroleum, crude, producing ________ do ____ 64.6 56.0 57.1 58.0 58.9 fil. 4 59.7 60.4 59.6 60.1 61.3 Quarrying and nonmetallic __________ do .•.. 41.3 30.9 36.1 42.1 44.0 43.9 46.2 44.8 46.2 43.5 39.4
Public utilities: Electric light and power and manufactured
95.6 85.91 86.2 87.0 88.1 89.8 89.8 91.4 92.7 91.8 93.8 gas._. __ --------------- _______ 1929= 100. _ Electric railroads, etc .. _------- ..•.• do.--- 69.2 67.R 65.9 66.1 66.81 66.5 66.5 66.4 67.7 69.7 69.3 Telephone and telegraph ____________ do ..•. 87.1 77.2 76.0 78.5 77.4 7\l. 9 81.2 78.8 83. 1 81.6 82.4
May 1937
1937
January I Fehru-
90.6 86.5 99.4
115.9
63.3 94.4 54.9 71.4 47.3 37. 1
110.0 130. A 97.0
98. 7 145.4 97.1
114.7
113.1 148.4 61.2 64.5 61.1 52.5 36.2 49.6 83.8
100.6 108. I
58. 8 96. 1 95.9
119.5 131.8 113. I 120.3 119.5 333. I 100.4 118.4 186.9 95.8 8,). 8 81.8
102.5 98.7
109. g 99.0 93.9 94. 7 96.0 ss. 2 47.2
104.0 55.8
104.6 72.2
'97. 3 •106.1 •90. 7
89.4 74. 7
106.4 80.3 79.1 78.6
•89.4 939
42.7 80.0 57.9 61.0 34.9
92.1 68.3 84.0
ary
r95. 92.
•103.
rll9,,
r 67. •99.'
5 I 2 )
r 5~. r 7j, (
r 50. •39.
4 7
•118 .. •139. r 107.'
•105. ( r 12-±.'
103.' 121.
'120. r 15-'1. ( '63 •64. '63. r 5\}.' ,;
9 r 3i. • 52.1
, 107 .• •112. r 12l. • 66. r97. (
3 R 7 u 9 6 2 3 2
,gg_' 123.
r 135.' •119 r 127. 1
•122. I 344 .. ;,
3 9 3 4 9 9 6 5 5 4 3
101. '12!. •189 .. rs.~.
90. •87.
•104. •100. •113.' •104. '101. •100.1 •97.
'100. •52.
108. fo8.
108.
6 9 6
75.'
6 4 2 0
4 8 6
•99. '117.
98.
91 78.
110. 82. n 80.
•94. 100.
41. 82. 63. 63. 37.
92. 6R. 82.
3 0 5 9 2 7
0 4 \1 3 4
5 8 2
r Revised. tRevised series. Factory pay rolls, for revisions beginning January 1931, see table 13, p. 19, of the l\Iarch 1937 issue. Pay-roll indexes for Philadelphia and PennsylYania
revised for 1935 and 1936. Revisions not shown on p. 30 of the April 1937 Survey will appear in a subsequent issue.

May 1937 SURVEY OF CURRENT BUSINESS -
Monthly statistics through December 1935, to- 1937 1936 gether with explanatory notes and references
March I I
I I I At' gust I Septem-1 October I Novem-1 Decem-to the source of the data may be found in the 1936 Supplement to the Survey March April I May June July • · ber ber her
EMPLOYMENT CONDITIONS AND WAGES-Continued
PAY ROLL8-Continued
Nonmanufacturing-Continued. Trade:
Retail, totaL----·------ ________ 1929= 100. _ General merchandising ____________ do ___ _ Other than general merchandising_do ___ _
Wholesale ______ ••• ___________ • ______ do ___ _ Miscellaneous:
Dyeing and cleaning ________________ do ___ _ Laundries. ____ ---------------------do ___ _ Year round hotels ___________________ do ___ _
WAGE8-EARNINGS AND RATES
Factory, weekly earnings (25 industries) (N. I. C. B.):
70.6 87.7 07.1 75.0
61.6 77.5 7:l. 6
All wage earners ____________________ dollars.. 27.49 Male:
Skilled and semiskilled ____________ do ___ _ Unskilled _________________________ do. __ _
Female. ___ -----·--·---------- ______ do. __ _ All wage earners __________________ 1923=100 ..
Male: Skilled and semiskilled ___________ do ___ _ Unskilled __________________ • ______ do. __ _
Female. __ ------_--------- __________ do ____ • Factory average hourly earnings (25 industries) I
(N. I. C. B.): All wage earners .. ---·--·-··-·-·----dollars ..
Ms~~hed and semiskilled ____________ do .•• .l Unskilled. __ -------_------------ .. do ____ !
Facfo~~a~eek'fiearniilis-,-lii'Eiiaies:·---do ____ l Delaware _________ ------_ ••••.• 1923-25= 100 __ : Illinois. ___ --------------------192;;...27 = 100 .. 1 Massachusetts ..•••.••••.• __ ••• ________ do. __ _ New .Jersey ----··----···-------1923-25= 100 .. New York--.----···-------··---192;;...27: 100 __ 1
Pennsylvama .••..• ------------1923-25-100 .. Wisconsin .• --------------·----192;;...27 = 100. _
Miscellaneous wage data: Construction wage rates (E. N. R.):§
Common lahor .•••.•••••.• .dol. per hour __ Skilled labor---------------------- .. do ___ _
Farm wages, without board (quarterly)•
30.82 22.41 17. 24 103.3
!CO. 0 100.6 100.0
.659
. 7:l4
. 535
.4!4
\)2.0 94. 1 !!S. :;
109.3 ~5. 9
104.8 1()0. 2
. 612 1. 25
63.5 77.3 60.7 69.0
56.4 69.9 66.0
23.67
26.43 19. 14 15.24 89.0
85.8 8.5. 9 88.4
. 611
. 67fJ
.4Da
. 429
83.1 84.2 87.2 97.1 87.0 87.7 88.4
.547 1.13
dol. per month .. --------- ---------Railways, wB!(es (average) ..•. dol. per hour .. --------- • 676 Road-building wages, common labor, on
public works projects: United States ______________ dol. per hour.. (b)
East North CentraL •..•••.•••••• do____ ( >) East South Central _______________ do____ (') Middle Atlantlc __________________ do____ (') Mountain States __________________ do ..•. j (b) New England---------------------do____ (') Pacific States .•• ------------------do ••.. l ( ') South Atlantic ____________________ do.... (') West North Centra!_ _____________ do.... (') West South CentraL _____________ do... (')
Steel industry wages: I U.S. Steel Corporation 1----------.do .... l .575 Youngstown district .. percent base scale •.• ---------
Acceptances and com'! paper outstanding:
.37 • 62 . 30 • 48 . 55 . 50 • 59 .32 . 47 • 36
.485 115.0
65.3 81.0 62.1 67.9
64.1 70.9 66.3
24.33
27.18 19.60 15.15 Ul. 4
88.2 88.0 87. g
. 613
.680
.496 • 430
84.6 83.5 88.5 97.9 85.7 91.9 87.9
. 552 1.13
30.87 • 670
.38
.57
.30
.46
:g~ I .57 .33 .46 .37
.485 115.0
65.8 80.8 62.7 68.2
72.2 75.6 67.0
66.4 81.3 63.3 68.4
69.2 75.8 66.6
24.41 24.45
27.32 27.31 19.67 19.74 14.98 15.00 91.7 91.9
88. 7 88.6 88.3 88.6 86.9 87. 0
. 616 • 617
• 684 . 685 .498 .496 . 432 • 429
85.8 85.8 84.2 85.0 88. 3 87.0 99.0 98.6 85.9 86.3 92.6 93.2 87.7 88.0
. 558 . 064 1.14 1.14
.670
.42 • 56 .30 . 45 . 57 . 48 .M • 34 .48 .35
.485 115.0
• 663
.42
.54
.30
.46
. 56
.47
.55
.33
.49
.36
.485 115. o I
FINANCE
65.1 77.3 62.6 09.0
64.8 79.0 66.0
26.88 19. 56 15. 14 •90. 9
87.2 87.8 87.8
.617
.684
.498
.428
84.4 84. 1 88.1 98.5 87.2 91.5 83.2
.~54 1.15
32.21 .664
.42
.56
.30
. 46
.56
.50 • 54 .33 .49 .36
. 4851 117.0
64.4 76.4 61.9 69.7
63.2 76.7 66.1
•24. 76
27.49 20.04 15.93 •93.0
89.2 89.9 92.4
•.619
.683
. 495
.429
82.3 84.4 89.4 99.5 89.0 95.0 89.4
.569 1.16
• 665
.41
.54
.30
.47
. 57
.49 • 51 . 32 . 50
.~:I 117.0
66.6 82.8 63.3 70.5
66.1 76.6 67.5
•25.18
28.16 20.25 15.87 •94. 6
91.4 90.9 92.1
. 619
. 687
.496
.430
80.5 83.1 87.9 96.4 87.0 93.4 86.3
. 569 1.16
• 672
.42
. 58
. 31
.47
. 56
.48 • 56 .32 .50 .34
.4851 117.0
68.3 87.2 64.4 71.5
66.7 75.3 69.6
25. 51
28.55 20.72 16.06 95.9
92.7 93.0 93.2
.619
. 6'l9
. 498
. 431
811.9 87.2 88.6
101.9 88.9 97.5 94.0
. 583 1. 18
32.81 .667
.42
.60
. 33
.48
.55
. 51 • 53 . 33 .50 • 35
.485 117.0
70.1 91.4 65.7 73.1
60.2 74.5 69.6
•25.98
29.03 21.20 16.23 •97.6
94.2 95.2 94.1
.624
.696
.505
. 431
89.0 88.0 90.0
103.5 88.7 97.3 95.1
.583 1.18
76.0 116.8 67.5 72.8
-07.3 76.1 69.8
•26.63
30.27 21.88 16.92 100.1
98.2 98.2 98.1
•.637
. 711
. 517
.436
91.6 89.8 95.3
107.6 92.7
101.3 95.8
.586 1.18
.686 . 683
. 41 • 39
.63 .61
.30 .30
.48 . 50
.53 .50
.47 .45 • 52 . 51 .31 . 31 •• 51 . 50 . 34 .32
. 505 . 525 125.0 125.0
31
1937
January I Febru-
68.0 83.5 64.8 72.7
55.3 76.5 71.0
26.11
29.88 21.65 16.72 98.1
97.0 97.2 97.0
. 638
. 715
. 515
. 438
90.0 90.9 95.~
105.3 92.1 99.4 94. 1
. 603 1. 24
31.37 . 688
.39
.65
.30 • 53 .60 .40 . 57 . 31 . 50 .36
.525 125.0
ary
67.7 82. f)
64.6 74.0
54.3 76.2 72.3
•26. 68
•30. 02 •21. 94 '17.00 •100. 3
•97.4 r98. fi •,98. 6
'· 642
.718
.518 • 440
89.6 92.6 96. I
106. 7 92.9
102.4 98.8
.603 1. 24
. 696
(b) (b) (') {b)
(b) (b) (b) (b) (b) (b)
.525 125.0
BANKING I Bankers' acceptances, totaL ... mills. of doL. 396 359 344 331 316 316 308 315 330 349 373 387 401
Held by Federal Reserve banks: 0' . For own account. _________ mills. of doL.-------------------·--··--- ________ _! _________ ---·---·--·-·--·-----··-----·--···-----·----------------·---------------For foreign correspondents ________ do____ --------- ------·-·
Held by group of accepting banks: TotaL. ____________________ mills. of doL.
Own bills. -------------·-·------do .• __ Purcha·sed bills. ------------·---do ___ _ Held by others ______________________ do ___ _
Com'! paper outstand!ng ______________ do ...• Agricultural loans outstanding:
Grand totaL _______________ ---·--·---.do •.• _ Farm mortgage loans, totaL ••...••• do ___ _
Federal land banks _______________ do •••. Land bank commissioner _________ do ___ _
Loans to cooperatives, totaL •....... do ___ _ Federal intermediate credit (direct)
mills. of doL. Banks for cooperatives Incl. Central
Bank ____________________ mills. of doL. Agricultural Marketing Act revolving
fund ••••••••••••••••••••. mills. of doL
317 1.>0 166 80
290
3,374 2, 8~:2 2, 058
834 110
57
52
321 150 171 38 1~0
•3, :;as 2, 878 2, 060
818 87
2
41
44
310 143 167 34
174
3,362 2,885 2,062
823 85
2
40
44
297 155 142
34 184
•3,375 2,890 2,063
827 82
40
42
276 129 147 40
169
3, 381 2,891 2,064
827 84
• Revised. • Less than 1 million dollars. & Data temporarily discontinued by reporting sourec. § Construction wage rates as of Apr. 1, 1937...::common labor, ~0.612; skilled labor, $1.25. 0' Since April1935, Federal Reserve banks have held no bankers' acceptances. • Farm wages as of Apr. I, 1937, $34.16.
278 131 147 37
188
•3,387 2,894 2,065
829 88
43
44
279 140 139
29 205
'3,384 2,899 2,067
832 89
44
44
276 139 137 39
197
•3, 382 2, 902 2,068
834 105
(•)
56
49
296 150 147 34
199
•3, 378 2, 903 2,008
835 123
71
51
309 157 152 40
191
•3,371 2, 902 2,066
836 130
73
315 151 164 57
215
•3,362 2,901 1,064
837 125
2
70
54
1 Basic rate for common labor.
325 154 171 62
244
•3,352 2,898 2,061
836 120
64
341 161 180
61 268
•3,353 2,896 2, 060
836 114
60
52

32
Monthly statistics through December 1935, together with explanatory notes and references to the source of the data may be found in the 1936 Supplement to the Survey
I BANKING-Continued
Agricultural loans outstanding-Continued. Short term credit, totaL _______ mills. of doL_
Federal intermediate credit banks, loans to and discounts for:
Regiom1l a~ricultural credit corps.', prod. crcdtt uss'ns and banks [or eoopera-tives _____________________ mills. of dol _
Otber financing institutions _______ do ____ Production credit ass'ns _____________ do ____ Hegional agr. credit corp ____________ do ____ Emergency crop loans _______________ do ____ Drougbt relief loans _________________ do ____
Joint stock land banks in liquidation ... do ____ Bank debits, totaL _____________________ do ____
New York City _______________________ do ____ Outside New York City ______________ do ____
Brokers' loans: ToN. Y. S. E. members ______________ do ____ By reportingmember banks:
To brokers and dealers in New York City mills. of doL_
To brokers and dealers outside New York Ci!.y ____________________ rnills. of doL_
Federal Reserve banks, condition, end of mo.: Assets (resources) totaL _______ mills. of doL.
Reserve bank, credit outstanding, total mills. of dol. __
Bills bought_ ____________________ _do ____ Bills discounted _____________ ------ do ____ United States securities ___________ do ____
Reserves, totaL ____________ ----- ____ do ____ Gold _______________ ------ _________ do ____
Liabilities, total. _____ ----------- ______ do ____ Depooits, totaL ____________________ do ____
Member bank reserve balances, total mills. of doL
Excess reserves (estlmated) _______ do ____ Notes in circulation _________________ do ____
Heserve ratio ________ ------ _______ percent. ___ Federal Heserve reporting
condition, end of month: member banks,
Deposits: Demand, adjusted ___________ mills. of doL Time ___ ------ __ ----- ______________ do ____
Investments, totaL ___________________ do ____ U.S. Government direct ohli!(ations.do ____ U.S. Government guaranteed issues.do ____ Other seeurities ___ ------ _____ ----- __ do ____
Loans, totaL __________________________ do ____ Acceptances and commercial paper .. do ____ On real estate _______________________ do ____ To banks ___________________________ do ____ On seeurities ___ ------ _________ -----_do. ___ Other loans_------------------------ do ____
Interest rates: Acceptances, bankers' prime _______ percent__ Bank rates to customers:
In New York City ___________________ do ____ In eight otber northern and eastern cities
In twenty-seven southern percent__
and western cities ___________________________ percent __ Call loans, renewal (N.Y. S. E.) ______ do ____ Com'! paper, prime (4-6 mos.) _______ .do ____ Discount rate, N.Y. F. R. Bank _____ do ____ Federal Land Bank loans _____________ do ____ Intermediate credit bank loans ________ do ____ Time loans, 90 days (N. Y. S. E.) _____ do ____
Savings deposits: N.Y. State savings banks _______ mills. of doL_ U. S. Postal Savings:
Balance to credit of depositors _______ do ____ Balance on deposit in banks _________ do ____
FAII.URES
Commercial failures: Orand totaL ______________________ number __
Commercial service, tota!_ __________ do ____ Construction, totaL ________________ do ____ Manufacturing, totaL ______________ do ____
Chemicals and drngs ______________ do ____ Foods _____________________________ do ____ Forest products ___________________ do. ___ Fuels. ____________________________ do ____ Iron and stee!_ ____________________ do ____ Leather and leather products ______ do ____ Machinery ________________________ do ____ Paper, printing, and publisbing ___ do ____ Stone, clay, and glass ____________ _cto ____ Textiles ___________________________ do ____ Transportation equipment _______ _cto ____ l M i'cellaneous _________ ----- ______ _do ___ .
Retail trade, totaL _________________ do ____ Wholesale trade, totaL _____________ do ____
•Revised.
SURVEY OF CURRENT BUSINESS
1937 1936 ---
March March I April I May I June I July I August I Septem-1 October I Novem-1 Decem-
ber ber ber
FIN AN CE-Continued
I i
I I I
I
•3n I 3i3 '392 '403 '106 '405 '396 '375 r 35:2 '3:l9 '336
144 1231 133 140 144 146 144 139 136 132 130 42 r 4H r Fil r,t};) ',)j r .~5 ':,s r 50 '44 '41 '41
1:ll 116 128 135 13U 141 136 122 111 105 105 24 40 39 38 36 35 33 31 29 26 25
115 104 112 114 114 112 111 lJO 107 105 104 60 64 63 63 63 62 62 62 61 61 60
126 162 158 154 151 147 145 142 139 136 133 42,003 37,496 34,783 33, 225 37,505 34,816 31,169 33, 242 37,313 35,869 45, 896 20,:198 19,629 17,286 16, 227 18, 623 16,199 14,363 15,656 17, 171 17, 394 22, 658 21,605 17,867 17,497 16,998 18,882 18, 617 17, 106 17,586 20,142 18, 475 23,238
I, 159 997 1,064 970 989 967 974 972 975 984 1. 051
9581 990 1, 064 1,032 1, 154 973 907 972 93:l 969 1, 047
241 220 209 238 253 220 205 222 220 212 242
12, 3:l9 11, 127 11, 184 11, 266 11, 571 11,629 11,621 11,862 12,057 12,208 12, 525
2,458 2, 473 2, 475 2,474 2, 473 2, 462 2, 471 2, 473 2, 476 2,453 2, 500 :l 5 5 3 3 3 3 3 3 3 3
12 8 5 5 4 4 8 9 6 7 3 2,130 2, 430 2, 430 2, 430 2, 430 2, 430 2. 430 2,430 2, 430 2,430 2, 430 9, 141 8, 027 8, 049 8,132 8,385 8, 503 8, 579 8, 659 8, 914 9, 048 9,121 8, 856 7, 680 7, 717 7, 837 8,119 8, 210 8, 312 8, 397 8, 662 8, 810 8,865
12,339 11, 127 11, 184 11,266 11,574 11,629 11,621 11,862 12,057 12,208 12, 525 7,186 6,497 6, 524 6, 574 6, 585 6, 758 6, 800 6, 844 7, 035 7, 068 7,109
ll, u:m 5, 087 5, 486 5, 719 5,633 6,005 6, 410 6,357 6, 753 6, 78S 6, 606 1, 398 2,305 2, 664 2, 866 2, 717 3, 029 1, 950 1, 840 2, 175 2, 236 1, 984 4,174 3, 764 3, 762 3. 795 4, 034 3, 978 4, 018 4,049 4,116 4,199 4, 284 80.5 78.2 78.3 78.4 79.0 79.2 79.3 79.5 79.9 80.3 80.1
13,578 14, 258 14,580 14,679 14,850 14, 867 15, 340 15,126 15, 116 15, 464 15,571 5, 144 4,909 5, 047 5, 035 5, 011 5,015 5,032 5, 063 5, 065 5, 037 5, 067
12,907 13,229 13,452 13,522 14, 159 14.084 13,809 13, 929 13, 796 1:;, 647 13, 742 8,:196 8,643 8, 802 8,909 9,510 9, 456 9, 263 9, 336 9, 274 9,173 9,241 1,199 1, 265 1, 281 1, 305 1, 289 1, 272 1, 236 1, 256 1, 257 1, 246 1, 238 3, :ll2 3, 321 3,369 3, 308 3, 360 3,356 3, 310 3, 337 3, 265 3, 228 3, 263 9, :l!lo 8,392 8, 343 8, 626 8,460 8,2\14 8,4541 8, 753 8, 721 8,812 9, 189
410 352 346 315 315 319 318 311 313 324 351 I, 1fi7 1,144 1, 141 1,147 1, 145 1,144 1, 145 1, 139 1,143 1,152 1,156
81 88 67 92 62 58 65 112 53 63 66 3, 3.56 3, 313 3, 304 3, 486 3, 3\D 3,173 3,177 3, 242 3,179 3, 20.1 3,326 4, 362 3, 495 3,4R5 3, 586 3, 619 3,600 3, 749 3, 919 4, 033 4, 068 4. 290
~i6-9i6 ~· ~· ~- ~li Ji-?i• :
%• %• %• ~~. %• I
2. 50 2.61 2. 54 2.51 I 2. 44 2.44 2. 42 2.40 2. 46 2. 43 2. 43
3.60 3. 47 3. 45 3. 51 3. 61 3. 47 3.45 3. 50 3. 34 3.47 3. 46
4. 15 4. 44 4. 40 4. 43 4. 39 4.35 4. 25 4. 29 4. 23 4. 24 4.14 1.00 , 75 • 75 • 93 1.00 1.00 1.00 1.00 1. 00 1.00 1.00
% % ~4 % % % ~· % ~4 % ~ 1. 50 1.50 1. 50 1.50 1. 50 1. 50 1.50 1. 50 1. 50 1. 50 1. 50 4. 00 4.00 4. 00 4.00 4. 00 4.00 4.00 4.00 4.00 4. 00 4. 00 2. 00 2.00 2.00 2.00 2.00 2.00 2.00 2.00 2.00 2.110 2.00 jl' 1 1 1-IH 1>4 H4 1H 1H H4 IH 1~ ,4
5. 278 5, 204 5,175 5,165 5, 210 5,197 5,197 5, 223 5, 210 5, 201 5, 246
1, 216 1, 215 1, 214 1, 232 1, 244 1, 249 1, 251 1, 271 1, 255 1, 257 1, 260 120 221 216 211 203 172 166 162 158 •145 132
H20 946 830 832 773 639 655 586 611 688 692 ;j\ 47 38 35 43 34 37 39 35 29 32 72 51 32 46 36 42 36 43 34 46 43
126 158 161 146 143 131 104 107 105 139 141 4 2 5 5 11 4 6 2 6 2 5
10 50 37 33 35 37 30 33 23 43 36 8 11 12 11 11 6 6 14 9 11 15 1 3 4 2 3 6 1 1 2 3 4 6 5 7 0 5 6 6 8 3 4 6 5 4 9 7 8 8 2 3 3 2 10 R 6 2 6 7 5 7 6 4 8 9
111 17 13 17 13 7 10 7 14 11 11 .> 7 4 1 2 6 2 1 6 5 3
22 27
481 26 27 22 18 20 17 30 27
I 3 2 8 1 2 3 2 4 6 2 16 23 18 21 20 22 13 10 14 14 13
481 602 506 533 479 365 408 328 382 409 398 90 88 93 721 72 67 70 6D 55 65 78
May 1937
1937
Jauu-
I Febru-
ary
•3:H
12f> I '40 10fi
24 1114
fiO l:lO
39,479 19,091i 20,383
1,026
(l64
240
12, 297
2, 497 :J :l
2, 430 9,156 8,8o2
12,297 7, 257
6, 781 2, 1.12 4,160 80.2 '
15,493 5, 077
13,638 9, 149 1. 214 3, 275 8, 941
392 1, 151
60 3, 238 4,100
Ho-H
2. 50
3. 36
4.16 1. Oil
% 1.50 4. 00 2.00 IH
5, 24!
1, 266 121
R11 42 45
136 8
34 9 0 R 7 9
10 3
25 1
22 49R 00
ary
'31:
131 '11 II. 2
w: f>l
121 34,52 1n. ~o, 17,62 0
1, 07.
1, 021
2:;
12, 3:ll
2, 41i;
2. 4%( J 4 I! )
9. 1:l 8. 85.
12, 3:ll 7, 17
6,1i9. 2, 07 4. 191 so.
15,50 5, 16
1~. 59 9,06 1, 20
1 7 7 7 8 2 1
3, 32' 9,12
41 1, 14'
8 3, 2HI 4, 19
?11
2. 4
3. 4'
4. ], 5 0 i ) )
)()
1.11 ;;
1. -~1 4.1H 2.1 n
:;, 24
1, 27 0 8 11
72 ,,. I 2 l 0
4: 12
3 7 3 3 6 5 4 8 )
5 f, 'J II H 8
21
1
1 43
6

May 1937 SURVEY OF CURRENT BUSINESS 33
Monthly statistics through December 1935, to- 1937 1936 1937 gether with explanatory notes and references
March I I I I to the source of the data, may be found in the
March April May June July I August I Septern·l October I Novem·l Decem- January I Febru· 1936 Supplement to the Survey ber ber ber ary
FINANCE-Continued I I
I I
FAILURES-Continued I
Commercial failures-Continued. Liabilities:
Grand totaL. ............... tbous. of doL 10,922 16,271 14,157 15,3751 9,177 9, 904 8, 271 Commercial service, totaL ________ do .... 529 650 567 494 638 1, 314 502 Construction, totaL ______________ do .... 2,138 4, 484 l, 570 4,816 1, 050 1,873 1,498 Manufacturing, totaL ............. do ..•. 2, 744 4, 371 4, 959 2, 709 2, 541 2,347 1, 852
Chemicals and drugs ............ do .... 109 21 108 9[1 i 95 51 225 Foods ... -----_------- .. ---- ..•.. do .... 958 707 762 389 I 509 329 340 Forest products ................. do .... 11.5 248 169 264 394 62 209 Fuels ........................... do .... 150 1, 546 122 94 78 84 35 Iron and steeL .................. do .... 123 90 154 124 162 586 112 Leather and products ........... do .... 62 51 140 108 244 128 33 Machinery .................. __ .. do ...• 340 218 93 128 228 1~9 205 Paper, printing, and puhllshing.do .... 243 322 1,020 374 147 112 176 Stone, cluy, and glass ........... do .... 99 146 808 4 7 94 12 Textiles ........... _ .... __ . ____ •• do .... 319 568 625 406 356 373 253 Transportation equipment. ..... do .... 3 47 110 517 8 83 101 Miscellaneous ................... do .... 223 407 848 211 313 316 151
Retail trade, totaL ............... do .... 3, 927 5, 503 5, 581 5, 933 3, 535 3, 197 3, 255 Wholesale trade, totaL ............ do .... 1, 584 1, 263 1,480 1,423 1, 413 1, 173 1, 164
LU'E INSURANCE
(Association of Lift Insurance Presidents) I Assets, admitted, totaL .......... mills. of doL. --------- 19,354 19, 435 19, 539 19,640 19,775 19, 875
Mortgage loans, totaL ................ do .... --------- 4, 279 4, 256 4, 234 4, 220 4,198 4, 188 Farm .. --------- __ .. -----.--------- .do_ ... --------- 773 7(i5 759 752 746 739 Other __ .. ___ •• ___ ................... do .... --------- 3,506 3,491 3,475 3,468 3,452 3,449
Bonds and stocks held (book value), total mills. of doL ... --------- 9,412 9,508 9,639 9, 795 9, 908 10,015
Government ........................ do .... --------- 4,018 4,076 4,170 4, 293 4,352 4, 419 Public utility _______________________ do .... --------- 2,022 2,043 2,049 2,060 2,105 2,130 Railroad ............................ do .... --------- 2,60~ 2,629 2, 651 2, 6.57 2,635 2,643 Other ............................... do .... --------- 764 760 770 786 816 823
Policy loans and premium notes ...... do .... --------- 2, 713 2, 705 2,699 2, 690 2, 676 2, 667 Insurance written:
Policies and certificates, total number thousands .. 1,175 1,147 1,113 1, 096 1, 079 1, 045 1,003
Group ... ____ ...... -- ............ __ . do .... 51 32 30 47 37 M 29 IndustriaL .......................... do .... 862 890 868 821 805 767 771 Ordinary ............................ do .... 262 226 216 228 237 223 202
Value, totaL .................. tbous. of doL. 917,780 771, 311 741, 366 749, 138 768,076 749, 491 6fl8, 638 Group .............................. do .... 77,956 56,213 37,213 59,130 42,095 79,323 39,540 IntlustriaL ......................... do .... 253,087 246, Oll 244,356 2'30, 464 233,333 220,672 221,692 Ordinary ............................ do .. __ 581,737 469,087 459, 797 459,544 492,648 449, 496 407,406
Premium collections, totaL ............. do .... 285,221 259,941 248,049 250,655 251,841 255,954 2'35, 996 Annuities ............................. do •. __ 31,807 30, 781 30, 487 30,380 27,571 32,673 26,182 Group ....................... __ ........ do .... 12,925 9, 790 10,679 9, 365 9, 700 10,047 (l, 054 IndustriaL .............. __ ............ do .... 6~,397 58,223 47,959 55,009 58,926 51,522 58,685 Ordinary-------- ................ __ ... .do .... 174,092 161, 147 158,924 155,901 !55, 644 161, 712 142,075
(Life Insurance Sales Research Bv,reau)
Insurance written, ordinary, totaLrnills .of doL. 604 525 506 I 504 533 513 452 Eastern district ....... ____ ...... __ .... do .... 253 222 210 211 224 208 175 Far Western tlistrict. ................. do .... 63 56
561 54 58 57 56
Soutllern district. ..................... do .... 71 62 62 60 62 63 57 Western district. ...................... do.... 217 185 178 ' 179 189 185 164
Lapse rates ...................... 1925-26= 100 .. _________ --------- ---------:---------1 99 --------- ---------MONETARY STATISTICS I
I I I Foreign exchange rates: I
. 330 I . 331 I I Argentina .............. dol. per paper peso .. . 326 . 331 .334 .335 • 335 Belgium ..................... doL per hclg:a .. . lfi8 • 170 .169 . lfl9 .169 .169 • 169 BraztlO ------ ______________ doJ. per mtlrets __ . 087 . 085 • 086 . 086 • 086 . 085 . 085 Canada .............. doL per Canadian doL. 1.001 • 998 . 995 . 998 .997 . 999 1. 000 Chile ......................... dol. per pest>-. .052 . 051 .051 .051 . 051 . 051 . 052 England ......................... dol. per£ .. 4.89 4.97 4.94 4.97 5.02 5. 02 5. 03 France ....................... dol. per frenc .. . 0<16 .0~6 '066 .066 .066 .066 .066 Germany ______________ dol. per retchsruark .. . 402 • 404 . 402 • 403 . 403 .403 .402 In<lia ........................ dol. per rupee .. . 31~9 . 37.5 . 373 . 375 . 379 . 379 . 379 Ita1y,A._ ........................ dol. per lira .. _ .o5:l .oso . 079 • 079 . 079 . 079 . 079 Jnpan ... -·---------------------dol. per yen __ . 285 . 2R9 . 289 . 291 . 294 . 293 • 2<J4 Netherlands ___________ ...... dol. per florin __ . 547 • 6F4 1 . 679 :m1 .677 .681 .679 Spain§ ------------------··--dol. per peseta __ .061 . 137 • 137 . 137 . 137 . 136 Sweden_ ..................... dol. per krona __ . 252 . 256 . 255 • 256 0 259 . 259 0 259 l:ruguay ______ ---·------------dol. per peso._
Gold: . 788 . 800 . 798 . 797 . 797
I . 798 . 797
Monetary stocks, U. S ......... mills. of doL ll, 502 10, 172 10, 202 10,324 10,514 10,629 10,674 11ovement, foreign:
Net release from earmark, ... thous. of doL -399 9G9 -155 -3,248 -24,781 2, 293 -11,945 Exports ............................. do_ ... 39 2, 315 51 5 77 695 32 Imports .................. ----------·do .... 154,371 7, 795 28, 106 169,957 277, 851 16, 074 67,524 Net golrl imports including ~old released
from earmark •------------thous. of doL. 153, 933 6, 449 27,900 166,704 2[·2, 993 17,672 55,547 Produelion, Rand .............. fine ounces .. 933, 7'i'U 912,G:m 938,050 944, 165 967,993 954,517 Receipts at mint, dornestic .. __________ do .... 185, 71i8 156, 435 163, 674 lSI, 140 157, 081 264, 140 228,557
]\1oney in circulation, totaL ..... mills. of ctoL. 6,391 5, R57 5, 892 5, 918 6,062 6, 203 6, 191
I Quotations partly nominal. • Less than $1000. ' Largely nominal.
§Quotations nominal beginning July 31, 1936. No quotation from Sept. 22 to 30, and from Nov. 1 to 13, 1936. A Quotations nominal tllrouRb Apr. 1, 1936. 10r increase in earmarked gold (-). • Or e'ports (-). • Revised.
9,819 8, 266 557 501
1,148 573 3, 212 3,469
148 423 487 1, 391 377 378 45 43
190 89 208 33 403 65 258 405
5 103 848 211
27 94 216 234
3, 391 2,888 1, 51~ 835
19,997 20, 119 4,172 4, 167
733 726 3, 439 3,441
10,098 10, 227 4, 437 4, .534 2,183 2, 230 2, 647 2, 640
831 823 2, 661 2, 653
952 1,067 30 35
725 809 198 223
630,831 715,261 35, 601 40,507
208,001 232,465 387,229 442,289 22,>, 4% 239,313 20,555 27, 101 10,109 9, 046 52,490 54, 734
137,332 148,432
426 491 168 201 49 52 56 62
153 176 --------- --------·
.336 • 327 I, 169 .168 • 086 .087
1.000 1.000 • 052 . 0,)2
5. 04 4. 90 .063 .047
'.401 • 402 I. 380 .370 I. 079 '.055 I. 294 .286 1.662 .536 .123 .090
'· 260 . 2.03
! . 797 . 799
I 10,764 10,983 I
-28,805 -11,253 42 117
171, 866 218,929
143,019 207, 559 967,328 977,425 237, 630 273,318
6, 258 6,321
11,532 12,288 8, 661 287 478 32G
2, 781 I, 601 1,015 3, 631 3,121 2, 502
27 27 81 1, 273 774 575
254 329 188 122 57 0 96 48 339 28 696 139
386 234 65 582 144 148 221 145 27 371 477 674 107 69 6 164 121 260
3, 901 3,135 3. 746 932 3,953 1, 012
I 20,380 I 20.239 20, 5lti
4, !58 4,166 4,142 720 718 708
3,438 3,448 3, 434
10,346 10,642 10, 709 4,606 4, 789 4, 871 2, 241 2, 364 2,32'3 2, 645 2, 641 2,6fi2
854 848 863 2, 647 2, 641 2. 632
1,090 1,058 893 29 54 25
853 777 670 208 227 197
709,051 805,077 670,276 43, !24 80,570 42,051
236, 846 216,363 195, 405 42!),081 508, 144 432,820 240,380 360,242 262,037 25, 592 67,687 35,512 9, 261 11,892 10,000
57, 440 100,271 57, 28() 148,087 180,392 159,239
478 561 462 W6 221 201
52 61 43 60 71 54
170 208 164 --------- 97 ---------
I . 325 . 327 0 327 .169 • 169 .lfiH .087 .087 • Ob7
1.001 1. 001 1.0110 . 052 . 052 .OG'2
4.89 4. 91 4. Ul • 046 . 047 .0<17 • 402 . 402 .402 .369 . 371 . 371 • 053 . 053 • O!i3 . 286 • 285 '· 28.0 .540 .546 • 548 . 088 . 077 . 071 .2.02 • 253 . 253 .800 . soo • 789
11,116 11,220 11,310
2, 956 -6681-48, 330 127 99 11
75,962 57,070 121,336
78, ;n 56,303 72,995 944, 783 970,030 9SG, 208 220,645 196,248 19:l,079
6,401 6, .>63 0,400
J Official rate.
I
I
9, 77 I 9 9 1 6 7 9 1 8 3 I 2 6 7 1 0 1 I
I, 16 1, 27 2, il
6 1, 01
4 29
2 G'
25 27 3
19 31 13
3. 57 1, 04
20, GO 9 7 3 4
4.12 70
3, 42
J0,SG 4,um
7 )
J 8 0 3
2, 34( 2, fi7
88 2, 62
9.) 2 8 1 2 5 7 1 7 2 7 6 7 2
2 71 21
711.82 40,24
212,23 459,34 252,16 27,29 11, 18 56.91
156, 76'
48 21
8 3
4 " 8 5 17 2
--------
• 32 . IG'
6 iJ 7 0 2
.08 1.00 . 05
4.89 .04 .40 . 37 . 05
'· 28
7 2 0 3 5 7 7 2 9
. 51
. 06
. 2.>
. 78
11, 39.
-8,00 0 (')
120,32
112,32 922,94 155,33
6, 36
6 1 2 9

34 SURVEY OF CURRENT BUSINESS May 1937
Monthly statistics through December 1935, to· get her with explanatory notes and references to the source of the data may be found in the 1936 Supplement to the Survey
MONETARY STATISTICS-Continued
Silver: Exports ....................... thous. of doL Imports .. _ .......................... _. do .... Price at New York ......... _dol. per fine oz .. Production, world ......... thous. of fine oz ..
1937
March
346 5,589 .451
Canada ..•.. _ .. _ ................. ___ do ..•. --------· Mexico ........... _ .. _ •••.....•..•... do •.•. ---------United Rtates_ .......... __ .......... do .... ---------
Storks refinery, end of month: United States ......... ______ ........ do .... ---------Canada_ ................ _ .. _ .• _ .... _ do ..... ---------
CORPORATION PROFITS
(Quarterly)
Federal Reserve Bank of New York: Industrial corporations, total (168 cos.)
mills. of doL. ______ _ Autos, parts, and accessories (28cos.).do .... ________ _ Chemicals (13 cos.) .................. do .... ________ _ Food products and beveral(es (19cos.).do .... ________ _
(17 cos.) ___________________ miJls. of doL ________ _ Machinery and machine manufactures I Metals and mining (12 cos.) ......... do .... ________ _ Oil (13 eos.) ......................... do .... _______ __ Steel (11 cos.) _______________________ do .... ________ _ Miscellaneous (55 cos.) .............. do .... ________ _
Telephones (net op. income) • ......... do .... ________ _ Other public utilities (net income) (53 cos.)
mills. of doL ________ _ Railways, class J (net income), ________ do .... ________ _
Standard Statistics Co., Inc.:t Combined index, unadjusted (161 cos.)
1926=100 ..
Railroads (26 cos.) __________________ do .. ..
p ~l. 3 v (12. 1
p 1. .) Industrials (120 cos.) ................ do.---~·
Utilities(!.> cos.) ____________________ do .... v !:37.4 Combined inrlex, adjusted (161 cos.) ... do ___ _
Industrials (120 cos.) ................ do ___ _ Railroads (26 cos.) ................. .do .. .. Utilities (15 cos.) .................... do .. ..
PUBLIC FINANCE (FEDERAL)
v :3.3. 4 p 97. f)
27.8 P l2S'. :J
Deht, ~ross, end of month ....... mills. of doL. i 34, 72S Obligations fully guaranteed by the U. S. j'
Government: Amount outstanding hy agencies, total [
mills. of doL 4, unr, Federal Farm Mortgage Corporation.do ....
1
1 1, 422 Home Owners' Loan Corporation ... do.... o 09'' Reconstruction Finance Corporation_do ____ l -· ~~2
E>pen<litures, total (incl. emergency) tho us. of doL_ 971. G!i3
Re,Tennes, totaL ___ w ____________________ do ____ ll, 130,513 \'u;:;;toms ________ ----------------------do____ 52, .1n:~ Internal revenue, totaL _______________ do ____ ~;1;; 0~::?
Income tax __________________________ do ____ \ oso; CO::; Taxes from: 1
Ad.n:issions to theaters, etc ________ do ____ i l, 530 Capital stock transfers, etc ________ do. ___
1 :). 040
Sales of produce (future delivery)_ do____ ~~12 Sales o!ra<lio sets, etc ______________ do ___ . i 301
Reconstruction Finane~ Corporation loans out- 1 standing end of month: '
Orand t.otaJ. __________________ thous. of doL.I2,(!1il,9l~ Section 5 as amended, totaL ________ do __ .__ fiGS, 585
Bank and trust companies including re-(•eivers _ --~---- -------- __ tho us. of doL-~17S. 3Hi
Building and loan associations _____ do____ :2, o~:f: lnsuranee companies __ : ___________ do____ ~. Rfi:l l'vlortga~e Joan companieSw ________ do____ 1213, 3~30 Railroads incl. receivers ........... do .... l 310,31\7 All other under section 5 .......... do ....
1
l7,Gl3 Total Emergency Relief Construction Act,
as amended ............. thous. of doL.! 57fl, D~3 Self-liquidating projects ...... _ .... do .. __ 200, 6a7 Financing of exports of agricultural sur-~
pluses ................... thous. of doL 47 Financing of agricultural commodities ,
and livest.ock ........... thous. of doL.j 81,101 Amounts made available for relief and
work relieL ............. thous. of doL.! ~89, 228 Total, Bank Conservation Act, as amended
thons. or doL.! ii~!l. 522 Other loans and authorizations ...... do.... 189.852
March I April I May I June I 1936 I 1937
July I August I Septem-1 October I Novem-1 Decem- January I Febru-ber ber ber ary
237 8,115 . 448
21,259 1,845 6, 840 5, 329
I, 757 755
FIN AN CE-Continued
535 4, 490 . 449
19,497 1,499 5, 783 5, 046
1,834 638
203 4,989 . 449
19,772 1, 276 6, 710 4, 754
1,316 691
548,518 172,538
47
179, 517
197 23,981
.448 21,374 1,450 7,157 5, 293
1,151 409
269.2 123.7 41.4 20.1
10.9 3 0
I.>. 6 25.3 29.2 57.3
138 143 6, 574 16,637 . 448 . 448
20,008 21,504 1,662 ], 543 6, 457 7. 850 4,616 4, 733
1, 101 1, 535 345 317
::::::::r::::::: 4~:g :::::::::[:::::::::
'88. 8 _________ ! _______ __
'1,0~: ~ ,:::::::=:1:::::::::
;l~~j : ~~;~~~~~t~~~~j 108.8 ---------1---------1
' I I 33, 779 ! 33, H4 ' 33,380
528,682 564,487 IG8, 489 174, 249
47 47
163, 732 93,777
296, 4161296, 414 296, 4H
8<2, !94 I sz1, 704 722,910
290,223
706,395 174,806 1.)0, 071 152, 792 169,368
204 8,363 . 448
21,846 1, 726 7, 078 5, 524
779 545
295,995
702,151 177,395
268 4111 26,931 4,451
.448 .454 21,614 21,339 2,083 I, 357 5, 417 6,400 6,391 5,561
1, 247 985 510 403
295,759 295,657
236 2,267 .454
'19, 594 1, 619 3, 748 6, 1G5
1,050 1,023
283.5 97.2 50.9 22.4
11.3 fl. 3
13.0 3g, 2 43. 2 6~. 2
31,407
295, 655
695,987 6\l1, 987 684.046 181, 510 182, 792 182, 135
612 611 2,846 14,080
. 449 . 448 23, 165
1, 252 1, 539 8, 765 5,409 4, 965
1, 347 970 1, 512 754
-------- ·[· ---------- -------~- ----------- ------~-- ----------------1--.-------
~~~~~ ~~J=~~~~~=~ :
---------I-------~·
3-±, .)02
4, 687 1, 422 3,013
252
fl07,41S 32n.o:H 4t),.jl~
2(1~, 4;~ 4o, 2-tt~
1n1, 52-l 2, :1<:9 4,015
130.343 3,1:5, fiG2
25, ;(n
r,:;o, 04.5 1~8. 339
47
13G, 30;j
295,354
663, !~: 181, ~J5
3-t, 601
4, (il)7 1, -12~ 2, 993
252
645,053 330.310
41, 72G 237, S~6
C4, 035
184,030 2, 214 3. 935
129, 71D 34;J, -H7
25. 096
(i30, 918 20t, 839
47
13\1,1373
29), 354
f)4f!, :jl',:3 IS3, 744
• Number varies. • Deficit. v Pro1iminary. • Re>ised. \ Figures shown on o. 1\4 of the 193fl Supplement are in thousands of dollars instead of in millions as the box head indicates. t Data revised for 1935 anrl 1936. Revisions not shown above will appear in a subsequent issue.
•Latest quarter estimated.
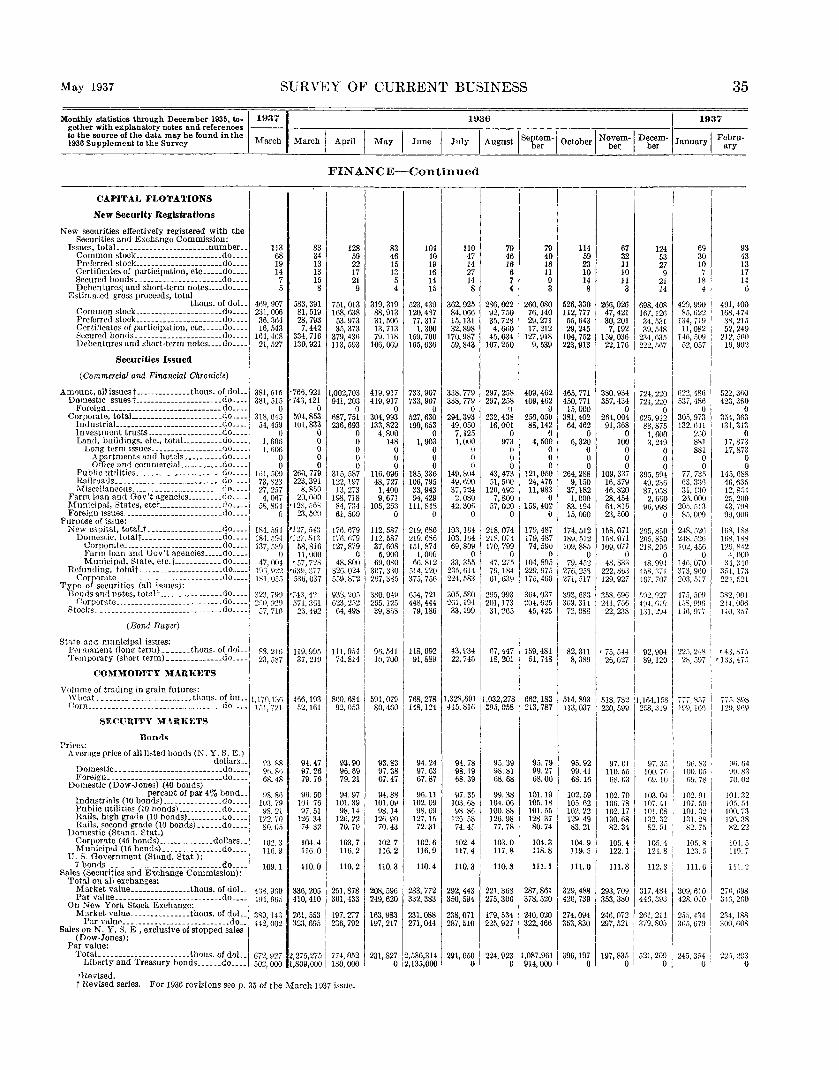
May 1937 SURVEY OF CURRENT BUSINESS
Monthly statistics through December 1935, to- 1937 1936 gether with explanatory notes and references
March I I I I to the source of the data may be found in the
March April May June July I August I Septem-1 October I Novem-1 Decem-1936 Supplement to the Survey ber ber ber
FINANCE-Continued
CAPITAL FLOTATIONS
New Security Registrations
New securities effectively registered with the Securities and Exchange Commission:
Issues, totaL. ---------------------number .. Common stock .... -------- _________ .do .... Preferred stock .... ----_. ____ . __ ••... do .. __ Certificates of participation, etc ..•.. do .... Secured bonds. ---------------------do .•.• Debentures; and short-term notes .... do ....
Estimated gross proceeds, total tho us. of doL.
Common stock ____ ------------------do ... . Preferred stock ____ ---------------- .. do ... . Certificates of participation, etc ..•.. do ... . Secured bonds __ --------------------do .•.. Debentures and short-term notes .... do .•..
Securities Issued
(Commercial and Financial Chronicle)
Amount, all issues t--------------thous. of doL. DomestlC ssues t ----------------------do .•.•
Foreign __ --------- .• ---------------- do ....
c1;{;f~~[~~f~_t_a_l~~==::::::::::::::::::: ~~:::: Investment trusts·--------- ____ ..... do ..•• j Land, buildings, etc., totaL ..•••.... do ..... 1
Long term issues __________________ do .... i Apartments and hotcls ••.•...... do ____ ,
1
Office and commerciaL •...•••.. do .... Public utilities ... _ ..• ----- .• _______ .do .. __ Railroads .. _________ .. ------------- .do.---~ Ivriseellaneous _______________________ do ___ _
Farm loan and Gov't agencics ..••..... r!o ___ _ Munidpal, States, etct----------------do .•.. i Foreign tssues ____________ -------- _____ do ____ l
Purpose of issue: , Kew capital, totaLt -------------------do .... l
Domestic, totalt ..•... ------------ .. do .... l Corporate _________________________ do __ .. ~. Fann loan and Gov't agencies _____ do ___ _ Municipal, State, etc.t------------ do ___ _
Refunding, totall----------------------<10 .•.. 1
Corporate _____________ --------- ____ .do ___ _ Type of securities (all ie,ues;: I
Bonds and notes, total t ---------------.do ....
8 t~~{~"~"!~~==: ::::: =: ::::::: =: :::: =: =~~= ::: i (Bond Bu.yer)
113 68 19 14
7 5
4tl9, 907 2:ll, OOii
36, 364 !6, 543
164, 468 21,527
381,515 381, 515
0 318, 6!3 54,459
0 1. 606 1, 606
0 0
!Gl, 500 73,823 27, 257 4, Oll7
58,801 0
!R4, .o91 184, 534 137 5S9
• 0
47,00! l~ll, 922 lSI. o.;,;
83 34 13 13 15 8
583,391 81,519 28,793 7,442
334, 716 130,921
•766, 921 •743, 421
0 594,853 101,833
0 0 0 0 0
260,779 223,391
8, 850 20. ono
•128, 56") 23, 5CU
'127, 54~ rJ27, ,54;3
58,816 !1,000
.. b7, 728 'l);)~i, :-;i7
53fi, 037
323, i9!l ·743, 42 2r:0. B~D 571, 3Gl 57, 71H 23, 4U2
128 59 22 17 21 9
751, 013 168, 638 53,973 35,373
379, 436 113,593
1,002,703 941,203
0 687,751 236,693
0 0 0 0 0
315, 587 122,197 13,273
198,718 84, 7:H 61,500
176, li79 176, 679 127,879
0 48,800
826.024 5j9, 872
93S. 20.1 623,2.12 64, 498
St~re and municipal issues: I Permanent (long terrn) _______ thous. of doL.I ss. 216 119,995 !11, 954 Temporary (short term). _____________ do____ 23,587 37,219 74,814
COMMODITY l\IARKI<~TS i Vol nnw of trading in grain futures:
WheaL_---------------------- tlwus. of bu •. 1,170, 13G 456, 193 800, f,~4 Corn __________________________________ do ____ 151,721 52,161 92,053
SECURITY MARI{ETS
Bonds I Prires:
Avenge price o!alllbted bonlls (N.Y. S. E.) I dollars __ ,
~~;~~~~c ~ :::::::::::::::::::::::::: g~::::! Domestic (Dow-Jones) (40 bonds) I
percent of par 4% bond._ lndustrlals (10 bonds) ___ •. _ .. _ ....•. do ...• Public utilities (10 bonds) ..•......... do .•.. : Hails, high grade (10 honds) ......... do ..... l Rutls, second grade (10 bonds) .••... do ____
1
03. ~K 95. s•; 68.48
98. 8G IO:l. 79 98.21
122. 70 so. 05
Domestic (Stand. Stat.) I Corporate (45 bonds) ______________ dollars__ 10~. 3 Municipill (15 bonds)_ ______________ do ____ i 116. g
u 7 ~'o~g;·~~-"!.6.~~-(~-t-a_~~: -~:~~~~-----do.J 109. 1 Sales (Securities and Exchange Commission): I
Total on all exchanges: Market value _______________ thous. of doL
1 43S. 9GO
o:~e':!'1Y.~i-i<s-t"ock·E~cilaii;;,:·------do ....
1
, 491• 965
Market value _______________ thous. of doL. 38n, 143 Par value ... ------------------------do .. H2 OO?
Sal•s on N. Y. S. E., exclusive of stopped sales I ' -(Dow-Jones):
Par value: TotaL ______________________ tbous. of doL 672 927
Liberty and Treasury bonds ...•.. do.... 502; 000
'Revised.
94.47 97.26 79.76
96.50 !Ol 76 97. 51
126. 34 74. 32
10<1. 4 1!6. 0
110.0
336,206 410, 410
261, 553 :l2:l, 695
I
93.90 96.69 79.21
94.97 101.39 98.14
126. 22 70.70
103.7 116.2
l!O. 2
2.11, 878 301,433
197,277 235,792
2,275,2751' 774, 052 1,809,000 180, 000
tHe vised series. For 1936 revisions seep. 35 of the March I!l37 issue.
83 46 15 13 5 4
319, 319 88,913 31,506 13, 713 79, 118
106, 069
419,917 419,917
0 304,993 133,822
4,800 148
0 0 0
116,096 48,727
1,400 9,671
105,253 0
112. 587 112, 587 37,608
5, 900 69.080
307,3:10 267,385
380, 0-!9 26-5, 125 39, 81\S
95, 541 10,700
591,079 80, 4GO
93.83 97.38 67.47
94.88 101.09 98.14
126. r.o 70.43
102.7 116.2
110.3
104 40 19 16 14 !5
523,439 120, 487 77,317
I, 300 !.59, 700 165,636
733,907 733,907
0 527,630 199,653
0 1, 903
0 0 0
185,336 106,795 33,943 94,429
Ill, 843 0
219, C86 219, 6S6 151' 874
1,000 66.812
514, 220 375, 756
1)54,721 448,444 79,186
118,092 91,889
768,278 148,124
94.24 97.63 67.87
96.11 102.09 98.69
127.15 72.31
102.6 116.9
110.4
208, 596 283, 772 249, 620 332, 383
163, 983 231, 088 1~7, 217 271, OH
231,82712,586,314 0 2,135,000
110 47 14 27 14 8
362,925 84,066 15, 131 32,898
170,987 59,843
338, 779 338,779
0 294,393 49,050
7,125 !, 000
0 0 0
149,804 49,690 37,724
2,080 42,306
0
lO:l, 164 103, 164 69,809
0 33, 355
235, (;].j
22-1,583
305,580 261,194 33,199
I 43,934 1
22,7461
79 46 16 6 7 4
286,022 92,750 35,728 4,660
45,634 107,250
297,258 297,258
u 232.438
16,001 0
973 0 0 0
43,473 &1,500
120,492 7,800
57, 0~0 0
218,071 218,074 170, 799
0 47, 2"/5 79, 1~1 61,639
265,993 201, 173 31,265
fo7,447 18,201
1,328,691 i 1.032,278 415,8161395, 058
94. 78 1 98.19 68.39
97.35 103.08 9S. 86
126. D8
74. 451 102.4 117.4
I 110.3
95.39 98. 8! 68.68
99.38 104. 06 100. 88 120.98 77.78 I
103. o I 117.8
110.8
79 40 16 11 9 3
260,080 76, 140 29,271 17,212
127,918 9, 539
409,462 409,462
0 250,050 88,142
0 4,500
0 0 0
121,050 24,475 11,983
0 159, 402
0
179, 487 179,487 74,590
0 104,895 229, 975 175,460
364,037 204,625
45, 425
159, 481 51,748
662 183 213:787
9.1. 79 99.27 68.00
101.19 105. 18 101.55 128. 37 80.74
104.3 118.8
111.1
292, 443 221. 368 287, 861 350, 594 275,306 378,520
238. 011 179, 5~4 I 240, 020 287, 510 225, 9271322, 466
291. 650 1 224. 923 11.087.961 0 0 ' 914,000
114 59 23 10 14 8
526,330 112, 777 55,643 29,245
104, 752 223,913
67 32 11 10 11 3
266,026 47, 421 30,201 7,192
!59, 036 22, 176
465, 771 380, 934 450, 771 357, 434 15,000 0
381, 402 264, 004 64,462 ' 91, 368
0 0 6, 320 100
0 0 0 0 0 0
264,288 109. 337 9, !50 16, 379
37. 182 46, 820 1, 000 28, 454
83, 194 64, H!G 15, 000 23, fOO
124 53 27 9
21 14
698,408 167,121i 34,531 39,548
234,635 222,567
724, 220 72-l, 220
0 G2:), 912 88,875
1,000 3, 249
0 0 0
395, 591 49,230 87,1158
2, 660 96, 998
0
174, 512 1~9. 512 109,885
158,071 2G5, SflO
0 79,452
27G, 258 271,517
393,683 3(l9. 314 nos8
82, 3l! 8, 389
5!4, 893 113, 037
95.92 99.41 68.16
102. 59 105.62 102.22 129. 49 83.21
104.9 119.5
!11.0
158. 071 21i5, 850 109, 077 218, 201l
0 0 48, 833 48. 99~
222, 8G:l 14,\~, :J71 129, 927 ·107, i07
358. fi96 0~)2, 927 241, 7G6 I 4Vl. (i]!) 22, 238
1
1:)1, ~U4
• 75. 54-l I 92. 90-l 26, 627 1 1>9, 120
I
I 518,782 :I,Hi4,1[)8 230, 5991258, 31 G
97.01 110. 55 68.63
102. 70 lOG. 78 102.17 130.68 82.34
I
105.4 I 122.1
111.8
07. 3.) 100. 7G GV.IO
103.04 107.41 !OJ. G8 1:}2. 32 82.51
105.4 12!. 8
112.3
329,488 293,709 317,484 420, 739 353, 380 446, 393
274.094 246,072 261,214 353, 830 297, 521 379,805
396, 197 197, 835 521,209 0 0 0
I
35
1937
January I
69 30 10
7 18 4
429,990 85, G22
134, 719 11,082
11G, 50\J 52, 057
622, 4R6 537, 4R6
0 305,973 132,641
250 8~1 881
0 0
77.73:1 (;3, 3:)1)
31, 1:;o 2tl. ooo I
205, fll3
85, ~oo I 2-18. ,>26 2-18, 526 102,456
0 !46, 070 373, 91l0 203, 517
47;3, .son 1.~.s. oun 146, 077
22!), 218 2S, 51)7
777, R.i7 109, Wfi
OG. s:; 100.05
G9. 78
102.nl 107. 50 101.32 131.28 62. 75
IO!i. 8 123. 5
l!l.G
309, 610 428, 010
2:..0, 4~4 3fo!i, G79
2-15,35-1 0
Febru-ary
93 43 13 17 14
6
491,400 11}8, 474 38,215 52,249
212, sr:o 19,902
522,31\0 423,360
0 3ii4, 363 131,313
0 17.873 17,873
0 0
145,688 4G, 63.5 12, 8~>4 25,200 43.7\18 99,000
!Gil, ISS IllS. 188 rznl P..t2
4. 000 :1-J,;-;tl)
354, li:l 224, 521
382,001 214, OOii IW.:J.37
71;\ S98 1:2H, 9139
flfi. 64 !i!J. 83 70. 02
101.32 10;") •• '14 100. 7:l 12/l. 38 g2. 22
101.5 llO. i
111. 2
2/fl, fi98 3lC•, 2GO
234, 188 300, (lOS
22:i, 293 0

36 SURVEY OF CURRENT BUSINESS May 1937
1936 1937 Monthly statistics through December 1935, to· get her with explanatory notes and references to the source of the data may be found in the 1938 Supplement to the Survey
19371
March March I April I May I June I July I August I Septem-1 October I N ovem·l Decem-ber ber ber
I January I Febru
ary
SECURITY 1\IARKETS-Continued I Bonds-Continued I'
Value, issues listed on N. Y. S. E.: . Par, all issues .................. mills. of doL.!
Domestic issues ..................... do .... ' Foreign issues ....................... do .... l
Market value, all issues ............... do ... . Domestic issues ..................... do .... l Foreign issues ....................... do ... .
Yields: Standard statistics:
Corporate issues (45 bonds) ...... percent .. Industrials (15 bonds) ............. do .. .. Publi0 utilities (15 bonds) ......... do ... . Railroads (15 bonds) .............. do .. ..
Municipals (15 bonds) .............. do ... . Bond Buyer domestic municipals (20 bonds) I
percent.. U.S. Treasury bonds .................. do ... .
Cash Dividend Payments and Rates !
46,994 42. 045
4, 949 44, 116 40,726
3, 389
4.36 4.48 4. 17 4.43 2. 72
3.15 2.5U
Dividend payments (N.Y. Times): i TotaL .............. , .......... thous. of doLl 249,402
Industnals and misc ................ do .... 1 244.089 Railroads ........................... do .... · 5,313
Annual payments at current rates (GOO com-Dividend payments and rates (Moody's): 'I
panies) ...................... mills. of doL 1,885. 7 Number of shares, adjusted ........ rnillions .. l 923.50 Dividend rate per share (weighted average)
(600 cos.) ........................ dollurs.. 2. 04 Banks (2l) .......................... do.... 3.07 Industrials (492 cos.) ................. do .... l' 2. 02 Insurance (21 cos.) .................. do.... 2. 25 Public utilities (30 cos.) .............. do.... 2. 08 Railroads (36 cos.) .................. do .... < 1. 77
Stocks Prices:
Dow-Jones: 1 Industrials. (30 s~ocks) ...... dol. per share .. l Public utilities (20 stocks) ........... do .... : Railroads (20 stocks) ................ do ....
1
1 New York Times (50stocks) .......... do .. ..
Industrials (25 stocks) ............... do .... l Rmlroads (25 stocks) ................ do .... l
Standard Statistics: Combined index (419 stocks) ___ 1926= 100 .. !
Industrials(347 stocks) ............ do .... i Publw utilities (40 stocks) ......... do ... .. Railroads (32 stocks) .............. do .... l
Danks N.Y. (19 stocks) ............. do .... ' Fire insurance (lR stocks) ........... do .... i
Sales: I Market value of shares sold (S. E. C.):
On all registered exchanges, total 1
188.4 33.1 (il. 7
137. 19 225.73 48.70
129.9 152.6 105. 7 62.8 88.0 97.0
thous. of doLi2,P77,570 On New York Stock Exchange ...... do .... 12,62b,767
Number of shares sold: I On all registered exchanges, total (S. E. C.)
thous. of shares .. lll7, 481; On N.Y. S. E., total (S. E. C.) ..... do.... 83,720
Exclusive of odd lot and stopped sales (N.Y. 'l'imes) ........ thous. of shares.. W, 34l
Shares listed, N.Y. S. E.: Market value all listed shares .. mills. of doL. 62, 41l8 Number of shares listed ........... millions.. 1, 380
Yields: Common stocks (200)* ............. percent..
Industrials (125 stocks)• ............. do .. .. Rails (25 stocks)* ................... do .....
1
Utilities (25 stocks)* ----------------do .. .. Banks (15 stocks)* .................. do .. .. Insurance (10 stocks)* ............... do .. ..
Preferred stocks, Standard Statistics: ' Industrials, high grade (20) ......... do .... l
Stockholders (Common Stock)
3. g 3. 8 3. 1 5. 0 2.8 3. 2
5. 07
American Tel. & Tel. Co., totaL .... number .. i 539, 227 Foreign ___ .............................. do .... : 7, 265
Penns'.'lvania .Railroad Co., totaL .. ___ do .... i 217,016 Foreign ............................... do ____ , 3,020
U.S. Steel Corporation, totaL .......... do .... l 164,271
~g~~~~'te-1<1-ty !lrokers~~:::iJeiceili o-do~aL! ~4:~1 I
'Revised.
FIN AN CE-Continued
44,255 37, 196 7,059
41,807 36, 177 5,630
4. 24 4. 32 4. 01 4. 37 2. 78
3.03 2.54
200,042 192, 324
7, 718
44,223 37, 150 7,073
41,525 35,922 5,603
4. 28 4. 38 4.00 4. 4.5 2. 76
3.12 2. 51
162, 174 155, 519
6, 655
1, 345. 5 1, 355. 8 923. 92 1 923. 92
1. 46 2. 98 1. 33 2.39
1.861 1. 21
155. g 30.9 48.0
120.95 203.97 37.94
108.7 124.6 102. 8 49.2 66.4
102.1
I
1. 47 2. 98 1. 34 2. 39 1. 86 1. 21
155.8 31.7 47.2
121.63 206.14 37. 12
108.9 125.3 101. 5 48.9 64.1 96.8
2,420,960 1,936,202 2,092,308 1,679,839
101,923 75, 532
51,025
51,668 1,330 I U! 2. 8 4. 5 3. 7 3. 7
5. 02
78,137 56,935
39, 616
47,774 1, 337
3.ll I' 3. 3
3. o I 4. 9 4. 0 1.1 1
5. 041
I I
42, 255 37, 242 5,013
39,648 36,286 3, 382
44, 164 39,128
5,036 41,619 38,201 3,418
43,981 I 38,947
5, 034 41, 685 38, 242 3,443
4. 34 4. 45 4.04 4. 52 2. 76
3. 00 2. 50
I
4. 34 4. 44 4.03 I 4. 561 2. 72
I
2. 99 I 2. so 1
I
4. 35 4. 45 4.02 4. 58 2. 70
2. 95 2. 50
409. 5.52
1
, 263. 830 1 236. 196 375, 035 237, 655 215, C03 34, s17 26,175 I 21,193
i I, 385.2 ], 397.4 I 1, 457.2 923. 92 923. 92 923. 94
1. GO 1. 51 I 1. f•S 2.93 3.001 3.00 1. 38 1. 41 1. 48 2. 39 2. 03 2. 09 1. 86 1. 861 1. 95 1. 21 1. 21 1. 21
149. 3 30.0 44.5
119.46 203. 36
35. 57
101. o 1·
116.2 94.7 45.0 62.6 94.2
l!H II
124.28 211.69 I 36.88
i 105. 6
1
. 120.6
102. o I 47. 7 65.0 95.2 l
162.3 34.6 51. 5
130. 74 221. 15 40.33
109.2 124.3 105.8 50.7 72.1 96.1
44,279 39,241
5,038 42,236 38,776 3, 460
4. 32 4. 42 4.02 4. 52 2. 68
2.91 2. 43
331,918 317,088 14,830
!, 517.4 923. 94
1. 61 3. 00 1. 56 2. 09 1. 96 1. 21
165.9 34.7 54.0
131. 55 220.56 42.55
113.0 12S. 4 108.8
53. 9 l 76. f5 I
96.5
45,211 40,178
5,033 43,305 39,883 3,422
4. 24 4. 40 4.00 4, 33 2. 62
2.86 2. 41
231,730 226,642
5, 088
1, 539. 6 923.99
1. 67 3. Ol 1. 58 2.13 1. 99 1. 21
167.8 34.5 55.8
133.48 222. 54 44.42
45,018 39,988 5,031
43,180 39,751 3,429
4. 21 4. 40 4. 01 4. 24 2. 58
2.85 2.42
233,697 226,269
7, 428
1, 568. 2 923.99
1. 70 3. 04 1. 62 2.14 2. 01 1. 21
175.0 35. 1 58.7
138.39 230.40 46.38
114. 1 118. 7 130.2 136.0 107. 7 109. 1
5.5 4 . 58. 4
94. 1 93. 8 75. 1 •
1
75.3
45,026 40,038
4, 988 43,680 40,257 3,423
4.18 4.33 4.00 4. 22 2. 45
2.00 2. 29
880,262 814,406 65,856
1, 825.6 923.99
1. 98 3.04 1.96 2.14 2.04 1. 55
182.1 34.9 56.7
141.46 238.88 44.04
124.2 144.3 108.9 57.9 70.4 96.1
46,280 41,301
4, 979 45 054 41:613 3, 441 I
4.18 4. 30 4. 00 4. 24 2. 31
2. 62 2. 27
437, 541 407,957 29,584
1,876. 2 923. 50
2. 03 3. 07 2. 01 2. 21 2. 09 1. 77
180.1 34.9 53. 9
m:i1 1
41.81
'122. 8 '142. 6
110.6 54.4 70.6 98.3
46.592 41. 63o I
4, 961 I
45, 113 1
41,651 i 3, 41\2
·1.16 4. 2V 4. 02 4.17 2. 38
2. 74 2. 29
233, 330 212, s:l7 20, 4U3
1,884. 0 923.50
2. 04 3. 07 2. 02 2. 25 2. 09 1. 77
183.5 36.4 55. 1
139. 48 235. 41 43.56
'126. 0 '146. 3 r 113. 2
r 55.6 78. g 98.7
46. 572 41,593
4, 979 45,007 41, ~121
3, 486
4. 24 4. 36 4.09 4. 26 2. 57
2. 90 2. 31
358,9119 3;-:;2, 406
::6,503
l, SS6. 9 923.50
2. 04 3. 07 2. (l2 2. 2:i 2. 09 1.77
188.0 35.0 57.4
138.67 231.77 45.58
129.5 151.7 110.7 57.9 90.6 98.4
I
1,223,44411,1Gl,l47 11,765,391 1,435,776 1,077,672 1,002,190 11,526,176 1,218,924
1,594,411 12,241,462 1,387,439 1,948,171
I
2,530,464 2,358,956 12,663,064 12.101,226 2,188,579 2,025,678 2,246,887 12,332,408
46, 756 43, 9371 64, 728 50, 937 35, 943 31,897 48,272 37, 109
59, 6271 79, 992 44, 535 60,019
94,299 68,306
99,756 71, 123
20, 615 21, 428 34, 787 26, 564 30, 872 43, 998 50,470
60,020
48,605
59,878 1, aoo
49,998 1, 339
3. 5 3. 3 2.8 4. 5 3. 9! 3. 9
5. 06
50,912 1,340
3. 4 3. 3 2.8 4. 5 3. 6 3. 0
5. 04
54, Oll7
1
54, 532 55, 105 1, 341 1, 344 1, 348
Hli U U 4. 4 4. 4 4. 6 3.3 3.21 3.3 2.9, 3.0 3.1
5. 03
58,507 1, 349 1, 356
3. 4 3. 91 4. 0 3. 3 3. 9 4. 0
~: ~ \ ~: ~ I ~: ~ 3. 4 3. 4 3. 4 3.0 2.8 3.0
s. oo 1 5. o4 4. 99
117,097 81, Cbi
58,5761
61,912 1, 3G7 i
3. 9 : 3. 8 3. 5 4. G 3.1 3. 1
4. 94 5. 031 5. 021 I I
I i i
107, 061 ;z, oo4
50,255
62, m8 1, 374
3. 8 3. 8 3. 3 4. 2. 8 3.
4.9
I I I 653,435 1---------~---------1 649,876
7, 859 1---------~--------- 7, 804 22s,t2o 1--------T-------- 223,844
3,101 1 ........ T........ 3,0~7 181, 4D3 1---------·--------- 177, 7a8
3. 870 < ......... !.......... 3, 941
_________ 11 _________ 11645,457
--------- --------- 7, 540 .................. 221,327 --------+-------- 3, 076 ---------~--------- 173,633 ------------------1 3,8G6
========= !========= ~1 ::t ~~g t::::::::f:=====---------··II_-------- 3, t55 ~~------- --~---- ----.................. l70,~f8 ............... ..
========+:=:=:=:I ~3:~§ i=~=~:~=~: :===:~::: 21.751---------1--------- 22.72 ---------1----·----1 23.51
• New series. For data for period June !929-July 1936, and a description of the series on yields ol200 common stocks, seep. 18 of the Sept. 1936 issue.

May 1937 SURVEY OF CURRENT BUSINESS
Monthly statistics through December 1935, to- 1937 1936 gether with explanatory notes and references
J\1 arch I I I I to the source of the data may be found in the
March April May June July I August I Septem-1 October I Novem-1 Decem-1936 Supplement to the Survey ber ber ber
FOREIGN TRADE
I J INDEXES ) Exports: Total value, unadjnsted ..•.... l923-25=100 .. 68 51 51
56 I 49 47 58 70 59 61 Total value, adjusted _________________ do .... 67 51 53 55 54 51 55 57 52 57
U. S. merehandise, unadjusted: Quantity---------- .•... ____ ••••... do .•.. 95 79 77 83 74 72 71 86 104 89 89 Value ..... _ •. -------------_. ____ .. do_ ... 6~ 52 51 53 48 47 47 58 70 60 61 Unit value .. ------------ •... ------do .•.. 71 65 66 64 66 66 66 68 68 67 68
Imports: •rota! value, unadjusted •••••••••••••• .do •••• 95 62 63 59 59 60 60 67 66 61 76 •rota! value, adjusted ..•.•.....•.•.... do .•.. 85 55 58 58 62 65 62 70 64 61 76
Imports for consumption, unadjusted: Quantity----------------- .1923-25= 100 .. 155 115 116 llO ll4 ll5 ll7 124 123 ll4 185 Value ... ------ .•.. ---------- __ .••• do ____ 93 61 63 59 61 62 63 68 67 63 75 Unit value .. ------ ____ .. ____ ...•.. do .•.. 60 53 54 54 53 54 54 55 54 55 56
Exports of agricultural products, quantity: Total:
U nadjusted ...•...•••...•.•.. l910-14= 100 .. 56 51 44 45 40 27 33 68 99 76 66 Adjusted._ .. -----------------------do .... 57 52 52 54 52 39 40 63 74 59 52
Total, excluding cotton: U nadj u'ted _ .. _ ..•.•.•.••• __ ••.•.... do __ .. 36 41 34 33 31 30 39 47 61 41 37 Adj usteJ ..• __ • ___ .•..•..•• _ •..••.••• do .••• 3:3 41 36 35 35 33 39 I 44 53 38 35
VALUE
Exports, inel. reexports .•..•.•.• thoas. of doL.I256, 390 !94, 792 192, 629 200,606 184,908 179, 828 178,314 220,149 264,740 225,766 229,739 By gmnd di\"isions and countrie<: I
Africa ... ________ ---------------- ••.. do .•.. _. _______ 10,553 9, 215 9, 325 S, 628 10, 562 8,828 9, 451 10,919 8, 208 12,651 Asia and Oceania. __________________ do .... ------·-- 38,332 39, 337 38,902 38,766 35, 725 33, 570 43,604 51,005 44,200 41,180 Japan ___________________ .• _ •.• _ ... do .. __ --------- 16,401 16, 2ll 11, 6SO 1:1,027 11, 975 10, 76! 21, 328 26, 6fi3 24,100 16,433 Europe .•••••••. __ .• ___ •.. ________ .. do .• __ --------- 82.932 7H, 247 7/1,, 097 69,400 64,462 69,978 98,937 122,1l97 98,236 99,863
~'ranee ...... __ -------- ____ ------ .• do .. __ --------- 8, 388 9, 311 7, 301 8,893 6, 448 8, 4~-1 14.929 17, 102 11,410 J,), 808 Germcmy _ -------------------- __ .• do ...• --------- 9, 4S9 7, 787 7, 210 6, 541 7,041 5, 840 10,213 10,905 9, 550 8, 995 Italy _________ ------- .•.. _____ . ___ . do .•.• --------- 5, 831 4, S27 5, 697 4, 299 2, 873 2, 21>5 2, 868 5, 699 5, 401 5, 907 United Kingdom _________________ do ____ --------- 32,012 27,954 30, 4.)0 27,066 27, 3Sl 33, 223 47,498 59,511 43,839 40. 62:J I North America, northern ..•........ do ____ --------- 27, IJ~5 32,123 37, 50J 35, 498 32, 016 32, 251 32, 142 39,180 36, 539 33, 137 Cau,\da. ------------------------ .. do .•.• ~--------- 27,356 31, 557 36,603 34, 875 31,296 31, 516 31,498 38,442 35,905 32, 556
North America, southcrn ..•.....•.• do .•.• --------- 19,593 17, 902 18,535 16,789 17, ~19 18, 528 19, 370 21,456 19, i71 22,616
So~~:!~;:~~~~=~===:::::: ::::::::J~:::: I::::::::: 6, 395 5, 932 6, 243 5, 800 6,830 6, 348 6, 381 6, 670 6, 799 7, 723
15,438 15, 801 18,306 15,828 19,243 15, 159 16, 596 19,423 18,812 20,291 3, 876 4,031 4, 507 4, 662 5, 957 4, 124 4, G46 5, 296 .?, 320 6, 317
BraziL .. ___ •••.• ---- .. ------ •. ___ .do .•.• --------- 4,109 3, 70! 4, 475 3, 757 3, 560 3, 557 3, 516 5,o:J2 4,8fi7 4, 237 Chile.---- ______ ---- __ .• ______ ...• Jo .. __ --------- 1, 274 1, 562 1, 676 I 982' 1, 540 1, 071 1, 051 1, 272 1, 288 1, 579
By economic classes (U.S. mdse. only): TotaL. -------------------·-thous. of doL 252, 268 192,081 189,408 196,913 180,601 176, 397 175, 556 217,535 261,963 223,321 226, 605
Orude m~terials ________________ •.• do .. __ 52, !52 44,486 40,431 42, 627 39,310 30,379 38, 127 72,819 100,418 82,173 67,:183 Ootton, unmanufactured .•...... do ...• 34, 272 26,322 22,764 22, 905 19,707 10,788 12, 360 38, 221 58,402 46,969 40,220
Foodstuffs, to I'lL. ----------------do .••• 17,475 16, 8!8 14,199 15, 925 14, 509 15, 036 19, 675 23, 349 24,923 13, 697 13, ll2 Foodstuffs, crude .•.•.•.. -- .• _ •.• do .... 4,100 5,087 4, 949 4, 621 4, 402 3, 774 5, 725 5, 697 7, 490 4, 369 3, 644 Poodstuffs, mfgd .•...•.........• do .••• 1~. 37;, 11, 761 9, 250 11, 304 10, J[,71 11,262 13,950 17, 652 17,433 9, 328 9, 468
Fruits and prep _______________ do .••• 5, 510 6, 756 5, 475 5, 2,)8 4,144 4, 952 8, 719 10, 438 ll, 831 4, 579 3, 7i6 Meats and fats .....•••.•••.•.• do .... 3, 1.11 3, 496 3, 340 4, 231 3, 982 4,088 3,135 3, 013 3, 409 3, 560 3, 325 Wheat and flour --------------do ...• 1, 927 1, 439 1, 391 1,464 1, 281 !, 335 1, 656 2, 424 2, 541 1,429 1, 931
Manufactures, semL ...•.•...•.••• do ••.• 53,005 32,096 33,802 35, 11.5 34, 107 33, 282 32, 287 31,860 36,668 32,826 34,901 Manufactures, 1\nished ••.•.....•.• do .•.. 129,635 98,652 100,976 103, 245 92, 674 97,701 85,467 89,508 99,953 94, 626 111,208
Autos and parts ....•....••.•.•.. do ...• 28,8!9 23,955 22, 972 22,532 19,135 16,915 12, 359 12,451 15,766 21,218 28,769 Gasoline .. ----------------------do .•.. 5, 349 3, 265 5, 059 5, 570 4, 366 5, 036 4, 983 5, 495 4,534 5, 307 3, 993 Machinery ______ ....•••••••..•.. do .•.. 31l, 985 27,872 30,651 29,611 2.5, 962 29,311 25, 178 27, 307 31,760 26,408 30, 788
General imports, totaL _________________ do .... 306,699 198,686 202,789 191, llO 190, 387 194, ll4 192, 375 215, 645 212,464 196,491 244,321 By grand divisions and countries:
Africa ... ____ ------ ________ ------ .... do .. __ --------- 5,504 6,468 4, 250 2,425 2, 803 3,164 3, 585 3, 58! 3, 800 6, 284 Asia and Oceania ___________________ do .••. 59,766 66,479 58,263 60,236 66,099 60,845 67, 733 61, 189 53,698 66,805
Japan ... ____ .. ---- _______ . __ .•.... do. ___ --------- 12,670 13, 141 12,053 11,088 12, 187 16,948 16,017 15,930 15,340 16,427 Europe_-------- ___ . _____________ ._ .do .... 55, 789 50,408 54, 665 53,543 55,049 57,089 66,291 70,722 64,695 80.890
France .. _.----- ____ . ___________ ._ .do .... --------- 5,385 4, 357 4,888 4,163 4, 657 5, 759 5, 905 6,807 6,165 7, 137 Germany_. ___________ .. ________ - .do ... - --------- 6,490 5, ~87 6,036 5, 866 7,570 6, 023 7, 212 8, 767 6, 567 7, 616 Italy _____ •. ______ . ___ . __ ------ ____ do ..•. --------- 2,812 2, 708 3, 375 2, 904 2, 861 2,480 3,171 4, 756 4, 416 4,812 United Kingdom •. _______________ do .•.. 16,949 14, 299 14, 770 14,540 14,30.5 15,444 17, 524 18,548 16,625 26, 443
North America, northern .•.•..•.... do ...• --------- 26,675 27,129 30, 100 29,917 30,990 36,620 36,015 39,068 38,775 39, 550 Canada __________ .... ------- .. __ .. do .. __ --------- 26,309 26,921 29,749 29,409 30,594 36, 161 34,998 38,532 38,331 3\l, 010
North America, sonthern .•.......•. do .... 24,828 27,209 24,190 24,214 19,149 12,515 17, 103 13, 166 12, 377 17. 607 Mexico_. ___ -------- ..•.••.•••... .do ____ 5, 240 5,090 4, 087 4,052 4,044 3, 258 3,055 3, 691 3,435 4, 640 South America ______________________ do. ___ 26, 125 25,095 19, 641 20,052 20,024 22, 141 24,918 24,739 23,146 33,184 Argentina .•.. ----- .. ------ ______ •. do .. __ --------- 5, 700 5,564 3, 821 3, 060 3, 597 4, 173 6,546 7, 585 7, 583 8, 181 BraziL .•... ___ . ____ . ____________ •. do .. __ --------- 9, 469 7,186 5, 923 6, 950 7, 241 7, 682 9,455 8, 758 8, 466 11,462 Chile ... ______ . __________________ .do. ___ --------- 2,448 3,555 2,896 1, 508 1, 433 1, 667 1, 476 1, 601 980 2, 520
By economic classes (imports tor coosump-tion):
TotaL ------------------------thous. of doL 29,), 928 194,281 199,787 188,421 193,622 196,516 200,090 218,370 213,209 200,391 239.835 Crude materials ..•.•.•.•.... ------ •. do .. __ 91,616 57,749 62,076 55,071 54, 612 56,022 61,003 69,437 62,758 61,226 75, 383 Food stu tis, crude .• -----------------do ..•. 45,251 31,221 28,690 21,759 22,893 24,529 28,627 31,063 33,802 30,582 40. 221 Foodstufis, manufactured •.•.....••• do ..•. 52,162 32,338 37,035 34,080 36,065 34,726 27,630 33, 149 27,512 27,705 33,036 Manufactures, semi.. _______________ do .... 57, 853 36, 127 37, 577 38,456 43,056 42,660 40,814 40,817 40, 536 40,638 48,967 Manufactures, finished ______________ do ..•• 49.046 36,847 34,409 39,056 36,996 38, 579 41,356 43,904 48,601 40,241 42,228
TRANSPORTATION AND COMMUNICATIONS
TRANSPORTATION I Express Operations
Operating revenue •......•••.••• thous. of doL. --------- 8,245 8,396 8,579 8,435 8,323 8,371 8,809 8, 975 8, 930 10,021 Operating income _______________________ do .... --------- 126 123 110 123 119 120 115 120 124 125
Electric Street Railways
Fares, average, cash rate ________________ cents •• 8.041 8. 099 8.092 8.092 8.092 8.092 8.075 8.0;.5 8. 075 8.075 8.075 Passengers carried .••.•.•• __ •.•.• _. thousands .. 859,898 814,298 790,697 788,307 758,943 720,39l! 704. 446 I 737. 523 814,254 777, 157 847, 775 Operating revenues ••••.•.••.••. thous. of doL.--------- 58,752 57,627 57,426 55,553 53, 553 52, 612 54, 701 59,900 57,047 62,446
37
1937
January I
58 57
85 59 69
74 74
125 71 57
64 57
40 39
221, 550
10,094 49,281 22, 364 8S, C77 13,492
7, 05G G, 033
3.), 232 31,687 31,207 22, OH
6, 9G5 H!, 7(i3
5, 312 4, ](j2 1, Q(j8
217, 919 60, 5S7 37, 4G1 13,062
3, 598 9, 464 4, 263 2, 980 1, 894
34, 156 110, 144 27, 586 5,882
31,532 240,396
i, .)73 7(;,843 li. 683 67,213
[>, 859 7, 717 4, 291
18,453 33,975 33,089 22,361
5, OR8 32,431
8, 467 11,534
2, 898
228,682 77,045 38,727 29, 648 46, 533 36,729
------------------
8. 075 803,620
57, 834
Febru-ary
6 6
8 6 8 2 0 7
8 6 7 8
14 8 5
5, 6
3 4
232, 50
10, GO 49, ~1
8 2
24, H. g;,, 17 13, lUI 8, 88 2 6,071
38,84 31,92
7 6
31, GJ3 21,591 i, 877
20,09 5, 92
3 8 9 4
3, 97 1, 55
229,05 0 0 6 4 2 2 3 4 5 7
54,41 31,06 22,52
3, 52 19,00 9,90 2, 62 1,81
37,93 114, 179 25,D7 4
2 5
5, Of, 31, 47.
277, sor:
9, 35 92,11 IS, 3S
0 2 2
.-:l, 209 G,BO 0 6, :J94 4, 1G
19,056 30,811 30,568 27,787
5, 509 41,536 IG, 199 10,999
5, 119
260,320 90,930 41,399 3'1, 929 52,187 40,875
------------------
H. 075 757, .518
55,042

38 SURVEY OF CURRENT BUSINESS
Monthly statistics through December 1935, to- 1937 1936 gether with explanatory notes and references
March I I I I to the source of the data may be found in the
Merch April May June July I August I Septem-1 October I Novern-1 Decem-1936 Supplement to the Survey c ber her ber
TRANSPORTATION AND COMMUNICATIONS-Continued
TRANSPORTATION-Continued Steam Railways
Freight carloarting (Federal Reserve): Comhined inuex, unadjusted .. 1923-25= 100 .. CoaL _______________________________ do. _.
Coke. _____ -------------------------do ... -~ For~st products. ____________________ do ___ . Gram and products _________________ do ... . Livestock ... ______________ ------ ..... do .... -I
~~~e~;~~~~~~~~~=c=: ~-::::: :::::::::::: ~~::: ·1 c't~~1~~~~~~~~~·-~~!~~~~:~~~: :::::::::: 3~:::: I
Coke. ___ ------------------------ __ .do __ _ Yore~t produf'ts _____________________ do ___ i Grain and products _________________ do. __ !
tt¥~~~~~~i~~:!::~:l:-:=: ::::::::::::::~~=:· •I Miscellaneous _______________________ •lo _ .
76 fl2 9f)
52 62 34 G9 28 \10 '13 g~
\),\
;/0 73
Freight carloading (A. A. R.): . 1 Total cars , ______________________ thousanas .. 1 3, 003
Coal_ ------------------------------·-.do ____ , fi7G C k i I 47 F~re~t -proctucts:::::::::::::::::::: =~i~~==~ I 1 ;> 1 Grain anct products _________________ do ____ J 11.~)
Livestock.------------------------- .do ____ I ·H:
~r~~c-h~~~~i~~: !:~~-~----~~:::::::::::::3~:: ~:I G~~ .:r..nsre1laneous _______________________ do____ 1. 21\J
Freight-car surplus. totaL •.. ___________ do ____ , 11:1 Box cars ______________________________ do ____ ! ~~
Fi~~~~,i~~r~i>erniio~s -<·class -i 'Rai!;;;y-,;,:do.-- ·1 Opera_ting re.venues, totaL ___ thous. of doL--l 377,fl:~
~~~~~~~er _-_-_-_-_-_ ----~-_.--_~--------------~------~-:=3~~ ~= = ( 3:U: 0·~1
Operating elpenses ___________________ f!o __ ·- 20G, ~7:! Net railway operating income ________ do____ 69, 3/U Net income .... ---·-·--·---------------do ____________ _ Operating results:
Freizht carried 1-mile ........ mils. of tons .. ---------Revenue per ton-mile. ___________ cents ____ ---------Passengers carried 1 mile ______ millions ____ I---------
Canals: Waterway Traffic Oape Cod ______________ thons. of short tons.. 317 New York Shte ______________________ do____ 0 Panama. totaL _________ thous. of long tons... :l,OI6
In U.S. vessels _____________________ do____ 1,255 St. Lawrenee ___________ thous. of short tons__ 0 Sault Ste. Marie ______________________ do____ 0 Suez __________________ thous. of metric tons __ Welland ______________ .... thous. of short tons.. 0
Rivers: Allegheny_----- -------------------··--do ___ _ Mississippi (Government barges) •••.• do ___ _ Monongahela _________________________ do ___ _ Ohio (Pittsburgh dist.rict) _____________ do ___ _
Clearances, vessels in foreign trade:
231; 131
2, (i~g 1, 337
TotaL ___________________ thous. of net tons ... -----·---
~~1~dn siaies:~:::: ~~~~:: :::~::: :: ::~~:: :: ::::::::: •rravel
Operations on scheduled airlines: Express carried •..• -------- ________ pounds .. Miles flown _________________ thous. of miles .. Passenger-miles flown .... ---· _______ .. do. __ _ Passengers carried ________ ----- ____ number __
Hotels:
580,602 .o,486
34, 5B4 74,972
Average sale per occupied room ..... dollars.. 3. 09 Rooms occupied ____________ percent of totaL. 68 Restaurant sales index ..........•• 1929=100 __
1 89
Foreign travel: Arrivals, U.S. citizens _____________ number.. ---------Departures, U.S. citizens. ____________ do ____ ---------
f~~~~;~s:::::::::::::::::::::::::::~~:::: ::::::::: Passports issued ______________________ do____ 15,151
National Parks:t Visitors. ____ .••. -----·-----·--------- .do .. __________ _ Automobiles •. --····--·-·----- _______ .do. ___________ .
Pullman Co.: Revenue passengers carried ..••• thousands .. ---------Revenues, totaL ______________ thous. of doL.
COMMUNICATIONS Telephones: §
Operating revenues ••••••..... thous. of doL. --------Station revenues.----·---·-····-··- .do .. __ Tolls, message. ----------·---·------do ...• --------.
Operating expenses._ -----------------do ___ _ Net operating income ...•.....•...••.. do ___ _ Phones in service end of mo •.•... thousands ..
Telegraphs and cables: Operating revenues ___________ thous. of doL.---------
Commercial telegraph tolls •••••••..• do .•..
1
________ _
Operating expenses ••• -----------·----do .... ------·--Operating income _____________________ do .. _ _ __
62 66 60 64 5fi iS 42 42 72 f)f) 35 38 63 6.1 15 27 n 7~ 66 69 ()~ Ti 55 61 40 40 R5 hi 41 41 t!2 63 G'l b:~ 77 77
'2, 415 2, 545 ' 42-1 445
r :2X 28 12~ 121
' l'l4 123 4:S 50
'"20 647 24 35
1, 017 1. 096 205 179 104 97 61 42
·30'l.25S 313,410 r 2) l, 779 2:)[\, '32~
30, .1ltj ~{0, (j;i:)
r 23(), f)4 7 1 235, 07:3 ":15, 1.52 i 41, 5~8 " ~. ;m; 1 d 2, zgs
27,992 I 28,145 .9\)4 ' 1.015
1, 539 1. 578
200 227 0 223
2, 634 2, 430 981 1, 023
0 187 0 37
2, 149 2, 091 0 95
56 226 140 188
1, 327 !, 928 520 863
4, 639 4. £72 3, 225 3, 329 1, 414 1, 542
535, 736 4, 860
31, 730 70,926
2.8D 65 78
30,678 26,081 2,108 2, 591 8,071
47,083 14,120
1,312 4, 479
88,909 57,594 23,459 59,582 19,165 14,921
10,046 7,757 8, 288 1 326
483,505 4, 885
30,326 71,449
3.00 68 93
24,808 24,149 2,134 3, 016
15,509
67,767 20,068
1, 353 4, 438
88,754 57,667 23,298 59,543 18,818 15,004
9,996 7, 742 8,156 1, 407
71 65 70 46 6\J 37 66
107 83 70 73 70 4-1 84
~v I f;j
71 so
3, 3.'2 557
41 11)2 155
61 793 1~7
1. 394 18.\ 105 41
3:20,91)(} 2fi2 ·o:lo;35i
2to, 234 4!, R-t2
a Z, -120
29,894 • 97.5
1, 578
270 568
2,<120 9·!0
1, 300 8, 710 2, 215 1, GIS
365 200
2, 361 1, 246
6, 057 3, 901 2, 155
483,798 5, 511
40,097 96,368
2. 85 64 86
20,010 21,686 2, 643 3,067
27,725
72 G1 69 •IS 77 35 66
130 R3 70 70 75 4() 89 4! nr~
7'2 7H
2, 787 425 33
139 140 47
649 202
1, 151 170 t~O 41
330, fJU2 2fi8, 642 3t, ~45
241, Sl2 50,:l!3 h,902
20,750 1.023 1, 911
228 616
2,4(;0 989
1, 207 9, 835 1. 981 1, 1!4
367 155
2,457 !, 319
6,134 4,121 2, 013
701,142 5. 620
40,252 97,453
2. 97 64 93
21,038 22,732 2, 527 3,008
31,305
144,034 ~311, 391 43, 128 91, 575
1, 295 1, 430 4, 163 4, 705
89,209 57,864 23,486 59, 614 19,182 15,0~8
10,025 7, 787 8, 302 1.292
89,680 57,673 24, 116 59, 7i8 19,268 15, 111
10,551 8, 244 8, 513 1.603
75 65 73 47
ll7 41 6(\
139 1;4 73 74 83 48 9~ 49 67 77 80
2, 826 434 35
131 212
52 628 209
!, 125 147 77 Si
3-t~), i44 ·>w· Ul4 -3t).' 187 24:-i, :!GO
'l1, 771 19,2S3
31, 144 1. 002 2, 2til
25'S 738
2, 4.50 976 997
10.951 2,150 1,322
405 143
2, 564 1, 399
6, 564 4,418 2,146
613,837 6,043
44,364 111, Oi2
2. 98 61 89
30,346 36,361 2, 780 3, 571
16,980
6.15, 786 182,958
1, 516 5,019
91,129 57,681 25,406 62,136 18, 298 15,549
10, 534 8, 258 8, 718 1,399
70 6S 71 50 8S 46 67
141 85 70 71 79 47 73 52 ~7 8? 77
3, 701 60,)
43 lSl 217
77 828 274
1, 176 14ll 81 30
350, -\85 2S;;, H02
3:.1, ~t2l 24(\, 2\ll}
H-4, r:g1 20,857
32, 075 . 971
2. 308
232 605
2. 396 1. 058 1,%0
10. 699 2,-"54 !, 366
404 138
2, 623 1,461
6,886 4, fJ94 2,192
565.358 6, 046
43, 109 106, 143
3.10 61 91
61,230 57,067 3,004 3, 891 8,198
622, 721 175,090
1, 565 5, 211
89,571 56, 727 24,692 59,960 18, 853 15,622
!0, 121 7,917 8, 616 1.08~
82 80 83 50 71 57 70
150 95 72 74 85 47 5g 4b G7 ga ~0
3, 061 5.'!1 39
139 127 n
6f;3 226
1, 264 125 71 23
357,207 2['t '"'7') 3a:356
24S, 553 70, lou 26,406
33, 049 . 964
2, 004
258 821
2, 526 1,0.14 1, 130
11,041 2,172 !, 407
378 127
2, 569 !, 425
6,668 4, 606 2,061
652,930 5, 756
43,510 101,239
3. 09 66 91
63,575 48,693 2, 612 4, 606 6, 564
258,495 77, 'il2
1, 519 4, 929
90,668 58,441 24,095 60,923 19,277 15,762
10,321 8,010 8, 608 !, 300
84 90 87 49 69 65 69
133 97 73 79 85 48 62 49 66 95 82
4,096 I 791 53
178 161 10~ 8.\6 264
!, 683 112 65 17
80 92 96 49 73 59 6S 73 92 80 8~ 93 51 69 51 67
105 94
3, 013 1'
625 4[1
136 131 77
651 113
r, 236 I 121 I 63
23
?l~~ ·o 45s~ I ~~1~' ;~~o' ' .. o, • u . -· ~. --33,914 I 32,U~<:l
261, 2J2 I 21". 2>;,) so, s.s1 12.411 46, 234 30, o,:;
37,H8 • P.1.5
1, 913 i I
2s1 I 722
2,463 962
1,386 10, 789 2,172 1, 646
428 129
2, 661 1, 452
5, 973 4, 209 1, 764
799,266 5, 913
44,411 102,917
3.14 69 95
33,176 36, 246 2, 436 5,101 5, 659
77,783 24,926
!, 469 4, 959
93,979 60,781 24,984 61,910 22,142 15,880
10,564 8, 134 8, 600 1,438
33, 865 • t1G7
1, 7US
2;i5 717
1, 747 485 999
7,094 2,302 1, 3081
134 1~9
2, 446 1, 355
4, 881 3, 631 1, 249
751,890 5, 639
42,891 96, 019
3. 28 65 96
16,973 22, 983 2, 708 3,871 5, 865
46, 127 14, 102
1, 351 4, 309
92,393 60,285 23, 843 61,363 21,274 15,961
9,803 7, 541 8, 310 I. 070
74 92 97 46 71 45 66 23 83 86 8fi 90 57 73 45 71 ~).j
107
2, iii) 625
4.j 132 130 ,jg
632 s:~
1 113 '133
1)5 30
372, :_?();)
2:)U, :2:~1 W1,2(U
2.)7, 4:!-1 if!, f1:!0 4(!, 678
3:l, 980 . 903
2,16!
288 0
1, .139 214
22 373
2,3-16 232
260 103
2, 601 1, 372
4, 351 3, 2.55 1, 096
663,721 5, 301
,. 37, 952 82,022
3.10 60 91
19,573 21,222 2,653 4,082 6, 104
43,715 13,019
1, 497 4, 772
96,638 62,045 26,340 63,891 23,822 16,067
11,893 9,326 9,800 !, 481
May 1937
1937
January I
70 89 97 42 65 42 64 26 78 80 79 88 48 {;~
40 tiS
1GS
I I I
i
3, 3!7 7.~8 1 .~s !
)-1~)
HS
7tH 4U
1,322 E1 (:!
2C
[;:)], zc-..:, ~{7. -!H
2?~~. t' ~:·1 .3~, 4.)f ' 4, 5~,
Febru-ary
,z \11
101 49 64 3J 66
,. so o3 89 4S G 3 !j
11 ~)
2. 778 f,2
ll j
1'.40 4.2
1, ll 11
321. ~)~7 2!~-t. Fi z:J, o;6
2H, 146 3>;, 3.59
d 5, 72
3:).130 32, 21 . 8~18 1-- ---
2,030 !--
320 275 0 0
1, bfl!i 1, S40 281 4G7
0 0 0 0
2, OS~ ________ 0
129 193 79 R9
1, '9G 2, 496 8.54 1, 32
4, 100 4, 2H 3, 15(} 2, 997 1. 043 1, 248
554,030 4, 19~
21,379 46,012
:l.12 70 92
19,686 21,757 !, 897 2, 958 7,046
50,307 14,211
1,605 5, 697
94,277 61,457 24,420 61,453 20,774 16, 160
10,326 8, 049 8,854
878
500,004 4, 600
26, 108 58,008
3. 22 66 90
27, B~O 30, GPi5
1, 413 3, 224 7, 716
40,608 11,.\30
1, :lS5 4, 973
91,263 60,138 22,658 60,301 19,072 16,259
•Revised. • Deficit. t Revised series. For revisions for period 1919-36 seep. 20 of the December 1936 issue. , Data for May, August, October 1936 and January 1937 are for 5 weeks; other months, 4 weeks. §While the number of telephone carriers reporting has varied somewhat, the coverage has shown very little change, and the series are comparable for all practical purposes,
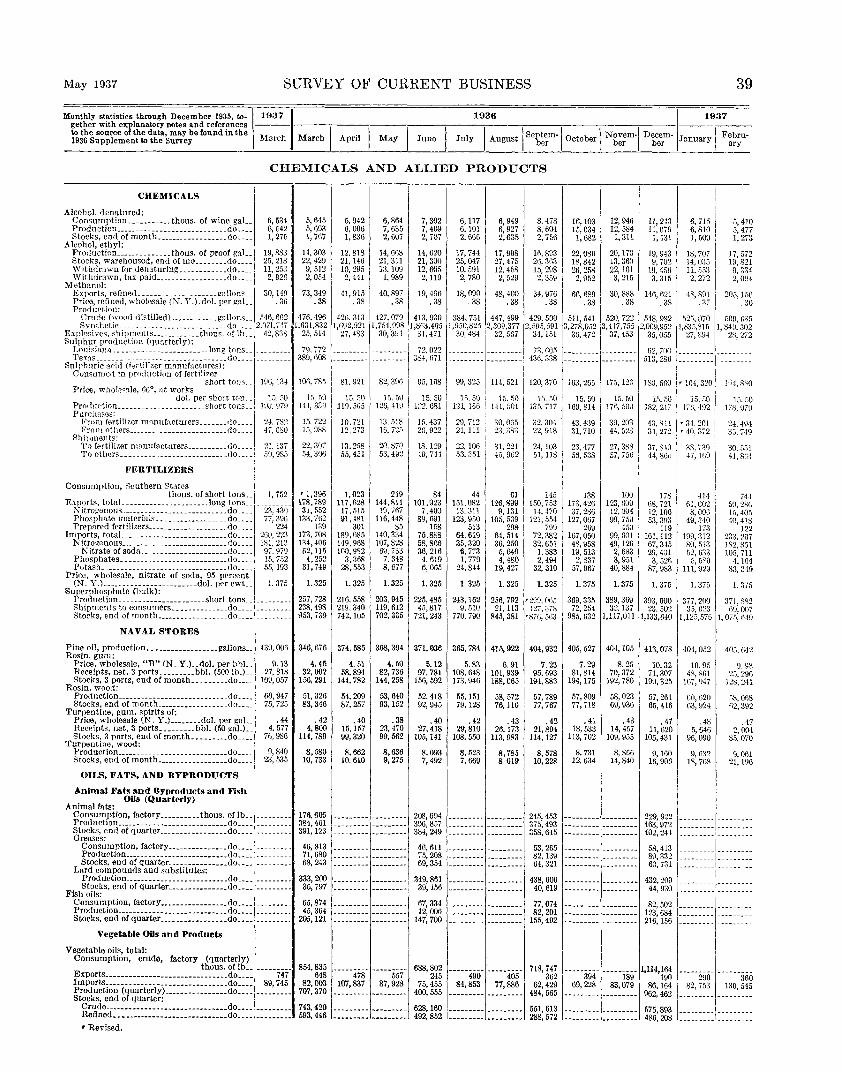
May 1937 SURVEY OF CURRENT BUSINESS 39
1936 1937 get her with explanatory notes and references --- ---.-------.----:-------;.------;----.,-----;-----.----c----1-------,---
Monthly statistics through December 1935, to-~19371
~J~~~~~~~~~~~::, ~~t,:'·s~r~~~e found in the March March I April I May I June I July I August I Seb~~m-1 October I N g:~m-1 D'i,c;rm- January I F~~~u-CHEMICALS AND ALLIED PRODUCTS
CIIEMICALS
Alcohol, denatured: Consurnption ....•...... thous. of wine gal__ Production ________ .. ________________ .. do .•• _ Stocks, end of month __________________ do ....
Alcohol, ethyl: Protlnctinn ______________ thous. of proof gal.. Stocks, warehoused, end of mo ________ do ___ _ Withdrawn for denaturing ____________ do .... \Vithdrawn, tax paid __________________ do ___ _
Methanol:
6, 534 6, 542 1, 275
19,883 25,218 11, 2.13
2, 926
Exports, refined ____________________ !mllone__ 30, 14(1 Prire. refined, wholesale (N. Y.).dol. per gal. . 36 Produrtion:
Crurle (wood distilled) ..•..•....•. gallons__ M6. 6fJ2 Synthetic .. ________ ----------- _______ do ___ -12,07l.7,fi
Explosives, shipments ____________ thoue. uflh_ -~ 42,838
SuTl,~~~~f~j,{;~,~~l-~~t-i~~ _<:_~~~~~r_l_Y}_: ____ long tnns __ ---------StJt~h~t~-ic-~;;;~i ·(r~~i;1 i:<;,; m_;;;;,ii,;;;i,iresi':_rto. -- -~---- -----
Consume•l in production of fertilizer short tons. 19G. 134
Price, who1·?.:::1le, 66°, R.t works 11
doL per short ton_ 15. iiO Prodnction ______________________ short tons __ 1!J3. 970 Purcha::es: i
From fertilizer mannfacturers ....... <lo ____
1
1 21, 7S2 From others _________________________ do____ 41, {iSO
Shit1ments: rro fr-rtilizer manuracturers __________ do ____ l 21. 137 To others _____ --------------------- .do.___ 50, 9S5
FERTILIZERS
Consumption, Routhern States I thous. of short tons ... i 1, 752
Exports, totaL-------------------- .long tons __ I_ Nitro~unous _______ .. __________________ do. ___ Phosphate rnat~rials .• ________________ do. __ _ Prepared lertili7.ers __________________ .. do. __ _
Imports, totaL------------- ____________ do .... N itro!lrnous _____________ ------ __ -----.do ___ _
Nitrate of soda ______________________ do .. .. Phosphates. __________________________ do .. .. Potash. _____ . __ ....... ________________ do. __ _
Price, wholesale, nitrate of soda, 9., percent (N. Y.) ________________________ do!. per cwt..
Superphosphate (hulk):
23, 4~D 77,396
224 260, 223 I); I, 213 97. 979 15,752 55, 193
I. 375
Production ______________________ short tons. ________ __ Shipments to consumers ______________ do ____ ---------Stocks, encl of month __________________ do .... ________ _
NAVAL STORES
Pine oil, production __________________ gallons .. Rosin. gum:
Price, wholesale, "B" (N. Y.) .. clol. per bbL. Receipts, net, 3 ports ......... bbl. (500 !h.) .. Stocks, 3 ports, end or month. ___ ..... do ....
Rosin, wood: Production _____ .. ________ ----- __ .. ____ do. __ _ Stocks, end of rnonth __________________ do .. __
Turpentine, gum. spirits of: Price, wholesale (N. Y.) ________ dol. per gaL Receipts. net, 3 ports ......... bbl. (-'0 ~al.) .. Stocks, 3 ports, end ofmonth _________ do ....
Turpentine, wood: Prodnction ____________________________ do .. .. Stocks, end of month. _________________ do .. ..
OILS, FATS, AND BYPRODUCTS
Animal Fats and Byproducts and Fish Oils (Quarterly)
Animal fats:
4~9. oor,
9. 1:\ 27,818
109,057
60,947 75,725
. 44 4. 577
7n, 986
9, 840 23, 535
Consumption, faetory __________ thous. or lb .. ---------Production ...... _._ .. _________________ do .. __ . ____ • __ _ Stocks, end of quarter _________________ do .... ---------Greases:
Consumption, factory _______________ do .... ---------Production .......... _______ --------- do. ___ . __ .. __ . _ Stocks, end of qnarter ............... do .... ---------
Lard compounds and substitutes: Production ...... _. __________________ do. __________ __ Stocks, end of quarter _______________ do .... ---------
Fish oils: Consumption, ractory _________________ do .... ---------Production ............ __ ------------- .rio ____ ------- __ Stocks, end or quarter _________________ do .... ---------
Vegetable Oils and Products
Vegetable oils, total: Consumption, crude, factory (quarterly)
thous. of lb __ ---------Exports ... ---------- ____ ------------ •• do.... 747 Imports _______________________________ do.... 89,745 Production (quarterly)------------- ___ do .. __________ _ Stocks, end of quarter:
Crude ..... _______ • ________ . __ •••••• _ do____ _ _____ . _. Refined ••• ------------------------ •. do. ______ ------• Revised.
5, 645 5, 693 1, 767
14,303 22 429 9:512 2, 054
73,349 . 38
476, 496 1,631,832
25, 514
79. 772 389, 608
106,785
1.\ [)\) Ill, 33!!
15,722 lfi, nss
22,307 54, 306
'1,396 178,789 31,552
133.762 139
173,708 134,406 62, 115
4,252 31,749
1. 325
257,728 238,498 953,739
346,676
4. 45 32,002
156, 291
51,:126 83,346
.42 4,800
114,789
8,580 10,733
176,605 384,461 391,123
46, 813 71,680 68,243
333, 200 36,797
65,874 45,364
205, 121
I
I
5, 942 6, 006 1, 836
6,864 7, 635 2,607
7,3021 6,1171 6, 949 6, 927 2,635
8. 478 8, 604 2, 756
16,103 15,034
12, 946 12, 584
II, 243 ll, 079
6, 715 6,810 1, 509
5,410 5,477 1, 273
7, 409 6, 101 2, 707 2, 66G 1,682 1, 311 1, 131
12. 818 21. 146 10,295
2, 4-ll
14, 6oS 21, 311 13, 109
1, 989
14,620 21,300 12,605 2, 119
41,915 40, 897 19, 496 .38 .38 .38
426. 3131427,079 413. 930 1,t192,92l 1,754,998 1,8n3,405
27,483 30,3\14 1 31,471
-==:=:=:: :::::::::13~~: m I
81. 921 82, 3961 95, 1G8
1s. so 1s. so I 15. 5o 119.5f;5 126,419 I 122,681 I
I lO. 721 13. 518 1<•. 437 12,273 16, 72.1 25, 9~2
13, 2.18 20. 870 18. 1 S9 55,451 53, 492 49, 744
1,023 117,628
17,515 91,181
301 189,085 149,968 100,982
3,368 28,553
1. 325
216,558 219,340 742.105
2-191 84 144,811 101 '923 19,767 7,400
116,448 89, 691 85 158
140,334 75,888 107, 828 58, Silo 69, 733 36, 216
7, 348 4. 619 8, 677 6, 065
1. 325
203,945 119, 612 702, 335
1. 325
225,485 45,817
721,243
374, 585 368,304 371,036
4. 51 58,894
144,782
54,209 87,257
.40 15, 157 99,320
8, 662 10. 610
4. 50 82,736
144,258
53, 640 93. 152
. 38 23, 470 99,562
8,636 9,275
5.12 97,781
156,592
52, 118 92,945
.40 27,418
105, 141
8,093 7,492
208,694 396,857 384,249
46, 611 75,208 69,354
349,861 39,156
67,334 12,006
147,700
17, 744 25,047 10,591
2, 780
17,998 27,475 12, 45S
2, 529
16. 893 26. 3fl3 15. 298 2,_359
18, 090 48, 400 34, 976 .38 .38 .38
:;s4, 7-" 447, 499 1 429, 5oo 1,9!i0,825 2,309,37712,695,591
30, 48! 32, 567 34, 151
-=======r======= 1~~: ~£~ 99, 325 1114, 521 1120, 370
1:\. 50 l 13. 50 II 15. fiO 121, 1661141, 501 135, 717
29, 712 30, or,.) 32, aot 21,111 23,:;s:; 22.~18
22,106 53,351
44 151, OS2
13.311 123, 950
513 64,619 35,320
fi, 773 1, 779
24,844
31,221 45, 962
61 126,899
9, 131 105,539
298 64,514 36,250
5, 640 4, 480
19, 427
I 21, 103 51, 118
145 150, 753
1-l. 470 121,554
799 72,382 32,651 l, 383 2, 494
32,310
22,086 18,842 26,258 2, 952
20, 170 13,360 22, lG! 3, 215
66, 689 30, 888 . 38 . 38
511,541 520, 722 3,278,0.1213,417,755
36, 472 37,453
========r======= 163,265 ' 175, 123
15. GO 169, 814
43, 4:J9 31, 710
n,477 56,538
138 173,426 37, 2t\6
127,067 269
167,050 48,958 19, 513 2, 837
57,967
15.50 176, 500
39, 203 44, 523
27, 388 57, 75G
100 123, tlll9
12,004 99, 750
45ll 99,001 49,126
2,683 3, 951
40, 884
19,943 9, 702
19, 456 3,315
18,707 14, o:~5 n, .oo:l 2, 272
17,572 19,821
9, 334 2,0U4
146, 621 48, 8~! . 38 . ol
205, 1.1)1) . 36
548. 982 1 523, 070 2,009,952 1,om,81.1
.100, fiS5 1, 84ll, 302
2~. 272 35, 055 27' 094
62, 700 513,286
lSO, 560
15.50 182, 21~
43, S!-l 3!, 27::!
37,810 44, SGu
178 68,721 12,106 53, 3U3
1!9 161, 112 67, 345 29,4:;1
3, 526 87,983
:::::::::1::::::::: i
IG-1, 320 I 1''4. s'o 15.W I 15.fJ0
1 7G, 4!)2 I 17H, 9itl
• 3-l. 201 1 2-1. 494 r 40, :)72 I 33, 7!9
3~. 7:;g 1
1
' 30, 5:,1 47, Wfl 41, sc 1
61,~!~~ li s,oo;;
49, :Ho !73
199, 312 80,513 52, !\33
5, 5RO 111,929
741 59, 2k{) 15,405 40,4lS
122 233. 207 182. R51 105,711
4. 164 :l3, 249
1. 325 1. 325
243, 162 256, 792 9, 510 21, 113
1. 3251 1. 375
'299, 065 369, 335
1. 375
389, 369 393, 600 377,200 371. 882
1. 375 ]. 375 l. 375
770, 790 845, 381
365,784
5. 83 108,648 173,946
55, 1.o! 79, 128
• 42 29,810
108, 550
8, 523 7, 669
415,922
6. 91 101, 939 188,065
58, 572 76, l!O
. 43 26.173
113, 983
8,785 8.019
127,378 72,254 '876, 563 985, 632
404,932
7. 23 95, 6\13
194,883
57,789 77,767
.42 21, 89i
114, 127
8, 578 10,228
245, 4.o3 375,493 358,615
53,265 82,139 64,321
438,606 40,619
77,074 82,201
155, 492
405, 527
7. 29 81,814
194,175
57,809 77,718
• 41 18, 533
113, 702
8, 731 12, 634
32. 137 23, 502 3->, 023 69,007 1,117,011 1,133,640 !,12ii,576 1, 07S, 640
404, 105 413,078 404,0521 403, 642
8. 25 10. 321 10. 95 9. 9R 70, 372 71, 307 48, Sf\1 2.1 296
192, 780 190,325 167, t)47 12~3: 241
58, 023 57, 261 GO, 620 r.s, OilS 69,936 65, 416 (13, 924 fi2, 392
.43 14, 457
109,955
8, 866 14,840
. 47 11, 620
105,431
9,160 16, 906
.48 5,646
96,090
9, 632 1~. 768
. 47 2, 004
85,070
9,0fil 21, Hl6
i:!TI .I. : 58,413 ---------1---------89,332 --------- ---------60,731 1--------- ------ --
432,209 1---------1---------
l~~ -I I
854' ~~ -----478' -----557' 688
' ~~; -----4iiii' -----4ii5' 718' ~g ~~ ~~ ~· ~w ~~ n• ~~
707,370 --------- --------- 400,555 --------- --------- 484,565
--------- --------- 1,114,161 394 189 190
69, 228 83, 079 86, 164 --------- --------- 962,462
290 360 82,753 130, 545
743,420 593,446
628, 160 492,852
551, 613 288,572
575,893 486,208

40 SURVEY OF CURRENT BUSINESS May 1937
1937 1936 1937 gether with explanatory notes and references ----1-----,----,----.----,----~---.-----.-----,----.------l-----;----
Monthly statistics through December 1935, to-~
to the source of the data may be found in the I I I I I I Sept m I I N I D I F b 1936 Supplement to the Survey March March April May June July August e • October 1 ovem- ecem- January e ru-ber ber ber ary
CHEMICALS AND ALLIED PRODUCTS-Continued
OILS, FATS, AND BYPRODUCTS-Con.ll
Vegetable Oils and Products-Continued
Copra: I j Consumption, factory (quarterly~hort tons.-1--------- 56, 394 --------- --------- 56, 449 _________ : ________ _ Imports _______________________________ do____ 15,192 14,976 16,971 11,908 11,631>, 17,416 14,789 Stocks, end of quarter .•......•.•...... do ____ --------- 31,902 --------- ••....... 16,896 1 ...••.... ---- ----
Coconut or copra oil: I -Consumption, factory:
~~~~~d <<;'::~:;!:rk=======~~~~-~~:~g~:~:: =========
1
zh27
,: 25~~3~i2·1·:=4io~.~3i33: 46:r3:92: •• : 95: -6:99::1· \1494~.: s~~6o~ 1.::3: 93~·.=s~~45==r.i==1i4i •• :.2;~.3~=. 1~~: ~l~ Imp~~t~,l~~~~~:~~:~~~-=================~~==== --i7."65i- I " ~ · l~: ~gt Pr8~t'tJ~~o~-~~~~~t_e:!:!~---------------do .... l--------- 69, 89~ '·--·----- •••••••• .! 72,049 : ----·----'---------11
63,004
C1;~ufidnee_d __ --_-_-_-_-_-_-_-_-_-_-_-_-_-_-_-__ --_-_-_·_·_·_-_::·_-_ddo0:-.:-.i::::::: :: 129,419 _________ l ________ _l 129,894 '. ________ _i --------- 77, 121
---------~--------- 143,565 --------- --------- so. 676
13.619 w. 211 I 10.916 23, 500 32, 712 29, 186
--------- ---------1 53, 142 --------- --------- 73,900
--------- --------- 59,551 --------- ---------: 15.458
st~c'l[~~~~(I'Of"Q.ii;lrter:-··-------------do .... l--------- 87' 20" ~---------·---------1 83• 629 ,------ --+--------~ 95• (;78
Cott~~seed: I 17,973 ··------- ---------~lti,074 ,---------1---------, 14,241
Consumption (crnsh) ____________ shorttons .. 31U,882 2;,4,2531 132,464 u,OS2
1
40,283 j 36,4.o.o 1102,451 '592,820 1718,126 Receipts at mills ______________________ do ___ _l Gl,O'i> 81,752 ! 31,0H 25,322 24,208 1 22,332 I 252,834 1,258,8!10 1,178,322 Stocksatmills,endofmo. ____________ do ____ i 3!4,17V 109,304' 97,884 52,124 36,049: 21,926,168,145 838,37911,274,173
C<ji~0P~~~~~-~~~-e-~_n_d--~-e-~l~--------------do ____ i lSI 781 11 74 38 38 I, 115
11 506 I
I 686, 251 i 656, 2-10 791, !l36 I 535, 511
1,377,955 i 1,258,226
I lH 532 , 549 999
Production0
__________________________ do____ , 11.5,476
1
62.530 • 3f\,509 1
20,271' 1>,50·1 i 46,774 204,173 331.248 827 I 160
310, 738 296, 173 209,660 214,731 Stocks at mills, end of mo _____________ do ____ 138, U6S 285,387 202,421 II 164,4.59 1 117, •>01 ' 6.\0.53 ! 45,561 126,014 190,068
Cottonseed oil, crude: I VV, 701 1 'I 1 I Production _____________________ thous. of lb .. I R1, 6421' 13,028 1 24, 31R 1 ll, 170 11,0.57 I 29.787 176.256 222,294 203,416 195,763 Stocks,endofmonth _________________ do ____ 100,950 113,\!.51 8il,G561 62,698
1 37,251 1 19,192 21l,547 92,667 121,398 143,182 142,021
Cottonseed oil. refined: I Consumption, factory (quarterly) _____ do ..•• --------- 241,109 ------ --1---------'1 2!13, 502 1---------•----- --- 332,216 --------- --------- 333,099 PJ~e~1;~~~~~.r~1iow:iii-iffiii-(ii:'Yydo ____ -----~~-- s, 11s i 8, 31i 1, 361 6, 649 7, 612
1
1, 608 9, ost 10, o42 10,373 12. 689
dol. per lb__ 1 094 • 094 1
088 II . 091 . 098 .101 . 102 . 099 . 100 I . 110 Production _____________________ thous. of lb__ 134, 2.i4 Rl', 2o9 65, 185 41, 196 40, 443 29,637 22,725 92,306 179,721 183, 5,og ws. 381
8, 900
;;, 713 39, 345
58~. 373 20\J, 533 8S5, 386
41,966
5, 587 21,643
417. 753 102, 577 570,210
4~8 321 25l,c861 191.87-l 224,460 I 198,768
175,942 I 129, 311 146,396 128, 164
---------'---------13, 752112,911
.114 .110 167, 3')2 141, 777 460, 448 529, 781 Stocks, end of month _________________ do ____ 57U, 427 .so~. :l37 487,994 46(, 213l 408,944 318,8731237,220 228,764 307,369 385,250 .
1. 418,087
Flaxseed: Imports _______________________ thous. of bu__ 4, 084 1, 496 1, 037 1, 244 1 747 117 6il 1, 813 1, 747 2, 707 1, 489 1, 139 3, 727 Minneapolis and Duluth: 740 · ,,
46 1.,8
Sh!pments _________________________ _cto____ 541
131 95 160 181 291 665 318 3, 466 264 310 11 1 Receipts ____________________________ do....
11 224 172 270 I 5421 2f5
1
1 1, 539 336
1
703 484 3%
.stocks, end of month _______________ do____ 1, 2461 791 535 I 348 285 668 783 742 709 470 501 488 0'b~d;~n\~~/:,"~~~l?:)_: __________________ do____ ~· 17? 7, 094 __ ------- ____ ----- 5, 168 ---------~---------~ 4, 817
1
____ ----- --------- 6, 931 ~------ ___ ---------Stocks, end of quarter _______________ do____ '002 2, 434 1---- _____ I ____ -----~ 2. 222 ------ ___ --------- 2, 083 --------- --------- 2, 864 __________ --------
~~~3~~?~~e(~:~P ~~tJ.:~~!~!~tgg~s~~~ ~~:: ---;~-~~- ----~~~~.1.---~~:~-~----~~~:- ----~~::. ----~~~~_! ____ :~~~- ----=~=~- ----~~~~- ----=~=~- • 4l,. 93.032811 ---6·,=4~92~,-~'----6-,=2~9=· 9~ Stocks, Argentina, end of mo ...•.•..•. do____ '• S74 5, 315 i 6, 299 I 6, 693 5, 906 6, 299 I 5, 906 5, 512 I 3, 937 2, 756 "
Exports ____ ---------- __________ thous. oflb.. , • 42, 379 33, 233 27, 117 25, 794 20, 469 24, 140 32, 581 37, 625 40.403 56, 569 35,468 40, 7f>G Linseed cake and meal: I 61 • 41 I
Shipments from Minneapo}is __________ do ____ l_________ 21,748 23,715 15,649 15, 104 12,891 Ill, 365 1 3, 205 11,313 12,229 10,068 9, 163 7, 2.16 Linseed oil: 1 1
Consumption, factory (quarterly) I 1
Price, wholesale (N. Y.l-------~a~l."i>~:IL ----:io4- 6.5: g~~ ----~095+·-·:oii4" 84: ~~~ ~----~ioor··~iii3" 79
: I8f ----~09ii-,----~ii93" 78: M~
Pn;>duction (quarterly) __________ thous. of lb.. l:iu, o77 lr~·. ~Zb ~---ii-, 372 ___ iii,_868. 100, 119 ---------1----- ____ 91,098 ------~--._ 6·-~-~--- ------~-~--~--~--9-- 131,899 Slupments from Mmneapohs __________ do ____ --------- 12,932 7, 273 1 5, 106 3, 538 4, 784 Stocks at factory, end of quarter ________ do. ___ --------- 187,466 --------- --------- 140, 666 ---------~--------- 98,411 117, 268
.101
5, 319
Oleomargarine: 1· , ! Consumption (tax-paid withdrawals) ! I
thous. oflb__ 35, 739 32,368 32,464 26,911 22,549
1
26,796 1 31,805 34,426 35, 144 34,365 38,806 34,025 Price, standard, uncolored (Chicago) I
dol. per lb__ . 150 .145 . 143 . 130 .125 I .125 . 134 . 138 . 140 .140 .142 . 1.50 Production _____________________ thons. of lb.. 35,894 33,794 32,302 25,580 25,834 27,695 30,351 33,711 35,586 34, 209 38,773 30,956
Vegetable shortenin~s: 1 Price, tierces (Chicago) _________ dol. per lb__ .136 .117 .117 • 109 .107 .117 i
PAINTS l Paint, varnish, lacquer, and fillers: 1 37
, 86
, '1' I Total sales of manufacturers .• thous. of doL v 29, 912 36, 209 40, 950 38. 736 33,919
Classified __ ------------- ____________ do.... 26, ~03 20, 728 25, 199 28,026 26, 587 23, 393 IndustriaL _______________________ do____ 12,214 9, 282 11,021 10,746 10,795 10,287 Trade _____________________________ do____ n.· ~~~ 11,446 14,178 17,280 15,792 13,106
Unclassified _________________________ do.... 9, 185 11,010 12,924 12, 149 10,526 Plastic, cold -water paints, and calcimines:
Sales of manufacturers: Calcimines ______ -------- .. ________ dollars __ ---------Plastic paints _______________________ do ____ ---------Cold-water paints ___________________ do ____ ---------
CELI,ULOSE PLASTIC PRODUCTS
Nitro-cellulose, sheets, rods, and tubes: Production ______________________ thous. of lb __ ---------Shipments.--------- _________________ _do ____ ---------
Cellulose-acetate, sheets, rods, and tubes: Production _____ .-------- ________ thous. o!lb .. ---------Shipments.----- ____ ------------ _____ .do .• __ ----- ·---
ROOFING Dry roofing felt:
Production. _________ ------- ____ .short tons .. Stocks, end of month __________________ do .•••
Prepared roofing shipments: TotaL ____________________ thons. of squares __
Grit rolL ____________________ • ___ •.•. do .•.• Shingles (all types) __________________ do ___ _ Smooth roiL_------------------ _____ do .•.•
• December I estimate.
31,015 6, 324
2, 329 540 587
1, 202
293, 756 44,520
134,803
1, 224 I, 239
785 939
22,528 7, 999
2, 451 566 681
1, 205
348,953 3M, 356 306,656 261,462 47,407 51,758 54,817 49,389
147, 160 175,088 158,285 139,565
1, 388 1, 345 1.154 1,225 1,319 1,288 1, 206 1, 198
1, 221 980 1, 061 1, 002 1, 097 921 850 746
23,713 22, 391 21,956 20,209 7,086 8, 630 10,479 10,583
2, 744 2,103 2, 361 2,509 634 566 653 637 887 740 795 784
1, 223 I 797 913 1, 088
.124
33, 380 23.333
Q, 095 13,243 11.041
297, S78 50,267
133,825
I, 463 I, 501
1, 162 I, 468
21,833 9,5GO
2, 994 783 gog
1, 303
.125
33,450 22,338 9,504
12, 774 11,112
292,071 47,268
149,3331
1, 787 1, 532
I, 204 1.027
23,083 7,523
4,306 1, 181 1,119 2,005
.120
34,049 23,192 10.628 12, 564 10,857
279,193 41,672
138,903
1, 806 1, 648
I, 462 1,316
25,907 5,853
3,899 998
1,140 1, 760
.120
28,503 20,037 10,018 10,019 8,466
222,965 35,902 95,783
I, 594 1, 420
1, 438 1, 313
25,628 5, 753
2, 592 633 626
I, 333
.130
29,465 19. 759 10,223 9, 536 9, 705
251,068 33,895 98,048
1, 398 1, 479
l, 255 1,112
21,361 6,381
1, 452 327 385 750
.137
30,202 20,726
9, OBO 11, 646 9, 476
295, 405 32,091
119,037
1, 715 1, 561
853 742
2·!, 547 I 9, 545
,,~I 516 549
I, 321
.099
5, 693
28, 169
. 150 30,638
.135
29, 749 20,257 9, 518
10, 739 9, 492
302,414 34. 768
135, 676
1, 9iG I, 687
1. 270 I, 397
27, 031 5, 228
3, .589 774 785
2, 030

May 1937 SURYEY OF CURRENT BUSINESS 41 --~------·--c.=--=---=-========;===;=------=-=·-=·==
19371 Monthly statistics through December 1935, to
gether with explanatory notes and references to the source of the data may be found in the 1936 Supplement to the Survey March March ! April i May I June
1936 •
1
1937
July I August I Septem-1 October I Novem-j Decem- January I Febru-ber her her ary
ELECTRIC POWER AND GAS
ELECTRIC POWER
Production, total , ___________ mills. of kw.-hr __ 10, 236 By source:
Fuels , __________________ ------------do____ 6, 355
Bi"t~~! gr;r~d~c-ei:------------------do ____ [ 3, 882 Central statwns , ___________________ do____ 9, 636 Other producers _____________________ do____ GOO
Sales to ultimate consumers, total (Edison Electric Institnte) ________ mills. of kw.-hr __ --------.
Domestic service ______________________ do ___________ . Commercial-retaiL __________________ do ____ ---------Commercial-wholesale _______________ do ____ ------- __ Municipal street lighting _____________ _do ____ ---------Railroads, electrified steam ____________ do ____ ---------Railroads, street and interurban _______ do ____ ---------
Revenues from sales to ultimate consumers (Edison Electric Institute) ____ thous. of doL --------·
GAS Manufactured gas: t I
Customers, totaL ___ ------------thousands •.... ___ ... Domestic ... ______ -------------- ___ .do .. --~-- __ ._._. House heating _____________________ .do ____ . --------Industrial and commerciaL _________ do ____ ---------
Sales to consumers ___________ mills. of cu. ft .. ---------
~~:~s~~atin~g--~ ~:::::::::::::::::::~~::::I::::::::: Industrial and commerciaL •.....•.. do .... ---------
Revenue from sales to consumers I
I , s. 906 I ',5, 115 1 r 3, 791 1
r 8, 425 481
6, 913 1, 254 1, 256 3, 649
209 83
394
165,650
'9, !\14 '8, 907
'130 '466
'31,483 '17,423
r 5, 223 '~- 632
'&. 893
4, SiS '4. 015
'8, 417 475
7, 069 1, 223 1,281 3,842
193 86
375
165,703
'9, 551 '8, 940
'133 '467
'30, 473 '17,107 '4,179 '9,000
r 9,087
'5. 164 3, 923
'8, 606 481
7,085 1, 165 1, 266 3, 975
180 77
354
164, 015
'9,160
'5,885 '3, 275
'8, 630 530
7, 264 I, 144 1, 275 4,197
159 74
346
164,007
r9,G34 '9,616 ' 9, 023 '9, 012
' 136 ' 130 '4641 '464
' 28,912 ' 27, 255 '17,26G '17,465
r 2, 775 r 1,021 r 8, 699 r 8, 622
thous. of doL ---------Domestic ... ------------------------do. ___________ _
'31, 094 '30, 352 ' 30,097 r 21, 412 r 21, 5il8 r 22, 508
'29, 028 r 22,437
r 7fi5 r 5, 721
House heating ______________________ do ____ --------- '3, 478 '2, 558 '1, 537 Industrial and commerciaL _________ do ____ --------- r 6, 065 r 6, 049 r 5, 923
Natural gas: t Customers, totaL _______________ thousands .. --------- '6, 562
Domestic ___________________________ do____ _________ '6, 066 Industrial and commerciaL _________ do ____ --------- '494
Sales to consumers ___________ mills. of cu. ft.. --------- '113,121 Domestic ___________________________ do ____ --------- '40, 764 Industrial and commerciaL _________ do ____ --------- '70, 967
'6, 556 '6, 067
'487 '105,534 '33, 266 '70, 760
' 6, ,562 ' 6, 538 , 6. 085 I , 6. 087
r 474 r -149 ' 92, 001 ' 84, 385 '24, 720 ' 17,502 r 65, 935 r 65, 805
I
'9, 6821
, 6, 537 I '3, 144 '
, 9,121 561
7. 519 1,159 1, 317 4,362
171 99
342
167, 672
'9, 641 '9,0H
'125 r 41)4
'25,163 '15, 967
'629 '8, 390
'27, 121 '20, 956
'493 '5, 569
r G, 536 '6, 093
'442 r 82,166 '14,348 ' 67, 007
r 6, 748 '3,066
t 9, ~~~
7, 723 1,180 1, 361 4, 487
188 97
340
169, 636
t 9, 654 '9, 0.16
t 127 r 4fi3
t 23, 743 '14, 939
'484 t 8,18:1
'25, 748 r 19,772
'398 t 5, 467
'6, 565 '6,120
'444 '84, 735 '13, 256 '70, 271
I I I T 9, 722 10,1761 '9, 785 II;
t 6 775 I t f), 424
10,5281 '10, 151
'6, 695 1 3,027
'9, 178 544
7, 910 1, 261 1, 402 4,540
197 99
338
175,597
3: 401 I' 3, 362 I
' 9 641 ' 9, 1821
8: ~~: 1 8. ~~~ 1, 324 1, 419 1, 421 ! 1, 459 4, 5741 4, 315
214 225 110 112 374 I 392
179, 972 1183, 066 '
I t 9, i30 r 9. 762 t 9, 737
'9, 103 '165 '460
'30, 824
'9.121 •9,142 '139 '1.55 r 4fi2 t 453
' 25, 753 ' 28,863 ' lfJ, 682 '18, 156
'541 ' 1, .580 ' 16, 335
t 4, 965 '9, 323
G, 879 :J, 649
9, 910 618
8,154 1,482 1. 501 4. 298
235 124 1
43:l
187,094
t 9, 754 I '9,110 !
'172 !
'462 '33, 853 '16, 502 '7, 458 '9, 660 ' 8, 3781 ' g_ 934
' 27, 824 ' 30, 213 ' 21, 583 . ' 22, 946
'30, 700 ' 32, 425 r 21, 63V r 21, 5i9
' 497 ' I, 184 ' 5, G40 ' 5, 959
'6, 610 r 6,162
'446 '87, 869 '13, 980 '72, 637
'6, fl90 '6, 208
'480 '95, 107 '19, 105 ' 74, 956
' 2, 683 ' 4, 157 '6, 236 ' 6, 547
,. 6, 78-1 '6, 268
'514 '112,410 '30, 403 '80, 938
r 6,805 '6, 282
'521 r 12,1,409
1
'40, 988 '83, 016
'(i, 315 '3. 835
T 9, .~56 r 5U.~ I
R, 359 l,tiN:i 1, tiHi 4. 2.'8
21H 118 410
194 .. 1.54
0, 769 9, 131
161 46~)
32,470 17,373
fi, 134 s, 750
31,967 21,834 3, 799 (i, 197
6, 754 6, 236
514 129,312 47,159 80,892
'9, 244
T ,r,, 759 '3, 485
'8, 687 t 5fl7
9, 802 9,162
166 464
31,860 Hi, 44~
6, 173 n, 04G
30, 724 20, 39() 4, 02\1 (i, 172
6, 704 6, 251
512 135, 179 48, ],52 85, 627
thous.ofdoL --------- '41,395 '36,982 '30,481 '25,840 '23,857 '23,722 '24,667 '28,645 '36,827 '43,926 47,847 48,975 Revenues from sales to consumers I
Domestic ___________________________ do ____ --------- '26, 258 '22, 342 '17, 462 '13, 501 I' 11,597 '10, 992
1
'11, 456 '14, 330 '20, 501 '2fl, 328 I 30, oss 30, 525 Industrial and commerciaL _________ do ____ --------- '14, 918 I' 14.417 i '12, 833 1 '12, 210 '12, 132 '12, 570 '13, 047 '14. 172 '16, 165 \ '17, 389 I 17,558 18, 162
-------------~--~--~'---~---'----·----·-~--~-------~-~---~----
BEVERAGES
Fermented malt liquors: Consumption (tax-paid withdrawals)
thous. of bbL Production. ___ ---------------- ______ ,do ___ _ Stocks, end of month _________________ do ___ _
Distilled spirits: Consumption, total (tax-paid withdrawals)
thous. of proof gaL. Whisky _____ -----------------------do ___ _
Production, total._----------------· •• do ___ _ Whisky .. ----------- ________________ do ___ _
Stocks, total, end of month ___________ do ___ _ Whisky ___ ------------------ _______ ,do ___ .
Rectified spirits: Consumption (tax-paid withdrawals)
thous. of proof gaL.
DAIRY PRODUCTS Butter:
Consumption, apparent_ _______ thous. of lb __ Price, wholesale (N. Y .), (92-score)
dol. per lb .. Production creamery (factory).thous. of lb __ _ Receipts, 5 markets ___________________ do ___ _ Stocks. cold storage, creamery, end of month
thous. of lb __ Cheese:
Consumption, apparent_ ______________ do ___ _ Imports ______ . _____ .---_------- _______ do ___ _ Price, No.1 A mer. (N. Y.) ______ dol. per lb __ Production (factory) ___________ thous. oflb __
American whole milk _______________ do ___ _ Receipts, 5 markets ___________________ do ___ _ Stocks, cold storage, end of mo ________ do ___ _
American whole milk _______________ do .•
'Hevised.
FOODSTUFFS AND TOBACCO
4,176 .>, 054 8,345
7, 045 5, 835
22,385 21', 255
422,883 108,510
2, 907
3, 738 4,433 7,333
6,203 5, 531
22,691 21,612
258,221 248,946
2,335
135, 993 ' 124,620
36 .32 119, 604 ' 121,258 42, 896 45, 829
6, 741
61,675 6, 347
18 47, 553 32,780 11,790 85, 223 73,827
5, 346
57, 43R 5, 693
, 17 ' 46 241 '32, 410
15, 164 73,952 62.261
3,887 4,970 8,208
6,177 5,390
23,251 21,917
273,798 264,389
2,367
131,896
.31 130,928 48,379
4, 997
62,127 4,217
.15 48,816 37, 089 13,398 67,776 55,756
I !
5, 041 1 5, 600 5, 418 I 6, 061 8, 409 8, 633
5, 666 I 5, 229 4, 760 4, 288
23, 373 24, 27 4 22, 158 22, 693
290, 739 310, 793 281, 208 300, 653
2, 0441 1, 937
162,006
.27 178,028 56,537
21,157
70,165 3,152
, 15 65,339 52,395 14,206 70,783 56,946
132,596
.30 185,223 69,435
73,816
76, !50 4, 257
, 17 83,132 67,101 21,191 85,788 70,282
I 6, 670 I 5, 938 4, 985 I 6. 791 5. 771 I 5. 183
1
8, 525 8, 122 8, 082 .
5, 8231
1
5, 200 I 6, 931 I 4, 643 4, 279 5, 952
21, 720 19, 763 23, 698 19,994 17,824119,063
325, 990 1339,820 352, 151 315,936 328,808 341,264
2, 1591 I, 9361 2, 783
122, 804 ! 131, 579 1135, 667
.341 .361 .35 152, 001 139, 363 131, 862 54, 676 44, 7921 44, 637
103, 259 112, 106 108,835
60,370 53,897 I 53,331 5, 463 6, 452 5, 796
. 20 . 21 i , 20 63,922 57,693 I 55,389 53, 032 44, 451 43,l\_QJ 18, 479 1o, 981 I 12, o98 97,403 ' 107, 542 ' 114,990 80, 735 ' 90,471 ' 98,206
4, 249 4,097 7, 722
9, 724 8, 202
27,625 20,299
364,023 352,639
4,074
139, 245
, 33 135, 140 47,202
105,368
59,392 5, 675
, 19 57,738 44, 965 13,386
118,907 102,847
3, 640 3, 399 7, 319
11,567 9, 643
22,973 18,868
373,330 361,318
4, 858
131, 760
. 34 113,985 39,587
88,866
56,953 5,881
, 18 46,786 33, 150 12. 524
!14, 706 98, 975
I 3, s31 I 3,6651 6, 945
10,609 8, 907
25, 188 22,289
387,322 374,629
5, 044
137, 441
, 34 108, 703 39,310
61,234
,\3, 092 6, 229
.18 42,629 29,610 11, 311
110,400 95,418 !
3,05fl 3, ()57 7, 407
5, 3141 4, 528
21,109 19, 171
402.099 388,416
2,123
124,930
, 34 103,900 37,067
42,734
55,745 5, 022
, 18 41,599 27,425 11, 548
102, 112 88, 0()1
3, 140 3,537 7, 660
6,804 5, 779
14,203 12,836
408,.198 394,947
2, 497
125,872
, 34 100, 91l9 36,236
'20, 678
53,202 4,697
.18 39,622 27, 174 11,.545
'93, 114 80, 713
t Hevised series. Manufactured and natural gas revised for period 1929-36. For revicions see tables 20 and 21, pp. 19 and 20 of this issue. , Data revised for 1936. Revisions for Jan., total production 9,247, fuels, 5,882, central stations, 8,748; February, total production 8,601, fuels, 5,682, water power, 2,919,
central stations, 8,120.
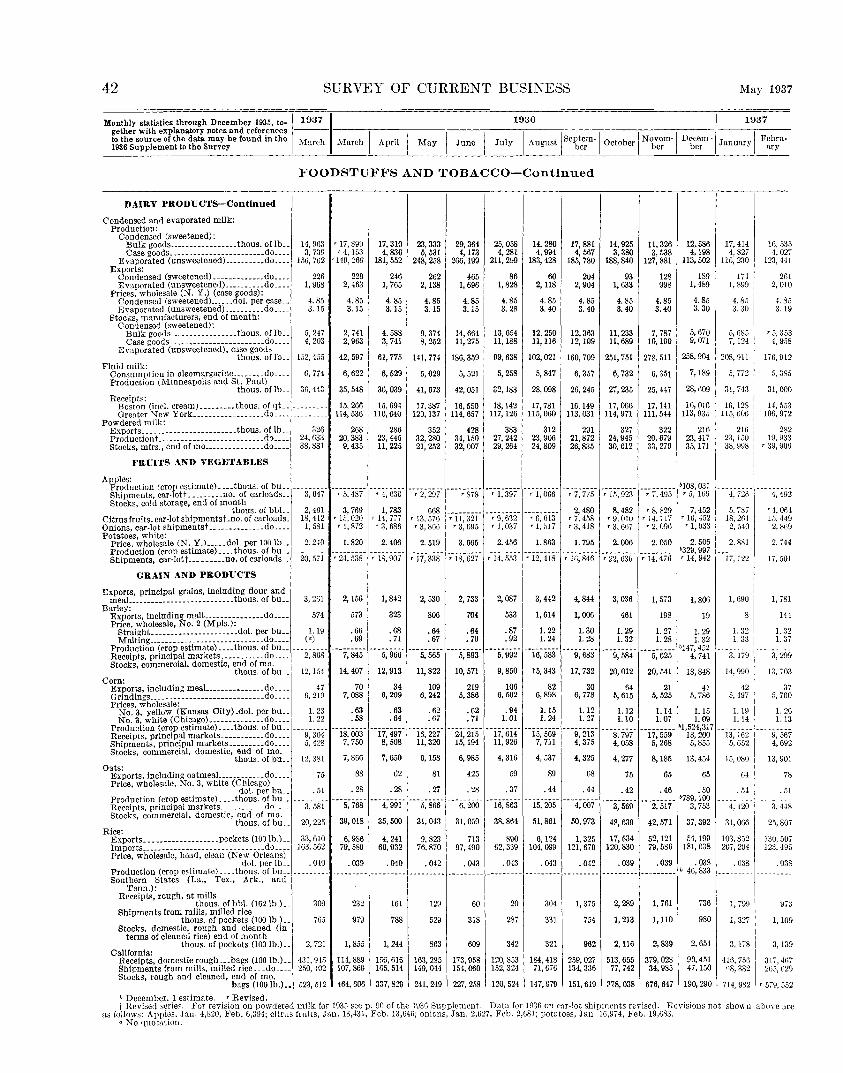
42 SURVEY OF CURRENT BUSINESS May 1937
Monthly statistics through December 1935, to- I 1937 gether with explanatory notes and references I 1936 1 1937
to the source of the data may be found in the March 1936 Supplement to the Survey March I April I May I June I July I August ISelf,~rm-1 October I N'b~~m-1 D'i,ceerm -1 January I F~~~u-
FOODSTU:PFS AND TOBACCO-Continued
DAIRY PRODUCTS-Continued
Condensed and evaporated milk: Production:
Condensed (sweetened): Bulk goods _________________ thous. of lb .. Case goods. __ ------------------ ___ do ___ -
Evaporated (unsweetened) __________ do ___ _
14,963 '17,890 3, 739 ' 4, !53
156, 762 ' 149, 269 Exports:
Condensed (sweetened) ____________ _do____ 226 Evaporated (unsweetened) __________ do____ 1, 968
Prices, wholesale (N.Y.) (case goods): Condensed (sweetened) ______ dol. per case .• Evaporated (unsweetened) __________ do ___ _
Stocks, manufacturers, end of month: Condensed (sweetened):
4. 85 3. 15
Bulk goods _________________ thous. of lb__ 5. 2.!1 Case goods ________________________ do____ 4; 203
Evaporated (unsweetened), case goods thous. of lb__ 152, 455
Fluid milk: Consumption in oleomargarine ________ do____ 6, 774 Production (l\Iinneapolis and St. Paul)
thous. oflb__ 3G, 413 Receipts:
Boston (incl. cream) _________ thous. of qt._ Greater '\ew York __________________ do ____ ---------
Powdered milk: Exports ________________________ thous. of lb __ Production t ________ - --------------- __ .do_---Stocks, mfrs., end of mo _______________ do ___ _
FRlJJTS AND VEGETABLES
326 24, 633 38,881
229 2, 463
4.85 3.15
2, 741 2, 963
42,597
6, 622
35,548
15, 266 114, 536
268 20,383 9,435
17,310 4,830
181,552
246 1, 765
4.85 3.15
4, 588 3, 741
61, 775
6, 529
36,039
15,694 110,640
286 23,445 11,225
23,333 5, 531
248,258
262 2,138
4. 85 3.15
9, 374 8, 252
141, 774
5,029
41,673
17,387 120, 137
352 32,280 21, 252
29,364 4,173
266,199
465 1, 696
4. 85 3.15
14, 664 11, 275
186, 359
5, 521
42, 051
16,550 114, 657
428 34, 150 32,007
25,058 4, 281
211,299
86 1,828
4.85 3. 28
13, 654 11,188
99,638
5, 258
32,183
18, 142 117, 126
383 27,242 29, 264
14,280 4,994
183, 428
60 2,118
4. 85 3. 40
12, 250 11,116
102,021
5, 847
28,098
17,781 115,060
312 23,906 24,809
17, 881 4, 567
185, 780
204 2, 904
4. 85 3. 40
12,363 12, 109
14,925 3,380
188,840
93 1, 633
4. 85 3. 40
11,233 11,689
160, 709 251,751
6,357
26,245
16, 149 113, 031
291 21,872 26,835
6, 732
27,235
17,066 114,971
327 24,945 30,612
11,326 3,538
127,881
128 998
4.85 3.40
7, 787 10, 190
278, 511
6, 351
25,447
17, 141 111, 544
322 20,679 33,270
12,586 4,198
113,502
189 1,489
4. 85 3. 30
5, 670 9, 071
258,904
7,189
28,609
16, 016 !13, 935
216 23,417 35,171
Apples: Production (crop estimate) ____ thous. of bu .. --------- --------- --------- --------- --------- '108,031 Shipments, car-lott _________ no. of carloads.. 3, 647 '5, 487 '4, 630 '2, 297 '878 '1, 397 '1, 066 '7, 775 ' 15,923 '7, 495 '5, lti9 Stocks, cold storage, end of month
thous. of bbL Citrus fruits, car-lot shipmentst .no. of carloads. Onions, car-lot shipmentst_ _____________ do ___ _
2, 461 18,412
1, 581
3, 769 , 15,020
r 1, 872
1, 783 r 14, 7-;7 '3, 686
668 --------- --------- ---------' 13, 576 '11, 321 '9, 632 '6, 613 •3,865 •3,695 •1,037 •1,517
2, 480 '7,458 '3, 418
8, 482 '9, 010 '3, 667
'8, 829 r 14,717 '2,096
Potatoes, white: Price, wholesale (N. Y,) _____ dol. per 100 lb__ 2. 240 1. 820 2. 406 2. 519 3. 665 2. 456 1. 863 1. 795 2. 006 2. 050 Production (crop estimate) ____ thons. of bu .• --------- --------- --------- --------- --------- ---------Shipments, car-lott---------no. of carloads__ 20,571 '24, 538 '18, 907 '17, 338 '18, 627 '14, 553 '12, 418 '16, 846 '22, 630 '14, 476
GRAIN AND PRODUCTS
Exports, principal grains, including flour and meaL _________________________ thous. of hu__ 3, 261
7, 452 r 16, 452 'l, 933
2. 505 '329, 997 '14,942
1,806
17,414 4, 827
116, 230
174 1,899
4. 85 3. 30
5, llS5 7,124
208,911
5, 772
31, 743
16,128 115,606
2Hl 23, 150 38,998
In, .53 4, 02
123,44
261 2, 010
·!. 85 3. 19
T 5 353 4:958
176,912
5, 38
31,000
14, 553 106,972
28' 19,93
'39, 90
---4; 726 -I,----4; 492 5, 787 • 4, 06
18, 261 15, 44 2, 540 2, 86
2. 881 2. 74
17, 122 17, 50
1, 690 1, 78 Barley:
Exports, including malt__ _____________ do____ 574 Price, wholesale, No. 2 (Mpls.):
Straight ______________________ dol. per hu__ 1.19 Malting _____________________________ do____ (")
Production (crop estimate) ____ thous. of bu __ ---------
2,156
573
.66
.69
I, 842
323
2, 530
806
2, 733
704
2, 087
533
3, 442
1, 614
4, 844
1,006
3, 036
461
1,573
198
. 68 . 64 . 64 . 87 1. 22 1. 30 1. 29 1. 27 !. 29 1. 32 1. 3
. n . 67 • 70 . 92 1. 24 1. 28 1. 32 1. 28 1. 32 r. 33 1. a,
191 8 14
7,845 ---:s:9iiii- 5,565 -·-:s:s93- ---:s:992- --~6:583- ---9:iis3- ---9:584- ---5:iiz5- '14~:m ---s.-ii-9-~----3;29-Receipts, principal markets ___________ do____ 2, 808 Stocks, commercial, domestic, end of mo.
thous. of bu._ 12, 154 14, 407 12, 913 11, 822 10, 571 9, 850 15, 343 17, 732 20, 012 20, 541 18, 848 14, 990 13, 70 Corn:
Exports, including meaL _____________ do____ 47 70 34 109 219 106 Grindings _____________________________ do____ 6, 210 7, 088 6, 209 6, 242 5, 386 6, 502
82 6,898
30 6, 778
64 5, 615
21 5, 525
41 5, 786
42 5, 497
Prices, wholesale: No.3,yellow(KansasCity).dol.perbu •. 1.23 .63 .63 :~~ .62 .94 1.15 1.12 1.12 1.14 1.15 1.19
37 5, 760
1. 20 1.13 No.3, white (Chicago) ______________ do____ 1. 22 . 58 . 64 v • 71 1. 01 1. 24 1. 27 1.10 1. 07 1. 09 1. 14
Production (crop estimate) ____ tlJous. of bu __ --------- --------- --------- --------- --------- --------- --------- --------- --------- '1,524,317 --------- -- _____ _ Receipts, principal markets __________ _do____ 9, 304 1~.· ~gg 17, 497 16, 227 24, 215 17, 614 15, 569 9, 213 8, 797 17,559 18,200 13, 162
13,454 7,866 7,650 6, 158 6, 985 4, 316 4, 537 4, 325 4, 277 8,185 15,080
Shipments, principal markets _________ do____ 5, 428 8, 508 11,320 15, 194 11,926 7, 711 4, 375 4, 058 5, 268 5, 855 5, 652 Stocks, commercial, domestic, end of mo.
thous. of bu.. 12, 381
88 62 81 425 59 89 68 75 65 75 65 Oats:
Exports, including oatmeaL __________ do ___ _ Price, wholesale, No.3, white (Chicago)
64
. 54
9, 56 4,69
13,90
.f> dol.perbu __ .51 .28 .28 .27 .28 .37 .44 .44 .42 .46 .50 Production (crop estimate) ____ thous. of bu .• -------------------·---------------------------------------------------------------------- '789, 100 --------- ________ _ Receipts,principalmarkets ___________ do ____ 3,581 8,768 4,991 5,866 6,200 16,863 15,205 4,007 3,569 2,517 3,753 4,120 Stocks, commercial, domestic, end of mo.
thous. or bu__ 20,225 39,018 35,500 31,043 31,059 38,864 51,861 50,973 48,639 42,571 37,392 31,066 Rice:
Exports ___________________ pockets (100 lb.)__ 33, 610 Imports.------------------------- _____ do____ 163. 562 Price, wholesale, head, clean (New Orleans)
dol. per lb__ . 040 Production (crop estimate) ____ thous. of hu __ ---------Southern States (La., Tex., Ark., and
Tenn.): Receipts, rough, at mills
thous. of bhl. (l62lb.) __ Shipments from mills, milled rice
tho us. of pockets (100 lb.) __ Stocks, domestic, rough and cleaned (in
terms of cleaned rice) end of month
309
765
thous. of pockets (100 lb.)__ 2, 721 Cali!ornia:
Receipts, domestic rough ___ bags (100 lb.) __ Shipments from mills, milled rice ... do ___ _ Stocks, rough and cleaned, end of mo.
bags (100 lb.) ••
' December. 1 estimate. 'Revised.
431, 9-!5 250, -!02
523,512
6, 986 79,589
4, 241 60,932
9, 823 76,870
713 97,490
890 62,339
6,124 104,099
1, 325 121, 670
17,534 120,830
52,121 71),586
54,199 181, 638
103, 8.12 207,204
-~ -~ .00 .00 .00 ,00 .00 -~ -~ -~ . 038 --------- --------- --------- --------- --------- --------- --------- --------- --------- b 46,833
232
979
1, 855
114,889 107,869
464, 606
161
788
1, 244
Vi6, 616 165, 514
337,829
129
529
863
163, 295 149,044
241, 2·19
60
318
609
173,958 154,060
227,258
20
287
342
120, 853 152, 324
120, 524
304
331
321
184,418 71, 676
147,979
1, 375
754
962
259,027 134, 336
151,619
2, 289
1, 213
2,116
513, 655 77,742
?78,038
1, 761
1,110
2, 839
736
980
2, 654
1, 799
1, 327
3,178
379, 028 90,451 416, 756 34,9851 47,150 •18,382
676,647 190,290 ' 714 982
3, 4±8
25,801
130,50 123, 49
. 03
g;·
1,109
3, 13
3l7, 46 2()5, 62
r 579 55
t Hevised serie,. For revision on powdered milk for 193.1 seep. 90 of the 1936 Supplement. Data for 1936 on car-lot shipments revised. Revisions not shown above are as follows: Apples, Jan. 4,820, Feb. 6,394; citrus fruits, Jan. 13,431, Feb. 13,646; onions, Jan. 2,627, Feb. 2,681; potatoes, Jan. 16,974, Feb. 19,683.
a No quotation.

May 1937 SURVEY OF CURRENT BUSINESS 43
1937 Monthly statistics through December 1935, together with explanatory notes and references to the source of the data may be found in the 1936 Supplement to the Survey
1937 I 1936
March March I April I May I June I July I August I Se~~~m-[ October I Nobe~m I D'l;:rm- January I F~~;u-
FOODSTUFFS AND TOBACCO-Continued
GRAIN AND PRODUCTS-Continued Rye:
Exports, including flour _______ thous. of bu __ 1 0 0 0 3 0 0 0 Price, wholesale, No.2 (Mpls.).dol. per bu .. 1. 09 0 52 .50 0 52 0 58 0 75 .83 .87 Production (crop estimate) ____ thous. of bu __ -------- --------- --------- --------- --------- --------- ---------Receipts, principal markets ___________ do ____ 737 1, 324 970 2, 297 1,422 1, 630 1, 540 1, 658 Stocks, commercial, domestic, end of mo.
Wheat: thous. of bu .. 3, 215 7, 555 7,009 6,869 6, 730 6,080 6, 674 6, 515 Exports:
Wheat, including fiour ______________ do ____ 1, 565 1,425 1,423 1, 534 1, 382 1,389 1, 657 2,415 Wheat only ------------------------.do .• __ 61 30 16 34 26 26 222 487
Prices, wholesale: No. 1, dark, northern, spring
1\iinneapolis _______________ dol. per bu .. J..\3 1. 24 1.23 1.14 1.24 1. 36 1. 47 1.46 No.2, red, winter (St. Louis) _______ do ____ 1.13 1.08 1. 07 1.02 .95 1.06 1.17 1.19 No.2, hard, winter (K. C.). ________ do ____ 1. 39 I. 06 1.02 0 95 0 96 1.11 1.22 1.22 Weighted av., 6 markets, all grades .. do ____ 1.42 0 98 0 95 .90 0 96 1.10 1.27 1.25
Production (crop est.), totaL __ thous. of bu •. -- ------ -----~~-- --------- --------- --------- --------- --------- ---------Spring wheat_ ___ ---------- ________ .do ____ Winter wheat _______________________ do ____ -- --------- --------- --84~222- -·io~62i-Receipts, principal markets __________ .do ____ -------- 9, 788 7, 417 11,103 14,819 29,495 7, 592 Shipments, principal markets _________ do ____ 7, 512 9, 289 7, 745 12,970 12,363 27,210 18, 214 10,658
StockR, end of month, world estimated thous of bu __ 380, 190 335,840 284,970 244,020 275,131 293,970 315,760
Canada (Canadian wheat) __________ do ____ --- ----- 19!,367 '177,325 145, 011 124,110 96,652 100,704 126,378 r,.s, 700 United States (domestic wheat) ____ _cto ____ 3fi. 850 51,945 40.698 31, 174 23, 161 67,305 81,048 82,849
lleld by mills (end of quarter) Wheat flour: thous. of bu._ 86,097 --------- --------- 62,642 --------- --------- 153,521
-------Consumption (computed by Russell's)
tbous. of bbL --------- 9,035 8, 090 8, 009 7,694 10,064 11,250 8, 198 Exports _______________________ . _____ ._ do ____ 320 297 299 319 289 290 305 410 Grindings of wheat_ ___________ thous. of bu •. 38, 605 Prices, wholesale:
38,273 36,453 35,328 36, 637 43,660 42,087 40,055
Standard Patents (Mpls.) ___ dol. per bbL 7. 44 6.92 6. 45 6.07 6.28 6. 78 7.21 6. 96 Winter, straights (K. C.) ___________ do ____ 6. 15 5. 42 5. 24 4.80 4. 73 5. 23 5.64 5.67
Production: Flour, actual (Census) ______ thous. of bbL 8, 402 8, 252 7,840 7,569 7,845 9,416 9,148 8, 708 Flour, prorated, total (Russell's) ____ do ____ --------- 8, 975 8, 235 8,149 8,300 10,244 11,652 9, 182 Offal (Census) _______________ thous. of lb._ 697,4.51 694,897 665,223 650,921 675,914 793,510 758,322 723,978
Operations, percent of capacity (Census) ____ 50 51 48 48 48 58 56 56 Stocks, total, end of month (computed by
Russell's) _________________ thous. of bbL .. ---- 4, 950 5,100 4,950 5,600 5, 500 5, 600 6, 500 Held bv mills (end of quarter) ______ do. ___ -- ------ 4,068 --------- --------- 4, 255 --------- --------- 4. 677
LIVESTOCK Cattle and c<.lves:
1, 727 Receipts. ----------------thous. of animals __ 1, 625 1, 673 1, 522 1, 764 1, 881 2, 216 2, 264 Disposition·
1, 113 Local slaughter _____________________ do. ___ 1,046 1,094 1, 002 l, 137 I, 179 1, 322 1, 339 Shipments, totaL------------------- do ____ 564 556 573 511 610 697 848 928
Stocker and feeder_ _______________ do ____ 134 190 195 163 167 240 319 380 Price, wholesale, cattle, cornfed (Chicago)
14.06 dol. per 100 lb .. 10.31 9. 21 8. 61 8.lil 8. 70 9,00 9.52 Hogs:
2, 224 Receipts __ . ______________ thous. of animals __ 2, 045 1,875 1, 759 1,864 1, 915 1, 747 1, 939 Disposition:
Local slaughter __ -------------------do ____ 1, 595 1, 372 1, 322 1, 276 1, 348 1, 347 l. 166 1, 263 Shipments, totaL ___________________ do ____ 619 666 550 482 512 562 572 673
Stocker and feeder ________________ do ____ 42 33 38 32 36 57 91 94 Price, wholesale, heavy (Chicago)
10.26 dol. per 100 lb .. 10.10 10.55 9.48 10.05 10.11 10.82 10.25 Sheep and lambs:
1, 576 Receipts. ________________ thous. of animals .. 1, 701 1, 798 1, 944 l, 859 2,022 2, 287 2, 766 Disposition:
960 J,ocal slaughter._- __________________ do ____ 1, 023 990 889 961 1, 006 1, 011 1, 126 Shipments, total. ___________________ do ____ 620 666 800 1, 063 873 1, 014 1, 271 1, 597 Stocker and feeder_ _______________ do ____ 60 66 112 183 108 152 343 480
Prices, wholesale (Chicago): fi. 59 Ewes. _____________________ dol. per 100 lb .. 4. 62 4.81 4.56 (') (') 3. 31 3.36
Lambs._------------------------ ____ do. ___ 11.49 9.66 10.75 10.97 10.38 9. 06 8.86 8. 91
Total meats: MEATS Consumption, apparent _________ mills. oflb __ 1,039 942 961 957 1, 033 1,040 1,001 1, 075 Production (inspected slaughter) ______ do ____ 1,006 937 960 949 l, 033 1,066 997 !, 029 Stocks, cold storage, end of month ..... do .... 1,240 675 669 650 641 665 671 625
Miscellaneous meats __ . _____________ do .... 117 67 61 57 57 62 73 75 Beef and veal:
Consumption, apparent_ _____ thous. of lb .• 484,622 !39, 651 485,136 474,901 502, 0!8 523,522 528,398 5.\8, 678 Exports ___ ... -------- _____ .. ______ .. do .... 1, 497 !, 218 1, 032 1, 426 1, 110 1,302 I, 790 1, 483 Price- wholesale, beef, fresh, native steers
(Chicago) ___________________ dol. per !h .. 0192 .151 .149 .134 0 133 0 138 .143 .145 Production (inspected slaughter)
453,710 thous. oflb .. 425,199 459,149 453,127 485,518 518,400 542,249 571,787 Stocks, cold storage, enrl of mo ______ do ____ 142, 685 79,.509 65, Oll 51,134 41,222 42,91.4 64,255 82,806
Lamb and mutton: i Consumption, apparent_ ___________ _cto ____ 56, 404 58, 477 52,394 47, 205 48,108 49,448 50,815 6o. n6 I Production (insoected slaughter). ___ do .... 5:3, 33;3 58,285 5!, 871 46,720 47,971 49,833 52,001 60,894 Stocks, cold storage, end of month .. do ... _ 7, 1713 2,334 1, 785 1, 282 1,122 1,478 2,634 3, 374
Pork (including lard): Consumption, apparent. ____________ do ____ 498,379 443, 4~6 423,876 435,020 482,772 467, 498 422,125 455,960 Exports, totaL ________ . __ -------- .. do .... 12,487 16,403 14, 118 18,495 18,880 16,811 12,224 !2,083
Lard ____ -------·---------------·- .do. ___ 7, 324 11,461 9,489 10,837 11,090 7, 481 6,045 7. 856 Prices, wholesale:
Hams, smoked (Chicago) ____ dol. per lb .. 0 209 0 235 0 239 0 2381 0 240 0 252 0 256 0 246 Lard, in tierces:
Prime, contract (N. Y.) _________ do .... 0 127 0 111 0 113 .104 0103 .110 .122 .ug Refined (Chicago) .. ____________ do .... 0 132 . liS .120 . ua 1 .113 0 119 .129 .126
Production (inspected slaughter), total thous. oflb .. 498,794 453,787 449,029 449,173 499,066 497,956 403,!98 396,371
Lard •.•. -------------------- ______ do. ___ 76, 584 75, 518 77,024 80, 534 87,288 82,952 64,362 59, 627 Stocks, cold storage, end of month .. do. ___ 973. li64 526. 963 541,017 MO. 274 511, 904 558,987 531,409 463,404
Fresh and cur~d-----------------·do. ___ 756, 09.5 450, 149 457, 402 440, 618 43.5, 130 441,961 420,848 361,608 Lard .... -. __________ ._.----- _____ .do.--· 217, .5G9 76, 814 83,615 9'9, 656 106, 7i4 117,026 no, sot 101, 796
• December 1 estimate. • No quotation.
I
0 1 1 .85 .92 1.10
--------- --------- b 25,554 1, 375 1, 735 1, 084
6,209 5, 983 5,008
2,436 1, 288 1, 681 926 21 50
1. 48 1. 44 l. 59 1. 21 l. 23 l. 35 L 22 1.22 1. 34 1.29 1. 28 1.39
--------- --------- '626, 461 '107, 448 '519,013
15, 237 --iii~7i2" 10, 389 13,978 10,945 11, 601
305, 590 292,870 312,480 117,412 93,924 82, 625 76,423 70,314 63, 453
--------- --------- 135,189
--------- ---------321 269 -----358-
41, 770 36,844 37,832
7. 06 6. 84 I 7. 26 5. 57 5. 49 5. 94
9,120 8, 019 8. 216 9,831 8,829 8, 333
749, 121 666,240 687, 727 54 53 51
--------- --------- --"4;686---------- ---------
2,439 2,176 1, 811
1, 368 1, 246 1, 145 1,060 893 695
516 449 277
9. 91 11. OS 12.05
2, 613 3, 149 3,145 l 1, 782 2, 234 2, 216
830 900 934 62 41 40
10.00 9. 67 10.25
2,871 2,149 1, 761
1, 191 1,071 1, 082 1, 723 1, 083 692
721 367 110
3 49 3. 67 3.83 8. 50 8. 40 8. 47
1,195 1, 0.>9 1, 047 1, 210 1, 242 1, 337
638 828 1,149 77 95 132
580,904 466, 194 482,171 1, 536 1, 021 960
0 150 .163 .168
595,095 510,943 521,965 104,961 152, 769 193, 760
1)5, 068 58,904 62,6921 67, 654 61,443 64, 5fi3 5,930 8, 450 10, 228
549,324 534,078 502, 456 14,784 16. 484 13,618 10,454 9, 563 9,384
0 225 0 223 . 226
0 117 .119 .135 .125 .126 0 139
546,907 669, 1151750,815 80,568 103,020 118,420
449,698 572, 165 8 I 2, 700 354,950 453. 4oo I 666. 891 94,748 lOS, 765 145, 809
0 1.13
---------715
4, 476
1, 576 33
1. 66 I. 40 1. 3S 1.44
---------
1 ------
3,
1,
I I I I
------
0 .11
334
980
522 38
0 59 0 43 0 37 0:39
------ ------------- ---
7, 7fi6 8, 676
336,500 74,737 52, 251
-------------- ~---
328 37, 586
7. 51 6.16
8,180 8, 24fl
681, 2i() .sa
---------
------fJ, 7,
316, 68, 4:J,
------
··- .. 3•1,
7 fi
7, 8,
628,
------
116 089
7i0 010 709
316 ll30
0 45 .08
------- -------
!, 691
1,107 500 184
12.91
2, 500
1, 7~.) 712
29
10.38
2, 063
1, 200 852 115
5. 52 9. 94
1, 008 1,109 1, 2"15
132
483,312 879
.182
4119, .582 180,916
~~: ~~g I 10,491
·lii5, 098 12,:m 8,Ril4
. 225
0139 .144
5i0, 173 90,4-13
921, z:n 7:)\ 522 182,709
1, 342
916 419 121
13 0 24
084
443 638
28
2
I,
10. 18
591
933 601
1,
78
5 0 77 0 06 10
' '],
T 401, I,
:3R4, r JG7,
r;)·l. [J.f. r U,
8fJO 903 2S2 126
174 071
18:3
817 4:38
804 Hi2 807
'404,. 334 lfil 4.56
u, 4,
4()j, 72,
'978, r 775, '202,
227
126 131
299 324 104 fi88 476

44 SURVEY OF CURRENT Bl'SI.:\ESS May lfl3i
1937 Monthly statistics through December 1935. together with explanatory notes and references to the source of the data'may be found in the 1936 Supplement to the Survey
1936 I ----~---~----~---,----~--.-----,----~---,--~----
April I May June July ~ August I Septern·l. October 11. Novem·i Decem· I Janu----~ Febr~~ March March ! 1 ber 1
ber ber ary ary
FOODSTUFFS AND TOBACCO-Continued ----------------------------~~------.c----------------------------------~----------------~------------
POULTRY AND EGGS I F:ggs: I
Receipts, 5 markets ................. thous. of cases .. ..
Stc~~~- ~~~~_s_t_or~:._e:_:~~~!-~~~~~~: of cases .. -! Pouft~~~en _______________________ thous. of lb ....
1 Receipts, 5 markets ___________________ do ..... . Stocks. cold storage, end of mo ________ do ...... l
TROPICAL PRODUCTS i Cocoa: I
Imports .. -------------------------long tons .... l Price, spot. Acrra (N. Y.) _______ dol. per lb .... !
Exports from the Gold Coast and Nigeria, I Africa ........ __ ------- _____ .......... long tons .... I
Coffee: Clearances from Brazil, totaL thous. of bags __
To United States .. _--------------- .. do ____ i Imports into United States ............... do .... l Price, wholesale, Rio No.7 (N.Y.)
dol. per lb .... l Receipts at ports, Brazil ..... thous. of hags .... I Stocks, world total, incl. interior of Brazil, 1
end of month ........ __ ....... thous. of bags .. 1 Visible supply, total, excl. interior of Brazil ,
thous. of bags ... I United States _____________________ do .... 1
Sugar: Raw sugar:
Cuha: i
1, 645
1, 406 53,102
19,993 120,420
34, 337 .11-l.:)
49, 211
1, 233 654
J, 3fi5
. 0(13 1.0Uf\
(f)
s. 0!6 t!75
thous. of long tons... 2, 221 Stocks, total, end of month
1
.
United States: Meltings, 8 ports _____________ long tons ..
1
510,489 Price. wholesale, 96° centrifugal (New I •
York) ........................... dol. per lb ... 1
• 03;, Receipts: 1
From Hawaii and Puerto Rico 1
long tons.. 180, QS5
Stocks at refineries, end of month .. .do........ 16~. 499 Imports _________________________ do .....
1
1 %6, ~.62
Refined sugar (United States): Exports, including maple ......... long tons.... 6, f64 Price, retail, gran. (N. Y.) ........ dol. per lb ...
1
. 0.5.\ Price, wholesale, gran. (N. Y.) ........ do...... . 047 Receipts: I
From Hawaii & Puerto Rico ... long tons.. 19, 187 Imports: 1
From Philippine Islands .......... do.... 4, G23 From Cuba _____________________ do ..... l 91,546
Shipments, 2 ports ... ________________ do ..... ~---------Stocks, end of month, 2 ports .......... do ..... _______ __
Tea: Imports .... ---------------------- thous. of! b.... 9, 567 Price, wholesale, Formosa, fine (N. Y.)
dol. per lb.... . 275 Stocks in the United Kingdom .. thons. of lb ..
MISCELLANEOUS FOOD PRODUCTS
Candy, sales hy manufacturers-.thous. of doL.. 26, 2n0 Fish:
Landings, fresh fi<h, prin. ports .. thous. of lb.. 34,964 Salmon, canned, shipments ___________ crtses __________ _ Stocks, total, cold storage, 15th of month
Gelatin, edible:• thous. of lb.. 51,645
Monthly report for 7 companies: Production ___________________ thous. of lb ......... . Shipments ____________________ ..... .do ......... __ ..... ___ Stocks ... ----------- .. -------- ........... do ........ ___ .. _. __ .
Quarterly report for 11 companies: Production ___________________ thous. of lb.... 6, 311 Stocks .. _ ..... -----------------------..do____ 8, 200
TOBACCO Leaf:
1, 798 !
807 45,848
15,098 69,494
28, 549 .0536
40, 114
1201 692
1, 450
. Ofi5 : !, 444 !
30,650
8. ll6 1. 056
I, 991
419, 096
. 036
197,386 279,852 240,659
4. 391 . 053 . 048
14,213
42,877 9, 371
65.722 11,080
8,159
. 275 232,000
22,123
'39,028 494,700
31,270
!, 318 !, 159 6,038
5, 597 8, 590
Exports ______ ------------------ thons. of lb.... 26,732 13,877 Imports, unmnfrd., Incl. scrap .. _______ do....... 5, 711 4, 553 Production (crop estimate) ____________ do ...... Stocks, total, Incl. imported types, end of
qnart.er. ............................ thous. of lb ................ 2,421,162 Flue-cured, fire-cured, and air-cured .. do ........... _____ 1,949,418 Cigar types _________________________ do .......... _______ 374,720
Manufactured products: Con~umption (tax-paid withdrawals):
Small cigarettes _________________ mllllons.. 12,792 !1, 193 Large cigar< ___________________ thousands .. 466,831 377,167 Manufactured tobacco and snuff
thous. of lh.... 31, 084 30,315 Exports, cigarettes ______________ thousands .... 488,721 351,679 Prices, wholesale:
Cigarettes __________________ dol. per 1,000 .. 1 .5. 513 5.380 Cigars ........... -----·-----------------do ...... l 46.020 45.996
2, 022 1, 727 i 3.039 7,058 I
69,172 111,725 ! 15,122 22, 7-!0 : 49, 324 43,050
31.206 9. 696 1 7,174 . 0533 .0558 1 .0617
17,025 11,063 14,331
!, 094 1,150 998 549 511 437 i
1,138 879 940 .
. 063 . OCf; 070 . 1.027 l,OOP 947 i
29, 606 {') 28,918 ]
s, 128 : ~. 108 995 : 998 '
8, 111 i 1,015 I
2,092 1, 886 1, 566
I, 247 981
7, 335 1 7, 006 l 115, 48,> I 108,614 I
i 22,683 26,400 ! 49. 220 65,488 i
15.570 18, 129 . 0641 . 0()67
20, 795 20,158
1,097 ! 1, 174 !168 i 669 i 901 ~ 904 !
I I
078 i 082 i I, 115 , 1, 016 i
(.:) (<)
~. 030 i 7, 8F4 i 903 889 !
782
5,817 96,660
27,580 82,096
22,816 i . 0750
17,241
I, 090 603 970
.081 I, 238
(<)
7, 754 9fi3
652
3, 788 82,029
34, 434 104, 981
23,012 .0843
28,074
1,192 (i42 920 :
.081 1, 12-l
(')
7, 905 i 8ti2 •
482 1
1. 755 1 66, 309 !
n. 2117 1
Ho, 391 I
i 22. 5f,4 I . 0954
38, 2(-\3
1, 230 6S4 798
. 085 I, 293
(')
7, 815 690
1. 375 : l, 209 1, 009 i 844 741 :
687 1. r7t5 {•:2-!
651 T 469 3:22 51,837 39, 104 r 34,:300
72,999 23,122 17, ~'.8 187,887 178, 301 : r 157,858
I 40, 268 2~. 788 i 26. ~V'l . 1134 . 1221 . lil32
54, 571 47,744 .::-, 2Gf.
1. 447 i ]. 289 i
fJ.!~ E89 fl87 ;~23
1, 454 i I, 370 1. 563
. 088 I . 0~9 ! 1, 409 1. 4.37
(') {'j ("\
7, 822 l 7. f/.14 76~ r ~51
3711 I o '
460,316 326,152 406,144 371,268 i 30;,639 i 277,352 260,661 230,213 i 215,168 230,fo50 313,51~
. 037 i . oa; i • os7 . o3e . 034 1
. 036 1 . o3s .038
176,391 325, 379 301, 105
3, 710 . 053 . 049
.037
171,070 274, 287 401,669
! i i I I
45, 159 H5, 833
123, 2b3
. 039
50: 01 s 18~1, 0-!7 !GO, 119
158.756 . 146,418 Ill, 968 128,439 i 70,8391 76,6821 305, ~37 I' 268,453 103, 264 217,897 I 82, 527 102, 207 402, 960 ' 450, 122 390, 794 323, 843 273, 200 215, 500
i I I 3, 981 3, 545 I 4, 968 5, 971 5, 647 I 7, 198 I 5, 185 I 3, 696 4, 567 . 053 . OM I . 055 . 055 . 054 I • 054 I . 052 I . 053 . 054
117, 279 2::?2, 73.f ~20, H";"
6. 12; . 0-'·5
.049 .o49l .047 .047 .o47 I .046 1
.o46, .047 .o,n! 17,924 1~,919 16,445 I 11,016' 2,189 4,8961 3,872 i 1,116 I 4,498. 6,1171 L). 77(.
I . • I I ' I ' I 37, 9S8 1 41,628 37, 503 I 30, 251 1 17,615 , 21,539 12,735 i s, 104 i 19, 542 1 10,834 i Jr,, 5~3
i~: m I===;=~~~= ===~=~~~:I::=~=~~= i= ==~=~~~= !===~=~~~=~===~=~~~= 1======~~=11===~·=~~~= ~~• == ===~~~:I::=:~:~~~ 6, i76 i. 5, 449 I 5, 172 I 5, 996 i_ 6, 3121 9, 036 j 9, 727 l 5, 710 8, !58 . 7, 544 I ~- 37f;
' I ! ' I. I .275: .2751 .2751 .2751 .275 .275 .27.11 .275! .275! .275 .2;;.
218,000 ' 208,500 I 199,200 'I 186,200 i 194,500 I 200,900 i 201\. 500 i 215,300 I" 214,800 I 207,633 J89. <9•; ' I I I
I I : I I i ' ' ' I I ' I I
21,399 17, 703 I 20,638 ! 12,064 I 17,603 30,033 i 31, 163 I 30,328 30, 567 25,068 ' 24, 4•;:=;
42,560 43,355 il 45,5631 44,351 I 45,390 i 42,812 il 45,074 :1 41, 131 I 32, 776 24. 2-'fi 27. li'~ 273.242 514.664 I 325. ss2 I 565,101 1,195,502
11.747,920
1
596.139 66, 100 45, 597 352.432 l, 1us. wo
26, 102 34, 256 i 46. 230 I 62, 551 I 76.0761 ~4. 698 i 86, 145 I 92, 702 I 94, 695 S7. 50:l ' fi\l, 629
1,391 1,296 i 1,270 i 980 1 477 1 763 1 l,o;s1
1 1.417 I 1,297 1 1,3s;, 1,H.o 1. 143 I 1, 280 i 1, 243 I I. 228 i 1, 163 ! I. 114 I I, 280 9~2 I, 175 I I, 18:l I 1, ·;;,~ 6, 286 i 6, 301 I 6, 328 i 6, 080 I 5. 393 i 5, 042 ' 4, 840 I 5, 275 I 5, 397 I 5 599 5, "'9
--------1--------1 5.65611 .............. f ............ [ 3,701 1--------1---------11 5,36811
_________ ---------
-------; --------:1' ~.85311 --------~ --------1 7,317 ,---------~~---------1 7,958 !---------~---------
-~~:~~-i--:;:!~~-1--~~~~~~-1 -~:~~-~-~~~~~!-: -~~:~~! 1-~~:~~~-:--~;:~~!_i"'~v~ :--~~~~~~-~---~~~~:~ ________ I ___ -----12,175,266 1---------]·--------12,146,600 ---------1-------__12,205,874 1----- ......... --------------1--------- 1,717,132j ................ l .. _______ 1,729,ii15 : ____ ---· .. -------11,827,6241 _____ ... ' --------1 --------1371,956 !--------- --------~~ 342,766 1 --------~.---------~ 312,135 ______ __
I i I ' i ! I It, 869 i 12,025 ~ 14,009 . 14,801 [ 13,430 14,342 I 13,204 .,11, 557 13, 246 13.4311 12, 32-'-
411, ooe ! 41~. 369 452, 312 482,448 1 445,976 489,293 551, 114 489, 180 371, 231 356, 996 362,935
29, 254 i 28, 100 29, 474 31, R26 ~ 26, 7561 30,096 32,046 26, 611 26, 302 25, 759 211, H4 428,572 i 398,683 366, 128 380,1531452,731 . 371, 146 297, 3581361, ~36 513, 538 463,0171 4\19,483
5. 380 I 5. 380 5. 380 5. 380 5. 380 I 5. 380 5. 380 5. 380 5. 380 5. ~35 ·'· 513 45. 996 45.996 45.996 45. 996 I 45. 996 45. 996 I 45. 996 i 45.996 45.996 I 45. 996 i 4f,. 991)
r Revised. " Dec. 1 ('stimate. e ~ot availahle. • The quarterly report is compl<'te for the industry; the new monthly data are for 7 companies, for data fur p<•r'od 1930-36, see table 8, p. 20, of the February 1937 issue.

\lay 1937 SURVEY OF CURRENT BUSINESS 45
~Monthly statistics through December 1936, to-~19371 gether with explanatory notes and references ---to the source of the data may be found in March March I April the 1936 Supplement to the Survey
1936 I 1937
July I August I Septem-1 October I Novem-1 Decem· January I Febru-ber ber ber ary
FUELS A.ND BYPRODUCTS
Anthracite: COAL Exports _________________ thous. of long tons __ 129 Prices, composite, chestnut:
Retail• _________________ dol. per short ton __ .... _____ ---------Wholesale ___________________________ do.... 9. 415 10.001
Productionf ____________ thous. of short tons.. r 4, 774 3, 061 Shipments ___ -------------------------do____ 4, 235 2, 429 Stocks, end of month:
In producers' storage yards __________ do ___ _ 980 In selected retail dealers' yards
numberofdays'supply __ ---··-·--•Bituminous:
Industrial consumption, total thous. of short tons __ --··--·--
Beehive coke ovens __ ---------------do ____ ..... ___ . Byproduct coke ovens ______________ do ___ • ________ _ Cement mills_. ---------------------do ____ ... _____ _ Coal-gas retorts. ____________________ do ______ ...... . Electric power utilities ______________ do ____________ _ Railways (class 1>-------------------do ____ ---------Steel and rolling milJs _______________ do ____ ........ . Other industriaL ___________________ do ______ .. ____ _
Other consumption: Vessels (bunker) ______ thous. of long tons__ 113 Coal mine fueL ______ thous. of short tons .. ---------
Exports _________________ thous. of long tons.. 474 Prices:
Retail, composite, 38 cities doL per short ton __ ---------
Wholesale: Mine run, composite ______________ do.... 4. 235 Prepared sizes, composite ________ .do.... 4. 490
Productionf ____________ thous. of short tons .. r 50,720 Stocks, industrial and retail dealers, end of
month, totaL ______ thous. of short tons .• ---------Industrial, totaL __________________ .do ____ ---------
Byproduct coke ovens ____________ do .•.• ------·--Cement mllls ..................... do .... ---------Coal-gas retorts •. _________________ do .... -·-· -----Electric power utilities .. __________ do •••• --···----Railways (class l) _________________ do .••. ---------Steel and rolling mllls-------------do .•.. ---------Other industriaL _________________ do ____ ---- ... --
Retail dealers, totaJ. ________________ do ____ ---------
COKE 'Exports._. ________________ thous. oflong tons .. Price, beehive, Connellsville (furnace)
Production: doL per short ton ..
24
4.131
Beehive _________________ thou.•. of short tons. 35.5 Byproduct .... ------------------------do.... 4, 495 Petroleum coke ..• --------------------do ____ - ~-- -----
Btocks, end or month: Byproduct plants, totaL.-------------do ___ _
At furnaces ____________ . _______ • ____ .do.---At merchant plants _________________ do .. __
Petroleum coke ____________ ---- ________ do .. _.
PETROLEUM AND PRODUCTSf Crude petroleum:
Consumption (run to stills) ... thous. of bbL -
1, 2.14 467 787
Imports _________ ~ _______ --------------do.... 2, 199 Price (Kansas-Oklahoma) at wells
dol. per bbL I. HlO Production ___________________ thous. of bbL ---------Refinery operations ________ pct. of capacity __________ _ Stocks, end or month:
California: Heavy crude and fueL .... thous. of bbL.---------Light crude _______________________ do ____________ _
East of California, totaL ____________ do ____________ _ Refineries ___________ .. __________ .. do ........ ___ __ Tank farms and pipe lines ________ do ___ _
Wells completed ___________________ number __ 'Refined petroleum products:
Gas and fuel oils: Consumption:
El~ctric power plantst .... thous. or bbL I, 209 Railways (elass I). ________________ do .... Vessels (bunker) __________________ do____ 3,186
Price, fuel oil (Oklahoma)_ .. dol. per bbL. . 870 Production:
Residual fuel oiL--------- thous. of bbL Gas oil and dist. ruels _____________ do .•..
Storks, end of month: Residual fuel oil, east of Calif~rnia
Gas oil and dist. fuels ..••. ~~~~~-~~~~!::11 ::::::::: Gasdine:
Consumption, domestic .... thous. of bbL.~---~----~;i~~~t;_iioiesale:·-------------------do ____ l 2' 101
Drums, delivered (New York) I dol. per gaL . 130
Refinery (Oklahoma) _____________ do____ . 057 Price, service station, 50 cities _______ do ____________ _
458
31
25,821 174
4,688 198 182
2,896 7,392 1,091 9,200
101 276 308
4.347 4.612
31, 527
28,083 22,133 3, 431
236 3.10
5,509 4,840
817 6, 950 5,950
24
3.575
110 3,257
105
1,444 632 812 360
85,286 2.183
1.040 90,568
75
63,341 39,856
266,092 51, 741
214,351 1,309
'973 3,878 3,005
.800
23,667 10,262
17, 529 15, 746
35,871 I, 404
.165
.060
. 139
101
11.61 9. 707 4, 773 4, 217
369
38
25,217 140
4, 993 341 164
2, 711 6,841 I, 157 8,870
88 268 462
8.57
4.303 4. 340
30,454
26,596 21,446 3, 515
256 211
5,613 4,674
807 6,370 5,150
20
3.575
91 3, 466
109
I, 586 567
I, 020 367
84,545 2,865
1.040 90,479
76
63, 729 39,338
268. 560 53,053
215,507 !, 580
'964 3,810 2, 643
.800
23,062 9, 553
16,996 17,031
38,825 2,140
.165
. 060
. 143
189 100
9.283 5, 121 4, 274
853
77
24,442 134
5,408 454 162
2,801 6,596 1,077 7,810
116 252
1,103
9.327 4, 306 3, 516
1,240
59
24,052 148
5,325 472 154
3,153 6, 255 1,045 7, 500
122 260 914
--------- ~-- -------4. 2891 4. 289 4. 302 4. 303
28,684 I 29,217
28,073 22,573
4,064 251 228
5, 645 4, 521
874 6,990 5, 500
34
3.575
86 3, 753
113
I, 695 581
I, 114 382
28,753 22,953 4, 565
250 245
5, 548 4,351
874 7,120 5,800
62
3.575
93 3, 695
122
1, 702 597
I, 104 382
I 90,637 2, 661
89,003 I 2, 872
I. 040 93,739
79
63,792 38,878
268,650 53,989
214, 661 I, 522
'1,015 3,864 3,184
.800
23,925 10, 169
18, 293 19,910
42,007 2,368
- 165 .060 I .143 i
1.040 90,185
80
63,717 37,856
265,554 53,628
211, 926 1,612
I, 156 3,811 3,193 .7~5
22,499 9, 567
18,506 22,475
44,630 I, 755
. 165
. 060
. 143
I Data will be shown when available. 'Revised. r Preliminary.
91
11.20 9. 452 3, 925 3,345
1,556
57
24,950 177
5,332 507 148
3, 564 6,501 1,011 7, 710
124 283
1, 035
8.13
4. 227 4.346
32,005
30,126 23,726 5,302
236 275
5,473 4, 254
916 7, 270 6,400
67
3.550
Ill 3, 718
120
I, 816 651
I, 165 399
91,709 2, 591
I. 040 92,078
80
64,382 36,781
262,013 53,221
208,792 I, 718
I, 228 4, 006 2, 992 . 763
23,144 10,323
19, 525 24,814
46,638 2,167 I
I .1551 .060 .142 '
9. 564 3, 503 2, 917
1, 9921
771 25,427
205 5, 548
550 149
3, 662 6,546 1,037 7, 730
134 294
1,174
4.217 4.428
33,086
32,071 25,171 5, 982
257 267
5, 744 4, 304
947 7,670 6,900
69
3. 575
128 3, 866
121
1, 986 670
1, 316 409
93, 444 2,871
1. 040 95,090
81
64,825 35, 476
258,685 51,691
206,994 1, 521
'1, 312 3, 919 2, 897 . 750
23,287 10,627
20,379 27,645
46,081 2,029
.150 • 059 .142
120 i 139 126 i
~\.~r ~---9~857- ---9~914· 3, 87 4 4, 608 4, 334 3, 440 3, 942 3, 783
2, 347 I 2, 473 2, 515
I
129 I
11.81 9. 905 4, 947 4, 317
2, 259
122 107
9. 827 9. 824 4, 025 3, 368 3, 674 3, 042
1, 833 I, 299
62 --------- --------- --------- --------- ---------
26,063 262
5,499 534 153
3,654 6, 782 1,059 8,120
134 329 954
8. 31
4. 229 4.498
37, 192
34,604 27,235 6,562
241 283
5,933 4,963
973 8,280 7, 340
67 .
3.875
164 3,831
123
2, ~~~ I I, 383 I
423 .
90,872 2, 629
1.040 90,972
80
64,564 34,123
253,969 50,469
203,500 I, 583
'1,261 4,058 3,248 .750
23, 154 10,095
20,182 27,871
44,346 2, 216
.150 1
.055 '
.141
(1) (1) (1) (1) (1) (1) (1) (!) (1)
164 (1) I, 201
4. 224 4. 557
43, 321
(!) (I) (!) (!) (1) (!) (!) (!) (!) (I)
66
3.875
237 4.071
117
1,886 578
1.308 408
93, 146 2, 956
1.040 95,795
80
64,745 33,901
250,724 49,604
201, 120 I, 708
'1, 264 4,627 2, 724 .750
25,285 10,266
20,536 27,659
44,253 I, 902
.150
.05R
.140
(1) (1) (!) (1) (') (1) (1) (!) (1)
!51 (1) 1, 222
---~~;;;-,, 4.551
41,879
(') I C'J I (1) i i'J I
~:l 'i (') (!) (!) (I)
60
3.875
240 4,048
111
1,806 519
1, 287 400
89,1421 2, 662
1. 040 91,018
79
64,836 33,815
247,452 48,503
198,949 1,545 I
I , I, 356 I
4, 522 I, 868 • 765
23, 671 11,201
20,255 26,414
39,919 2,2121
.150 I
.057 I
.140
31,995 417
6,242 418 157
3, 759 8,229 1,283
11,490
132 371 494
8.53
4. 233 4. 548
45,756
43,499 35,026 8,535
263 295
7,162 6,847 1, 264
10,660 8,473
44
3. 938
261 4, 348
109
1, 684 487
1, 197 389
93, 051 3, 001
I. 040 ' 97,652 :
80 :
65,481 i 34,189
246,409 49,823
196,586 1,448
I, 374 4,846 2, 375 -775
25,670 11,875
18,718 22,719
39,393 I, 768
.150 I
31,409 435
6, 262 327 157
3,586 8,140 1,222
11,280
30,262 468
5, 738 302 145
3,323 7, 728 I, 218
11,340
128 106 341 348 344 l 392
4. 218 4. 497
40,940
I
(1)
35.390 I 8,031
307 274
7, 570 7,354 1,374
10,480 (1)
27
4.000
272 4, 358
102
1, 533 464
1, 069 384
94, 179 945
1.125 98.567
80
li.t, H~4 :3:1,5:35
245, ll\8 a :J\), Ollo azon. l!iO
l. ;,go
'I, 774 5,077 2, 540 • 775
25, 453 13,319
18,392 ' 19,0881
3:1,696 I 2, 505 '
4. 236 4. 510
'42, 110
46,785 38,785 8,687
357 267
8,047 8,674 1,603
11,150 8,000
26
4.000
292 3,991
92
1, 307 446 861 380
84,984 606
l.lf>O 93,173
79
63,768 33,417
248,474 39,901
208,573 1, 366
'I, 333 4, 422 2,829 .844
22,222 11,206
16,R03 18,211
32,000 2,35ti
_ o58 I .141 --
.14~ i
. 051 ' i
.130
.058 ---------------
*New .series .. Data for period 1929-36 are shown in table 10, p. 20 of the February 1937 issue. t Revised ser!cs. Anthracite and bituminous coal production revised for years 10~5 and 193(i. Revisions not shown in the March 1937 issue will be published in a subse
<]Uent Issue. Senes on petroleum and products revised for !935. See table 14, p. 19 of the Aprill937 issue. Series on consumption of gas and fuel oil in the production of elee· tric power revised for 1936. Revision for Jan. 1092, Feb. 1123.
• D';'ta on stocks of crude petroleum east of California revised in January 1937, certain stocks formerly included in "tank farms and pipe lines" being transferred to '·refinenes." December 1936 figures comparable with those shown for January 1937 are, refineries, 39,912; tank farms and pipe lines, 206,497.

46 SURVEY OF CURRENT BUSINESS May 1937
Monthly statistics through December 1935, together with explanatory notes and references lo the source of the dat& may be found in the 1936 Supplement to the Survey
1937
1
1936 I 1937
J\Iarrh March I April I May 1· June I July I August I Septem·j October I Novem-1 Decem- January I Febru-1 , ber
1 ber ber 1 arr
FUELS AND BYPRODUCTS-Continued
PETROLEUM AND PRODUCTS-Con-I I Refined petroleum products-Continued. I
Gasoline-Continued. Production:
At natural gas plants ..... thous. of bbL _________ 3, 378 3, 265 3, 275 3,217 3,355 3, 507 3, 584 At refineries._·------··--·-- ...... do .... --------- 38, 764 39,902 41,951 41,612 43, 500 44,M8 44,024
Retail dlstributlon,t ........ thous. of gaL --------- •1,444,285 •1,552,850 Stocks, end of month:
rJ,706,133 •1,789,356 •1,926,411 •1,890,846 •J ,815,342
Finished gasoline, total ... thous. of bbL --------- 67, 128 66, 552 64, 675 60,519 55,922 53,040 51,394 At refineries .. ____ .... ______ .... do .... --------- 45,799 44, 361 42, 527 39, 050 35,062 33,417 31, 230
Natural gasoline .................. do .... Kerosene:
--------- 4, 553 5,058 5,664 5, 829 5,846 5, 653 4, 945
c.,.m,.ioo, '"m'"""····· "·~- " '"'-- , ....... 4,098 3,914 4, 03.1 3, 075 3,019 3, 218 4, 305 Exports .... __ .. __ . ______ . _________ .. do .. __ 437 435 512 380 664 474 607 590 Price, water white 47, refinery, (Pennsyl-
0 056 i vania) ...................... dol. per gaL . 053 0 055 0 056 .055 • 0,:)2 0 049 0 050 Production _________________ thous. of bbL .......... 4, 741 4,953 4,626 4,376 4, 455 4, 297 4, 428 Stocks, refinery, end of month ______ do .... _________ 5, 974 6, 496 6, 681 7, 296 8, 228 8,690 8, 217
Lubricants: Consumption, domestic ............. do .... --------- 1, 863 2,197 2,028 1,969 2,123 1, 851 2, 059 Price, cylinder, refinery (Pennsylvania)
dol. per gaL .190 0 135 . 139 .149 0 154 0 155 0 155 0 155 Production._--------------- tho us ofbhL --------- 2, 515 2, 687 2, 768 2, 509 2, 626 2, 668 2,567 'ltocks, refinery. end of month ______ do .... --------- 7,137 7, 044 6, 884 6, ;gg 6,620 6, 730 6, 544
Asphalt: Imports .............. thous. of short tons .. 5 I 1 4 3 1 1 3 Production ......................... do .... --------- 261 319 377 407 426 491 468 Stocks, refinery, end of month ....... do ....
Wax: --------- 526 520 542 546 488 389 305
Production .................. thous. oflb .. _________ 42,280 39, 480 40, 320 a~. 92o 34, 720 35,000 34, 440 Stocks, refinery, end of month ... - .. do ... -j--------- 119, 684 121,857 I 121,416 1!7, 362 u8, 257 I 116,888 113,359
I
LEA'l'HER AND PRODUCTS
3,830 3, 816 3,965 45,887 43, 138 44,658
•!, 796,005 •1,649,380 ri,622,953
51,238 52,509 56, 353 31,936 33,242 37, 057
4, 555 4,153 4, 055
4, 370 4, 943 6, 148 565 841 666
.050 .050 0 051 4, 712 4, 788 I 5, 500 7, 976 6, 1)66 5, 633
1, 911 1, 938 1,821
0 151 .150 .155 2,632 2,653 2, 767 6, 576 6, 628 6, 942
2 1 2 475 344 244 302 330 368
42,840 42,840 41,160 113,049 119,307 115,434
I
I
I 3, i32
43,630 1,372,436
64, 2fi3 i
44. 144 ! 4, 032 I
5, 207 ! 6C8
. 052 5, 923 5, 622
1, 763
. 160 2, 649 7, IUS
0 226 444
41.720 •!07, 490 i
3, 56 40, 7&
/1, 45. 3 9 0
:>0. 91 -!, 2H
-!, 22 6 80
.05' 3 6 3
4, 86 5, 44
1, 51
. 17: 2, 72 7, 46.
h· 44'
41, 72 10\1,01
-----------------------------------~----------~----~----~----~----~----------------~----------~-----
1 I HIDES AND SKINS
Imports, total bides and skins ____ thous. of lb .. 1 41,01:6 28,963 28,1161 Calf and kip skins .................... do____ 2, 345 1, 354 1, 215 Cattle hides ........................... do.... 17, 147 13,063 12,613 Goatskins ............................. do.... 10, 746 8, 506 7, 911 Sheep and lamb skins ................. do.... 7, 205 4, 668 4, 809
Livestock (inspected slaughter): Calves ___________________ thous. of animals.. 592 483 525 Cattle _________________________________ do____ 825 763 812 Hogs __________________________________ do.... 3, 023 2, 617 2, 559 Sheep _________________________________ do.... 1, 312 1, 374 1, 267
Prices, wholesale (Chicago): _130
1
Packers, heavy ~teers ........... dol. per lb.. . 166 .130 Calfskins, packers', 8 to 15lb .......... do.... . 241 .181 .188
LEATHER Exports:
Bole leather .. __________________ thous. of lb.. 293 Upper leather ............... thous. of sq. ft.. 5, 960
Production: Calf and k!p ________________ thous. of skins __ ---- ..... Cattle bides _________________ thous. of bides .. Goat and kid ............... thous. of skins .. ---------Sheep and lamb _______________________ do .... ---------
Prices, wholesale: Sole, oak, scoured backs (Boston)
dol. per lb.. . 418 Upper chrome calf B grade, black, composite
dol. per sq. ft.. .431 Stocks of cattle bides and leather, end of month,
totaL ______________ thous. of equiv. hides ...... _ .... In process and finished ________________ do .. .. Raw __________________________________ do .... _. _____ . _
LEATHER MANUFACTURES
Gloves and mittens: [ Production (cut), totaL ........ dozen pairs __ I .........
Dress and semidress ................. do .... l------ ---Sho~; ork _____________ -----------------.do .. --~---- .. ----
Exports ..................... thous. of pairs.. !53 Prices, wholesale, factory: '
Men's black call blu~her .... dol. per pair .. ! Men's black c•lf oxford._ ............ do .... I Women·~ colored blucher ........... do .. ..
Production:t Total boots, shoes, and slippers
tbous. of pairs .. Athletic ...... ___ -------- ____ .. __ .. do._._ All fabric (satin, canvas, etc.) ..... do ... . Part fabric aud part leatber ....... do .. .. High and low cut, total. .......... do .... l
Boys' and youths' .............. do .. .. Infants' ......................... do .. .. Miss~s· and children's ............ do .... , Mens .......................... do .... 1
5. GO 4. 81 3. 25
45,803 259
!, 343 2, 210
30, lfi3 1, 710 2, 512 3, U·W
11 22'' 16: 7G\i s1~g~:~~d fiiiiccasiiisroiiiousii·w-~~r---1
thous. of pairs .. , 3, 963 All other footwear ................ do .... l l,ii66
310 5, 234
960 •I. 918
3, 786 2, 824
0 360
.378
17,797 11, 655 6,142
410 5,107
1,046 1, 844 4,018 2, 925
0 360
.380
17,865 11, 7M 6,111
205, 081 203, 126 117,791 117,320 87, 290 I 85, 806
188
5.50 4.50 3.15
34, 832 187 270 416
29,602 1, 266 I, 941 3, 293 8, 251
14, 8471
2, 806 1, 551 j
104
5. 50 4. 50 3.15
33,398 196 301 342
27,929 I, 223 !, 958 3, 185 8, 057
13, 505
2, 976 1, 654
25,216 2, 336
10,296 8, 292 2, 549
503 786
2, 579 1, 213
.123
.171
368 5, 566
998 '1, 692
3, 990 2, 897
0 355
0 380
17,827 11,779
6, 048
201,375 121,661
79, 714
106
5. 50 4. 50 3.15
30, 264 207 313 314
24, 551 1, 033 1, 589 2. 493 7, 2~'9
12,206
3, 2531 I, 627 I
27,690 1, 434
13, 145 5,690 5, 989
517 853
2, 739 1, 309
.125
.177
110 4,180
1, 199 1, 657 4,055 2, 849
.330
.378
17,941 11, 874 6,067
203,250 126,406 76,844
112
5. 50 4.50 3.1~
29,371 209 249 246
23,562 I, 311 1, 661 2, 379 7, 574
10, 638
3. 801 !, 304
26,050 2,015
10,869 6,452 4, 792
523 928
2, 692 I, 352
.124
.170
241 4, 846
1, 289 1, 834 3, 989 3, 237
.330
0 370
17, 687 11, 676 6, 011
220,474 139.173 81,301
82
5. 50 4. 50 3.15
35,678 217 144 190
29,598 I, 561 I, 600 3, 065 8, 724
14,648
4, 590 938
23,013 1,068
12,004 5,024 3, 521
541 1, 012 2, 254 1, 395
0 131 .174
144 4, 787
1,158 1, 866 3, 900 3, 391
0 330
0 372
17,4.16 11,417 6, 039
242,741 153,229 89,512
103
5. 50 4. 50 3.15
40,668 221 147 231
33,851 1, 567 I, 720 3, 467 9, 297
17,801
5, 308 911
22,442 1, 967 9,429 5,183 4,354
553 1,071 2, 403 1, 593
.147
.172
176 5, 973
1, 051 1,806 3, 947 3.059
0 350
.378
17,198 11,118
6, 080
245, 115 156, 140 88,975
149
5. 50 4.50 3.15
40,975 204 165 255
33, 241 1,603 1,877 3, 399 9, 546
16,815
6,146 964
20,617 1, 571 7, 325 5, 593 4,077
585 1,124 3, 492 1, 742
0 149 .177
300 6,116
1,083 2,051 3,862 3,692
0 360
0 379
17,190 11, 245
5, 945
274,853 179,561 95, 292
134
5. 50 4. 50 3. 15
39,916 252 229 229
31, 152 1, 771 I, 969 3, 388
10,072 13, 953
7, 163 891
23,838 1, 421
12,465 4,368 4,172
477 988
4, 292 l,M4
0 201 .1531
296 4,872
966 2,007 3, 663 3, 314
. a;o I
.383
29,722 2, 393
14,142 6,552 4, 705
494 987
4, 681 1, 573
0 156 0 215
133 6, 807
1,180 2,154 4, 315 3, 494
0 390
0 399
17,436 '17, 173 11, 522 ' 11' 294
5. 914 '5, 879
242, 106 206. 559 152, 627 119, 049 89, 479 87,510
90
5. 50 4. 50 3. 15
30, 3·131' 216
rg~ ' 22, 171
1, 376 1, 753 2, 676 8, 381 7, 9Sl
6, 628 838
83
5. 50 4. 50 3.15
33,381 258 239 4G~l
26,B4! 1, i59 1, ggo 3, 12:J 9,_2(jt)
11,103
4, 449 I, 131
• Revised. , Number of States reportin? varies slightly from month-to-month, but the comparab!lity of the series is not seriously affected.
23, 363 1, 575
10, 554 5. 791 2, 375
4R4 8Gi
3. 519 1, 700
. 162 0 228
2()4 6, 385
982 '2, 094
3,810 '3, 151
0 !00
. 4111
• 1C. 913 ' 11 21-1
r 5: 0\l~l
183,109 104, 525 ;s, 584
71
;,. 50 : 4. 50 ; 3. 10
r 36, 867 \ 2:21
'54! r (:!l i
• 31, G2~ I 1,,1fi0 ;
r "2 1'>3 1
:1: 4io I • II, 381
r 15,25.1
r 2, -!8.wl I r 1, 31S :
I
27, 500 1, i25
11, 622
'· 143 4, 2~11
437 708
2, 842 I, 31
. 160
. 213
224 6, 408
1. 035 2. 052 3. 743 3, 17
0 41
. 4 !~
lfi. 40' 11.036
,'), 361
211,061 133, 89
77, lW
13.
r 39, 26' · zo·
r 1, l81 r 2. 22
r 31, 47 • t},,j(J(
'2, 23: r 8, fi5' r Q 9UJ
' 14: 19 T 2, ~·1 rt-n
• One company ceased reporting after December 1936. Figure lor December 1936 comparable with January 1937 is 110,634. t Revised se.rie-s. Production of boots and shoes, for 193fi reYi5ions SE'e p. 46 of the nrarch 1H37 issur. Snies on retail distribution of gasoline revised for 1935 and 1936.
Revisions not shown above will appear in a subsequent issue. P Preliminary.

May 1937 SURVEY OF CURRENT BUSINESS
Monthly statistics through December 1935, together with explanatory notes and references to the source of the data may be found in the 1936 Supplement to the Survey
1937 I 1936
March March I April I May I June I July I August I Seb~~rn-1 October I Nb~~m-1 Dt;';rm-
LUMBER-ALL TYPES
Exports (boards, planks, etc.) •••.• M ft. b. m .. National Lumber Mfgrs. Assn .. t
Production, totaJ. ____________ mill. ft. b. m •. Hard woods ••• _____________ -- __ -- ___ do. __ _ Softwoods _________________________ •• do. __ _
Shipments, totaJ. ___________ -------- .• do •• __ Hard woods. ________________________ do .. __ Softwoods __ •. _. _____ . __ .• ___________ do .. __
Stocks, gross, end of month, total. ..•. do ___ _ Hard woods _________________________ do. __ _ Softwoods .... _________ • _________ . ___ do. __ _
Retail movement (yard): Ninth Federal Reserve District:
Sales __________________________ M ft. b. m __ Stocks, end of month. -------·--··--do ___ _
Tenth Federal Reserve District: Sales _________________________________ do ___ _ Stocks, end of month. ______________ do ....
FLOORING
Maple, beech, and birch: Orders:
New __________________________ M ft. b. m __ Unfilled, end of month ______________ do ___ _
Product ion. ___________________________ do ___ _ Shipments ____________________________ do._ .. Stocks, end of rnonth __________________ do ....
Oak: Orders:
New_ -------------------------------do ... . Unfilled, end of month ______________ do ... .
Production ____________________________ do .••. Shipments _____________________ .. __ ... do. __ _ Stocks, end of rnonth __________________ do ___ _
SOFTWOODS Fir, Douglas:
Exports: Lumber. ______________________ M ft. b. m .. Timber ... __ ........................ do .. ..
Prices, wholesale:• No. I, common boards.dol. perM ft. b. m .. Flooring, 1 x 4, "B" and better, v. g.
dol. per M ft. b. m ..
112, 807
2, 154 332
1, 821 2,298
359 1, 939 7,108 I, 813 5, 295
4, 644 89, 716
2, 56fi 33,319
10,346 21,015
9, 746 10,348 18,757
29, 737 51, 166 39,006 36, 427 60,846
31,397 19,811
21,854
45,080 Southern pine:t
Exports: Lumber ______________________ M ft. b. m.. 25,813 Timber.--------- ___________________ do.... ti, 941
Orders: 1
New_ -----------------------mill. ft. b. m.l Unfilled, end of month .............. do ... .
Price, wholesale, flooring dol. perM ft. b. m ..
Proauction ____________________ mill. ft. h. m .. Shipments_ .. ________________________ .do. ---1 Stocks, end of month __________________ do ___ _
Western pine:t Orders:
New --------------------------------do ___ _ Unfilled, end of month ______________ do ....
l'rice, wholesale, Ponderosa pine, 1 x 8 no. 2,
570 409
46.49 o75 fi25
1, G92
411 411
common (f. o. b. mills).dol. perM ft. b. m .. 1---------Production ___________________ mill. ft. b. m __
1 297
Shipments. _______ ----------------- ... do ___ .
1
395 Stocks, end of month_., _______________ do.... 1, 411
West Coast woods:1 Orders:
New -··---------------------mill. ft. b. m__ 714 Unfilled end ofmonth .............. do .•.. l ~-~~
Production._. ____ ----_------- ........ do ___ -~ Shipments. ____ ... __________________ .• do ... _ 732 Stocks, end of month ................. do.... 1, 211
Redwood, California: Orders: 1
New __________________________ M ft. b. m .. l Unfilled, end of month ______________ do ____ i
m~;:,~~~~---~~==== ============ :::::::=gg== :: i All districts: FURNITURE I
Plant operations _________ percent of normaL.I Grand Rapids district: [
Orders: Canceled ... _______ percent of new orders .. ! New. ____________ no. of daYS' production ..
1
.
Unfilled, end of month no. of days' production .. !
Outstanding accounts, end of month 1
no. of days' sales .. l Plant operations _________ percent of normaL. i Shipments _________ no. of days' production .. !
Prices, wholesale: 'r
B~d~, wooden._ -.-----------------1926= 100 .. Dmmg-room chairs, set of 6 ........... do ____
1
K.it~hen cabinets.. ____ ---------- ______ do ___ _ LIVIU~·room davenports .. ____________ do .... [
Steel furniture (See Iron and Steel Section).
39,437 74,421 311,783 43, 870
81. 5
7. 0 21
3Cl 84.0
;!()
78.2 97.0 t)i'. (i
Ul. U
LUMBER AND MANUFACTURES
90,328
1, 718 295
I, 423 1, 853
351 1, 502 7, 018 I, 858 5, 160
'4, 104 81,490
3, 752 32,396
12,700 20, 100
5, 900 6, 900
26,550
19,381 43,793 27,607 28,479 58,683
23, 49R 12,985
18.620
44.100
28,913 6,184
613 439
36.78 548 593
1, 580
334 302
23.89 224 282
1, 423
498 547 521 498
1, 199
32,979 43, 049 37,318 34,327
58.0
10.0 13
13
24 57.0
13
67 .• 5 84.0 83.5 87.5
96,053
2, 005 294
I, 711 2, 093
338 1, 755 6, 927 1, 816 5, Ill
7, 210 81,851
4,191 32,143
5,900 18, 500
7, 200 7,500
25,400
19, 211 33,521 30,761 29,483 59,961
40,462 23,371
19.600
43.855
22,893 7, 506
560 399
37.63 580 600
1, 560
321 306
23.83 322 319
1, 427
6451 509 666 684
1, 181
41,535 49, 143 37, 584 35, 562
59.0
6.0 9
11
22 54.0 !
11
67.5 84.0 83.5 87.5
8£,904
2, 052 318
1, 735 1, 962
318 1, 644 7, 031 1, 826 5, 205
10,227 79,392
3,627 32,426
4,300 15, 500 5,850 7,300
24,000
23,622 28,564 30,273 28,579 61, 655
28,714 14,612
19.845
43.120
21,487 6,890
556 359
37.40 591 596
1,555
401 340
23.77 432 363
1, 495
491 470 559 530
1, 210
31, 157 44,213 37,763 35,207
59.0
6. 0 18
18
20 56.0
11
67.5 84.0 83.5 87.5
83,255
2, 052 328
1, 725 1, 972
309 1, 663 7, 113 1, 845 5, 268
13,192 72,456
3, 437 32,459
6, 500 14,600
6, 200 7,850
22,350
30,576 27,523 32,031 31,617 62,069
27,331 18,312
20.090
42.728
22,826 6,358
561 3:l9
37.37 586 591
1,550
382 324
23.82 466 384
1,577
469 {15
ml 1,199
29,813 39, 251 38,700 37,433
65.0
5. 0 12 I
I
17 : I
21 !
58.0 I
11
67.5 84.0 83.5 87.5
95,230
2, 218 337
1, 881 2, 056
315 1, 742 7, 265 1,866 5,399
11,827 77,794
3,840 31,894
7,050 13,000 7,000 9, 000
20,500
29,463 26,863 32,980 30,123 64,926
32,063 23, 6~9
20.090
41.160
25,463 5, 137
604 324
36.52 634 609
1, 575
379 335
23.78 491 381
1, 687
572 393 594 594
1,199
30,603 37, 172 35,434 30,992
68.0
3. 5 23
25
25 60.5
15
67.9 84.0 83.5 87.5
85,813
2,171 348
1, 823 2, 005
331 1, 674 7, 419 1, 883 5, 536
12,042 74,909
4,137 31,445
8, 300 12, 400 7, goo 8, 500
21,000
32, 953 29,408 30,872 30,408 65, 3UO
82,409
2, 151 351
1, 800 2,122
342 1, 781 7, 438 1, 876 5, 562
12,842 72,208
3, 536 31,3411
10, 100 13,600 8, 600 9,000
21,000
40, 671 36, 647 32,378 33,432 64,336
27' 670 28, 920 19,456 31,776
19.845 19.502
40.180 40. 964
19,836119,955 4, 224 6, 587
693 384
36.61 628 633
1, 570
468 361
23.79 516 397
1, 806
558 462 515 490
1, 225
32,201 36,608 38,939 33,477
74.0
3. 0 21
30
25 63.5
16
70.4 84.0 83.5 87.5
645 374
37.29 640 655
1, 555
428 321
23.92 477 424
1,859
530 452 516 539
1,202
34,426 33,781 38,928 36,390
81.0
5. 0 23
33
30 73.0
18
71.1 84.0 83.5 87.5
'Revised. • New series. For data for period 1922-36 see table 7, p.19 of the February 1937 issue.
89,934
2, 352 351
2, 001 2,327
356 1, 972 7, 463 1, 870 5, 593
14,355 67,785
4,648 30,756
7,400 12,600 9,000 8,500
21,500
39,210 41,922 33,864 33, 935 64,265
21,248 22.625 I 19. 600 I 41.160
24,797 4, 213
691 374
38.31 671 691
1, 535
455 325
23.91 471 454
1, 876
726 520 679 658
1, 223
34,327 33,000 41,884 33,814
86.0
5. 0 20
33
31 76.0
19
70.5 85.5 1
83. 51' 87.5
62,036
1, 816 314
1, 502 1, 751
340 1, 411 7, 512 1, 842 5, 670
10,726 63,934
3, 991 30, 197
6,800 12,900 7, 350 7, 050
22,500
56,471 68,405 31,752 29,988 66,029
2, 509 1, 465
I 19. 6oo 1
41.160
25,322 4, 310
676 409
38.59 661 641
1, 555
393 329
24.28 365 362
1,879
418 661 336 277
1, 282
32,668 39,873 34,564 25,998
85.0
5. 0 26
39
30 78. 5
17
71. 7 85. 5 83.5 88.9
51,803
1,827 311
1, 516 1, ggg
319 1, 581 7, 432 1, 816 5, 616
4, 785 67,970
3, 408 31,299
15, 500 19,700 8,100 8, 900
21,700
41,589 74, 116 35,489 35,878 65,640
3, 505 62
20. 286
42. 532
17,822 5, 573
796 509
39.28 671 696
1, 530
429 442
24.46 264 351
1, 792
f,42 907 444 397
1,329
4.5, 013 GO, 50.3 31, 119 24,382
82.0
10 .. 5 15
31
31 77.0
19 .
76.0 !
~u I 88. g
I
47
1937
J ann· Febru-ary ary
63,169
'1, 571 '301
'1, 270 '1,813
'3.59 '1,454 T 7, 619 '1,895 r 5, 724
4, 264 79,170
. 2,047 32,079
8, 900 21,300
7, 300 8,100
20, suo
30,569 65, 83S 34,012 38,847 60,805
1, 723 I 52 I
I 20.825 1
43. 610 :
2.\, 2115 i 5, 1fj3 !
740 571
41. 68 640 t)75
1, 4tl5
327 ' 445
25. 77 179 314
1, 657
4--lO i 1,rm
354 32()
1, 357
48, 393 s1, oo:l 35, 108 27,622
81.5
H
:~o r it:.[)
'1u
71J. () 97.0 ~2. 5 94. u
84, 644
r 1, 597 270
'!. 327 '2,051
377 '1, 674 r 7,195 '1,810 r 5, 385
2, 765 86,554
1,990 32, 811
9, 600 21,000 7, 600 9, 300
19,600
26,409 57,85() 31,853 34,391 58, 267
12,750 8, 522
21.560
45.080
32,184 4, 978
655 549
44. 56 650 680
I, 465
334 423
26.80 163 311
1,509
424 926 422 519
1, 260
32, 142 80,281 34,791 :33,435
Sl. 5
;),!)
18
·10
31 s:J. o
18
7~. 2 97.0 S2. 5 91.0
, Data for April, Jnly,Octoher ana December 1936 and March 1937 are for 5 weeks; other months, 4 weeks. t ltevised series; for HJ35 and 1936 revisions, see table Hi, total lumber and table 17, Southern pine and \\'estern pine lumber, p. 20 of the April HJ37 issue.

48 SURVEY OF CURRENT Bl'SINESS May 1937
1937 gether with explanatory notes and references --- ---,-----,------,---,-------,----,---,----.,------.--- ---c---
Monthly statistics through December 1935, to-~19371 1936
to the source of the data may be found in I . I I ! I Septem I I No I D I 1
the 1936 Supplement to the Survey March March Apnl May June . July '1 August · October vern- ecem· Janmry 1·
________ ----------'-----'-----'----'-------'----'------'..---L_b_er her her ! · _ Febru
nry
IRON AND STEEL
Foreign trade, iron and steel: Exports (domestic) ..•.•.•••••.•.• long tons .. Imports ____________ • ______ ---- ____ •.•. do.---
Price, iron and steel, composite dol. per long ton .•
Ore
Iron ore (Lake Superior dist.J: J
Consumption by furnaces ' thous. of long tons ..
Shipments from upper lake ports .••..• do .... Receipts:
Lake Erie ports and furnaces ________ do ___ _ Other lower lake ports ______________ do ....
Stocks, end of month, totaL .•..••..... do ..•. At furnaces .. _ ----------------------do .•.. Lake Erie docks ____________________ do •...
Imports _____ .. ________ . ___ ------------do .. --Manganese ore, imports (manganese content)
thous. of long tons ..
Pig Iron and Iron Manufactures
Castings, malleable: Orders, new ..........•...•...•.. short tons .. Production .. _____ .. __ ..••.•••...•...• do .•..
Percent of capacity------------------------Shipments ________ • _____ ..•..••.. short tons._
Pig iron:
570,669 51,702
39.92
5, 142 0
0 0
li, 437 14, 5R5
2,852 215
41
68,525 67,521
82.1 67,224
Furnaces In blast, end of month: Capacity ....•...•.•.•.. long tons per day-- 112,970 Number ____ .-- ....•• _ ..••• ---·------------ 182
Prices, wholesale: Basic (valley furnace) •.. dol. per long ton.. 23. 10 Composite ________ -------------------do.... 23. 80 Foundry, no, 2, northern (Pitts.)
dol. per long ton.. 25. 49 Production .....•.....•.. thous. or long tons__ 3, 459
Cast-iron boilers and radiators: Boilers, round:
Production .•........•....•••. thous. of lb .. Shipments_ ... _ ..•••••..••.•••••••.. do .•.. Stocks, end or month ...•.•.•.•••.... do ....
Boilers, square: Production ... ------------------ •.••. do .••• Shipments_._ ........•••.•••.•.•.• _. do .• _. Stocks, end of month ••.•.•••...•.•.• do .••.
Radiators: Convection type:
Sales, Incl. heating elements, cabinets. and grilles
thous. sq. ft. heating surface .. Ordinary type:
Production •••....•...•.•••••.•.•.• do_ •.. Shipments_._ ... _ .••.•.•.•••••.••• do_ .. . Stocks, end ofmo ......•••...•...• do ... .
Boilers, range, galvanized: Orders: New ___________________ number or boilers .•
Unfilled, end or mo., totaL •.....•••• do ..•. Production •....... __ .. ----------------do_. __ Shipments_._ ... _. ___ ..•.•.•••....••.• do ••.. Stocks, end or month __________________ do ....
Boiler and pipe fittin~s: Cast iron:
3,855 2,131
33,800
25,653 13,947
159, 185
465
7, 61)9 4, 343
44.609
86,439 51,418 91,899 91,519 43,002
Production ____________________ short tons .. l 10,432 Shipments __________________________ do____ 9, 520
Malleable: i Production __________________________ do ____ , 6, 586 Shipments __________ -------- --------do ____ l 6, 095
Sanitary Ware I Plumbing and heating equipment, wholesale J
price (8 pieces) ...........•....••.••• dollars .. l 226.91 Porcelain enameled flatwear: j
:i~~;~E;-;mm-:~--:~_:: !! :::1•• • •• •• •· Steel, Crude and Semimanufactured
Castings, steel: Orders, new, totaL ______________ short tons ..
Percent of capacity---------------- __ -----Railway specialties •.••.••.••.• short tons •.
Production, totaL----- ................ do .•.. Percent of capacity-----------------------Railway specialties .....•..••.. short tons •.
Ingots, steel: Production ...•.......... thous. of long tons .. Percent of capacity, ____________________ _
Bars, steel, cold finished, shipments short tons .•
• Revised.
158, 079 132. 6
86,557 113,247
95.0 50,911
5, 229 88
84,858
METALS AND MANUFACTURES
264,337 56,720
33.21
2,898 0
0 0
22,933 18,199 4, 734
132
23
48,008 45,536
55.9 46,823
68,395 126
19.00 19.96
21.39 2,040
3, 954 1, 664
37,738
17,957 8, 984
129,933
229
5, 046 2, 720
34, 779
62,649 26,094 64, 227 61,937 43,332
5, 721 5, 325
3,817 3, 663
301,987 49,277
33.10
3, 4851 19 •
0 9
19,370 15,240 4,130
177
19
47,933 50,954
62.6 51,840
84,915 144
19.00 19.96
21.39 2, 404
3, 456 1, 683
35,429
18,176 11, 129
127,274
278
6,345 3, 549
36,997
57,631 20,177 65,773 63, 548 45,557
6, 032 5, 940
4, 296 4, 201
I
212. 31 i 212. 19 i 877,598 11,088.105 2o6, 115 I 265, 338 154, 291 238, 447 908, 433 11,076,233 220, 4271315, 556 176,295 205,747
71.341 '
1
, 83. 188 I 59.8 69.8 '
32, 542 1 45, 942
5\n i 635g~~ 17, 3851' 24,712
3, 343 3, 942 59 I 69 I
31,378 I 33, 512
i
314.950
1~ 294.951
59,391 59,910
32. 921 32. 79
3, 882 I 3, 763 5,050 6,608
2, 651 1,409
19,242 15,269 3, 974
199
38
44, 136 45,027
55.3 48,854
86,030 146
~~:~I 21.39 2,648
3, 639 2, 243
44,882
19,043 13, 552
150,558
551
6, 253 4, 175
40,368
66,598 25,581 60,3.52 6\,194 44,715
5, 768 5, 923
4,196 4, 442
212.10
1,005,791 265,199 187,662
1.002,735 281,205 189,980
63,950 53.6
25,755 64,246
53.9 25,857
4,046 71
36,232
4, 692 1, 931
23, 107 18,017 4,045
170
29
42,848 43,766
53.9 46,489
85,405 145
19.00 19.96
21.39 2, 586
3,339 3,195
41, 160
21,625 19,523
143,991
613 '
5, 931 5,590
40, 179
73,967 : 21,279 1
74, 242 I 72,921 ' 38,161 j
5, 981 ; 6, 132 :
4,173 ' 4, 202
212. 11
951,022 284,068 210,834 978,254 284,574 234,884
94.345 I 79. 1 '
sz. 466 1
70.323 : 59.0 :
30,802
3. 9ss I 70
296,738 47,940
33.49
3,826 7,160
5,064 2,148
295,341 60,697
33.88
3,969 7,444
5,120 2,005
28, 158 24,008
25,211 21,194 4,017
198 4,150
234 1
21
41.031 44,413
53.3 46, 158
83,720 146
19.00 19.96
41
45, 179 42,253
52.0 35,554
88,075 148
19.00 19.86
21.39 I' 21.39 2, 594 2, 712
3,066 I 3,020 I 3, 905 3, 634 I
40, 314 39, 723
24,867 29, 200
139, 619
I 803 i
27,265 24,658
142,225
755 I
6, 821 i 7, 487 8, 027 i 7, 785
39, 223 ' 39, 246
115, 834 ; 64,671 : 8o, o36 1
78, 142 : 39,755 •
6, 414 7, 690
4, 233 4, 404 .
89, 192 50,064
103, 208 103, 7991' 39,164
I 1, t6o .1 9, 529 I
4, 2251 5. 697 I
j
235, 7641261, 882 59, 993 64, 509
34.15
4,027 7, 481
5, 383 1, 904
31,978 27,555
4,422 258
36
44,361 46,552
57.0 40,194
94, 140 155
19.00 19.80
21.39 2, 730
4, 7931 5, 809 38,706
29,062 33,549
137, 671
750
7, 917 9,190
38,216
91, 142 44, 518 96,757 96,688 39,233
8, 211 9, 613
5, 200 5, 454
34.63
4,385 7,301
5,388 1,989
35, 156 30,377
4, 780 193
40
55,521 51,778
61.9 48,338
97,740 161
19.00 19.80
21.39 2,992
4, 256 8,633
34, 338
32,748 45,960
123,005
789
9,914 12,452 35,990
151,230 57,842
133,848 137,906 35, 175
9, 989 10,170
5,639 5, 794
203,297 61,970
34.65
4,269 3, 758
3,014 1,430
35,378 30,460
4,918 204
37
58, 1521' 50,934
62.3 50,041 i
99,205 164
19.25 20.00
21.64 2, 947
2, 748 5,202
31, 681
22,992 28,642
122, 143
656
7, 111 9, 475
34,032
91,317 39,310
111, 534 109,849 36,860
8, 902 8,134
5, 270 4, 618
221.80 221.80 I 221.95 I 222. 12 i 222. 35
1,027,198 i 1,105,921 li 1,119,943 1,139,842 11,025,742 292,762 I 257,132 235,617 201,2451257,344 294, 246 I 355, 827 I 287. 987 325, 894 240, 369
1,055,71311,087,682 11,192,520 1,298,152 911,011 298, 549 285,935 316, 116 295, 440 214, 742 310,063 i 310, 583 I 338, 500 38.1. 569 I 221,318
74,011 62. 1
34,443 78,654
66.0 34,858
3,923 ' 69
59.393 49.8
21,455 81,574
68.4 36.826
4,195 74
! I
56,877 47.7
16,686 76,617
64.2 34,304
4,161 73
59, 431 ! 49.8
17,962 74,775
62.7 30,006
4, 545 I
77 i
76,394 64.1
35,714 68,874
57.8 28,094
4, 337 1 79 '
244, 173 52,484
201. 512 1 291,079 43,063 l 41.628
35.15
4, 551 0
62 37
31,402 27,022 4, 380
189
48
67,035 61,674
73.5 57,609
102, 195 170
20.00 20.82
22.39 3, 115
2, 584 3, 562
29,96.5
36. 55 ;
4, 691 0
0 0
26, 747 22. (186 3, 761 '
186 i
29 : i
54.070 I 53,638
67.4 51,754 '
104, o6o I 170 !
20.50 1 21.30 l 22.89 I 3. 212 1
3,123 2, 244
30,090
36.74
4, 413 0
0 0
22,418 19,081 3,337
2\0
20
60,187 57,295
72.0 55,742
\08,720 176
20.75 21.44
23.14 2, 999
3, 689 1, 897
31, 857
23,821 19,765
24, 084 24, 497 13, 616 11, 306
125,090 135, 356 i 148, 420
633
7,689 7,444
33,020
129,644 83,949 91,451 85,028 43,326
9,193 7, 365 i
5, 601 I
4, 584 '
427 :
7,180 II'
4, 572 37,069 I
122. v3o I lO~l. f\~l 100,:{(\..1,
103. l~.o 40, 505
s. 818 8, 542 '
5, 544 5, 952 I
222. 47 ' 22:l. 8() .
1,255,81711 9-10.668 ' 319, 452 224,042 306, 329 1 228. 011
1,109,110 11,003.919 285, 187 i 26;), 992 320, 743 ' 260. 120
159,430 i 133.7 '
85.076 83,615
70.1 35,309
4. 432 • 78 :
52, 467
11\~5~ 62,102 8'J. 649
75.2 40,867
4. 737 83
60,363 '
478
7,692 3, 613
41.210
flO. 149 .51\, l9S
10fi, 16b 107, :!15 39,622
8, 69;! 8. 719
5, 922 6, 338
224. 82
892,149 171,884 208,908 964,995 230, 595 232,766
95, tl~3 80.2
51,908 92,678
77.7 42,849
4, 425 84
65,668
, Beginning January 1937, the American Iron and Steel Institute computes the percent of capaeity on a weekly average basis, with no allowance for Sundays or holidays; the figure shown here will be carried forward on the old basis (which relates daily average output to daily average capacity with allowance for Sundays, July 4, and Christmas) in order to keep the series comparable.

May 1937 SURVEY OF CURRENT BUSINESS 49
Monthly statistics through December 1935, to-~1937 1936 1937 gether with explanatory notes and references --- . .
1 ---
to the source of the data may be found in the ' . I I I I 1 Septem-1 • '1 N ovem·l Decem· I Febru 1936 Supplement to the Survey i March March ' Apnl · May
1 June July 1 August . ber Octooer i ber ·, her January -
~---~--~---~l __ a_rY __
METALS AND MANUFACTURES-Continued
IRON AND STEEL-Continued Steel, Crude and Semlmanufactured- 1
Continued f
Prices, wholesale: 1
Composite, finished steeL ______ dol. per lb __ l' 0. 0283 Steel billets, rerolling (Pittsburgh)
dol. per long ton__ 36. 40 Structural steel (Pittsburgh)_ ___ dol. per lb__ . 0221 Steel scrap (Chicago) ____ dol. per gross ton__ 20.85
U. S. Steel Corporation: Earnings, net _________________ thous. of doL_ 44,010 Shipments, finished products _____ long tons __ 1,414,399
Steel, Manufactured Products Barrels, steel: .
Orders, unfilled, end of month _____ number __ 1
1
722,659 Production. ___ -----------------------do____ 855, 889
Percent of capacity------------------------~ 63.6 Shlpments _________________________ number__ 853, 62.5 Stocks, end of month __________________ do ___ _l 24, 014
Boilers, steel, new orders: I Area ________________________ thons. of sq. ft.. l, 516 Quantity --------------------------number ••
1 1, 343
F'gJN~~~r~\~~;e: I Orders: 1
New -----------------·-·--thous. of doL_.---------Unfilled, end of month ____________ do ___ _i---------
Shipments __ ---------··-------------do ____ !---------Shelving: 1
Orders: i New __ -------· ---·--------·-------do ____ .---------Unfilled, end of month ____________ do ____ , ________ _
Shipments _______ -----------------do ____ i_ --------
Sa~~ders: i New_--------- __ ---- ______________ do __ ·-1--- ------l_Jnfilled, end of month ____________ do ____
1
---------
Shipments __________ ---- __ ---·-- ___ _rto ____ .---------Spring washers, shipments ___ • _________ do ___ J ________ _ Plate, fabricated steel, new orders, t<Jtal I
short tons__ 68,899 on storage tanks ______________________ do ____ l 30,548 She~!~e~;ack, blue, galvanized, and full fin·
1
Orders: I New_- --------·--------·------short tous_ -I Unfilled, end of month ______________ do ___ _
Production. totaL ___________________ _cto ___ _ Percent of capacity--·-------------------·
Shipments_- --------------------short tons __ Stocks end of month, t<JtaL_. ________ .do ___ _
Unsold stocks __ - __ ---- _____________ _no ___ _ Track work, shipments _________________ do ___ _
MACHINERY AND APPARATUS Air-conditioning equipment:
(') (1) (') (1) (') (1) (1)
10, 720
Orders, new: 1
Fan group __ --------·------.thous. of doL_1
1---------
Umt-heater group ___________________ do_, __________ _ Electric overhead cranes: I
Orders: New------------------------- __ ---· _.do ____ . Unfilled, end of month. _____________ do ____ l
El~~m:i~~tiiviiieiii:(see-Norirerrous-iii~t~iS.i-Exports, machinery. (See Foreign trade.) Foundry equipment: I
Orders: 1
New _________________________ 1922-24 = 1 oo_ -I Unfilled, end of month ______________ do ____
1
F~~i~~j~};;_eili:------------------------do ___ _
Oil burners: 0~:~:----·----------------·----number-.1
Unfilled, end of month ____________ do ____ l Shipments __________________________ do ___ _ Stocks, end of month _______________ do ____ l
Pulverizers, ordersr new _______________ do ____ i Mechanical stokers, sales § i
1, 079 3, 994
578
294.2 408.5 285.6
14,242 2,838
14,428 16,016
79
0. 0237
28.20 .0180 14.75
0. 0236
28.00 . 0180 14.34
0. 0236
28.00 .0180 12.88
341,248 578,705
43.3 577,240 35,260
299, 7 45 i 400, 184 650, 028 I 636, 449
48.5 ' 47.5 658, 657 i 643, 841
' 26, 991 : 19, 599
590 594
1. 667 964
1, 586
419 235 382
227 190 210 232
784 687
1, 583 913
1, 634
378 I 229 384
251 197 244 313
712 720
1. 514 I 975
1,451
414 262 381 I
228 I 2181 207 251
30, 437 30, 018 ' 51, 443 3, 620 5, 678 . 9. 311
251,818 ! 190, 269 280, 493 i 221, 950 201, 820 1 211, 975
68.3 ' 71.6 209, 673 i 252, 441 141, 916 : 124, 239 10. 648 1 65, 783 6, 258 . 7, 031
954 561
363 1, 723
317 ;
I
115. o I 94.4 1
124.0
9, 431 2,034 8, 931
15,109 24
2,652 !
948 576
572 2.026 I
277
134.0 123.2 105.1
10,541 2, 365
10,210 16,944
41
3,180
191, 511 217,831 224,056
73.6 210,127 138,510 72,333 7,314
1, 059 564
889 2, 641
268
165.4 142.6 146.7
12,730 2, 739
12,356 18,890
27
3, 773
0. 0236 0. 0243 0. 0243 0. 0241 II' 0. 02461 0. 0246 0. 0252 II 0 0257 : 0 02fh
28. 00 30. 00 I 30. 00 : 30. 40 32. 00 32. 00 I 32. 40 I 34. 00 34. 00 . 0181 '0190 i . 0190 I • 0190 I . 0190 . 0190 I • 0199 i . 0205 0205 12.85 13. 38 : 15. 19 , 16. 15 I 16.25 I 16. 50 I 17.15 18 06 19 44
8~:~~~ ~-95ii.851l923;7oa-19~i:~~~ li;oo7Xi7-l-ss2;64311,~t7.~~~ ii;149,\)1ii i,-i33, 724
452, 3861499, 838 I 427. 583 I 456, 6821343, 347 351, 8S8 i 800, 546 826, 510 623, 803
46. 8 ro. 6 I 38. 4 st. 9 62. 1 48. 6 59. 9 61. z 46. 3 626,599 677,462 I 515,380 697, 783 835, 177 653,971 1804,526 824,073 722,338
627,065 67~. 974 I 518. 795 694.331 836,983 658, 1o3 793,670 825, 40{) {)27, 755 19, 133 23,621 I 20,206 23,658 21,852 17,720 ' 28,500 27, Hi7 I 21,750
1, 131 1, 110 1, 081 ! 892 969 I 937 i 1, 872 651 I ' 85.1 1, 049 1, 091 I 1, 140 I 1, 233 1, 201 837 I 915 682 ' 757
. I I I
1. 565 1, 070 1, 470
448 294 416
224 216 226 246
52, 937 21,861
1, 511 918
1, 511
~~~ I 393
204 208 205 267
60,324 9,968
261, 439 I 192,873 276, 551 263, 531 210, 448 217, 651
69.2 71.5 203, 853 213, 372 136, 605 138, 884 75,912 72, 503 6, 507 6, 216
1,106 626
281 2, 242
680
141.4 130.8 153.0
16,038 4,078
14,699 19,341
48
4, 712
1, 336 ' 763 1
404 ' 2, 085 I
566 i
159.6 144.5 145.7
16,413 3,041
17,450 21, 577
23
5,952
1, 517 996
1, 439
1,587 1, 033 1,550
433 394 425
205 195 204 178 209 220 199 201
31, 999 35, 033 8, 604 9, 446
207,781 237,029 202,456
66.5 197,156 141,328 79,451 6,401
1,154 871
539 2,208
416
145.4 152.1 137.2
22,347 4,224
21,164 23,608
34
9,123
255,557 287,746 213,706
70.2 204,285 137,556 71,367 5, 722
983 1, 013
479 2, 275
412
161.0 162.8 150.5
35,252 4,071
35,405 16, 538
22
16,139
1, 841 1, 097 1, 777
436 395 435
1, 734 1,186 1, 646
459 418 436
I
2 227 I
1:363 i 2,113 '
670 ! 426 571
250 238 : 287 194 192 ' 228 234 240 240 242 247 299
33,791 40, 465 51, 017 6, 632 6, 368 9, 320
223, 195 281,226 235,057
82.6 223,874 133,370 69,355
5, 547
1,078 1,624
416 1, 908
783
174.4 174.0 162.9
33,355 3,467
33.959 14,102
23
17,909
294,080 372,407 224,031
78.7 212,130 128,906 62,938 4, 756
1, 044 I 1, 279
529 1,999
436
200.4 223.4 150.9
15,437 2,557
16,347 15, 174
38
8, 687
336,758 456,811 230,581
84.7 244,409 132,432
59,325 5, 579
960 1, 141
1,136 2,472
664
283.3 319.6 187. 1
11,135 2,392
11,300 16,082
133
5, 513
r 2, 444 r 1, 727 r 2, li5
,. 574 '434 '567
192 217 203 309
40,424 10, 507
(') l') (') (') (1) (1) (1) 7. 246
1.137 871
883 2, 893
462
190.9 333.3 177.2
10,333 3,4.)] 9, 274
16, 335 59
'2,899
2, 070 1, 734 2,072
599 404 628
197 186 222 289
30,340 9, 041
(') (') ('I (1) (1) (') (') 8,153
1. 204 711
921 3, 427
387
249.5 380.0 201.8
9, 401 3,024 9,828
16,000 15
3, 121 8\:~~:~ i·,.Z~J'~~ a__ _________________ do ____ ! 5, 326
Number------·------·------··-----------! 159 133 155 186 244 336 434 499 462 ~24 309 • 142 119 20,648 Horsepower--------------·----·---------! 20,313 24,855 43,fi30 38,068 50,717 67,218 80,268 75,106 89,130 62,680 79,226 •22,518
105.3
40, 679 i 42, 407 968 1, 250
Machine tools, orders, new av. mo. shipments 1926=100 __ 1 211.6
Pumps: Domestic, water, shipments: j
Pitcher, other hand, and windmi!Lunits __ l .13, 577 43, 92~1 36 Power, horizontal type ______________ <}o ____ l L ~82 Measuring and dispensing, shipments:t '
125.7 118.9
Gasoline: : Hand-operated ___________________ units _ _l_________ 630 · 871 Power _____ --------------------- .. do ____ 1_ ________ 5, 229 i 8, 725
834 8, 937
128.8
52,236 1,198
621 8, 785
150.1
60,054 1,326
786 9,347
127.5
55,762 1,412
729 8, 971
118.5
47,454 826
886 9,320
136.5
47,548 1, 306
8361 8,630
147. 1
33,022 1, 3~0
748 8, 306
257.7 200.3
32, 602 ' 66, 089 1, 134 ' 1, 242
767 9,035
393 8, 487
Oil, grease, and other: i Hand-operated ____________________ do. ___ . _______ ~ 13, 79S : !l, 329 11, 894 10, 706 H, 341 10, 511 10, .163 14, 785 15, 841 15, 609 12,884 Power_ __________________________ _cto____ _________ 5,224 · 3,450 3,936 3,564 3,282 3,704 3,331 4,620 3,212 1,956 •5,672
Steam, power, centrifugal, and rotary :t Orders,new _________________ thous.ofdoL'--------- 1,1~0 1,267 1,189 1,250 1,379 1,542 1,183 1,198 1,046 1,535 1,271
' Entire series now being revised by the National Association of Flat Rolled Steel Manufacturers. The data will be shown in the Su.rvey when available. r Revised. §See note marked"§", on p. 50.
165.2
59,201 1, 349
658 8,316
13, 513 4, 729
t Revisf'd Sf'ries. Stf'arn, power, centrifugal ond rotary pumps, for reviswns. fo:- period 1919-ao ~ec table 15, p. 19 of the April 1937 issue. For measuring and dispensing pnmp:-.. sec reYisions and explanatory note. Set' not(l nwrked .. ,, on p . .f!J of tht? AJJril 19:17 issu(•.

50 SURVEY OF CURRENT BUSINESS May 1937
1937 gether with explanatory notes and references --- -----.--------c----,----,---,-----.------.---,-------,---- ----,----
Monthly statistics through December 1935, to-~19371 1936 I to the source of the data may be found in the I . I I I 1 I I Septem-1 0 , b I Novem-1 Decem-1936 Supplement to the Survey March March April May June Ju y August ber c.o er ber ber
METALS AND MANUFACTURES-Continued
MACHINERY AND APPARATUS-Con.
w w w
"ter-softening apparatus, shipments .. units .. ater systems, shipments .•............. do .... oodworking machinery: Orders:
Canceled .....•..••..•..•.... thous. of doL New ____ ·---------------------------do ..•• Unfilled, end of month •.•..•.•..•••. do .•..
Shipments: Quantity •.•••.•.•...••.••.. __ .• machines .. Value .........•..•.•.•...•.. thous. of doL.
NONFERROUS METALS AND PRODUCTS
Metals A luminum:
B
Imports, bauxite .........•••••.•• long tons .. Price, scrap, cast (N. Y.) ........ dol. per lb .. abbitt metal (white-base antifriction-bearing
metals): Production, totaL ....•...••... thous. of lb ..
For own use .•••.•.•.•.•.•.•••....•• do .... Sales ................................ do ....
opper:, Exports, refined and mfrs .•••..•. short tons .. Imports, totaL ......•..•.••.... ----- .do .•..
For smelting, refining, and export ... do .... Product of Cuba and the Philippine Is·
c
lands ........................ short tons .. All other ............................ do_ ...
Price, electrolytic (N. Y.) .••.•.. dol. per lb .• L ead:
Imports of ore, concentrates, pigs, bars, etc. short tons ..
Ore: Receipts, lead content of domestic ore.do .... Shipments, Joplin district.. ......... do •••.
Refined: Price, wholesale, pig, desilverized (N.Y.)
dol. per lb .. Production from domestic ore .. short tons .. Shipments, reported ................. do .•.• Stocks, end of month ................ do ....
Tin: Consumption in manufacture of tin and
terneplate ...................... long tons .. Deliveries ............................. do .•.. Imports, bars, hlocks, etc ............. do .... Price, Straits (N.Y.) ..•.•...... dol. per lb .. Stocks, end of month:
World, visible Sllpply .......... long tons .. United States ......•....••....••.•.• do_ ...
Zinc: Ore, Joplin district:
Shipments ..................... short tons .. Stocks, end of month ________________ do ....
Price. prime, western (St. L.) .... dol. per lb •. Production, slab, at primary smelters t
short tons .. Retort8 in operation, end of mo .... number.. Shipments, total t ................ short tons ..
Domestic L ........................ do .•.. Stocks, refinery, end of mo t ........... do ....
Electrical Equipment
Furnaces, electric, new orders: Unit ............................. kilowatts .. Value ................... _ .... thous. of doL.
Electrical goods, new orders (quarterly) thous. of dol..
Laminated phenolic products, shipments thous. of doL
Motors (1-200 H. P.): Billings (shipments):
A. C ........................ thous. of doL D. C ............................... do ....
Orders, new: A. C .•• ------------·-·········-·----do .... D. C ................ ____ ....•..•.••. do ....
Power cables, paper insulated: Shipments ...................... thous. of ft .• Value ......................... thous. of dol..
Power switching equipment, new orders: Indoor .............................. dollars .. Outdoor .............................. do ....
Ranges, electric, billed sales ...... thous. of doL. Refrigerators, household, sales •.•.•.. numher .. Vacuum cleaners, shipments:
Floor cleaners ......................... do .... Hand-type cleaners ................... do ....
Vulcanized fiher: Consumption of fiber paper ••.• thous. or lb .. Shipments .................... thous. of doL.
• Revised.
1, 141 15, 788
-------------- ..
---------...
43,016 .1281
2, 999 546
2,453
31,728 14,553 12,905
46 1, 602 .1578
602
---------
. 0719 41,246 63,425
137, 028
3, 680 9, 080
10, 468 . 6271
24, 127 5, 731
---------• 0738
53, 202 43,635 59,633 59, G3•\ 18,183
3, 664 281
---------
1, 451
------------------
------------------
848 1, 090
.------------------
3, 402 ---------
148, 113 52,301
3,007 652
1, 0141 980 1, 031 12,059 13, 067 13,718 .
5 7 9 417 377 439 632 610 604
224 217 247 358 383 444
19,938 21, 685 28,003 .1263 .1257 .1207
2,064 2, 414 2, 312 453 549 420
1, 612 1, 865 1,893
17,874 17,250 20,421 16, 428 11, 311 15,700 11,988 10, 111 12,926
2, 938 9 1, 467 1, 502 1, 191 1, 307 .0903 .0917 .on8
946 718 2, 967
29, 341 29, 535 30, 547 4, 550 2, 950 4, 540
. 0460 .0460 . 0460 32, 184 36, 175 39, 558 36, 743 40,457 33, 125
223,388 220,991 229,409
2, 350 2,850 3,300 5. 520 6, 235 5, 235 6, 104 4, 994 5, 493 . 4799 .4694 .4630
18, 664 16,869 18, 380 3, 968 2, 713 2, 941
38,640 40,060 40,900 26,930 28.070 33, 560 .0490 . 0490 .0490
'42, 411 '43, 180 '44. 833 37, 922 41,400 41,048
' 38, 037 T -!2, :238 '43, 905 '38.tB7 r 42, 231) T 43,905 T 79, GG3 '80, 634 '81, 502
2, 992 3, 246 3, 637 200 253 358
153,452 --------- ---------'916 r 987 r 1. 125
1, 815 2, 158 2, 248 425 518 525
2,134 2,194 2, 539 585 595 613
446 408 533 561 626 697
57,981 68,080 77,795 166,011 214,250 162, 163
2,190 2, 213 2, 311 272,139 304,089 329,140
114,001 104,559 105,275 35, 878 29,588 32, 175
1, 830 2,129 2, 248 492 470 471
1, 052 845 1, 016 954 1, 001 990 17, 295 16,815 14,990 15, 537 13, 112 11,074
9 12 16 9 10 14 445 474 571 652 561 737 597 610 657 819 816 1,050
267 280 300 358 314 280 445 439 494 490 557 470
41, 043 29, 113 40,506 22,836 19,178 27,496 .1188 .1165 .1163 .1198 .1222 .1263
2, 374 2, 540 2, 495 2, 654 2,491 2, 362 495 563 772 678 695 570
1,879 1, 9761 1, 723 1, 977 1, 796 1, 792
24,516 22, 148 24,622 22,737 28, 577 24,560 14,670 18,071 15, 574 14,639 9, 516 23, 589 14,561 14,788 12,980 11,225 8,093 22, 321
9 1, 512 2 13 24 25 100 1, 771 2, 592 3, 401 1, 399 1, 243
. 0928 .0935 .0953 .0953 • 0956 .1016
1, 027 1, 192 2, 997 382 1. 742 698
31, 828 34, 137 31,314 30,892 30,910 31,096 3, 500 5,880 3.180 2, 970 4, 880 6,390
.0460 .0460 .0460 .0460 .0463 . 0511 36,756 36,863 31, 117 29,788 39,317 40,273 37, 736 38,996 46,388 50,685 59,210 50,313
230, 481 231,081 218, 233 200, 517 183,430 176,960
3, 520 3,260 3, 050 3, 300 3, 300 2, 940 7, 795 7,120 5,385 6. 200 6, 005 5,345 8, 134 6, 674 6, 069 5, 626 6, 327 5, 098 . 4222 . 4297 . 4257 . 4474 .H94 . 5131
16,448 16,759 17,642 16, 896 19,048 23, 148 3, 054 2, 151 3, 095 2, 860 3. 315 3,030
22,060 35,780 46,500 29, 420 35,810 40,830 39,240 41, 270 37,180 30, 590 31,200 29,990 . 0488 . 0478 .0480 . 0485 .0485 . 0497
r 45, 4g1 r 4G, 225 r 44, 875 '43, 5-12 r 42, 211 r 45,670 40, 700 41,308 41.308 40,672 41,733 43, 103
r 41,582 '41, 819 '46. 013 r 51, 775 ' 53, 963 r 56, 887 r 41, 582 ,41,810 I '·11l,Ol3 r 51, 775 ' 53, 963 r .~o. 8/;7 '84, 855 ' 8~. 5171 '86, 046 T 76,482 r 6S, 'iH 57, 527
3,631 2. 262 1 4, 391 • 3, 203 2 757 3, 365 230 168 I 329 I 221
-----~:~-1-----~::. 190,598 ---------~---------1 191,319
'1, 122 ' 1. 123 ' I, 060 · '1,086 '1,131 ' 1,138
2, 513 2. 536 2,319 2, 466 2, 735 2, 243 554 524 607 661 727 558
2, 915 2, 636 2, 628 2, 691 2, 508 2, 563 608 599 682 882 573 658
536 672 664 655 677 ~6~ I 613 610 734 671 672 I
72,425 118,256 85, 7.18 75,906 99,621 89,517 143, 8138 203,674 165, 245 222,832 267. 098 192,967
2, 272 I, 678 1, 468 1, 746 1, 708 1, 425 23i, 371 205,098 106,975 80,050 44,380 78,265
80,649 71,628 84, 108 104,944 109,636 100,983 22,295 18, 765 22,101 39,118 32,944 38,860
2,116 2,179 2, 210 2,185 2,382 2, 23.1 489 525 485 517 I 579 l 510
1,018 10,864
7 744
1, 195
367 619
29,744 . 1274
2. 706 602
2, 104
23,490 16, 702 12,599
2, 974 1,129 . 1076
1,073
32.052 4, 954
. 0555 43,613 52,032
171,856
3, 200 6, 930 8, 339 . 5!85
23, 787 5, 095
44, 24S 23,08.1 . 0527
' 46, 940 42.965
r !)9, 512 , sn. 512 '44, 955
3, 161 236
228, 062
'1, 229
3, 26fi 811
3, 9.15 933
577 815
124. 562 284,308
1. 719 123, 208
114,892 40,921
2, 446 599
Janu- Febru-ary ary
'960 ' 15, 562
21 744
1, 339
314 571
28,363 . 1281
2, 364 518
I, 846 .
22,046 7,133 5, 994
2;) I, 115 . 1242
249
35.760 4, 722
. 0600 41,223 45, 718
169, 776
3. 070 7. 615 8 •. \09 . 5089
26,179 : 5, 47~
41,262 ... ----
. 0585
'40, 047 40,285
'51, 227 r 51, 227 '33, 775
4, 225 255
I, 005
2, "176 634
3, 274 984
732 8()8
77, 303
'1, 012 16,082
---------------------------
------------------
41,603 .1281
2, 290 579
1, 712
29,099 21,952 18,358
2, 133 1, 460 .1343
402
32,286 5, 398
. Ofl24 :14,986 .50, 375
1.50, 832
3, 13 0 7. 675 7, 238 . 5194
23,774 4, 956
43, 837 ---------
. 0647
r 37, 79 42,78
4 6 3 3
r 40, 1)5, T 4(), g.)'
T 24,61
3. 26 21
1. Q,)
2. 64 7-t·
3, 30 1, 07
95. 1.02
-----3!1. 3\J.\ :. -----
I, 840 : 171,405
92.0.16 32, 520
2, 3()7 G40
], 69 245, 71
112, 7~ 38,47
9 8
2, 32 63.
,Monthly data on copper production. shipments. and stocks for months of 1936, comparable with those shown in the 1936 supplement through 1935, are not aYailsble. §Classifications changed starting in January 1937, but for all practical purposes the series shown are comparable. Classes 4 and 5 are practically equivalent to former
class 4; changes made in classes 1, 2, and 3 do not affect the total for the 3 classes as shown here. tHe vised series. Data revised for 1936. He visions not shown a hove are as follows: January production, 41,641; total shipments, 46,341; domestic shipments. 46,341; stocks
79,059; Febmary pro,Juction, 36,15n; total shipments. 39,846; domestic shipments, 39,846; stocks. 75,369.

May 1937 SURVEY OF CURRENT BUSINESS 51
Monthly statistics through December 1935, to- 1937 1936 1937 get her with explanatory notes and references
March I I I I January I to the source of the data may be found in the March April May June July I August I Septem-1 October I Novem-1 Decem-1936 Supplement to the Survey ber her her
METALS AND MANUFACTURES-Continued
NONFERROUS METALS AND
I PRODUCTS-Continued
Miscellaneous Products
Brass and bronze (ingots and billets): Deliveries. ____ -------. ____________ net tons .. 10,626 5,897 6,012 5, 747 5, 996 6, 339 6,379 6. 783 8,025 7, 773 7, 939 !0, 022 Orders, unfilled, end of mo ____________ do ____ 26,408 18,914 22,238 19,288 17, 379 25,289 23, 717 23, 796 32, 411 30,436 33,077 29,309
Plum bin;!; fixtures, brass: Sbipments ________________ number of pieces __ --------- 1,210,393 1,275,836 1,274,888 1,345,454 1,502,900 1,428,850 1,561,410 1,657,418 1,539,774 1,804,702 1,929,150
Radiators, convection type: Sales:
Beating elements only, without cabinets 140 106 141 47 or grilles .... thous. of sq. ft. heating surL. 34 63 51 74 84 101 103 168
Including heating elements, cabinets, & 459 343 grilles ______ thous. of sq. ft. heating surf.. 448 117 202 233 349 441 415 448 426 328
Sheets, brass, price, mill. _________ dol. per lb __ • 210 .H6 .148 .151 .151 .152 .154 .155 .157 .162 .168 . 178 Wire cloth (brass, bronze, and alloy):
Order.: New. ---------------------thous. of sq. fL. 1, 107 413 369 416 408 384 423 455 505 517 689 1,191 Unfilled, end of mo ____ ----------- .. do ____ 2, 051 516 412 441 500 478 469 528 567 672 774 1, 355
Production ___ ------ __ -- __ ------ ______ do ____ 557 424 450 387 413 413 408 433 501 428 521 535 Shipment~---------. ------ ____________ do .... 558 411 439 386 379 416 406 442 457 418 508 512 Stocks, end of month _________________ do .... 790 709 702 706 740 718 698 740 764 771 749 774
PAPER AND PRI~TING
WOOD PULP I
I I I Consumption and shipments:t EEl I I
Total, all ~rades _________________ short tons __ 563, 062 442,488 484,223 476,628 473,075 463, 80·1 483, 154 481,745 529,035 504,627 511, 019 820,747 Oroundwood ________________________ do ____ 138,800 117, 280 127. 121 129,305 128, 242 120, 955 120,403 120, 190 137, 945 132, 914 134,039 131,041 Sulpbate ____________________________ do ____ 179. 0\!1 140,989 140,867 152,811 151,003 148,729 159,542 157, 116 168,533 161,442 !58, 782 172, 386 Sulphite, totaL--------------- ______ do ____ 183, 588 137, !53 166,413 149, 149 148,742 150,673 !55, 813 156, 131 169, 416 157, 897 161,912 !55, 192 Bleached .. _______________________ do ____ 115, 30\ 85,952 109,146 93,911 95,594 97,032 100,809 98,355 106,994 98,008 99,946 100. 255 Unbleached _____________________ _do ____ 67,287 51, 201 57, 267 55,238 53,148 53,641 55,004 57,776 62,422 59,889 61,966 64,937 Soda .. ____ ------------------------ .. do. ___ 61, 583 47,066 49, 822 45,363 45,088 43, 447 47,396 48,308 53, 141 52,374 56,286 58, 128
Production:t Total. all vrades ______________________ do ____ 576, 0\li 455, 842 483,432 490,802 473,980 452,394 475,360 464,735 519,909 501,810 512,057 540, 822
Ground wood------------------_. ____ do .... 148, 927 126,379 137, 726 138, 146 126,471 111, 582 108.962 109,463 130, 383 130, 436 138,470 139, 109 Sulphate ____________________________ do ...• 179, 0(1] 140, 567 141,860 !52, 354 151,914 149,027 !59, 702 154,947 167,030 161,604 159,420 172,559 Sulphite, total. _____________________ do ____ 186, 7G6 143, 378 153, 572 154, 060 150, 280 147,855 158,870 151, 381 170,089 !59, 265 158.161 170, 9f>8 n leached--------------------------do---- 115, 1S-t 89,254 99,951 99,799 96,268 94,850 100,910 91, 120 105, 935 98,402 96,380 103, G76 Unbleached _______________________ do ____ 71,582 54,124 53,621 54,261 54,012 53,005 57,960 57,261 64,154 60,863 61,781 G7, 292 Soda __ . _____ . ___________________ . ___ do .. __ , 61,313 45, 518 50, 274 46,242 45,315 43,930 47,826 48,944 52,407 50,505 56,006 58,186
Stocks, end of montht: • Total, all grades .. ____________________ do ____ l S7, 820 l05, 476 104,234 116, 514 117,402 107,266 100,707 85.310 77,656 75, 722 76,614 71,712 Oroundwood ________________________ do ____ 34,403 41,479 50,727 58,396 56,830 48,616 38,646 29,280 22,742 20,600 24, 634 22,926 Sulphate __________ . __ ._. ____ ._. _____ do. ___ n. 4~~ 6,440 7,471 7,085 7, 912 8, 232 8,384 6, 203 4, 784 4. 98.1 5, 474 6,014
Sulphite, totaL _____________________ do .. --1 44, 580 55,080 43,239 47,624 49,104 46,529 49,478 45,170 45,999 47,317 43,867 40,091 Bleached ______________________ .... do ____ 28, 404 36,593 28,276 33,631 34,260 32,304 32,369 28,565 27,651 2R, 047 24,868 24, 24fi Unbleached _____ . __ ----- _______ . __ do ____ 16, 176 18,487 14,963 13,993 14,844 14,225 17, 109 16,605 18, 348 19, 270 18,999 15,845 Soda .. __ -----------. ____ ------ __ ._ .. do ____ 2, 402 2,477 2, 797 3,409 3, 556 3,889 4,199 4, 657 4, 131 2, 820 2, 639 2, G81
Imports: ChemicaL ____________________________ do ____ 170, 038 143, 576 122,060 166,048 235,129 207,444 222,320 208,933 201, 284 198,195 215,612 192,788 Oroundwood ______ ------ _____ .. ___ . __ .do. ___ 17, 2\!6 20,457 13,905 21,437 14,529 26,628 19,850 28, 183 23,572 27,031 26,333 20,7:35
Price, sulphite, unbleached .... dol. per 100 lb .. 3. 34 . 1.90 1.90 I. 91 l, 93 L 93 1.93 1.94 I. 98 2. 06 2. 33 2.1\3
PAPER I
Total paper: Paper, incl. newsprint and paperboard:
Production, ___________________ short tons .. ---- .. -- 776,471 •868, 901 798,060 797,826 ' 846,4341833. 038 843, 417 •984, 688 8fl4, 309 956,779 <r 948,514
Paper, excl. newsprint and paperboard: 613, 61l9 I, sz1. 4or. Orders, new ___________________ short tons __ ------ -- 4.13, 983 485,208 415,828 406, 228 466, 482 428, .149 459,373 560, 150 505, 593
Production ________ ._._ .... __ -----._ .do .. __ ----- --- 414,714 496,498 432, 8!4 429,324 474,040 439.309 442,692 5-13, 763 462, 837 517,958 '50:), 4~7 Shipments_---------------------- ... do ____ ----- --- 413,778 485,666 424, 281 415, 506 480, 156 426,957 449,087 538,340 457,044 563,997 '511, 911i
Book paper: Coated paper: Orders, new _______________________ do ____
24,709 31,096 18,610 17,097 16, 502 16,876 18. 53! 18,895 1 20,554 28, 287 28, 119 26,676 Orders, unfilled, end of mo ________ do ____ 10, 855 17,314 11,336 9.106 8,218 6, 657 6, 780 i, 407 6,634 12, 1;59 12, 783 11,11fl Production ________________________ do ____
21,4Mi 24,697 23,525 21,409 19.260 19,226 20,103 19,239 22,225 22.761 2G, 835 27,210 Percent of potential capacity __________ 94.5 76.0 79.0 71.0 68.0 66.3 69.4 77.7 83.4 83.4 91.0 94.0 Shipments _______ ._._. _______ short tons .. 21, ISS 25,998 23,734 21,308 18, 497 18,885 20,387 18,983 22.048 22, 531 28,952 27,939
Stoeks, end of month ______________ do ____ 10,230 12,528 11, Q92 12,093 12,245 12,878 13,284 12, 157 12,334 12, 386 12, 785 11, 884 Uncoated paper:
Orders, new _______________________ do ____ l 131. 537 128,902 85, 518 72,890 77, 313 82, 107 85,004 91,452 101,413 115, 477 127,834 114, 643 Orders, unfilled, end of mo _______ .do .... S2, 2-14 65,508 49.939 37,369 35,013 1 33.058 33,831 34, 208 34, 270 54,829 66,239 64,372 Price, cased, machine finished, at, mills
5. 25 I 5.251 dol. per 100 lb .. :). 7.) 5. 25 5.25 5. 25 5. 25 5. 25 5. 25 5. 38 5. 50 5. 73 Production __________________ .short tons __ 100, :2fi0 101,669 107, 5331 97,369 86,676 89, 210 93,988 95,793 103,417 98,939 112,689 111, 733 Percent of potential capacity .. -------- 9~. 8 80.0 85.4 77.5 71.6 73.4 76.0 83.2 83.5 84. 3 86.2 90.6
Shipments _______ ---------- .. short tons .. 112,741 107, 116 10.5, 689 90,507 83,718 86,040 92,611 94,141 101. 648 98,448 119, 231 114,085 Stocks, end of month _____________ _do ____ 77, 743 73,349 76,033 82,280 83,644 87,036 88,970 94,548 89, 724 92,607 86,067 80, 267 Fine paper: I Ord~rs, new __ .-----------. __________ do ____ --------- 39,086 44.620 30,922 31, 641 37,073 31,516 3!,8G5 50,578 40,033 53,679 T 48, ()']() Orders, unfilled, end of mo __________ do ____ i _________ 16, 121 16, 169 13, 194 12,274 10,941 9, 684 9,995 13,800 !(), 468 21,470 ' 24, 778 Production _________________________ ,do _____________ 33, 678 47,990 35,561 3.1,077 39,358 33,626 30,625 47,416 37, 986 48, 112 ' 43, 482 Shipments. ____ ._ .. ____ . __ . _________ do. ___
--------· 35,435 45, 119 33,559 33,033 39,951 31,838 31,727 46,610 36, 610 48,308 45, 632 Stock~. end of month _______________ .do .... -------- 61,141 61,545 62,510 65.784 62,957 65,527 66, 100 66,771 68, 325 67,972 63, 068
Wrapping paper: Orders, new -------------------------do .... --------- 133. 755 177,510 151,013 140,385 167,815 141, 436 159,712 207,062 170,910 230,499 rlt)\), ;)!)\) Orders, unfilled, end of mo __________ do ____ -------- 61,447 77,344 73,312 72,439 74,750 77,600 87,212 95,934 116, 625 153,811 r 145, :!51 Production _______________ .------._ .. do __ .. --------- 132,887 165. 537 140, 120 144,615 163,588 147. 142 150,952 19.5, 874 155, 605 19G, 998 '169, f>l7 Shipments. _____ ._----- ____________ .do ___ . --------- 128,056 161,543 144,232 143.367 I 167, 586 140, 740 153, 243 199, 369 151,785 200, 43:1 r 171.2/0 Stocks, end of month ________________ do .... --------- 114,066 118,269 114.092 113,711 to9, tso I 112, 323 110, 704 108, 163 111,912 110,612 r :!.08, 14fi
Febru-ary
9, 433 30,28 6
1,878,90
33
23 .18
21 1,36
48 47
6 g
78
5 04,031 22.003 60,859 65,613 99,373 66,240 55,556
1 1 1
5 13,703 30,067 61,343 66. ~58 04,713 G2, 245 55,335
1 1 I 1
78,586 27,970 6,435
41, r.40 2R, 489 13, 151 2, 541
2 14, 115 17,093
3. 01
9 44,760
12,858 99,257 93,677
5 ·I 4
21,746 9, 257
23,043 103.0
22,863 11, 029
I 11,112 69, 703
1
1
1 1 1 1 1
5. 75 04, 795
95.7 03, 829 84, 191
44, G38 23,960 44,516 4G, 0.)0 62, 534
~~: gE~ 72,290 (i9, 367 09,925
,See note marked .. , .. on next page. • Revised. E9 Comprises pulp used in the producing mills and shipments to the market. tRevised series. Production of wood pulp, except soda pulp, for 1936 has been revised to conform with the industry totals reported by the U. S. Pulp Producers' Asso
ciation for that year. For these items, consumption and shipments have been adjusted to the revised production figures by the Survey nf Current Busines-•. For the same items, data on production and consumption and shipments for !935 adjusted to census data for that year will appear in a subsequent issue. Pending publication of these figures, data shown in monthly issues starting with March 1937 can be used in conjunction with earlier data shown in the 1936 Supplement without serious error. Figures on stocks have not been adjusted through December 1936. All wood-pulp data except soda pulp, starting w;th Janu"ry 1937 are based on the reports of 145 identical mills (earlier months are for 162mills) adjusted to compare with the figures for earlier periods. Data on soda pulp (production and consumption and shipments) have been adjusted to the 1935 census by the Survey; earlier figures appeared in the 1936 Supplement.

52 SURVEY OF CURRENT BUSINESS May l\:137
Monthly statistics through December 1935, together with explanatory notes and references to the source of the data may be found in the 1936 Supplement to the Survey
1937 I 1936 1937
March March I April I May I June I July I August I Septem-1 October I Novem-1 Decem-11 January I' Febru· , her , her her ary
PAPER AND PRINTING-Continued __________ P_A_P_E __ R ____ C __ o_n_t-in_u __ e_d--------~------.-----~------~-----,-------~-------~------~----~------------~------------ --------
Newsprint: li I Canada: I
Exports .• ---------------------short tons.. 294,935 256.564 192, 894 I 258, 288 283, 589 234,050 1 257, 577 278,368 Production t-------------------------do.... 301, 110 243; 811 258, 6881267, 753 270, 709 272, 7621270,363 269, 074 Shipments from millst --------------do.... 290,453 240, 164 267,263 287, 131 263, 512 269,929 278,529 268,909 Stocks, at mills, end of mot _________ do.... 84, 902 94, 204 85, 618 66, 107 72,597 73,960 65, 896 65, 718
United States: I I Consumption by publishers •••••••• .do.... 197,956 183,974 183,399 227,216 178,396 170,884 168,289 175,811 Imports ...•.•••.•••.•••.••.•••••.••. do .... 270,478 220,641 203,590 1262,580
1
222, 187 205,704
1
1 246, 186 . 238,317 Price, rolls, contract, destination (N. Y. 'I
basis) ________________ dol. per short ton.. 42.50 41.00 41.00 41.00 I 41.00 41.00 41.00 ! 41.00 Production, ------~------------short tons .•
1 ~2. ~~li 76, 500 76, 504 75, 719 79,820 73. 361 , 74, 338 : 72, 206
Sh!pments from mlils ............... do .... 1 ,g, "' 0 74,482 77, 714 77, 273 74,838 74, 780 1
] 72, 645 , 75, 599 Stocks, end of month: I I ·
At publisherst .................... do .... 247,395 202,838 189,054 191, 162 1?3, 761 201,731 ' 220, 145 I 232,204 At mills ........................... do ...• l 19,001 18, 163 17,249
1
15,907 21, o:n 19,907 1 20,647 1 16,878
In transit to publisherst .......... .do ... -1 57, 099 40,924 48, 663 45, 868 40, 553 48, 099 42,309 · 42, 881 Paperboard: , 1
Consumption, waste paper ............ do .... l. 237,601 245,738 i 241,895 241, 651l Orders, new ........................... do .... ' 290, 854 297,984 i 280, 899 290, 098 Orders, unfilled, end of mo ............ do .... l ... _ 96,202 99,796 i 92,784 96,402 Production, ___________________________ do ... -1.... 285,257 295, R99 i 289,527 288,682
PercentofcapacitY----------·-------------1--- 69.4 71.8' 71.0 70.5
249,402 304, 747 101,557 299,033
69.4
268,770 332,553 117, 443 319,391
76.7
281, 046 353, 197 135,732 328,519
79.1
289, 733 295, 833 301, 096 286, 235 307, 250 293, 539
59, 439 51,986
203,198 260,135
41.00 81,076 81,771
16,400 236,743 42,106
306,874 357,783 138,830 359,849
82.7
223,813 249,153
41.00 79,848 80,469
15,988 ~14, 568 56, 425
274,332 308,732 127, 193 321,624
79.6 Stocks ?f waste paper, end of month: i i i
At m!lls ....................... short tons __ ,_ 204,376 I 204,353 '213,4:l5 In transit and unshipped purchAse<
1
1 I I ; 218, 330 • 219,042 207, 886 191, 408 189, 590 182,822
(') sh rt tons (') 38,167 I 44,306 1 (')
PAPER PRODUCTS 0
--~ I ' Abrasive paper and cloth, shipments: I
Domestic .. ----------------------·---reams __ l 90,365 67, 405 77, 5fil 90.064 p,r;~~~~.:<i·il1iiiiiiiii-l)<ixes:·-----------do. ___
1
13, 971 9. 769 , w. 241 1. 864
Shipments. totaL ........... mills. of sq. ft .. _____ 2,0191 2,095 1 2.268 i Corrugated _________________________ do____ _____ 1, 804 1, 873 2, 035 ! Solid fiber __________________________ do .... l- 215 222 233
PRINTING I I Blank forms, new orders ________ thous. of sets .. ! 129,377 95, 189
1 101,805
Book publication, totaL ______ no. of editions .. I 889 953 I 854 New books _______________________ .. ___ do .. __ ; 740 801 718 New editions _______________________ .d0----1 149 !52 'I 136
Operations (productive cap.) ....... l923=!00 .. __ ------- 82 84 Sales hooks. new orders._ .thous. of hooks ___ ! 19,711 15.778 15.031
96,677 : 990 : 795 i 195 !
861 15.581
(')
76,084 9. 479
2,188 l, 945
242
100, 725 729 602 127
81 17,48.1 I
(')
69,709 7, 306
2,249 l, 994
255
107, 837 723 575 148 80
18,384
(1) (!) (1)
76,191 10,176
79, 4R9 I 85, 824 7, 455 : 9, 377
2. 698 2. 382
317
i
2. 809 ! 2, 485 !
324 !
' 104, 349 I 107, 421 !
890 • 809 ' 731 69o I
1~~ ! lb~ 't
16.683 I 16.920
2, 650 2,392
258
129,034 1,195
966 229 98
18,513
RUBBER AND RUBBER PRODUCTS
6~. 952 7,327
2, 281 2,092
189
140,638 841 732 109 101
16,166
286, 233 ' 259, .\4:) 289, 312 ! 286, 991 ' 316, 723 1 2f.l, 992 24, 506 ' 49. 505
'·'
198,264 183, 106 278, 991 1 238, 426
41. oo I ·12. 50 80, 048 79, 362 s1, 91o I 7 s. o4r.
14,239 ' 18, f\73 251,091 1 257. 2-ll 54, 294 I '49, 013
279, 068 1, 295. ss4
i~8: m ::~gr: XAg 32s. 773 I, 36.1, 665
75.6 1 •82.0 I
199,404 •211,29!i
(1)
74, 713 11,492
2, 488 2, 276
212 '
166,970 1, 074
868 206 98
19,139
('
81, 94f; 6, 2\14
2.3q 2. Lil
1C4
li\f;, \J.l~ 7Sl f\94
87 99
lf\, g,\9
CRUDE AND SCRAP RUBBER I 'I ' I ' ' I '
I' li ' i I I Crude: · ' Consumption, totaltt ............ long tons.. 52, 9:lb '42, 813 1
' 52,031 I '50, 612 '52, 772 '48, 250 '46, 777 1 '4f\, 449 '49, 637 '50, 433 '49, 754 For tires and tubest.-----·----------do____ 26,385 35,3.90 36,442 38,168 38,380 35,823 35,093 36,520 37,215 37,179
Imports, total, including latex ........ do.... 40, 898 34, 874 45,830 37,050 38, 273 39,843 41, 788 W, 033 40,965 38,414 51, 382
48, i44 i
36,777 43, 339
Price, smoked sheets (N. Y.) .... dol. per Jb__ . 24(i . 159 . 159 .156 .159 . 165 . 163 .164 .165 . 180 . 200 Shipments, world ________________ Jongtons .. 101,000 68,671 59.261 67,718 65,756 82,35.0 70,249 71,343 80,552 77,000 79,000 Stocks, world, end of montht _ ........ do._.. 448,879 '583. 318 '5117, 1i2 '541, 871 '520, 255 .119. 074 '500, 520 l'493, 585 •486, 159 •46fl, 491 •466, 576
Afloat, totaL. ______________________ do ____ , 125,0011 90,000 83.000 89,000 90,000 106,000 99,000 96,000 106,000 •105,000 103,000 For United States ................. do .... ! 5fi, \194 58,935 47,678 48.860 47,228 60,343 63, .197 62, 24D 67,825 73,691 56,567
London and LiverpooL ......... - ... do .... l 52,077 147,712 140,404 130,590 122,285 113,386 108,2151103,962 96,625 88,781 78,462 BritishMalaya ___________________ .. do .... 82,802 61,045 61l,290 59,866 62,426 63.838 63,138 60,287 59,534 60,230 62,114 UnitedStatest, .. __ .. _______________ do .... , 18\1,000 •284,561 '277,478 262.415 •245,544 •235,850 '230,167 1•233,336 '224,000 •211,480 •223,000
Reclaimed rubber:t t i I Consumption _________________________ do. ___ j I.o.393 •8,9o7 •IO,Sn7 '10.682 •11,810 '12,084 '11.242 •11,424 •12,892 •12,302 •13,280 Production ___________________________ cto.- .. 1 14,458 '10,102 •10,734 •10,857 •11,256 '11,628 •12,124 •12,221 •13,898 '13,540 •15,031 Stocks,endofmouth _________________ do .. __ i :l0,277 '16,215 '12,391 '12,706 •12,585 •12,522 •13.206 •13,87-1 •14,673 '15,643 •19,000
Scrap rubber: i Consump:~:~~ '::~~m;~~~u:~·) ... do ___ T _ 28,994 -------- 31,033 -------- ......... I 33,741
1......... 36,347
Pneumatic casings: , I] I Production ...................... thousands .. ' ...... 3,638 4,854 4,971 5,610 5,465 5,014' 4,981 5,125 4,969 •5,311
. 214 71,000
'4.14,249 98,000 5.5, 096 71,062 7R, 276
r 2G6,9ll
13.3flG 15,129 31,610
4, 980 4, 509
222,94.\ 21\ 532 251, 256 73, 769
'199, 997 204, 689
42.50 72,072
'74, 941
15,995 '243, 951 '54. 013
:295, 477 386, 7~1 236, Oil 37:J. 131
90.0
('•
80, 29-l fi, 97?
~- 434 ~.103
·?:~1
14t~. 194 1.<•11
81.'· l9f) 103
10. f)f,';'
,)(J, 282
4-1, 715 . 213
,. il,OO(J r 43.~. 26Zl '94, 001l
53, 538 63, 761! 8fl, 47>i
r 191, ()2/
13.48:1 15,192
r 32, Sl7
Shipments, totaL _____________________ do ... -; ... 3,856 1 4,903 5,832 5,792 5, 744 1 4,976 3,836 4,081 4,232 '5,016 Domestic ........................... do .•.. 1 .... ... 3, 784 4,836 5, 752 5, 711 5,678; 4,911 3, 768 4,012 4,162 •4,926
Stocks, end ofmonth ................. do ... _, _____ ... 9,087 9,034 8,176 7,833 7, 746 1 7, 793 9,005 10,089 10,814 '11,114 Inner tubes: i 1
4, 421 ------- .. 11,377 ---
Production .......................... .do ....
1
.___ 3,787 4,824 4,819 5,035 5,177
1
5,039 5,161 5,397 4,739 5,121 4,801 Shipments, totaL ..................... do .... __ . _ .. _ 3, 796 4, 746 4, 919 5, W4 5, 758 5, 136 4, 231 I 4, 108 3, 995 4, 819 4 391 ~-- ·- ..
Domestic_. -------------------------do.... ... . .. 3, 737 4, 681 4, 853 5, 4421 5, 544 5, 093 4, 031 j 4, 055 3, 948 4. 754 4' 3"7 · .. · .. Stocks,endofmonth ................. do .... i ... _ .... 8,692 8,788 8,719 8,105 7,725 7,621 8,627, 9,977 10,732 10.985 11:100 .. ::::::
Raw material consumed: ' I ~~~~~-~~~~·---(~-~~~~~~-e-~~-~~g~~s oflb.. 1... .. 16,564 20,458 21,110 I 22,833 ]' 22,532 ) 21,175 i 20,9741 21,690 21,744 22.649 22,207 I' .........
MISCELLANEOUS PRODUCTS i 1
,
Simrle and double texture proofed fabrics: 1 I I i , Production .................... thous. of yd __ , 5, 25:\ 3, 268 3, 869 3, 258 3, 5261 3, 667 I 4, 145 1 4, 849 1 4, 650 3, 672 3, 953 3, 8S4 I! -l, 34:2
Rubber and canvas footwear:t I I Production, totaL .......... thous. of pairs .. i --------- 5, 905 5, 876 5, 227 5, 659 4, 571 1 5, 588 6, 003 6, 751 6, 496 7, 599 5, 898 1 .i, 93.5
Tennis------------------------------do •••• ~--------- 2, 937 2, 888 2, 058 2, 018 1 1, 244 I 1, 377 1, 150 1, 280 1, 461 1, 951 2, 418 1 :l, 241 WaterprooL ....................... .do .... ----·---- 2,969 2,988 3,170 3,641 I 3,327 4,212 4,853 5,471 5,035 5,648 3.480, 2.694
Shipments, totaL ..................... do .... _________ 5,041 4,970 4,429 4,334 5,431 I 6,877 'I 8,063 7,897 6,502 7,409 6,018 i 4.520 Tennis .............................. do ____ ,_________ 3,019 3,519 3,333 2,791 2,034 1,443 1,481 796 588 1,295 2,639
1 3,308
WaterprooL ........................ do .... :_________ 2,022 1,451 1,096[ 1,543 'j 3,3971 5,435 6,582 7,102 5,914 6,114 3,379: 1.212 Shipments, domestic, totaL __________ do .... ' .... .. .. . 5, 011 4, 928 4, 399 4, 290 5, 407 6, 851 I 8, 039 7, 844 6, 464 7, 373 5, 954 1 4. 488
Tennis .............................. do ...• : .. _...... 2, 997 3, 480 I 3, 3091 2, 751 ,
1
2, 018 1, 420 , 1, 465 751 557 1, 26:\ 2, ti03 ' 3, 291 WaterprooL ....................... do ... -1---- 2,014 1,447 1,090 1,539 3,390 1 5,431 1 6,574 1 7,093 5,908 6,108 'l 3'>1 ' I 195
Stocks,total,endofmonth ............. do .... ; ... ------ 15,804 16,699 17,497 18,822 17,962! 16,6261 14,567' 13,430 13,425 13,615 13:4~,4 I 14:869 Tennis ................................ do ____ ,_________ 7,207
106 •. ,
1o6354
1
152
•. 2820
98
i,· 4,519 ( 3,729! 3,615! 3,286! 3,780 4,654 5,310 5,108; .i,041 Waterproof . _ ... _ ... _. _ ... __ ........ do_ .. _I... 8. 597 I _____________ 1_~· 303_,_ _ _1_4._2_3_3_! __ 1?_,._01_0_1 _ _::_11",-"'28"-'1'--'-1 __ 9::·.::6::.51:__ __ 8'",_.7.:_7::_1 --~8,':!3:::0::.5 -'---"8-'3'-!:.:c"..:I __ __:-9·_:B_:_:2 0
' Revised. 1 Data no longer collected by the Bureau of the Census. ,For data raised to industry totals, see the 1936 Supplement. Figures shown here are as reported; these were also given in the 1936 Supplement. t Revised series. Data on total rubber consumption, world and United States stocks of rubber, consumption, production and stocks of reclaimed rubber reYisetl for 193·
and 1936. Revisious~uot shown above will appear in a subsequent issue. Data for newsprint (Canada) revised for 1936. Seep. 52 of the Aprill937 issue. Revis'on; for earlier years on stocks at publishers and in transit to publishers will be shown m a subsequent issue.
1Data are raised to industry totals; see the note explaining these series iu the 1936 Supplement.
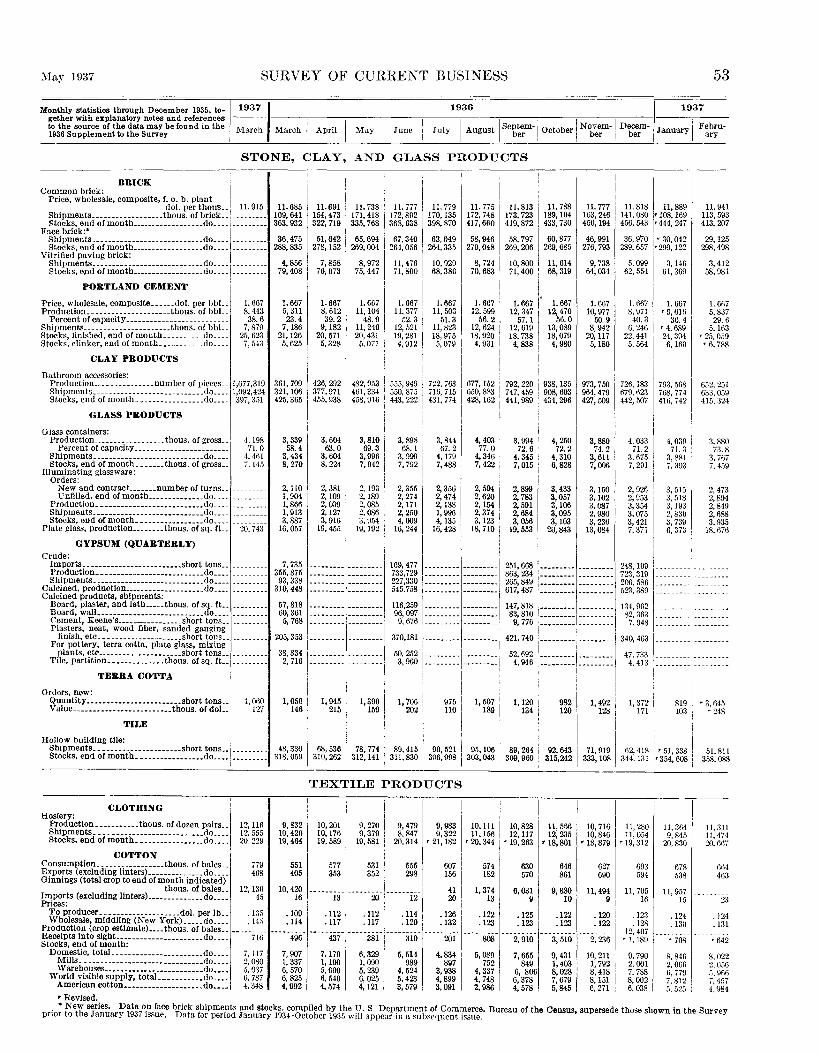
.\lay 1937 SURVEY OF CURRENT BUSINESS 53
1936 1937 Monthly statistics through December 1935, to-, 19371 gether with explanatory notes and references --- ----,,-----,-------;-----,~----~--;---,-
1---,
1---,
1----,-
1----l----,
1---
to the source of the data may be found in the March March I April I May I! June July August Se~te~m- October Nobe~m- Dtc:rm- January F;~Yru-1936 Supplement to the Survey
1 1
STONE, CLAY, AND GLASS PRODUCTS
BRICK Common brick: I
Price, wholesale, composite, f. o. b. plant I
dol. per thous .. 1
11.915 Shipments------------------thous. of brick .. , Stocks, end of month _________________ .do .... , .... -----
Face brick:* I ~f~~~~~~'::io!llioiiiii_-_~~~=~=:~:::~:~::g~::~: i :::::::::
Vitrified paving brick: I Shipments .. -------------------- ...... do ....
1
.--- ---Stocks, end of month __________________ do ...... _____ _
PORTLAND CEMENT 1
Price, wholesale, composite ••.... dol. per bbL. Production _____________________ thous. of bbL.
Percent of capacity------------------ _______ _ Shipments __________ ----------.. thous. or bbL. Stocks, finished, end ofmonth .......... do ..•. Stocks, clinker, end of month. __________ do ....
CLAY PRODUCTS
Bathroom accessories:
1.667 8,443 38.6
7,879 25,623 7, 543
11.685 11.691 11.738 11.777 11.779 11. 775 11. 813 109,641 154,473 171,418 172,892 170,135 172,748 173,723 363,932 322, 719 335,768 368,638 398,870 417,660 419,872
~rn ~~ ~M ~~ ~oo ~~ ~m 288, 835 278,152 269, 004 264, 056 264, 335 270, 048 269, 206
4, 856 7, 858 8, 972 11, 476 10,920 8, 724 10, 800 ~~ ~~ ~w n~ •~ m• n~
1.667 5, 311 23.4
7, 186 21,126
5, 625 I
1.667 8,612 39.2
9,182 20,571
5, 328
1. 667 11,104
48.9 11,240 20,431
5,071
!.667 11,377
52.3 12,521 19,281 4, 912
1.667 11,503
51.3 11, 823 18,975 5,079
1.667 12,599
56.2 12, 624 18,920
4, 931
1.667 12, 347
57. 1 12,619 18,738 4,838
!
11.788 189,104 433,730
60,877 269,685
11,614 68,319
1.667 12,470
56.0 13,089 18,079 4, 980
ll. 777 1 L 818 ll, 889 163,246 141,080 r 108, 169 450, 194 456, 543 r 444, 24 7
46, 991 36, 970 r 30, 042 276, 793 289, 657 r 299, 122
9, 738 5, 099 3, 146 64, 034 62, 554 61, 369
I. 667 10,977
50.9 8, 942
20, ll7 5,180
1.667 8. 971
40.3 6, 246
22,441 5, 564
l. 667 r 6, 616
30.4 '4,689 24, 3~4 6, 160
Production _______________ number of pieces .. 1,077,319 361,799 Shipments ____________________________ do .... 1,092,424 321,106 Stocks, end of month _________________ do ..•. 397,3.11 425.365
426, 292 482, 953 1 .555. 949 377,971 451,334 550,875 455,938 458,916 : 443, 222
7'22, 763 715, 715 431,774
677, 152 I 792, 220 i 938, 135 I 973,750 650, 883 ! 747, 459 : 908,603 964,479 428, 162 I 441, 989 434, 296 427, 509
726, 183 793, 5fi8 679, 623 7f>8, 77 4 442, 507 416, 742
I GLASS PRODUCTS
Glass containers: Production __________________ thous. or gross ..
Percent of capacity------------------------Shipments. ____ ----- ____ ----. _____ . ___ do •• __ Stocks, end of month .••.••• thous. of gross ..
Illuminating glassware: Orders:
4. 198 71.0
4, 461 7. 145
New and contract. ...... number of turns .. ________ . Unfilled. end of month ______________ do .... ________ .
Production. --------------------------do ••.... __ . ___ _ Shipments ____________________________ do ____________ _ Stocks, end ofmonth _________________ do .... ________ _
Plate glass, production •.••..•• thous. of sq. fL 20,743
GYPSUM (QUARTERLY)
3,339 I 58.4
3,434 8, 270
2, uo I 1, 904 1,866 1, 913 3, 887
16,057
i 3,604 ; 3,810 63.0 ' 69.3
3,604 3,996 8, 224 7,942
2, 381 2. 193 2, 109 : 2, 189 2,0.39 : ~: ~~ ~m 1 3,954
19,455 1 19, 192
I ,
3, 898 68.1
3, 999 7, 792
2, 355 2, 274 2,171 2, 2/iO 4, 009
16,244
3,844 67.2
4,179 7,488
2,356 2,474 2,138 1, 996 4,135
16,428
I I
4, 403 . 3,994 4, 250 a,88o I 4. 033 4,039 77. 0 ' 72.6 72.2 74.2 71.2 71.3
4,346 I 4, 345 4, 310 3,6ll 3,675 3, 881 7, 422 i 7, 015 ' 6,828 7,006 7, 291 7, 39:!
i I
2, 594 i 2,899 3,433 3,150 2, 926 I 3, 515 2,620 I 2, 783 3,057 3,102 2, 953 ' 3,518 2,154 2,591 3,106 3, 087 a, 3541 3,19:3
i:r~ 1 2,684 3,095 2,980 3,075 2,830 3,056 3,103 3, 236 3,421 3, 739
18, 710 ; 19,553 20,843 13,084 7, 371 ' 6, 373
11.941 113,593 413, 207
29,125 298,498
3,412 58,981
1. 61!7 5,837 29.6
5,163 r 25,0.19 '6, 788
652, 251 633,059 415, :)24
3, 880 73.8
3, 7(l7 7. 4-59
2, 473 2,894 2,849 2,688 3, 935
18, 676
Crude: Imports _________________________ short tons ..... _____ _ Production •• -------------------------do .... __ .. ____ _ Shipments._---- __ --------------------do ••........ _. _
7, 735 355,875 93,338
310,448
I : :::====~~:::=::::::
169, 477 733,729 227,330 545.758
I i i I : --------- ---------1· 251,6681--------- --------- 724283.· 310199 . -_-_ -_-_-_-_-_ -_-_11·--_ -_-_ -_-_-__ --_ --------- --------- 863,234 --------- ---------
::::::::: ::::::::=~ ~~~:~~~ r========= ========= ~~:~~~ ::::::::_:::::::::~ Calcined, production. ___________________ do .••• __ . _____ _ Calcined products, shipments:
Board, plaster, and lath ...•. thous. of sq. ft •• ________ _ Board, wall ___________________________ do .... _______ . _ Cement, Keene's _________________ short tons .... __ _
57,818 60,361
5, 768 --------- ---------!
116,259 96,097 9, 676
--------- ---------1147,818 ~--------- --------- 134,962 ---------1---------~=~==~~~~ ~::::::::. 8~:~i~ :::~=~:::1~======~~ s~;~~~ ::::~:~::1:~:~::::: ---------~---------:
Plasters, neat, wood fiber, sanded gauging finish, etc _____________________ short tons __________ _
For pottery, terra cotta, plate glass, mixing plants, etc _____________________ short tons .. ---------
Tile, partition ______________ thous. of sq. ft.. ________ _
205,353
38,834 2, 716
I : ! I I : 370,181 ---------~---------1421, 740 ~--------+--------1340,4631·-----·--:·--------
5~:~g51:::~=~~~:1::~~=~==:: 5~::~ '========+~~~===~ 4~:m ·===~===~:i::::::::: i i ' . , I ! .
I I ---------~---------! I . ---------!---------1 ---------! --------- i
TERRA COTTA
Orders, new: Qu3ntity ------------------------short tons.. 1, 060 Value _________________________ thous. of doL 127
TILE
1,050 146
1, 945 i 215 I
1,390 159
I I I I I
1, 706 I 975 II I, 507 ' 1, 120 I 982 I, 492 11 1, 3i2 i Bi m\ ~~ rni w m 1 rn,
, ' I ! . I 1
819 103
Hollow building tile: 1
Shipments._ --------------------short tons •• I-- __ ... _. Stocks, end of month .. ---------------do .... i ------- __
' I I ' I i I 48,330 I 68,536 1' 78,774 . 89,415 1 90,521 I 95, 106 , 89,264 I 92,643 71,919 62,418 I r 51,338 , 51,811 318.059 310,262 312, 141 : 311,830 ! 306,998 i 303,043 1 309,960 315,242 I 333, 108 . 344. 131 i' 354, 608 i 358, 088
TEXTILE PRODUCTS
CLOTHING I I I H?;~~;;ction ........... thous. of dozen pairs .. ,12,116 9, 832110,201 ~~ 9, 270 I
Shipments .... -----------------------do____ 12. 555 10,420 10, 176 9, 379 1
Stocks, end of month._ ---------------do.... 20. 229 19,464 19, 589( 19,581 1
9, 479 9, 983 8, S47 9, 322
20,314 r 21, 182
COTTON i Consumption _________________ thous. or bales__ i79 551 577 I 531 I 555 Exports (excluding linters) ______________ do____ 468 405 353 ! 352 I 298
607 I 1561
Imports (excluding linters) ______________ do.... 4-5 16 Prices:
41 20
i i
10. 111 1 to, s28 ll, 156 1 12, ll7
r 20, 344 : r 19, 263 !
574 I 1821
1,374 I 13
630 570
6,031 9
11, 566 10, 716 12, 235 10, 846
r 18, 801 r 18, 879
646 861
9,880 10
627 690
ll, 494 9
Ginnings (totalcroptoendorm~g;~s~n0~ib!~:~L 12,
130 10,420
______
1
_
3
________
20
___ ,
1
i _______ 12
__
1 Toproducer.c·--.---------------dol.perlb.. .135 .109 .112 .112 1 .ll4 1
.126 .122 .125 .122 .120 Whole_sale, m1ddh~g (New York) ..... do.... .145 .114 .ll7 , .117 1 .120 'I .132 .123 .123 .123 .122
Product1~n (cr?P estlmate) ••.• thous. of bales.. --------- ________ _1 _________ 1--------- --------- --------- --------- ---------Receipts mto Slght ______________________ do.... 716 496 437 I 381
1 310 201 808 2, 910 3 510 2 236
Stocks, end of month: 1 ' ' Domestic, totaJ. ______________________ do____ 7,ll7 7,907 7,179 6,329. 5,514 4,834 5,089 7,655 9,431 10,211 I
Mills _______________________________ do.... 2,080 1,337 1,190 1,090 i 989 897 752 849 1,403 1, 792 Warehouses _________________________ do.... 5, 037 6, 570 1 5, 990 5 239 ' 4, 524 3, 938 4, 337 6, 806 8, 028 8, 418
World visible supply, totaL .......... do.... 5, 787 46 ••
989225 I 6, 540 5' 0251 5, 423 4, 899 4, 748 6, 378 7, 679 8, 151
American cotton ____________________ do.... 4, 348 4, 574 4:121 3, 579 . 3, 091 2, 986 4, 578 . 5, 845 6, 271
• Revised .
11, 2SO 11,054
r 19,312
693 594
11,705 16
.123
.128 12,407 '1,189
9, 790 2, 001 7, 788
~;~g~ I
11, 364 9, 845
20,830
678 538
11,957 15
.124
. 130
8,846 2,066 G. 779 7, 812 ·'· 525
11,311 II, 474 20,1167
664 463
23
. 124
.131
'642
8,022 2,056 r,, non 7. 457 4. 984
. • New series. Data on face brick shipmepts and stocks, compiled by the U.S Department of Commerce, Bureau of the Census, supersede those shown in the Survey pnor to the January 1937 1ssue, Data for penod January 1934-0ctober 1935 will appear in a subsequent issue.

54 SURVEY OF CURRENT BUSINESS
Monthly statistics through December 1935, to· 1937 1936 gether with explanatory notes and references
March I I I I
to the source of the data may be found in the ~I arch April May June July I August I Septem-~ October I Novem-1 Decem-1936 Supplement to the Survey ber ber her
TEXTILE PRODUCTS-Continued
COTTON MANUFACTURES
Cotton cloth: Exports .•.••••..•.•.•...... thous. of SQ. yd.. 20,339 lmports ...••.....•.••••.••.•....•••.•. do.... 22,257 Prices, wholesale:
Print cloth, 64 x 60 .•...••••.. dol. per yd .. Sheeting, brown, 4 x 4 ......••.•••... do ....
. 079
. 089 Cotton cloth finishing:
Production: Bleached, plain ______________ thous. of yd __ Dyed, colors.---------.----- ______ •. do ___ _ Dyed, black .• ----------------------do ___ _ Printed _____________________________ do .•..
121,981 97, 171
4, 405 89. 279
Stocks, end of month: Bleached and dyed __________________ do.... 1S7, 958
Printed ..... ------------------------do.... 77,480 Spindle activity:
Active spindles ...... ----- _______ thousands._ Active spindle hrs., totaL ______ mills. of hrs __
Average per spindle in place ________ hours __ Operations _________________ per. of capacitY--[
Cotton yarn: 1 Prices, wholesale: 1
22/1, cones (Boston) __________ dol. per lb .. I 40 /I, southern spinning _____________ do .... l
Rayon:
24, n::;n V,ti9S
35U 14~. 3
. 364
. 482
RAYON AND SILK II
Deliveries, index: U nadjusted __________________ l923-25= 100.. ~~~ A djusted ____________________________ do ____ , 1
3-mo. moving average _____________ do ____ , ________ _ Imports ________________________ thous. of lb __
1
, 2, 457 Price, wholesale, 150 denier, 41 A" grade
(N. Y .) _. _____________________ doL per lb.. . 60 Stocks, producers, end of mo.
no. of months' supp]y __ '---------S!lk:
Deliveries (consumption) _____________ hales.. 39,934 Imports, raw ___________________ thous. of lb__ 5, 026 Price, wholesale, raw, Japanese, 13-15 (N.Y.)
doL per lb.. 2. 012 Stocks, end of month:
Total visible supplyt _______________ bales.. 146,331 United States (warehouses) _______ do.... 41,731
WOOL
Consumption of scoured wool: 1 Apparel class ___________________ thous. o! lb •• Carpet class ___________________________ do ....
Imports, unmanufactured. _____________ .do ___ _ Operations, machinery activity:
Combs percent or active hours to total reported __
Looms: Carpet and rug ______________________ do ___ _
Narrow -----------------------------do ___ _ Broad _______________________________ do ___ _
Spinning spindles: Woolen __ ---------------------------do ___ _ Worsted. __ -------------------------do ___ _
Prices, wholesale: Raw, territory, fine, scoured .••• dol. per lb .. Raw, Ohio and Penn., tleeces. ________ do ___ _ Suiting, unfinished worsted, 13 oz. (at
factory) ..• ___________________ doL per yd __ Women's dress goods, French serge, 54" (at mill) _________________________ doL per yd __ Worsted yarn, 32's, crossbred stock (Boston)
doL per lb .. Receipts at Boston, totaL ________ thous. oflb __
Domestic_ • ---------------------------do ___ _ Foreign_------------------------------do .•• _
Stocks, scoured basis, end of quarter, total thous. of lb ..
Woolen, totaL. -----------------------do ___ _ Domest!c. ___________________________ do ___ _ Foreign _____________________________ do ___ _
Worsted, totaL •• ---------------------do ___ _ Domest!c •••. ------------------------do ___ _ Fore!gn _____________________________ do ___ _
MISCELLANEOUS PRODUCTS
Buttons, fresh-water pearl: Production _________________ pet. of capacity __ Stocks, end of month •.••••.. thous. of gross __
Fur, sales by dealers. ___________ thous. of doL. Pyroxylin-coated textiles (artificial leather):
Orders, unfilled, end of mo.thous.linear yd •. Pyroxylin spread _______________ thous. of lb .. Shipments, billed __________ thous. linear yd ..
26,328 12, 511 48,528
124
74 58 97
104 87
I. 05 .45
2. 030
1.188
1.46 34,730
7, 745 26,985
120,200 46,065 31,536 14,529 74,135 26,933 47,202
64.1 6, 465
"4, 772
5,107 7,803 7,412
• Preliminary. • Revised.
21, 745 12,316
. 055
.070
107,893 101, 739
4,140 95,274
183,292 99,684
23, 182 7, 254
251 107.\l
. 27~
. 435
422 399 423 346 i
. 57
1.1
36,000 3,480
I. 733
167, 689 53,689
20,209 7,424
25,298
88
50 38 80
.93
.42
1. 742
1.114
1. 33 22,258 4, 845
17,413
105,096 44,667 32,003 12,664 60,429 28,470 31,959
53.4 7, 989 4,045
2, 475 5,121 4,689
19, 685 9,836
.053
. 067
104,837 !OS, 305
4, 087 91,074
187. 333 93,275
18,840 8, 680
. 051
.065
105, 062 98,345
4, 364 89,518
191,956 103, 419
23, 119 22, 833 7, 313 i 6, 896
255 242 110. 7 105.2
. 274
.426
!
433 I 416 420 551
. 57
uj 34,564
4, 647
1.682
161,498 46,098
20,554 8, 792
23,883
74
50 36 76
82 60
.88
. 37
I. 782
1.114
1.30 20, 495 6,071
14,424
51.9 8,003 4,053
2, 459 5,647 5,118
. 271
.426
428 i :~~ I 683
.57
1.2
32,087 4,066
I. 600
150,266 40,066
17,297 6, 945
17, 207
72
48 34 76
87 57
.87
. 37
1. 782
1.114
1. 28 25,599 21,761 3, 838
51.2 8, 046 3,857
2, 273 5,423 5, 013
16,843 18, 527 24, 412 14, 624 4, 705 5, 802
. 054 . 059 . 059
.066 .072 .075
104, 630 90,398
4, 675
101, 904 I 104, 667 91, 620 100, Oil!
6, 357 7, 690 90,338 91, 273 91, 157
188, 124 !35, 548 !54, 264 105, 782 94, 557 88, 815
23, 021 I 23. 252 7, 320 7, 855
259 279 IlL 0 119.8
. 271 . 295 • 413 . 426
498 614 623 808 626 672 699 1, 242
. 58 . 60
1.0 0. 7
31, 437 36,658 4, 143 4, 753
I. 597 1. 714
135, 609 145, 439 35, 409 30, 139
20,075 7,191
17, 541
93
48 36 74
87 57
.00
.38
I. 782
I. 114
1.30 54,421 50,424
3, IXI7
147,057 48,747 38,024 10, 723 98,310 72,874 25,436
50.5 8,061 3, 133
2,000 4,930 4, 608
24,785 9,058
16,079
93
47 36 69
90 69
. 89
.39
1. 745
1.114
1.29 66,708 64,300 2,408
42.6 7,690 3,433
2,460 4,686 4,501
23,434 7, 573
270 115.8
. 301
.430
633 586 594
2,441
.60
0. 4
42,016 6, 315
I. 791
!56, 125 29,825
23,030 8, 539
17, 546
106
M 43 73
97 68
.89
.38
1. 634
1.114
1.28 21,694 20,101 1, 592
55.2 7, 660 3, 575
2,612 5, 375 4, 972
t Revised series. For data for period July 193Q-December 1936 see table 11, p. 20 of the February 1937 issue. , Data for April, July, and October 1936, and January 1937 are for 5 weeks; other months, 4 weeks.
14,387 7,098
.060
.075
107,706 100,042
6,420 86,514
171, 340 86,798
23,514 8,088
289 125.8
.303
.444
537 387 483
2,072
. 60
0.3
45, 709 6, 900
1.698
155, 253 29,553
21, 477 9, 207
19, 639
95
61 41 66
88 65
.89
.38
1.634
1.074
1.26 16, 156 13, !53 3,004
126, 846 44,574 35, 350 9, 224
82,272 65, 161 17, Ill
56.0 7,550 2,808
2,668 6, 087 5, 232
15, 359 8, 034
. 068
. 077
121,419 105,698
5, 831
88.890 I 166, 771 80,329
23,638 8, 328
298 123. 3
.304
. 448
504 475 494
1, 113
.60
0. 3
43,093 6, 953
l, 756
157, 500 30,300
25,861 11,880 23, 550
97
66 46 72
90 74
.90
.39
1. 652
1.064
1. 25 15,478 12,060 3,418
61.0 7,461 2, 297
2, 410 6,081 5,408
12, 843 9, 648
. 077
.080
105, 188 88, 383
4, 767 83, 760
172, 559 79, 152
23,806 7, 297
288 129.9
. 311
. 452
538 611 583
1, 513
. 60
0.2
40,401 7, 214
1.935
165, 713 40,713
23,927 9, 937
25,548
109
64 42 82
96 83
.98
.43
1. 782
1.101
1.34 20,280 15,515 4, 766
62.2 7,395 2,850
2,684 5, 321 5,094
13, 750 15, 123
.080
.086
123,125 101, 3111
5, 670 gJ,839
183, 108 sa, 691
24.090 8, 679
313 134.5
. 341
. 483
562 662 607
1, 540
. 60
0.1
41,627 7, 275
1.968
180, 114 44,414
27,851 11,355 29,037
123
67 52 94
110 92
1. 06 .49
I. 955
1.139
1.47 18,911 6,139
12,772
'129. 204 T 45,753 '35, 223 '10,540 '83, 441 '44, 484 '38, 957
66.3 7, 349 3, 941
3, 633 5,648 5,495
May 1937
1937
January I
14, 502 1.'5, 591
. 081
. 086
Febru-ary
15,892 19,278
. 076
. 086
115, 127 ' 109, 939 98, 409 ' 1'8, 127
5, 117 ' 4, 322 93, Qg2 ' 1'>2, 762
179, 435 79, 109
24, 360 8, 5b7
3l5 137. 7
. 347
. 513
.s:n: 548 ' 564 I
1, 494
. 60 i i
0.1
44, 198 7, 413
2. 051
160, 944 50, 544
28,814 12,802 46,890
116
64 56 97
105 88
1.11 . 52
1. 955
l.151
1.49 28,602 5, 126
23,476
58.4 6, 725 3, 983
4,110 5, 965 5, 618
180, 796 7~. 715
24, f,S6 8, 353
308 144.8
.3H
. -182
~4U 482 ,\05
2, 095
60
0.
38,484 6, 472
I. 99
152,808 49,408
25, 722 12,814 46, 292
12
72 59
100
111 89
I. 07 . 50
2. 005
1.188
l. 50 38.618 2, 407
36,212
64.7 6, 612
'4,444
4, 731 6, 498 5,806

May 1937 SURVEY OF CURRENT BUSINESS 55 I
1936 1937 Monthly statistics through December 1935, to-,1937 gether with explanatory notes and references 1o the source of the data may be found in M h the 1936 Supplement to the Survey arc March I April I May I June I July I August I Se~~~m-1 October I Nb~~m-1 D'J;::n- Janusry I F:~~u-
TRANSPORTATION EQUIPMENT
AIRPLANES I I I roduction, total t ___________________ number__ I _________ 209 233 308 394 263 366 212 247 207 267 1---Commercial (licensed) t---------------do ____ --------- 99 106 201 240 136 260 124 120 99 107 -----Military (deliveries) t _________________ do ____ --------- 86 95 72 73 59 45 68 96 i6 93 ---For export t _--------------------------do ____ --------- 24 32 35 81 68 61 20 31 32 6.1
p
AUTOMOBILES E xports:
Canada: Assembled, totaL _______________ number __ 7,078 7, 603 3, 726 5, 222 4, 424 4, 545 3, 414 3, 514 2,886 5, 132 3, 904 5, 250 4,424 Passenger cars ______________ ------ __ do ____ 5,040 1, 607 3,108 3, 945 3,438 3, 367
United States: 2, 335 2,153 1,822 4, 715 2, 772 3, 330 2, 339
Assembled, totaL ___________________ do ____ 33. 762 28,920 26,053 28,575 24, 042 22,525 15, 728 10, 939 16,720 27,428 35, 289 32,691 27, 528 Passenger cars ____________________ do ____ 22, 63:l 18,921 17, 723 17,727 14,987 12, 714 8, 323 4, 564 9,894 20,032 2·1, iSS 20,099 17,014 Trucks ____________________________ do ____ 11, 129 9, 999 8,330 10,848 9, 055 9, 811
Financing: 7, 405 6, 375 6,826 7, 396 10, 501 12,592 10,514
Retail purchasers, totaL ______ thous. of doL_ 163,891 143, 515 172,982 176, 316 186, 550 168,685 140,436 122,158 100, 696 107,837 141,036 10~. 021 98, 437 N e\v cars ___________________________ do ____ 102, 499 91,664 116, 297 116,569 125,916 112, 795 91,206 76,563 58,486 70, 572 94, 075 61,437 55, 421 Used cars ___________________________ do ____ 60,665 48,044 55,705 58,695 59, 606 54,980 48,368 44,768 41,580 36,598 46, 055 40,045 42, 528 Unclassified _________________________ do ____ 727 807 980 1, 051 1, 028 910 861 828 630 667 906 .o:m 41'8 Wholesale (mfrs. to dealers) ___________ do ____ 193, 721 154, 147 189,481 180, 665 174, 277 162,404 127,032 55,341 72,086 129,829 180, 422 154, 2ti0 123, !18
Fire~extinguishin~ equipment, shipments: Motor-vehicle apparatus __________ number __ 85 52 53 48 56 67 69 59 64 60 71 50 58 Hand-type ____________________________ do ____ 41, 8G9 30,639 32,430 32, 496 35, 110 38,560 36,573 31, 105 34,309 31,440 35, 106 39,001 30, C54
Production: I Automobiles: Canarta, totaL ______________________ do ____ 24, 701 18,021 24,951 20,006 16,100 I 10,475 4,660 4, 655 5, 361 10, s12 I 20, 411 19, 583 19, i07
Passenger cars ____________________ do ____ 19, 313 14,488 20, 247 16, 389 13, 126 8,192 3, 051 2, 481 4, 592 10,086 16,542 1.1, 009 14,415 Unitert States, totaL _______________ do ____ 494,014 420,971 502, 775 460,565 452, 9.o5 440,999 271,291 135, 130 224,628 394,890 498, 721 379, 843 r 3()3, g;)3
Passenger cars ____________________ do ____ 403, 773 343, 523 417,133 385,507 375, 894 372, 402 209, 754 90,597 190,688 341, 456 426,019 309,594 r 29(), 58;) Trucks ___________________________ do ____ 90,241 77, 448 85,642 75,058 77, 061 68, 597 61,537 44,533 33,940 53, 434 72,702 70, 249 r 07, 250 Automobile rims ____________ thous. of rims __ --------- 1, 841 2, 258 2, 9.o9 1,876 1, 716 935 1,104 1, 847 2,173 1, 942 2, 12-J 2, 022
Registrations: New passenger cars ________________ number __ P366, 867 301, 239 397, 190 392, 750 369,423 357,490 262,912 208,896 171,319 223,.560 I '127, 303 280, 615 r 214,973 New commercial cars _________________ do ____ P58, 000 52,430 64,957 62, 183 56.851 63,695 59, 222 54, 61J 41,207 30, 222 ·12, 205 47, (\Q() '41, 815
ales (General Motors Corporation): I To consumers in U. s ________________ do ____ 196,095 181,782 200, 117 194,628 189,756 163, 459 133,804 85,201 44,274 155, 552 1 1n. 472 92, 9!18 51,600 To dealers, totaL _____________________ do ____ 2GO, 9G5 196,721 229, 467 222, 603 217,931 204, 693 121,943 19, 288 90, 764 191, 720 239, 114 lO:l, 6118 74,567 To U.S. dealers ______________________ dO---- 216,606 162,418 194,695 187,119 186, 146 177,436 99,775 4,669 69,334 156, 041 197,065 70,901 49,674
Accessories and parts:
s
Shipments, combined index__Jan.l925=J00 __ 1.17 149 162 150 157 136 110 114 138 150 164 154 152 Accessories for original equ!p ________ do ____ 174 160 181 163 166 145 108 108 144 167 198 178 166 Accessories to wholesalers ___________ do ____ 96 120 130 110 112 88 75 98 99 96 83 93 124 Replacement parts _________________ do ____ 134 109 125 130 151 148 147 153 158 139 113 116 131 Service equipment_ ___ --------------do ____ 139 Q7 104 113 115 109 106 105 109 103 91 99 106
RAILWAY EQUIPMENT I (Associalion of American Railroads)
F reight cars owned & on order, end of mo.: Owned:
Capacity ______________________ mills. of lb __ 169,671 172, 620 172,460 172,341 172, 156 172, 033 171,934 171,700 171,710 171,586 170,410 170, 109 '169, 887 Number _______________ --------thousands __ 1, 733 1, 780 1, 778 1, 776 1, 772 1, 769 1, 767 1, 763 1, 762 1, 759 1, 745 1, 741 1, 738
In bad order ___________________ number__ 187,227 249,296 253, 125 260,013 254,447 258, 198 256,903 241, 573 226,095 217, 243 205, 146 205,500 201,960 Percent in bad order __________________ 11.0 14.2 14. 5 14.9 14.6 14.8 14.7 13.9 13.0 12.5 11.9 11.9 11.7 Orders, unfilled ________________________ cars __ 44, 708 13, 478 15, 683 22,964 25,311 24, 373 20,530 18, 434 13,291 16, 579 23,421 33,608 39,729
Equipment manufacturers __________ do ____ 34,314 5,471 7, 035 14, 646 15,907 15,092 12,924 11,787 7, 251 10, 974 17,755 27,414 31,214 In railroad shops ____________________ do ____ 10, 394 8,007 8,648 8, 318 9,404 9, 281 7, 606 6,647 6,040 5,605 5, 666 6, 194 8, 515 ocomotives owned and on order, end of mo.: Owned:
L
Tractive etfort ________________ mills. of lb __ 2, 161 2,194 2,193 2,189 2,186 2,185 2,182 2,179 2,176 2,173 2,167 2,166 2,164 Number ____________________________________ 43,788 45,009 44,966 44,835 44, 743 44,682 44,564 44,451 44,314 44,208 44,035 43,981 '43, 875 Awaiting classified repairs _____ number __ 7,083 9, 642 9, 610 9, 389 9, 119 8, 906 8, 736 8,369 7, 929 7, 782 7, 350 7, 228 7,142
Percent of totaL---------------------- 16. 2 21.4 21.4 21.0 20.4 19.9 19.6 18.8 17.9 17.6 16.7 16.5 16.3 Installed ____ -------------- ________ number __ 39 53 60 65 91 60 53 106 57 1~~ I 57 95 30 Retired _______________________________ do ____ 126 132 103 196 184 124 171 215 223 250 119 132 Orders, unfilled _______________________ do ____ 359 52 52 58 67 65 43 50 67 111 297 362 375
Equipment manufacturers __________ do ____ 3:!4 40 40 49 59 57 35 44 64 102 279 339 3.52 In railroad shops ____________________ do ____ 25 12 12 9 8 8 8 6 3 9 18 23 23 Passenger cars:
Owned by railroads ___________________ do ____ --------- 40, 199 --------- --------- 39,912 --------- --------- 39, 705 --------- --------- 39,602 --------- ----- ---Unfilled orders ____ ------------ ________ do ____ --------- 65 --------- --------- 139 --------- --------- 183 --------- --------- 177 --------- ---------
(V. S. Bureau of the Census) I
ocomotives: Orders, unfilled, end of mo., totaL ___ _do ____ 417 95 101 106 114 115 106 113
1251 330 368 387 416 Domestic ___________________________ do- ___ 415 90 95 100 111 112 101 102 117 321 364 384 412 Electric ___________________________ do ____ 33 33 33 33 35 37 35 39 36 34 31 30 31 Steam _____________________________ do ____ 382 57 62 67 76 75 66 63 81 I 287 333 354 381 Shipments, domestic, totaL ___________ do ____ 28 0 4 5 11 12 18 13 7 9 21 16 9 E Iectric _____________________________ do ____ 5 0 3 0 2 3 2 2 4 3 3 3 0 Steam _______________________________ d
0 ____ 23 0 1 5 9 9 16 11 3 6 18 13 9
Industrial electric (quarterly): Shipments, totaL_----_----- ________ do. ___ 92 58 --------- --------- 104 --------- --------- 79 ---------
__ .., ______ 109 --------- ---------
Mining use ___ --- -----------------dO---- 80 58 --------- --------- 103 --------- --------- 79 --------- --------- 104 --------- ---------
L
(A merlcan Rallwav Car ln&tilult)
s hipments: Freight cars, totaL ___________________ do ____ 5, 541 189 2,168 2, 514 2,172 1, 930 3, 854 4, 964 8,205 3, 799 3, 513 2,846 2, 644
Domestic ___ ------------------------dO---- 5, 520 186 2,066 2,299 2,056 1,924 3, 804 4, 963 5,205 3, 799 3,483 2, 766 2, 615 Passenger cars, totaL _________________ do ____ 3 4 5 5 12 0 2 1 40 16 12 2 28 Domestic ____________ ------- _________ do ____ 3 4 5 5 12 0 2 1 40 16 12 2 28
N ew orders: (RaUwav Age)
Freight cars ___________ ---------- ______ do ____ 6, 200 627 3,650 9,677 4,320 4,469 3,225 3,100 1,310 1,550 17,230 10,881 10,532 Locomotives __________________________ do ____ 29 13 ~I 10 24 9 3 24 22 174 88 46 33 Passenger cars __ ----------------------dO---- 162 0 0 20 34 0 0 5 50 34 70 154
• Preliminary. • Revised. t Revised series. For 1936 revisions see p. 55 of the March 1937 issue.

56
Monthly statistics through December 1935, together with explanatory notes and references to the source of the data may be found in the 1936 Supplement to the Survey
SURVEY OF CURRENT BUSINESS May 1937
1937l 1936 I 19~ March March I Apnl I May I June I July I August I Septem-1 October I Novem-1 Decem- Janu1ry j' Febru-1 ber ber ber , ' >try
TRANSPORTATION EQUIPMENT-Continued
RAILWAY EQUIP~IENT-Continued
41
I J {U.S. Bureau of Foreign and Dome8tic Commerce) I Exports of locomotives, totaL ••..•.. number .. I 3 oj 8 3 7 3 3
Electric .••...•.•.•........••.••.•..•.. do .... I)
~I 0 0 gl 0 2 0 1 I 0
Steam .....••• _. __ ••• __ ._. _____ .• _._ •.. do_ ... 2 I 3 8 I 2 6 2 3 INDUSTRIAL ELECTRIC TRUCKS
I AND TRACTORS I Shipments, totaL ••.•••••.•.......•.. numher __ ill 89 ' 112 91 881 113 12.5 112 124
1111 1291 152 142 Domestic _______________ ••• ____ ---- ___ .do. ___ J;lS ss I 99 86 84 110 115 101 113 103 122 U6 126
Export•-------------------------------do ____ 31 13 4: 3 10 11 11 8 7 6 16 SHIPBUII,DIN G i
United States: I
I i Vessels under construction, all types
1541 thous. gross tons .. :~2::: ·:i I 154 !54 213 221 210 201 223 248 237 281 Steam and motor •.•..••••...•••••.. do ____ :?2f. 86 91 94 1 132 169 159 151 153 180 163 190 U nrigged _________ • ____ ----- __ ---_._.do._ .. \)~ 59 68 63 60 I 81 52 51 50 70 68 73 91
Vessels launched, all types .•.•.•. 1rross tons .• 7,001 10,543 26,929 25. 507 5, 161 I 3, 911 9, 999 23,282 24,007 12,298 24,048 21,600 4, 560 Powered: i
Steam .•.••. __ -------- _____ ---- ___ .do. ___ 0 0 7, 300 8.850 oi 0 0 9.aoo 7, 451 9,874 16,614 17,571 0 Motor------· ___ •••••••••• _------_ .do .. __ I) I, 699 905 576 125 475 1,441 0 810 250 297 0 0
Unrigged .........•.•••••.•••.•.•.•.. do .... 7,001 8, 844 18,724 16, 081 5, 036 3,436 8, 5!\8 13,982 15,746 2,174 7,137 4,029 4, 560 SteeL .. _ .. _ ... ___ ---·-- __ ._ ..... _._ .do .. __ 6. 891 10,543 26,929 25,161 5, 036 3, 436 9, 758 23, 282 24,007 12,098 24,048 21,600 4, 560
Vessels officially numhered, all types gross tons .. 186,673 20,898 21,321 24,442 22,040 15,949 14, liS 5, 953 44,091 31,871 44,737 36,591 66, 628
SteeL ..•.••...•• --------------- ..... do .... 24, 765 13,386 8, 024 15,442 12,8851 11, 407 3, 992 2, 857 33,423 22,607 14, 879 20,791 17, 557 World (quarterly):
Launched: 230
1
...•••••• -·--·----Number------·-----· ••••. _ .•..•••• _ships __ --------- 148 --------- --------- 467~--------T·------258 ---------
---------1 253
Tonnage ________________ thom. gross tons .. 394 --------- --------- 516 --------- 684 Under construction:
Number .... ·----_ •...• __ ..........• ships .. --------- 537 --------- --------- 581 618 --------- ---------Tonnage ..•...•.•...••.. thous. gross tons .. 1, 820 1--------- I,~ ,:::::::::1::::::::: 2,111 2, 251 --------- ---------'
CANADIAN STATISTICS
I I I hysical volume of business: t Comhined index .................. 1926=100 .. 118. 7 104.0 111.0 107.6 111.1 110.8 113.5 120.0 121.5 118.0 118.4 116.9 115.0
p
Industrial production: Combined index .•...•.....•..•••. do .•.. 122.4 105.2 113.1 108.5 113.0 112.0 115.8 123.9 125.5 121.7 121. 1 119.4 117. 7
Construction ...• ___ .••....•..•• .do .... 83.0 52.4 39.3 39.5 48.2 43.7 37.9 44.5 44.0 42.7 40.8 37.7 45.5 Electric power •••••.••••••..••.. do .... 237.7 210.4 223.0 210.3 215.8 215.8 212.4 211.0 225.7 215.6 219.3 223.5 225.3 Manufacturing .................. do .... 115.4 102.2 110.7 106.4 Ill. 3 109.5 114.8 126.5 129.0 125. 5 123. 1 122.8 116.4 Forestry ------------------------do •... 138.0 116.0 125.6 116.3 124. 1 124.2 121.9 128.2 132.4 133.0 150.4 149.9 138.1 Mining .•.• ----·-·--------------do .... 161.1 142.9 174.1 165. 5 160.6 169.0 180.8 171.7 163.0 157.2 168.5 156.8 170.1
Distribution: Combined index •.•.. -------------do .... 107.9 100.5 104.8 104.9 105.6 107.3 106.9 108.5 109.9 107.4 110.6 109.8 107.2
Carloading __________ ... _ .•.. _ ... do ...• 80.6 72.2 74.6 71.8 73.6 79.3 79.5 81.6 78.0 74.4 85.0 79.4 77.7 Exports (volume) ........•••.... do ____ 89.0 87.8 109.8 106.5 104.3 107.9 117. 5 108.7 115.8 106.1 107.6 107.4 97.9 Imports (volume) ....•...•.....• do .... 85.0 74.5 87.6 82.9 83.7 85.7 79.0 85.3 96.6 95.7 93.5 93.3 84.4 Trade employment. ....••.••••• do .... 131.3 124.2 125. I 128.5 127.8 128.0 127.2 129.1 130.2 129.0 129.5 131.2 130.5
Agricultural marketings: Combined index ..............••.. do .... 37.3 77. 1 81.1 149. 5 45. 1 77. 5 117.6 116.6 90.3 72.7 51.0 42.0 31. 4
Grain. ____ . __ •.•.• _ ..... __ ..••.. do. ___ n.> 73.5 77.9 163. 5 32.4 74.8 124.5 120. I 89.9 67.9 40.1 29.6 17.9 Livestock •.. __ •• _ •••..•. ___ ..... do .. __ 94.7 9a. o 95.0 86.7 101.8 89.2 86.9 100.9 92.2 94.0 99.6 97.2 91.7
ommodity prices: Cost of living.-----· __ ----------------do .... 82.0 80.4 79.6 80.0 80.0 80.4 81.0 81.1 81. I 81.4 81.7 81.6 r81. 7
c Wholesale prices ...........••••..•.•.. do .... 85.5 72.4 72.2 71.8 72.3 74.4 76.2 76.4 77.1 77.2 79.7 ~I.:) 82.9 mployment (first of month): Combined index ................•.•... do .... 102.8 98.9 97.4 99.5 102.0 104.6 105.6 107.1 110.1 111.0 110.1 l03. 8 104.1
E
Construction and maiutenance _____ do ____ 52.8 78.2 71.8 79.4 87.0 97.4 102.9 109.0 103.9 99.6 80.1 61.2 57.2 Manufacturing ______ .. ___ •.. _ •...... do_ .. _ 107. 6 \!9. 5 101. 1 102.7 103.4 104.7 104.9 105.9 109.0 107.7 107.0 102. 4 1M.3 Mining. ____ ------- ..... __ --------- .do ____ 145.8 129.1 128.2 127.4 132.1 134.1 137.9 140.2 147.9 151. R 150.3 14.5. 6 147.6 Service _____________ -------- __ ....... do .... 118.9 117.5 118. 5 120.4 123.0 131.7 135.8 137.5 127.4 124.9 122.4 124.8 119. I Trade ... ________ . ____ ._ •........ __ .. do .... 126.1 123. 1 121.0 123.3 127. 1 127.3 126.3 126.3 129.6 132.0 136.0 136.9 128.4
F Transportation. ____ ---------- ____ .. do ____ 79.6 78.9 78. 51 82.8 85.4 87. 1 88.7 89.4 88.3 87.1 86.5 .~1. 4 80.7
inance: Banking:
Bank debits _________________ mills. of doL 3,190 2, 599 2, 774 2, 979 3, 136 2, 894 2,619 3,134 3,328 3, 303 3, 405 3, 227 2, 732 Interest rates ..• ________ ........ 1926= 100 __ --------- 77.3 78.5 76.6 73. 3 72.0 71.2 69.9 72.2 71.8 69.7 70.4 ---------Commercial failures .•. ____________ nnmher __ --------- 103 100 91 100 104 87 88 94 94 --------- --------- ---------
Life insurance, new paid for ordinary thous. of doL_ --------- 31,664 ao, 147 28,977 32,277
Security issues and prices: 32,573 25,011 26,966 30,092 37,813 36,904 28, 76-! ---------
New bond issues, totaL .........••.. do .... 81,3.>5 123,332 103, 186 47,826 190,179 70,692 26,791 177.870 124,665 51,018 94,279 207,282 100,539 Bond yields ______________________ percent._ 3. 76 3. 70 3. 76 3. 67 3. 51 3. 45 3. 41 3. 35 3. 46 3.44 3. 34 3. 37 3. 56 Common stock prices ........... l926=100 .. 117.4 115.9 112.8 113.8 114.3 114.7 119.5 126.9 131.8 129.2 137.4 ---------
oreign trade: F Exports, totaL •.•.•....•...... thous. of doL 89,359 74,582 57,964 84,515 79,942 84,968 93,530 89,582 113,003 122,866 99,407 >l;l,416 75, 691 Imports ... _._ ..... __ .. ____ ._ ... __ .. _ .. do._ .. 70,974 52,681 42,217 59,121 57,598 53.821 50,258 .52, 983 65,159 66, 169 52,996 51,883 48,681 Exports:
Wheat_ ______________________ thous. of hu~- --------- 13, 146 6, 752 27,317 25, 764 25,913 21,157 20,720 26,917 33,309 20, 428 9, 789 -- ------Wheat flour _________________ thous. ofhbL --------- 477 281 449 430 445 388 378 464 409 475 :)14 -- ----ail ways: R Carloading __ . ___ .... _ .. _____ . thous. of cars._ 214 192 193 190 201 203 222 251 263 220 206 192 186 Financial results:
Operating revenues .. _______ thous. of doL. --------- 25, 535 26,050 27,022 26,049 27,301 28, 637 33,103 33,840 29,034 30,108 25,140 -------Operating expenses ..... _ .... ------- .do .•. _ ----- - ~ - 22.465 22,320 23,789 24,049 25,335 26,026 25,574 24,700 22, 160 22,579 22,890 ---------Operating income ......... _-------- .do ... _ ----- -- 1, 914 2, 586 1, 953 832 890 1,615 6, 609 8,255 5,884 6,385 1,146 ---------
Operating results: Freight carried I mile ....... mills. of tons .. -- --- 2,056 2,081 1, 990 1, 775 1, 941 2, 364 3, 055 2, 721 2,376 2, 161 2,053 ---- ----Passengers carried 1 mile ... mills. of pass .. __ ------ 126 125 128 148 195 183 165 127 107 169 131 --- -- --
Pr oduction: Electrical energy, central stations:
2,1651 mills. of kw.-hr __ 2, 412 2,136 2, 083 2,029 2, 021 2,020 2,042 2, 381 2, 262 2,325 2.:319 2,148
Pig iron ................. thous. oflong tons __ --------- 54 54 59 56 35 39 52 10 I 74 68 66 62 Steel ingots and castings •.•........... do. ___ 101 107 95 82 69 80 86 98 99 104 11.> 116 Wheat flour. __________________ thous. of bhL 1. 099 1. 172
I 1, 009 1,196 I, 149 1, 301 l, 363 I, 516 1, 701 I 1, 459 1, 090 I, 009 1,000
t Revised series; for 1936 revisions seep. 56 of the March 1937 issue. r Revised. U.S. GOVERNY.E:-tT ?R<NT::-t•; OFr'iC£ 1937

INDEX TO MONTHLY BUSINESS STATISTICS
Abrasive paper and cloth _________________ _ Acceptances ____________________________ _ Accessories-automobile _________________ _ Advertising _____________________________ _ Africa, United States trade with __________ _ Agricultural products, cash income received
Page 52
31,32 55
25,26 37
from marketings of_____________________ 23 Agricultural wages, loans _________________ 31, 32 Air-conditioning equipment_______________ 49 Air maiL_______________________________ 26 Airplanes _______________________________ 38,55 Alcohol, denatured, ethyl, methanoL_______ 39 Aluminum _____ ----------------_________ 50 Animal fats, greases______________________ 39 Anthracite industry ___________________ 22, 29,45 Apparel, wearing __________________ 23, 28, 30,53 Argentina, United States trade with; exa
change; flaxseed stock _______________ 33,37,40 Asia, United States trade with_____________ 37 Asphalt_ ___________ ------ __________ ----- 46 Auton1obi1es ___________________ 22
1 26, 28, 30, 55
Babbitt metaL__________________________ 50 Barley__________________________________ 42 Bathroom accessories_____________________ 53 Beef and veaL___________________________ 43 Beverages, fermented malt liquors and dis-
tilled spirits___________________________ 41 Bituminous coaL ______ ------ ____ ----- 22 1 29,45 Boilers and boiler fittings_________________ 49 Bonds, prices, sales, value, yields __________ 35,36 Book, publication________________________ 52 Boxes, paper, shipping____________________ 52 Brass _____ ----__________________________ 51 Brazil, coffee; exchange; United States trade
with ___________________________ ---- 33, 37, 44 Brick _______________________________ ---- 53 Brokers' loans __________________ ------___ 32 Bronze ______ --------- __________ -------- 51 Building contracts awarded_______________ 24 Building costs _____ ----- ____________ ----- 25 Building materials _______________________ 24,47 Business activity index (Annalist)__________ 22 Business failures ____ -----_----- __________ 32,33 Butter__________________________________ 41 Canadian statistics ______________________ - 56 Candy__________________________________ 44 Canal traffic_____________________________ 38 Capital issues____________________________ 35 Carloadings _____________________________ 22,38 Cattle and calves ___________________ ----- 43 Cellulose plastic products ________________ - 40 Cement_ __________________________ 22, 28, 30, 53 Chain-store sales _________________________ 26,27 Cheese ________________ --------_________ 41 Chile, excharlge, United States trade with__ 33, 3 7 Cigars and cigarettes_____________________ 44 Civil-service employees___________________ 29 Clay products ________________________ 28, 30,53 Clothing ____ -------- ___________ 23, 24, 2B, 30, 53 CoaL ________________________________ ..12, 29,45 Cocoa ___________________________ ------- 44 Coffee _______________________________ 23, 24,44 Coke___________________________________ 45 Collections, department stores_____________ 27 Commercial paper_ ______________________ 31,32 Communications_________________________ 38 Construction:
Contracts awarded, indexes_____________ 24 Costs ________ ---------________________ 25 Highways_____________________________ 25 Wage rates____________________________ 31
Copper ________________________________ - SO Copra and coconut oiL___________________ 40 Corn _____ ---------_____________________ 42 Cost-of-living index______________________ 23 Cotton, raw and manufactures ______ 23, 24, 53,54 Cottonseed, cake and meal~ oil_____________ 40 Crops_ ___ ------ _______________ 23, 40, 42, 43,53 Dairy products ________________ ---- 23, 24, 41,42 Dehits, bank____________________________ 32 Debt, United States Government__________ 34 Delaware, employment, pay rolls __________ 29,30 Department-store sales and stocks_________ 27 Deposits, bank__________________________ 32 Disputes, labor_ ____________ ----_________ 29 Dividend payments______________________ 36 Douglas fir_______ _ _ _ _ _ _ _ _ _ _ _ _ _ _ _ _ _ _ _ _ _ _ _ 4 7 Earnings, factory____________ _ _ _ _ _ _ _ _ _ _ _ _ 30, 31 Eggs ___________________________________ 23,44 Electrical equipment_____________________ 50 Electric power, production, sales, revenues __ 22,41 Electric railways _________________ ------__ 37 Employment:
Cities and States_______________________ 29 Factory ___________________________ 27, 28, 29 Nonmanufacturing ________________ ----- 29 Miscellaneous_________________________ 29
Emigration______________________________ 38 Enameled ware___________________________ 48 Engineering construction_________________ 25 England, exchange; United States trade
with ___________ ----------------------- 33,37 Exchange rates, foreign ______________ ----- 33 Expenditures, United States Government___ 34 Explosives _________________________ ----_ 39 Exports ________ ---- _______________ ------ 37 Factory employment, pay rolls ___ 27, 28, 29, 30,31 Failures, commerciaL ________________________ 32,33 Fairchild's retail price index_________________ 23
Fares, street railways ____________________ _ Farm employees ________________________ _ Farm prices, index ______________________ _ Federal Government, finances ____________ _ Federal-aid highways ____________________ _ Federal Reserve banks, condition oL ______ _ Federal Reserve reporting member bank
Page 37 29 23 34
25,29 32
statistics ___________ ---- ______________ ~ 32 Fertilizers_______________________________ 39 Fire-extinguishing equipment______________ 55 Fire losses______________________________ 25 Fish oiis and fish ________________________ 39,44 Fla:tseed___ _ _ _ _ _ _ _ __ _ _ _ _ _ _ _ _ _ _ _ _ _ _ _ _ _ _ _ _ 40 Flooring, oak, maple, beech, and birch______ 47 Flour, wheaL--------------------------- 43 Food products __________________ 22-24, 28, 30, 41 Footwear _______________________________ 46, 52 Foreclosures, real estate__________________ 25 Fo:reign trade, indexes, values_____________ 37 Foundry equipment_ ______________ ---____ 49 France, exchange; United States trade with_ 33,37 Freight cars (equipment)_________________ 55 Freight carloadingS, cars, indexes__________ 38 Freight-car surplus_______________________ 38 Fruits __________________________________ 23,42 Fuel equipnlcnt__________________________ 49 Fuels ____________ ------ ______________ --_ 45,46 Furniture __________ --------------_______ 47 Gas, custom.'!rs, sales, revenues____________ 41 Gas and fuel oils_________________________ 45 Gasoline _________________ --- _________ --- 45 Gelatin, edible __________________ --------- 44 General Motors sales_____________________ 55 Glass and glassware ________________ 22,28,30,53 Gloves and mittens _________ --- ____ ------ 46 Gold __ ----------- _______ --------------- 33 Goo.1s in warehouses ______ ---------_----- 26 Grains ____________________________ 23, 24, 42, 43· Gypsum ________________ ---------------- 53 Hides and skins __________________________ 24,46 Hogs ______________ ----- ___ ------ ______ - 43 H:::>me loan banks, loans outstanding ______ - 25 Home Owners' Loan Corporation__________ 25
~~~~1~~::::== = == = = = = = = = === === = == = = = = =- 29, 31, ~~ Housing _________________ --------------- 23 Illinois, employees, factory earnings _____ 29,30,31 Imports _______________ ---------------__ 37 Income-tax receipts _______ -_---_---_-_-_- 34 Incorporations. business ______ ,____________ 26 Industrial production, indexes ____________ "' 22 Installment sales, New England __ -________ 27 Insurance, life___________________________ 33 Interest payments __ - ___ -·--------------·- 36 Interest rates--------------------------------- 32 Investments, Federal Reserve reporting
member banks______________________________ 32 Iron, ore; crude; manufactures _______________ 22,48 Italy, exchange; United States trade with __ 33,37 Japan, exchange; United States trade with __ 33,37 Kerosene _______________ --------_-_- ___ - 46 Labor turn-over, disputes_________________ 29 Lamb and mutton ________ -------_---_-_- 43 Lard ___________________ ----- ------- __ -- 43 Lead ______ ------------_----·------_- ____ 22, 50 Leather ________________________ 22, 24, 28, 30, 46 Leather, artificial________________________ 54 Liberty bonds ___________ ------- ------ _- _ 35 Linseed oil, cake, and meaL_______________ 40 Livestock ____________________________ 23, 24,43 Loans, agricultural, brokers', time, real
estate ________________ ------__________ 31,32 Locomotives ___________ --------------___ 55 Looms, woolen, activity __ --------_----___ 54 Lubricants _____________ -----_---_------_ 46 Lumber ________________ ------_ 22, 24, 27, 28,47 Lumber yard, sales, stocks________________ 47 Machine activity, cotton~ silk, wool________ 54 Machine tools, orders ___ ------------_____ 49 Machinery ______________ ------- 27, 28, 30, 49, SO Magazine advertising _______ - __ -_- ____ ---_ 25, 26 Manufacturing indexes ____ ---_--_________ 22 Marketings, agriculturaL_________________ 23 Maryland, employment, pay rolls __________ 29,30 Massachusetts, employn1ent, pay rolls ______ 29,30 Meats ___________________ ----___________ 43 Metals_ _____ ---- _________________ 22-24, 27-30 MethanoL______________________________ 39 Mexico:
Silver production______________________ 34 United States trade with________________ 37
Milk___________________________________ 42 Minerals _____________________________ 22, 45, 50 Money in circulation_____________________ 33 Naval stores____________________________ 39 Netherlands, exchange____________________ 33 New Jersey, employment, pay rolls __ ------ 29,30 Newsprint_--___________________________ 52 New York, employment, pay rolls, canal
traffic _____________________________ 29,30, 38 New Xork.Stock.Exchange ________________ 35,36 Notes 1n ctrculatton______________________ 32 Oats ____________ --------_______________ 42 Oceania, United States trade with__________ 37 Ohio, employment_-------_______________ 29 Ohio River traffic________________________ 38 Oils and fats____________________________ 39 Oleomargarine___________________________ 40 Paints _____________ ·-----_______________ 41
Pap Paper and pulp ______________ 23,24,28,3j),Sl,S2 Passenger-car sales index ______________ ..,___ 26 Passengers, street railways; Pullman _______ 37,38 Passports issued ___________ ------------...... · 38 Pay rolls:
FactorY--------------------------·--- 30 Factory, by cities and State•------·-·--·- 30 Nonmanufacturing industries _____ ................. 30.31
Pennsylvania, employment, pay rolls_______ 30 Petroleum and products ___ 22, 24, 28, 29, 30,45,'16 Pig iron ______ ---- ____________ ---------- 2~, 48 Pork __________________________ ------·-· 43 Postal business__________________________ 26 Postal savings___________________________ 32 Poultry----- ____________________ , ____ 23, 24,44 Prices:
Cost of living, indexes __________________ 1 23 Farm indexes__________________________ 23 Retail indexes _______________ .-----____ 23 Wholesale indexes _____________ -----· ___ 23,24 World, foodstuffs and raw materiaL______ .24
Printing __________________ ----------- 28, 30,52 Production,industrial_ ___________________ ' 22 Profits, corporation ___________ -·-- ____ ........ 34 Public finance __________ ~ ___________ ._·-_ 34 Public utilities _____________________ 24, 29, 30,36 Pullman Co_____________________________ 38 Pumps ________________________ .---- __ -~- 49 Purchasing power of the dollar____________ 24 Radiators ________ --------------·--·---__ 48 Radio, advertising----------------------.. 2.5 Railways; operations, equipment, 6n.ancial. .'
R=~~:,S;~~s;t-r-;,-;,t:= = = = =~= = = = ============-~~' SS, ~ Ranges, electric _______ ---.- ___ ................. ___ ..,__ ·50 Rayon ___________ ~ ________ -------------- 54 Reconstruction Finance CorporatiJm, l~a·
outstanding ______________ ----·•------- 34 Refrigerators, electric, household __ ~ .. ~---~-- SO" Registrations, automobiles _________ :_·;.._____ ,. 55 Rents (housing), index___________________ 23 Retail trade: :
Automobiles, new, passenger ______ ,.._____ 26 Chain stores:
5-and-10 (variety)___________________ -26 Grocery _____ ------ ________ ---- ____ _: 26
Department stores ______ ---·- ____ :,._ ... _........ 27 Mail order-------------------------~-----·· 21 Rural g;eneral merchanoise __ .,. _________ ....... 27
Roofing ____ ------------ _____ ---------·-·--·· 40 Rice _______________ ---- _______ --·--•- --- 42 Rubber, crude; scrap; clothingi footwear;
tires ________ -_-_- ____________ 22, 24, 28,30,52 Rye _____________________ • __________ -•·- 43 Sanitary ware ____________________ -----·- 41 Savings deposits_________________________ 32 Sheep and Jambs_________________________ 43 Shipbuilding _______________ ·------ 22, 2S, 30,56 Shoes_ _____ ---- ________ ·-- __ --- 22, 24,28,30,46
~~r;;_~~========~==================~~=~~·~;:t: Softwoods __ .-- __ ---- __________ --------- 47 Spain, exchange_________________________ 33 Spindle activity, cotton___________________ 54 Steel, crude; manufactures _____ .. _____ . __ 22,48,49 Stockholders _______ ----- ___ ·-------_--·· 36 Stock indexes, domestic and world.________ 23 Stocks, department stores ______ ,. __ .,.................... 27 Stocks (see individual commodities)~ Stocks, issues, prices, sales ____________ ..,,.__ 36 Stone, clay, and glass products ___ ; __ 22, 28,30, 53
~~f:h;;; ~ ~ = = = = = = = = = = = = = = =:: =: =:: = = = =:-~~' 24, ~~ Sulphuric acid___________________________ 39 Superphosphate_________________________ 39 Tea _____ --- ____ - _____________ ·---- __ 23, 24,44 Telephones and telegraphs _________ .;. __ .. ___ 38 Terneplate ________ -------"----- __ ·- __ __ _ 50 Terra cotta-------------·-----·--------- 53 Textiles, miscellaneous products___________ 54 Tile, hollow building_____________________ 53 Timber ________________________ --------- 47 Tin and terneplate ____________________ 23,24,50 Tires ___ -------------- ______ --- 22, 24, 28, 30, 52 Tobacco __ -----_-_------- __ ----- 22, 26, 28, 30,44 Tools, machine _______________ .,. ________ ... __ 49 Trade unions, ernployment............................................ 29 TraveL __________________ -------------'-- 38 Trucks and tractors, industrial electric_____ 56 United Kingdom, exchange; United States
trade with _____________ ------------·-- 33,37 Uruguay, exchange_______________________ 33 United States Steel Corporation ________ 31,36, 49 Utilities _________________ 29, 30,34, 35,36,41, 55 Vacuum cleaners ___________________ .:, .. ____ 50 Variety-store sales index ________________ ...,_ 26 Vegetable oils ________________ ----· ___ •-- 39,"10
~e;:;:~!~~=============::::::::::::=:::: 2ll,j: · Warehouses, space occupied ____ ·--------·-- 26 Waterway traffic_________________________ 38 Wheat and wheat flour-------------·-~ 23 1 24;43 Wholesale prices _________ ----·---·-----~- 23,::14. Wire cloth ______________ --··-·----_-·--- 51 Wisconsin, employment, pay rolls ___ ;. ___ ::19,30,31 Wood pulP-----------------···---~-----· .. 51
~:~~·:::::.:.=:.= =:.=:. :.= :.= ==:.:.:.:.:.:.:.:.::.::::::: ~~:~~

THE BUREAU OF FOREIGN AND DOMESTIC COMMERCE OF THE
UNITED STATES DEPARTMENT OF COMMERCE IS COOPERATING WITH THE
U. S. CHAMBER OF COMMERCE IN CELEBRATING
NATIONAL FOREIGN TRADE WEEK
CANADA /4cfo
UNITED KINGDOM 7.4~
JAPAN 7.4~o
BRIT. MALAYA 6.3tyo
CUBA s.scy. BRAZIL
4.97o
ro CANADA
/4.2~o
JAPAN 8.90/o
FRANCE .S./Off)
GERMANY 4~o
ITALY 3.20fo
PHILIPPINES 4-.BOf•
GERMANY 3.8~o
MAY 16·22 MEXICO
2.9~.
CUBA 2.6cyo
INDIA 3.2~·
ARGENTINA 3./~o
ICJ37 AUSTRALIA
2.S"?o
, ALL OTHERS ALL OTHERS 39.6«yo 35~.
FOR 25 YEARS THE BUREAU OF FOREIGN AND DOMESTIC COMMERC.E HAS
SERVED AMERICAN BUSINESS IN PROMOTING DOMESTIC AND FOREIGN TRADE
Recommended


![DEEDS REGISTRIES ACT NO. 47 OF 1937 - Shepstone & Wylie · DEEDS REGISTRIES ACT NO. 47 OF 1937 [View Regulation] [ASSENTED TO 19 MAY, 1937] [DATE OF COMMENCEMENT: 1 SEPTEMBER, 1937]](https://img.pdfslide.us/doc/110x75/5f0aaf9f7e708231d42cd69c/deeds-registries-act-no-47-of-1937-shepstone-wylie-deeds-registries-act.jpg)