Materials SectorFelix Kvarnstroem, Luke Lentin, Jeffrey Li, Michael Li
SIM BUSFIN 4228 SP21
2
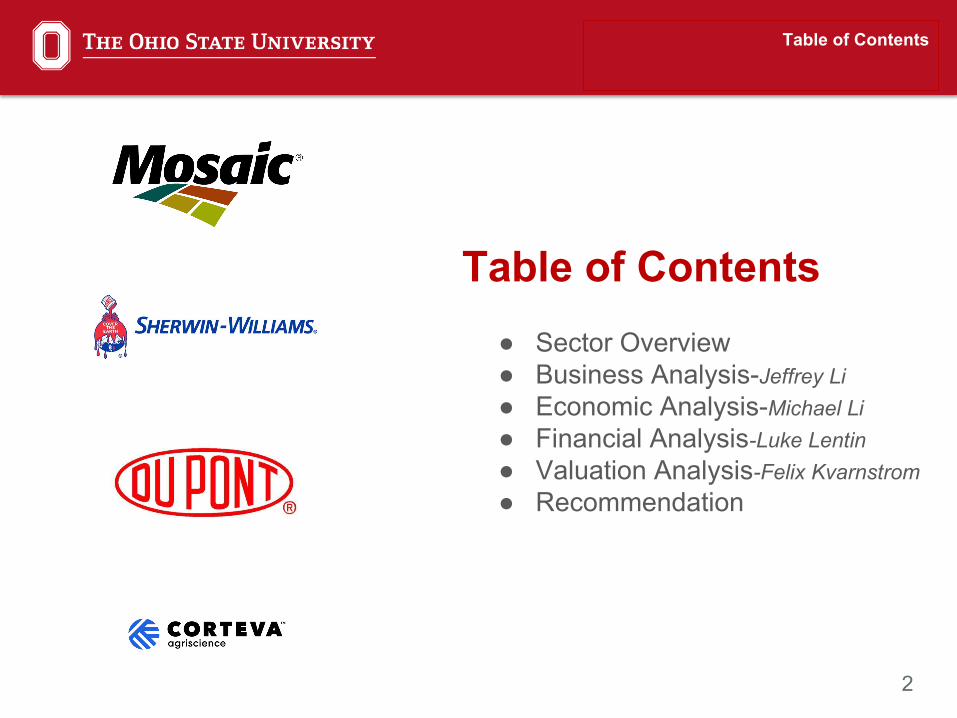
Table of Contents● Sector Overview● Business Analysis-Jeffrey Li● Economic Analysis-Michael Li● Financial Analysis-Luke Lentin● Valuation Analysis-Felix Kvarnstrom● Recommendation
Table of Contents

3
SectorOverview
By Jeffrey Li
4
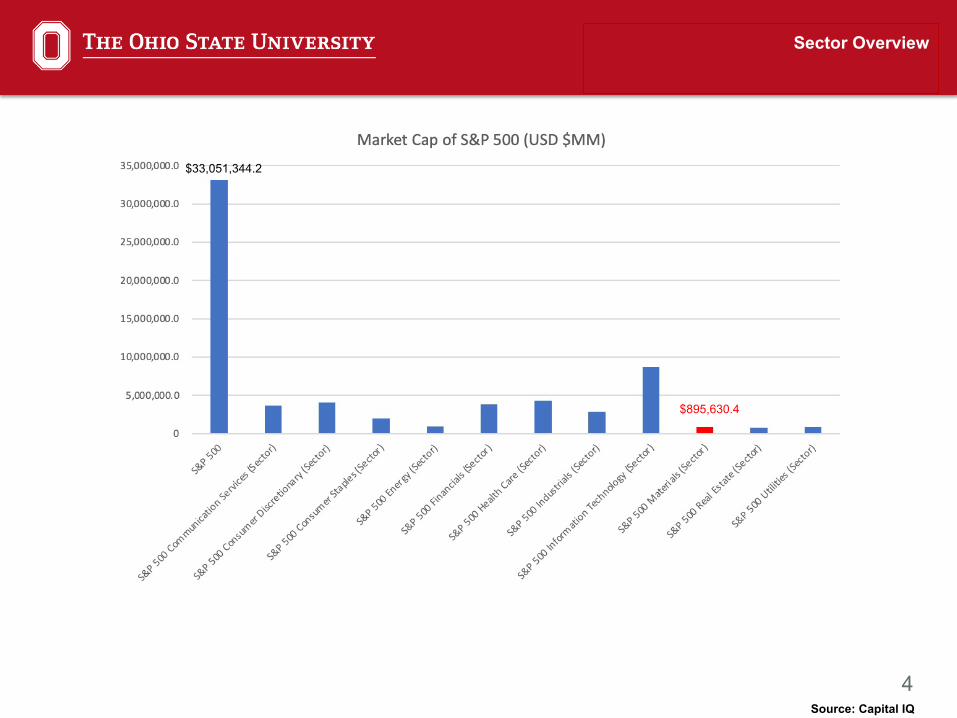
Sector Overview
Source: Capital IQ
$895,630.4
$33,051,344.2
5
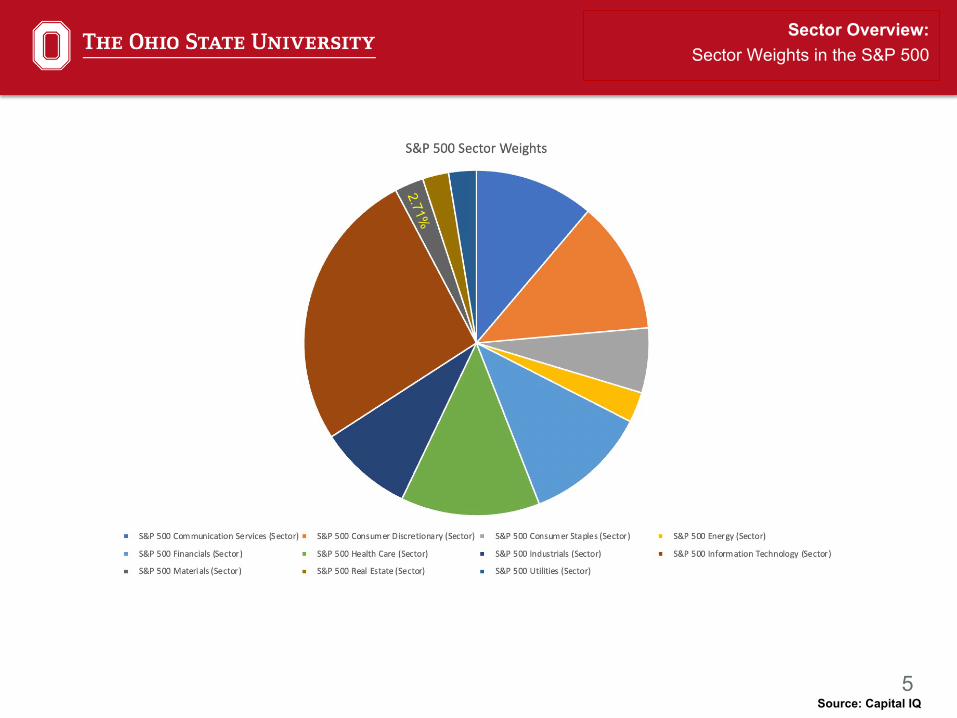
2.71%
Source: Capital IQ
Sector Overview:Sector Weights in the S&P 500
6
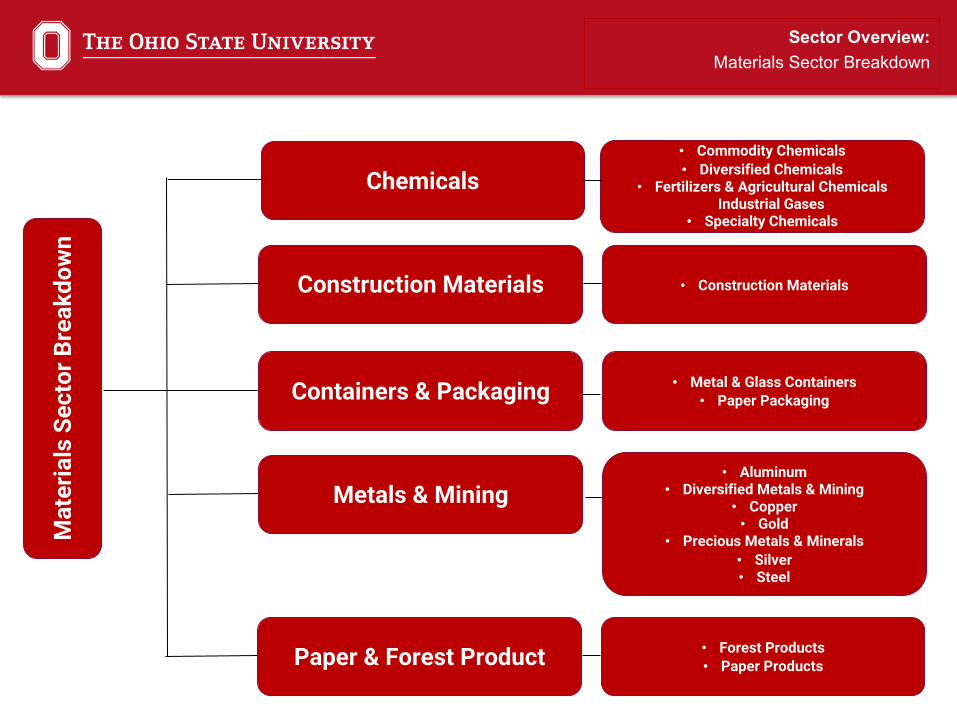
Sector Overview:Materials Sector Breakdown
Mat
eria
ls S
ecto
r Bre
akdo
wn
Chemicals
Construction Materials
Containers & Packaging
Metals & Mining
Paper & Forest Product
• Commodity Chemicals• Diversified Chemicals
• Fertilizers & Agricultural Chemicals Industrial Gases
• Specialty Chemicals
• Construction Materials
• Metal & Glass Containers• Paper Packaging
• Aluminum• Diversified Metals & Mining
• Copper• Gold
• Precious Metals & Minerals• Silver• Steel
• Forest Products• Paper Products
7
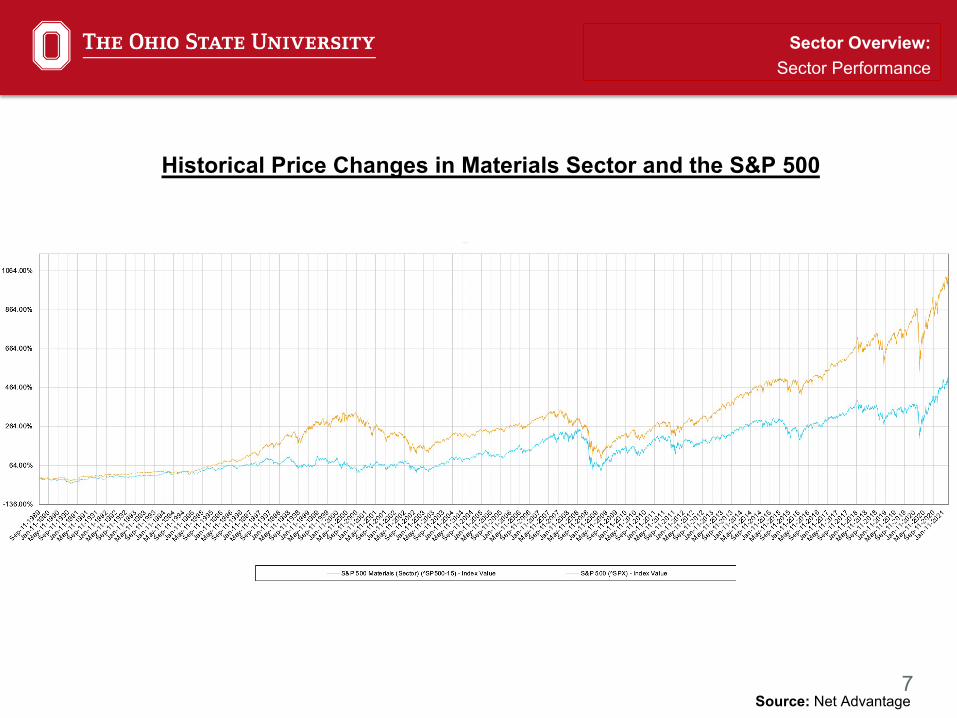
Sector Overview:Sector Performance
Historical Price Changes in Materials Sector and the S&P 500
Source: Net Advantage
8
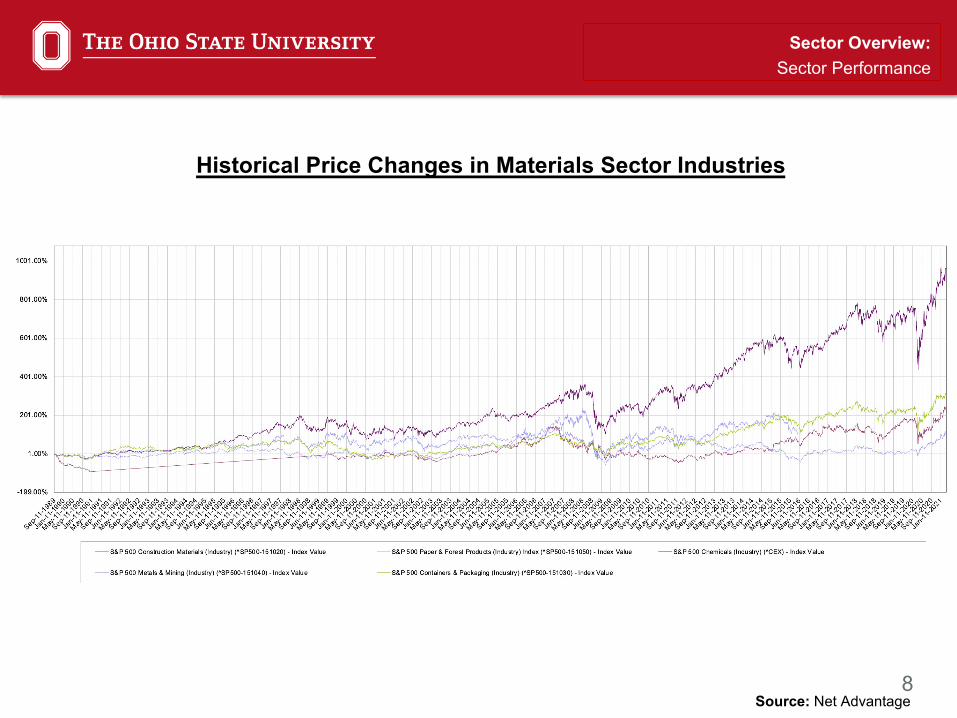
Sector Overview:Sector Performance
Historical Price Changes in Materials Sector Industries
Source: Net Advantage
9
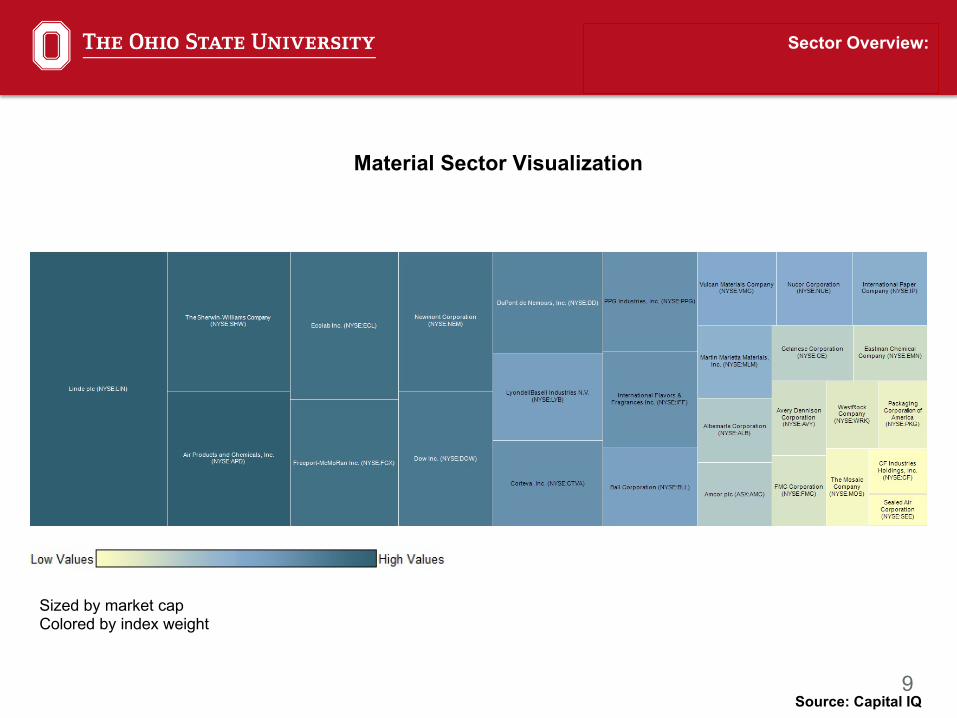
Sector Overview:
Source: Capital IQ
Material Sector Visualization
Sized by market capColored by index weight
10
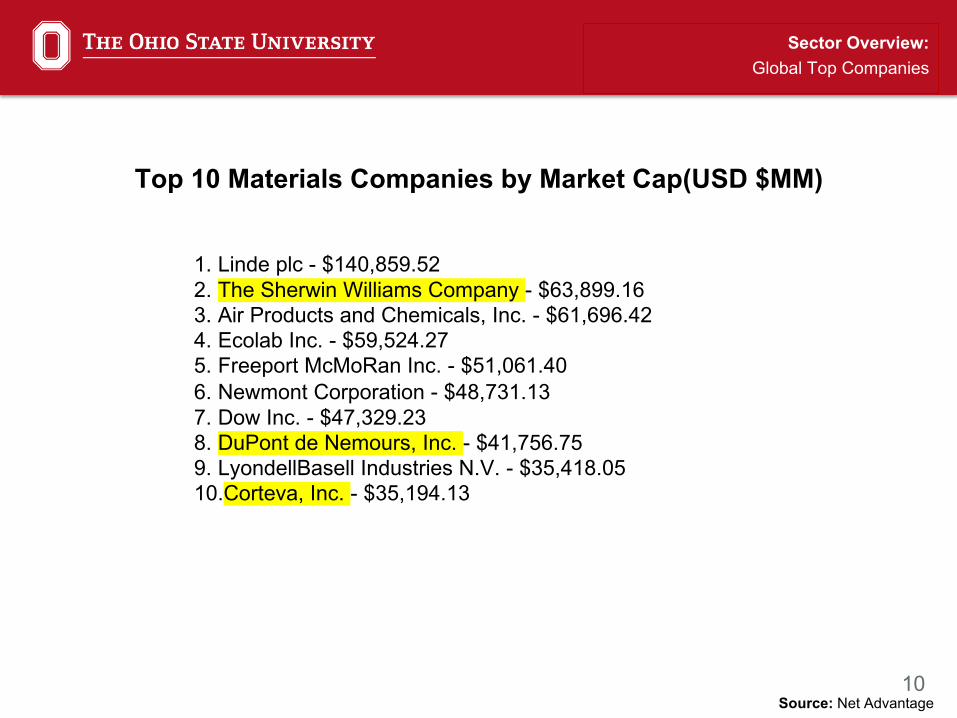
Sector Overview:Global Top Companies
Source: Net Advantage
Top 10 Materials Companies by Market Cap(USD $MM)
1. Linde plc - $140,859.522. The Sherwin Williams Company - $63,899.163. Air Products and Chemicals, Inc. - $61,696.424. Ecolab Inc. - $59,524.275. Freeport McMoRan Inc. - $51,061.406. Newmont Corporation - $48,731.137. Dow Inc. - $47,329.238. DuPont de Nemours, Inc. - $41,756.759. LyondellBasell Industries N.V. - $35,418.0510.Corteva, Inc. - $35,194.13

11
BusinessAnalysis
By Jeffrey Li
12
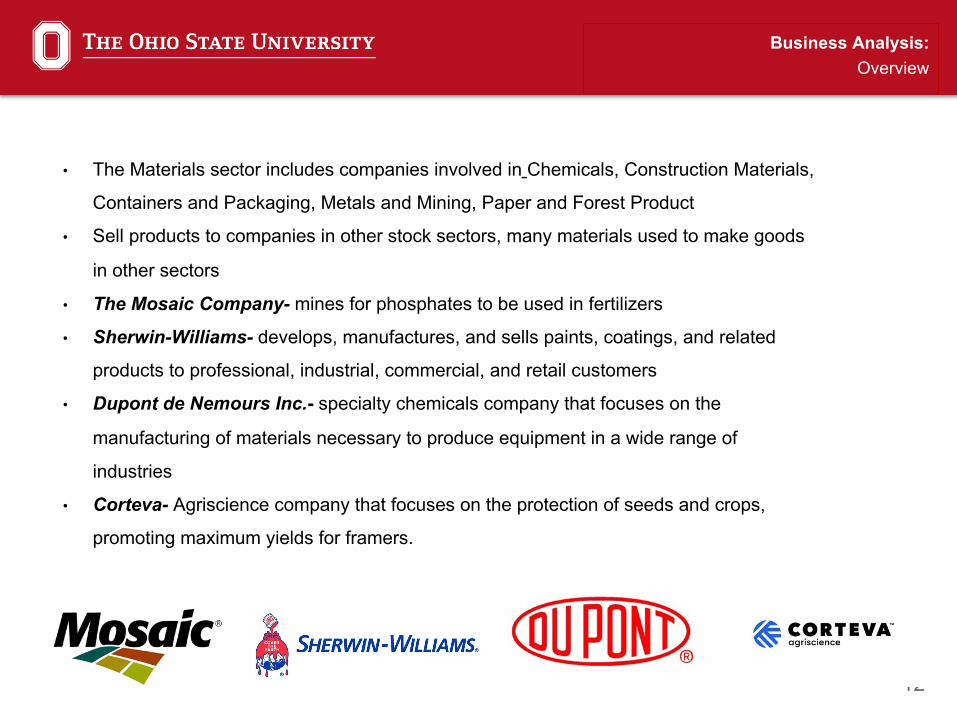
Business Analysis:Overview
• The Materials sector includes companies involved in Chemicals, Construction Materials,
Containers and Packaging, Metals and Mining, Paper and Forest Product
• Sell products to companies in other stock sectors, many materials used to make goods
in other sectors
• The Mosaic Company- mines for phosphates to be used in fertilizers
• Sherwin-Williams- develops, manufactures, and sells paints, coatings, and related
products to professional, industrial, commercial, and retail customers
• Dupont de Nemours Inc.- specialty chemicals company that focuses on the
manufacturing of materials necessary to produce equipment in a wide range of
industries
• Corteva- Agriscience company that focuses on the protection of seeds and crops,
promoting maximum yields for framers.
13
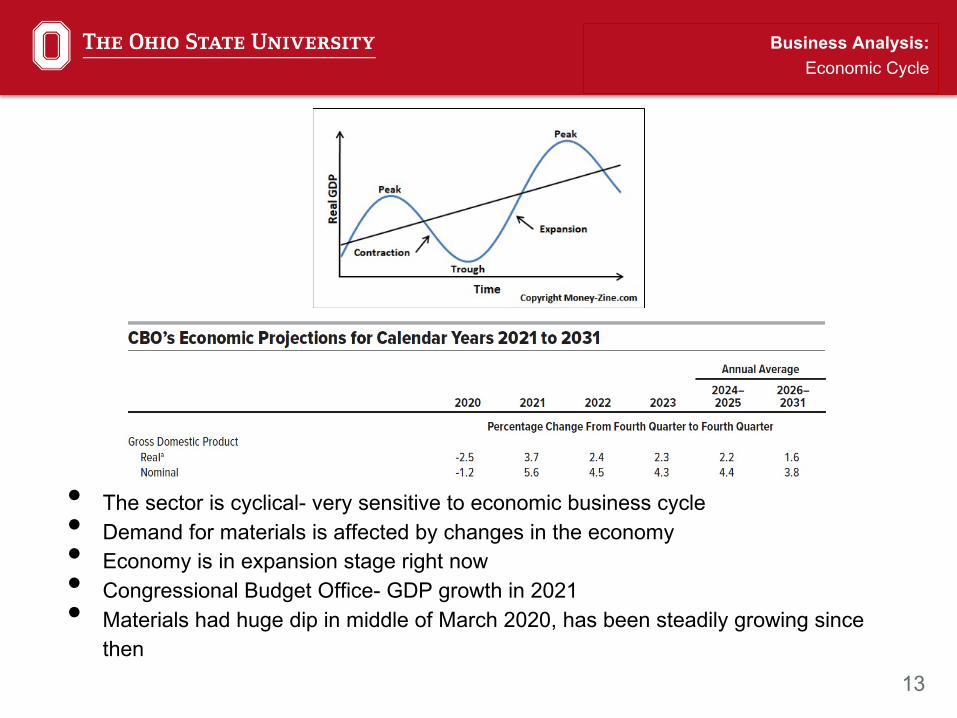
Business Analysis:Economic Cycle
• The sector is cyclical- very sensitive to economic business cycle• Demand for materials is affected by changes in the economy• Economy is in expansion stage right now• Congressional Budget Office- GDP growth in 2021• Materials had huge dip in middle of March 2020, has been steadily growing since
then
14
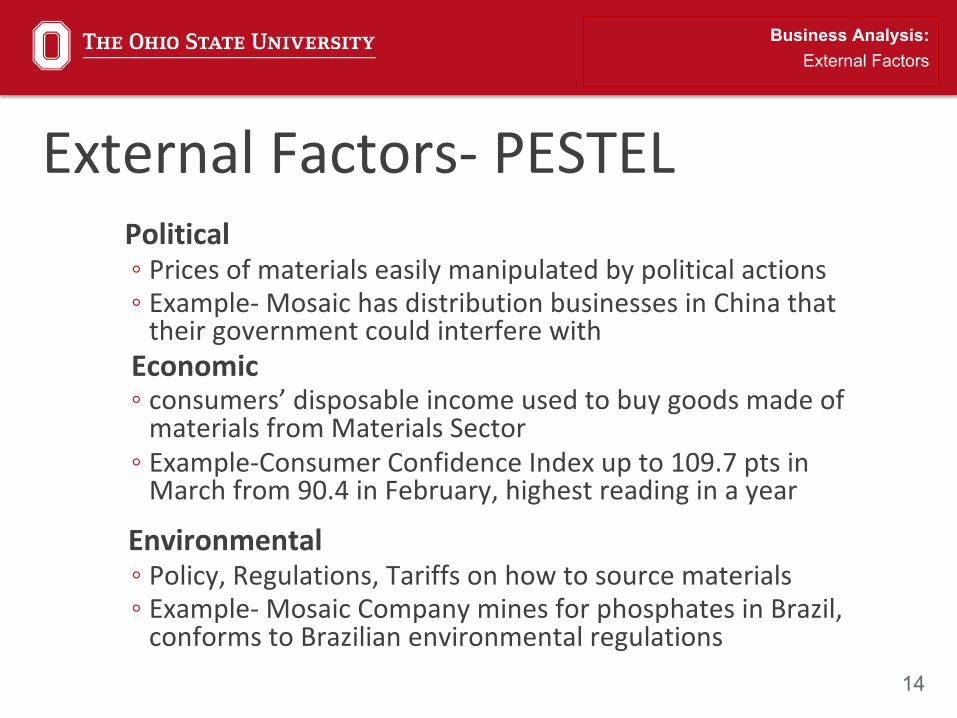
External Factors- PESTELPolitical◦ Prices of materials easily manipulated by political actions◦ Example- Mosaic has distribution businesses in China that
their government could interfere with Economic◦ consumers’ disposable income used to buy goods made of
materials from Materials Sector◦ Example-Consumer Confidence Index up to 109.7 pts in
March from 90.4 in February, highest reading in a year
Environmental◦ Policy, Regulations, Tariffs on how to source materials◦ Example- Mosaic Company mines for phosphates in Brazil,
conforms to Brazilian environmental regulations
Business Analysis:External Factors
15
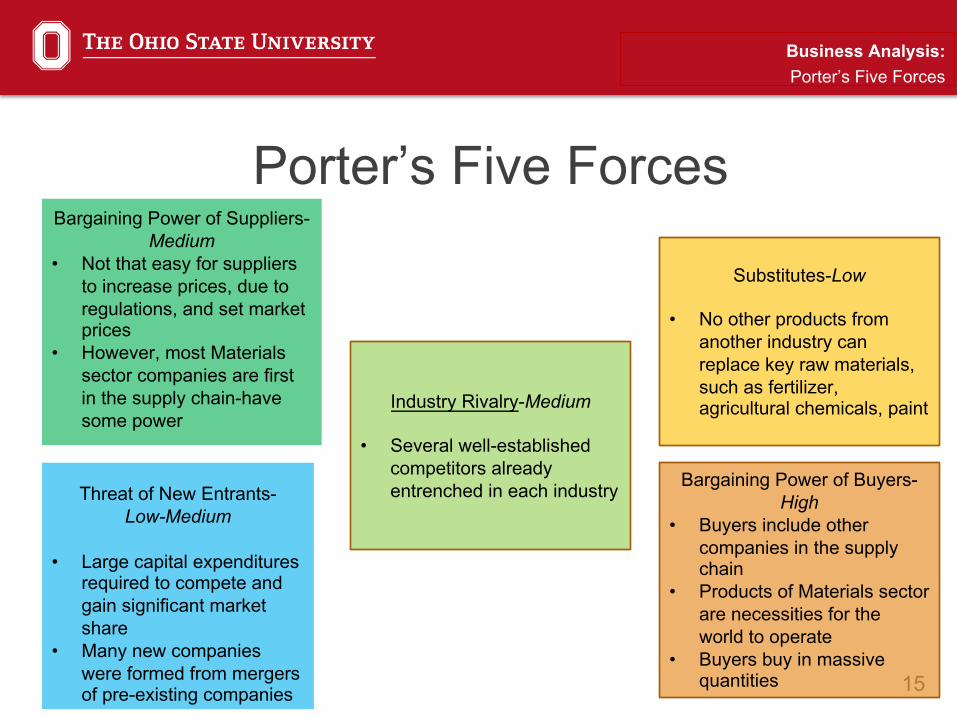
Porter’s Five ForcesBargaining Power of Suppliers-
Medium• Not that easy for suppliers
to increase prices, due to regulations, and set market prices
• However, most Materials sector companies are first in the supply chain-have some power
Threat of New Entrants-Low-Medium
• Large capital expenditures required to compete and gain significant market share
• Many new companies were formed from mergers of pre-existing companies
Industry Rivalry-Medium
• Several well-established competitors already entrenched in each industry Bargaining Power of Buyers-
High• Buyers include other
companies in the supply chain
• Products of Materials sector are necessities for the world to operate
• Buyers buy in massive quantities
Substitutes-Low
• No other products from another industry can replace key raw materials, such as fertilizer, agricultural chemicals, paint
Business Analysis:Porter’s Five Forces
16
Economic Analysis
by Michael Li
17
• Cyclical Sector – Sensitive to economic cycle• Investigated Indicators:
• Producer Price Index (PPI), PPI for construction• Consumer Price Index (CPI)• 10-Year Treasury Yield• Home Price• US Dollar Index• Unemployment Rate• WTI Oil Price
Economic Analysis:Economic Indicators
Economic Indicators
18
Economic AnalysisSector Correlation with PPI
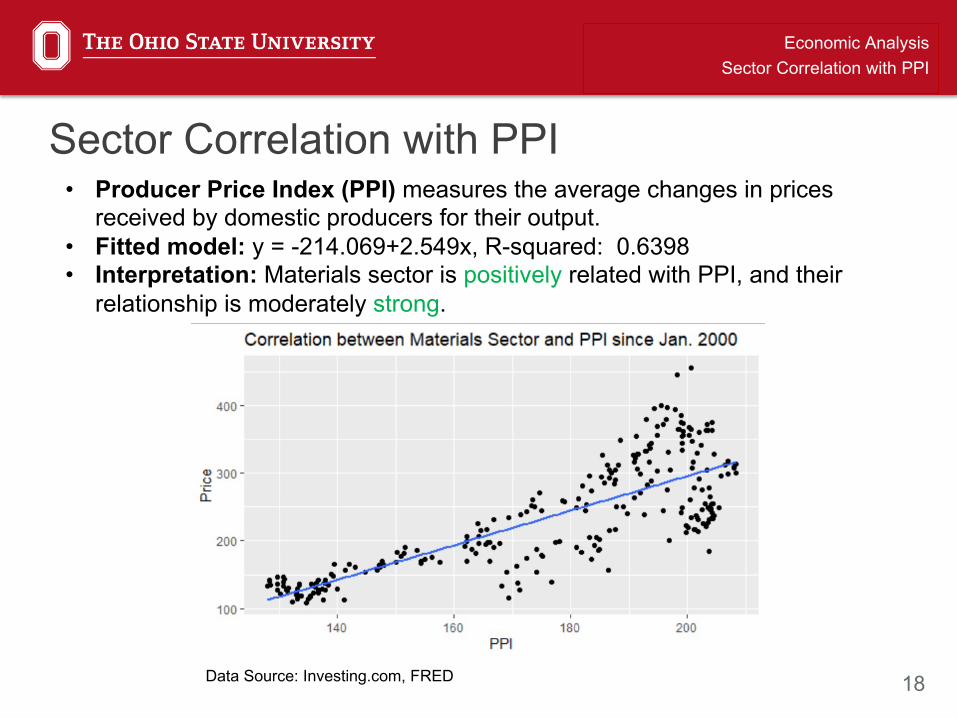
• Producer Price Index (PPI) measures the average changes in prices received by domestic producers for their output.
• Fitted model: y = -214.069+2.549x, R-squared: 0.6398• Interpretation: Materials sector is positively related with PPI, and their
relationship is moderately strong.
Sector Correlation with PPI
Data Source: Investing.com, FRED
19
Economic AnalysisSector Correlation with PPI
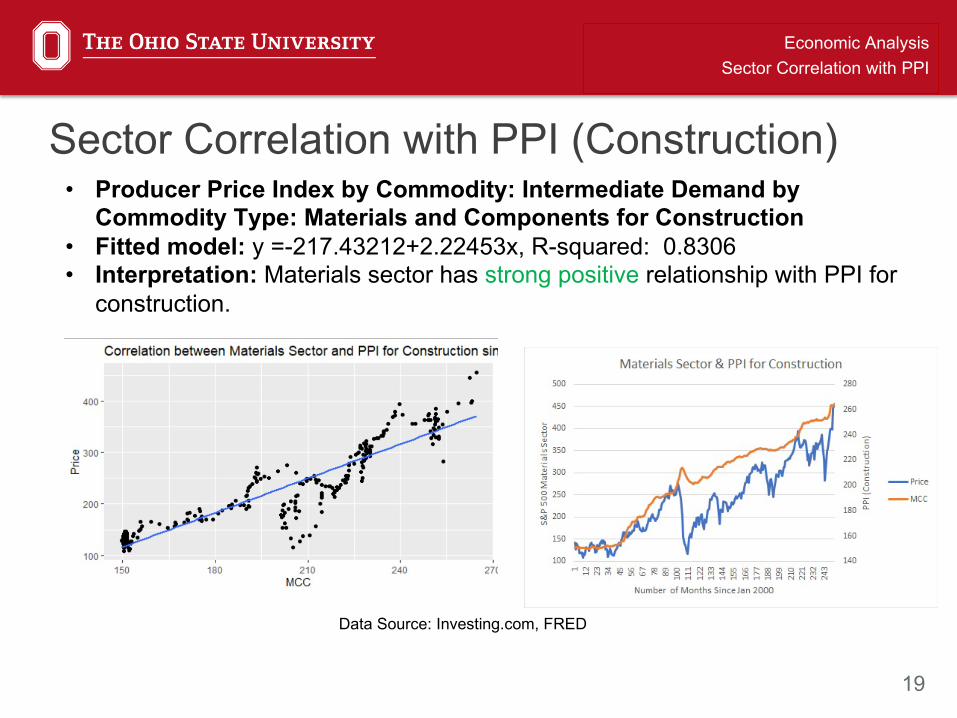
• Producer Price Index by Commodity: Intermediate Demand by Commodity Type: Materials and Components for Construction
• Fitted model: y =-217.43212+2.22453x, R-squared: 0.8306• Interpretation: Materials sector has strong positive relationship with PPI for
construction.
Sector Correlation with PPI (Construction)
Data Source: Investing.com, FRED
20
Economic AnalysisSector Correlation with CPI
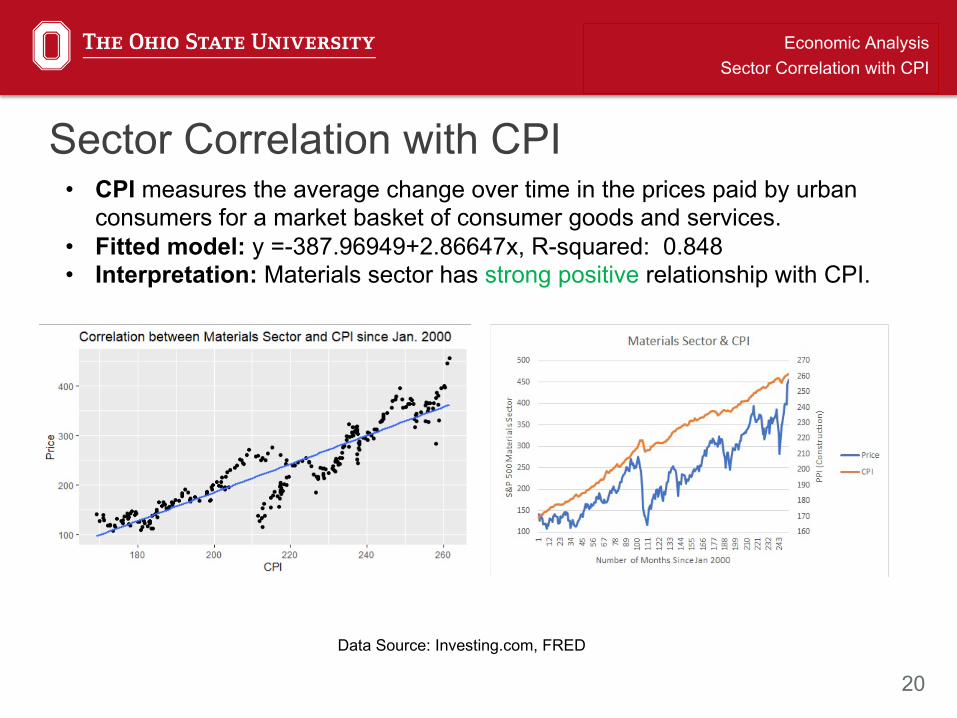
• CPI measures the average change over time in the prices paid by urban consumers for a market basket of consumer goods and services.
• Fitted model: y =-387.96949+2.86647x, R-squared: 0.848• Interpretation: Materials sector has strong positive relationship with CPI.
Sector Correlation with CPI
Data Source: Investing.com, FRED
21
Economic AnalysisSector Correlation with Treasury Yield
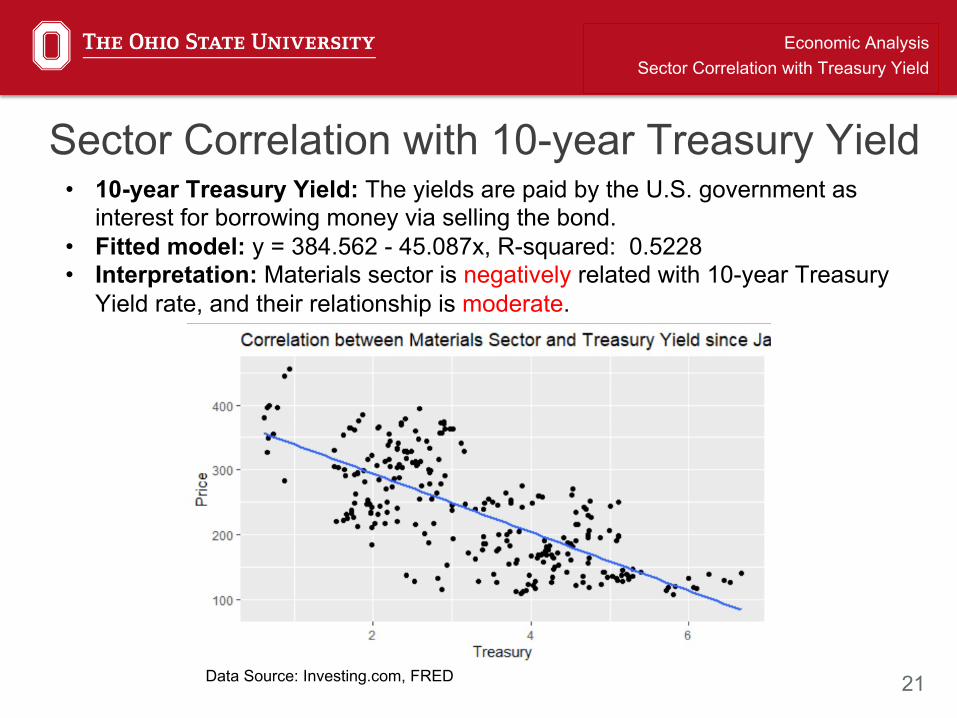
• 10-year Treasury Yield: The yields are paid by the U.S. government as interest for borrowing money via selling the bond.
• Fitted model: y = 384.562 - 45.087x, R-squared: 0.5228• Interpretation: Materials sector is negatively related with 10-year Treasury
Yield rate, and their relationship is moderate.
Sector Correlation with 10-year Treasury Yield
Data Source: Investing.com, FRED
22
Economic AnalysisSector Correlation with Home Price
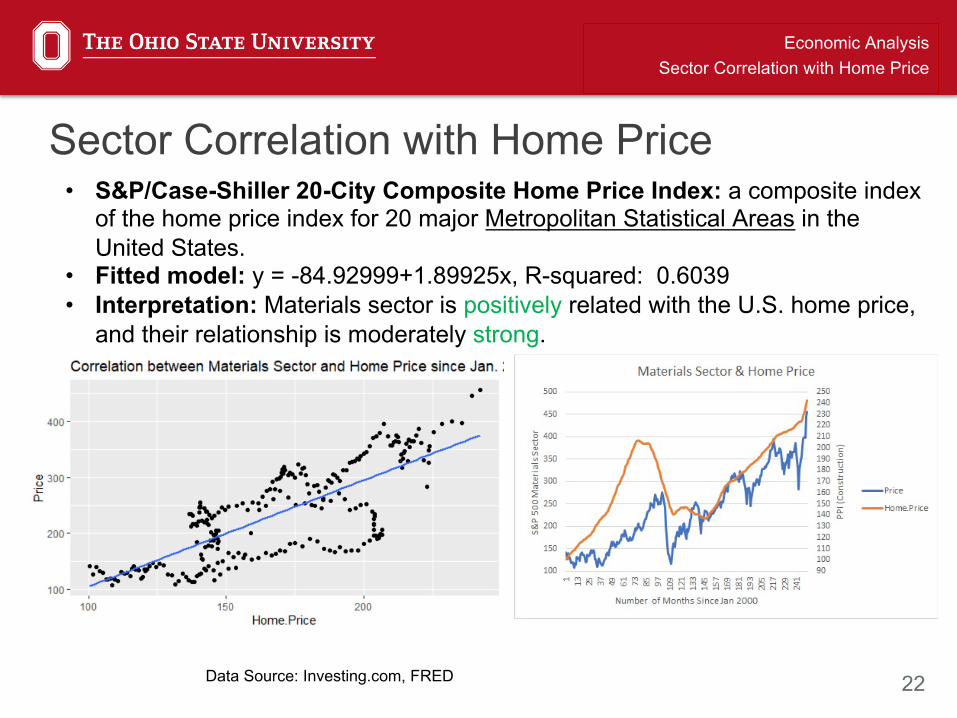
• S&P/Case-Shiller 20-City Composite Home Price Index: a composite index of the home price index for 20 major Metropolitan Statistical Areas in the United States.
• Fitted model: y = -84.92999+1.89925x, R-squared: 0.6039• Interpretation: Materials sector is positively related with the U.S. home price,
and their relationship is moderately strong.
Sector Correlation with Home Price
Data Source: Investing.com, FRED
23
Economic AnalysisSector Correlation with US Dollar Index
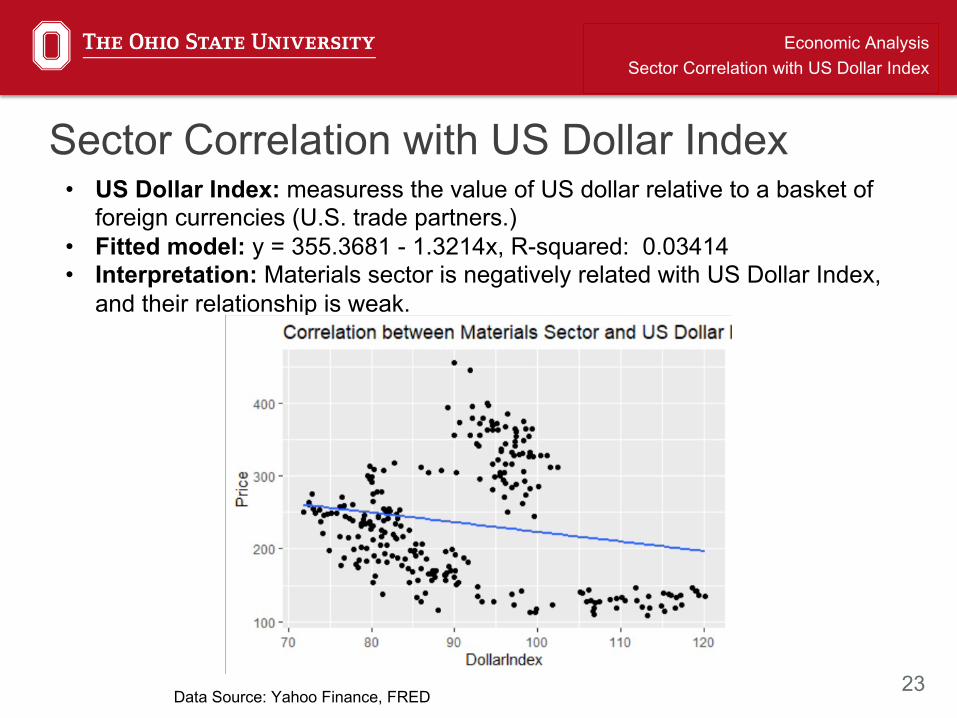
• US Dollar Index: measuress the value of US dollar relative to a basket of foreign currencies (U.S. trade partners.)
• Fitted model: y = 355.3681 - 1.3214x, R-squared: 0.03414• Interpretation: Materials sector is negatively related with US Dollar Index,
and their relationship is weak.
Sector Correlation with US Dollar Index
Data Source: Yahoo Finance, FRED
24
Economic AnalysisSector Correlation with Unemployment Rate & Oil Price
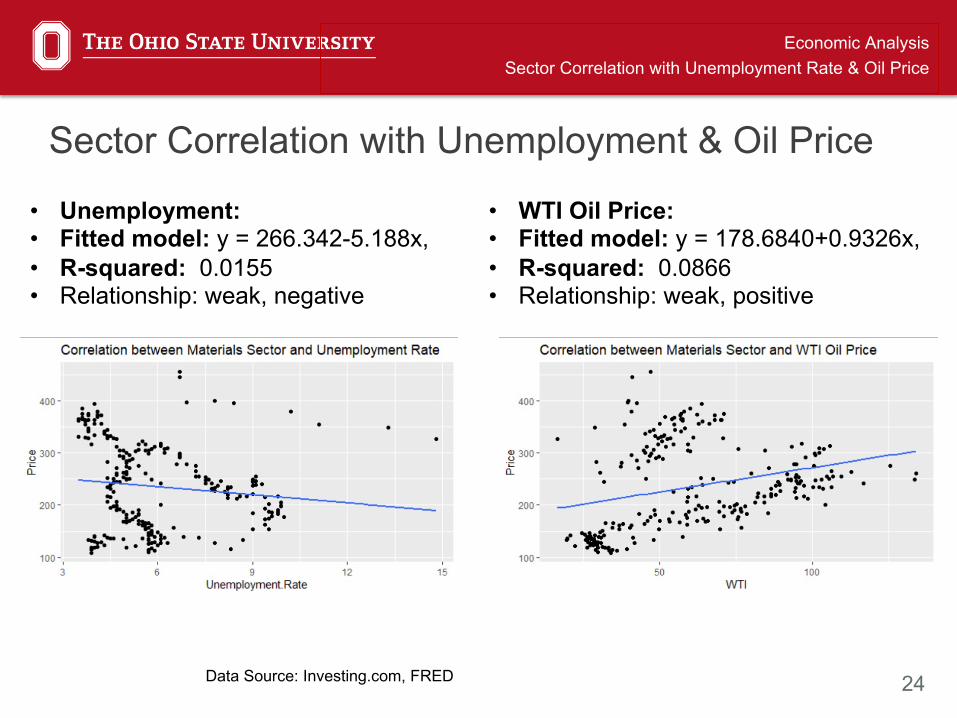
• Unemployment:• Fitted model: y = 266.342-5.188x,• R-squared: 0.0155• Relationship: weak, negative
Sector Correlation with Unemployment & Oil Price
Data Source: Investing.com, FRED
• WTI Oil Price:• Fitted model: y = 178.6840+0.9326x,• R-squared: 0.0866• Relationship: weak, positive
25
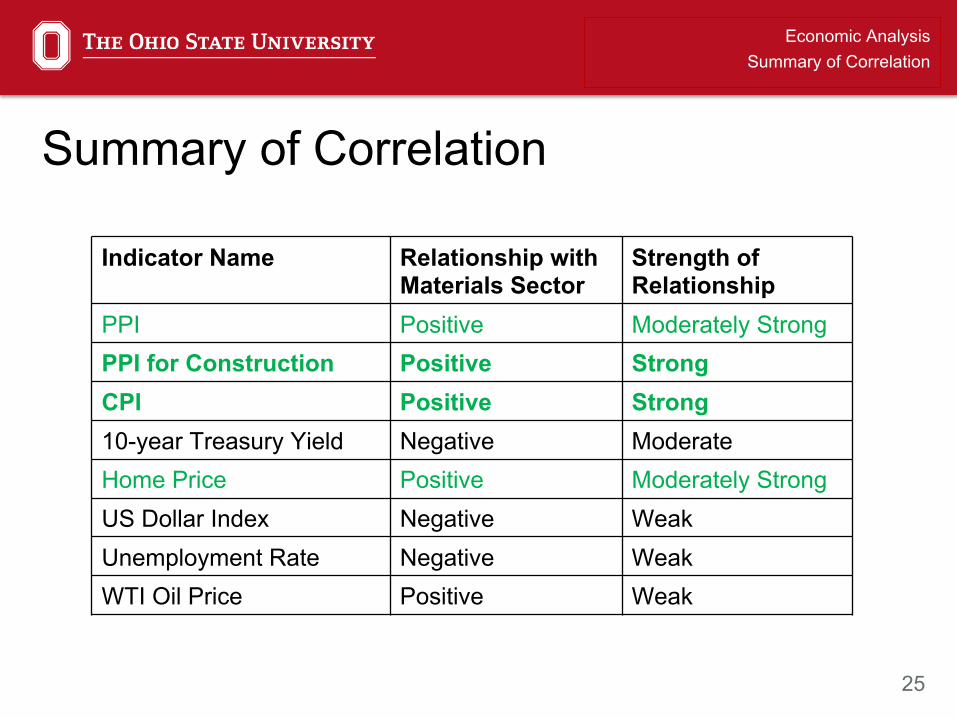
Economic AnalysisSummary of Correlation
Summary of Correlation
Indicator Name Relationship with Materials Sector
Strength of Relationship
PPI Positive Moderately StrongPPI for Construction Positive StrongCPI Positive Strong10-year Treasury Yield Negative ModerateHome Price Positive Moderately StrongUS Dollar Index Negative WeakUnemployment Rate Negative WeakWTI Oil Price Positive Weak
26
Financial Analysis
By Luke Lentin
27
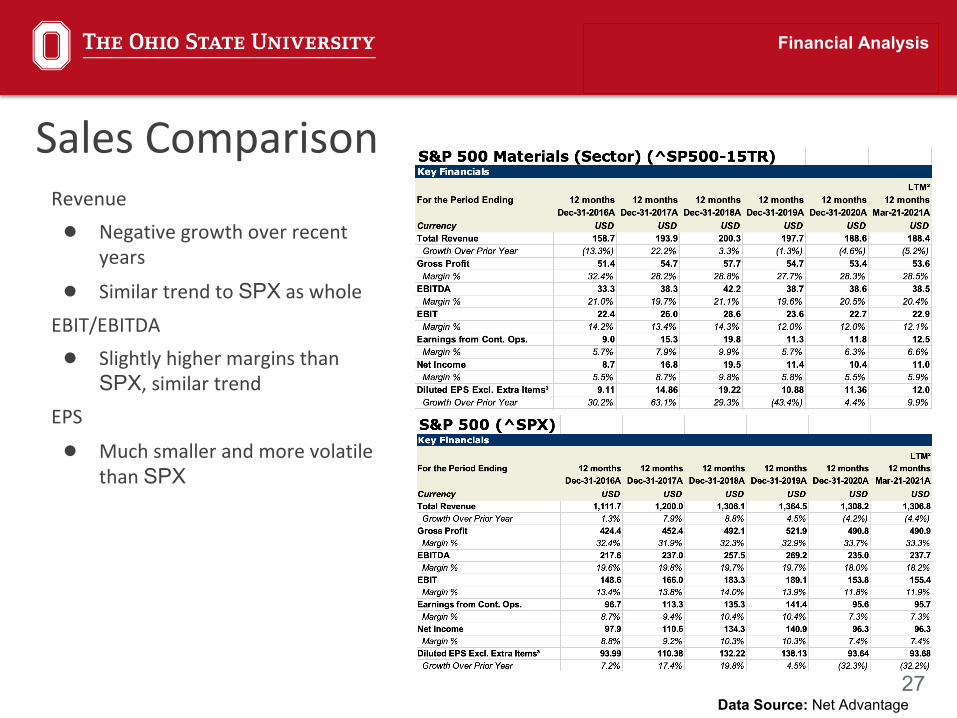
Financial Analysis
Data Source: Net Advantage
Revenue● Negative growth over recent
years
● Similar trend to SPX as wholeEBIT/EBITDA● Slightly higher margins than
SPX, similar trendEPS
● Much smaller and more volatile than SPX
Sales Comparison
28
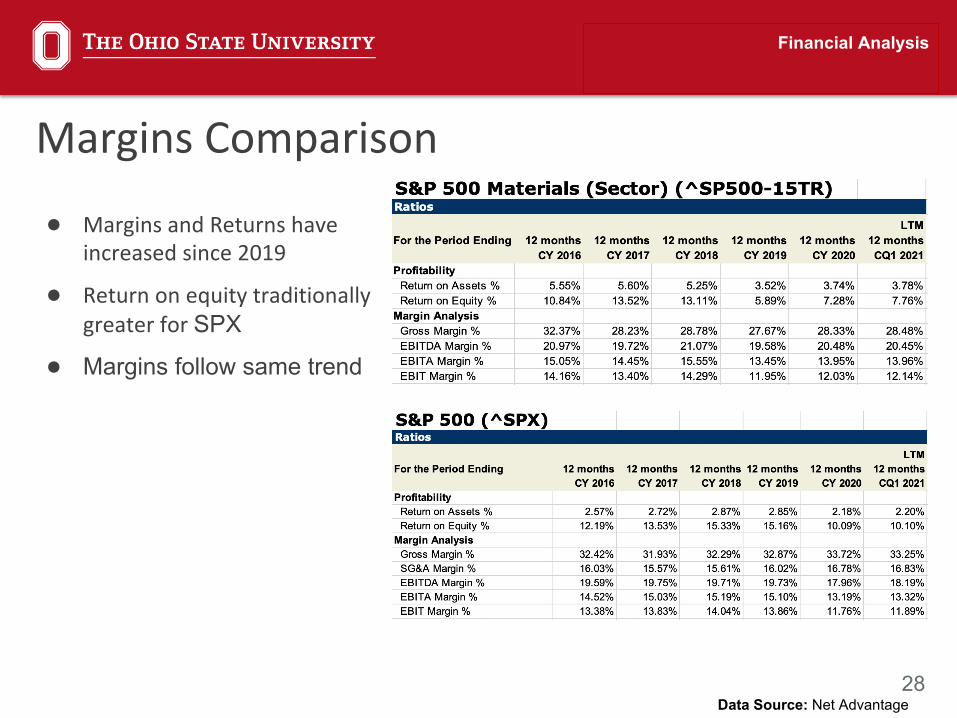
Financial Analysis
Data Source: Net Advantage
● Margins and Returns have increased since 2019
● Return on equity traditionally greater for SPX
● Margins follow same trend
Margins Comparison
29
Financial Analysis
Data Source: Net Advantage
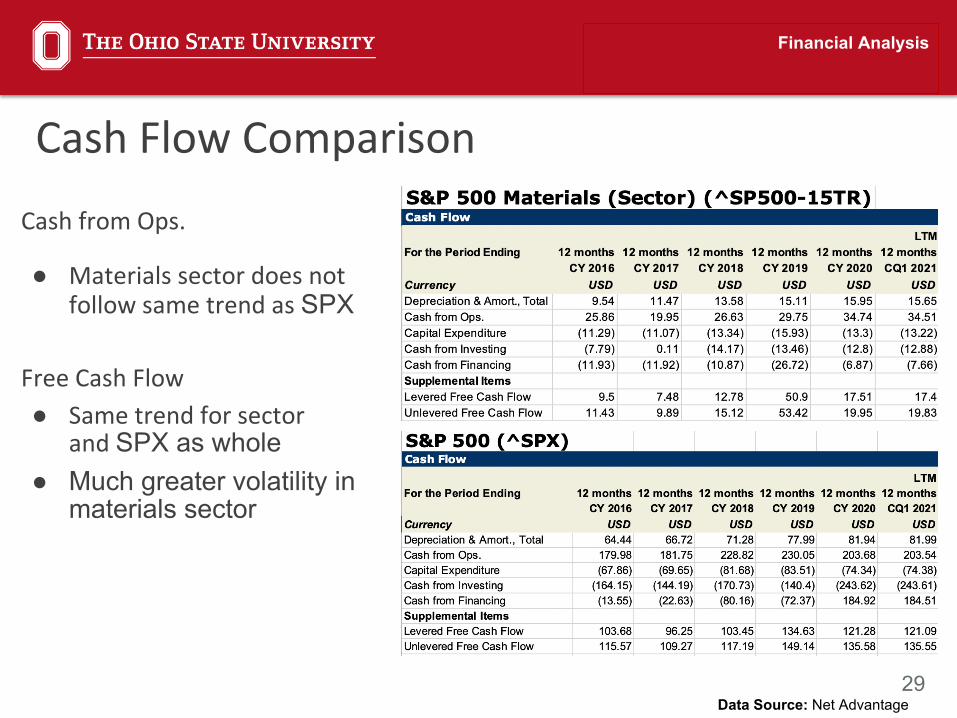
Cash from Ops.
● Materials sector does not follow same trend as SPX
Free Cash Flow● Same trend for sector
and SPX as whole● Much greater volatility in
materials sector
Cash Flow Comparison
30
Financial Analysis
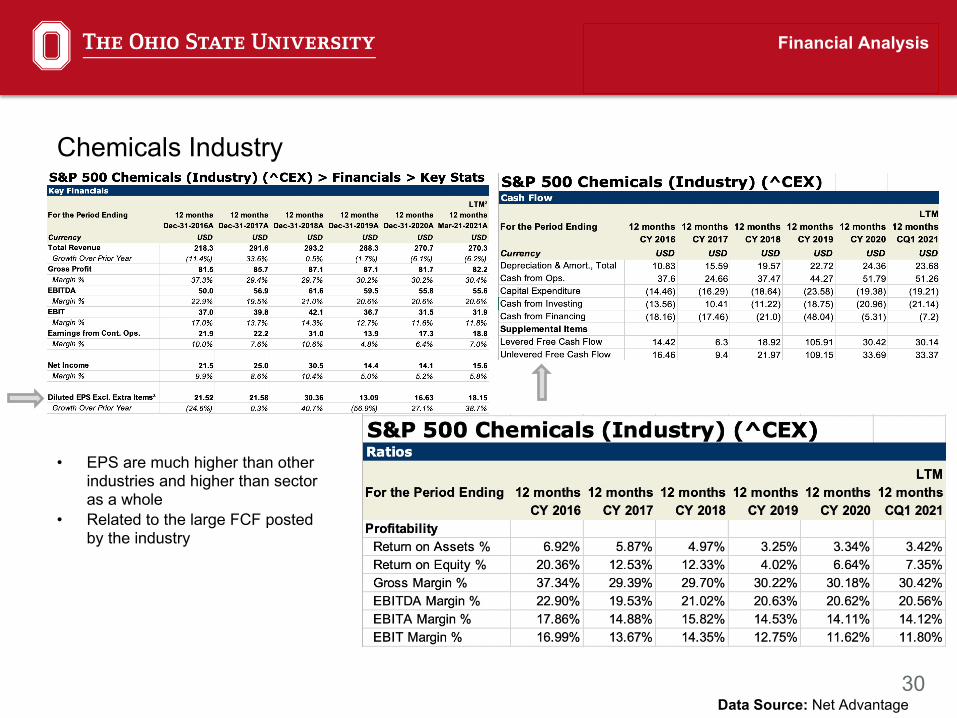
Chemicals Industry
• EPS are much higher than other industries and higher than sector as a whole
• Related to the large FCF posted by the industry
Data Source: Net Advantage
31
Financial Analysis
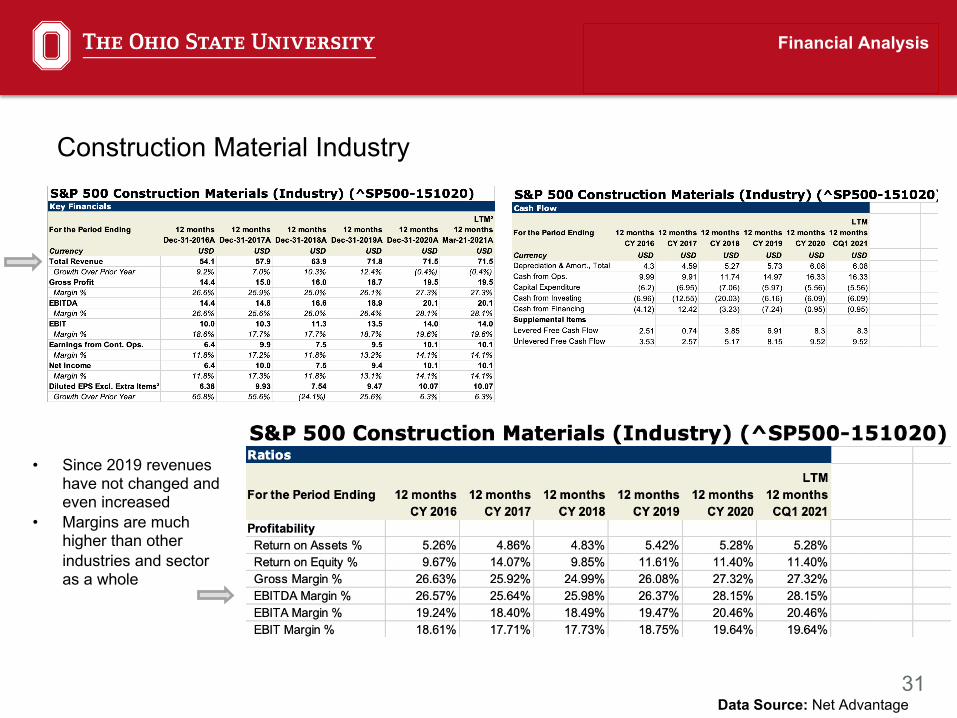
Construction Material Industry
• Since 2019 revenues have not changed and even increased
• Margins are much higher than other industries and sector as a whole
Data Source: Net Advantage
32
Financial Analysis
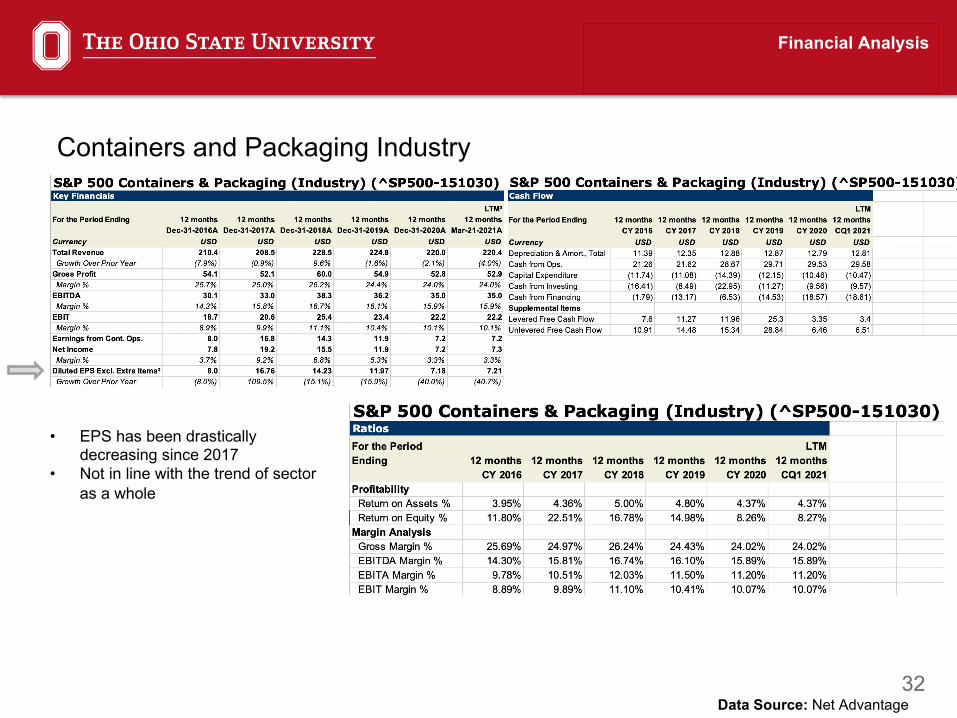
Containers and Packaging Industry
• EPS has been drastically decreasing since 2017
• Not in line with the trend of sector as a whole
Data Source: Net Advantage
33
Financial Analysis
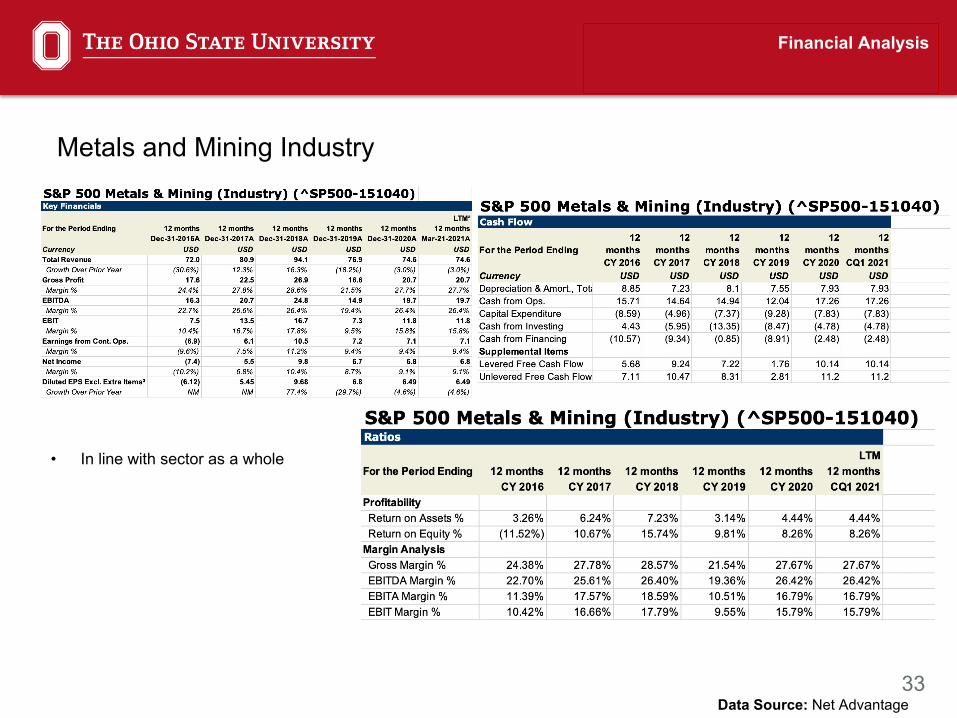
Metals and Mining Industry
• In line with sector as a whole
Data Source: Net Advantage
34
Valuation Analysis
35
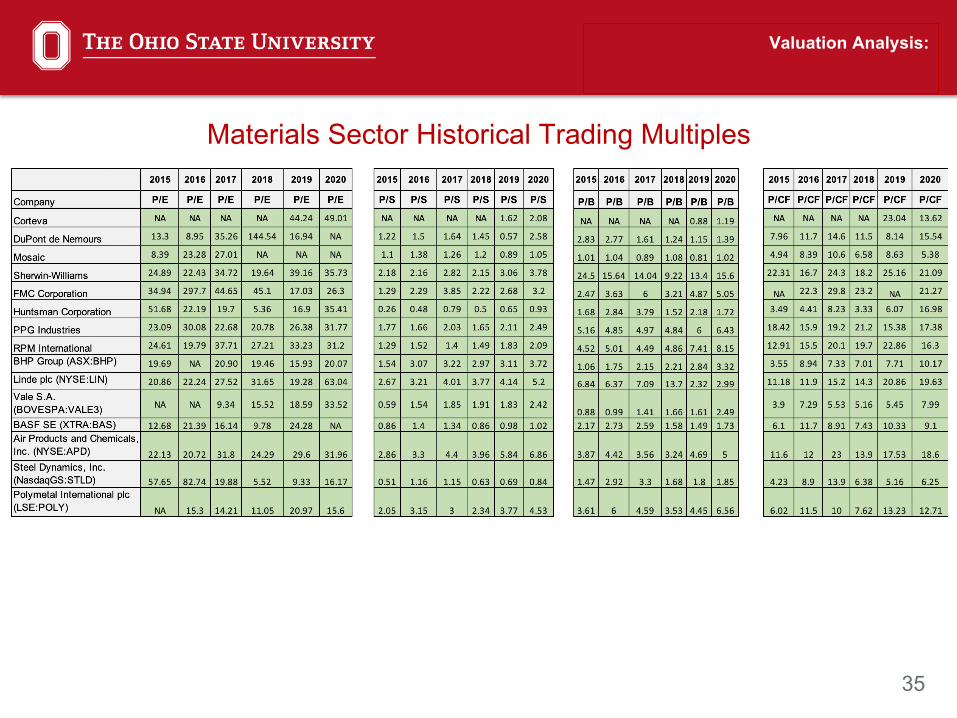
Valuation Analysis:
Materials Sector Historical Trading Multiples
36
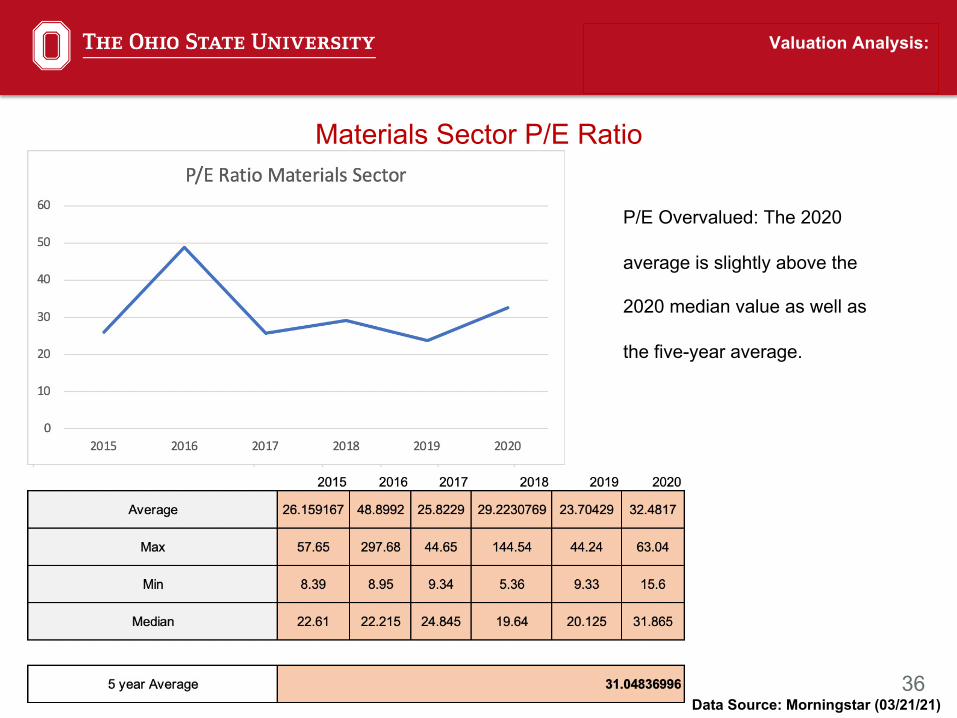
Materials Sector P/E Ratio
Valuation Analysis:
Data Source: Morningstar (03/21/21)
P/E Overvalued: The 2020
average is slightly above the
2020 median value as well as
the five-year average.
37
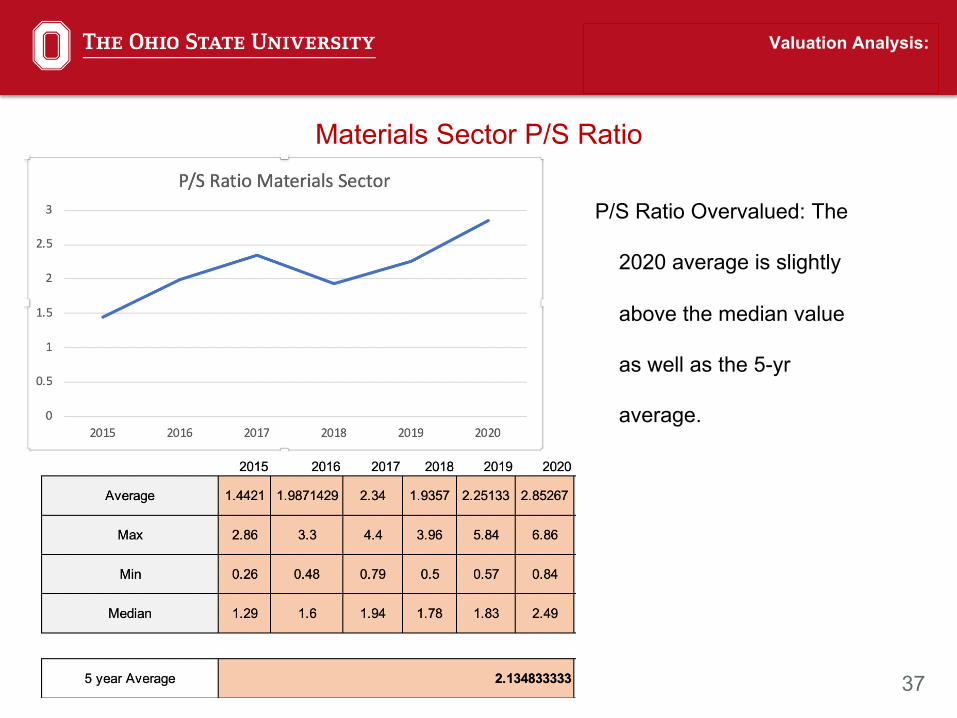
P/S Ratio Overvalued: The
2020 average is slightly
above the median value
as well as the 5-yr
average.
Valuation Analysis:
Materials Sector P/S Ratio
38
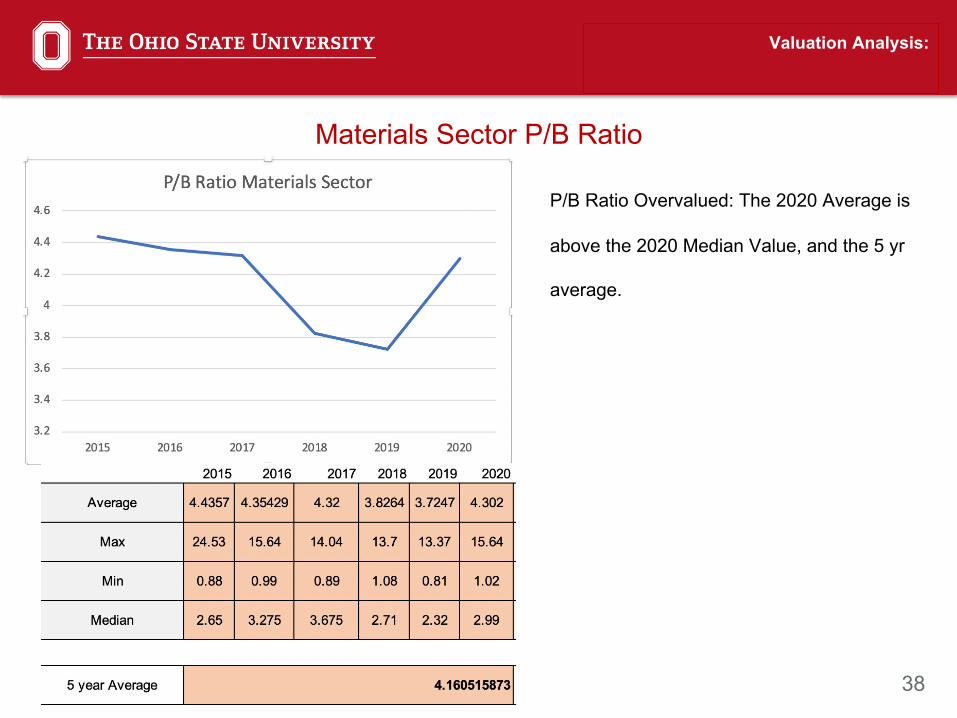
Valuation Analysis:
Materials Sector P/B Ratio
P/B Ratio Overvalued: The 2020 Average is
above the 2020 Median Value, and the 5 yr
average.
39
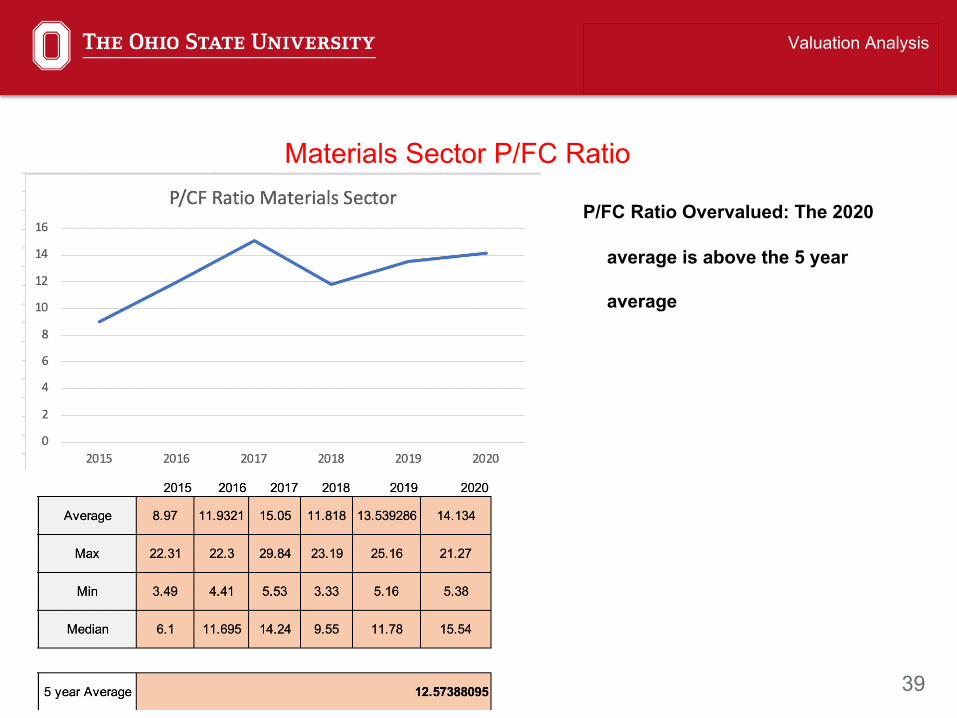
P/FC Ratio Overvalued: The 2020
average is above the 5 year
average
Valuation Analysis
Materials Sector P/FC Ratio
40
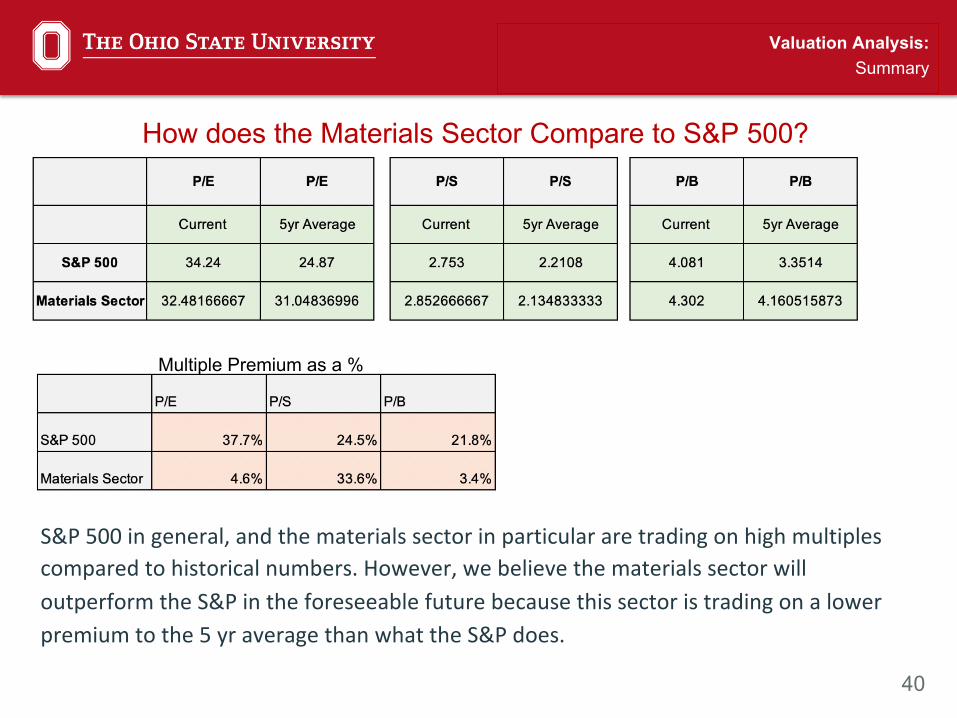
S&P 500 in general, and the materials sector in particular are trading on high multiples compared to historical numbers. However, we believe the materials sector will outperform the S&P in the foreseeable future because this sector is trading on a lower premium to the 5 yr average than what the S&P does.
Valuation Analysis:Summary
How does the Materials Sector Compare to S&P 500?
Multiple Premium as a %
41
Recommendation
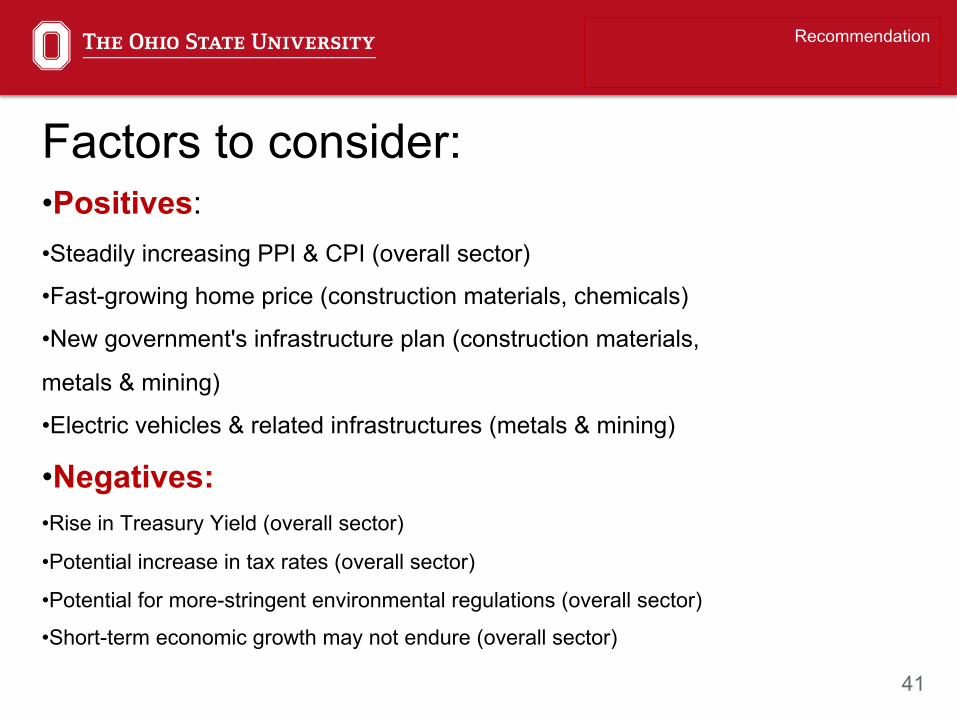
Factors to consider:•Positives:•Steadily increasing PPI & CPI (overall sector)
•Fast-growing home price (construction materials, chemicals)
•New government's infrastructure plan (construction materials,
metals & mining)
•Electric vehicles & related infrastructures (metals & mining)
•Negatives:•Rise in Treasury Yield (overall sector)
•Potential increase in tax rates (overall sector)
•Potential for more-stringent environmental regulations (overall sector)
•Short-term economic growth may not endure (overall sector)
42
Industry Insights
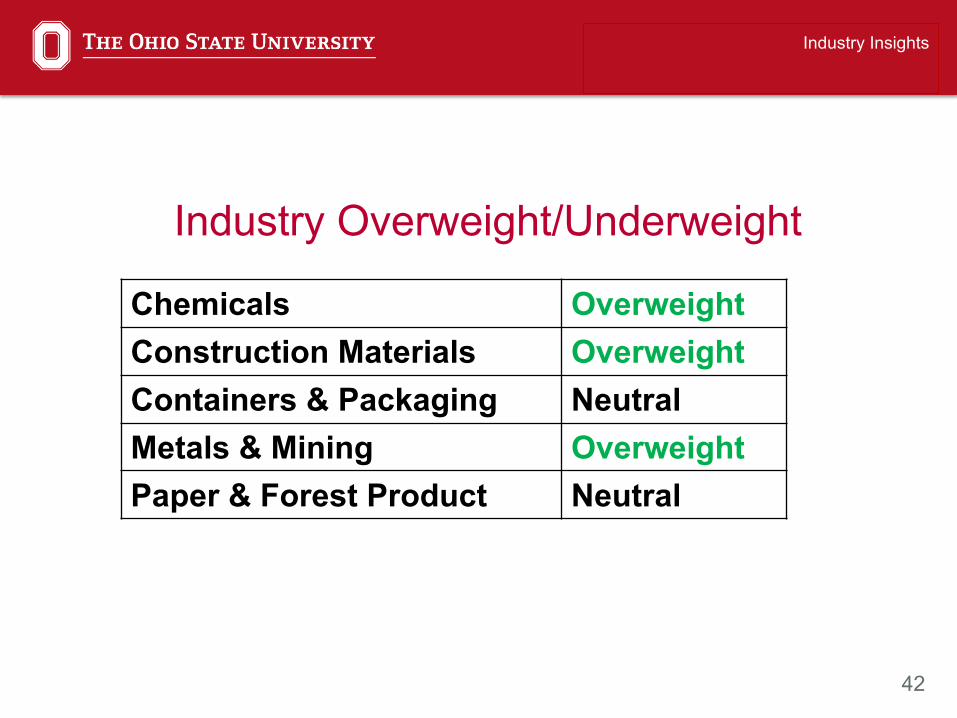
Industry Overweight/Underweight
Chemicals OverweightConstruction Materials OverweightContainers & Packaging NeutralMetals & Mining OverweightPaper & Forest Product Neutral
43
Recommendation
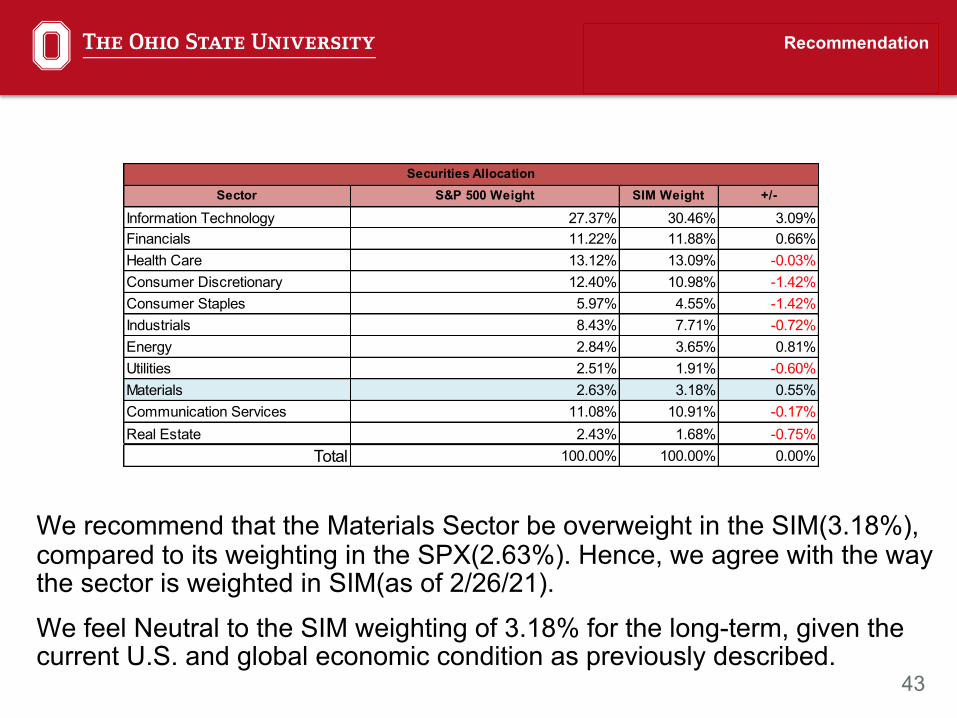
We recommend that the Materials Sector be overweight in the SIM(3.18%), compared to its weighting in the SPX(2.63%). Hence, we agree with the way the sector is weighted in SIM(as of 2/26/21). We feel Neutral to the SIM weighting of 3.18% for the long-term, given the current U.S. and global economic condition as previously described.
Sector S&P 500 Weight SIM Weight +/-
Information Technology 27.37% 30.46% 3.09%Financials 11.22% 11.88% 0.66%Health Care 13.12% 13.09% -0.03%Consumer Discretionary 12.40% 10.98% -1.42%Consumer Staples 5.97% 4.55% -1.42%Industrials 8.43% 7.71% -0.72%Energy 2.84% 3.65% 0.81%Utilities 2.51% 1.91% -0.60%Materials 2.63% 3.18% 0.55%Communication Services 11.08% 10.91% -0.17%Real Estate 2.43% 1.68% -0.75%
Total 100.00% 100.00% 0.00%
Securities Allocation

44
Recommendation
Q&A
Recommended