Material Flowin Japan
2006
Material Flowin Japan
2006
ReduceReuse
Recycle
1-2-2 Kasumigaseki, Chiyoda-ku, Tokyo 100-8975, JapanTel: +81-(0)3-3581-3351 (extension 6819); Fax: +81-(0)3-3593-826E-mail: [email protected]
Material Flow in Japan Published in March 2009
Office of Sound Material-cycle Society Policy Planning Division Waste Management and Recycling DepartmentMinister's SecretariatMinistry of EnvironmentGovernment of Japan
Ministry of the Environment
Government of Japan
Ministry of the Environment
Government of Japan

1
Overview of the Material Flow in JapanOverview of the Material Flow in Japan
(Note) Including water: Input of water included in waste and the like (sludge, animal manure, human waste, waste acid, and waste alkali) and sediment and the like associated with economic activities (sludge from mining, building and water works and tailing from mining).
Material Flow in Japan (in Fiscal Year 2006)
Imported Products (57)
Total Materials
Input(1,819)Domestic
Resources(778)
Including Water (See Note)
(290) Reduction (241) FinalDisposal
(29)
(Unit: Millions of Tons)
Export (170)
Net Additions to Stock (754)
Energy Consumption and Emissions from Industrial
Processes (494)Food Consumption (91)
Fertilizer (15)
Returned to Nature (85)
Generation of Waste, etc.
(583)
Amount of Cyclical Use (228)
Imported Resources
(756)
Import(813)
Natural Resources, etc.
Input(1,591)
The first step in building a sound material-cycle society is to understand the flows of materials (material flows) in the economic sector in terms of the resources extracted, consumed, and disposed of. By accurately understanding these flows, we can not only promote the reduced generation and cyclical use of wastes, but also apply this knowledge to the promotion of the efficient use of all materials input to society, thus making it possible to obtain information that is highly useful for formulating future policies.In the Second Fundamental Plan for Establishing a Sound Material-Cycle Society, which was decided by the Cabinet in March 2008, we added new targets to the indexes on “Inlet,” “Outlet,” and “Cycle,” which are different aspects of the material flows, in order to achieve the formation of a sound material-cycle society in which measures such as reduced generation, reuse, recycling, and appropriate disposal have been advanced in a balanced manner. This pamphlet presents an overall picture of the material flow in our country based on material flow accounts (MFAs); these MFAs enable us to identify the whole system of material flow in the economic sector of Japan, and provide overviews by item.
In the material flow in Japan in 2006, the quantities of domestic and foreign resources and products entering the economic sector (total amount of input materials) was 1.8 billion tons, of which 750 million tons (approximately half) were accumulated in the form of durable goods, buildings and social infrastructure. In addition, 170 million tons were exported in the form of products, 490 million tons were consumed as energy or emitted through industrial processes, and 580 million tons were produced as waste. Of this waste material, cyclical use accounted for 230 million tons, which represented 12.5% of the total amount of the input materials.

2
Explanation of the Items that Constitute the Material Flow
■ COLUMN : What is the Fundamental Plan for Establishing a Sound Material-Cycle Society?
The Fundamental Plan for Establishing a Sound Material-Cycle Society (hereafter called “Fundamental Plan for Sound Material Cycle”) was established in March 2003 (first plan), and revised in March 2008 (second plan), in accordance with the provisions of Article 15 of the Fundamental Law for Establishing a Sound Material-Cycle Society (Law No. 110 of 2000) in order to radically review the existing mechanism of social–economic activities based on mass production, mass consumption, and mass disposal and to establish a sound material-cycle society.The Fundamental Plan for Sound Material Cycle defines a concrete image of a sound material-cycle society that Japan aims to establish. Numerical targets, roles that the respective entities should play, and measures and actions to cope with wastes and promote recycling are being comprehensively and systematically taken in accordance with the plan.The numerical targets of the Second Fundamental Plan for Sound Material Cycle, which was revised in FY 2007, are described on page 14.
Item Explanation
Inlet Side
Total Materials Input - Sum of the amount of natural resources, etc. input and the amount of cyclical useNatural Resources, etc. Input - Sum of the domestic resources and amount of import
Domestic Resources - Amount of domestically extracted resources
Import - Amount of resources and products imported to JapanAmount of Cyclical Use - Amount of cyclical use excluding returned to nature
Including Water
- Amount of water not included in “natural resources, etc. input” but included in “waste, etc.”- Amount of accompanying inputs including soil that are related to economic activities
(sludge from the mining industry, construction industry, and water/sewage industry, and slag from the mining industry)
- Amount of air as part of industrial products taken in through industrial processesOutlet side
Export - Amount of resources and products exported from Japan
Net Additions to Stock
- Amount of materials newly accumulated in a given year such as civil engineering structures, buildings, and durable goods, which cannot be disposed of immediately, but are accumulated through economic activities, excluding those that are disposed of/turned into waste, etc. in the same year
Energy Consumption and Emissions from Industrial Processes
- Amount of exhaust gases or waste water from fossil and biomass resources (excluding waste, etc.) that are used as energy
- Amount of materials discharged as a result of substance change in industrial processes, such as oxygen reduced from iron oxide contained in iron ores and carbon dioxide separated from limestone
Food Consumption - Amount of human food and livestock feed excluding that directly converted to waste, etc. or converted after being consumed
Fertilizer - Amount of fertilizers spread on farmland
Generation of Waste, etc. - Amount of generated waste, etc.
Returned to Nature
- Amount of rice straw, wheat and barley straw, and husks that are directly plowed back into farmland, and of those returned to farmland after being used as spreads at animal manure
- Amount of animal manure returned to farmland without being treatedCyclical Use - Amount of cyclical use excluding those naturally returned
Reduction- Amount of materials reduced through intermediate treatment in order to treat waste,
etc. The wastes whose volumes are reduced at facilities equipped with waste power generators are included in this item, not in energy consumption.
Final Disposal - Amount of waste, etc. disposed of directly or after intermediate treatment

3
Details of the Material Flow in Our CountryDetails of the Material Flow in Our CountryIn this section, the material flow is divided into “Inlet” and “Outlet,” and the details are organized according to item.
The total amount of input materials on the inlet side includes [Domestic Resources] such as non-metallic minerals, [Import] such as imported resources and imported products, and [Amount of Cyclical Use].
Export
Energy Consumption
Emissions from Industrial Processes
Food Consumption
Fertilizer
Generation of Waste, etc.
Net additions to Stock
Outlet SideInlet Side
Import
Domestic Resources
Amount of Cyclical Use
Amount of Natural Resources, etc. Input
Total Amount of Input Materials
Including Water
Total Materials Input
(p.4)
(p.5)
(p.6)
(p.7)
(p.8)
(p.9)
(p.10)
(p.11)
(p.12)
Inlet Side
The total materials input in Japan in 2006 was 1.8 billion tons, consisting of 780 million tons (42.8%) of domestic resources, 760 million tons (41.5%) of imported resources, 60 million tons (3.1%) of imported products, and 230 million tons (12.5%) of cyclical use. 1.819
Billion Tonsin 2006*
DomesticResources
778(42.8%)
ImportedProducts
57(3.1%)
ImportedResources
756(41.5%)
Amount ofCyclical Use
228(12.5%)
* Sum of the total materials input excluding including water
4
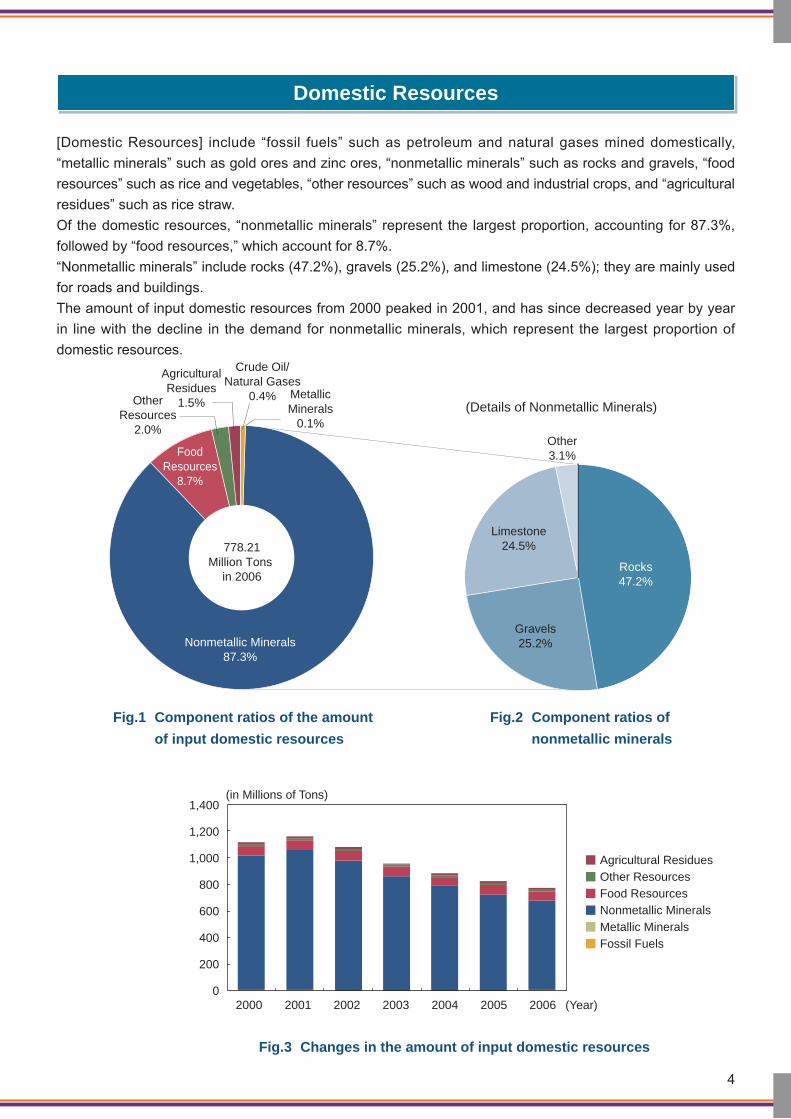
[Domestic Resources] include “fossil fuels” such as petroleum and natural gases mined domestically, “metallic minerals” such as gold ores and zinc ores, “nonmetallic minerals” such as rocks and gravels, “food resources” such as rice and vegetables, “other resources” such as wood and industrial crops, and “agricultural residues” such as rice straw. Of the domestic resources, “nonmetallic minerals” represent the largest proportion, accounting for 87.3%, followed by “food resources,” which account for 8.7%.“Nonmetallic minerals” include rocks (47.2%), gravels (25.2%), and limestone (24.5%); they are mainly used for roads and buildings. The amount of input domestic resources from 2000 peaked in 2001, and has since decreased year by year in line with the decline in the demand for nonmetallic minerals, which represent the largest proportion of domestic resources.
Domestic Resources
0
200
400
600
800
1,000
1,200
1,400
2000 2001 2002 2003 2004 2005 2006
Agricultural ResiduesOther ResourcesFood ResourcesNonmetallic MineralsMetallic MineralsFossil Fuels
(in Millions of Tons)
(Year)
Fig.1 Component ratios of the amount of input domestic resources
Fig.2 Component ratios of nonmetallic minerals
Crude Oil/Natural Gases
0.4%OtherResources
2.0%
AgriculturalResidues
1.5%
778.21Million Tons
in 2006
Nonmetallic Minerals87.3%
MetallicMinerals
0.1%
FoodResources
8.7%
Other3.1%
Rocks47.2%
Limestone24.5%
Gravels25.2%
(Details of Nonmetallic Minerals)
Fig.3 Changes in the amount of input domestic resources

5
Import
2000 2001 2002 2003 2004 2005 2006
Imported ProductsImported Resources
0
300400500600700
9001,000
100200
800
(Year)
(in Millions of Tons)
Other14.3%
755.63Million Tons
in 2006
Foods7.0%
Ores19.7%
NaturalGases8.4%
Crude Oil26.9%
Coals23.7%
[Import] is divided into “imported resources” including fossil fuels such as petroleum and coals and food resources such as meats and vegetables, and “imported products” such as clothing, furniture, and electric appliances. Regarding the changes since the year 2000, import decreased in 2001, increased thereafter, and have remained nearly flat since 2004.Of the “imported resources,” which account for over 90% of all import in 2006, there are 490 million tons of fossil fuels such as coals, petroleum, and natural gases; these fuels account for approximately two-thirds of these resources. Since there are only approximately 3.45 million tons of fossil fuels mined in Japan, our country depends on import from foreign countries for almost all of our energy needs.
Fig. 4 Change in the amount of import
Fig. 5 Details of the amount of imported resources

6
[Amount of Cyclical Use] are classified into “nonmetallic mineral based” such as rubble, slag, and dust, “biomass based” such as used paper and animal manure, “metal based” such as iron scrap and waste metals, and “fossil fuel based” such as waste plastics.Although the amount increased between 2001 and 2004, it has since remained nearly flat.As for the details of the amounts, “nonmetallic mineral-based” materials such as rubble, slag, and dust represent approximately 60% of the total amount, of which rubble represents the largest proportion (25.4%).
Amount of Cyclical Use
Fig. 6 Changes in the amount of cyclical use
Fig. 7 Details of the amount of cyclical use
0
50
100
150
200
250
2000 2001 2002 2003 2004 2005 2006
Biomass BasedNonmetallic Mineral BasedMetal BasedFossil Fuel Based
(in Millions of Tons)
(Year)
Other30.6%
227.87Million Tons
in 2006
IronScrap7.3%
Slag21.8%
Dust5.3%
Rubble25.4%
UsedPaper5.0%
WasteMetals4.6%

7
[Including Water] includes “including water such as waste, etc.,” which are regarded as water not contained in natural resources but contained in animal manure and sludge, “accompanying inputs” such as sludge produced from the mining, construction, and water supply industries and soil contained in slag, and “intakes as raw material of air,” which are collected in industrial processes and transformed into industrial products.The amount of these materials has remained nearly flat since 2000, and “including water such as waste, etc.” represent 99%.
Including Water
0
50
100
150
200
250
300
350
2000 2001 2002 2003 2004 2005 2006
Intakes as Raw Material of AirAccompanying InputsIncluding Water such as Waste, etc.
(in Millions of Tons)
(Year)
Fig. 8 Changes in the amount of including water
■ COLUMN : Method for Estimating Data on Import and ExportData on import and export are estimated along the flow indicated in the flow diagram shown on the right.
(1) Collection of Country CodesSince “Trade Statistics of Japan” of Ministry of Finance consist of data compiled according to articles and countries, this information can be collected and the data can be compressed.
(2) Conversion of Certain Articles in Terms of Weight Of certain articles whose volume units other than weight are supplemented, those articles whose units can be converted to weight if multiplied by a common coefficient are so converted.For example, in the case of wood, the conversion is performed by multiplying it by 0.5 ton per m3.
(3) Conversion of Articles Other than Certain Articles in Terms of WeightRegarding articles other than certain articles, data of those not supplemented wi th weight are converted in terms of weight . In pr inc ip le , the convers ion is performed by multiplying the weight unit price (t/Yen) created with data supplemented with weight by the transaction amount of data not supplemented with weight. Articles are classified using the first two digits of the respective article code provided in “Trade Statistics of Japan.”
Flow of Estimating Data on Import and Export
Data on Importand Export
Aggregation by Types
Conversion of ArticlesOther than Certain Articles
in Terms of Weight
Work File
Conversion of CertainArticles in Terms
of Weight
Collection ofCountry Codes
Trade Statistic Data Set
Conversion Factor forArticles Other than Certain
Articles from Price to Weight
Conversion Factor forCertain Articles from
Unique Unit to Weight

8
[Export] includes iron and steel, and exported machines, machinery, and foods.[Iron and Steel] represent the largest proportion at 40 million tons (22.7%), followed by [Export Machines] such as vehicles at 30 million tons (16.1%).[Other] includes wood pulp products, chemical industrial products, and miscellaneous goods such as fiber products and furniture.
Outlet Side
Export170
(8.0%)
Net Additionsto Stock
754(35.8%)
EnergyConsumption
and Emissionsfrom Industrial
Processes494
(23.4%)
FoodConsumption
91(4.3%)
Returnedto Nature
85(4.0%)
Fertilizer17
(0.8%)
Amountof Cyclical
Use228
(10.8%)Final
Disposal29
(1.4%)
Reduction241
(11.4%)
2.109Billion Tons
in 2006
The outlet side includes [Energy Consumption and Industrial Process Emissions], [Export] such as exported products, [Reduction], and [Amount of Cyclical Use] such as waste, etc., and [Net Additions to Stock], which are accumulated in the form of durable goods, buildings and social infrastructure.
Of the 2.1 billion tons of resources input in 2006, 750 million tons (35.8%) were accumulated in economic activities such as civil engineering structures and durable goods, and 490 million tons (23.4%) were discharged through energy consumption and substance change in industrial processes.In addit ion, 580 mil l ion tons (27.6%) were generated in the form of waste, etc., which included reduction of 240 million tons (11.4%) achieved through intermediate treatment of wastes.
Fig. 9 Details of the amount of export
Export
169.62Million Tons
in 2006
Other20.5%
Export Machines16.1%
Machinery7.0%
Iron andSteel
22.7%
Ores, Slag,and Ash
6.2%
PetroleumProducts12.1%
Salt, Sulfur, Soil, andStones; Plaster,
Coals, and Cement9.0%
OrganicChemicals
6.5%

9
[Energy Consumption] includes the amount of fossil fuels and biomasses (excluding waste, etc.) used as energy, while [Industrial Process Emissions] include CO2 separation from “limestone” and “dolomite,” and “separation of oxygen from iron ores.”Since 2000, the energy consumption and industrial process emissions have not significantly fluctuated.Of the details in 2006, the amount of energy consumption, which accounts for more than 80%, was 420 million tons. Fossil fuels represented 98% of the energy consumption, and the fossil fuels consisted of crude oil and petroleum products (43.8%), coals and coal products (37.8%), and natural gases (16.4%).
0
100
200
300
400
500
600
2000 2001 2002 2003 2004 2005 2006
CO2 Separationfrom DolomiteCO2 Separationfrom LimestoneEnergy Consumption
Oxygen Separationfrom Iron Ores
(in Millions of Tons)
(Year)
Fig. 10 Change in energy consumption and emissions from industrial processes
Fig. 11 Changes in energy consumption
Energy Consumption and Emissions from Industrial Processes
416.65Million Tons
in 2006
Natural Gases16.4%
Coals/Coal Products37.8%
CrudeOil/Petroleum
Products43.8%
Use of Biomassesas Energy
2.0%

10
[Food Consumption] is the amount obtained by subtracting the “amount of animal manure,” “amount of sewage sludge/amount of human wastes,” “reduction amount and final disposal amount of food wastes,” and “amount of recycled food wastes for use other than feeds” from the “amount of domestic supply of foods/feeds.” [Fertilizer] is the amount obtained by subtracting the “amount of export” from the value obtained by adding the “amount of import” to the “amount of domestic production of fertilizer.”The amount of [Food Consumption] in 2006 was 90 million tons, while the amount of [Fertilizer] was 20 million tons. Since 2000, the fertilizer amount has remained nearly flat, while the amount of food consumption has decreased by 5.8% from 2000.
Fig. 12 Flow of estimating food consumption
Fig. 13 Changes in the amount of food consumption and the amount of fertilizer
0
20
40
60
80
100
120
140
2000 2001 2002 2003 2004 2005 2006
FertilizerFood Consumption
(in Millions of Tons)
(Year)
Food Consumption/Fertilizer
Amount of FoodConsumption
Amount of Recycled FoodWastes for Use Other
than Feeds
Amount of DomesticSupply of Foods/Feeds
Amount of Animal Manure
Amount of Sewage Sludge/Amount of Human Wastes
Reduction Amount andFinal Disposal Amount
of Food Wastes
11
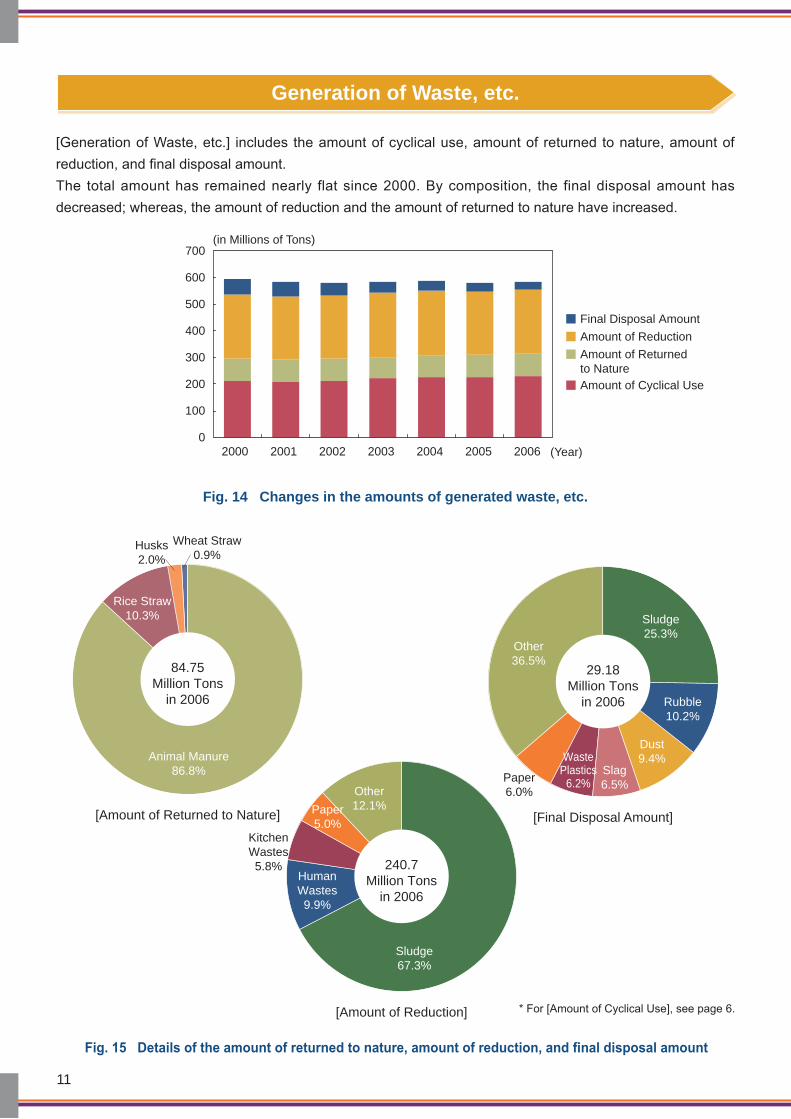
[Generation of Waste, etc.] includes the amount of cyclical use, amount of returned to nature, amount of reduction, and final disposal amount. The total amount has remained nearly flat since 2000. By composition, the final disposal amount has decreased; whereas, the amount of reduction and the amount of returned to nature have increased.
0
100
200
300
400
500
600
700
2000 2001 2002 2003 2004 2005 2006
Final Disposal AmountAmount of ReductionAmount of Returnedto NatureAmount of Cyclical Use
(in Millions of Tons)
(Year)
Fig. 14 Changes in the amounts of generated waste, etc.
Fig. 15 Details of the amount of returned to nature, amount of reduction, and final disposal amount
Wheat Straw0.9%
84.75Million Tons
in 2006
Husks2.0%
Rice Straw10.3%
Animal Manure86.8%
[Amount of Returned to Nature]
Other12.1%
240.7Million Tons
in 2006
Paper5.0%
KitchenWastes5.8%
HumanWastes9.9%
Sludge67.3%
[Amount of Reduction]
Other36.5%
29.18Million Tons
in 2006
WastePlastics
6.2%Slag6.5%
Dust9.4%
Rubble10.2%
Sludge25.3%
Paper6.0%
[Final Disposal Amount]
* For [Amount of Cyclical Use], see page 6.
Generation of Waste, etc.
12
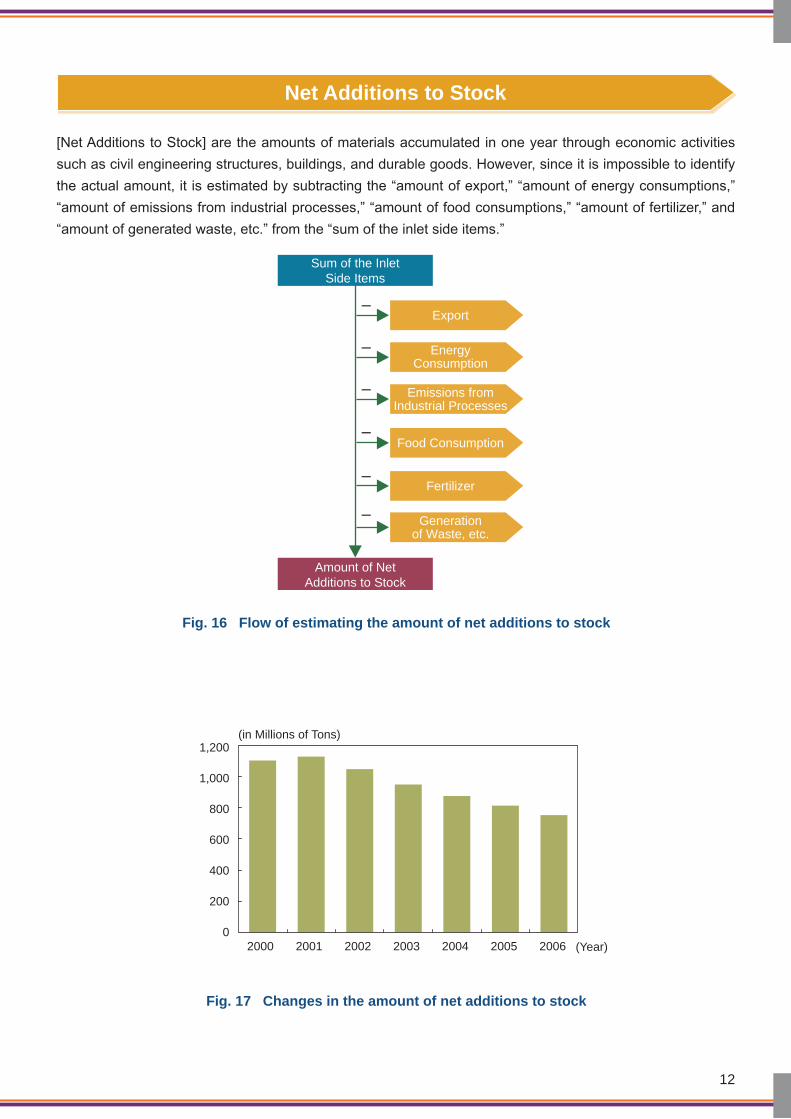
[Net Additions to Stock] are the amounts of materials accumulated in one year through economic activities such as civil engineering structures, buildings, and durable goods. However, since it is impossible to identify the actual amount, it is estimated by subtracting the “amount of export,” “amount of energy consumptions,” “amount of emissions from industrial processes,” “amount of food consumptions,” “amount of fertilizer,” and “amount of generated waste, etc.” from the “sum of the inlet side items.”
Fig. 16 Flow of estimating the amount of net additions to stock
Fig. 17 Changes in the amount of net additions to stock
0
200
400
600
800
1,000
1,200
2000 2001 2002 2003 2004 2005 2006
(in Millions of Tons)
(Year)
Net Additions to Stock
Amount of NetAdditions to Stock
Sum of the InletSide Items
Export
EnergyConsumption
Emissions fromIndustrial Processes
Food Consumption
Fertilizer
Generationof Waste, etc.

13
Material Flow 2006 Details and SourcesMaterial Flow 2006 Details and Sources
Item Quantity (in 10,000 tons) Source
Inlet SideDomestic Resources 77,821
Crude Oil/Natural Gases 345 - “General Energy Statistics” by Agency for Natural Resources and Energy
- “Yearbook of Mineral Resources and Petroleum Products Statistics” by Ministry of Economy, Trade and Industry
- “Result of Aggregating Reports on the State of Operations by Quarry Businesses” by Agency for Natural Resources and Energy
- “Aggregate Supply-Demand Table” from the website of the Japan Crushed Stone Association
Metallic Minerals 42Nonmetallic Minerals 67,937
Rocks 32,052Gravels 17,100Limestone 16,662Other 2,122
Food Resources 6,742- “Crop Statistics,” “Statistics on Production and
Shipment of Vegetables,” “Statistics on Production and Shipment of Fruits and Nuts,” “Statistics of Agriculture, Forestry and Fisheries,” “Statistics on Production and Shipment of Flowers,” and “Report on Supply and Demand of Lumber” by Ministry of Agriculture, Forestry and Fisheries
Other Resources 1,558
Agricultural Residues 1,197
- “Survey on the Study of Measures to Cope with Wide-Area Transfer of Wastes and Fact-Finding Survey on the Amount of Recycled Wastes (Chapter on Fact-Finding Survey on the Amount of Recycled Wastes)” by Ministry of the Environment
Import (Resources) 75,563
Fossil Fuels 44,594 - “General Energy Statistics” by Agency for Natural Resources and Energy
- Estimated from “Trade Statistics of Japan” by Ministry of FinanceCoals 17,910
Crude Oil 20,359
Natural Gases 6,326
Ores, Slag, and Ash 14,876
Foods 5,255
Other 10,837
Import (Products) 5,714
Chemical Industrial Products 1,277 - Estimated from “Trade Statistics of Japan” by Ministry of Finance
Base Metals and their Products 1,442
Machinery/Electric Appliances 724
Other 2,272Amount of Cyclical Use 22,787
Rubble 5,785 - “Survey on the Study of Measures to Cope with Wide-Area Transfer of Wastes and Fact-Finding Survey on the Amount of Recycled Wastes (Chapter on Fact-Finding Survey on the Amount of Recycled Wastes)” by Ministry of the Environment
Slag 4,977
Iron scrap 1,664
Dust 1,205
Used paper 1,133
Waste metals 1,045
Other 6,977
Including Water 28,997Including Water such as Waste, etc. 28,810
- “Survey on the Study of Measures to Cope with Wide-Area Transfer of Wastes and Fact-Finding Survey on the Amount of Recycled Wastes (Chapter on Fact-Finding Survey on the Amount of Recycled Wastes)” by Ministry of the Environment
Waste Acids 535
Waste Alkalis 254
Animal Manure 7,444
Sludge 18,162
Human Wastes 2,415
Accompanying Inputs 78 - “Survey on the State of Industrial Waste Discharge and Disposal” by Ministry of the Environment
Intakes as Raw Material of Air 109
- Estimated from the “Yearbook of Chemical Industry Statistics” by Ministry of Economy, Trade and Industry
Item Quantity (in 10,000 tons) Source
Outlet SideExport 16,962
Petroleum Products 2,060 - “General Energy Statistics” by Agency for Natural Resources and Energy
- Estimated from “Trade Statistics of Japan” by Ministry of Finance
Iron and Steel 3,854
Machinery 1,190
Transport Machines 2,727
Other 7,130Energy Consumption and Emissions from Industrial Processes
49,448
Energy Consumption 41,665 - “General Energy Statistics” by Agency for Natural Resources and Energy
- “Current Survey of Energy Consumption” and “Yearbook of Mineral Resources and Petroleum Products Statistics” by Ministry of Economy, Trade and Industry
- Estimated from “Trade Statistics of Japan” by Ministry of Finance
CO2 Separation from Limestone 4,004
CO2 Separation from Dolomite 28
Oxygen Separation from Iron Ores 3,751
Food Consumption 9,145Amount of Domestic Supplies of Foods and Feeds 12,565
Domestic Resources + Amount of Import – Amount of Export
(Portions to be Subtracted) 3,421 - Estimated from “Trade Statistics of Japan” by Ministry of Finance
- “Survey on the Study of Measures to Cope with Wide-Area Transfer of Wastes and Fact-Finding Survey on the Amount of Recycled Wastes (Chapter on Fact-Finding Survey on the Amount of Recycled Wastes)” by Ministry of the Environment
Amount of Animal Manure 1,314Amount of Sewage Sludge/Amount of Human Wastes 207
Amount of Reduction of Food Wastes and Final Disposal Amount
1,654
Amount of Recycled Food Wastes for Use Other than Feeds
247
Fertilizer 1,667“Pocket Guidebook on Fertilizers” by the Association of Agriculture & Forestry Statistics
Generation of Waste, etc. 58,250Amount of Cyclical Use (Re-published) 22,787
- “Survey on the Study of Measures to Cope with Wide-Area Transfer of Wastes and Fact-Finding Survey on the Amount of Recycled Wastes (Chapter on Fact-Finding Survey on the Amount of Recycled Wastes)” by Ministry of the Environment
Amount of Returned to Nature 8,475
Animal Manure 7,356Other 1,119
Amount of Reduction 24,070Sludge 16,193Human Wastes 2,383Kitchen Wastes 1,388Paper 1,199Other 2,908
Final Disposal Amount 2,918Sludge 737Rubble 297Dust 273Slag 189Waste Plastics 182Other 1,240
Net Additions to Stock 75,411
Sum of Inlet Side Items 210,883(Portion to be Subtracted)Sum of Outlet Side Items 135,472
Ministry of the Environment has prepared this document based on data from the following sources.

14
Three Targets in the Fundamental Plan for a Sound Material-CycleThree Targets in the Fundamental Plan for a Sound Material-CycleThe Fundamental Plan for Establishing a Sound Material-Cycle Society, which was decided by the Cabinet in accordance with the Fundamental Law for Establishing a Sound Material-Cycle Society (2000), has set numerical targets concerning “material flow indexes” for identifying the overall flow of materials in the economic sector in order to form a sound material-cycle society. Specifically, the plan has set an index for each of the three aspects of the material flows.
“Resource Productivity” is the index to comprehensively represent how effectively materials are used by industries and in people’s lives. Natural resources are limited in quantity, cause environmental loads when extracted, and finally become waste. Therefore, it is desirable that the GDP is effectively generated with a lower input of natural resources. That is, an improvement of resource productivity is desired.
“Cyclical use Rate” is the index to represent the percentage of the amount of cyclical use in the total amount of things input into an economic society. It is desirable, in principle, that this rate is increased, which means correct cyclical use is promoted to reduce the final disposal amount. The “total amount of things input into an economic society” is the sum of the natural resources input and the amount of cyclical use.
“Final disposal amount” is an index that directly concerns the urgent issue to face the shortage of landfill capacity at final disposal sites. Since the index is expressed as the sum of general wastes and industrial waste. That is, a decrease of final disposal amount is desired.
0
10
202530354045
1985(Fiscal year)
5
15
1990 1995 2000 2005 2010 2015
Res
ourc
e P
rodu
ctiv
ity(in
Yen
10,
000/
ton) [Target value]
Yen 420,000/ton
0
4
8
10
12
14
16
2
6
Cyc
lical
use
rate
(%) [Target value]
14 to 15%
1985(Fiscal year)
1990 1995 2000 2005 2010 2015
0
40
80
100
120
20
60
Fina
l dis
posa
l am
ount
(in M
illio
ns o
f Ton
s)
[Target value]23 million tons
1985(Fiscal year)
1990 1995 2000 2005 2010 2015
Inlet : resource productivity (= GDP/natural resources, etc. input).
Cycle : cyclical use rate (= cyclical use amount/(natural resources, etc. input + cyclical use amount))
Outlet : final disposal amount

Material Flowin Japan
2006
Material Flowin Japan
2006
ReduceReuse
Recycle
1-2-2 Kasumigaseki, Chiyoda-ku, Tokyo 100-8975, JapanTel: +81-(0)3-3581-3351 (extension 6819); Fax: +81-(0)3-3593-826E-mail: [email protected]
Material Flow in Japan Published in March 2009
Office of Sound Material-cycle Society Policy Planning Division Waste Management and Recycling DepartmentMinister's SecretariatMinistry of EnvironmentGovernment of Japan
Ministry of the Environment
Government of Japan
Ministry of the Environment
Government of Japan
Recommended