University of Nebraska - LincolnDigitalCommons@University of Nebraska - LincolnMechanical (and Materials) Engineering --Dissertations, Theses, and Student Research
Mechanical & Materials Engineering, Departmentof
10-31-2016
Material Evaluation: Self Damping Wire SD/ACSRConductor FailuresDaniel F. WeyerUniversity of Nebraska-Lincoln, [email protected]
Follow this and additional works at: http://digitalcommons.unl.edu/mechengdiss
Part of the Materials Science and Engineering Commons, and the Mechanical EngineeringCommons
This Article is brought to you for free and open access by the Mechanical & Materials Engineering, Department of at DigitalCommons@University ofNebraska - Lincoln. It has been accepted for inclusion in Mechanical (and Materials) Engineering -- Dissertations, Theses, and Student Research by anauthorized administrator of DigitalCommons@University of Nebraska - Lincoln.
Weyer, Daniel F., "Material Evaluation: Self Damping Wire SD/ACSR Conductor Failures" (2016). Mechanical (and Materials)Engineering -- Dissertations, Theses, and Student Research. 102.http://digitalcommons.unl.edu/mechengdiss/102

Material Evaluation: Self Damping Wire
SD/ACSR Conductor Failures
By
Daniel F. Weyer
A THESIS
Presented to the Faculty of
The Graduate College at the University of Nebraska
In Partial Fulfillment of Requirements
For the Degree of Master of Science
Major: Mechanical Engineering and Applied Mechanics
Under the Supervision of Professor Jeffrey E. Shield
Lincoln, Nebraska
October 31, 2016

MATERIAL EVALUATION: SELF DAMPING WIRE
SD/ACSR CONDUCTOR FAILURES
Daniel Fred Weyer, M.S.
University of Nebraska, 2016
Advisor: Jeffrey E. Shield
Following numerous 954 ACSR SD Wire failures from 2010 to 2012, Nebraska Public
Power District (NPPD) implemented an inspection program to determine the extent of
condition for this type of widely used conductor. Other companies which have had
related issues with similar types of corrosion have simply replaced their existing
insignificant miles of conductor; however NPPD transmission system includes over 2000
miles of this particular conductor. Throughout 2012, many other conductor spans were
discovered with either broken or missing steel wire in the bundled conductor.
Transmission line splices are installed every 15-20 spans, with failures being located in a
span containing a splice. NPPD worked with Kinectrics to complete electromagnetic
field inspections for three days in 2013, with retesting performed in 2015. Throughout
this inspection of 54 spans of conductor, 36 were found to have some level of
deterioration/corrosion ranging from marginal (5) to fair (1) to good (30).
Over 80% of the corrosion noted in the report was found on a conductor span containing
a splice; only 45% of the spans tested contain a splice. All of the failures occurred in
spans where a compression sleeve or compression dead-end was present. In all cases,
only the steel core broke internal to trapezoidal aluminum wire layers. The results of the
inspection indicated that there is a notable amount corrosion in more than 50% of the
spans inspected, mainly located in the middle 300 feet of the span. The corrosion is
“marginal” in a few locations, but generally not indicative of an acute problem.
Removal of spans testing “marginal” occurred in April 2015, along with the physical
evaluation of the conductor validating the results of the electromagnetic inspection tool.
Broken strands were found in all of the tested conductors scored as “marginal” following
removal 2 years after initial testing. None of the conductors were rated as poor, which
would indicate no imminent failures exist. Since none of these localized areas were in
poor condition, it could be several years before more frequent findings of broken wire
and related problems are observed.

i
Acknowledgements
To begin with, I would like to recognize Dr. Jeffrey Shield for being my advisor,
educating me on material transformations and X-Ray diffraction, and sharing his
principles on the topic of materials and material engineering.
I would like to also thank committee members: Dr. Bai Cui and Dr. Ram Bishu for
their time and advice regarding my research thesis.
I would like to show gratitude those at the Electric Power Research Institute
(EPRI) who have assisted with the development of this inspection program, Fabio
Bologna and Neal Murray.
I would like to acknowledge the financial support by my employer Nebraska
Public Power District (NPPD), for which this underlying material evaluation was made
possible. My coworkers working on this project Mark Fletcher, Leslie Svatora, Robert
Blessin, and Scott Fritz. Also my supervisor Marc Ronne, his support throughout my
many years in the master’s program here at UNL was very much treasured.
I would like to recognize those at Kinectrics that have assisted with the
evaluation and research for ACSR conductor assessment: Greg Albin, Andrew Rizzetto,
Phoebe Wang, and Craig Pon.
Finally, I would like to thank my wife Amber and children Keira, Aden, & Taygen
for their love and patience while putting in the extra time at work and school to complete
my master’s degree.

ii Table of Contents
Chapter 1 – History of Transmission Conductors ............................................................................ 1
1.1 Overhead Copper Conductor ................................................................................................. 1
1.2 Aluminum Conductor ............................................................................................................. 2
1.3 Aluminum-conductor Steel-reinforced (ACSR) ...................................................................... 3
1.4 ACSR Conductor Splicing ........................................................................................................ 5
Chapter 2 – NPPD Transmission Conductors ................................................................................... 7
2.1 Conductor Selection at NPPD................................................................................................. 7
2.2 Line Patrol Inspections ........................................................................................................... 8
2.3 NPPD ACSR/SD design, experience, and observations ........................................................ 10
Chapter 3 – Failure Analysis ........................................................................................................... 13
3.1 Extent of Condition .............................................................................................................. 13
3.2 EPRI Broken Strand Analysis ................................................................................................ 13
3.3 Experimental Techniques ..................................................................................................... 15
Chapter 4 – Conductor Evaluation Methods ................................................................................. 18
4.1 Conductor Corrosion Causal Factor Analysis ....................................................................... 18
4.2 Non-Destructive Testing Methodology ................................................................................ 20
4.3 Test Signal Data Correlation................................................................................................. 22
Chapter 5 – Conductor Examination (April 2013) .......................................................................... 25
5.1 Conductor Test Scope .......................................................................................................... 25
5.2 Inspection Corrosion Detection ........................................................................................... 26
5.3 Collective Inspection Results ............................................................................................... 27
Chapter 6 – Corrosion Sample Dissection - L2312 Middle............................................................. 31
6.1 Defective Conductor Lab Testing ......................................................................................... 31
6.2 Visual Inspection .................................................................................................................. 35
6.3 Overall Assessment .............................................................................................................. 39
Chapter 7 – Final Discussion .......................................................................................................... 40
7.1 Summary of Results ............................................................................................................. 40
7.2 Progress since initial examination ....................................................................................... 41
Chapter 8 References ..................................................................................................................... 43
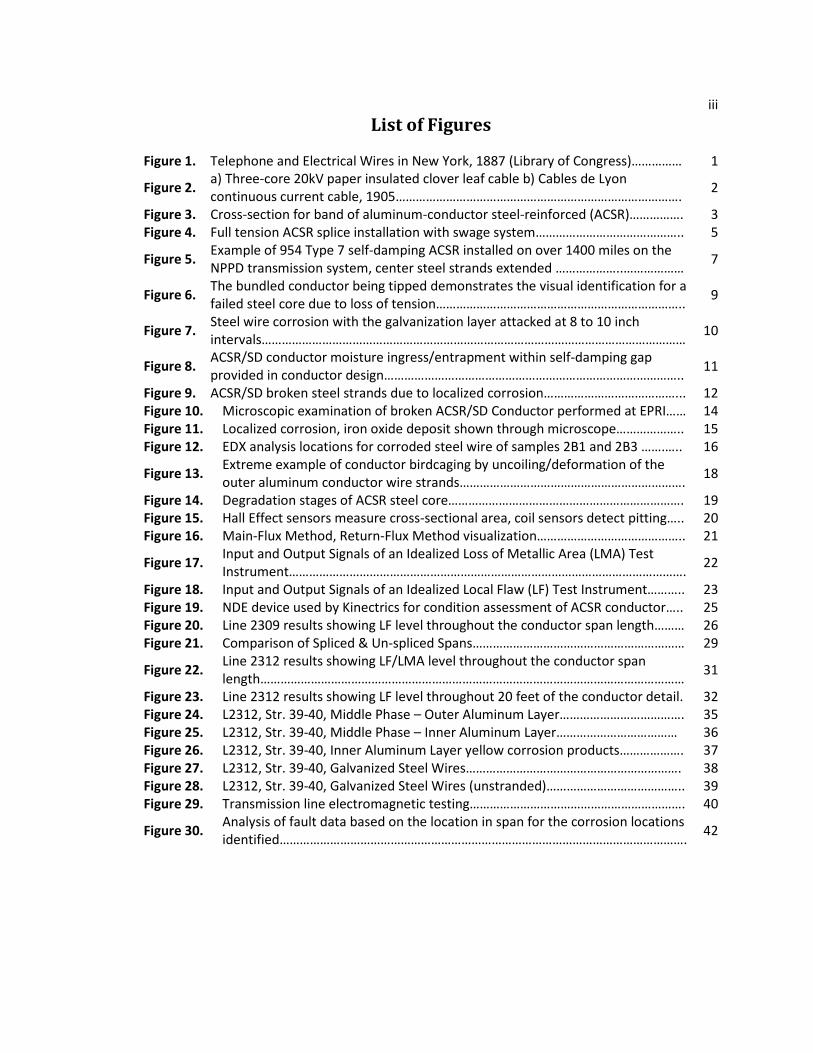
iii List of Figures
Figure 1. Telephone and Electrical Wires in New York, 1887 (Library of Congress)…………… 1
Figure 2. a) Three-core 20kV paper insulated clover leaf cable b) Cables de Lyon continuous current cable, 1905…………………………………………………………………………. 2
Figure 3. Cross-section for band of aluminum-conductor steel-reinforced (ACSR)……………. 3 Figure 4. Full tension ACSR splice installation with swage system…………………………………….. 5
Figure 5. Example of 954 Type 7 self-damping ACSR installed on over 1400 miles on the NPPD transmission system, center steel strands extended ………………..……………… 7
Figure 6. The bundled conductor being tipped demonstrates the visual identification for a failed steel core due to loss of tension……………………………………………………………….. 9
Figure 7. Steel wire corrosion with the galvanization layer attacked at 8 to 10 inch intervals……………………………………………………………………………………………………………… 10
Figure 8. ACSR/SD conductor moisture ingress/entrapment within self-damping gap provided in conductor design…………………………………………………………………………….. 11
Figure 9. ACSR/SD broken steel strands due to localized corrosion…………………………………... 12 Figure 10. Microscopic examination of broken ACSR/SD Conductor performed at EPRI…… 14 Figure 11. Localized corrosion, iron oxide deposit shown through microscope……………….. 15 Figure 12. EDX analysis locations for corroded steel wire of samples 2B1 and 2B3 …….….. 16
Figure 13. Extreme example of conductor birdcaging by uncoiling/deformation of the outer aluminum conductor wire strands…………………………………………………………. 18
Figure 14. Degradation stages of ACSR steel core……………………………………………………………. 19 Figure 15. Hall Effect sensors measure cross-sectional area, coil sensors detect pitting….. 20 Figure 16. Main-Flux Method, Return-Flux Method visualization…………………………………….. 21
Figure 17. Input and Output Signals of an Idealized Loss of Metallic Area (LMA) Test Instrument………………………………………………………………………………………………………. 22
Figure 18. Input and Output Signals of an Idealized Local Flaw (LF) Test Instrument……….. 23 Figure 19. NDE device used by Kinectrics for condition assessment of ACSR conductor….. 25 Figure 20. Line 2309 results showing LF level throughout the conductor span length……… 26 Figure 21. Comparison of Spliced & Un-spliced Spans……………………………………………………… 29
Figure 22. Line 2312 results showing LF/LMA level throughout the conductor span length……………………………………………………………………………………………………………… 31
Figure 23. Line 2312 results showing LF level throughout 20 feet of the conductor detail. 32 Figure 24. L2312, Str. 39-40, Middle Phase – Outer Aluminum Layer………………………………. 35 Figure 25. L2312, Str. 39-40, Middle Phase – Inner Aluminum Layer……………………………… 36 Figure 26. L2312, Str. 39-40, Inner Aluminum Layer yellow corrosion products………………. 37 Figure 27. L2312, Str. 39-40, Galvanized Steel Wires………………………………………………………. 38 Figure 28. L2312, Str. 39-40, Galvanized Steel Wires (unstranded)………………………………….. 39 Figure 29. Transmission line electromagnetic testing………………………………………………………. 40
Figure 30. Analysis of fault data based on the location in span for the corrosion locations identified…………………………………………………………………………………………………………. 42

iv List of Tables
Table 1. ACSR/SD Conductor types throughout the NPPD transmission system………………. 13 Table 2. Sectional remaining area following loss of galvanization, correlated to tensile
design strength remaining……………………………………………………………………………….…. 17
Table 3. Corrosion severity categories results summary………………………………………………….. 27 Table 4. Corrosion extent stage and severity categories…………………………………………….……. 32 Table 5. Galvanized steel wire tension and elongation L2312 middle phase……………….…… 33 Table 6. Galvanized steel wire remaining thickness for L2312 middle phase…………………… 34

1 Chapter 1 – History of Transmission Conductors
1.1 Overhead Copper Conductor
In the late 1800s large outdoor arc lighting systems were powered by high-
voltage (HV) alternating current (AC). Power transmission methodology resulted in the
War of Currents in determining the optimum system to transmit electricity from a
generating power plant[1]. Converting DC power to a higher voltage resulted in
increased difficulties and power losses, while power transformers designed for the AC
system had high efficiency and low maintenance. Power transmission from hydro
sources resulted in the adoption of the alternating current system.
Figure 1 - Telephone and Electrical Wires in New York, 1887 (Library of Congress)
The first high-voltage transmission line for three phase alternating current was
108 miles long connecting Frankfurt to Lauffen on the Neckar, operating at 15,000V[2].
For efficient power transmission, conductor cables were initially produced with copper
and insulated with paper through the turn of the century (Figure 1). Electric wiring has

2 been performed with copper since the invention of the telegraph, and the adoption of the
telephone created further demand for copper as an electrical conductor.
Figure 2 - a) Three-core 20kV paper insulated clover leaf cable b) Cables de Lyon continuous current cable, 1905
Benefits around the mechanical and electrical properties of copper resulted in it
being widely used throughout the generating facilities and power electrical grid, but for
power transmission superior options were considered in overhead conductor design.
Nearly half of all copper mined was used to manufacturer cable and electrical wiring by
the late 1800’s[3].
1.2 Aluminum Conductor
The strength-to-weight ratio for aluminum is 30% greater than copper, and the
conductivity-to-weight ratio is double as compared to copper(Figure 2). For all known
nonprecious metals, the volume conductivity of aluminum is second only to copper.
Aluminum conductor requires a 56% larger cross sectional area than copper for the
same current carrying capability[4].

3 The first aluminum stranded transmission line constructed by Connecticut
Electric in 1899 remained in service until the 1950’s[2]. It was quickly realized that the
strength-to-weight ratio for aluminum conductor was not enough in itself, resulting in the
development of an aluminum-steel composite cable. As electric power transmission
voltages increased, the conductor height followed since air was used for insulation. By
1914, operating voltage had increased to over 150,000V with more than fifty systems
operating above 70,000V[4]. Reinforcing the preferred aluminum stranded conductor
with the high strength of galvanized steel core helped in the electrification of the United
States throughout the 1920’s[5].
1.3 Aluminum-conductor Steel-reinforced (ACSR)
Reinforcing the high-purity aluminum conductor with steel allows for increased
mechanical tension to be applied. The strength of steel is higher than aluminum, but
offers a reduced elastic/inelastic deformation characteristic for mechanical loading due
to wind and ice. Aluminum-conductor steel-reinforced (ACSR) diminishes the amount of
sag as compared to conductors made solely out of aluminum (Figure 3).
Figure 3 - Cross-section for band of aluminum-conductor steel-reinforced (ACSR)

4 ACSR is not fully supported by the steel, therefore the tensile strength of the
aluminum limits the continuous operating temperature to the annealing temperature of
aluminum (75-100°C). On the other hand, aluminum-conductor steel-supported (ACSS)
depends entirely on the steel for the conductor strength allowing operating temperatures
up to 250°C[6].
Standard ACSR is manufactured with round strands of galvanized steel and an
even number of aluminum layers which helps to minimize hysteresis losses. The even
number of aluminum layers is due to atomic dipoles within the core steel. The altering
direction with induction from the 60Hz alternating current in the conductor results in
around a 10% lower ampacity rating due to hysteresis losses[7].
There are several variations to standard ACSR due to the overall economic
advantages and conductor design efficiency. These special ACSR variants include:
• Trapezoidal wire (TW) conductor – Variation of ACSR which provides trapezoidal
aluminum strands with a more compact design. TW conductor provides a nearly
20% greater cross-sectional area of aluminum conductor by “filling in the gaps” of
the round aluminum strands[7].
• Aluminum-conductor steel-supported (ACSS) – High temperature (200°C)
conductor made with annealed aluminum allows for lower tension reducing the
need for additional Stockbridge-type dampers[7].
• ACSR Self-Damping (ACSR-SD) – Provides a small annular gap between
conductor layers allowing the steel core and aluminum layers to vibrate at
different frequencies and impact damping. Reducing the tension, structure
height and need to Stockbridge-type dampers[7].

5 1.4 ACSR Conductor Splicing
With many transmission line lengths over 100 miles and standard reel package
size of around 3 miles (15,000 ft.), this requires numerous spliced connection locations.
Full tension splice installation involves measurement/cleaning preparations, swaging,
inspection, compound and plugs.
Figure 4 - Full tension ACSR splice installation with swage system
Spliced connections require high electrical current rating and physical strength to
ensure a weakened design point is not introduced[8]. The temperature of the splice
connector is lower than the bulk conductor with less resistance due to the increased
cross-sectional area for the splice connector design. Compression-type splice designs
are relatively inexpensive and easy to install.
Special two-piece splices are required for self-damping (ACSR-SD) as the gap
between the steel core and trapezoidal aluminum inhibits the compression force to reach
the steel core shown in Figure 4. The interior smaller splice for the core is installed first,

6 then the larger diameter splice is slide down over the aluminum and compressed. Splice
connections for ACSR-SD conductor are somewhat more intricate, making it more
difficult to obtain a solid splice connection.
Common origins for splice failures are insufficient wire prep/cleaning to eliminate
the aluminum oxide layer which has a high resistance, Aeolian vibration of the aluminum
strands near the end of the splice, and improper splice installation. Improper conducting
grease application, compression location within the splice, and compression forces are
likely causes for conductor compression splice failures.

7 Chapter 2 – NPPD Transmission Conductors
2.1 Conductor Selection at NPPD
Design and construction for new 230kV and 345kV lines was extensive in the
1970’s, and Nebraska Public Power District (NPPD) transitioned to the use of an
aluminum-conductor steel-reinforced (ACSR) conductor which provided for self-damping
(SD). The SD conductor was selected to dampen Aeolian vibration without the use of
external dampeners which allows for increased tension on transmission lines. Overall,
increased tension allowed designers to reduce the construction costs with longer span
lengths or lower tower heights.
Figure 5 –Example of 954 Type 7 self-damping ACSR installed on over 1400 miles on the NPPD transmission system, center steel strands extended
The 954 Type 7 SD ACSR which was installed in the 1970’s contains 21
trapezoidal aluminum strands and 7 steel strands (Figure 5). Following more than 30

8 years in service, NPPD began to have multiple steel strand failures on the SD/ACSR
conductor. Broken steel strands in the conductor are easily identified during line patrol
inspections since the conductor tension change results in the span to sag when
compared to neighboring spans. This type of ACSR has since been redesigned with 46
smaller circular aluminum strands, resulting in 3 layers of aluminum to better protect the
steel core strands.
2.2 Line Patrol Inspections
Throughout line patrol inspections in 2012, more than 4 additional miles of
corroded/failed conductor were identified (Figure 6). All of these locations were
ACSR/SD type conductor with failed transmission conductor being placed in service
during the late 1970’s and early 1980’s. Steel core conductor failed transmission lines
were constructed with final design tensions of 5,000 pounds; two-piece transmission line
splices connect the two ACSR/SD conductor reels during the original construction.
Prior to removal of the failed sections of conductor, a rare earth magnet test is
used to find the ferrous steel beneath the aluminum; this is performed to determine the
steel core contraction within the conductor bundle following a break for repair of the
composite conductor. Once this is determined, the damaged portion of the conductor is
removed and replaced to return the transmission line to service.

9
Figure 6 –The bundled conductor being tipped demonstrates the visual identification for a failed
steel core due to loss of tension
Corrosion has been noted adjacent to steel wire breaks, with the interior steel
wire found to be rusted and rather brittle throughout informal assessments. Preventive
line maintenance is greatly preferred as opposed to corrective line maintenance. A
planned removal of a transmission line from service during the spring or fall is ideal for
maintenance, repair, or replacement.

10 2.3 NPPD ACSR/SD design, experience, and observations
ACSR/SD is also known as a “gap conductor”, where the wire is specifically
designed such that there is an internal gap between the steel core and the first layer of
aluminum. This design feature helps to reduce the amount of tuned damping necessary
for wind-induced vibrations. The existence of mass (Stockbridge) dampers require
additional system outages for constant maintenance and repair on this system.
Throughout the past 40 years in service, the self-damping conductor has proven
to have less external vibration as there have been fewer hardware repairs for external
connections to the outer aluminum layer. In theory, the self-damping attribute results in
some internal vibration of the steel conductor separately from the aluminum layers. The
frequency of the steel wire vibration is not known, but is a function of the wire tension
and wind speed. Vibration may contribute to the corrosion spacing found in Figure 7.
Figure 7 – Steel wire corrosion with the galvanization layer attacked in 8 to 10 inch intervals
The first phase of the resulting corrosion appears to be the internal vibration of
the steel wire within the aluminum wire, which results in abrasion on the steel wires. The

11 galvanization layer on the steel wire has a thickness of around 0.002 inches. From
multiple dissections it has been observed that the abrasion intensifies approximately
every 8 to 10 inches as shown in Figure 7, which is roughly the same as the lay (or
rotation spiral) of the interior steel wire.
Removal of the galvanization layer is the first phase of the steel wire corrosion
and resulting failure, while the next phase appears to be ingress of moisture. The water
tightness of the aluminum is compromised near a compression splice as the outer
aluminum layer is deformed, resulting in a “birdcaging” effect where the aluminum layer
is uncoiled. This deformation allows moisture to seep into the annular gap which was
designed for damping. As shown in Figure 8, the moisture collects at the low point (i.e.
belly) of the span which is more tightly sealed as it is further from the splice and more
uniform. This hypothesis has been detected, as water has been “drained” in the past
while lowering the conductor down to the ground for repair or replacement.
Figure 8 – ACSR/SD conductor moisture ingress/entrapment within self-damping gap provided in
conductor design
Broken steel wire(s) such as those in Figure 9 were found on a span with a splice
installed. The outer layers of aluminum are quite homogeneous for many miles along

12 the conductor, but the connection points appear to indicate a likely failure point. Once
the protective zinc layer has been eroded from the steel and an electrolyte has been
introduced, a galvanic corrosion cell may occur.
Figure 9 – ACSR/SD broken steel strands due to localized corrosion
Dissection analysis revealed that general uniform corrosion does not occur, but
instead the corrosion is localized with a distinct pattern with a reduced amount of
intensity each 8-10 inches for a few recurrences until the corrosion is completely absent.
As an individual outer steel strand rotates around the center strand, it contacts the
moisture, then exits and contacts the aluminum, then again regains contact with the
electrolyte[10]. Conductor dissection revealed some zinc-oxide on the steel surface
away from the isolated aggressive corrosion locations, but in general the Zinc appears to
be intact protecting the steel.

13 Chapter 3 – Failure Analysis
3.1 Extent of Condition
As shown in Table 1, NPPD has over 1800 miles of the problematic ACSR/SD
conductor energized throughout the state of Nebraska. Mass replacement of the
problematic conductor is not an option, as this replacement can run upwards of $60,000
per mile, bringing the total cost to more than $100 million. Replacement expense would
need to be distributed over at least 20 or more years to decrease the impact for
replacement of the conductor.
Table 1 - ACSR/SD Conductor types throughout the NPPD transmission system
3.2 EPRI Broken Strand Analysis
Broken conductor samples which have been removed from service were sent to
the Electric Power Research Institute (EPRI) for a laboratory analysis. A macroscopic
visual examination of the failed specimen shows corrosion products on the steel strands,
varying from blackish-brown to reddish-brown. The surface was found to be heavily
pitted near the failed section; away from this section the surface has white zinc oxide
deposits while the pH was found to be neutral[12].
Airborne particulates in the rural area of the failed conductor are apparent due to
the surrounding agricultural production. Transmission structure variations, vegetation
type, and terrain anomalies were noted in the EPRI report[12]. Location specific

14 differences in environment were not found to be significant, and similar environmental
conditions exist in areas which are not overcome by ACSR/SD conductor failures.
EPRI performed a microscopic examination shown in Figure 10 for the core
strands; although it is unclear which layer of the galvanizing is exposed[12]. Trace
amounts of zinc and zinc oxide with outer steel sections showing signs of iron oxide
deposits. These surface anomalies include no less than four iron oxide deposit types
along with heavy localized corrosion contributing to the indication of trapped moisture.
Figure 10 – Microscopic examination of broken ACSR/SD Conductor performed at EPRI
According to the EPRI report[12], surface anomalies were noted throughout the
steel core sample and many different iron oxide deposit types which show heavy
localized corrosion (Figure 11). Film thickness in samples ranged from 5-7 microns for
the steel strand diameter of 0.0971 inches. The oxide film types observed were;
red/black powder Iron Oxide (Magnetite Fe3O4), brown Iron Hydroxide (Goethite
FeO(OH)), white Iron Hydroxide II (Fe(OH)2), and red/brown Iron Oxide III (Hematite
Fe2O3).

15
Figure 11 - Localized corrosion, iron oxide deposit shown through microscope
Initial pitting of the steel wire was likely due to mechanical damage and/or
localized stresses near the compression splice, while vibration following installation
could damage the passive film to expose the metal surface. Free ends of the ACSR
conductor stored on reels have increased vulnerability to environmental conditions to
introduce reactive products.
The localized pitting corrosion of the steel wire is an electrochemical oxidation-
reduction process occurring deep within the galvanization layer. Anodic reactions within
the pit resulted in the dissolution of iron (Fe Fe2+ + 2e-) with discharged electrons
reacting with the electrolyte engulfing the pit. Electrolyte pH levels adjacent to the pit
and the anode to cathode ratio result in further acceleration of the corrosion. The
corrosion product Iron Oxide III (Fe2O3) forms around the pit.
3.3 Experimental Techniques
Linear polarization resistance (LPR) measurements were taken for these steel
core samples with a measured potential of -149.3 mV utilizing deionized water. This
technique monitors the existing relationship between the current from charged electrons
and the electrochemical potential to the estimate the polarization resistance and in turn
the corrosion rate. The reaction rate or corrosion current is assumed to be proportional
to for an anodic and cathodic reaction.

16 Table 2 - Sectional remaining area following loss of galvanization, correlated to tensile design
strength remaining
The corrosion rate determined throughout the LPR measurements was found to
be slightly less than 1 mil-per-year (mpy), as compared to the approximately 49 mil
radius for the steel core.
With the assumption that the galvanizing is worn away, extrapolating the sample
corrosion rates of 0.936 mils-per-year shows that the strength remaining is around 60%
of the original design strength as shown in Table 2. Without the consideration for
potential wind, ice, or amp-hour loading, the initial line tension is typically set around
25% of the rated strength. Design loading with other load factors result with the steel
core accounting for nearly 50% of the overall rated strength.
Energy-dispersive X-ray spectroscopy (EDX) analysis was performed on the
broken portion of the steel core strands. EDX testing performed stimulates X-ray
emission from the steel strands, the difference in results in higher and lower energy
shells are released in the form of an X-ray. Samples were ground with alcohol instead of
water to avoid removal of any water soluble corrosion products during the grinding
process. Steel strand samples were not mounted in epoxy prior to grinding.

17 EDX analyses resulted in chlorides and sulfates being found within the oxide
formations. The concentrations were found to be 2,400 ppm for chlorides and 2,200
ppm for sulfates. The heightened sulfur and chloride anion levels within the steel strands
influences corrosion. Both chlorides and sulfates are electron acceptors and
depolarization changes the interaction within the corrosion cell. Cathodic cells lose
electrons, essentially accelerating the oxidation process.
Figure 12 - EDX analysis locations for corroded steel wire of samples 2B1 and 2B3
Monitoring of locations susceptible to corrosion was also performed in
conjunction with this analysis from EPRI[12]. The source of chlorides and sulfates is
uncertain, but a nearby fossil plant or heavy road salting may be the source of chlorides.
Further testing to understand the effects of the permeated anions is necessary to
associate actual service life with the extrapolated data.

18 Chapter 4 – Conductor Evaluation Methods
4.1 Conductor Corrosion Causal Factor Analysis
Conductor analysis up to this point has been performed in a destructive manner
with the removal of corroded conductor. For the many failed steel core strands thus far,
each has arisen in a transmission span that include a compression splice. Line splices
typically occur every 15 to 20 spans, and generally exist on less than 10% of all circuit
spans on the transmission system.
Figure 13 - Extreme example of conductor birdcaging by uncoiling/deformation of the outer aluminum conductor wire strands
Line technicians installing splices need to ensure that the conductor is
adequately sealed along with confirming that “birdcaging” has not occurred on either
side of the splice (Figure 13). Incorrect conductor/strand tension or loss of conductor
bundle rotation can result in birdcaging at spliced locations, resulting in increased
abrasion potential, water capture, and exposure of the steel strands to the environment.
The zinc galvanization layer on the steel strands delays the base metal
deterioration, although this protective film wear from years of abrasive erosion and
exposure to the environment. Visual inspection of ACSR conductor through our
binocular or helicopter inspection programs is quite ineffective due to the issues
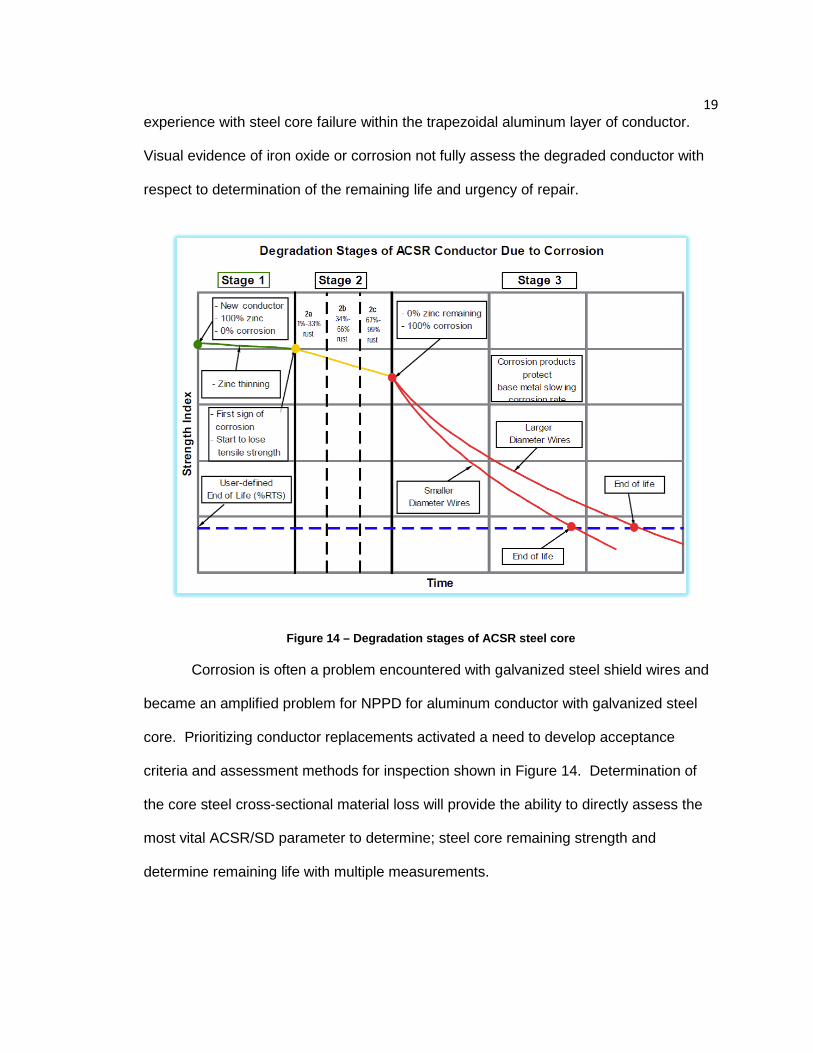
19 experience with steel core failure within the trapezoidal aluminum layer of conductor.
Visual evidence of iron oxide or corrosion not fully assess the degraded conductor with
respect to determination of the remaining life and urgency of repair.
Figure 14 – Degradation stages of ACSR steel core
Corrosion is often a problem encountered with galvanized steel shield wires and
became an amplified problem for NPPD for aluminum conductor with galvanized steel
core. Prioritizing conductor replacements activated a need to develop acceptance
criteria and assessment methods for inspection shown in Figure 14. Determination of
the core steel cross-sectional material loss will provide the ability to directly assess the
most vital ACSR/SD parameter to determine; steel core remaining strength and
determine remaining life with multiple measurements.

20 4.2 Non-Destructive Testing Methodology
The ability to inspect transmission assets and verify rates of deterioration to
determine the design margin remaining helps a utility make good decisions. Non-
destructive testing to assess the condition of the interior steel strands is a desirable
capability. This non-destructive sensing head was developed by Kinectrics to inspect
steel ropes for the mining industry, but reconfigured for remote travel along energized
transmission lines of up to 500kV for conductor assessment. Lab verification by EPRI is
outlined in a December 2012 report[13], which was designed to detect loss of metallic
area and local flaws in steel strands surrounded by aluminum in ACSR.
Figure 15 – Hall Effect sensors measure cross-sectional area, coil sensors detect pitting
Point discontinuities cause the magnetic flux to leak radially from the steel when
a flaw is discovered; sensors detect the magnetic flux leakage and measure the
magnetic flux. The sensing head saturates the steel conductor core with a magnetic flux
using permanent magnets shown in Figure 15.

21 The proportional relationship of the cross-sectional area of steel and flux
introduced by the permanent magnet resulted in a NDE method to detect pitting, broken
strands, and quantitatively measure the gross loss of steel cross sectional area[9]. As
the device travels along the ACSR conductor, average Loss of Metallic Area (LMA)
measurements and Local Flaw (LF) detect severe pitting or broken steel wires and are
captured with resolution down to an inch[14]. Fluxgate sensors (Hall sensors) need to
be inserted directly into the magnetic flux path such that the sensors require intersection
with the flux[15].
Instrumentation using fluxgate sensors indirectly determine the axial flux for the
ACSR conductor. Some flux density external to the ACSR conductor is measured,
which is then used to estimate the longitudinal conductor flux. The coil must encompass
the ACSR conductor, the annular coil provides uncommon resolving power and signal
fidelity to verify accuracy.
Figure 16 – Main-Flux Method, Return-Flux Method visualization
The Return Flux Method uses Hall Sensors to quantify the magnetic flux
surrounded by the magnetic return pathway of the instrument[11]. Outside stray flux

22 along with the average axial flux with the ACSR conductor, providing a method to
estimate the average cross-sectional area for the conductor within the sensor head[14].
The flux gate sensors can be located in the air gap between the ACSR conductor and
permanent magnets poles or as shown in Figure 16 at the interior of yoke plate for the
magnetic device assembly.
4.3 Test Signal Data Correlation
In interpreting outcome for the test, correlations between the response signal,
and the actual ACSR condition the device operator must understand the equipment
capabilities and limitations. ACSR degradation characteristics found through strand
dissection is vital to determine the current status of the steel core. The sensor head
produces several electrical signals, detecting step changes for the steel core cross-
sectional area.
Figure 17 – Input and Output Signals of an Idealized Loss of Metallic Area (LMA) Test Instrument
Interpretation of LMA signal output is much less straightforward for inspection
equipment operators, LMA signal overshoot can cause equivocal measurements. Data

23 resolution and scan length for LMA will determine the length for anomaly detection, the
signal averaging length results in the loss of data definition. Significant steel
deterioration throughout a relative short distance will essentially be unnoticed through
the LMA analysis[14].
This step change is referred to as a fundamental defect, resulting in a step
response of the LMA and LF signals. The LF sensor signal approximates the first
derivative of the cross-section for the ferrous steel strand for most test equipment. The
alternate LF signal shown in Figure 18 depicts the second derivative for the steel core
cross section[11]. The modeling performed with the high-pass filter operation
emphasizes the fast changes in signal which indicate corrosion pitting and broken steel
core strands.
Figure 18 – Input and Output Signals of an Idealized Local Flaw (LF) Test Instrument
Early detection of corrosion for susceptible conductor sections is necessary to
ensure electrical clearances and eliminate unplanned conductor repair. Initial and
periodic electromagnetic inspections are effective to assess the health of self-damping

24 ACSR conductor. Corrosion pitting of the steel wire causes stress concentrations,
eventually resulting in the rapid deterioration of the steel wire. Internal steel wire breaks
will be undetected until the eventual failure of the entire steel core, which results in the
loss of symmetry of the different conductor phases.
In determining the overall health for a given conductor span, other factors such
as the relative circuit importance, availability for maintenance, and standby availability all
help to determine the relative importance for a conductor span. The estimated
remaining life found does not have sensitivity for these factors, and is simply a sign of
the degradation. Results indicating corrosion require evaluation on a case-by-case
basis to optimize the capital improvement budget.

25 Chapter 5 – Conductor Examination (April 2013)
5.1 Conductor Test Scope
Non-destructive examination for conductor still in service is desired without
removal, Kinectrics was contracted. Susceptible similar conductor locations and sizes
were selected, with some including an in-line splice. The goal of the initial inspection is
to carry out a susceptibility analysis for conductor spans with and without a compression
splice connector. Confirmatory test results are expected to show degradation only on
spans which have a compression splice.
Figure 19 – NDE device used for condition assessment of ACSR conductor
The inspection device shown in Figure 16 travels down the conductor bundle at
approximately 150 feet/minute gathering data to detect anomalies, driving down the line
and back for abnormality confirmations. This machine is connected wirelessly to a
laptop on the ground, live data streaming for the technician operating the device.
Calibration is also performed for the tested conductor type prior to operation.

26 Following a thorough review of susceptible transmission lines and available line
outages, 54 conductor spans were selected to determine extent of condition. Locations
identified were scheduled for line outages to provide access for the field inspection
device occurring in April 2013. The initial 54 inspections performed on conductor spans
varying mostly from 700 feet to 1000 feet of inspected length; the Kinetrics reports[15]
are referenced in this analysis, being evaluated in their entirety.
5.2 Inspection Corrosion Detection
The transmission line test equipment travels the line with both LMA and LF
measurements output. The LF channel detects localized faults presumed to be broken
steel wire strands or corrosion pitting. Signal measurement amplitude ranges from 0 to
+/- 30,000 with the scale adjusted for correlation to the category range[16].
Figure 20 - Line 2309 results showing LF level throughout the conductor span length
LMA data points were also collected throughout this analysis, generally the
averaging length of the LMA masked the concentrated pitting found. The 40 year old
conductor had not experienced general corrosion throughout the steel strand, but
instead the concern is aggressive localized corrosion. Areas with notable levels of LF

27 amplitude typically resulted in some adjacent areas with LMA detecting reduced cross-
sectional area of all steel wires[16].
5.3 Collective Inspection Results
Non-destructive examination of the ACSR conductor located many instances of
heavy surface rust with medium levels of pitting. Throughout these inspections, 18
tested conductor bundles did not exhibit signs of corrosion. It is important to note that 17
of the 18 spans which did not have signs of corrosion did not contain a splice. Over 95%
of the spliced spans revealed signs of corrosion as only one (1) spliced conductor span
was corrosion-free out of the 24 spans analyzed in Table 3[16].
Table 3 - Corrosion severity categories results summary
Comparing this to the 30 non-spliced spans, only 13 exhibited signs of corrosion.
Corrosion analysis on this small sample size shows that 44% of non-spliced sections
were diagnosed with lower levels of corrosion. This original theory regarding splice
locations being more susceptible to corrosion or failure appears to be correct.
Corrosive signs that were noted included a severity rating from “poor” to “very
good”, with “very good” showing no signs of corrosion. For the 5 locations identified as

28 “marginal”, four (4) of them included a splice in the span. For these locations identified
in the analysis, the “marginal” typically suggests that either a deep corrosion pit or a
broken strand exists, resulting in only 6 steel strands in tension[17].
Overall, around 10% of the total tests spans were found in the fair or marginal
category where the potential exists that steel core galvanized protection is lost.
According to the LPR measurements in the EPRI analysis discussed previously, cross
sectional thinning is beginning to occur on some spans with 15 years of remaining
service life. A significant ice or winding load on the conductor will likely break the core
steel for many of these weakened conductor spans.
Following a review of the 6 spans which were either marginal or fair in severity
[Table 3], with most occurring near the midpoint (i.e. low-point or belly) of the span.
• Marginal - Outer surface of the steel strands likely has heavy surface rust with
medium pitting. The extent of corrosion is estimated with approximately 33%
loss of the zinc galvanizing layer, with indicated localized total loss with the base
metal being exposed.
• Fair – Significant low frequency amplitude was indicated near the midpoint of the
span for a distance of 20 feet. Again, the extent of corrosion was estimated to be
a loss of approximately 33% of the zinc galvanizing layer, with some localized
exposure of the base metal.
For locations with splices, the corrosion points ranged from 8 to 100 feet away from
the existing splice within the span. An indication of corrosion was frequently noted on
the downhill side of the splice occurring basically between the splice to the low-point of
29 the span. Instances of corrosion were often found throughout the spans with “good”
rated severity either near the mid/low-point of the span or near a splice if one existed.
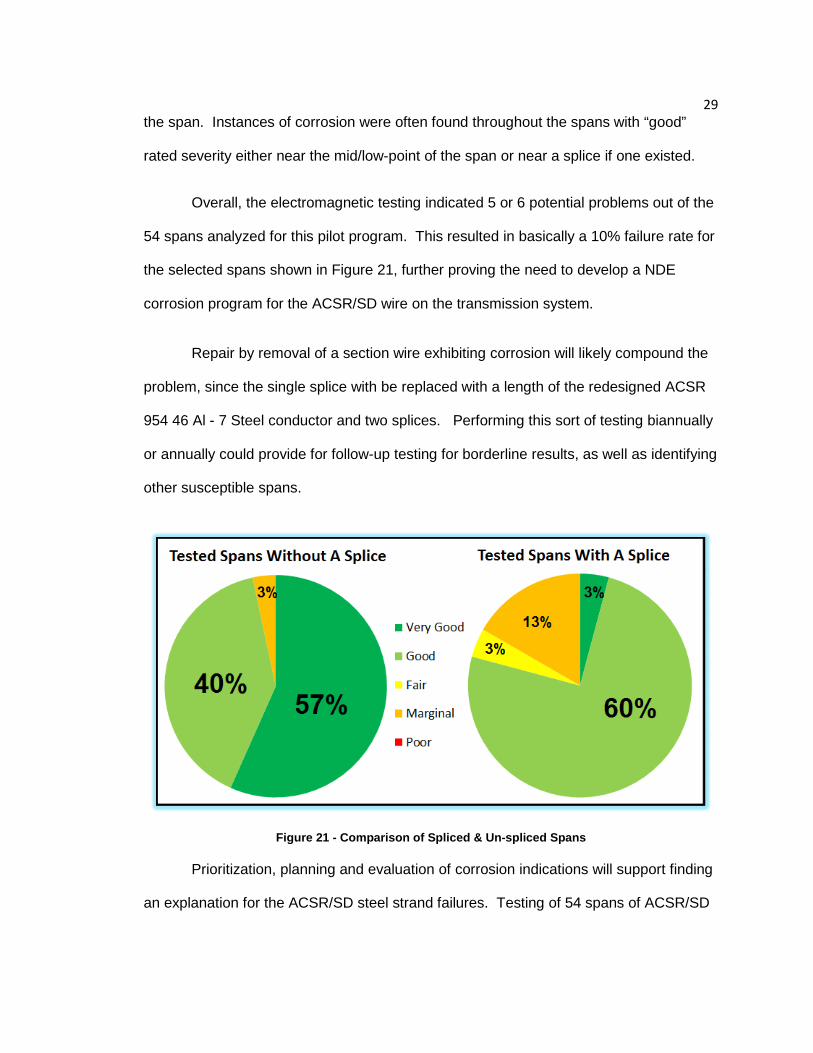
Overall, the electromagnetic testing indicated 5 or 6 potential problems out of the
54 spans analyzed for this pilot program. This resulted in basically a 10% failure rate for
the selected spans shown in Figure 21, further proving the need to develop a NDE
corrosion program for the ACSR/SD wire on the transmission system.
Repair by removal of a section wire exhibiting corrosion will likely compound the
problem, since the single splice with be replaced with a length of the redesigned ACSR
954 46 Al - 7 Steel conductor and two splices. Performing this sort of testing biannually
or annually could provide for follow-up testing for borderline results, as well as identifying
other susceptible spans.
Figure 21 - Comparison of Spliced & Un-spliced Spans
Prioritization, planning and evaluation of corrosion indications will support finding
an explanation for the ACSR/SD steel strand failures. Testing of 54 spans of ACSR/SD

30 is a very small sample size, when compared to the approximately 10,000 spans
throughout the 1800 miles of conductor owned by NPPD.
Two additional samples were also shipped to EPRI for further microscopic
analysis of broken strands with similar results. The five marginal locations had line
outages in 2015 for replacement to allow for further analysis and testing to determine
causal factors. ASTM A90/A90M testing was performed to determine the amount of zinc
remaining by comparison of the steel strand weight before and after hydrochloric acid
strips the galvanizing layer.
NPPD has performed further additional testing of susceptible circuits to help
conclude overall extent of condition with testing on the 115kV transmission lines in 2016.
Specific locations identified for ACSR/SD wire where conductor is not bundled to reduce
the difficulty and increased time for non-destructive testing with testing device.

31 Chapter 6 – Corrosion Sample Dissection - L2312 Middle
6.1 Defective Conductor Lab Testing
In April 2015, the removal of the five defective conductor spans occurred with the
acute corrosion locations were marked red tape for reference during separation. Our
line crew assisted with the dissection of the wire with the removal of the outer aluminum
layers to expose the center core layer of seven steel strands. NPPD set aside 2 out of 5
conductors for shipment to Canada (Kinectrics) for lab testing, analysis, and dissection.
Accuracy of the electromagnetic inspection device was verified for location and severity
of degradation of the conductor[17].
Figure 22 - Line 2312 results showing LF/LMA level throughout the conductor span length
As shown in the test data in Figure 22; cross-sectional area of the steel wires at
approximately 434 feet from structure 39 is approximately 85% to 90% of that of a

32 galvanized new section of the steel wires in the conductor. This is due to either a very
deep corrosion pit or a broken steel wire strand recognized by the LF coil sensor[16].
Figure 23 - Line 2312 results showing LF level throughout 20 feet of the conductor detail
The data from the LF channel, and supported by the LMA channel, indicates that
extent of corrosion of the steel wires in this conductor are in Stage 2A condition. From
Table 4 the outer surface of the steel wires has lost up to 33% of the zinc galvanizing
layer in some sections of the conductor, exposing the base metal. The location of worst
corrosion is approximately 434 feet from structure 39.
Table 4 - Corrosion extent stage and severity categories
Data from the LF channel indicates that at the location of worst corrosion, the
steel wires in this span of conductor are in Category 5 condition. From Table 4 the outer
surface of the steel wires have significant rust on the surface with medium to a

33 significant amount of pitting[17]. The large spike in the LF channel at this location could
be due to either a very deep corrosion pit or a broken steel wire strand.
Table 5 - Galvanized steel wire tension and elongation L2312 middle phase
Steel wire strands for this span of conductor were evaluated for ductility, breaking
strength and elongation. Samples for this testing had a length of 4 feet and were loaded
at a rate of 2.4 in/min. The calculated break strength of the steel core based on the
values found in ASTM B498 is 9,590 lbf (7 wires x 1,370 lbf breaking strength for each
wire)[19]. This indicates that the measured steel core strength is 97.5% of the Rated
Tensile Strength even with a broken steel strand. The galvanized steel wire did not
exceed the rated tensile strength value[18].
Torsional ductility testing was also performed on individual galvanized steel
strand samples with an average length of about 5 feet. The average number of turns
was found to be just over 3. Based on ASTM A938 the average number of turns to
failure of new steel wire ranges from 30 to 35[20]. Torsional ductility of less than 5 turns
is rated as poor ductility; this level of ductility is considered to be the result advanced
corrosion and should be considered for replacement.
Measurement of the remaining galvanization layer on the steel wire strands
provides an indication of the extent to which the zinc has thinned due to mechanical
wear and corrosion processes. ASTM A90/A90M determines the weight of zinc

34 remaining on each steel wire as an average over a length of a 12 inch long sample[21].
The minimum mass of zinc for a Class A galvanized steel wire is 229 g/m2. In addition,
the center steel wire is better protected from corrosion to a large extent by the outer
steel wires, and therefore the thickness of zinc on the center wire is considered to be a
good reference for the outer wires.
Table 6 - Galvanized steel wire remaining thickness for L2312 middle phase
Test samples were prepared with the removal of loose impediments such as rust,
dirt, and other corrosion flakes prior to testing. Samples were cleaned and weighed prior
to the application of hydrochloric acid for removal of the exterior zinc coating. The
average remaining zinc of the six exterior steel wires was 81% as compared to the “new”
center steel wire. General mechanical wear on the outer steel wire layers is considered
moderate as the remaining zinc coating thickness was found to be over 70% for the
outer steel wire as compared to the core wire.
Removed conductor lengths were shipped to Kinectrics for further examination
and testing with similar results to our field analysis of other removed lengths. Broken
steel conductor wire was uncovered throughout the dissection. Analysis was again

35 performed to measure severity levels in an effort to determine the rate of corrosion with
electromagnetic levels being measured again about 24 months later.
Comparisons to previous test results were inconclusive due to failure of test
duplication with the adjusted tension levels of the strands which resulted in differences in
signal amplitude. Steel wires were found to have a few additional minor corrosion
locations following two years of continued service. No significant changes were
determinable with electromagnetic inspection with steel wire corrosion progressing
slowly over the 2 year period.
6.2 Visual Inspection
Conductor removed from the 5 locations deemed “marginal” were all visually
examined with an unaided eye and through a low magnification microscope. Samples
were all cleaned of loose dirt and other contamination, and aluminum layers were
examined along with the steel wire section. Below are the observations, photographs,
and comments of this examination.
Figure 24 - L2312, Str. 39-40, Middle Phase – Outer Aluminum Layer

36 During dissection, first the outer aluminum layer was observed to be grey in color
with many handling mark on the outside surface shown in Figure 24. It is likely that
many of the handling marks were caused by compression wire grips installed for
removal and or initial installation 40 years ago. Removed conductor is often subject to
being slid on coarse or jagged surfaces which will wear the relatively soft aluminum. The
inner surface of the outer aluminum wire had a light grease coating containing some
corrosion products.
Figure 25 - L2312, Str. 39-40, Middle Phase – Inner Aluminum Layer
Examination found that the inner layer of the aluminum had strands which were
dull gray in color and had scuff marks which may have been caused by the compression
clamp. There was some very light fret marks along the outer surface that were likely
caused by contact with the outer aluminum layer. Figure 25 shows that location of the
broken steel wire relative to the aluminum layer.
Inspecting more closely, yellow corrosion products were identified on a few of the
inner aluminum strands as shown in Figure 26. Grease was present on the inner surface
of the wires; some areas had yellowish colored grease that was mixed with corrosion

37 products. Removal of the grease found that the surface was etched with light corrosion.
A few of the areas examined had brown grease with rust corrosion product along with
transfer of brown/red rust to the aluminum surface.
Figure 26 - L2312, Str. 39-40, Inner Aluminum Layer yellow corrosion products
Tension and elongation testing was performed on individual aluminum wires with
results below minimum applicable standards for new wires. Measured breaking strength
for the inner and outer aluminum layer was found to be nearly 10% below the calculated
strength for new aluminum from ASTM B230[22]. Elongation tests results showed
tested values of 1.89% for the outer aluminum, 1.80% for inner aluminum. ASTM B230
elongation requirements are 2.1% for the inner layer, 2.3% for the outer layer[16].
Aluminum is obviously deteriorated by the environment after more than 40 years
of tensile fatigue throughout thermal, ice, and wind loading. Damage to the aluminum is
noted on both layers with visible distortion of the originally designed layer of the wire.
This damage was likely caused during the initial installation, where the aluminum wire

38 layers must be crushed due to the annulus designed for the self-damping ACSR. Gaps
are introduced through the permanent deformation of the trapezoidal aluminum wire,
which could allow for an electrolyte to be introduced into the annulus near a conductor
splice.
Figure 27 - L2312, Str. 39-40, Galvanized Steel Wires
The steel wires were uncovered to find grease present on the surface along with
white corrosion products were found near the location that the zinc galvanizing was
damaged. Along the surface of the steel wires, a significant amount of rust was noted as
displayed in Figure 27. Some of the wires had severe corrosion and heavy pitting in
various locations along the length of the sample.
After removing the grease, the surface of the wires was mostly covered in white
corrosion products which are possibly zinc oxide. Steel wires were separated to
examine the center steel core wire as shown in Figure 28. The galvanized steel core

39 wire had grease and white corrosion products removed and were found to have no
corrosion on the surface.
Figure 28 - L2312, Str. 39-40, Galvanized Steel Wires (unstranded)
6.3 Overall Assessment
Laboratory testing for the examined ACSR self-damping conductor were
generally inconclusive in determining a rate of corrosion. The reduction in the overall
tensile strength and ductility of the combined steel/aluminum conductor near the acute
corrosion location were found to be consistent[23].
It has been determined that a significant amount of life remains for the conductor
a few feet away from the isolated corrosion with a high level of galvanization thickness
remaining. Harsh material handling near the conductor splice is likely to blame for the
localized weakening of the galvanization and electrolyte access.

40 Chapter 7 – Final Discussion
7.1 Summary of Results
There were 5 spans that were classified as “marginal” during the April 2013
inspection; these deteriorated sections were removed in 2015 with a couple hundred feet
of new ACSR being spliced in the span in Figure 29. Of the 54 wire spans inspected, 30
spans contained a compression splice, while the remaining 24 spans did not contain any
type of compression connection.
• 96% of spans with compression sleeve splices have corrosion present in various
stages. 83% of these spans were considered “Good” or “Very Good”.
• 42% of spans without compression sleeves have corrosion present in various
stages. 91% of these spans were considered “Good” or “Very Good”
• About 40% of the spans in the system have localized areas of corrosion that are
Category 3 or worse.
• 33 of 36 maximum corrosion locations (91%) occurred within 150 ft. of the low
point of the span.
Figure 29 – Transmission line electromagnetic testing

41 • With the assumption that these results are representative of the system, the
following generalization can be made:
o Almost all spans with compression splices have corrosion at some
location.
o About ½ of spans without compression splices have corrosion at some
location.
o The point of maximum corrosion occurs within 150 feet of the low point of
the span.
• None of the conductors were rated as poor, which would indicate no imminent
failures. Since none of these localized areas were in poor condition, it could be
several years before more frequent findings of broken wire and related problems
are observed. However, a plan/program needs to be developed to start
addressing this deteriorating conductor.
7.2 Progress since initial examination
Following the initial examination of spliced and non-spliced ACSR conductor
spans in 2013, budget constraints put this project in a standstill until the replacement of
these conductors could be accommodated. Long range planning for assessment of
spliced connection of the self-damping ACSR has been justified as a future preventative
maintenance task.
• NPPD to perform follow-up electromagnetic inspection in 2-3 years for a different
population of SD conductors and include 2 or three locations from line 2309/2312
to test so that a degradation trend can be started. (Action Complete in 2016 –
Retests in April 2015 of two degraded locations were somewhat inconclusive)

42 • The 5 “marginal” locations found throughout test were scheduled for replacement
in the next 1-2 years (as previously stated). The removed conductor could be
sent to EPRI or Kinectrics for testing to measure corrosion and predict corrosion
rate in remaining conductor. (Action Complete April 2015)
Figure 30 - Analysis of fault data based on the location in span for the corrosion locations identified
• Low points in a span [Figure 9] with a splice seem to correlate well to the
corrosion “faults” located in the electromagnetic analysis reports.

43 Chapter 8 References
[1] Lantero, Allison, “The War of the Currents: AC vs DC Power” 2014. [Online]
Available: http://energy.gov/articles/war-currents-ac-vs-dc-power [Accessed: 09-
July-2016]
[2] Black, Robert M. (1983). “The History of Electric Wires and Cables” Peter
Peregrinus Ltd.
[3] Wikipedia, “Copper wire and cable” [Online]. Available:
http://energy.gov/articles/war-currents-ac-vs-dc-power [Accessed: 09-July-2016]
[4] Pryor L, Schlobohm R, Brownell B. A Comparison of Aluminum vs. Copper as
used in Electrical Equipment GE Industrial [Online]. Available:
www.geindustrial.com/Newsletter/Aluminum_vs_Copper.pdf [Accessed: 11-July-
2016]
[5] Thrash, Ridley F. (2003) “Transmission Conductors – A review of the design and
selection criteria”. Southwire Company
[6] Wikipedia, “Electric Power Transmission” [Online]. Available:
https://en.wikipedia.org/wiki/Electric_power_transmission [Accessed: 12-July-
2016]
[7] Kirkpatrick, L., McCulloch, A., Pue-Gilchrist, A. “Ten Years of Progress with Self-
Damping Conductor”, IEEE Paper 1979.
[8] Electric Power Research Institute Inc. “Transmission Line Reference Book, 345
KV and Above” 2nd Edition,1982.
[9] Morgan V, Zhang B, Findlay R, "Effect of Magnetic Induction in a Steel-Cored
Conductor on Current Distribution, resistance and Power Loss," IEEE Trans.
Power Delivery, July, 1997.
[10] Budinski, Kenneth; Budinski, Michael (2010). “Engineering Material Properties
and Selection (9th Edition)”. Pearson Prentice Hall

44 [11] Weischedel HR (2004) “The magnetic flux leakage inspection of wire ropes”.
Nondestructive Testing Handbook, Electromagnetic Testing
[12] Electric Power Research Institute Inc. (2013). “NPPD SD Conductor Analysis”.
[13] Bologna, F (2012). “Evaluation of Emerging Transmission Inspection
Technologies – Laboratory Test of the LineVueTM Conductor Inspection System”.
EPRI
[14] Kitzinger, F. and G.A. Wint. “Magnetic Testing Device for Detecting Loss of
Metallic Area and Internal and External Defects in Elongated Objects.” US Patent
4,096,437 (June 1978).
[15] Smith, D.T. and P. McCann (2002). “Evaluation of Instruments for the Non-
Destructive Testing of Wire Ropes”. Buxton, Derbyshire. UK: Health & Safety
Laboratory
[16] Wang, Phoebe; Hughes, John; Kinectrics (2013). “LinevueTM Field Inspection
Report for NPPD” dated Sept. 6th 2013.
[17] Fletcher M, Svatora L, Pon C, Rizzetto A, Weyer D. “Inspection of ACSR
Conductors on Overhead Power Lines using LineVueTM”. Transmission &
Distribution World (October 2015) p 36-44 [1,2,3,4]
[18] Ashby, M. F. (2011). “Materials Selection In Mechanical Design (4th Edition)”
Oxford: Butterworth-Heinemann.
[19] ASTM B498 “Standard Specification for Zinc-Coated (Galvanized) Steel Core
Wire for Use in Overhead Electrical Conductors”. Approved November 11, 2008.
[20] ASTM A938 “Standard Test Method for Torsion Testing of Wire”. Approved July
1, 2015.
[21] ASTM A90/A90M “Standard Test Method for Weight [Mass] of Coating on Iron
and Steel Articles with Zinc or Zinc-Alloy Coatings”

45 [22] ASTM B B230 230M-07 “Standard Specification for Aluminum 1350-H19 Wire for
Electrical Purposes”. Approved March 15, 2007.
[23] ASTM B701 “Standard Specification for Concentric-Lay-Stranded Self Damping
Aluminum Conductors, Steel Reinforced (ACSR/SD)” Table 1.
Recommended