
Pulse
Monthly Real Estate Monitor
Market Highlights JULY 2016
Office space demand
continued to increase
across most cities
Retail space demand
improved most
prominently in
Hyderabad and Pune
Residential demand
was steady in all
cities except Pune
which witnessed
growth
Get city Pulse by clicking below
Market
Sentiment
Deal of
the
month
Think About it!!
Green Wall
Pulse
Monthly Real Estate Monitor
Favourable Neutral Unfavourable
Legend: Market Sentiment
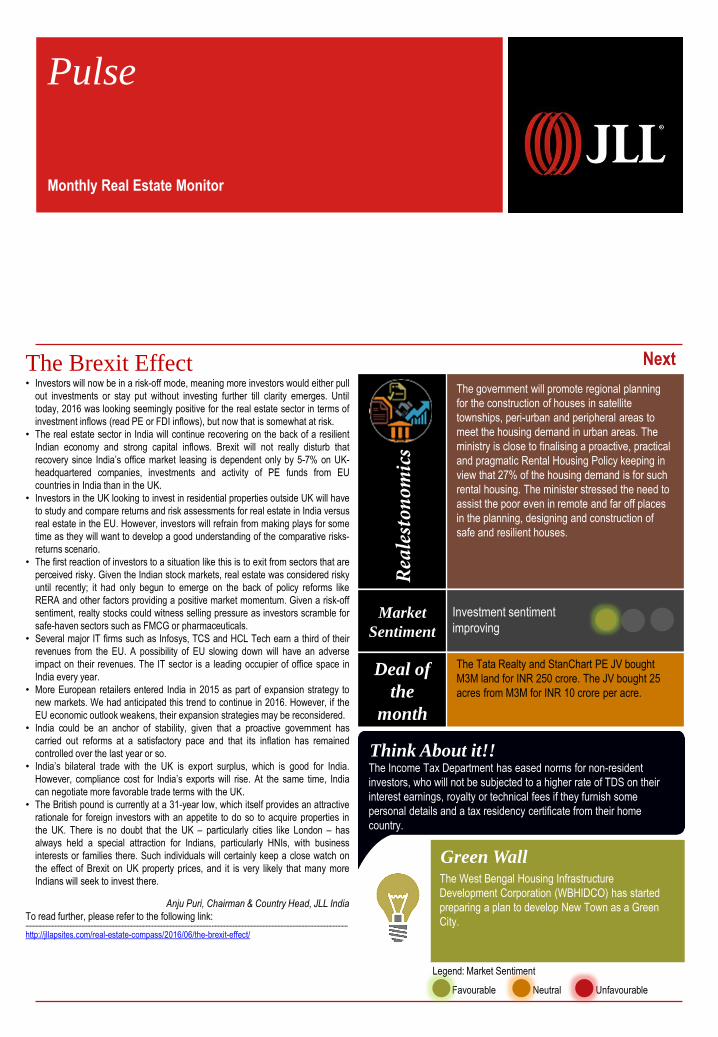
The Brexit Effect • Investors will now be in a risk-off mode, meaning more investors would either pull
out investments or stay put without investing further till clarity emerges. Until
today, 2016 was looking seemingly positive for the real estate sector in terms of
investment inflows (read PE or FDI inflows), but now that is somewhat at risk.
• The real estate sector in India will continue recovering on the back of a resilient
Indian economy and strong capital inflows. Brexit will not really disturb that
recovery since India’s office market leasing is dependent only by 5-7% on UK-
headquartered companies, investments and activity of PE funds from EU
countries in India than in the UK.
• Investors in the UK looking to invest in residential properties outside UK will have
to study and compare returns and risk assessments for real estate in India versus
real estate in the EU. However, investors will refrain from making plays for some
time as they will want to develop a good understanding of the comparative risks-
returns scenario.
• The first reaction of investors to a situation like this is to exit from sectors that are
perceived risky. Given the Indian stock markets, real estate was considered risky
until recently; it had only begun to emerge on the back of policy reforms like
RERA and other factors providing a positive market momentum. Given a risk-off
sentiment, realty stocks could witness selling pressure as investors scramble for
safe-haven sectors such as FMCG or pharmaceuticals.
• Several major IT firms such as Infosys, TCS and HCL Tech earn a third of their
revenues from the EU. A possibility of EU slowing down will have an adverse
impact on their revenues. The IT sector is a leading occupier of office space in
India every year.
• More European retailers entered India in 2015 as part of expansion strategy to
new markets. We had anticipated this trend to continue in 2016. However, if the
EU economic outlook weakens, their expansion strategies may be reconsidered.
• India could be an anchor of stability, given that a proactive government has
carried out reforms at a satisfactory pace and that its inflation has remained
controlled over the last year or so.
• India’s bilateral trade with the UK is export surplus, which is good for India.
However, compliance cost for India’s exports will rise. At the same time, India
can negotiate more favorable trade terms with the UK.
• The British pound is currently at a 31-year low, which itself provides an attractive
rationale for foreign investors with an appetite to do so to acquire properties in
the UK. There is no doubt that the UK – particularly cities like London – has
always held a special attraction for Indians, particularly HNIs, with business
interests or families there. Such individuals will certainly keep a close watch on
the effect of Brexit on UK property prices, and it is very likely that many more
Indians will seek to invest there.
Anju Puri, Chairman & Country Head, JLL India
To read further, please refer to the following link:------------------------------------------------------------------------------------------------------------------------------------------------------------------------------------------------------------------------
http://jllapsites.com/real-estate-compass/2016/06/the-brexit-effect/
The government will promote regional planning
for the construction of houses in satellite
townships, peri-urban and peripheral areas to
meet the housing demand in urban areas. The
ministry is close to finalising a proactive, practical
and pragmatic Rental Housing Policy keeping in
view that 27% of the housing demand is for such
rental housing. The minister stressed the need to
assist the poor even in remote and far off places
in the planning, designing and construction of
safe and resilient houses.
Investment sentiment
improving
The Tata Realty and StanChart PE JV bought
M3M land for INR 250 crore. The JV bought 25
acres from M3M for INR 10 crore per acre.
The Income Tax Department has eased norms for non-resident
investors, who will not be subjected to a higher rate of TDS on their
interest earnings, royalty or technical fees if they furnish some
personal details and a tax residency certificate from their home
country.
The West Bengal Housing Infrastructure
Development Corporation (WBHIDCO) has started
preparing a plan to develop New Town as a Green
City.
Next
DELHI
KOLKATA
CHENNAI
BANGALORE
HYDERABAD
PUNEMUMBAI
AHMEDABAD
For more information about our research, contact
Ashutosh Limaye
National Director, Research and REIS +91 98211 07054 [email protected]
Aritra Das
Analyst, Research +91 95157 20645 [email protected]
Research Dynamics 2016
Pulse reports from JLL are frequent updates on real estate market dynamics.
www.joneslanglasalle.co.in
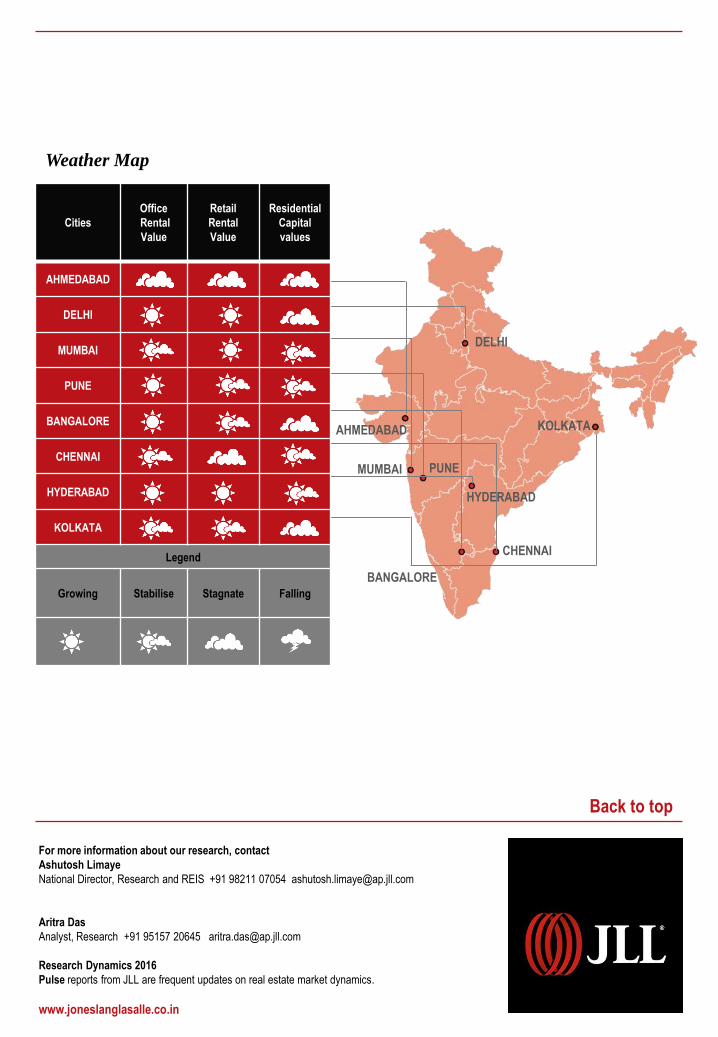
Cities
Office
Rental
Value
Retail
Rental
Value
Residential
Capital
values
AHMEDABAD
DELHI
MUMBAI
PUNE
BANGALORE
CHENNAI
HYDERABAD
KOLKATA
Legend
Growing Stabilise Stagnate Falling
Weather Map
Back to top
OFFICE
Demand Vacancy
RV CV
RETAIL
Demand Vacancy
RV CV
RESIDENTIAL
Demand Launches
RV CV
Demand/Vacancy
Rental Value (RV) / Capital Values (CV)Increasing Moderate Increase Stable Moderate Fall Falling
Pulse
Monthly Real Estate Monitor
DATA ANALYSIS FOR THE MONTH OF JUNE 2016
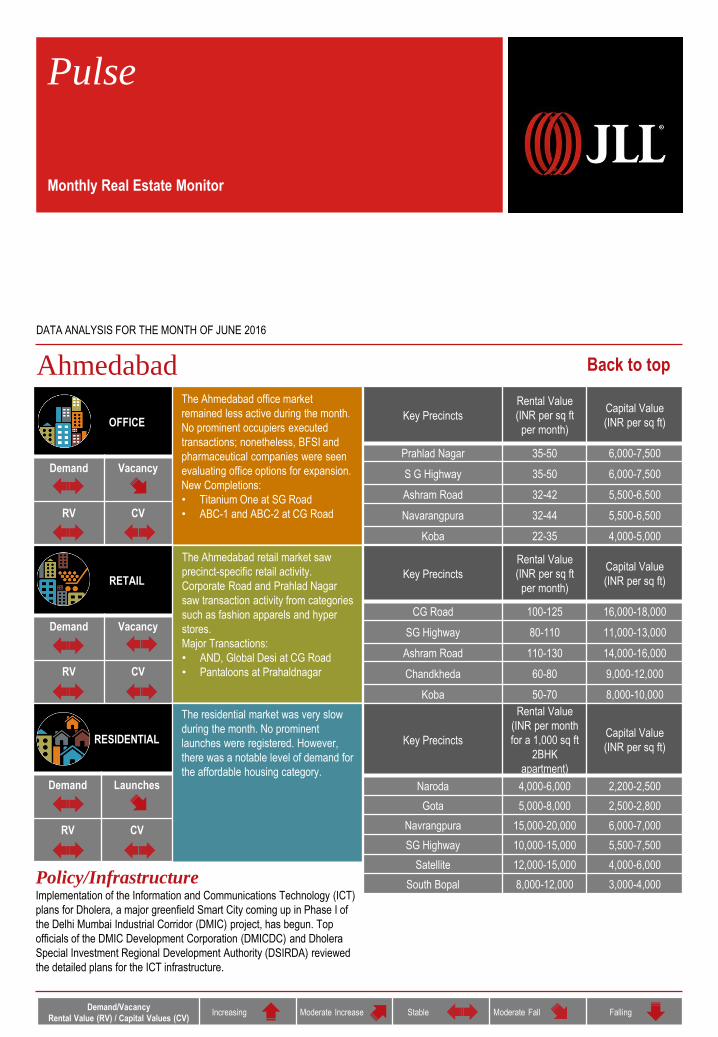
Ahmedabad
Policy/InfrastructureImplementation of the Information and Communications Technology (ICT)
plans for Dholera, a major greenfield Smart City coming up in Phase I of
the Delhi Mumbai Industrial Corridor (DMIC) project, has begun. Top
officials of the DMIC Development Corporation (DMICDC) and Dholera
Special Investment Regional Development Authority (DSIRDA) reviewed
the detailed plans for the ICT infrastructure.
Back to top
The Ahmedabad office market
remained less active during the month.
No prominent occupiers executed
transactions; nonetheless, BFSI and
pharmaceutical companies were seen
evaluating office options for expansion.
New Completions:
• Titanium One at SG Road
• ABC-1 and ABC-2 at CG Road
The Ahmedabad retail market saw
precinct-specific retail activity.
Corporate Road and Prahlad Nagar
saw transaction activity from categories
such as fashion apparels and hyper
stores.
Major Transactions:
• AND, Global Desi at CG Road
• Pantaloons at Prahaldnagar
The residential market was very slow
during the month. No prominent
launches were registered. However,
there was a notable level of demand for
the affordable housing category.
Key Precincts
Rental Value
(INR per sq ft
per month)
Capital Value
(INR per sq ft)
Prahlad Nagar 35-50 6,000-7,500
S G Highway 35-50 6,000-7,500
Ashram Road 32-42 5,500-6,500
Navarangpura 32-44 5,500-6,500
Koba 22-35 4,000-5,000
Key Precincts
Rental Value
(INR per sq ft
per month)
Capital Value
(INR per sq ft)
CG Road 100-125 16,000-18,000
SG Highway 80-110 11,000-13,000
Ashram Road 110-130 14,000-16,000
Chandkheda 60-80 9,000-12,000
Koba 50-70 8,000-10,000
Key Precincts
Rental Value
(INR per month
for a 1,000 sq ft
2BHK
apartment)
Capital Value
(INR per sq ft)
Naroda 4,000-6,000 2,200-2,500
Gota 5,000-8,000 2,500-2,800
Navrangpura 15,000-20,000 6,000-7,000
SG Highway 10,000-15,000 5,500-7,500
Satellite 12,000-15,000 4,000-6,000
South Bopal 8,000-12,000 3,000-4,000
OFFICE
Demand Vacancy
RV CV
RETAIL
Demand Vacancy
RV CV
RESIDENTIAL
Demand Launches
RV CV
Demand/Vacancy
Rental Value (RV) / Capital Values (CV)Increasing Moderate Increase Stable Moderate Fall Falling
Pulse
Monthly Real Estate Monitor
DATA ANALYSIS FOR THE MONTH OF JUNE 2016
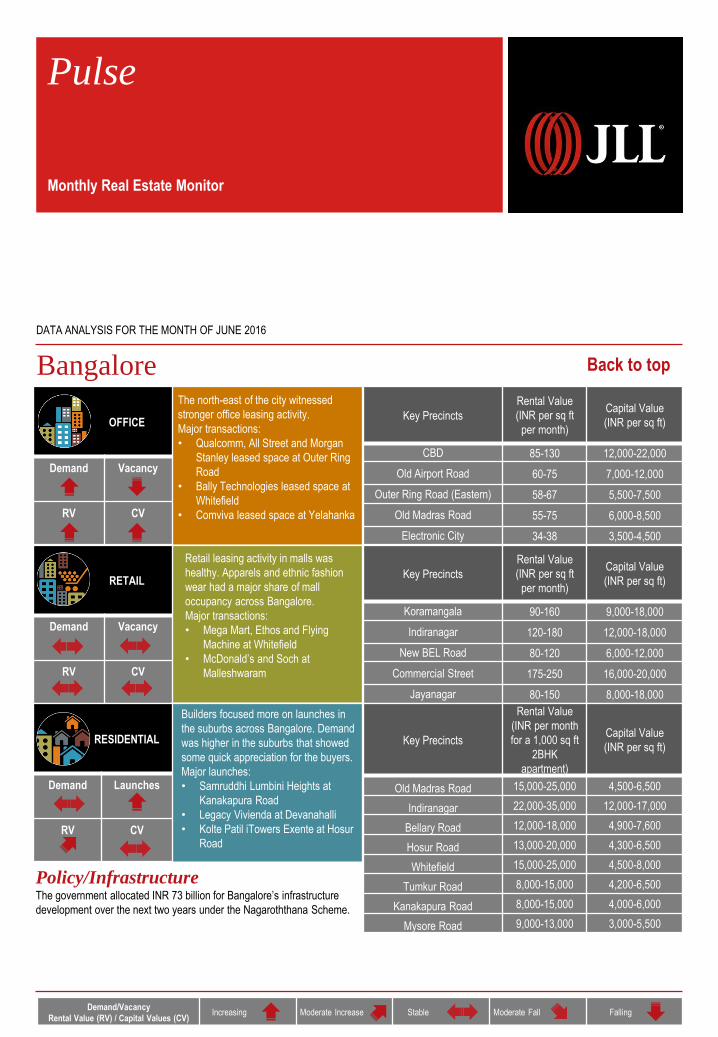
Bangalore
Policy/InfrastructureThe government allocated INR 73 billion for Bangalore’s infrastructure
development over the next two years under the Nagaroththana Scheme.
Back to top
The north-east of the city witnessed
stronger office leasing activity.
Major transactions:
• Qualcomm, All Street and Morgan
Stanley leased space at Outer Ring
Road
• Bally Technologies leased space at
Whitefield
• Comviva leased space at Yelahanka
Retail leasing activity in malls was
healthy. Apparels and ethnic fashion
wear had a major share of mall
occupancy across Bangalore.
Major transactions:
• Mega Mart, Ethos and Flying
Machine at Whitefield
• McDonald’s and Soch at
Malleshwaram
Builders focused more on launches in
the suburbs across Bangalore. Demand
was higher in the suburbs that showed
some quick appreciation for the buyers.
Major launches:
• Samruddhi Lumbini Heights at
Kanakapura Road
• Legacy Vivienda at Devanahalli
• Kolte Patil iTowers Exente at Hosur
Road
Key Precincts
Rental Value
(INR per sq ft
per month)
Capital Value
(INR per sq ft)
CBD 85-130 12,000-22,000
Old Airport Road 60-75 7,000-12,000
Outer Ring Road (Eastern) 58-67 5,500-7,500
Old Madras Road 55-75 6,000-8,500
Electronic City 34-38 3,500-4,500
Key Precincts
Rental Value
(INR per sq ft
per month)
Capital Value
(INR per sq ft)
Koramangala 90-160 9,000-18,000
Indiranagar 120-180 12,000-18,000
New BEL Road 80-120 6,000-12,000
Commercial Street 175-250 16,000-20,000
Jayanagar 80-150 8,000-18,000
Key Precincts
Rental Value
(INR per month
for a 1,000 sq ft
2BHK
apartment)
Capital Value
(INR per sq ft)
Old Madras Road 15,000-25,000 4,500-6,500
Indiranagar 22,000-35,000 12,000-17,000
Bellary Road 12,000-18,000 4,900-7,600
Hosur Road 13,000-20,000 4,300-6,500
Whitefield 15,000-25,000 4,500-8,000
Tumkur Road 8,000-15,000 4,200-6,500
Kanakapura Road 8,000-15,000 4,000-6,000
Mysore Road 9,000-13,000 3,000-5,500

OFFICE
Demand Vacancy
RV CV
RETAIL
Demand Vacancy
RV CV
RESIDENTIAL
Demand Launches
RV CV
Demand/Vacancy
Rental Value (RV) / Capital Values (CV)Increasing Moderate Increase Stable Moderate Fall Falling
Pulse
Monthly Real Estate Monitor
DATA ANALYSIS FOR THE MONTH OF JUNE 2016
Chennai
Policy/InfrastructureThe allotment of INR 3,500 crore towards the development of roads in the
state of Tamil Nadu under the Comprehensive Road Infrastructure
Development Programme (CRIDP) 2015-2016 is expected to give a
major fillip to the city’s realty industry.
Back to top
Grade A office space rentals are
expected to strengthen for quality
office space across all sub-markets.
Major transactions:
• Hexaware at Thoraipakkam and
Talent Maximum at Mount Road
• Fresh Desk at Kandanchavadi
New completions:
• High Street IT Park at Teynampet
The demand was primarily driven by
the high streets.
Major transactions:
• Sony Centre at TTK
• Children’s Place at Express
Avenue
• Double Roti at Anna Nagar
Interest rates combined with the
improving funding scenario provided
significant tailwinds to a hitherto
sluggish residential sector.
Major launches:
• Tuxedo by DRA at Velachery
Key Precincts
Rental Value
(INR per sq ft
per month)
Capital Value
(INR per sq ft)
Mount Road 60-85 9,000-16,500
RK Salai 65-90 10,000-15,000
Pre-toll OMR 40-75 5,000-6,500
Post-toll OMR 35-40 3,000-6,000
Guindy 45-65 6,500-9,000
Key Precincts
Rental Value
(INR per sq ft
per month)
Capital Value
(INR per sq ft)
T. Nagar 120-180 12,000-15,000
Nungambakkam 130-150 13,000-16,000
Velachery 90-125 10,000-12,000
Pre-toll OMR 80-100 8,000-11,000
Anna Nagar 120-150 11,000-13,000
LB Road (Adyar) 100-140 10,500-13,500
Key Precincts
Rental Value
(INR per month
for a 1,000 sq ft
2BHK
apartment)
Capital Value
(INR per sq ft)
Adyar 20,000-30,000 18,000-22,000
Medavakkam 11,000-14,000 4,000-6,000
Tambaram 8,000-15,000 4,000-6,000
Anna Nagar 18,00025,000 10,000-15,000
Porur 7,000-12,000 4,200-6,200
Sholinganallur 9,000-12,000 4,500-6,000
OFFICE
Demand Vacancy
RV CV
RETAIL
Demand Vacancy
RV CV
RESIDENTIAL
Demand Launches
RV CV
Demand/Vacancy
Rental Value (RV) / Capital Values (CV)Increasing Moderate Increase Stable Moderate Fall Falling
Pulse
Monthly Real Estate Monitor
DATA ANALYSIS FOR THE MONTH OF JUNE 2016
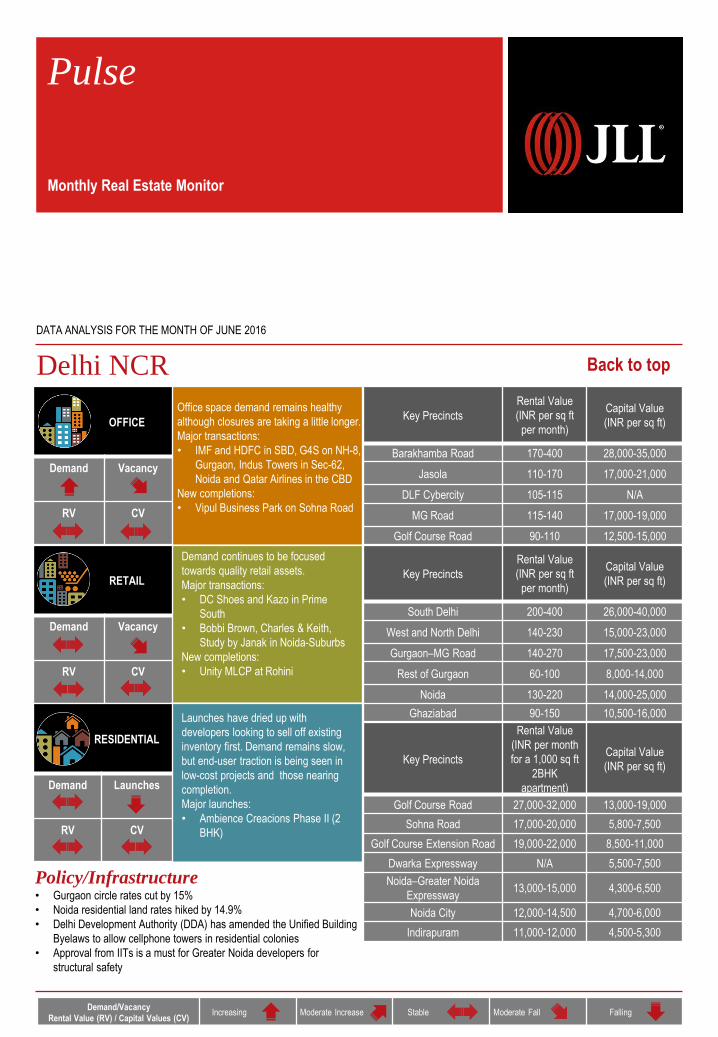
Delhi NCR
Policy/Infrastructure• Gurgaon circle rates cut by 15%
• Noida residential land rates hiked by 14.9%
• Delhi Development Authority (DDA) has amended the Unified Building
Byelaws to allow cellphone towers in residential colonies
• Approval from IITs is a must for Greater Noida developers for
structural safety
Back to top
Office space demand remains healthy
although closures are taking a little longer.
Major transactions:
• IMF and HDFC in SBD, G4S on NH-8,
Gurgaon, Indus Towers in Sec-62,
Noida and Qatar Airlines in the CBD
New completions:
• Vipul Business Park on Sohna Road
Demand continues to be focused
towards quality retail assets.
Major transactions:
• DC Shoes and Kazo in Prime
South
• Bobbi Brown, Charles & Keith,
Study by Janak in Noida-Suburbs
New completions:
• Unity MLCP at Rohini
Launches have dried up with
developers looking to sell off existing
inventory first. Demand remains slow,
but end-user traction is being seen in
low-cost projects and those nearing
completion.
Major launches:
• Ambience Creacions Phase II (2
BHK)
Key Precincts
Rental Value
(INR per sq ft
per month)
Capital Value
(INR per sq ft)
Barakhamba Road 170-400 28,000-35,000
Jasola 110-170 17,000-21,000
DLF Cybercity 105-115 N/A
MG Road 115-140 17,000-19,000
Golf Course Road 90-110 12,500-15,000
Key Precincts
Rental Value
(INR per sq ft
per month)
Capital Value
(INR per sq ft)
South Delhi 200-400 26,000-40,000
West and North Delhi 140-230 15,000-23,000
Gurgaon–MG Road 140-270 17,500-23,000
Rest of Gurgaon 60-100 8,000-14,000
Noida 130-220 14,000-25,000
Ghaziabad 90-150 10,500-16,000
Key Precincts
Rental Value
(INR per month
for a 1,000 sq ft
2BHK
apartment)
Capital Value
(INR per sq ft)
Golf Course Road 27,000-32,000 13,000-19,000
Sohna Road 17,000-20,000 5,800-7,500
Golf Course Extension Road 19,000-22,000 8,500-11,000
Dwarka Expressway N/A 5,500-7,500
Noida–Greater Noida
Expressway13,000-15,000 4,300-6,500
Noida City 12,000-14,500 4,700-6,000
Indirapuram 11,000-12,000 4,500-5,300
OFFICE
Demand Vacancy
RV CV
RETAIL
Demand Vacancy
RV CV
RESIDENTIAL
Demand Launches
RV CV
Demand/Vacancy
Rental Value (RV) / Capital Values (CV)Increasing Moderate Increase Stable Moderate Fall Falling
Pulse
Monthly Real Estate Monitor
DATA ANALYSIS FOR THE MONTH OF JUNE 2016
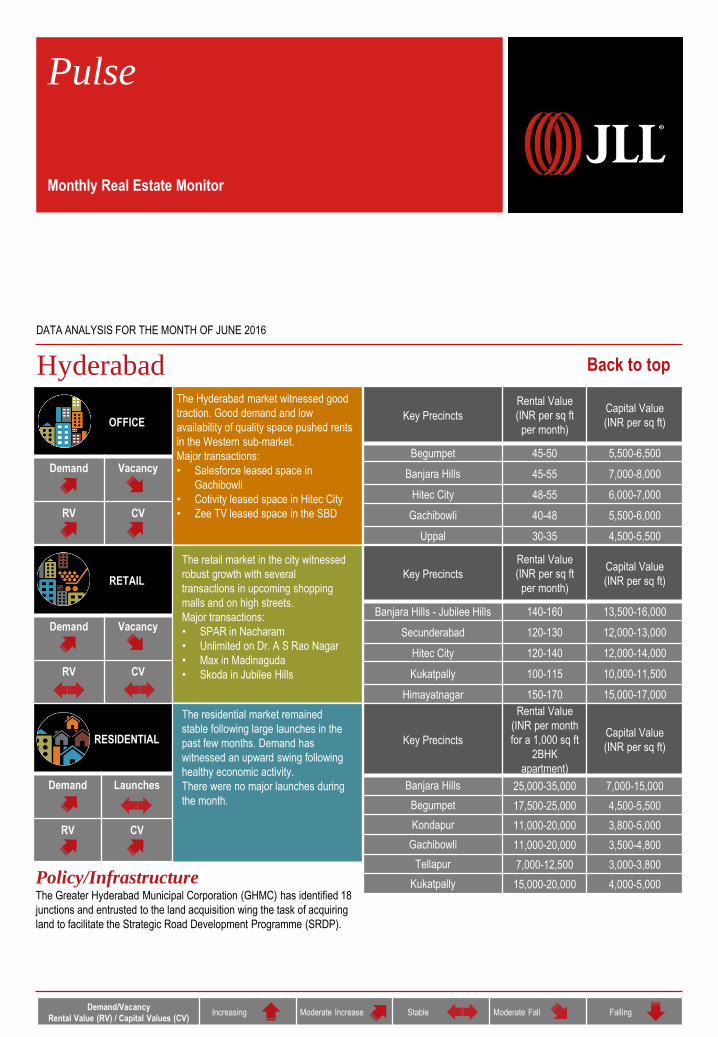
Hyderabad
Policy/InfrastructureThe Greater Hyderabad Municipal Corporation (GHMC) has identified 18
junctions and entrusted to the land acquisition wing the task of acquiring
land to facilitate the Strategic Road Development Programme (SRDP).
Back to top
The Hyderabad market witnessed good
traction. Good demand and low
availability of quality space pushed rents
in the Western sub-market.
Major transactions:
• Salesforce leased space in
Gachibowli
• Cotivity leased space in Hitec City
• Zee TV leased space in the SBD
The retail market in the city witnessed
robust growth with several
transactions in upcoming shopping
malls and on high streets.
Major transactions:
• SPAR in Nacharam
• Unlimited on Dr. A S Rao Nagar
• Max in Madinaguda
• Skoda in Jubilee Hills
The residential market remained
stable following large launches in the
past few months. Demand has
witnessed an upward swing following
healthy economic activity.
There were no major launches during
the month.
Key Precincts
Rental Value
(INR per sq ft
per month)
Capital Value
(INR per sq ft)
Begumpet 45-50 5,500-6,500
Banjara Hills 45-55 7,000-8,000
Hitec City 48-55 6,000-7,000
Gachibowli 40-48 5,500-6,000
Uppal 30-35 4,500-5,500
Key Precincts
Rental Value
(INR per sq ft
per month)
Capital Value
(INR per sq ft)
Banjara Hills - Jubilee Hills 140-160 13,500-16,000
Secunderabad 120-130 12,000-13,000
Hitec City 120-140 12,000-14,000
Kukatpally 100-115 10,000-11,500
Himayatnagar 150-170 15,000-17,000
Key Precincts
Rental Value
(INR per month
for a 1,000 sq ft
2BHK
apartment)
Capital Value
(INR per sq ft)
Banjara Hills 25,000-35,000 7,000-15,000
Begumpet 17,500-25,000 4,500-5,500
Kondapur 11,000-20,000 3,800-5,000
Gachibowli 11,000-20,000 3,500-4,800
Tellapur 7,000-12,500 3,000-3,800
Kukatpally 15,000-20,000 4,000-5,000
OFFICE
Demand Vacancy
RV CV
RETAIL
Demand Vacancy
RV CV
RESIDENTIAL
Demand Launches
RV CV
Demand/Vacancy
Rental Value (RV) / Capital Values (CV)Increasing Moderate Increase Stable Moderate Fall Falling
Pulse
Monthly Real Estate Monitor
DATA ANALYSIS FOR THE MONTH OF JUNE 2016
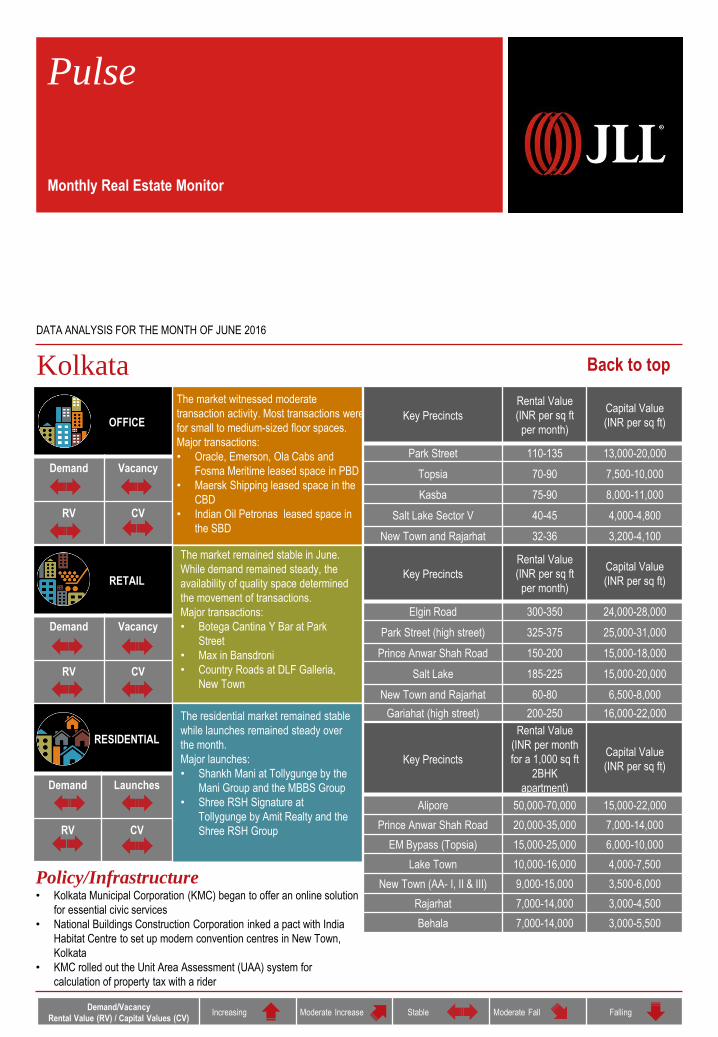
Kolkata
Policy/Infrastructure• Kolkata Municipal Corporation (KMC) began to offer an online solution
for essential civic services
• National Buildings Construction Corporation inked a pact with India
Habitat Centre to set up modern convention centres in New Town,
Kolkata
• KMC rolled out the Unit Area Assessment (UAA) system for
calculation of property tax with a rider
Back to top
The market witnessed moderate
transaction activity. Most transactions were
for small to medium-sized floor spaces.
Major transactions:
• Oracle, Emerson, Ola Cabs and
Fosma Meritime leased space in PBD
• Maersk Shipping leased space in the
CBD
• Indian Oil Petronas leased space in
the SBD
The market remained stable in June.
While demand remained steady, the
availability of quality space determined
the movement of transactions.
Major transactions:
• Botega Cantina Y Bar at Park
Street
• Max in Bansdroni
• Country Roads at DLF Galleria,
New Town
The residential market remained stable
while launches remained steady over
the month.
Major launches:
• Shankh Mani at Tollygunge by the
Mani Group and the MBBS Group
• Shree RSH Signature at
Tollygunge by Amit Realty and the
Shree RSH Group
Key Precincts
Rental Value
(INR per sq ft
per month)
Capital Value
(INR per sq ft)
Park Street 110-135 13,000-20,000
Topsia 70-90 7,500-10,000
Kasba 75-90 8,000-11,000
Salt Lake Sector V 40-45 4,000-4,800
New Town and Rajarhat 32-36 3,200-4,100
Key Precincts
Rental Value
(INR per sq ft
per month)
Capital Value
(INR per sq ft)
Elgin Road 300-350 24,000-28,000
Park Street (high street) 325-375 25,000-31,000
Prince Anwar Shah Road 150-200 15,000-18,000
Salt Lake 185-225 15,000-20,000
New Town and Rajarhat 60-80 6,500-8,000
Gariahat (high street) 200-250 16,000-22,000
Key Precincts
Rental Value
(INR per month
for a 1,000 sq ft
2BHK
apartment)
Capital Value
(INR per sq ft)
Alipore 50,000-70,000 15,000-22,000
Prince Anwar Shah Road 20,000-35,000 7,000-14,000
EM Bypass (Topsia) 15,000-25,000 6,000-10,000
Lake Town 10,000-16,000 4,000-7,500
New Town (AA- I, II & III) 9,000-15,000 3,500-6,000
Rajarhat 7,000-14,000 3,000-4,500
Behala 7,000-14,000 3,000-5,500
OFFICE
Demand Vacancy
RV CV
RETAIL
Demand Vacancy
RV CV
RESIDENTIAL
Demand Launches
RV CV
Demand/Vacancy
Rental Value (RV) / Capital Values (CV)Increasing Moderate Increase Stable Moderate Fall Falling
Pulse
Monthly Real Estate Monitor
DATA ANALYSIS FOR THE MONTH OF JUNE 2016
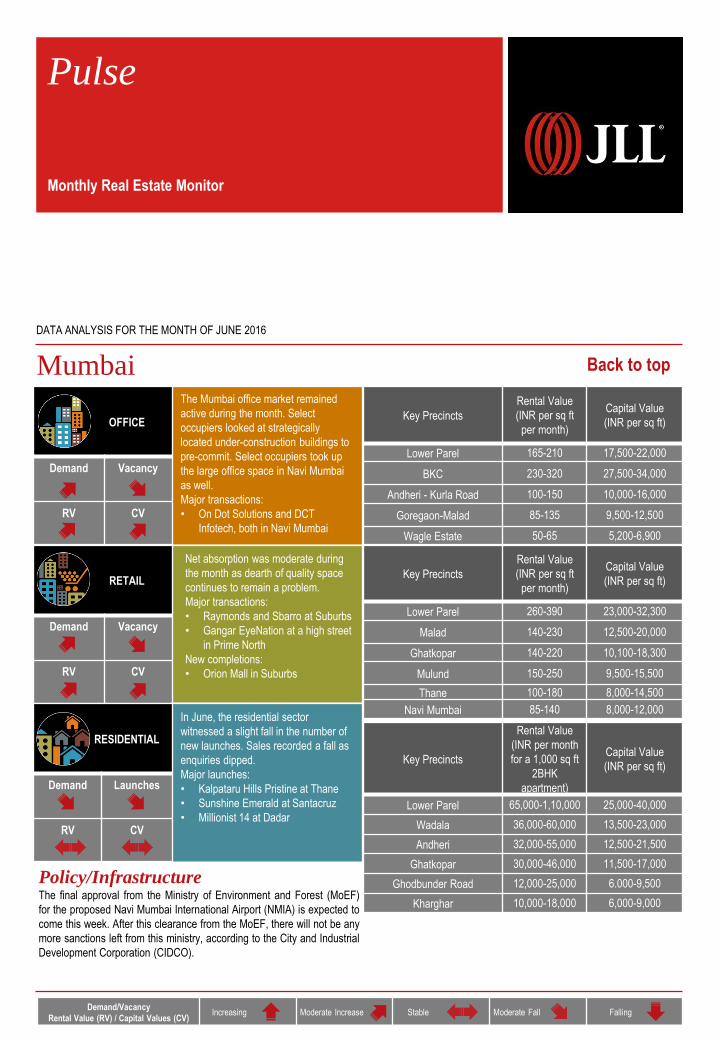
Mumbai
Policy/InfrastructureThe final approval from the Ministry of Environment and Forest (MoEF)
for the proposed Navi Mumbai International Airport (NMIA) is expected to
come this week. After this clearance from the MoEF, there will not be any
more sanctions left from this ministry, according to the City and Industrial
Development Corporation (CIDCO).
Back to top
The Mumbai office market remained
active during the month. Select
occupiers looked at strategically
located under-construction buildings to
pre-commit. Select occupiers took up
the large office space in Navi Mumbai
as well.
Major transactions:
• On Dot Solutions and DCT
Infotech, both in Navi Mumbai
Net absorption was moderate during
the month as dearth of quality space
continues to remain a problem.
Major transactions:
• Raymonds and Sbarro at Suburbs
• Gangar EyeNation at a high street
in Prime North
New completions:
• Orion Mall in Suburbs
In June, the residential sector
witnessed a slight fall in the number of
new launches. Sales recorded a fall as
enquiries dipped.
Major launches:
• Kalpataru Hills Pristine at Thane
• Sunshine Emerald at Santacruz
• Millionist 14 at Dadar
Key Precincts
Rental Value
(INR per sq ft
per month)
Capital Value
(INR per sq ft)
Lower Parel 165-210 17,500-22,000
BKC 230-320 27,500-34,000
Andheri - Kurla Road 100-150 10,000-16,000
Goregaon-Malad 85-135 9,500-12,500
Wagle Estate 50-65 5,200-6,900
Key Precincts
Rental Value
(INR per sq ft
per month)
Capital Value
(INR per sq ft)
Lower Parel 260-390 23,000-32,300
Malad 140-230 12,500-20,000
Ghatkopar 140-220 10,100-18,300
Mulund 150-250 9,500-15,500
Thane 100-180 8,000-14,500
Navi Mumbai 85-140 8,000-12,000
Key Precincts
Rental Value
(INR per month
for a 1,000 sq ft
2BHK
apartment)
Capital Value
(INR per sq ft)
Lower Parel 65,000-1,10,000 25,000-40,000
Wadala 36,000-60,000 13,500-23,000
Andheri 32,000-55,000 12,500-21,500
Ghatkopar 30,000-46,000 11,500-17,000
Ghodbunder Road 12,000-25,000 6.000-9,500
Kharghar 10,000-18,000 6,000-9,000
OFFICE
Demand Vacancy
RV CV
RETAIL
Demand Vacancy
RV CV
RESIDENTIAL
Demand Launches
RV CV
Demand/Vacancy
Rental Value (RV) / Capital Values (CV)Increasing Moderate Increase Stable Moderate Fall Falling
Pulse
Monthly Real Estate Monitor
DATA ANALYSIS FOR THE MONTH OF JUNE 2016
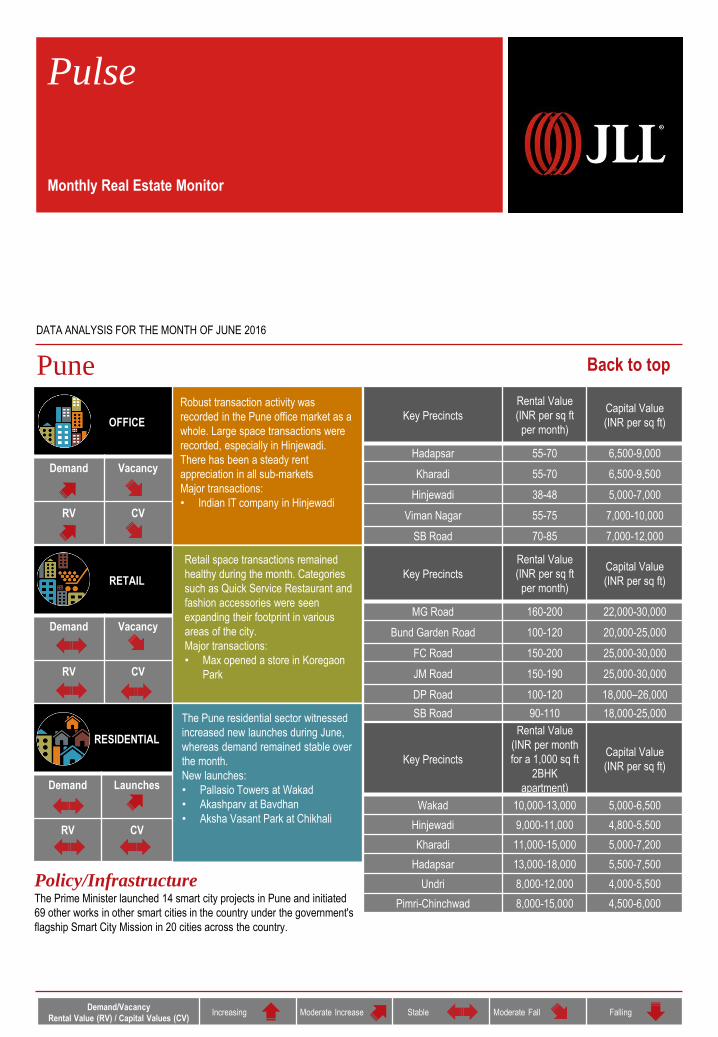
Pune
Policy/InfrastructureThe Prime Minister launched 14 smart city projects in Pune and initiated
69 other works in other smart cities in the country under the government's
flagship Smart City Mission in 20 cities across the country.
Back to top
Robust transaction activity was
recorded in the Pune office market as a
whole. Large space transactions were
recorded, especially in Hinjewadi.
There has been a steady rent
appreciation in all sub-markets
Major transactions:
• Indian IT company in Hinjewadi
Retail space transactions remained
healthy during the month. Categories
such as Quick Service Restaurant and
fashion accessories were seen
expanding their footprint in various
areas of the city.
Major transactions:
• Max opened a store in Koregaon
Park
The Pune residential sector witnessed
increased new launches during June,
whereas demand remained stable over
the month.
New launches:
• Pallasio Towers at Wakad
• Akashparv at Bavdhan
• Aksha Vasant Park at Chikhali
Key Precincts
Rental Value
(INR per sq ft
per month)
Capital Value
(INR per sq ft)
Hadapsar 55-70 6,500-9,000
Kharadi 55-70 6,500-9,500
Hinjewadi 38-48 5,000-7,000
Viman Nagar 55-75 7,000-10,000
SB Road 70-85 7,000-12,000
Key Precincts
Rental Value
(INR per sq ft
per month)
Capital Value
(INR per sq ft)
MG Road 160-200 22,000-30,000
Bund Garden Road 100-120 20,000-25,000
FC Road 150-200 25,000-30,000
JM Road 150-190 25,000-30,000
DP Road 100-120 18,000–26,000
SB Road 90-110 18,000-25,000
Key Precincts
Rental Value
(INR per month
for a 1,000 sq ft
2BHK
apartment)
Capital Value
(INR per sq ft)
Wakad 10,000-13,000 5,000-6,500
Hinjewadi 9,000-11,000 4,800-5,500
Kharadi 11,000-15,000 5,000-7,200
Hadapsar 13,000-18,000 5,500-7,500
Undri 8,000-12,000 4,000-5,500
Pimri-Chinchwad 8,000-15,000 4,500-6,000
For more information about our research, contact
Ashutosh Limaye
National Director, Research and REIS
+91 98211 07054 [email protected]
Aritra Das
Analyst, Research
+91 95157 20645 [email protected]
Research Dynamics 2016
Pulse reports from JLL are frequent updates on real estate market dynamics.
About JLLJLL (NYSE: JLL) is a professional services and investment management firm offering specialized real estate services to clients seeking
increased value by owning, occupying and investing in real estate. A Fortune 500 company with annual fee revenue of $5.2 billion and gross
revenue of $6.0 billion, JLL has more than 280 corporate offices, operates in more than 80 countries and has a global workforce of more than
60,000. On behalf of its clients, the firm provides management and real estate outsourcing services for a property portfolio of 4.0 billion square
feet, or 372 million square meters, and completed $138 billion in sales, acquisitions and finance transactions in 2015. Its investment
management business, LaSalle Investment Management, has $58.3 billion of real estate assets under management. JLL is the brand name, and
a registered trademark, of Jones Lang LaSalle Incorporated. For further information, visit www.jll.com
JLL has over 50 years of experience in Asia Pacific, with over 33,000 employees operating in 92 offices in 16 countries across the region. The
firm won 15 awards at the International Property Awards Asia Pacific in 2016 and was named number one real estate advisor in Asia at the 2015
Euromoney Real Estate Awards. www.ap.jll.com
About JLL IndiaJLL is India’s premier and largest professional services firm specializing in real estate. With an extensive geographic footprint across 11 cities
(Ahmedabad, Delhi, Mumbai, Bangalore, Pune, Chennai, Hyderabad, Kolkata, Kochi, Chandigarh and Coimbatore) and a staff strength of over
8500, the firm provides investors, developers, local corporates and multinational companies with a comprehensive range of services including
research, analytics, consultancy, transactions, project and development services, integrated facility management, property and asset
management, sustainability, industrial, capital markets, residential, hotels, health care, senior living, education and retail advisory. The firm was
awarded the Property Consultant of the Decade at the 10th CNBC-Awaaz Real Estate Awards 2015 and the Best Property Consultancy in India
at the International Property Awards Asia Pacific 2016-17. For further information, please visit www.joneslanglasalle.co.in
Recommended