Market Accessibility and
Regional Maps: Kyrgyz Republic
Brian Blankespoor (World Bank)
April, 2013
Poverty Reduction and Economic Management Unit
Europe and Central Asia Region
Document of the World Bank
76574
Pub
lic D
iscl
osur
e A
utho
rized
Pub
lic D
iscl
osur
e A
utho
rized
Pub
lic D
iscl
osur
e A
utho
rized
Pub
lic D
iscl
osur
e A
utho
rized
Pub
lic D
iscl
osur
e A
utho
rized
Pub
lic D
iscl
osur
e A
utho
rized
Pub
lic D
iscl
osur
e A
utho
rized
Pub
lic D
iscl
osur
e A
utho
rized
Market Access and Regional Maps: Kyrgyz Republic
2
Market Accessibility and Regional Maps: Kyrgyz Republic
Brian Blankespoor1
Abstract
Access to markets is argued to have a significant role in development. In order to quantify the access of places to markets, policy makers are showing increasing interest in accessibility indicators (Yoshida and Deichmann 2009). This paper seeks to examine the spatial relationship of access to market in the Kyrgyz Republic using a recent census and household survey in order to identify possible linkages with rates of poverty and other micro (spatial) information. This analysis uses the Market Accessibility Index that measures the potential connectivity of population or expenditures between village/towns and big cities via the transport network. Results show that high Market Accessibility is located near the large cities with a concentration of infrastructure, while low access is more in the rural areas. Future work will use this indicator in economic models to statistical identify its significance with regards to per capita expenditure and poverty.
Key words: Potential Accessibility; regional development, transportation; poverty mapping; GIS; Kyrgyz Republic
JEL classification: O18, R12, R58
World Bank Sector: PRM
This paper is a joint product of the Kyrgyz Repulic National Statistical Committee and the World Bank, which is prepared for Sarosh Sattar, TTL - Senior Economist (ECSP3) by Brian Blankespoor, Environmental Specialist (DECCT). This paper greatly benefited from discussion and information from the Kyrgyz Republic National Statistical Committee and others: Aziz Atamanov (ECSP3); Meera Mahadevan (PRMPR); Karen Stephanie Coulibaly (ECSP3); Cordula Rastogi, Senior Transport Economist (ECSS5); Nobuo Yoshida, Senior Economist (PRMPR); Mark Roberts (SASDU and DECEE); Uwe Deichmann, Senior Environmental Specialist (ECACE / DECEE); and Roy van der Weide, Economist (DECPI). The author would like to thank Shwetlena Sabarwal for reviewing this paper and providing insightful comments.
The findings, interpretations, and conclusions expressed in this paper are entirely mine. They do not necessarily represent the views of the Kyrgyz Republic National Statistical Committee and the International Bank for Reconstruction and Development/World Bank and its affiliated organizations, or those of the Executive Directors of the World Bank or the governments they represent.
Disclaimer: The boundaries, colors, denominations and any other information shown on these maps do not imply, on the part of The World Bank Group, any judgment on the legal status of any territory, or any endorsement or acceptance of such boundaries.
1 Environmental Specialist, Development Research Group, World Bank

Market Access and Regional Maps: Kyrgyz Republic
3
Executive summary
Access to markets is argued to have a significant role in development. In order to quantify the access
of places to markets, policy makers are showing increasing interest in accessibility indicators (Yoshida
and Deichmann 2009). For example, low access to social services, which is associated with low market
access, is linked with development challenges such as poor health and education outcomes (World Bank,
2009). This analysis uses the Market Accessibility Index that measures the potential connectivity
between village/towns and big cities via the transport network. Two inputs to potential connectivity are
calculated: population potential from 2009 population data and expenditure potential from household
survey per capita expenditure information. In Kyrgyz Republic, results show that high Market
Accessibility is located near the large cities with a concentration of infrastructure, while low access is
more in the rural areas. Higher access to population potential and expenditure potential are located in
the capital region and to a lesser degree near Osh city. The population potential and expenditure
potential results are highly correlated since the range of the population is greater than the range of per
capita expenditure, which in turn explains the similarity of the results from both inputs.
This paper suggests looking at development through a spatial lens in addition to a sector perspective.
Using access to market, a recent census and a household survey, the spatial relationships are examined
for linkages with rates of poverty and other micro (spatial) information. First, areas of poverty are
compared to market accessibility. Then, the comparison of poverty rate and market access to a number
of health, education and other indicators illustrate the wide variation of rayon and town characteristics
and spatial patterns in Kyrgyz Republic. With regards to health indicators and outcomes, the incidence
of registered illnesses is high in the urban areas, where as maternal and infant mortality rates are found
in the sparsely populated rayons. Hospitals and primary care facilities are located throughout with
higher concentration in the two major cities. Education attainment is high near the large cities and
education expenditure for both primary and secondary education is pro-poor. The average number of
students by school and the average class size per district are high in the two major cities and also At
Bashy. Finally, poverty areas are examined for areas of high unemployment and with sectors of
employment typical of low wages.
Policy makers can play a key role to promote the provision of basic services across the country and the
connectivity of lagging areas. The World Development Report 2009 on Reshaping Economic Geography
provides an economic geography framework for policy (World Bank 2009). Provision of basic services
such as health and education should be available to all regions that not only provide higher living
standards, but also better prepare people for the equality of opportunity in urban and rural areas. Also,
lagging areas need to be connected to leading areas. The Market Accessibility Index provides a measure
to rank rayon connectivity of population potential and expenditure potential. Policies that include the
promotion of the mobility of labor and the strengthening of investments can reduce the economic
distance to market and access to social services. This connectivity provides potential opportunities and
spillover effects for firms to locate in the appropriate places (e.g. land price and access to appropriate
labor).

Market Access and Regional Maps: Kyrgyz Republic
4
1. Introduction
With access to market and social services significantly determining the economic status and welfare of
the population, the increase of this access is argued to be a key contributor to poverty alleviation and
regional growth (Yoshida and Deichmann, 2009; World Bank, 2009). Access to market measures the
economic distance or connectivity between populated places, where high market access facilitates trade
by easing travel time and transportation costs. Since it has been proven empirically that trade can
increase per capita income, it follows that high access to market facilitates growth.2 Subsequently, low
access to social services, which is associated with low market access, is linked with development
challenges such as poor health and education outcomes (World Bank, 2009). So, it is important to
measure accessibility to assist policy makers in quantifying this key indicator related to growth.
Transportation networks play a pivotal role in access to markets by connecting economic centers to
economic activities and people to social services. High density and high quality infrastructure can reduce
transport costs, which in turn provide gains in trade3. From three case-studies, Bryceson et al. (2008)
suggest that road connectivity can provide poverty reduction when the time and distances make
available “greater economic opportunities or better access to social services or useful social contacts”
(478). Previous work that investigated the benefits of a large infrastructure investment in Bangladesh
suggests that the benefits of connectivity of the Jamuna Bridge from the Central Region to the North-
West Region are much larger than originally estimated through cost and time saving analysis (Masood
2009),4 which provided higher access to the capital region from the North-West Region.
Not only is access to market important, it can be compared to variety of micro (spatial) information. In
recent years, Geographic Information Systems (or GIS) technology has improved and provides a
common platform for a variety of micro (spatial) information that can be shown with a poverty map to
visualize and analyze this important linkage. Scenarios can also be created to analyze interventions to
infrastructure such as the creation of a major new bridge (e.g. Padma Bridge in Bangladesh in
Blankespoor and Yoshida, mimeo). This projection model is useful not only for quantifying
improvements in market accessibility via creating a new bridge or expanding a new road network, but
also for translating the effects onto poverty reduction.
2 Notably, the economy of the populated place also is a significant factor in gains from trade. In addition, a study of China
concluded that access to market explained a significant portion of the interindividual differences in returns to labor (Hering and Poncet, 2010).
3 As the market size increases, so does the potential for specialization and economies of scale. This may be one reason that a
large share of development projects are in the transport sector. 4 Notably, three improvements are mentioned. First, per capita growth in the benefitted area was 3 times of the control area.
Second, the decline in the extreme poverty in project villages was 2.5 more than that of control villages. Third, areas under perishable but high value products like vegetables, onion, spices and oilseeds, increased in project areas by about 10 percent while the same declined in control villages by about 18 percent.

Market Access and Regional Maps: Kyrgyz Republic
5
This paper provides the methodology to create a measure of market access applied to the Kyrgyz
Republic and examines rates of poverty and other micro (spatial) information using a recent census and
household survey in order to identify possible linkages.
The rest of the paper is organized as follows. Section 2 provides the analytical framework. Section 3
describes the data. Section 4 presents the empirical framework. Section 5 has the results and
discussion. Section 6 has the references and section 7 has an appendix with a table.
2. Framework
Given that economic activity often takes place where people are located and larger populated places
lead to agglomeration economies by efficiencies in production, proximity to economic distance matters.
As part of the New Economic Geography literature5, the World Development Report (WDR) 2009 (World
Bank 2009) argues that economic outcomes have transformed along three dimensions: distance, density
and division. One factor that contributes to economic distance is the infrastructure that connects the
centers of economic activity. Physical factors also influence economic distance like high mountain
ranges that make travel and trade difficult. Economic density shows the locations and size of populated
places. Economic division addresses the ease of movement, particularly international borders.
Building on the framework of the WDR 2009, Poor Places, Thriving People (World Bank 2011) presents a
typology of economic geography dimensions in the Middle East with careful attention to the local
characteristics of the lagging regions, which have the disadvantage of a limited market size. The report
suggests looking at development through a spatial lens instead of a strict sector perspective. Although
admittedly sectors are more clearly and cleanly defined vis-à-vis boundaries, institutions and
relationships, a spatial lens promotes the need to provide access to basic services in all regions and
connect lagging regions to leading regions.
Connectivity from the leading regions to the lagging regions can help reduce poverty by providing access
to agglomeration economies, additional educational opportunities, specialized social services and
greater size and type of markets. In more remote areas, farmers may have increased incentive to
produce the full potential of the land when provided less middle traders and easier access to markets
(Yoshida and Deichmann 2009). The relationship between poverty alleviation and connectivity of lagging
and leading regions, services and markets is complex and maps can illustrate spatial patterns, however
the maps display correspondence without suggesting causation.
With regards to the economic geography of the Kyrgyz Republic, Atamanov and Sattar (mimeo) explore
the contrasting hypotheses of “concentration” and “geography” with household survey data. The
concentration hypothesis suggests that poverty is related to the personal attributes, which make them
poor, whereas the geography hypothesis suggests that the returns from individual characteristics differ
5 Also, for example, see Fujita and Mori 2005

Market Access and Regional Maps: Kyrgyz Republic
6
according to the geography6. The authors’ findings include a large disparity of welfare between urban
and rural areas and can be explained by the concentration or density of better characteristics that is
dominated by the capital (Bishkek) region’s high living standards. In addition, Bishkek not only performs
better than all other urban areas due to a high concentration of better characteristics and these
characteristics provider greater returns than all other urban areas. This report does not include
information on accessibility.
Geographic technologies have improved and assist economic analysis by linking spatial information that
can increase understanding of the spatial distribution of poverty, human capital, physical investment,
and outcomes. Linking factors geographically with micro data can be combined to illustrate linkages with
poverty and indicate ways to address it (e.g. growth).
Hypotheses
Hypothesis 1:
Areas of high poverty are located in areas with low market accessibility.7
Hypothesis 2:
Areas of high poverty overlap areas with low coverage of basic services such as education and health.
Hypothesis 3:
Areas of high poverty overlap with areas of high unemployment.
Hypothesis 4:
Areas of high poverty overlap with sectors of employment typical of low wages.
In order to quantify access to market, this paper uses the market accessibility index (Deichmann 1997).
Then, this index is used to visually display areas of poverty coincident to areas of potential economic
activity.
Market Accessibility Index
This Market Accessibility index is part of a large literature of “accessibility index” see e.g. Deichmann
(1997), Geertman and Ritsema van Eck (1995), Guy (1983), Hansen (1959), Ingram (1971), Selza et al.
(2011), and Yoshida and Deichmann (2009). World Bank applications of the index include: Bangladesh
(Blankespoor and Yoshida, mimeo), Sri Lanka (Yoshida and Deichmann 2009), West Bank and Gaza
(World Bank 2011b) and Egypt (World Bank 2012a).
6 See Skoufias and Katayama, 2011
7 Market Accessibility is defined and measured with two different inputs: population potential and expenditure potential. See
Empirical framework Section 4.

Market Access and Regional Maps: Kyrgyz Republic
7
Exploiting the theory of a classic gravity model, the Market Accessibility index is a measure of potential
economic connectivity between village/towns and big cities. These population centers are considered a
proxy of market size or population potential. This metric discounts the market size proxy by an estimate
of travel time along a transportation network, which assigns little relevance of a market size in a very far
place from the origin or, conversely, assigns a strong relevance for markets in close proximity to the
origin. Using the transportation network and estimated travel time is a more realistic measure of
economic distance than Euclidean distance because not all distances are equal in travel time and
physical or man-made barriers may provide routes that are not straight line distance. Since various
methodologies exist for the discount of the market size, a robustness test is suggested.
Geo-referenced transportation data provide the network for the analysis from which to calculate the
estimates of travel time. Geo-referenced GIS data are essential in establishing the transportation
network. Ideally, these data are in GIS format and the lines are topologically connected (i.e. each road
segment is geographically connected to the adjacent road segment). These geographic features provide
the location of the roads; however information about each segment is used in constructing a reasonable
travel time model such as road class (national, regional, local, minor, other).
The market accessibility index calculation with the negative exponential potential model is:
(EQ. 1)
Where S is the size of the population, j is one of the set of populated places considered in the model, I
is the potential calculated at every node of the network, and a and b are distance decay parameters.
3. Data and variables
Population
Geo-referenced population information is used to identify the locations of potential markets. Population
numbers from 2009 are derived from the National Statistical Committee (NSC) (2010) at the rayon, town
and city level8. Population locations were derived from the locations from ARIS (Kyrgyz Republic's
Community Development and Investment Agency) that had an urban footprint and the United Nations
(UN) Common and Fundamental Operational Datasets (COD-FOD), which had location coordinates and
population for approximately 20 locations. When both the ARIS and UN COD-FOD had matching place
names, the location of ARIS was deemed more precise. Demographic information such as mean
8 The number of observations is 56 and it also includes differentiating two exclaves from the rayons: Paniflov and Zhayiyl.
22/*
ad
jj
nei
bijeSI

Market Access and Regional Maps: Kyrgyz Republic
8
household size and gender of the household head (0 = male and 1= female) are from 2009 and derived
from the NSC (2010).
Poverty rate – head count rate
Poverty rate are calculated from povmap and used for display purposes in this paper. These data are
produced using the ELL method (Elbers et al., 2003) from data in the Kyrgyz Integrated Household
Survey (2009) and the 2009 census (The National Statistical Committee of the Kyrgyz Republic 2010) -
(for details see Mahadevan, Yoshida, mimeo).9
Education
Shares of households completing levels of education are derived from the 2009 census. There are nine
categories considered in the education variable: 0: "No Education", 1 "Higher Professional Degree", 2
"Incomplete Higher Professional Degree", 3 "Secondary Professional Degree", 4 "Primary Vocational
Degree", 5 "Secondary General (Complete)", 6 "Basic General (Secondary Incomplete)", 7 "Elementary
General (Primary)", 8 "Without Elementary Education", and 9 "Illiterate". Four variables are constructed
from these dummies: the percent of the household with primary education, secondary education,
tertiary education or vocational education.10 Other education data, which are average number of
students per school in a district, number of schools per 10000 population and average class size, are
provided by the United Nations Kyrgyzstan district profile (United Nations, 2013) that sources data from
the National Statistical Committee of the Kyrgyz Republic as of the year 201111 and the 2009 population.
Health
By rayon, the Ministry of Health (2009) provides data on the number of beds, maternal mortality rate
and the Infant mortality rate. In addition, the census provides the number of people registered with an
illness and by specific disease such as infections and parasitic diseases and blood circulation diseases by
rayon from which a rate of the 2009 population is constructed (The National Statistical Committee of the
Kyrgyz Republic 2010). Also, the United Nations Kyrgyzstan district profile that sources data from the
National Statistical Committee of the Kyrgyz Republic 2011 has information on the number of hospitals,
the number of primary health care, the number of doctors and the number of nurses (United Nations,
2013). The number of health workers per 1000 is constructed using the UN-NSC total number of doctors
and nurses divided by the 2009 population per 1000.
9 Kindly provided by M. Mahadevan and N. Yoshida
10 Pri = dum7 + dum8 + dum9. Sec = dum5 + dum6. Ter = dum1 + dum2. Voc = dum3 + dum4
11 The UN district profile provides 40 districts and two cities: Osh city and Bishkek city. A selection of the districts in the report
does not have the number of primary students: Alamudun, Ton, Ak-Talin, At Bashynsky, Jumgal, Chon-Alai, Osh city, Bakai-Ata, and Kara-Buurinsky.

Market Access and Regional Maps: Kyrgyz Republic
9
Sector or employment
The 2009 census (The National Statistical Committee of the Kyrgyz Republic 2010) provides information
on the share of the household in a specific sector of employment and the percent of the household
employed. The sectors of employment include: manufacturing (mfg), agriculture (agri), construction
(constr), trade (trade), transport (trans), mining (min) and electricity / gas / water (egw).
Night time lights
Night time light composite of 2010 is downloaded from US NOAA and quantifies the luminosity, which
observes without filter the average of the visible band digital number values (0 – 63) by grid cell at 30
arc second grids.
Fiscal investment
BOOST data12 are obtained for the Kyrgyz Republic for the year 2010 (Table 4). These data provide
consolidated general government spending (excluding intrabudgetary transfers). A selection of these
data is used to determine the government spending in transport category (7045: Transport) and capital
investments in road repair (70451: Road transport and 31113320: Capital repair of roads). Education
expenditures for pre-school and primary education are from (7091: Pre-school education), primary and
secondary expenditures (7092: Primary and Secondary education) and tertiary education expenditures
(7094: Tertiary education).
Current Roads
Current transport network in Kyrgyz Republic GIS data are provided by ARIS. These data have the
following road segment categories: motor road, blacktop road, ground road, unpaved road and
horsepath. The main road data for Tajikistan, Kazakhstan and Uzbekistan are from Open Street Maps
(2012).
Border crossing
In particular, the current roads for the Osh-Batken-Isfana segment cross the Uzbekistan and Tajikistan
borders. Point location (coordinates) for each border crossing on the road network for current Osh-
Batken-Isfana road network is estimated and identified in the IBRD map 36940. Estimated wait times at
each border crossing (in order to estimate average travel time with border crossings) are 4 hours.
4. Empirical framework
In order to construct the market accessibility index, data modifications are made and a travel time
model is constructed.
12
BOOST was constructed on the basis of Ministry of Finance treasury data kindly provided by Karen Stephanie Coulibaly

Market Access and Regional Maps: Kyrgyz Republic
10
Market Accessibility specification: population potential and expenditure potential
A travel time model is constructed based on available GIS data in order to assess all possible travel
routes between the target city and the origin on a transportation network, and search for the shortest
travel time from each origin to each target city. The construction of the transportation network can
involve multiple data sources and needs effort to ensure connectivity between all segments to each
other. The travel time model is constructed with the best available information and uses the given road
class and road condition information available for each segment, then an estimated travel speed is
assigned for all possibilities of class and condition (Table 1).
Given EQ 1 of the Market Accessibility Index, the model is run with two different inputs as the size
variable. First, the size variable is population for population potential and is provided from the 2009
census. Second, an addition model output of accessibility is the expenditure potential, which is
information provided by the per capita expenditure by rayon from the household survey combined with
the 2009 population information from the National Statistical Committee. The decay parameters of the
model are a=0.5 and b=20.13
After the Market Accessibility Index model produces an observation for each junction in the road
network, ESRI ArcGIS inverse distance weighting (parameters: 12 nearest neighbors) is used to create a
continuous surface. Since activity is most likely to occur near the roads and in populated areas, the final
step summarizes the rayon-level average of the Market Accessibility Index derived within a 2 Kilometer
buffer from each road segment.
Caveats
The data do not allow for particular consideration of Osh city due to data issues in the Household
Budget Survey (2009)14; the information is marked as no data. Other caveats include: many factors
contribute to the connectivity of places – accessibility - beyond travel time, distance and per capita
expenditure such as tangible (informal and formal barriers such as border controls and/or tolls) and non-
tangible (religion, language and cultural practices and heritage). The accessibility index is a relative
ranking of connectivity, which is normalized from 0 to 100, and the interpretation of the results should
be a comparison to other rayons and towns.
Data modification
The following modifications are made to the data in order to perform the analysis.
13 The following parameters are suggested in the accessibility model from previous work (Deichmann 1997):
costdistance threshold = 3 hours, cost/distance decay exponent for the negative exponential model of 1.5; and cost/distance to the point of inflection of the distance decay function at 90; and input weights transformation – inscale a square root transformation on the input weights: 2 and choose the exponent to compute square roots: 0.5.
14 See Mahadevan, M., and N. Yoshida. Poverty Mapping in Kyrgyz Republic. Mimeo for more details.
Market Access and Regional Maps: Kyrgyz Republic
11
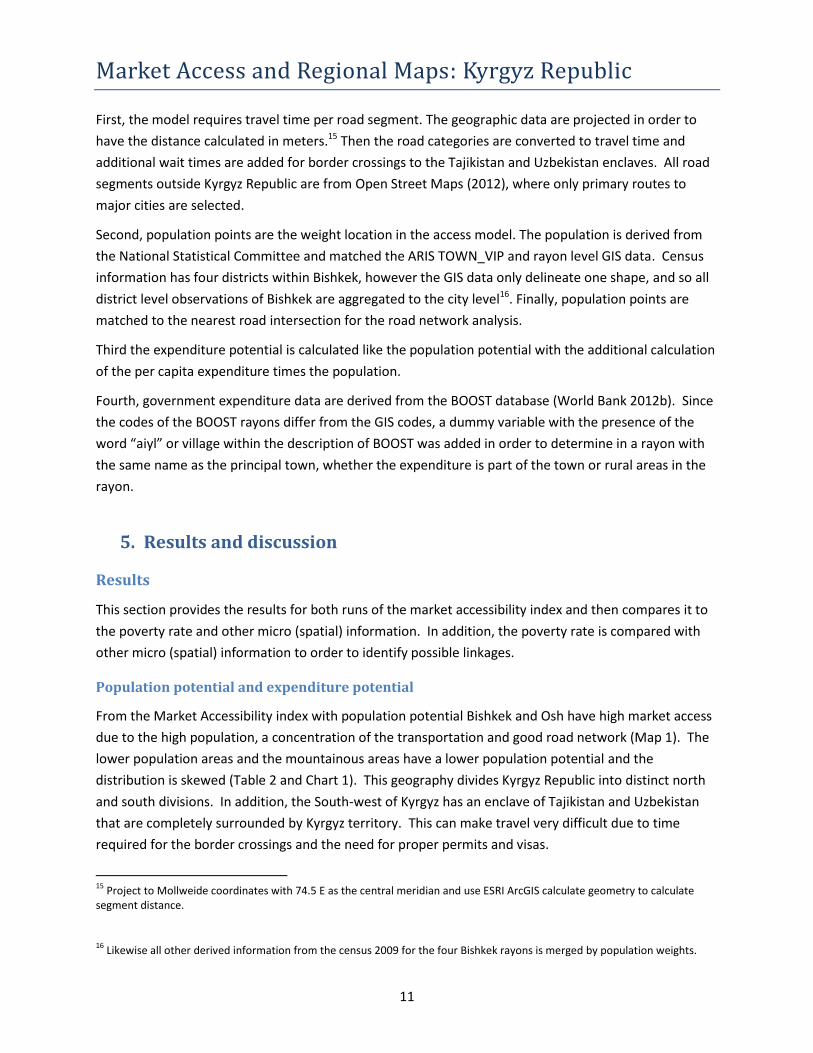
First, the model requires travel time per road segment. The geographic data are projected in order to
have the distance calculated in meters.15 Then the road categories are converted to travel time and
additional wait times are added for border crossings to the Tajikistan and Uzbekistan enclaves. All road
segments outside Kyrgyz Republic are from Open Street Maps (2012), where only primary routes to
major cities are selected.
Second, population points are the weight location in the access model. The population is derived from
the National Statistical Committee and matched the ARIS TOWN_VIP and rayon level GIS data. Census
information has four districts within Bishkek, however the GIS data only delineate one shape, and so all
district level observations of Bishkek are aggregated to the city level16. Finally, population points are
matched to the nearest road intersection for the road network analysis.
Third the expenditure potential is calculated like the population potential with the additional calculation
of the per capita expenditure times the population.
Fourth, government expenditure data are derived from the BOOST database (World Bank 2012b). Since
the codes of the BOOST rayons differ from the GIS codes, a dummy variable with the presence of the
word “aiyl” or village within the description of BOOST was added in order to determine in a rayon with
the same name as the principal town, whether the expenditure is part of the town or rural areas in the
rayon.
5. Results and discussion
Results
This section provides the results for both runs of the market accessibility index and then compares it to
the poverty rate and other micro (spatial) information. In addition, the poverty rate is compared with
other micro (spatial) information to order to identify possible linkages.
Population potential and expenditure potential
From the Market Accessibility index with population potential Bishkek and Osh have high market access
due to the high population, a concentration of the transportation and good road network (Map 1). The
lower population areas and the mountainous areas have a lower population potential and the
distribution is skewed (Table 2 and Chart 1). This geography divides Kyrgyz Republic into distinct north
and south divisions. In addition, the South-west of Kyrgyz has an enclave of Tajikistan and Uzbekistan
that are completely surrounded by Kyrgyz territory. This can make travel very difficult due to time
required for the border crossings and the need for proper permits and visas.
15
Project to Mollweide coordinates with 74.5 E as the central meridian and use ESRI ArcGIS calculate geometry to calculate segment distance.
16 Likewise all other derived information from the census 2009 for the four Bishkek rayons is merged by population weights.

Market Access and Regional Maps: Kyrgyz Republic
12
Map 1 : Market Accessibility - population potential
Although Bishkek and Osh are arguably strong contributors to the economy, the Market Access is an
improvement from other measures such as Euclidean distance from major cities (Map 2), because it
incorporates more populated places and the connectivity by the transportation network.
Map 2 : Distance to major cities: Bishkek and Osh

Market Access and Regional Maps: Kyrgyz Republic
13
Similar to the population potential map, the map of Market Accessibility with expenditure potential
shows the Bishkek area dominates and in the south there are some islands of prosperity near Osh (Map
3) – only a few subtle differences of the urban areas reflecting a higher rank of expenditure versus
population (Table 3 and Chart 2). The results are also consistent with the statistical understanding that
the range of values of the population by rayon is greater than the range of per capita expenditure by
rayon, so the rayon variance of expenditure potential is mainly driven by the population data17.
Map 3: Market Accessibility - expenditure potential
17
This result confirms the importance of population potential even in the absence of per capita expenditure data.

Market Access and Regional Maps: Kyrgyz Republic
14
Comparison of population potential and expenditure potential with other micro data in
panel maps
The Market Accessibility Index with population potential and expenditure potential assist in identifying
the connectivity of different regions. Additional information provides context to the populated places
such as geographic context (e.g. elevation – Map 4), economic activity, and government expenditures.
The locations of many of the populated places are in the lower elevation areas in the North near the
capital Bishkek, the Fergana valley or near Lake Issyk Kul. These locations also coincide with bright areas
in the night time lights map (Map 5). This measure can provide a possible illustration of income per
capita, since it is a determinant of night time lights and it follows that night time lights can shed light on
places of economic activity (Henderson et al. 2011). Information from BOOST, which is a database of
expenditures from the Ministry of Finance, displays the transport and capital road repair expenditures
from 2010 (Map 6 and 7). A large per capita expenditure in transport and capital road repair is specially
located in urban areas and the South East rayons that are adjacent to China and Tajikistan. This is likely
linked with current and recent infrastructure projects in lagging regions.
Map 4 : Elevation and populated places

Market Access and Regional Maps: Kyrgyz Republic
15
Map 5 : Night time light composite for 2010
Map 6 : Transport expenditure (total and per capita)

Market Access and Regional Maps: Kyrgyz Republic
16
Comparison of poverty rate with other micro data in panel maps
Micro data can be combined to illustrate linkages with poverty and access measures and indicate ways
of address it (e.g. growth). In general, the high access measures are in areas with a lower poverty rate,
however variation in the character of laggings areas exists. This section explores poverty rate,
population potential and expenditure potential, basic services such as health and education, and
employment (sectors and percent of the household).
Many of the areas of high poverty rate are located in areas with low Market Accessibility with
expenditure potential (Map 7). The central rayon of Toguz-Torous and the rayons south of Lake Issyk-
Kul are most notable. Likewise, areas of high consumption are located in areas with high market access.

Market Access and Regional Maps: Kyrgyz Republic
17
Map 7: Poverty rate, total poverty, expenditure potential and population potential

Market Access and Regional Maps: Kyrgyz Republic
18
Demographic characteristics of household size and gender reveal variation in the areas of high poverty
rate (Map 8). High household size is present in the West and South-west rayons. The percent of
households that have a female household head is lower than male household head, which is present
mainly in the capital region. Information about migration and remittances would be interesting to
explore in light of this finding and perhaps labor migration is more widespread in the south compared
with the north.

Market Access and Regional Maps: Kyrgyz Republic
19
Map 8 : Demographic characteristics: mean household size and gender of household head (0 = male and 1 = female)
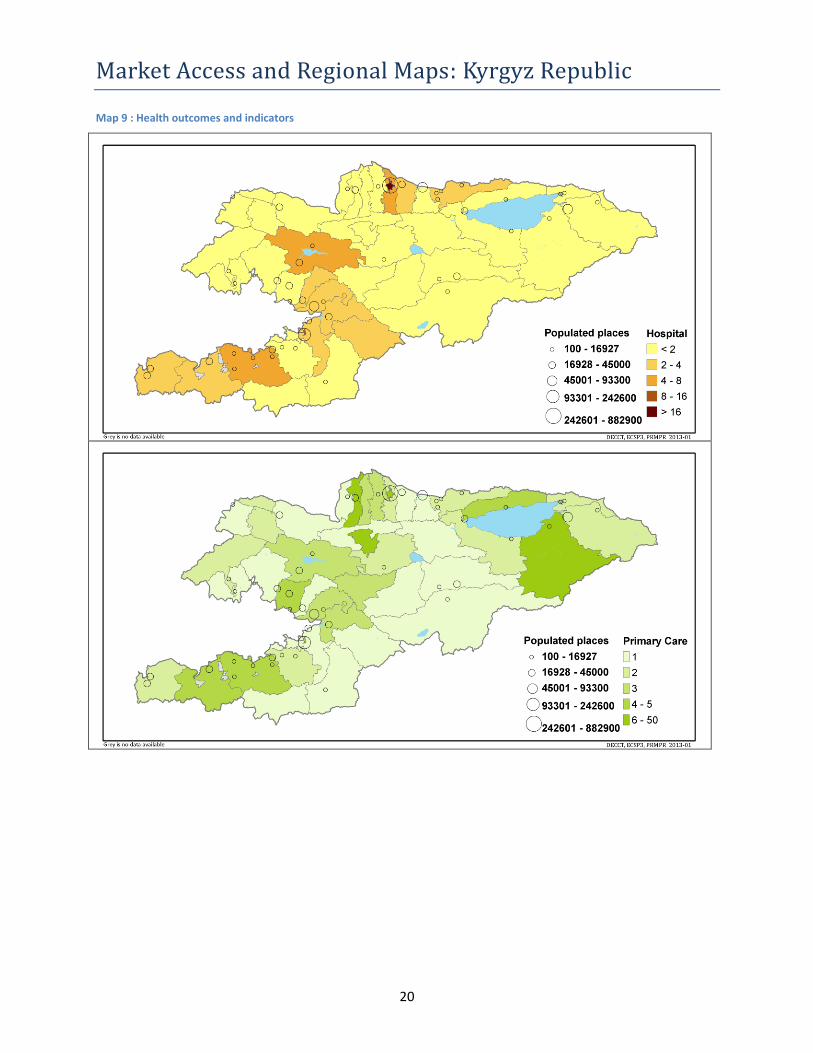
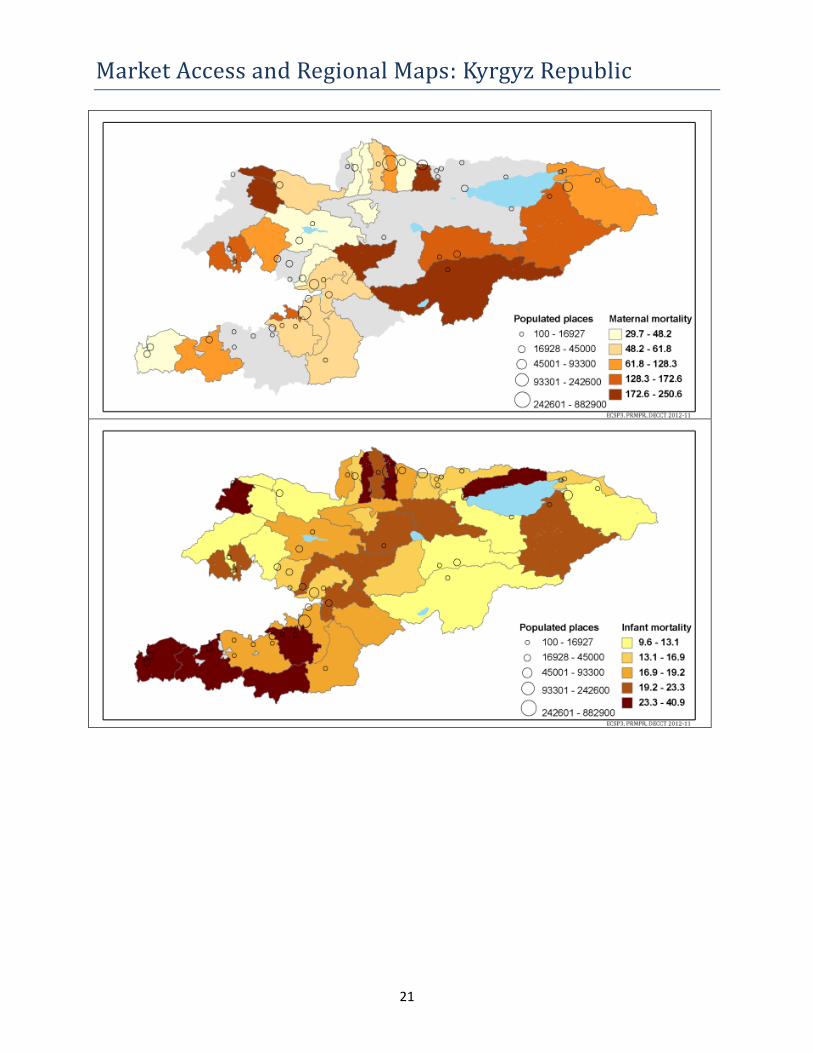
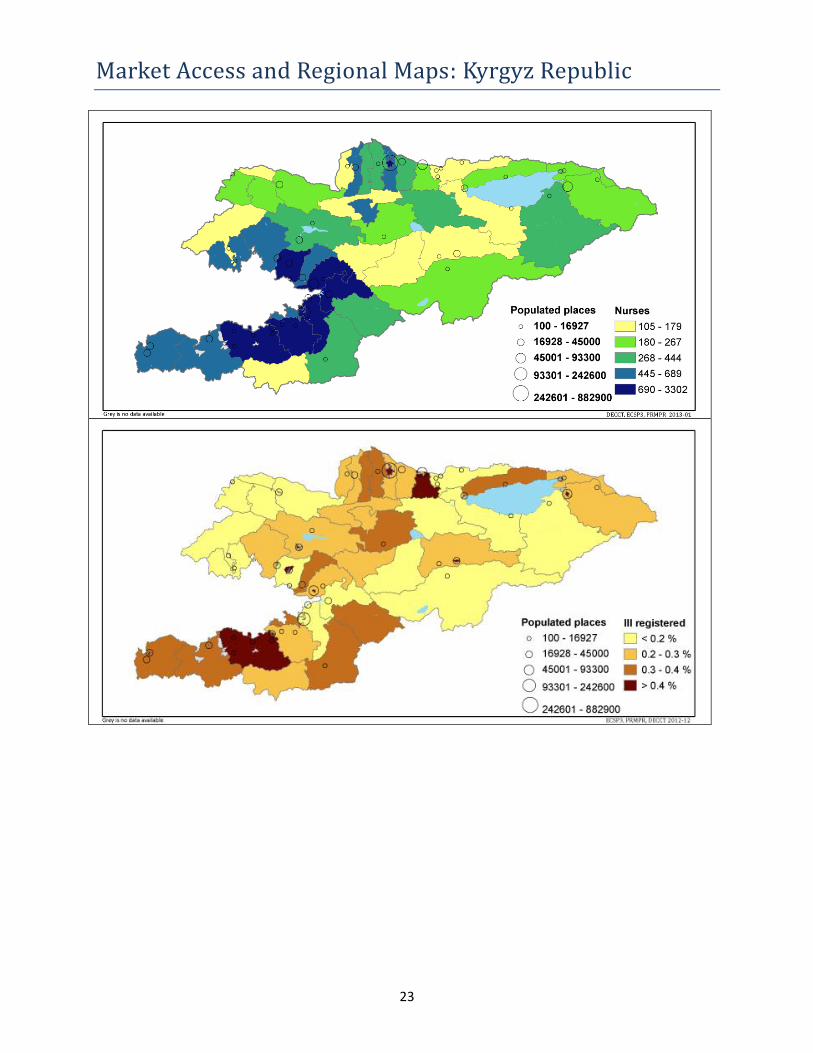
Areas of high poverty are located in areas with poor health outcomes (e.g. infant and maternal
mortality). The number of doctors, nurses and beds are concentrated in the capital region and the
Southwest region near Osh; however number of hospitals and primary health care are located more
evenly in both regions and towns with notable exceptions of Osh and Bishkek (Map 9). Information on
the incidence of illness is from the census and shows the number of registered ill are concentrated in
urban areas and the total number highest in the capital region and near Osh. This pattern could be due
to the incentive for registration of social services available in the urban areas.
Market Access and Regional Maps: Kyrgyz Republic
20
Map 9 : Health outcomes and indicators
Market Access and Regional Maps: Kyrgyz Republic
21

Market Access and Regional Maps: Kyrgyz Republic
22
Market Access and Regional Maps: Kyrgyz Republic
23

Market Access and Regional Maps: Kyrgyz Republic
24

Market Access and Regional Maps: Kyrgyz Republic
25
With regards to household characteristics of water, sanitation, and electricity, high coverage of
electricity is uniform across the rayons both urban and rural, however variation of access to toilet,
sewage and indoor water exist.

Market Access and Regional Maps: Kyrgyz Republic
26
Map 10 : Water and sanitation household characteristics

Market Access and Regional Maps: Kyrgyz Republic
27
Areas of high poverty do overlap areas with higher than average percent of the household employed,
but the dominant trend in household employment is higher in the central and Western rayons and
select urban areas (Map 11).

Market Access and Regional Maps: Kyrgyz Republic
28
Map 11 : Average percent of the household employed
With regards to education, high rates of literacy exist in all rayons, however wide variation exists
between areas of high poverty and levels of education (Map 12). The general pattern shows that the
population of high levels of education concentration is located near relatively higher population areas.
Households with a large share of tertiary education or vocational education are located in cities and the
northern capital region18. Preschool along with primary and secondary levels of education follow the
same pattern with a much higher completion rate as expected. With regards to educational expenditure,
the expenditure of pre along with the primary and secondary education is disproportionately located in
the lagging regions displaying pro-poor expenditures. Tertiary education expenditures are concentrated
in the urban areas.
18
A bias may exist since the level of education for Osh city is not displayed.

Market Access and Regional Maps: Kyrgyz Republic
29
Map 12 : Education (primary, secondary, tertiary)

Market Access and Regional Maps: Kyrgyz Republic
30

Market Access and Regional Maps: Kyrgyz Republic
31

Market Access and Regional Maps: Kyrgyz Republic
32

Market Access and Regional Maps: Kyrgyz Republic
33

Market Access and Regional Maps: Kyrgyz Republic
34
With regards to sector employment, sector employment has varied spatial pattern (Map 10). The
households, which have a higher than average participation in manufacturing, are located in the capital
region and cities. Agriculture is in the regional areas with a cluster in the West – Southwest around the
Fergana valley. With regards to wages, agriculture and manufacturing are often labor intensive and
associated with low wages. Agriculture has a large share of household employment and perhaps the
high intensity work includes more family members than other sectors. The rayons in the Fergana valley
and East of Lake Issyk Kul have relatively higher shares than other rayons. Trade, transport and
commerce are located near the major populated areas. Trade has a weak presence in the central and
Eastern rayons. Mining has a small yet relatively noticeable share of household employment in the
central rayon of Toguz-Torous and the rayons South and East of Lake Issyk Kul. The electric / gas / water
sector is in the North and urban areas.

Market Access and Regional Maps: Kyrgyz Republic
35
Map 13 : Sectors of employment: manufacturing, agriculture construction, trade and transport.

Market Access and Regional Maps: Kyrgyz Republic
36

Market Access and Regional Maps: Kyrgyz Republic
37

Market Access and Regional Maps: Kyrgyz Republic
38
Policy perspective
Previous reports suggest looking at development through a spatial lens in addition to a sector
perspective, although admittedly sectors are more clearly and cleanly defined vis-à-vis boundaries,
institutions and relationships.
A wide variation of characteristics in the lagging areas exists in Kyrgyz Republic. Access to services is not
uniform. The health and education outcomes and indicators display difference between leading and
lagging areas. Larger shares of low education are present in the lagging areas. With regards to health,
almost all rayons have at least one or two hospitals, yet health outcomes such as infant and maternal
mortality are still higher in lagging areas. Provision of basic services should be available to all regions
that not only provide higher living standards, but better prepare people for the equality of opportunity
in urban and rural areas.
Lagging areas need to be connected to leading areas. Policies that include the promotion of the mobility
of labor and the strengthening of investments can reduce the economic distance to market and access
to social services, however can also reduce economic opportunity. This connectivity provides potential
opportunities and spillover effects for firms to locate in the appropriate places (e.g. land price and
access to appropriate labor) that may promote economic clusters.19
19
Although this report focuses on domestic connectivity, the World Development Report 2009 (World Bank 2009) discusses connectivity at an international level. Small area countries benefit from openness to regional trade due to the lesser capacity to compete in the global market for goods and services.

Market Access and Regional Maps: Kyrgyz Republic
39
Conclusion
The market accessibility index with population potential and expenditure potential illustrate the
connectivity between populated places. Higher access to population potential and expenditure
potential are located in the capital region and to a lesser degree near Osh city. The population potential
and expenditure potential results are highly correlated since the range of the population is greater than
the range of per capita expenditure, which in turn explains the similarity of the results from both inputs.
The comparison of poverty rate and market access to a number of health, education and other
indicators illustrate the wide variation of rayon characteristics and spatial patterns in Kyrgyz Republic.
Four particular hypotheses are examined for correspondence between information. These relationships
are complex and the spatial patterns can provide insight to further investigation of the causation. First,
areas of high poverty show correspondence to areas with low market accessibility. The connectivity of
lagging is generally more distant than leading areas to large population centers where a relatively high
concentration of economic activity takes place. Second, areas of high poverty and areas of low coverage
of basic services such as education and health illustrate a wide variation of rayon and town
characteristics and spatial patterns in Kyrgyz Republic. With regards to health indicators and outcomes,
the incidence of registered illnesses is high in the urban areas, where as maternal and infant mortality
rates are found in the sparsely populated rayons. Education attainment is high near the large cities and
education expenditure for both primary and secondary education is pro-poor. Third, areas of high
poverty do overlap areas with higher than average percent of the household employed, but the
dominant trend in household employment is higher in the central and Western rayons and select urban
areas. Fourth, areas of high poverty overlap with sectors of employment typical of low wages. The
households, which have a higher than average participation in manufacturing, are located in the capital
region and cities and do not show correspondence with high poverty. However, agriculture is in the
regional areas with a cluster in the West – Southwest around the Fergana valley.
The information and maps in this paper can foster looking at development with a spatial perspective in
Kyrgyz Republic. Leveraging previous work including the World Development Report 2009 (World Bank
2009) provides an economic geography framework for analysis and policy recommendations. Policy
makers can play a key role to promote the provision of basic services across the country and the
connectivity of lagging areas.
Future work
Policy scenarios can be useful to visualize and examine the potential impact. Future work may consider
scenarios to the transportation network and see the impact on Market Accessibility Index. In cases
where ex-ante analysis is of interest, transportation information about the actual or anticipated changes
of the road information (e.g. such as an upgrade of a road segment from unpaved to paved) is important
to identify changes in travel time. In cases where a scenario is suggested to significantly alter the travel
time network, information about the type of shock is needed. For example, roads may become
impassable with a snow event or a landslide; identify the road segments that are altered by the shock.

Market Access and Regional Maps: Kyrgyz Republic
40
In cases where seasonal conditions contribute significantly to travel time, information about the passage
of routes in the winter and summer are needed. Another body of work may consider the effect of
accessibility indicator in economic models to statistical identify its significance with regards to per capita
expenditure, poverty and employment outcomes.

Market Access and Regional Maps: Kyrgyz Republic
41
6. References
“It’s unwise to pay too much, but it’s foolish to spend too little”: Sustainable road sector development
through asset management in the Kyrgyz Republic. Report. Received 2012-03-02.
ARIS. (Kyrgyz Republic's Community Development and Investment Agency) GIS data.
Atamanov, A. and S. Sattar. Regional disparities report. Kyrgyz Republic Programmatic Poverty
Assessment. Mimeo.
Blankespoor and Yoshida. Market Accessibility in Bangladesh. mimeo
Bryceson, D.F., Bradbury, A., Bradbury, T., 2008. Roads to Poverty Reduction? Exploring Rural Roads’
Impact on Mobility in Africa and Asia. Development Policy Review 26.
Deichmann, U. 1997. Accessibility indicators in GIS. United Nations Statistics Division.
Elbers, C., Lanjouw, J.O., Lanjouw, P., 2003. Micro-Level Estimation of Poverty and Inequality.
Econometria, 71, 355-364.
Fujita, M., Mori, T., 2005. Frontiers of the New Economic Geography. Papers in Regional Science, 84(3),
377-405.
Geertman, S. and J. Ritsema van Eck 1995. “GIS and models of accessibility potential: An application in
planning”, International Journal of Geographic Information Systems, 9 (1), p67-80
Guy, C. 1983. “The assessment of access to local shopping opportunities: A comparison of accessibility
measures”, Environment and Planning B, 10, p219-238
Hansen, W. 1959. “How accessibility shapes land use”, Journal of the American Institute of Planners, 25,
p73-76
Henderson, V., Storeygard, A., Weil, D.N., 2011. “A Bright Idea for Measuring Economic Growth:,
American Economic Review, 101, 194-199.
Hering, L., Poncet, S., 2010. “Market Access and Individual Wages: Evidence from China”, The Review of
Economics and Statistics, 92, 145-159.
Ingram, D. 1971. “The concept of accessibility: A search of an operational form”, Regional Studies, 5,
p101-107
Jin, Y., Fang, W., Bullock, R.G., 2010. The Impact of High Speed Rail on Regional Economic Development,
Working Paper 2, Beijing.
Kyrgyz Republic National Statistical Committee 2006-2010, 2010. The Kyrgyz Republic 2010 Census.
Демографический ежегодник Кыргызской республики 2006-2010 гг. Downloaded from
http://stat.kg/images/stories/docs/tematika/demo/Demo%20publ%202007-2011.pdf , accessed
2012-12.
Market Access and Regional Maps: Kyrgyz Republic
42
Mahadevan, M., and N. Yoshida. Poverty Mapping in Kyrgyz Republic. mimeo
Masood A. 2009. PADMA Bridge Project as part of Transport Sector South Asia Brown Bag Learning
Event, World Bank: Washington, DC: September 24.
Ministry of Health of the Kyrgyz Repbulic. 2009. number of Doctor, Hospital, Bed (count), Marternal
Motality rate [per 100,000 (mm rate)], Infant motality rate [per 1000 (inft.m rate)]. Downloaded
from UN COD-FOD at: http://cod.humanitarianresponse.info/country-region/Kyrgyzstan, accessed
2012-08.
National Statistical Committee of the Kyrgyz Republic. 2009. "Population and Housing Census of the
Kyrgyz Republic of 2009" Downloaded from http://cod.humanitarianresponse.info/country-
region/Kyrgyzstan, accessed 2012-08.
The National Statistical Committee of the Kyrgyz Republic. 2010. “Health of the population and health
system in the Kyrgyz Republic, 2005-2009". Bishkek, 2010. (in Russian). Downloaded 12-12-2012:
http://stat.kg/images/stories/docs/tematika/social/Health%202005-2009.pdf
NOAA. 2010. Version 4 DMSP-OLS Nighttime Lights Time Series. Downloaded 12-12-2012 at:
http://www.ngdc.noaa.gov/dmsp/downloadV4composites.html
Open Street Maps. 2012. Available at: http://downloads.cloudmade.com/, downloaded 4 March 2012.
Salze, P., Banos, A., Oppert, J.M., Charreire, H., Casey, R., Simon, C., Chaix, B., Badariotti, D., Weber, C.,
2011. Estimating spatial accessibility to facilities on the regional scale: an extended commuting-
based interaction potential model. International Journal of Health Geographics, 10(2): 16pp.
Skoufias, E. and Katayama, R. 2011. Sources of welfare disparities between and within regions of Brazil:
evidence from the 2002–2003 household budget survey. Journal of Economic Geography, 11: 897–
918.
United Nations OCHA.2013. Kyrgyzstan district profiles. Downloaded 2013-01-15 at:
http://gallery.mailchimp.com/ec45a63b0fd89096f578c6266/files/Kyrgyzstan_baseline_data_distict_
profiles.pdf
World Bank. 2009. Reshaping Economic Geography. World Bank, Washington, D.C.
World Bank, 2011a. Poor Places, Thriving People: how the Middle East and North Africa can rise above
spatial disparities. World Bank, Washington, D.C.
World Bank, 2011b. West Bank and Gaza Coping with Conflict? Poverty and Inclusion in the West Bank
and Gaza. World Bank, Washington, D.C., pp. 1-196.
World Bank 2012a. ARAB REPUBLIC OF EGYPT: Reshaping Egypt’s Economic Geography: Domestic
Integration as a Development Platform. World Bank, Washington, D.C.
World Bank. 2012b. BOOST data. Version 0.6
World Bank. Report No: 49915 – KG

Market Access and Regional Maps: Kyrgyz Republic
43
World Bank. Report No: 61262 – KG
World Gazetteer. 2012. Available at: http://world-gazetteer.com/, downloaded 7 March 2012.

Market Access and Regional Maps: Kyrgyz Republic
44
7. Appendix
Table 1 : Road category and speed in model
Road category Road speed
Motor road 90 kph
Blacktop road 70 kph
Ground road 40 kph
Unpaved road 25 kph
Horsepath 5 kph
Table 2 : Market Accessibility Index – population potential
Oblast Rayon / town / city Market Access Index – Population Potential
Chu Bishkek city 100.0
Osh Osh city 52.0
Chu Alamedin 46.9
Chu t. Tokmok 45.6
Dzhalal-Abad t. Dzhalal-Abad 45.1
Chu Sokuluk 42.9
Chu Issyk-Ata 41.4
Issyk-Kul' t. Karakol 31.1
Batken t. Kyzyl-Kyja 24.3
Chu Moskva 22.8
Batken t. Suljukta 22.6
Issyk-Kul' t. Balykchy 21.6
Dzhalal-Abad t. Tash-Kumyr 19.5
Talas t. Talas 19.2
Osh Kara-Su 18.3
Naryn t. Naryn 16.7
Chu Chu 16.6
Dzhalal-Abad t. Majjluu-Suu 16.4
Dzhalal-Abad t. Kara-Kul' 14.8
Chu Zhayiyl 14.6
Batken t. Batken 14.4
Chu Panfilov 14.3
Osh Uzghen 12.8
Dzhalal-Abad Suzak 12.6
Dzhalal-Abad Nooken 12.5
Issyk-Kul' Tiup 10.7

Market Access and Regional Maps: Kyrgyz Republic
45
Osh Naukat 8.9
Dzhalal-Abad Bazar-Korghon 7.9
Osh Aravan 7.9
Chu Kemin 7.6
Issyk-Kul' Issyk-Kul' 6.3
Batken Liayiliak 5.8
Issyk-Kul' Ak-Su 4.9
Talas Talas 3.9
Issyk-Kul' Ton 3.7
Talas Bakayi-Ata 3.4
Dzhalal-Abad Ala-Buka 3.0
Talas Manas 2.9
Dzhalal-Abad Aksy 2.6
Naryn Naryn 2.4
Batken Kadamzhayi 1.8
Batken Batken 1.8
Issyk-Kul' Dzhety-Oghuz 1.6
Dzhalal-Abad Toktogul 1.5
Osh Kara-Kul'dzha 0.7
Dzhalal-Abad Chatkal 0.7
Naryn Kochkor 0.5
Osh Alayi 0.5
Talas Kara-Buura 0.5
Naryn At-Bashy 0.4
Naryn Dzhumghal 0.1
Chu Panfilov (exclave) 0.0
Naryn Ak-Tala 0.0
Osh Chon-Alayi 0.0
Dzhalal-Abad Toguz-Torous 0.0
Chu Zhayiyl (exclave) 0.0

Market Access and Regional Maps: Kyrgyz Republic
46
Table 3: Market Accessibility Index – expenditure potential
Province Rayon / town / city
Market Access Index - expenditure potential
Chu Bishkek city 100.0
Chu Alamedin 47.0
Chu Sokuluk 42.9
Chu t. Tokmok 42.8
Chu Issyk-Ata 40.7
Osh Osh city 40.6
Dzhalal-Abad t. Dzhalal-Abad 38.2
Issyk-Kul' t. Karakol 29.0
Chu Moskva 22.7
Batken t. Suljukta 22.3
Batken t. Kyzyl-Kyja 21.4
Talas t. Talas 18.9
Dzhalal-Abad t. Tash-Kumyr 18.3
Issyk-Kul' t. Balykchy 17.2
Chu Chu 15.4
Batken t. Batken 15.1
Dzhalal-Abad t. Majjluu-Suu 14.9
Naryn t. Naryn 14.6
Chu Zhayiyl 14.4
Chu Panfilov 13.7
Osh Kara-Su 13.3
Dzhalal-Abad Nooken 11.2
Dzhalal-Abad Suzak 10.5
Issyk-Kul' Tiup 8.9
Osh Naukat 7.5
Chu Kemin 7.2
Dzhalal-Abad Bazar-Korghon 6.6
Osh Aravan 6.4
Osh Uzghen 6.0
Batken Liayiliak 5.6
Issyk-Kul' Issyk-Kul' 5.1
Issyk-Kul' Ak-Su 4.5
Talas Talas 3.8
Talas Bakayi-Ata 3.3
Issyk-Kul' Ton 2.9
Talas Manas 2.9

Market Access and Regional Maps: Kyrgyz Republic
47
Province Rayon / town / city
Market Access Index - expenditure potential
Dzhalal-Abad Ala-Buka 2.5
Dzhalal-Abad Aksy 2.4
Naryn Naryn 2.1
Batken Batken 1.9
Batken Kadamzhayi 1.5
Issyk-Kul' Dzhety-Oghuz 1.3
Dzhalal-Abad t. Kara-Kul' 0.6
Dzhalal-Abad Chatkal 0.6
Dzhalal-Abad Toktogul 0.5
Naryn Kochkor 0.4
Talas Kara-Buura 0.4
Osh Alayi 0.4
Naryn At-Bashy 0.3
Osh Kara-Kul'dzha 0.3
Naryn Dzhumghal 0.1
Chu ex. Panfilov 0.0
Naryn Ak-Tala 0.0
Osh Chon-Alayi 0.0
Dzhalal-Abad Toguz-Torous 0.0
Chu ex. Zhayiyl 0.0

Market Access and Regional Maps: Kyrgyz Republic
48
Chart 1: Market Accessibility Index - population potential - and total population (thousands)
Chart 2 : Market Accessibility Index – expenditure potential

Table 4 : Selection of rayon and town expenditures from BOOST (2010) (M= million, pc = per capita) (*see data section for description and methodology)20
Oblast Rayon / town* Transport (M)
Capital road repair (pc)
Preschool education (pc)
Primary and secondary education (pc)
Tertiary education (pc)
Chu Alamedin
181 956 Chu Bishkek city 1010 383 477 1476 1685
Chu Chu
108 123 Chu t. Tokmok 18 10 278 2550 Chu Issyk-Ata 10 7 263 1278 Chu Kemin 6 2 215 1761 Chu Moskva 19 16 161 1326 Chu Panfilov 9 6 66 1807 Chu Sokuluk
90 1145
Chu Zhayiyl 53 37 222 1644 Dzhalal-Abad Aksy 3 1 89 1447 Dzhalal-Abad t. Tash-Kumyr 16 11 203 1438 227
Dzhalal-Abad Ala-Buka 3 1 162 1530 Dzhalal-Abad Bazar-Korghon 3 1 86 1389 Dzhalal-Abad Chatkal 3 0 477 2639 Dzhalal-Abad Nooken 3 1 179 1277 Dzhalal-Abad t. Majjluu-Suu
2346
Dzhalal-Abad Suzak 18 13 77 1273 Dzhalal-Abad t. Dzhalal-Abad 176 145 633 1603 1148
Dzhalal-Abad Toguz-Torous 5 2 212 2551 Dzhalal-Abad Toktogul 14 10 128 1597 Dzhalal-Abad t. Kara-Kul' 16 9 113 1398 418
Issyk-Kul' Ak-Su 9 6 70 1293
20
We are currently requesting the official data.

Market Access and Regional Maps: Kyrgyz Republic
50
Oblast Rayon / town* Transport (M)
Capital road repair (pc)
Preschool education (pc)
Primary and secondary education (pc)
Tertiary education (pc)
Issyk-Kul' t. Karakol 95 84 447 1821 871
Issyk-Kul' Dzhety-Oghuz 4 2 39 1314 Issyk-Kul' Issyk-Kul' 7 3 294 1601 Issyk-Kul' t. Balykchy 9 4 339 1095 Issyk-Kul' Tiup 7 4 67 1213 Issyk-Kul' Ton 3 1 83 1597 Naryn Ak-Tala 4 2 255 2349 Naryn At-Bashy 10 2 99 2012 Naryn Dzhumghal 20 17 141 2173 Naryn Kochkor 7 2 133 1928 Naryn Naryn
153 1970
Naryn t. Naryn 81 65 594 3001 986
Osh Alayi 11 3 218 2632 Osh Aravan 4 1 123 1432 Osh Chon-Alayi 5 2 327 3316 Osh Kara-Kul'dzha 16 11 134 2099 Osh Kara-Su 5 2 81 1122 Osh Osh city 120 90 348 1406 2031
Osh Naukat 25 22 66 1214 Osh Uzghen 37 31 59 1298 41
Talas Bakayi-Ata 3 2 94 1859 Talas Kara-Buura 4 1 165 1291 Talas Manas 4 2 80 1598 Talas Talas
66 1502
Talas t. Talas 68 58 15 1189 516

Market Access and Regional Maps: Kyrgyz Republic
51
Table 5 : Household rates of sector employment from NSC 2010 (see data description for more details)21
Oblast Rayon / Town
hh ind agri mean rayon
hh ind min mean rayon
hh ind mfg mean rayon
hh ind egw mean rayon
hh ind constr mean rayon
hh ind trade mean rayon
hh ind trans mean rayon
Batken Batken 0.30 0.00 0.00 0.00 0.04 0.03 0.01
Batken Kadamzhayi 0.27 0.00 0.01 0.00 0.04 0.03 0.01
Batken Liayiliak 0.27 0.00 0.01 0.00 0.04 0.04 0.01
Batken t. Batken 0.11 0.00 0.01 0.00 0.03 0.04 0.02
Batken t. Kyzyl-Kyja 0.05 0.00 0.03 0.00 0.03 0.09 0.01
Batken t. Suljukta 0.00 0.10 0.01 0.00 0.04 0.06 0.02
Chu Alamedin 0.04 0.00 0.05 0.01 0.03 0.09 0.04
Chu Bishkek city 0.00 0.00 0.04 0.01 0.02 0.10 0.03
Chu Chu 0.21 0.00 0.03 0.01 0.02 0.04 0.02
Chu ex. Panfilov 0.18 0.00 0.03 0.01 0.02 0.04 0.02
Chu ex. Zhayiyl 0.08 0.01 0.04 0.01 0.02 0.06 0.02
Chu Issyk-Ata 0.13 0.00 0.07 0.01 0.02 0.07 0.03
Chu Kemin 0.16 0.01 0.02 0.01 0.02 0.03 0.01
Chu Moskva 0.21 0.00 0.05 0.01 0.02 0.05 0.02
Chu Panfilov 0.18 0.00 0.03 0.01 0.02 0.04 0.02
Chu Sokuluk 0.09 0.00 0.05 0.01 0.02 0.07 0.04
Chu t. Tokmok 0.02 0.00 0.06 0.01 0.02 0.14 0.04
Chu Zhayiyl 0.08 0.01 0.04 0.01 0.02 0.06 0.02
Dzhalal-Abad Aksy 0.31 0.00 0.00 0.00 0.02 0.03 0.01
Dzhalal-Abad Ala-Buka 0.37 0.00 0.01 0.00 0.03 0.02 0.01
Dzhalal-Abad Bazar-Korghon 0.31 0.00 0.01 0.00 0.03 0.04 0.01
21
We are currently requesting the official figures from the NSC.

Market Access and Regional Maps: Kyrgyz Republic
52
Oblast Rayon / Town
hh ind agri mean rayon
hh ind min mean rayon
hh ind mfg mean rayon
hh ind egw mean rayon
hh ind constr mean rayon
hh ind trade mean rayon
hh ind trans mean rayon
Dzhalal-Abad Chatkal 0.15 0.03 0.01 0.00 0.01 0.04 0.01
Dzhalal-Abad Nooken 0.25 0.01 0.01 0.00 0.03 0.05 0.01
Dzhalal-Abad Suzak 0.27 0.00 0.01 0.00 0.04 0.04 0.01
Dzhalal-Abad t. Dzhalal-Abad 0.02 0.00 0.02 0.00 0.03 0.10 0.03
Dzhalal-Abad t. Kara-Kul' 0.01 0.01 0.02 0.08 0.09 0.06 0.02
Dzhalal-Abad t. Majjluu-Suu 0.02 0.00 0.18 0.01 0.06 0.09 0.02
Dzhalal-Abad t. Tash-Kumyr 0.03 0.01 0.03 0.02 0.06 0.07 0.02
Dzhalal-Abad Toguz-Torous 0.14 0.04 0.01 0.00 0.01 0.02 0.01
Dzhalal-Abad Toktogul 0.25 0.00 0.01 0.00 0.02 0.03 0.01
Issyk-Kul' Ak-Su 0.35 0.01 0.00 0.00 0.01 0.02 0.01
Issyk-Kul' Dzhety-Oghuz 0.30 0.01 0.01 0.00 0.01 0.02 0.01
Issyk-Kul' Issyk-Kul' 0.19 0.00 0.01 0.00 0.02 0.06 0.02
Issyk-Kul' t. Balykchy 0.01 0.01 0.03 0.01 0.05 0.09 0.04
Issyk-Kul' t. Karakol 0.02 0.01 0.02 0.01 0.02 0.10 0.03
Issyk-Kul' Tiup 0.38 0.00 0.01 0.00 0.01 0.02 0.01
Issyk-Kul' Ton 0.28 0.00 0.01 0.00 0.01 0.02 0.01
Naryn Ak-Tala 0.26 0.00 0.01 0.00 0.03 0.02 0.01
Naryn At-Bashy 0.27 0.00 0.01 0.00 0.01 0.02 0.01
Naryn Dzhumghal 0.17 0.00 0.01 0.00 0.02 0.02 0.01
Naryn Kochkor 0.37 0.00 0.01 0.00 0.01 0.02 0.01
Naryn Naryn 0.30 0.00 0.01 0.00 0.01 0.01 0.00
Naryn t. Naryn 0.01 0.00 0.01 0.01 0.02 0.05 0.03
Osh Alayi 0.17 0.00 0.01 0.00 0.03 0.07 0.01
Osh Aravan 0.39 0.00 0.01 0.00 0.04 0.03 0.01
Osh Chon-Alayi 0.28 0.00 0.00 0.00 0.01 0.03 0.01

Market Access and Regional Maps: Kyrgyz Republic
53
Oblast Rayon / Town
hh ind agri mean rayon
hh ind min mean rayon
hh ind mfg mean rayon
hh ind egw mean rayon
hh ind constr mean rayon
hh ind trade mean rayon
hh ind trans mean rayon
Osh Kara-Kul'dzha 0.21 0.00 0.01 0.00 0.03 0.08 0.01
Osh Kara-Su and Osh city
0.23 0.00 0.01 0.00 0.03 0.07 0.02
Osh Naukat 0.40 0.00 0.01 0.00 0.03 0.04 0.00
Osh Osh city and Kara-Su
0.23 0.00 0.01 0.00 0.03 0.07 0.02
Osh Uzghen 0.29 0.00 0.01 0.00 0.04 0.06 0.01
Talas Bakayi-Ata 0.35 0.00 0.00 0.00 0.00 0.01 0.00
Talas Kara-Buura 0.36 0.00 0.01 0.00 0.01 0.02 0.01
Talas Manas 0.30 0.00 0.01 0.00 0.02 0.04 0.01
Talas t. Talas 0.04 0.00 0.02 0.01 0.01 0.09 0.03
Talas Talas 0.35 0.00 0.00 0.00 0.01 0.01 0.00

Market Access and Regional Maps: Kyrgyz Republic
54
Table 6 : Household and rayon level characteristics22
Oblast Rayon / town
sex mean rayon
hhsize mean rayon
edu primary
edu sec-ondary
edu tertiary edu lit
hh emp stat mean rayon
Elec-tricity mean rayon
sewage mean rayon
indoor water mean rayon
toilet mean rayon
Batken Batken 0.14 5.98 0.73 0.52 0.04 0.97 0.43 0.97 0.01 0.00 0.00
Batken Kadamzhayi 0.19 5.44 0.79 0.57 0.05 0.98 0.44 0.98 0.07 0.07 0.08
Batken Liayiliak 0.17 5.81 0.77 0.55 0.05 0.97 0.45 0.97 0.05 0.00 0.00
Batken t. Batken 0.22 5.25 0.76 0.56 0.12 0.98 0.36 0.95 0.05 0.01 0.04
Batken t. Kyzyl-Kyja 0.36 4.24 0.82 0.53 0.08 0.98 0.32 0.98 0.55 0.29 0.31
Batken t. Suljukta 0.26 5.60 0.78 0.61 0.06 0.98 0.36 0.98 0.73 0.13 0.14
Chu Alamedin 0.42 3.91 0.85 0.60 0.13 0.99 0.39 0.99 0.50 0.18 0.39
Chu Bishkek city 0.49 3.79 0.86 0.68 0.25 0.99 0.37 0.99 0.12 0.61 0.79
Chu Chu 0.31 4.44 0.82 0.56 0.08 0.99 0.42 0.99 0.37 0.08 0.09
Chu Issyk-Ata 0.37 4.04 0.82 0.51 0.10 0.98 0.42 0.99 0.51 0.21 0.25
Chu Kemin 0.33 3.97 0.83 0.56 0.08 0.98 0.36 0.99 0.40 0.09 0.18
Chu Moskva 0.35 3.97 0.82 0.48 0.07 0.99 0.43 1.00 0.68 0.14 0.17
Chu Panfilov 0.33 4.06 0.82 0.50 0.06 0.99 0.40 0.99 0.28 0.13 0.15
Chu Sokuluk 0.37 3.90 0.84 0.57 0.10 0.99 0.37 0.97 0.62 0.13 0.15
Chu t. Tokmok 0.48 2.99 0.86 0.58 0.08 0.99 0.41 0.98 0.39 0.45 0.47
Chu Zhayiyl 0.41 3.50 0.85 0.56 0.09 0.99 0.33 0.99 0.50 0.29 0.30
Dzhalal-Abad Aksy 0.19 5.64 0.74 0.51 0.05 0.97 0.43 0.98 0.08 0.00 0.00
Dzhalal-Abad Ala-Buka 0.18 5.50 0.77 0.54 0.05 0.97 0.49 0.98 0.11 0.00 0.01
Dzhalal-Abad
Bazar-Korghon 0.19 5.99 0.75 0.52 0.04 0.97 0.44 0.98 0.02 0.01 0.01
22
We are currently requesting the official figures from the NSC.

Market Access and Regional Maps: Kyrgyz Republic
55
Oblast Rayon / town
sex mean rayon
hhsize mean rayon
edu primary
edu sec-ondary
edu tertiary edu lit
hh emp stat mean rayon
Elec-tricity mean rayon
sewage mean rayon
indoor water mean rayon
toilet mean rayon
Dzhalal-Abad Chatkal 0.20 5.44 0.76 0.52 0.06 0.96 0.35 0.98 0.41 0.00 0.00
Dzhalal-Abad Nooken 0.22 5.64 0.77 0.52 0.05 0.97 0.41 0.99 0.21 0.03 0.04
Dzhalal-Abad Suzak 0.20 6.05 0.76 0.49 0.04 0.98 0.42 0.98 0.33 0.01 0.01
Dzhalal-Abad
t. Dzhalal-Abad 0.38 4.50 0.84 0.61 0.13 0.99 0.31 0.99 0.48 0.40 0.43
Dzhalal-Abad t. Kara-Kul' 0.32 4.17 0.78 0.55 0.13 0.98 0.38 1.00 0.07 0.76 0.76
Dzhalal-Abad
t. Majjluu-Suu 0.42 3.53 0.85 0.60 0.08 0.98 0.50 0.99 0.24 0.53 0.59
Dzhalal-Abad t. Tash-Kumyr 0.30 4.52 0.78 0.49 0.07 0.98 0.33 1.00 0.56 0.30 0.31
Dzhalal-Abad Toguz-Torous 0.22 5.23 0.77 0.53 0.07 0.97 0.33 0.99 0.05 0.18 0.18
Dzhalal-Abad Toktogul 0.21 5.67 0.73 0.50 0.05 0.97 0.37 0.99 0.09 0.00 0.01
Issyk-Kul' Ak-Su 0.25 4.77 0.77 0.50 0.08 0.98 0.46 0.99 0.65 0.01 0.03
Issyk-Kul' Dzhety-Oghuz 0.25 4.71 0.78 0.52 0.08 0.98 0.42 0.98 0.72 0.02 0.03
Issyk-Kul' Issyk-Kul' 0.32 4.08 0.81 0.52 0.11 0.98 0.40 0.99 0.52 0.10 0.11
Issyk-Kul' t. Balykchy 0.37 3.99 0.86 0.63 0.10 0.98 0.36 1.00 0.49 0.31 0.41
Issyk-Kul' t. Karakol 0.40 3.48 0.84 0.58 0.19 0.99 0.36 1.00 0.36 0.38 0.60
Issyk-Kul' Tiup 0.22 4.79 0.77 0.49 0.07 0.97 0.50 0.99 0.90 0.00 0.00
Issyk-Kul' Ton 0.23 4.49 0.81 0.58 0.07 0.98 0.39 0.98 0.46 0.00 0.02
Naryn Ak-Tala 0.18 5.41 0.76 0.51 0.07 0.97 0.42 0.98 0.01 0.00 0.00
Naryn At-Bashy 0.20 5.32 0.74 0.50 0.07 0.97 0.39 0.94 0.14 0.00 0.00
Naryn Dzhumghal 0.23 5.06 0.76 0.51 0.06 0.97 0.31 0.97 0.07 0.00 0.08

Market Access and Regional Maps: Kyrgyz Republic
56
Oblast Rayon / town
sex mean rayon
hhsize mean rayon
edu primary
edu sec-ondary
edu tertiary edu lit
hh emp stat mean rayon
Elec-tricity mean rayon
sewage mean rayon
indoor water mean rayon
toilet mean rayon
Naryn Kochkor 0.21 4.93 0.75 0.53 0.07 0.97 0.48 0.98 0.12 0.00 0.01
Naryn Naryn 0.18 5.32 0.74 0.48 0.06 0.97 0.39 0.96 0.08 0.00 0.01
Naryn t. Naryn 0.27 4.33 0.80 0.56 0.18 0.98 0.31 0.99 0.53 0.28 0.30
Osh Alayi 0.20 5.67 0.74 0.53 0.06 0.97 0.38 0.98 0.05 0.00 0.00
Osh Aravan 0.17 5.53 0.77 0.50 0.06 0.98 0.54 0.98 0.17 0.00 0.01
Osh Chon-Alayi 0.09 6.16 0.69 0.46 0.06 0.97 0.42 0.98 0.01 0.00 0.00
Osh Kara-Kul'dzha 0.16 6.35 0.75 0.54 0.05 0.98 0.40 0.96 0.04 0.00 0.00
Osh Kara-Su 0.22 5.87 0.77 0.49 0.05 0.98 0.43 0.98 0.22 0.01 0.02
Osh Naukat 0.17 6.14 0.75 0.52 0.04 0.97 0.53 0.98 0.10 0.00 0.00
Osh Osh city 0.22 5.87 0.77 0.49 0.05 0.98 0.43 0.98 0.22 0.01 0.02
Osh Uzghen 0.21 6.17 0.75 0.51 0.05 0.98 0.46 0.98 0.23 0.01 0.01
Talas Bakayi-Ata 0.20 5.29 0.74 0.51 0.07 0.97 0.42 0.99 0.45 0.00 0.00
Talas Kara-Buura 0.20 5.50 0.73 0.46 0.06 0.96 0.46 0.99 0.16 0.03 0.03
Talas Manas 0.22 5.52 0.76 0.48 0.06 0.97 0.46 0.98 0.13 0.00 0.00
Talas t. Talas 0.33 3.99 0.80 0.55 0.15 0.98 0.35 0.99 0.62 0.20 0.23
Talas Talas 0.18 5.38 0.74 0.52 0.06 0.97 0.44 0.98 0.36 0.00 0.00

Market Access and Regional Maps: Kyrgyz Republic
57
Table 7: Education characteristics from UN District 2011 Profile (* = primary student data not provided)23
23
We are currently requesting the official figures from the NSC.
Oblast Rayon / city Students (total)
Average Students By School
Average Students By Teacher
Schools Per 10.000
Batken Batken region 17926 358.52 14.81 5.73
Batken Kadamjai region 36172 441.12 14.74 4.18
Batken Leilek district 25711 395.55 14.02 5.49
Chu Alamudun* 20342 581.20 21.12 2.49
Chu Bishkek city 140212 1062.21 21.63 1.77
Chu Chui rayon 8983 320.82 16.13 2.91
Chu Issyk-Ata region 24861 469.08 19.27 4.11
Chu Kemin district 9373 275.68 13.53 8.08
Chu MOSCOW DISTRICT 16330 453.61 19.63 4.45
Chu Panfilov district 7527 289.50 14.67 6.33
Chu Sokuluk DISTRICT 30244 593.02 20.77 3.37
Chu Jayil DISTRICT 18215 404.78 19.42 5.00
Dzhalal-Abad Aksy DISTRICT 26748 411.51 12.71 4.46
Dzhalal-Abad Alabuka DISTRICT 20368 442.78 15.84 5.32
Dzhalal-Abad Bazarkorgon region 32430 484.03 15.49 4.84
Dzhalal-Abad Chatkal DISTRICT 5577 293.53 10.66 9.10
Dzhalal-Abad Nooken region 28249 513.62 20.47 4.07
Dzhalal-Abad Suzak district 50771 445.36 16.78 3.61
Dzhalal-Abad TOGUZ-TOROUSKY DISTRICT 5696 406.86 12.71 6.34
Dzhalal-Abad Toktogul rayon 20851 508.56 16.51 3.82
Issyk-Kul' Ak-Suu district 12641 371.79 11.46 2.82
Issyk-Kul' Jeti-Oguz district 17508 427.02 12.47 5.07
Issyk-Kul' Issyk-Kul district 16871 496.21 13.75 2.96

Market Access and Regional Maps: Kyrgyz Republic
58
Issyk-Kul' Tyup DISTRICT 12691 352.53 11.87 6.15
Issyk-Kul' Ton district* 10749 358.30 12.10 6.27
Naryn AK-Talin region* 7846 435.89 8.67 6.00
Naryn AT BASHYNSKY DISTRICT* 11457 545.57 11.28 4.28
Naryn Jumgal DISTRICT* 9078 378.25 11.08 6.00
Naryn Kochkor region 14160 429.09 11.28 5.72
Naryn Naryn rayon 10491 317.91 10.33 4.34
Osh Alay district 15728 296.75 10.44 8.87
Osh Aravan rayon 24109 430.52 13.38 5.72
Osh Chon-Alai rayon* 7004 412.00 10.52 7.64
Osh KARA-KULZHINSKY DISTRICT 18937 350.69 14.71 6.26
Osh Karasuu region 66732 501.74 16.41 4.05
Osh Osh city* 51894 894.72 20.58 2.40
Osh Nookat area 49788 452.62 13.11 4.69
Osh Uzgen district 50829 488.74 17.01 4.72
Talas Bakai-Ata rayon* 10049 436.91 11.99 5.48
Talas KARA-BUURINSKY DISTRICT* 12815 474.63 14.97 4.72
Talas Manas rayon 6293 262.21 12.59 7.39
Talas Talas district 11991 386.81 12.09 3.60

Market Access and Regional Maps: Kyrgyz Republic
59
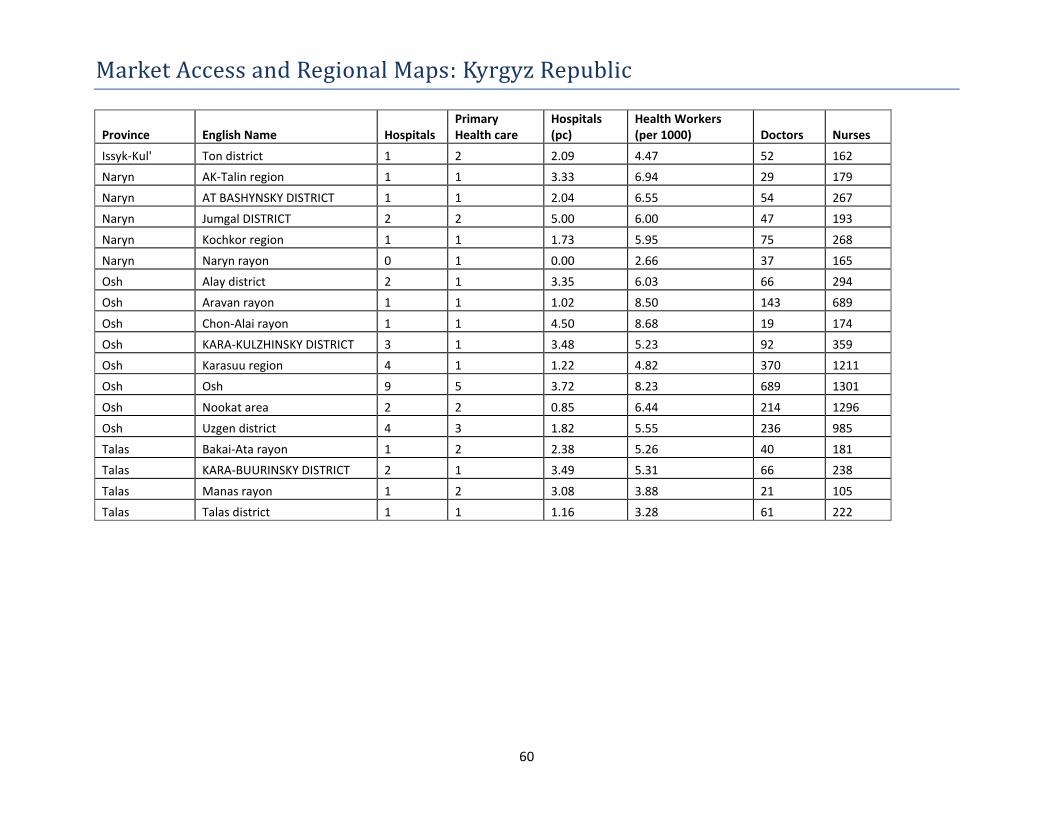
Table 8 : Health characteristics from UN District 2011 Profile24
Province English Name Hospitals Primary Health care
Hospitals (pc)
Health Workers (per 1000) Doctors Nurses
Batken Batken region 3 4 3.44 7.71 115 558
Batken Kadamjai region 5 4 2.55 6.42 194 1065
Batken Leilek district 3 2 2.53 5.89 133 564
Chu Alamudun DISTRICT 8 2 5.69 5.60 300 488
Chu Bishkek 22 50 2.95 8.18 2792 3302
Chu Chui rayon 1 1 1.04 2.59 57 192
Chu Issyk-Ata region 3 1 2.33 4.88 185 444
Chu Kemin district 3 2 7.13 6.09 82 174
Chu MOSCOW DISTRICT 1 3 1.24 4.92 124 274
Chu Panfilov district 2 1 4.87 5.36 47 173
Chu Sokuluk DISTRICT 2 3 1.32 3.45 157 365
Chu Jayil DISTRICT 2 8 2.22 7.73 186 509
Dzhalal-Abad Aksy DISTRICT 1 1 0.69 4.19 124 487
Dzhalal-Abad Alabuka DISTRICT 1 1 1.16 6.45 83 475
Dzhalal-Abad Bazarkorgon region 3 1 2.17 5.30 146 588
Dzhalal-Abad Chatkal DISTRICT 2 2 9.57 9.43 23 174
Dzhalal-Abad Nooken region 5 2 3.70 6.29 154 697
Dzhalal-Abad Suzak district 4 3 1.27 3.41 208 866
Dzhalal-Abad TOGUZ-TOROUSKY DISTRICT 1 3 4.53 8.96 39 159
Dzhalal-Abad Toktogul rayon 7 3 6.52 4.26 90 367
Issyk-Kul' Ak-Suu district 1 2 0.83 2.35 52 231
Issyk-Kul' Jeti-Oguz district 2 7 2.47 4.37 72 281
Issyk-Kul' Issyk-Kul district 2 4 1.74 3.10 112 244
Issyk-Kul' Tyup DISTRICT 1 2 1.71 4.76 50 229
24
We are currently requesting the official figures from the NSC.
Market Access and Regional Maps: Kyrgyz Republic
60
Province English Name Hospitals Primary Health care
Hospitals (pc)
Health Workers (per 1000) Doctors Nurses
Issyk-Kul' Ton district 1 2 2.09 4.47 52 162
Naryn AK-Talin region 1 1 3.33 6.94 29 179
Naryn AT BASHYNSKY DISTRICT 1 1 2.04 6.55 54 267
Naryn Jumgal DISTRICT 2 2 5.00 6.00 47 193
Naryn Kochkor region 1 1 1.73 5.95 75 268
Naryn Naryn rayon 0 1 0.00 2.66 37 165
Osh Alay district 2 1 3.35 6.03 66 294
Osh Aravan rayon 1 1 1.02 8.50 143 689
Osh Chon-Alai rayon 1 1 4.50 8.68 19 174
Osh KARA-KULZHINSKY DISTRICT 3 1 3.48 5.23 92 359
Osh Karasuu region 4 1 1.22 4.82 370 1211
Osh Osh 9 5 3.72 8.23 689 1301
Osh Nookat area 2 2 0.85 6.44 214 1296
Osh Uzgen district 4 3 1.82 5.55 236 985
Talas Bakai-Ata rayon 1 2 2.38 5.26 40 181
Talas KARA-BUURINSKY DISTRICT 2 1 3.49 5.31 66 238
Talas Manas rayon 1 2 3.08 3.88 21 105
Talas Talas district 1 1 1.16 3.28 61 222

Market Access and Regional Maps: Kyrgyz Republic
61
Table 9 : Ministry of Health (downloaded from UN COD-FOD)25
Oblast (Province) Admin Name #Bed Marternal Mortality
rate (per 100,000 live birth)
Infant mortality rate (per 1,000 live
births)
Batken oblast Batken region 400 128.3 30.8
Batken oblast Kadamjai region 427 - 17
Batken oblast Leilek region 362 37.8 24.6
Djalal-Abad oblast Aksy region 393 96 9.6
Djalal-Abad oblast Ala-Buka region 192 155.1 23.3
Djalal-Abad oblast Bazar-Korgon region 330 30 20.2
Djalal-Abad oblast Nooken region 401 - 16.4
Djalal-Abad oblast Suzak region 537 61.8 16.9
Djalal-Abad oblast Toguz-Toro region 70 175.7 22.7
Djalal-Abad oblast Toktogul region 277 43.2 18.1
Djalal-Abad oblast Chatkal region 96 - 12.4
Issyk-Kul oblast Ak-Suu region 151 126.3 12.7
Issyk-Kul oblast Jeti-Oguz region 117 169.1 22.5
Issyk-Kul oblast Issyk-Kul region 95 - 24.5
Issyk-Kul oblast Ton region 95 - 11.3
Issyk-Kul oblast Tup region 140 70.7 16
Osh oblast Alai region 190 53.1 18.5
Osh oblast Aravan region 320 159.7 17.6
Osh oblast Kara-Suu region 680 49.4 18.1
Osh oblast Kara-Kulja region 287 - 19.2
Osh oblast Nookat region 645 48.9 24.7
25
We are currently requesting the official data.

Market Access and Regional Maps: Kyrgyz Republic
62
Osh oblast Uzgen region 570 52.1 19.8
Osh oblast Chon-Alai region 180 - 24.7
Chui oblast Alamudun region 650 64.2 40.9
Chui oblast Jaiyl region 345 39.8 16.6
Chui oblast Panfilov region 85 - 18.9
Chui oblast Sokuluk region 200 53.9 21.6
Chui oblast Kemin region 155 - 16.1
Chui oblast Moscow region 171 48.2 26.9
Chui oblast Chui region 130 201.6 14.9
Chui oblast Issyk-Ata region 270 29.7 18.2
Nayrn Oblast Ak-Talaa region 70 - 14.1
Nayrn Oblast At-Bashy region 115 225.7 11.8
Nayrn Oblast Jumgal region 100 - 21
Nayrn Oblast Kochkor region 116 - 22.4
Nayrn Oblast Naryn region 502 172.6 12
Talas oblast Bakai-Ata region 70 205.8 13.1
Talas oblast Kara-Buura region 155 - 24.3
Talas oblast Manas region 45 250.6 11.7
Talas oblast Talas region 60 51.8 13.1

Market Access and Regional Maps: Kyrgyz Republic
63
Table 10: Ill and disease rate (* available for rayon only)26
Oblast Rayon / town Ill (%) Infect Parasite Registered (%) Blood Circulation Registered (%)
Batken Batken 0.38* 1.59 1.91
Batken Kadamzhayi 0.46 2.17 6.90
Batken Liayiliak 0.29 1.23 3.63
Batken t. Batken * 1.59 1.91
Batken t. Kyzyl kia 0.45 1.12 5.52
Batken t. Suljukta 0.46 1.64 2.92
Chu Alamedin 0.25 0.76 4.36
Chu Bishkek city 0.65 2.15 11.67
Chu Chu 0.47 1.31 7.31
Chu Issyk-Ata 0.24 0.49 4.66
Chu Kemin 0.17 0.69 2.96
Chu Moskva 0.33 0.63 5.07
Chu Panfilof 0.28 0.66 4.87
Chu Sokuluk 0.42 0.74 5.69
Chu t. Tokmok 0.23 0.44 4.71
Chu Zhayiyl 0.21 0.94 3.70
Dzhalal-Abad Aksy 0.21 1.10 3.98
Dzhalal-Abad Ala-Buka 0.18 1.24 1.20
Dzhalal-Abad Bazar-Korghon 0.32 2.48 3.66
Dzhalal-Abad Chatkal 0.18 0.94 3.67
Dzhalal-Abad Nooken 0.17 0.76 1.35
Dzhalal-Abad Suzak kok jangak 0.23 0.50 2.22
Dzhalal-Abad t. Dzhalal-Abad 0.53 0.90 11.24
Dzhalal-Abad t. Kara-Kul' 0.48 1.89 4.25
26
We are currently requesting official data

Market Access and Regional Maps: Kyrgyz Republic
64
Oblast Rayon / town Ill (%) Infect Parasite Registered (%) Blood Circulation Registered (%)
Dzhalal-Abad t. Majjluu-Suu 0.64 3.72 5.24
Dzhalal-Abad t. Tash-Kumyr 0.35 2.33 5.48
Dzhalal-Abad Toguz-Torous 0.23 0.74 3.08
Dzhalal-Abad Toktogul 0.21 1.17 4.18
Issyk-Kul' Ak-Su 0.24 0.52 5.38
Issyk-Kul' Dzhety-Oghuz 0.17 0.50 2.91
Issyk-Kul' Issyk-Kul' 0.35 0.30 2.68
Issyk-Kul' t. balykchi 0.35 0.94 4.72
Issyk-Kul' t. karakol 0.55 0.76 4.91
Issyk-Kul' Tiup 0.20 1.20 2.20
Issyk-Kul' Ton 0.17 0.61 2.27
Naryn Ak-Tala 0.20 0.47 4.17
Naryn At-Bashy 0.16 0.45 2.72
Naryn Dzhumghal 0.35 0.96 4.60
Naryn Kochkor 0.17 0.52 2.23
Naryn Naryn 0.26 3.11 2.61
Naryn t. Naryn 0.69 2.40 9.57
Osh Alayi 0.40 0.83 5.56
Osh Aravan 0.43 0.98 2.98
Osh Chon-Alayi 0.22 0.50 2.51
Osh Kara-Kul'dzha 0.34 0.76 4.39
Osh Kara-Su 0.13 0.33 1.21
Osh Naukat 0.26 0.77 3.41
Osh Osh city 0.26 0.73 3.16
Osh Uzgen 0.18 0.86 1.68
Talas Bakayi-Ata 0.16 0.32 1.63
Talas Kara-Buura 0.13 0.43 1.41

Market Access and Regional Maps: Kyrgyz Republic
65
Oblast Rayon / town Ill (%) Infect Parasite Registered (%) Blood Circulation Registered (%)
Talas Manas 0.15 0.84 2.40
Talas t. Talas 0.21 0.62 2.36
Talas Talas 0.17 0.29 2.20
Recommended