March 25, 2004
California’s Statewide Pricing Pilot
Larsh Johnson – President and Chief Technical Officer, eMeter
2© eMeter Corporation 2004
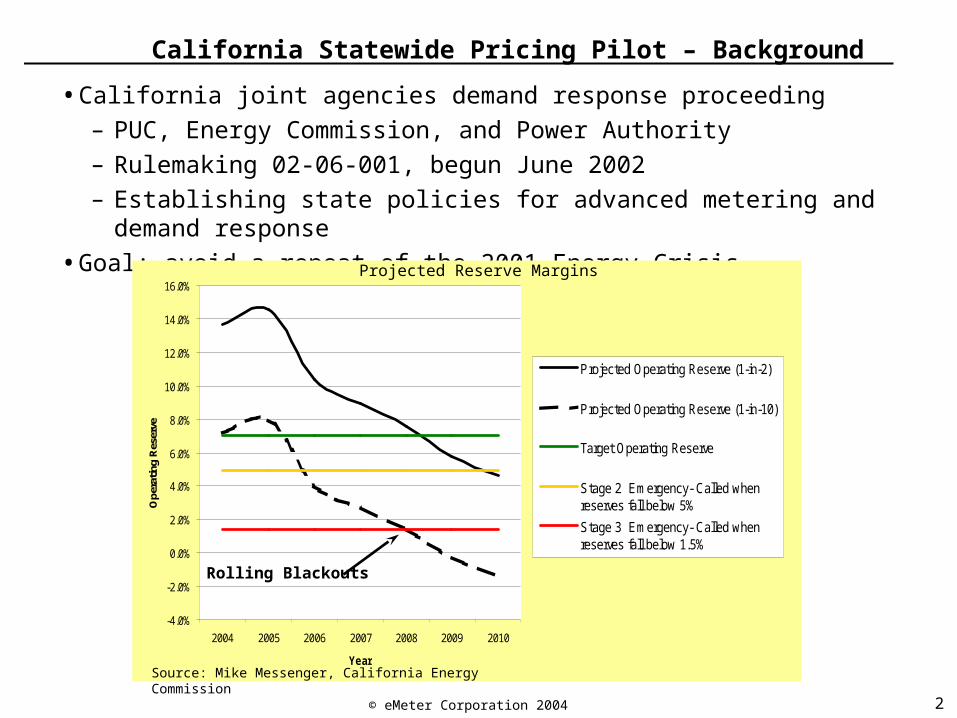
California Statewide Pricing Pilot – Background
• California joint agencies demand response proceeding
– PUC, Energy Commission, and Power Authority
– Rulemaking 02-06-001, begun June 2002
– Establishing state policies for advanced metering and demand response
• Goal: avoid a repeat of the 2001 Energy Crisis
-4.0%
-2.0%
0.0%
2.0%
4.0%
6.0%
8.0%
10.0%
12.0%
14.0%
16.0%
2004 2005 2006 2007 2008 2009 2010
Year
Ope
ratin
g R
eser
ve
Projected Operating Reserve (1-in-2)
Projected Operating Reserve (1-in-10)
Target Operating Reserve
Stage 2 Emergency- Called whenreserves fall below 5%
Stage 3 Emergency- Called whenreserves fall below 1.5%
Source: Mike Messenger, California Energy Commission
Projected Reserve Margins
Rolling Blackouts

3© eMeter Corporation 2004
Status of Proceeding
State Vision Adopted in 2003 (D.03-06-032)
• Utilities to meet 5% of system peak demand via dynamic pricing by 2007
• All customers should be provided advanced metering system capable of supporting a time-of-use (TOU) tariff or better
• Customers should have at least the following tariff options:
– Over 200 kW: hourly real-time pricing (RTP), critical peak pricing (CPP) or TOU
– Under 200 kW (residential and small commercial): CPP, TOU, or flat rate with hedge for risk protection
Major Activities
• Advanced metering and CPP/TOU tariffs in place for >200 kW customers
• CPUC determining business case methodology for metering for <200 kW customers now and will issue deployment decision in about a year
• Utilities file March 31, 2004 on plans to meet 2007 goal
• Statewide Pilot Program
4© eMeter Corporation 2004
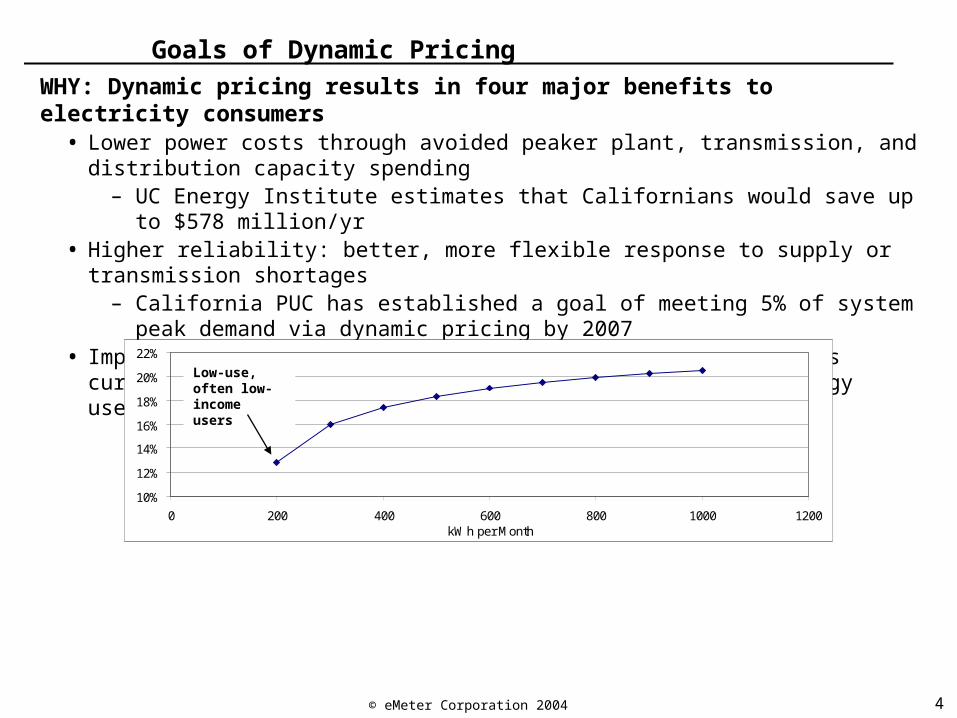
Goals of Dynamic Pricing
WHY: Dynamic pricing results in four major benefits to electricity consumers• Lower power costs through avoided peaker plant, transmission, and distribution capacity
spending– UC Energy Institute estimates that Californians would save up to $578 million/yr
• Higher reliability: better, more flexible response to supply or transmission shortages– California PUC has established a goal of meeting 5% of system peak demand via
dynamic pricing by 2007• Improved cost allocation, since low on-peak usage customers currently subsidize the
higher on-peak usage of other energy users
• Reduced air pollution emissions from reduced usage on hot summer “critical peak” afternoons, as well as reduced overall energy usage
– Puget Sound Energy estimated 1% conservation effect from dynamic pricing in presentation to California PUC September 2002
10%
12%
14%
16%
18%
20%
22%
0 200 400 600 800 1000 1200kWh per Month
Low-use, often low-income users

5© eMeter Corporation 2004
Why is the State of CA interested?
Relatively small changes in load can have large impact on energy
costs.
CPUC wants to enable consumer demand response and understands benefits to rate payers
• CPUC set 2007 goal at 5% of system peak demand • CPUC believes that AMI is foundation for demand response • Residential consumers offer greatest potential
CA Load Duration Curve
Planning Reserve Margin: 64,132 MW
Spinning Reserve Required: 56,364 MW
One quarter of capacity used less than 100
hours per yr

6© eMeter Corporation 2004
How Much Does Residential Load Contribute to Peak?
Source: California Energy Commission
7© eMeter Corporation 2004
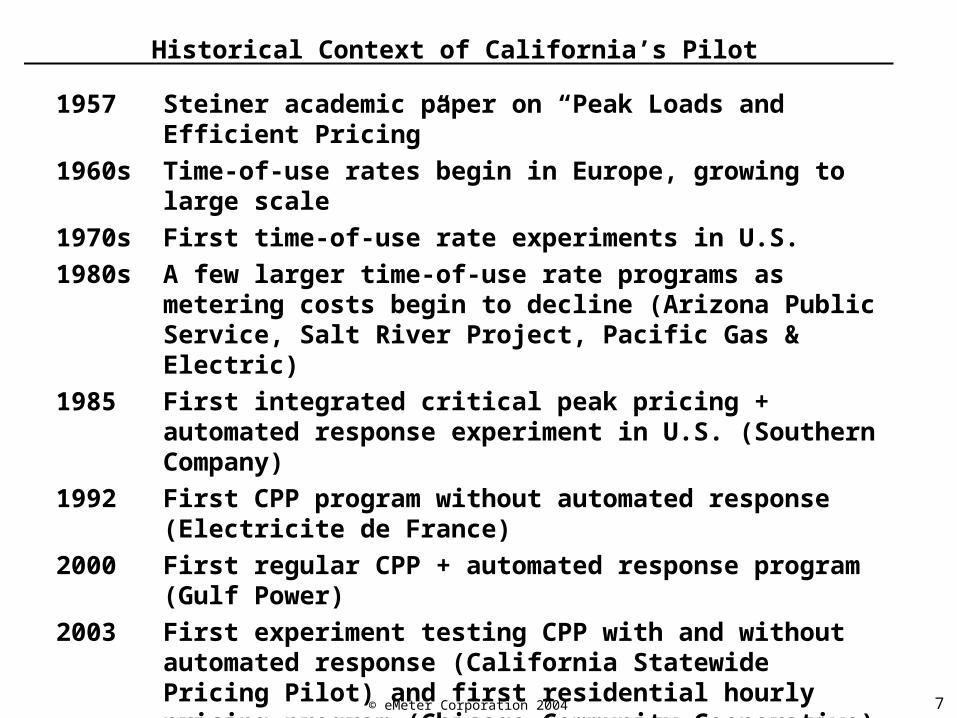
Historical Context of California’s Pilot
1957 Steiner academic paper on “Peak Loads and Efficient Pricing”
1960s Time-of-use rates begin in Europe, growing to large scale
1970s First time-of-use rate experiments in U.S.
1980s A few larger time-of-use rate programs as metering costs begin to decline (Arizona Public Service, Salt River Project, Pacific Gas & Electric)
1985 First integrated critical peak pricing + automated response experiment in U.S. (Southern Company)
1992 First CPP program without automated response (Electricite de France)
2000 First regular CPP + automated response program (Gulf Power)
2003 First experiment testing CPP with and without automated response (California Statewide Pricing Pilot) and first residential hourly pricing program (Chicago Community Cooperative)

8© eMeter Corporation 2004
Residential Dynamic Pricing Results: Price Elasticity
– Fifty-six analyses and projects in the past 25 years– Average of -0.3 own-price elasticity
• Equals 30% usage reduction for 100% price increase (off-peak to peak)– California’s pilot providing one more data point
Residential Own-Price Elasticities Recorded in Experiments/Programs
More
peak d
em
an
d
red
uctio
n
-0.9
-0.8
-0.7
-0.6
-0.5
-0.4
-0.3
-0.2
-0.1
0
1975 1980 1985 1990 1995 2000 2005
Average result =-0.30
California data
U.S./international data
Source: King and Chatterjee, Public Utilities Fortnightly, July 1, 2003

9© eMeter Corporation 2004
Residential Dynamic Pricing Results: Peak Demand Reduction
– Results of 30 residential time-of-use and critical peak pricing programs
– Results expressed as a percentage of customer’s total demand under non-time-based pricing
0%
10%
20%
30%
40%
50%
60%
70%
1975 1980 1985 1990 1995 2000 2005
Average reduction 24%
More
peak d
em
an
d
red
ucti
on
10© eMeter Corporation 2004
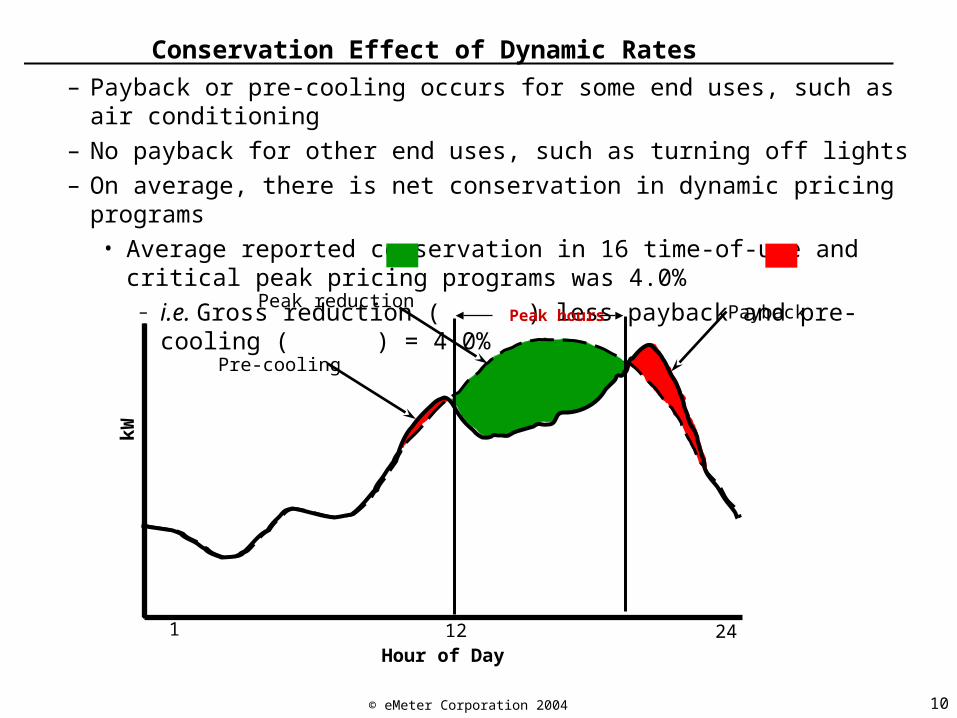
Conservation Effect of Dynamic Rates
– Payback or pre-cooling occurs for some end uses, such as air conditioning
– No payback for other end uses, such as turning off lights
– On average, there is net conservation in dynamic pricing programs• Average reported conservation in 16 time-of-use and critical peak pricing
programs was 4.0% – i.e. Gross reduction ( ) less payback and pre-cooling ( ) = 4.0%
kW
1 24
Pre-cooling
Hour of Day12
Peak hours PaybackPeak reduction

11© eMeter Corporation 2004
Statewide Pricing Pilot Overview
• Statewide– Pacific Gas & Electric, San Diego Gas & Electric, and Southern California Edison– Sample of 2,500 customers statistically representative of the entire state– Residential and small commercial customers
• Goals– Measure peak demand reductions– Measure total consumption reductions– Assess customer preferences via participant experiences and market surveys
• Customers put in three primary treatment groups– Time-of-Use (TOU)
• Peak (2-7 pm weekdays) and off-peak• Peak to off-peak price ratio about 2:1
– Critical Peak Pricing-Fixed (CPP-F)• Peak (2-7 pm weekdays) and off-peak• Much higher price – about 5x higher – during critical peak period (2-7 pm) on up to 15 days
a year, with day-ahead notification
– Critical Peak Pricing-Variable (CPP-V)• Three differences from CPP-F
– Critical peak period varies from 1 to 5 hours from 2-7 pm– Notification varies from day ahead to 4 hours ahead– All customers have smart thermostat programmed for automated response

12© eMeter Corporation 2004
Critical Peak Pricing Rates
$-
$0.10
$0.20
$0.30
$0.40
$0.50
$0.60
Sunday Monday Tuesday Wednesday Thursday Friday Saturday
Pri
ce
per
kW
h
Off-Peak
Peak (2-7 pm)
Critical Peak (2-7 pm)
Critical Peak Notification to Customer (by 5 p.m.)

13© eMeter Corporation 2004
Monthly Bill Summary
14© eMeter Corporation 2004
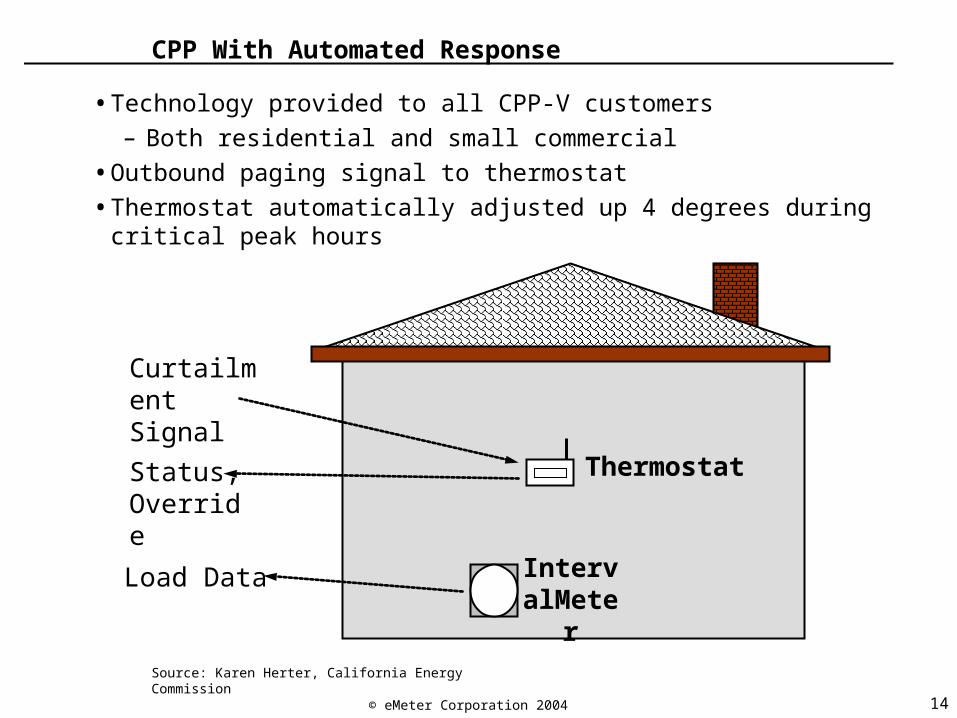
CPP With Automated Response
• Technology provided to all CPP-V customers
– Both residential and small commercial
• Outbound paging signal to thermostat
• Thermostat automatically adjusted up 4 degrees during critical peak hours
Curtailment Signal
IntervalMeter
ThermostatStatus,Override
Load Data
Source: Karen Herter, California Energy Commission

15© eMeter Corporation 2004
Statewide Pricing Pilot Results - Residential
• Rates went into effect July 1, 2003
• 12 events called during summer 2003
• Analysis by Charles River Associates (contractor to joint utilities) completed January 16, 2004 (draft report; final data may differ)
Performance Measure Average from the Literature
California SPP Result
Price elasticity (mean own price) -0.30 CPP-F: -0.27
CPP-V: -0.53
TOU: -0.24
Peak demand reduction – TOU 20% 24%
Peak demand reduction – CPP without automated response
24% 20%
Peak demand reduction – CPP with automated response
44% 49%
Total usage reduction (conservation effect)
4% CPP-F: 6%
CPP-V: 28%
TOU: 9%

16© eMeter Corporation 2004
Statewide Pricing Pilot Results – Small Commercial
• Same schedule and events as residential
• Small commercial groups did not include CPP-F
• Literature for small commercial is extremely limited
Performance Measure California SPP Result
Price elasticity (own-price) (Still being analyzed)
Peak demand reduction – TOU 15%
Peak demand reduction – CPP with automated response
67%
Total usage reduction (conservation effect)
(Still being analyzed)

17© eMeter Corporation 2004
Q95: In your opinion, should the new program be offered to other residential customers in California? Please tell me if the new program should definitely not be offered, probably should not be offered, probably should be offered, or definitely should be offered to other customers./ Q96: Why do you feel that way?
Preliminary Market Research Results
Should The New Program Be Offered? (Residential)
30%
57%
25%
62%
27%
61%
28%
60%Total
CPP-V
CPP-F
TOU
Total
CPP-V
CPP-F
TOU
Definitely
Probably
Why do you feel that way?
You save energy 19%
You save money 17%
It’s good/we like it 15%
It makes people aware of energy conservation 13%
Everyone should have achance to participate 12%
You can be in control/ manage your energy use
5%
Business customers have similar views with 55% of TOU and 69% of CPP-V customers saying the program should “definitely” be offered
TOTAL: 88%
The vast majority of SPP program participants say the new program should be offered to other customers
Source: Momentum Research Presentation to WG3, January 27, 2004
18© eMeter Corporation 2004
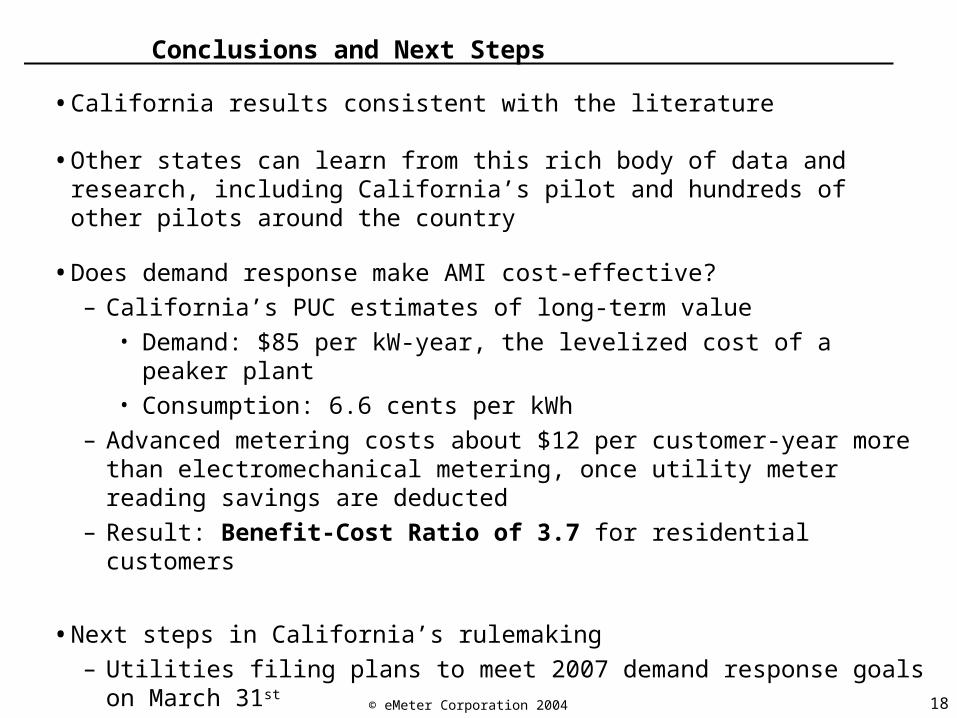
Conclusions and Next Steps
• California results consistent with the literature
• Other states can learn from this rich body of data and research, including California’s pilot and hundreds of other pilots around the country
• Does demand response make AMI cost-effective?
– California’s PUC estimates of long-term value• Demand: $85 per kW-year, the levelized cost of a peaker plant• Consumption: 6.6 cents per kWh
– Advanced metering costs about $12 per customer-year more than electromechanical metering, once utility meter reading savings are deducted
– Result: Benefit-Cost Ratio of 3.7 for residential customers
• Next steps in California’s rulemaking
– Utilities filing plans to meet 2007 demand response goals on March 31st
– CPUC to issue business case methodology decision in June 2004
– Utilities will file rollout applications, including business cases, later this year

19© eMeter Corporation 2004
Epilogue
“The essence of knowledge is, having it, to apply it.”
– Confucius
Recommended