This white paper was produced by Cascade Asia exclusively for informational reasons. While every effort has been
made to ensure the accuracy of the information and data contained herein, Cascade Asia bears no responsibility for
any errors or omissions. The information herein is given in good faith but without legal responsibility.
August 2016
Manufacturing in Indonesia New Options, Opportunities & Challenges

1
1
Executive Summary
Though it has yet fully regained its former dynamism,
Indonesia is increasingly being recognized for its
manufacturing competitiveness. The combination of relatively
low labor costs, favorable demographics, economic stability
and growth, natural resource endowments and market
expansion present a viable alternative for manufacturers
looking to shift production capacity away from China.
This white paper provides a snapshot of Indonesia’s
manufacturing sector and identifies the fastest growing sectors
and cost effective locations. By examining the size, growth
trajectory, supporting infrastructure developments and the
government’s targets and strategies within manufacturing this
paper touches on both the challenges and opportunities facing
the industry at present.

2
Introduction
Businesses looking for low-cost export platforms in Asia would do well to consider Indonesia one of the
top global manufacturing countries in the world. The country’s demographic landscape presents not only
a massive labor force of some 127 million but also a rapidly expanding middle class that is forecasted to
reach 140 million by 2020, almost doubling in size from 2012 (when it was estimated at 74 million
people). This relatively young and emerging consumer class will continue to drive domestic consumption
for the foreseeable future.
President Joko Widodo, known locally as Jokowi, is aggressively pursuing foreign direct investment and
targeting ambitious business environment improvements. Among these initiatives includes a massive
push for infrastructure upgrades across the country to ease notoriously high logistics costs across the
archipelagic nation, not just on Java and Sumatra islands as has been the focus of previous
administrations. He has set a target to improve Indonesia's ease of doing business ranking from 109th out
of 189 countries to 40th. During his 21 months in office he has also embarked on a sorely needed push to
dismantle a maze of overlapping regulations and removing red-tape by reducing bureaucratic approvals.
Indonesia is also one of the most politically and economically stable countries in Asia; a remarkable
achievement for the 18 year old democratic nation. Still, the country is not without challenges. Despite
the various improvements that Jokowi has introduced, transportation limitations and productivity issues
among other challenges remain.

3
Manufacturing and Indonesia’s Economy
Following oil price volatility in the late 1970s and 1980s, then oil-rich Indonesia diversified its economy
away from agriculture and commodities and towards manufacturing. Manufacturing remained a key
driver of Indonesia’s economy through the early and mid-1990s when non-oil and gas manufacturing
growth reached 12% per year and contributed to one-third of overall GDP growth. But in 1997 the Asian
financial crisis devastated Indonesia’s economy and lead to the toppling of Suharto, the country’s long-
serving president, a year later.
Combined, the economic and political shocks caused lower domestic demand and an overall deterioration
of the business environment. The industry was further stunted by a range of factors including rising
commodity prices, losing market share to Asian competitors and inflexible domestic labor laws.
Sources: BPS, Bappenas, World Bank
Since 2001, Indonesia’s manufacturing sector has grown at an average annual rate of 5.5% and has yet to
recapture its former dynamism. Non-oil and gas manufacturing now accounts for 18.1% of GDP (2015),
or approximately US$156 billion.

4
Source: BPS
When he assumed office in October 2014, President Jokowi pledged to make Indonesia’s manufacturing
industry more competitive and envisioned a revitalized manufacturing sector as a key part of bolstering
the country’s broader economic growth and absorbing the 2.3 million new workers that join the labor
force each year. Particularly since shaking up his cabinet in August 2015, the tenor and pace of the
government’s business climate improvements have intensified.
In May 2016 the newly revised Negative Investment List was released which outlined the Government of
Indonesia’s latest ruling on which sectors foreign investment is prohibited or restricted. Under this
revision, sectors like manufacturing of raw pharmaceutical materials is now 100% open (previously 85%
open). In essence, through liberalized market access, improving factor conditions like labor regulations
and land and infrastructure and through trade promotion efforts, the current administration is pursuing a
path which it hopes will eventually expand manufacturing’s share of GDP to 30% by 2035.
Recent evidence suggests Jokowi’s reforms may be having an impact. The Nikkei Indonesia
Manufacturing PMI exceeded 501 for the first time in President Joko Widodo’s presidency in March 2016
(50.6) and it has remained above 50 since. The industry has been trending toward a recovery since
January 2016. These changes have only further been complemented by the launch of a one-stop shop to
help expedite investment approvals, providing export incentives and import benefits for input materials
and dramatically ramping up trade promotion efforts.
Looking out on the horizon, President Jokowi has also expressed interest in joining the Trans-Pacific
Partnership (TPP) as a means of making Indonesia’s economy more competitive regionally and globally.
Some economists estimate that Indonesia’s exports would increase by some $2.9 billion and would ensure
that Indonesia remains competitive with Vietnam, one of the country’s toughest competitors. The move
1 Readings above 50 indicate an expansion in the manufacturing sector while readings below 50 indicate a
contraction.

5
would take two to three years and would require significant political wrangling but is a viable path
forward.
Manufactured Goods in Indonesia
Indonesia’s abundant natural resources provides a broad base for a diverse manufacturing industry and
rising personal incomes of its consumer class offers a strong growth driver. This is particularly true in the
food and beverage sector which is the largest manufacturing sub-sector in Indonesia. There are relatively
few manufacturers in Indonesia who have an international focus but local food and beverage
manufacturers are especially ambitious, several of whom successfully sell globally.
Source: Ministry of Industry
With manufacturing accounting for nearly a quarter of the country’s GDP, sluggish external demand on
the back of slowing global economic recovery since the 2007-2009 financial crisis has dampened
manufacturing growth. Since 2013, rising domestic wage growth rates are also cited by manufacturers as
an increasing concern. In the recent past (2012-2015), non-minerals and gas industry growth was mainly
driven by non-tech manufacturing like food and beverages, footwear and leather goods and jewelry.
During the first quarter of 2016, industries like automotive/machinery and electronics registered strong
growth that, if continued for the rest of the year, will mark their strongest performance in years.

6
Growth performance of Indonesia’s Manufactured Exports
Source: BPS, Ministry of Industry, Cascade Asia analysis
Cost and quality are among the most important factors manufacturers consider when deciding on where to
produce their goods. Cost considerations encompass factors such as wages, utility costs, real estate prices,
logistics costs, taxes and financial and fiscal incentives. While quality considers the broader ecosystem
which enables the manufacturing operations inclusive of labor, business environment and infrastructure.
Industries where Indonesia is cost competitive include automotive & components, chemicals and food &
beverage. Indonesia’s manufacturing labor costs are roughly one-third of those in China and, adjusting for
inflation, have remained comparatively flat. The average factory worker in China earns $29.70 per day,
compared with $10.40 in Indonesia. The industries that Indonesia is quality competitive include food &
beverage, tobacco, furniture, apparel and footwear.
Indonesia’s relative manufacturing strength has traditionally been in light manufacturing where it has
been competitive for years although the government is currently searching for way to graduate to
producing higher value goods. Specifically, the government is working on a policy to develop 10 priority,
higher value-added industries, including:
Food
Pharmaceutical, cosmetics and medical equipment
Textile, leather and footwear
Transportation equipment
Electronics, telecommunication and ICT
Power plant and energy generation

7
Capital goods, components and auxiliary materials
Upstream agriculture
Basic materials and non-metal mining materials
Oil, gas and coal
Indonesia’s Manufacturing Centers
Industry clustering is present in Indonesia’s manufacturing industry with most activities concentrating in
major urban centers like Jakarta, Bandung and Surabaya (all on Java island). Java and Sumatra are the
most populous and developed islands in Indonesia and are the preferred locations for manufacturing as
this is where skilled labor and access to good infrastructure is readily available.
Source: Tempo, Antara, Inilah
However, new clusters are forming outside of these areas due to high labor costs and infrastructure
bottlenecks. These include locations like Central Java and East Java where wages are roughly 40-50%
lower than in Jakarta, where new industrial zones are being installed and that are connected to the high-
speed train line that will eventually link Jakarta to Surabaya.

8
Comparison of key factors of production across Java
Key Factors Jakarta and
Surrounding Area Serang Bandung Central Java Surabaya
Labour Supply Available Easily Available Available Easily Available Easily Available
Minimum Wage
(2016)2
$233 $134 $169 $143 $228
Land Availability Available Easily Available Available Easily Available Easily Available
Land Cost Highest Medium to High Relatively High Low Relatively High
Time to Port of
Tanjung Priok
(hours)
1-2
2
(Merak Port also
an option)
3-4
(Patimban Port
will be
completed in
2017)
Roughly 4 days
(Tanjung Emas
Port also an
option)
Roughly 3 days
(Many products
shipped out from
Tanjung Perak)
Major
Manufacturing
Clusters
Full spectrum Marginal Textile and
garments
Textile and
garment,
furniture, and
automotive
Full spectrum
Source: Ministry of Human Rights, Ministry of Industry, HKTDC, Infopublik, Cascade Asia
The government aims to increase the proportion of manufacturers operating outside of Java from roughly
30% to 40% by 2025 and is in the process of establishing 36 new industrial hubs over the next 15 years
on islands other than Java. To date, Indonesia has 74 industrial zones, of which 67% are located on Java.
2 1 US$ = 13,298 rupiah exchange rate
9
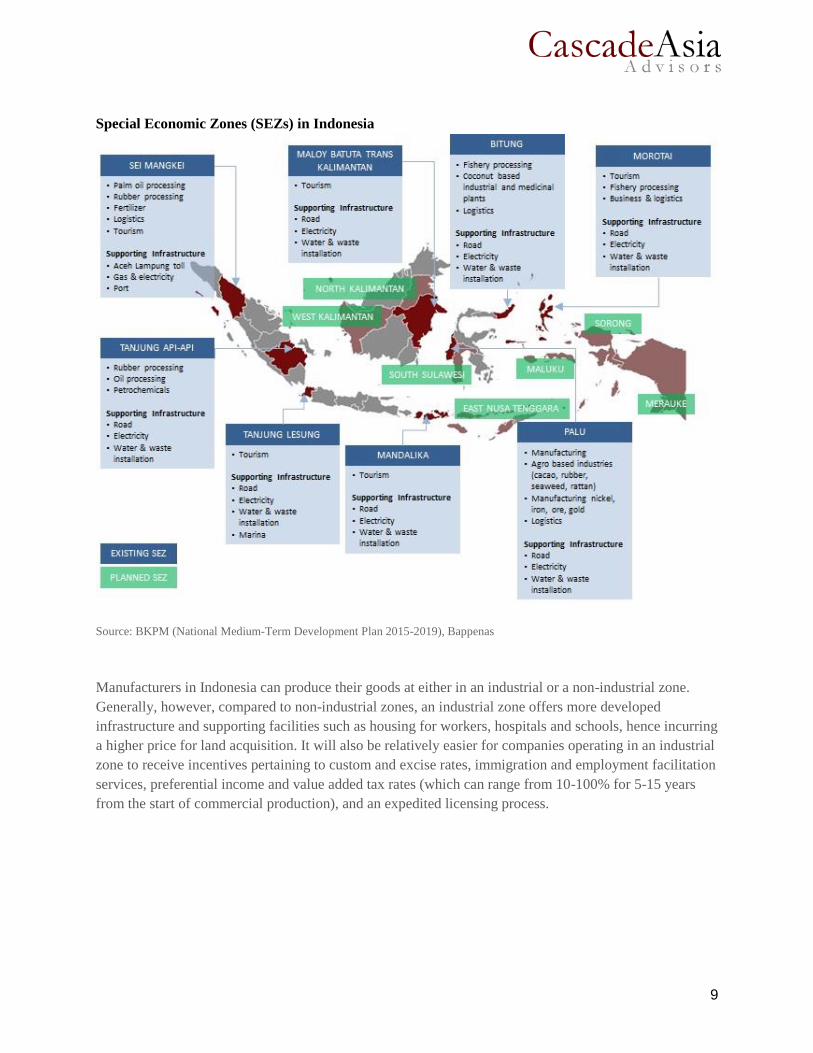
Special Economic Zones (SEZs) in Indonesia
Source: BKPM (National Medium-Term Development Plan 2015-2019), Bappenas
Manufacturers in Indonesia can produce their goods at either in an industrial or a non-industrial zone.
Generally, however, compared to non-industrial zones, an industrial zone offers more developed
infrastructure and supporting facilities such as housing for workers, hospitals and schools, hence incurring
a higher price for land acquisition. It will also be relatively easier for companies operating in an industrial
zone to receive incentives pertaining to custom and excise rates, immigration and employment facilitation
services, preferential income and value added tax rates (which can range from 10-100% for 5-15 years
from the start of commercial production), and an expedited licensing process.
10
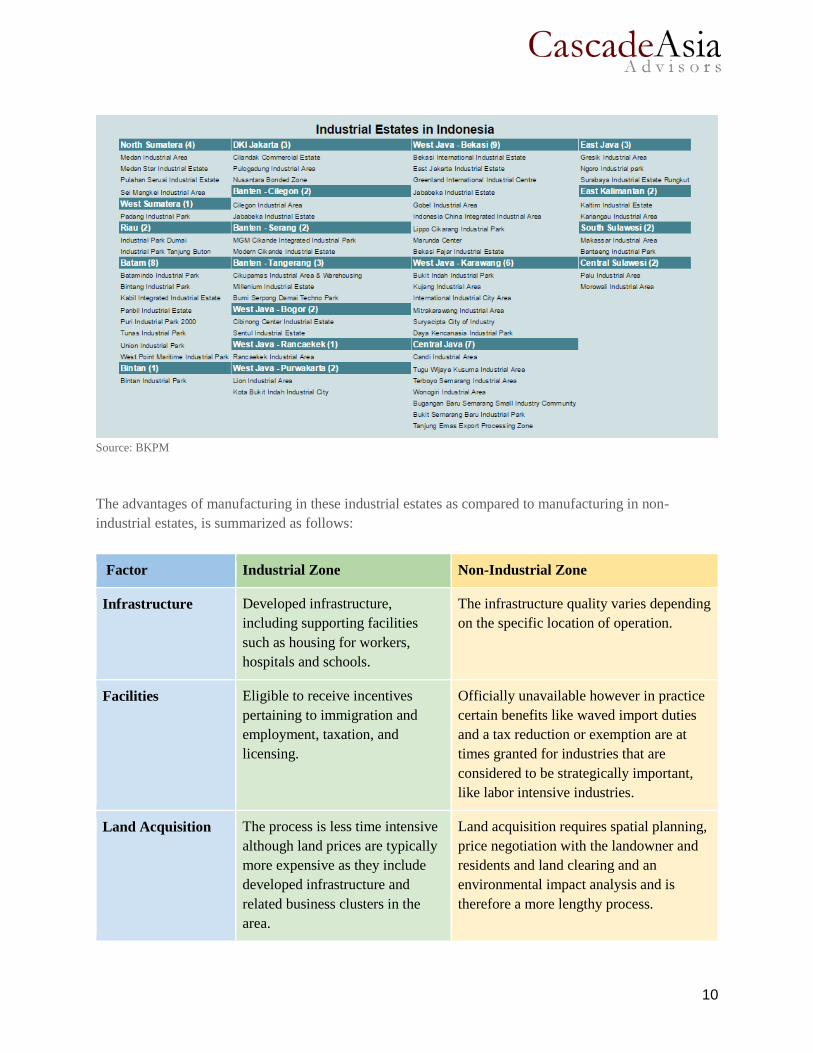
Source: BKPM
The advantages of manufacturing in these industrial estates as compared to manufacturing in non-
industrial estates, is summarized as follows:
Factor Industrial Zone Non-Industrial Zone
Infrastructure Developed infrastructure,
including supporting facilities
such as housing for workers,
hospitals and schools.
The infrastructure quality varies depending
on the specific location of operation.
Facilities Eligible to receive incentives
pertaining to immigration and
employment, taxation, and
licensing.
Officially unavailable however in practice
certain benefits like waved import duties
and a tax reduction or exemption are at
times granted for industries that are
considered to be strategically important,
like labor intensive industries.
Land Acquisition The process is less time intensive
although land prices are typically
more expensive as they include
developed infrastructure and
related business clusters in the
area.
Land acquisition requires spatial planning,
price negotiation with the landowner and
residents and land clearing and an
environmental impact analysis and is
therefore a more lengthy process.

11
Licensing Licenses are relatively easy to
obtain as the permitting process is
more streamlined. For instance, a
nuisance permit and an
environmental impact analysis are
not needed for investments in
industrial zones.
Investors will deal with local government
offices which are notorious for red tape.
Typical time to process these permits are
as follows:
1. Nuisance permit (10 working days)
2. Construction permit (15 working days)
3. Environmental impact analysis (75
working days)
Source: Ministry of Industry, BKPM
Indonesia’s Labor Market
With a workforce of approximately 127 million workers, few countries can match the size of Indonesia’s
working population. Indonesia’s labor costs are also relatively low when compared with other
manufacturing hubs in Asia.
Source: World Economic Forum, Wall Street Journal, FDRA
However, since the Asian financial crisis, Indonesia has struggled to make strides towards converging
with global productivity norms. Productivity in the country’s manufacturing sector is more than double
the productivity of the broader economy. Still, employers have argued that minimum wage increases need
to be tied to productivity gains though the government has not yet been willing to adopt such a wage
setting mechanism.
As part of President Widodo’s fourth economic stimulus package in October 2015, the government
announced the end to the failed tripartite mechanism for negotiating annual adjustments of wages on a
regional basis. In its place, the president signed Government Regulation on Wages (No. 78/2015)
ultimately opted for formula that accounts the current year’s inflation (at the provincial level) plus the

12
GDP growth rate. Though the new system is more centralized and transparent than its predecessor, the
government abandoned the most attractive component of the formula that appeared in an earlier draft,
namely the inclusion of productivity gains, though it is possible this could be included in a future
revision.
The Ministry of Manpower is the government agency responsible for planning strategic policies,
including among others, industrial relationships, employment supervision and all related employment
practices. The Manpower Law (No. 13/2003) and various implementing regulations set the legal basis for
employment in Indonesia. Labor disputes are directed to a labor court for resolution.
INDONESIA 2016 MINIMUM WAGES BY PROVINCE
Province
Monthly Minimum Wage (USD*) Growth (yoy, %)
2015 2016
1 Central Kalimantan 142 154 8%
2 West Kalimantan 117 130 11%
3 Jambi 128 143 12%
4 Southeast Sulawesi 124 139 12%
5 West Sumatra 121 135 12%
6 Bangka Belitung 157 176 12%
7 Papua 164 184 12%
8 Bengkulu 112 120 7%
9 Nusa Tenggara B. 100 111 11%
10 Nusa Tenggara T. 94 107 14%
11 Banten 120 134 12%
12 South Kalimantan 140 156 11%
13 DKI Jakarta 203 233 15%
14 Riau 141 157 11%
15 Riau Islands 146 163 12%
16 Bali 121 135 12%
17 North Sumatra 122 136 11%
18 East Kalimantan 152 162 7%
19 Aceh 142 159 12%
20 Lampung 118 132 12%
21 Central Sulawesi 112 125 12%
22 Moluccas 124 133 7%
23 North Moluccas 118 126 7%
24 South Sumatra 148 165 11%
13
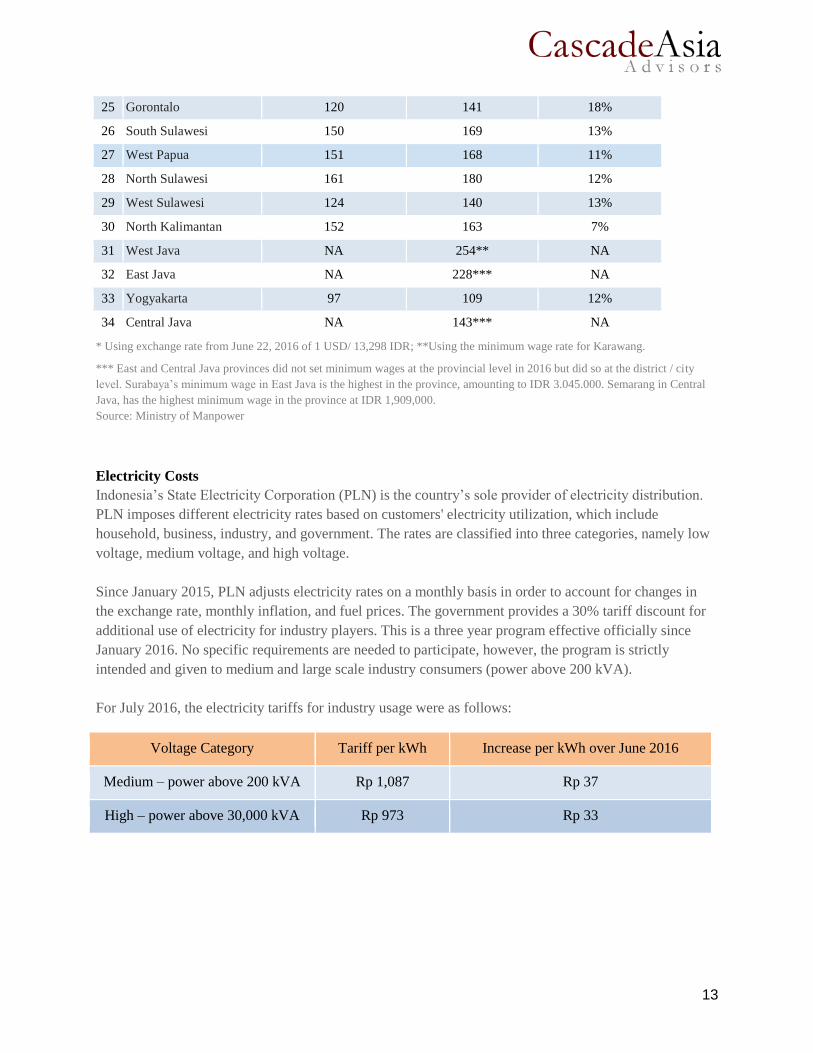
25 Gorontalo 120 141 18%
26 South Sulawesi 150 169 13%
27 West Papua 151 168 11%
28 North Sulawesi 161 180 12%
29 West Sulawesi 124 140 13%
30 North Kalimantan 152 163 7%
31 West Java NA 254** NA
32 East Java NA 228*** NA
33 Yogyakarta 97 109 12%
34 Central Java NA 143*** NA
* Using exchange rate from June 22, 2016 of 1 USD/ 13,298 IDR; **Using the minimum wage rate for Karawang.
*** East and Central Java provinces did not set minimum wages at the provincial level in 2016 but did so at the district / city
level. Surabaya’s minimum wage in East Java is the highest in the province, amounting to IDR 3.045.000. Semarang in Central
Java, has the highest minimum wage in the province at IDR 1,909,000.
Source: Ministry of Manpower
Electricity Costs
Indonesia’s State Electricity Corporation (PLN) is the country’s sole provider of electricity distribution.
PLN imposes different electricity rates based on customers' electricity utilization, which include
household, business, industry, and government. The rates are classified into three categories, namely low
voltage, medium voltage, and high voltage.
Since January 2015, PLN adjusts electricity rates on a monthly basis in order to account for changes in
the exchange rate, monthly inflation, and fuel prices. The government provides a 30% tariff discount for
additional use of electricity for industry players. This is a three year program effective officially since
January 2016. No specific requirements are needed to participate, however, the program is strictly
intended and given to medium and large scale industry consumers (power above 200 kVA).
For July 2016, the electricity tariffs for industry usage were as follows:
Voltage Category Tariff per kWh Increase per kWh over June 2016
Medium – power above 200 kVA Rp 1,087 Rp 37
High – power above 30,000 kVA Rp 973 Rp 33
14
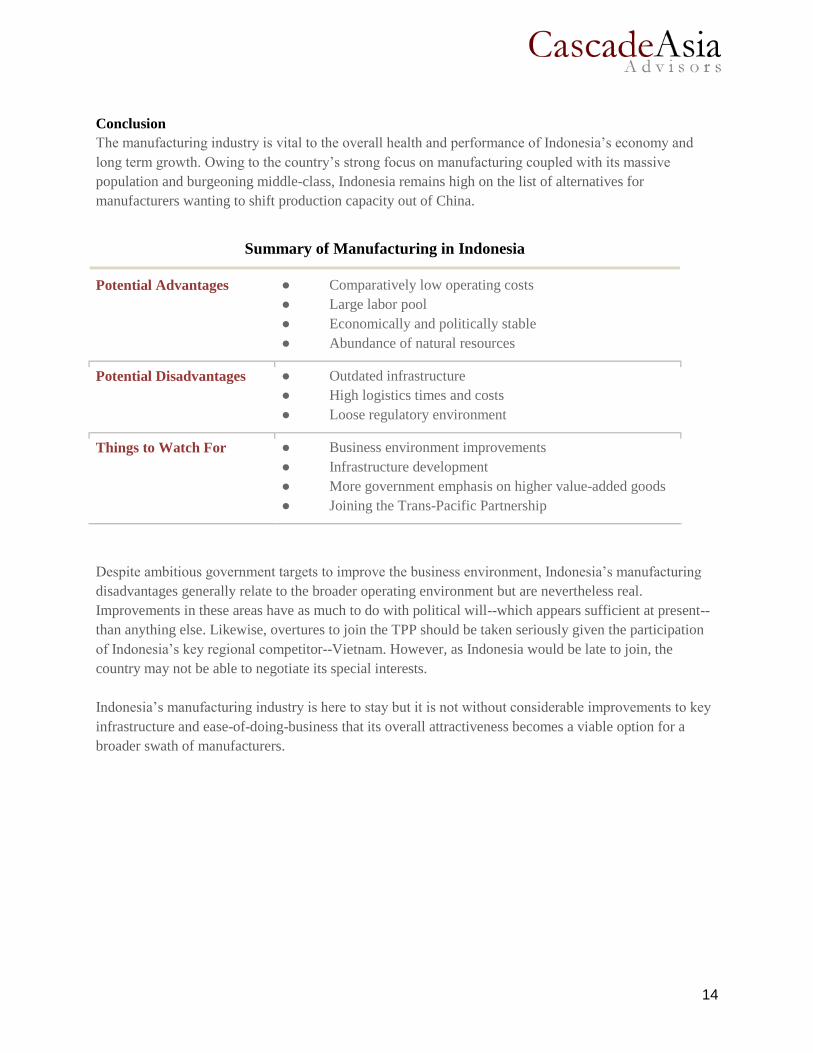
Conclusion
The manufacturing industry is vital to the overall health and performance of Indonesia’s economy and
long term growth. Owing to the country’s strong focus on manufacturing coupled with its massive
population and burgeoning middle-class, Indonesia remains high on the list of alternatives for
manufacturers wanting to shift production capacity out of China.
Summary of Manufacturing in Indonesia
Potential Advantages ● Comparatively low operating costs
● Large labor pool
● Economically and politically stable
● Abundance of natural resources
Potential Disadvantages ● Outdated infrastructure
● High logistics times and costs
● Loose regulatory environment
Things to Watch For ● Business environment improvements
● Infrastructure development
● More government emphasis on higher value-added goods
● Joining the Trans-Pacific Partnership
Despite ambitious government targets to improve the business environment, Indonesia’s manufacturing
disadvantages generally relate to the broader operating environment but are nevertheless real.
Improvements in these areas have as much to do with political will--which appears sufficient at present--
than anything else. Likewise, overtures to join the TPP should be taken seriously given the participation
of Indonesia’s key regional competitor--Vietnam. However, as Indonesia would be late to join, the
country may not be able to negotiate its special interests.
Indonesia’s manufacturing industry is here to stay but it is not without considerable improvements to key
infrastructure and ease-of-doing-business that its overall attractiveness becomes a viable option for a
broader swath of manufacturers.

15
Relevant Cascade Asia Publications
Indonesia Policy Monitor
Indonesia presents a host of challenges that can impede the ability
of foreign business players from operating at full stride. Among
these challenges, the multiple and often overlapping layers of
policy making and regulations makes for a complicated operating
environment. Cascade Asia developed the Indonesia Policy Monitor
as a complementary service to foreign players to help monitor
newly passed and pending legislation and regulations. Subscribe
Asia Light Manufacturing Outlook
The Asia Light Manufacturing Outlook is an executive-ready risk
assessment and outlook by our in-country analysts. Countries of
coverage include Cambodia, China, Indonesia and Vietnam. The
monthly outlook includes issues and events on the horizon,
inclusive of wage and currency forecasts. Customization is
available. Subscribe
Footwear Sourcing in Indonesia and Cambodia: Opportunities and
Risks
The analysis is designed to help footwear sourcing managers better
understand the socio-economic, regulatory, and political dynamics
in these countries as they look at alternative sourcing countries
outside China.
Footwear Sourcing Weekly
A multi-language media monitoring report across 11 key sourcing
countries tracking developments that impact operations and
reputations.

16
About the Authors
Adhiascha Iznandra Soemitro is an associate in the Jakarta office of Cascade Asia Advisors where he
focuses on due diligence and market research engagements. You may contacts him by email at
Garnadi Walanda Dharmaputra serves as a director in the firm’s Jakarta office. You may contact him
About Cascade Asia
Cascade Asia Advisors is a business intelligence advisory firm focused on Southeast Asia. We help
businesses anticipate risk and make informed decisions using forward-looking, on-the-ground business
intelligence. Please visit www.cascadeasia.com for more information.
Our Services
Vendor Screening
Commercial Due Diligence
Reputational Due Diligence
Business Intelligence
Market Entry Support
Policy & Regulatory Assessment
Government Relations
Stakeholder Mapping
Our Locations
Recommended