Managerial Opportunism and Earnings Manipulation:
Evidence from Defined Benefit Pension Plans
Daniel Bergstresser Harvard University
Mihir A. Desai Harvard University and NBER
Joshua Rauh MIT
March 2004
The authors thank David Cutler, David Hawkins, Caroline Hoxby, Dirk Jenter, André Perold, James Poterba, Andrei Shleifer, Jeremy Stein, and seminar participants at Harvard, Harvard Business School, and TCU for helpful discussions and the Division of Research at Harvard Business School for generous financial support.
Managerial Opportunism and Earnings Manipulation: Evidence from Defined Benefit Pension Plans
ABSTRACT
Managers appear to manipulate firm earnings when they characterize pension assets to capital markets and alter investment decisions to justify, and capitalize on, these manipulations. We construct a measure of the sensitivity of reported earnings to the assumed long-term rate of return on pension assets. Managers are more aggressive with assumed long-term rates of return when their assumptions have a greater impact on reported earnings. Managers also increase assumed rates of return as they prepare to acquire other firms and as they exercise stock options, further confirming the opportunistic nature of these increases. Decisions about assumed rates of return, in turn, influence asset allocation within pension plans. Instrumental variables results suggest that a 25 basis point increase in the assumed rate of return is associated with a 5% increase in equity allocation. Taken together, these results suggest that earnings manipulation arising from managerial motivations influences other significant managerial investment decisions. JEL Classifications: M41, M52, G23, G30, G11. Daniel Bergstresser Mihir A. Desai Joshua Rauh Harvard Business School Harvard Business School MIT Dept of Economics Morgan 391 Morgan 363 E52-300 Soldiers Field Soldiers Field 50 Memorial Drive Boston, MA 02163 Boston MA, 02163 Cambridge, MA 02142 [email protected] [email protected] [email protected]
1
1. Introduction
In speculative markets, manipulation of reported earnings can be a powerful tool for
managers to inflate their stock prices. The wealth redistribution and the distortions that
accompany earnings manipulation potentially threaten investor confidence in capital markets.
Given the numerous models that link managerial incentives and earnings reporting, the sources,
mechanisms and consequences of earnings manipulation are a critical topic of research. Study of
earnings manipulation also promises to illuminate whether managers manipulate earnings in
order to advance the interests of their shareholders or in order to expropriate them.
In this paper, we identify a simple mechanism for earnings manipulation, describe how
manipulation through this channel is linked to CEOs’ incentives, and show that firms change
investment decisions in order to justify, and capitalize on, this type of earnings manipulation.
Specifically, we focus on how managers opportunistically choose assumed rates of return on
pension assets and how these distorted reporting decisions interact with option exercises, merger
activity and asset allocation decisions within pension plans. The size of defined-benefit pension
plans and managers’ wide latitude in characterizing them to capital markets make pension
accounting a fertile area for earnings manipulation. Firms can improve earnings substantially in
the short run by changing the assumed long-term rate of return for the pension assets they
manage for their workers. Capital market observers consider the actions of IBM, under CEO
Louis Gerstner, Jr., to be a particularly striking example of how firms can use pension
accounting to manipulate earnings.1
IBM sponsors a large defined benefit pension plan, with over $57 billion in assets at the
end of 2002. Table 1 outlines the operating performance of IBM, the performance of its DB
pension plan, and CEO Lou Gerstner’s option grants and exercises. Changes in the long-term
rate of return (LTROR) that IBM assumes on its DB pension plan assets are of particular interest.
IBM changed its assumed long-term rate of return four times during this period: a twenty-five
basis point reduction in 1995, a twenty-five basis point increase in 1997, a fifty basis point
increase in 2000, and a fifty basis point reduction in 2002. As we describe more fully in the
sections that follow, IBM’s assumed rates of return throughout this period exceeded those used
1 See Maclean (2002).

2
by most firms. The frequent changes are also notable given the long run nature of these assets
and assumptions. While IBM reacted to poor actual performance in its pension plan in the mid-
1990s by reducing the assumed long-term rate of return, the opposite occurred in 2000. In the
face of poor equity market returns and declining bond yields during that year, IBM raised its
long-term rate of return assumption by fifty basis points. Nearly five percent of IBM’s income
before tax in 2000 and 2001 resulted from the increase in the assumed long-term rate of return
from 9.25% to 10.00%. More generally, IBM’s reported pretax income grew at a compound
annual growth rate of 6.7% from 1995 to 2001; without these changes, income would have
grown at only a 5.6% rate. As Table 1 shows, these critical changes in pension assumptions
coincided with deteriorating operating performance and with substantial option exercise activity
by Gerstner.
This example illustrates how senior managers can use pension accounting to
opportunistically boost their firms’ reported profits. Coronado and Sharpe (2003) present
evidence that investors have been unable to ‘pierce the veil’ of pension finance accounting; they
show that earnings associated with changed pension assumptions are capitalized into prices to
the same degree as operating earnings.2 This suggests that managers can boost both reported
profits and stock prices through the simple mechanism of pension accounting. We investigate
the degree to which managers are opportunistic with these assumed returns and evaluate the
extent to which choices on assumed returns interact with their own option exercises and with the
merger activity of their firms. Finally, we evaluate the extent to which managers alter asset
allocation within pension plans to justify these assumed returns.
We start by constructing a measure of the sensitivity of a firm’s overall profits to the
assumed long-tem rate of return on pension assets. We show that this sensitivity measure is an
important determinant of the levels of, and changes in, assumed rates of return. Specifically, a
firm whose pension assets are twice as large relative to its operating income as the median firm
in our sample assumes, on average, a long-term rate of return that is approximately ten basis
points higher than the median. A firm in the 90th percentile of sensitivity, on average, has an
assumed long-term rate of return that is 40 basis points higher than a firm in the 10th percentile.
2 In a related vein, Franzoni and Marin (2003) conclude that firms with underfunded plans are overvalued by the market.
3
The impact of these measures of pension sensitivity on rate of return assumptions grew
significantly over the decade.
We then investigate links between this earnings manipulation and firm and managerial
investment decisions. We show that firms make particularly high return assumptions in periods
leading up to the acquisition of other firms. This relationship is particularly strong for firms
whose reported income is the most sensitive to pension assumptions. Assumed long-term rates
of return at the median firm are between 5 and 30 basis points higher during the period prior to
an acquisition. In addition, years in which CEOs choose to exercise options also see higher
return assumptions. A one standard-deviation increase in option exercise, at the median firm, is
associated with a 4 basis point increase in the assumed long-term rate of return. As managers
prepare for acquisitions and for large exercises, they have an increased incentive to produce
higher earnings and stock prices and they appear to increase their assumed rates of return in
order to do so. The opportunistic use of pension accounting to inflate reported earnings appears
to be pervasive in the recent period. Alternative explanations for these assumed rates of return
are not consistent with the patterns illustrated in this paper.
We then describe the links between earnings manipulation and asset allocation within
pension plans. Allocations to equity vary considerably across organizational form and across
firms, with equity allocations in firm-sponsored pension funds exceeding those in public and
union-sponsored funds. Indeed, the large equity allocation in most firm pension plans is a
persistent puzzle; our analysis suggests that the interaction of managerial opportunism and
pension accounting may help explain part of this phenomenon. Our empirical strategy is to
regress equity allocation on the long-term rate of return assumption, using acquisitions and CEO
option exercises as instruments for long-term pension asset return assumptions. This strategy
aims to address the concern that assumed rates and asset allocation decisions may be correlated
for reasons unrelated to managerial motivations. Because it is unlikely that the variation in
equity allocations is independently correlated with firm acquisition and CEO option exercise
activity, this empirical approach provides a robust source of identification. The results from this
IV analysis indicate that changed assumed rates lead to changed asset allocation decisions.
Specifically, we find that 25 basis point increases in assumed rates are associated with 5%

4
increases in equity allocation. These results seem reasonable given that they are consistent with
an assumed market risk premium of 5%.
We conclude by framing our investigation of earnings manipulation within this debate on
whether earnings manipulation reflects an agency concern or is beneficial to current
shareholders. We show that managers who are the least constrained by their shareholders — as
measured by an index of corporate governance — appear to be the most aggressive with their
rate of return assumptions. This evidence suggests that the managerial opportunism and earnings
manipulation investigated here does not benefit current shareholders. We go on to speculate on
the magnitude of these effects by returning to the case of Gerstner and IBM. We estimate that
between $12 and $76 million of compensation accrued to Gerstner from these changed
assumptions alone.
This work relates closely to the existing work on earnings management, summarized in
Healy and Whalen (1999). Sloan (1996) finds evidence that the market ‘misprices’ accruals
components of earnings, meaning that periods where accruals make up a large part of earnings
are followed by low returns. Xie (2001) finds evidence that this result comes largely from
discretionary components of earnings, suggesting that Sloan’s result is related to managerial
manipulation of earnings.3 Teoh, Welch, and Wong (1998a, 1998b) focus on discretionary
accruals at times that firms are selling shares, and find additional evidence consistent with
opportunistic managerial manipulation of accruals components of earnings.
In contrast to much of the existing work on earnings manipulation and managerial
incentives, our analysis of the assumed rate of return on pension assets isolates a specific action
that is otherwise unrelated to the core business of a firm. This approach avoids measures of
earnings manipulation that are based on aggregate accounting variables, such as the difference
between a firm’s cash flow and its reported earnings. Such aggregate measures, because they are
often correlated with firm growth rates, can lead to potentially spurious correlations with other
variables related to firm growth rates. Our focus on pension accounting isolates earnings
3 Chan, Chan, Jegadeesh, and Lakonishok (2001) also focus on market evaluation of accruals components, without necessarily focusing on earnings manipulation. Their evidence suggests that, even without earnings manipulation, the market misjudges the importance of key accruals components. For instance, reductions in accounts payable (which actually reduce accruals) forecasts positive returns. If reductions in accounts payable are a leading indicator for corporate financial performance, this suggests that markets underweight the importance of this indicator.

5
manipulation in a way that is less likely to be associated with a firm’s core activities, and avoids
potential spurious correlations. Additionally, the results reported in the paper are robust to the
inclusion of industry-year controls and firm fixed effects, further confirming the underlying link
we identify between managerial opportunism and earnings manipulation. These controls also
help ensure that alternative theories of decision-making on assumed rates of return – that these
choices reflect equity allocations or that they reflect managerial optimism – cannot explain our
results.
In addition to the literature on the motivations for earnings manipulation, this paper
relates to the both the literature on incentive compensation and managerial incentives and to the
literature on the asset allocation decisions and reporting of pension plans. As detailed in Hall
and Murphy (2003), the growth of incentive compensation is one of the most notable
developments in corporate practices through the 1990s. Recently, more attention has been paid
to the less beneficial effects of such practices, as in Bebchuk, Fried and Walker (2002),
Bergstresser and Philippon’s (2003) study of accrual accounting, and Desai and Dharmapala’s
(2003) study of tax avoidance.
Academic work on pension plans has typically focused on whether or not firms
incorporate pension plans into their own capital structure and investment decisions (as in
Friedman (1983) and Bodie et al. (1985)), how unfunded pension liabilities are priced by the
market (see for example Feldstein and Seligman (1981) and Feldstein and Mørck (1983)), and
how firms react to the guarantee of pension liabilities provided through the Pension Benefit
Guarantee Corporation. Some studies have examined latitude in setting the rate used to discount
pension liabilities in accounting regimes where this flexibility was considerable.4 Several studies
have examined asset allocation decisions (eg. Papke (1992)) and their relationship to tax
incentives, as in Frank (2002). Amir and Benartzi (1998) examine expected rate of return
assumptions and find them weakly related to equity shares and unrelated to future performance
of pension fund assets. Gold (2003) conjectures that the puzzle of high equity allocations in
defined-benefit pension plans reflects managerial incentives created by accounting rules and our
results investigate, and confirm, this conjecture.
4 Feldstein and Mørck (1983) consider these assumptions in the US before SFAS 87, which placed significant restrictions on discount rates. Obinata (2000) considers Japanese firms.
6
Section 2 of the paper motivates the analysis that follows by providing an illustrative
example of managerial motives with respect to the reporting of defined benefit plans. Section 3
describes recent patterns on assumed rates and asset allocation and reviews the data employed in
the subsequent analysis. Section 4 analyzes the determinants of assumed rates of return with
particular emphasis on the role of merger activity and incentive compensation. Section 5 relates
decisions on assumed returns on pension assets to equity allocation decisions through and
instrumental variables analysis. Section 6 discusses the consequences of these results for the
evolving debate on how managerial manipulations reallocate value amongst current
shareholders, potential shareholders and managers. Section 7 concludes.
2. A motivating example
Firms that sponsor DB pension plans create a liability equal to the present value of all
future payments due their employees. Firms fund these liabilities with devoted pension assets,
which are to be managed in the interest of the employee-beneficiaries. These assets and
obligations, however, are accounted for on the firm’s financial statements. Explicit rules dictate
contribution and funding decisions, such as minimum funding requirements and restrictions
designed to prevent substantial overfunding of plans. Firms do, however, have significant
latitude to make assumptions when they report to capital markets the cost of sponsoring a
defined benefit pension plan, as well as the value of the plan’s assets and liabilities.5 We focus
on these assumptions and their impact on asset allocation in the sections that follow.
Firms must make three main calculations when characterizing the annual cost of their DB
plans — a service cost, an interest cost, and an offsetting assumed return on plan assets. The
service cost is the present value of benefits earned by the firm’s employees during the current
period. This cost is the change in the value of the firm’s promises to its employees that comes
from an additional year of employment.6 Firms also report an interest cost corresponding to the
change in the present discounted value of the pension obligations arising from the approach of
the discharging of these obligations. Holding constant the nominal value of the obligations,
5 For a detailed discussion of these accounting rules, see Hawkins (2001) and Zion and Carcache (2002). For a broader discussion of the legal rules surrounding DB plans, see Langbein and Wolk (2000). 6 When an employee’s wages grow with tenure, and when the promised benefits of the DB plan are a function of wages in the final years of employment, the reported service cost captures the cost arising from an additional year of wage growth for covered employees.
7
bringing these obligations a year closer increases their present discounted value. The interest
cost would also include the change in the present discounted value of pension obligations due to
changing interest rates. Industry observers suggest that individual firms have relatively limited
discretion over their reported service and interest costs.7
The final component of pension expense, the assumed return on plan assets, offsets the
interest and service costs. This return is an assumed return rather than the realized rate of return
on the plan’s assets. Using an assumption insulates annual earnings from year-to-year
fluctuations in the market performance of pension assets. The reconciliation between the
assumed and actual rates of return happens over time, with potentially very long amortization
periods.8
Decision-making about assumed rates of return may be guided by several objectives. As
discussed in Amir and Benartzi (1998), assumed rates of return might simply reflect the
composition of pension plan assets with higher assumed rates reflecting higher allocations to
equity. Amir and Benartzi (1998), and the results presented below, suggest that this explanation
for reported rates of returns is incomplete. It is also possible that assumed rates of return might
reflect managerial dispositions with higher rates of return being made by optimistic managers
and firms. This alternative, as discussed below, is difficult to reconcile with the results presented
below. Finally, assumed rates of return may simply reflect managers who react to a substantial
opportunity to manage earnings. As a simple example, consider a firm with $100 of operating
assets, a 4% ($4) return on these operating assets, and $20 of pension assets. If this firm changes
the assumed rate of return from 10% to 11%, it can immediately increase net income by 5% (or
$0.20). As this example illustrates, the scope for increasing profits in this manner is a function
of the size of pension assets relative to operating income.
7 See Zion and Carcache (2002). While changed interest rate assumptions can have large consequence, cross sectional variation in these effects is bounded by the rules that liabilities must be valued using rates that are between 90% and 120% of the 30-year Treasury rate. The steep decline in this rate has raised liabilities while asset values of equity-heavy pension funds fell, a situation industry insiders call the “Perfect Storm”. 8 Any deviation between actual realized returns and the actuarial assumption goes into an off-balance sheet item ‘unrecognized gain or loss’. The rules for amortization of this unrecognized component are based on a ‘corridor’ approach; as long as the unrecognized component is less than 10 percent of the PBO, there is no need to amortize any part of the difference. When the unrecognized component is beyond 10 percent of the PBO, a firm is required to amortize a share of the difference between their position and the 10 percent ‘corridor’ boundary. The required share is based on the expected future service of the plan’s participants.
8
Table 2 presents a matrix, showing for different levels of pension sensitivity (across the
columns) and different long-term rate of return assumptions (down the rows) the share of
operating income that comes from the assumed return on pension assets. Our measure of
pension sensitivity is the ratio of pension assets to firm operating income, and the long-term rate
of return is the one reported in the firm’s financial statements. The particular row entries in the
table reflect the distribution of long-term rates of return in the Compustat-based sample used in
the empirical work that follows; the fifth percentile is 7 percent, while the median is 9 percent
and the 95th percentile is 10 percent. The column entries in the table reflect the distribution of
pension sensitivity; at the median firm in our sample, pension assets amount to 71.6 percent of
firm operating income.
For the firms with small plans, even large changes in the assumed rate of return make
small differences in net earnings. For instance, at the 10th percentile of pension sensitivity, at
which plan assets amount to 5.8 percent of firm operating income, changing the assumed rate of
return from 7 percent to 10 percent would boost reported income by only 2 tenths of a percent.
However, at the 50th percentile of pension sensitivity, the same increase in the assumed rate of
return would increase reported income by over 2 percent. At the 90th percentile of pension
sensitivity, however, reported firm income would be boosted by almost 9 percent. Firms with
large pension plans, such as IBM, can significantly change their reported performance by
adjusting this assumed long-term rate of return.9
The desire to opportunistically manipulate assumed rates of return may have an influence
on pension asset allocations. Extreme rate of return assumptions may be easier to justify in a
setting where expected returns are more uncertain. In particular, the uncertainty involved in
equity returns means that a firm with a large equity allocation enjoys greater leeway in
estimating expected returns than a firm whose investments are entirely in fixed-income
securities. In short, higher assumed returns may be more easily rationalized with higher equity
allocations. The following sections explore the link between long-term rate of return
assumptions and managerial motivations in order to identify the role of opportunism – relative to
9 Not all firms with large pension plans actively change their assumed rates of return actively. Appendix Table 1 details the assumed rates of returns for the ten largest DB sponsors, other than IBM, as provided in their 10-Ks. This table demonstrates that several of these large firms never change their rates of return and others change their assumed rates of return often.
9
alternative explanations – in determining reporting decisions. In particular, we focus on the
desire to boost reported earnings in periods around option exercise and in periods when their
firms are purchasing other companies.
3. Data and descriptive statistics
To examine the links among managers’ motivations and pension reporting and asset
allocation decisions, we compile data from several sources. Firm non-pension income, non-
pension assets, pension fund size, pension liability size, and long-term rate of return assumptions
for pension assets come from the Compustat dataset for the years 1991-2002. Compustat
Executive Compensation provides information on CEO option exercise for a subsample of
Compustat firms from 1992-2002. We take data on firm acquisitions from the Securities Data
Company (SDC) database of mergers and acquisitions and are available for the entire sample
period.
Pension fund asset allocation data come from two sources. First, an annual survey
conducted by Pensions and Investments covers the asset allocation of the largest US pension
funds from 1991-2002.10 Second, firms sponsoring pension plans with more than 100 employees
must file a Form 5500 for each plan with the IRS on an annual basis; the full set of these forms
are publicly available in electronic form through 1998 and contain asset allocation data. For
firms with multiple plans we aggregate the IRS 5500 filings from the plan-year level to firm-year
observations. We do not use asset allocation data from a firm’s 5500 filings if that pension
fund’s assets are held in trusts or other opaque investment vehicles; for these observations it is
impossible to precisely identify equity allocations. The combination of the Pensions and
Investments and IRS 5500 sources provides equity allocation information for approximately
3,200 firm-year observations, and approximately equal numbers of firm-year observations come
from each of the two sources.11
10 The Pensions and Investments survey data begins in 1988 but the years 1988-1990 are not used in this study as the Compustat pension data does not begin until 1991. 11 The initial size of the P&I sample is 200 pension sponsors for each year 1988-1996 and 1000 sponsors for 1997-2002. Approximately 45% of the entities in each year of the P&I are corporate (as opposed to public, union, or nonprofit) sponsors of DB plans. The requisite data from Compustat (in particular the long-term rate of return) are available for approximately two-thirds of those observations, leaving about 1,700 P&I observations at the firm-year level. The IRS 5500 filings add the remaining 1,500 observations during the period 1990-1998, which is also the period for which the Pensions & Investments sample is smaller.
10
The analysis that follows uses three different samples; the second and third are subsets of
the first. Our primary sample includes all Compustat firms for which pension assets, operating
income, and assumed long-term rates of return on pension investments are available.12 This
sample has 19,325 observations for 3,247 defined-benefit plan sponsors during this period. We
use this sample to investigate the relationships among pension sensitivity, firm acquisitions, and
assumed rates of return on pension assets. The second sample includes the 7,075 firm-year
observations from the first sample that can be linked to the Compustat Executive Compensation
database. We use this smaller sample to investigate the role of executive option exercises. The
third sample includes the 3,200 firm-year observations from the first sample for which we also
observe pension fund asset allocations, either from the Pensions and Investments data or from
the IRS 5500 filings. We use this sample to investigate the relationship between long-term rate
of return assumptions and pension fund asset allocations.
Defined benefit pension plans are quite large in aggregate, and represent a significant part
of overall assets for corporate sponsors. These assets also represent a large part of the pool of
liquid financial assets in the economy. Table 3 describes the sizes of these plans among the
firms in our sample. The aggregate ratio of pension assets to operating assets peaked at 10.31%
in 1997 when pension assets totaled $1.156 trillion for the 1,630 firms in the sample. The mean
firm in our sample, in that year, had $709.4 million in pension assets. The distribution is highly
skewed, however; the median in 1997 year was $77 million and the 95th percentile was $414.6
million.
The market value of pension fund assets declined recently along with broader equity
markets. In 2002, the total pension fund assets for the 1,502 sample firms totaled $1.094 trillion,
an amount equal to 5.7 percent of balance sheet assets. This reduction in the value of pension
assets coincided with increasing plan liability values due to falling bond yields. The declining
funding status of the sample pension plans thus reflects both falling asset values and rising
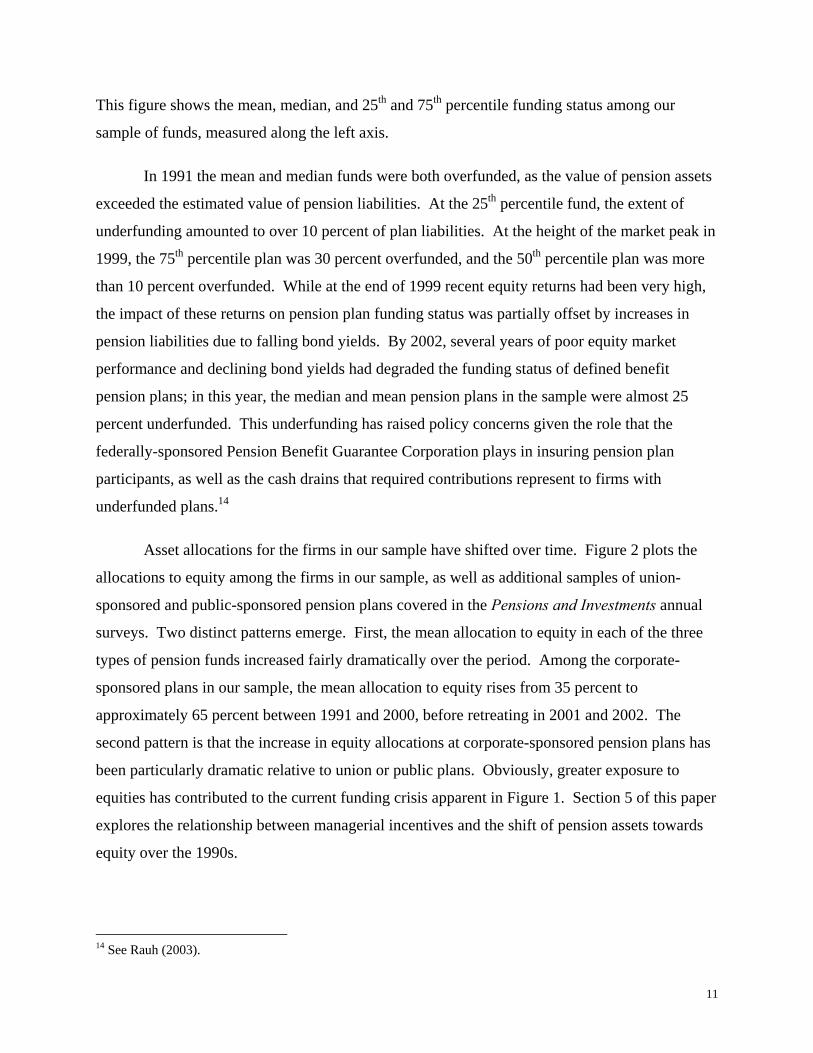
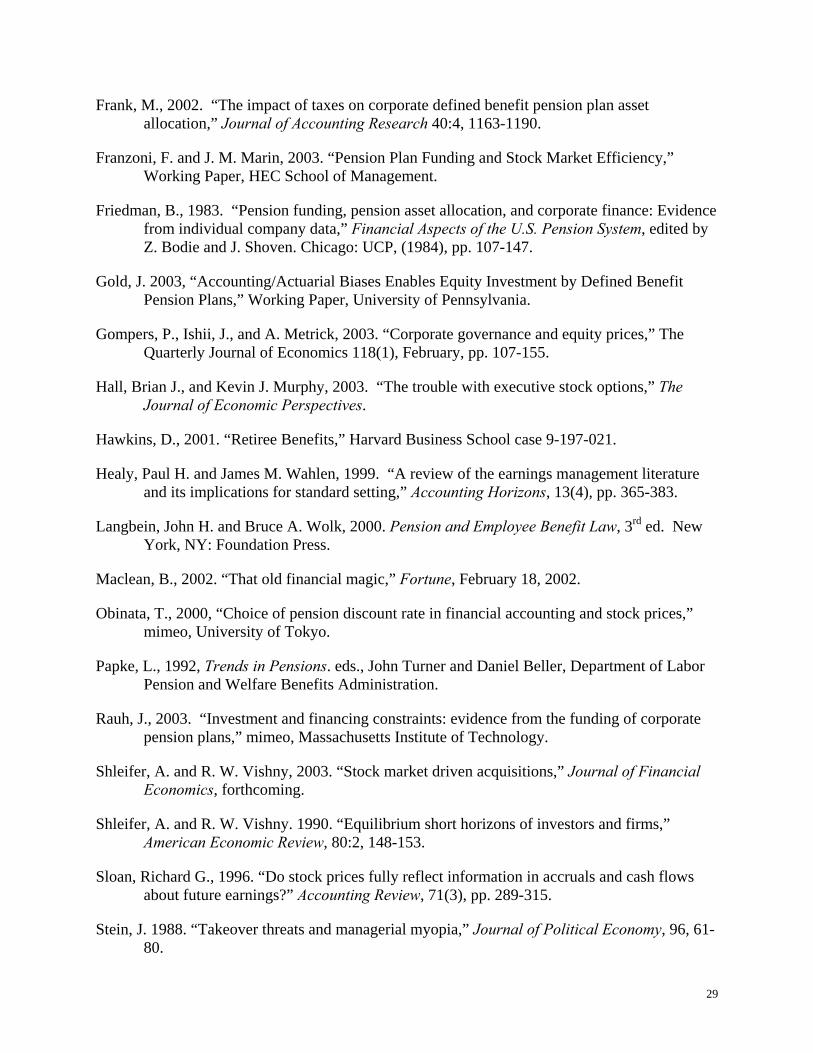
liability values. Figure 1 shows the changing pension funding status for our sample of firms.13
12 This sample includes only those firms for which the log ratio of pension fund size to firm operating income can be computed. 13 We use the projected benefit obligation (PBO) as our measure of liabilities and compute funding status as the difference between plan assets and plan liability scaled by plan liabilities.
11
This figure shows the mean, median, and 25th and 75th percentile funding status among our
sample of funds, measured along the left axis.
In 1991 the mean and median funds were both overfunded, as the value of pension assets
exceeded the estimated value of pension liabilities. At the 25th percentile fund, the extent of
underfunding amounted to over 10 percent of plan liabilities. At the height of the market peak in
1999, the 75th percentile plan was 30 percent overfunded, and the 50th percentile plan was more
than 10 percent overfunded. While at the end of 1999 recent equity returns had been very high,
the impact of these returns on pension plan funding status was partially offset by increases in
pension liabilities due to falling bond yields. By 2002, several years of poor equity market
performance and declining bond yields had degraded the funding status of defined benefit
pension plans; in this year, the median and mean pension plans in the sample were almost 25
percent underfunded. This underfunding has raised policy concerns given the role that the
federally-sponsored Pension Benefit Guarantee Corporation plays in insuring pension plan
participants, as well as the cash drains that required contributions represent to firms with
underfunded plans.14
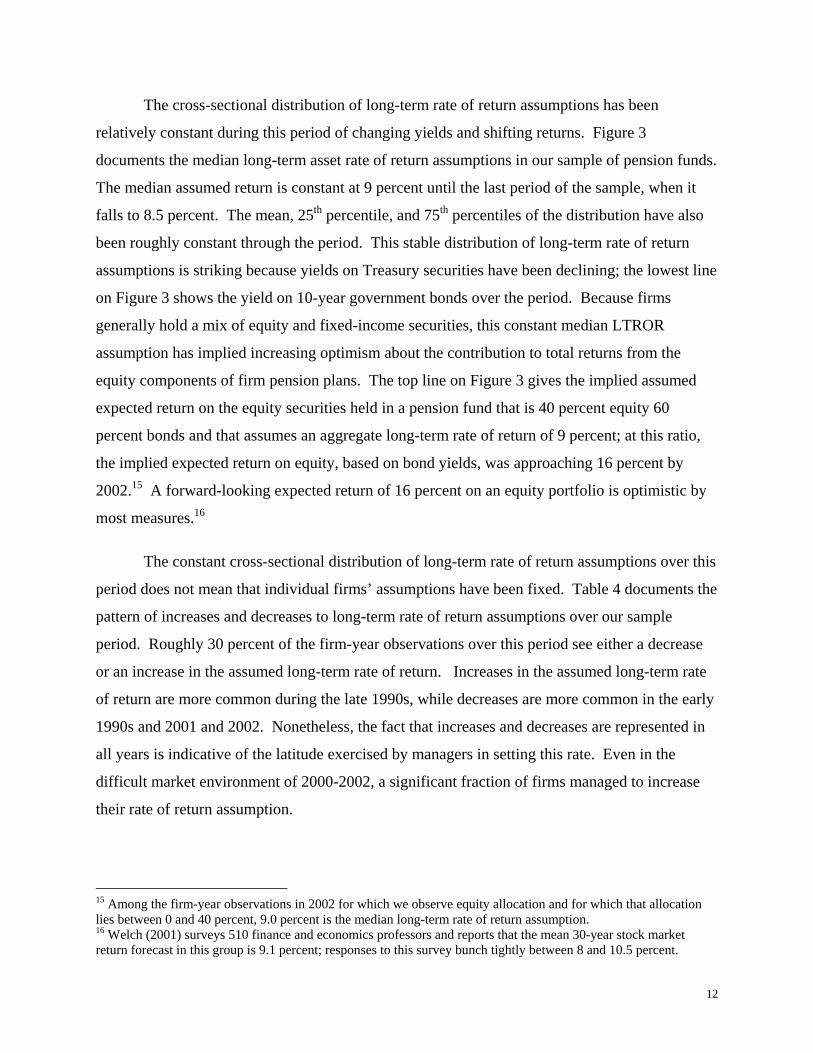
Asset allocations for the firms in our sample have shifted over time. Figure 2 plots the
allocations to equity among the firms in our sample, as well as additional samples of union-
sponsored and public-sponsored pension plans covered in the Pensions and Investments annual
surveys. Two distinct patterns emerge. First, the mean allocation to equity in each of the three
types of pension funds increased fairly dramatically over the period. Among the corporate-
sponsored plans in our sample, the mean allocation to equity rises from 35 percent to
approximately 65 percent between 1991 and 2000, before retreating in 2001 and 2002. The
second pattern is that the increase in equity allocations at corporate-sponsored pension plans has
been particularly dramatic relative to union or public plans. Obviously, greater exposure to
equities has contributed to the current funding crisis apparent in Figure 1. Section 5 of this paper
explores the relationship between managerial incentives and the shift of pension assets towards
equity over the 1990s.
14 See Rauh (2003).
12
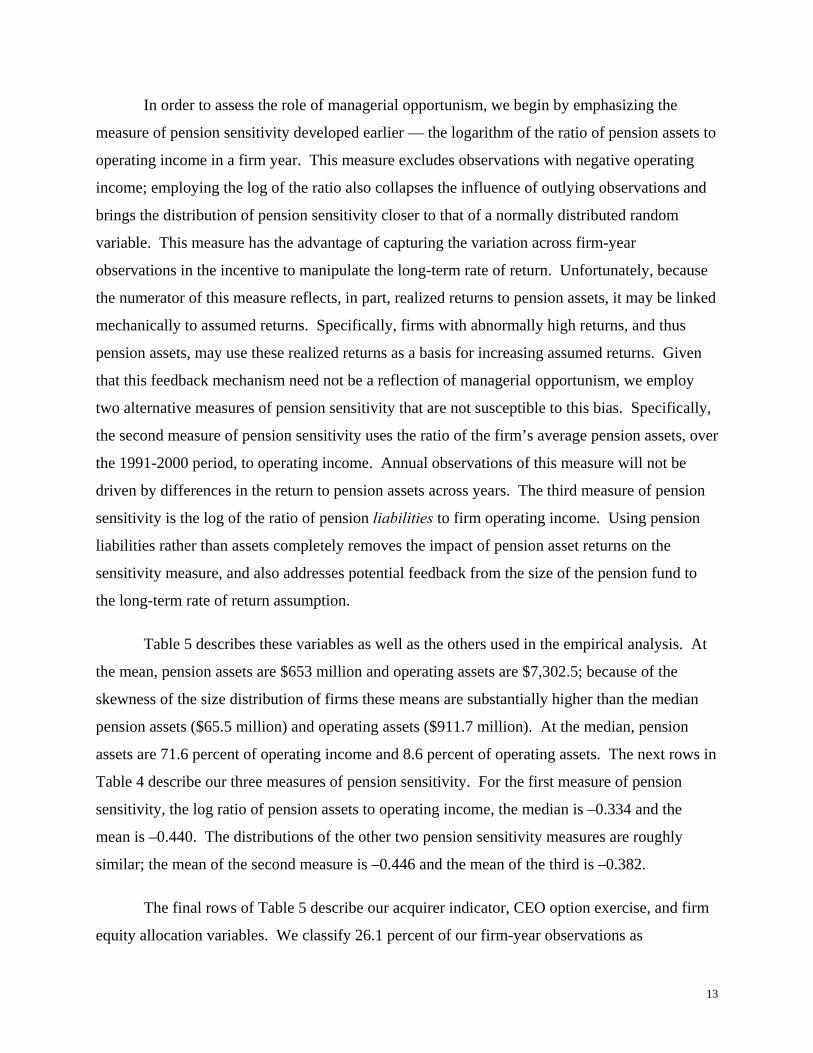
The cross-sectional distribution of long-term rate of return assumptions has been
relatively constant during this period of changing yields and shifting returns. Figure 3
documents the median long-term asset rate of return assumptions in our sample of pension funds.
The median assumed return is constant at 9 percent until the last period of the sample, when it
falls to 8.5 percent. The mean, 25th percentile, and 75th percentiles of the distribution have also
been roughly constant through the period. This stable distribution of long-term rate of return
assumptions is striking because yields on Treasury securities have been declining; the lowest line
on Figure 3 shows the yield on 10-year government bonds over the period. Because firms
generally hold a mix of equity and fixed-income securities, this constant median LTROR
assumption has implied increasing optimism about the contribution to total returns from the
equity components of firm pension plans. The top line on Figure 3 gives the implied assumed
expected return on the equity securities held in a pension fund that is 40 percent equity 60
percent bonds and that assumes an aggregate long-term rate of return of 9 percent; at this ratio,
the implied expected return on equity, based on bond yields, was approaching 16 percent by
2002.15 A forward-looking expected return of 16 percent on an equity portfolio is optimistic by
most measures.16
The constant cross-sectional distribution of long-term rate of return assumptions over this
period does not mean that individual firms’ assumptions have been fixed. Table 4 documents the
pattern of increases and decreases to long-term rate of return assumptions over our sample
period. Roughly 30 percent of the firm-year observations over this period see either a decrease
or an increase in the assumed long-term rate of return. Increases in the assumed long-term rate
of return are more common during the late 1990s, while decreases are more common in the early
1990s and 2001 and 2002. Nonetheless, the fact that increases and decreases are represented in
all years is indicative of the latitude exercised by managers in setting this rate. Even in the
difficult market environment of 2000-2002, a significant fraction of firms managed to increase
their rate of return assumption.
15 Among the firm-year observations in 2002 for which we observe equity allocation and for which that allocation lies between 0 and 40 percent, 9.0 percent is the median long-term rate of return assumption. 16 Welch (2001) surveys 510 finance and economics professors and reports that the mean 30-year stock market return forecast in this group is 9.1 percent; responses to this survey bunch tightly between 8 and 10.5 percent.
13
In order to assess the role of managerial opportunism, we begin by emphasizing the
measure of pension sensitivity developed earlier — the logarithm of the ratio of pension assets to
operating income in a firm year. This measure excludes observations with negative operating
income; employing the log of the ratio also collapses the influence of outlying observations and
brings the distribution of pension sensitivity closer to that of a normally distributed random
variable. This measure has the advantage of capturing the variation across firm-year
observations in the incentive to manipulate the long-term rate of return. Unfortunately, because
the numerator of this measure reflects, in part, realized returns to pension assets, it may be linked
mechanically to assumed returns. Specifically, firms with abnormally high returns, and thus
pension assets, may use these realized returns as a basis for increasing assumed returns. Given
that this feedback mechanism need not be a reflection of managerial opportunism, we employ
two alternative measures of pension sensitivity that are not susceptible to this bias. Specifically,
the second measure of pension sensitivity uses the ratio of the firm’s average pension assets, over
the 1991-2000 period, to operating income. Annual observations of this measure will not be
driven by differences in the return to pension assets across years. The third measure of pension
sensitivity is the log of the ratio of pension liabilities to firm operating income. Using pension
liabilities rather than assets completely removes the impact of pension asset returns on the
sensitivity measure, and also addresses potential feedback from the size of the pension fund to
the long-term rate of return assumption.
Table 5 describes these variables as well as the others used in the empirical analysis. At
the mean, pension assets are $653 million and operating assets are $7,302.5; because of the
skewness of the size distribution of firms these means are substantially higher than the median
pension assets ($65.5 million) and operating assets ($911.7 million). At the median, pension
assets are 71.6 percent of operating income and 8.6 percent of operating assets. The next rows in
Table 4 describe our three measures of pension sensitivity. For the first measure of pension
sensitivity, the log ratio of pension assets to operating income, the median is –0.334 and the
mean is –0.440. The distributions of the other two pension sensitivity measures are roughly
similar; the mean of the second measure is –0.446 and the mean of the third is –0.382.
The final rows of Table 5 describe our acquirer indicator, CEO option exercise, and firm
equity allocation variables. We classify 26.1 percent of our firm-year observations as
14
“acquirers.” These observations report the acquisition of another firm in that year. Among the
7,075 firm-year observations that we are able to link to Compustat Executive Compensation
data, CEO option exercises as a share of firm market value averages 29 basis points. About 32
percent of firm-year observations see CEO option exercise; among these observations, the
median option exercise value as a share of the firm’s value is 24 basis points. In addition to
scaling the value of CEO option exercise by the market value of the firm’s equity, we also
present results that scale CEO option exercise (and grants) by the CEO’s own option holdings.
The goal in this approach is to provide an additional control for cross-firm heterogeneity in the
importance of option compensation. The number of options exercised by the CEO in a year, as a
share of the total held, averages 10.5 percent among the CEOs in our sample. The number of
options granted, as a share of the number of options held, averages 26.5 percent in our sample.
4. The determinants of assumed returns
The empirical work in this section assesses the determinants of long-term rate of return
assumptions with particular emphasis on the links to the sensitivity measure and around mergers
and large option exercises by senior managers. Table 6 reports the results of linear regressions
of firm-year assumed long-term rates of return on covariates, including pension sensitivity
measures and year and industry controls. These regressions focus on assessing whether reported
long-term rates of returns are higher at those firms where reported earnings are more sensitive to
the rate of return assumption.
1 'i ,t i ,t i ,t i ,t( ) Assumed Rate of Return α β* Log Pension Sensitivity X Γ ε= + + +
We correct reported standard errors for clustering at the firm level. The first column of Table 6
reports the results of an OLS regression of assumed long-term rates of return on the first measure
of pension sensitivity, the log ratio of annual pension fund assets to annual firm operating
income. With no covariates, the coefficient on the pension sensitivity measure is 0.113. This
implies that a movement from the 25th percentile of log pension sensitivity (-1.21) to the 75th
percentile (0.40) would be associated with an 18 basis point increase in a firm’s reported long-
term rate of return. The second column of Table 6 includes a time trend and the interaction of
the time trend with pension sensitivity. The results in this column suggest that the impact of
sensitivity on the long-term rate of return assumption increases over the sample: the implied
15
impact of pension sensitivity is 0.072 in the first year of the sample and 0.171 by the end of the
sample.
Columns 3 through 6 of Table 6 explore the robustness of the relationship between
pension sensitivity and the long-term rate of return assumption to controls for year effects,
industry effects, year and industry effects, and year-by-industry effects. Column 6 has the most
generous control structure, allowing a separate dummy variable for each of 48 industry groups in
each year. The estimated coefficients on our first measure of pension sensitivity are not affected
by these additional controls. The point estimate of the coefficient ranges from 0.109 in the
specification with year fixed effects to 0.123 in the specification with 48 industry effects.
The final two columns of Table 6 explore the two other measures of pension sensitivity
and provides for industry-by-year effects as in column 6. Column 7 uses the average of pension
asset size over the period as a numerator in the measure of sensitivity, and provides a coefficient
roughly similar to those produced in the specifications presented in columns 1 through 6.
Finally, column 8 uses the log ratio of pension liability size to firm operating income. The
results are not statistically distinguishable from the results using our main sensitivity measure,
suggesting that the effect we observe is not merely the result of managers adjusting the long term
rate of return to correspond with recent past actual investment returns.
If managerial opportunism is important in determining assumed long term rates of return,
this relationship should be heightened when managers are most interested in inflating profits and
stock prices. Figure 4 presents a preliminary exploration of the relationship between takeover
activity and long-term rate of return assumptions, describing the pattern of return assumptions
around periods that firms undertake merger. Each point on the figure corresponds to a separate
regression (with 2-standard error bands on either side); these regressions fit firm-year long-term
rate of return assumptions on dummy variables for calendar year as well as an additional dummy
variable capturing takeover activity. Each date on the graph corresponds to a separate regression
with a different dummy variable; the date (-5), for instance, corresponds to a regression with a
dummy variable set equal to 1 if the firm is not doing a takeover in this year, but will do a
takeover in 5 years. The date (0) corresponds to a regression where the dummy variable is equal
to one for all firms that take over other firms in that year. This marks only a preliminary
16
exploration of the data, but the results are revealing. First, controlling only for year effects, firm
long-term rate of return assumptions are almost 30 basis points higher during merger years than
during other years. Firms that will eventually engage in merger activity appear different from
other firms; conditional only on takeover activity in 5 years and none in the current year, long-
term rate of return assumptions are almost 15 basis points higher than their unconditional
expectation in the complementary group of firms.
Table 7 pursues this line of investigation further, reporting results with different sets of
control variables. We use a dummy variable that is set equal to one when the firm makes an
acquisition of another publicly-traded firm in that year. This dummy variable captures potential
managerial motivations to inflate reported earnings in order to boost their companies’ share
prices prior to acquisition activity. In addition, we include the interaction of our acquirer dummy
with pension sensitivity. The motivation behind including these variables is to explore long-term
rate of return assumption during periods when firms have particularly strong incentives to inflate
their earnings, and the interaction identifies the effect at firms where the assumption could have a
larger impact on reported income prior to an acquisition.
Equation 2 gives the estimated empirical model for the analysis in Table 7:
2 i ,t i ,t i ,t
'i ,t i ,t i ,t i ,t
( ) Assumed Rate of Return α β* Log Pensions Sensitivity δ* Acquiror Dummy
λ* ( Log Pensions Sensitivity * Acquiror Dummy ) X Γ ε
= + +
+ + +
The results in Table 7 suggest that firms make more aggressive long-term rate of return
assumptions during periods when they are acquiring other firms. The magnitude of this effect is
quite strong. Firms that are one period before making an acquisition on average have assumed a
long-term rate of return that is around 30 basis points higher than other firms in all of the
specifications. In fixed effects specification, this effect is significantly smaller, but is still
statistically significant, with a point estimate of 3.5 basis points on the acquirer dummy and a
point estimate of 3.7 basis points on the interaction term.
These results support the hypothesis that the tendency to raise the return assumption is
stronger for firms where changes in the LTROR assumption have a higher impact on operating
income. At firms where the pension sensitivity is higher, the marginal impact of the acquisition
17
dummy is also greater. The coefficient on the interaction term is between 0.037 and 0.083 and
statistically significant in each of the specifications. Taking an estimated coefficient of 0.06
would imply that the marginal impact of the acquisition dummy on the rate of return assumption
is 10 basis points higher at the 75th percentile of log pension sensitivity (0.40) than at the 25th
percentile (-1.21).
For the specifications that include firm-level fixed effects, the point estimates on the
takeover dummy and the interaction term imply, if anything, that at the 25th percentile of the
pension sensitivity measure the long-term rate of return assumption is slightly (1 bp) lower than
usual during the acquisition period. However, these specifications also suggest that at firms
whose reported earnings are very sensitive to the assumption about the long-term rate of return
on pension assets, this assumption is substantially higher around the periods of acquisition
activity. At the 75th percentile of the distribution of pension sensitivity, the point estimates
suggest that the return assumption in the acquisition year is five basis points higher than firm
average. At the 90th percentile, the coefficients suggest that the return assumption is 7.5 basis
points higher.
Given the emphasis on changes in assumed rates of returns, it useful to directly analyze
these decisions with discrete dependent variables. Table 8 reports results of ordered probit
regressions, where the dependent variables are categorical variables that reflect changes in
assumed long-term rates of return. In the first two columns, the specification of the dependent
variable is coarse: (-1) if the firm decreases the long-term rate of return assumption in that year,
(0) if it is unchanged, and (1) if the firm increases its rate of return assumption. This ordered
probit model is based on a latent regression model of the following form:
3 i ,t i ,t i ,t
'i ,t i ,t i ,t i ,t
( ) ∆Assumed Rate of Return α β* Log Pensions Sensitivity δ* Acquiror Dummy
λ* ( Log Pensions Sensitivity * Acquiror Dummy ) X Γ ε
= + +
+ + +
The latent propensity to change the long-term rate of return assumption is unobserved, but we do
observe the actual changes:
18
1
1
1
3 1 0
0 0
1
*i ,t i ,t i ,t
*i ,t
*i ,t
( ') SIGN( Assumed ROR Assumed ROR ) if ∆Assumed ROR
if ∆Assumed ROR µ
if µ ∆Assumed ROR
−− = − ≤
< ≤
<
The results in column 1 suggest that firms are more likely to increase their long-term rate
of return assumption in periods where the pension sensitivity measure is highest; the results in
column 2 suggest that firms are likely to increase their long-term rate of return assumptions
when they are making acquisitions. In particular, the acquirer coefficients can be translated into
marginal effects for the probability of each action (increase, decrease, and no change). Firms are
1.2% less likely to reduce their long-term rate of return the year before an acquisition; 0.3%
more likely to keep it the same; and 0.9% more likely to raise the rate. Columns 3 and 4 of
Table 8 use a more nuanced, but still discrete, dependent variable: the variable takes on one of 11
different categories, ranging from large decreases in the assumed long term rate of return to large
increases. The results are consistent with those in the first two columns. The standard errors for
these results are clustered at the firm-level.
The results in columns 5 and 6 of Table 8 use our second of pension sensitivity as the
independent variable: the measure used, for each firm-year observation, is the log ratio of the
average pension fund size for that firm over the 11 years of the sample to the firm’s operating
income in that year. In these regressions, both the pension sensitivity measure and the takeover
variable remain statistically significant. Similarly, the final two columns use the third definition
of sensitivity, namely the log ratio of pension liabilities to the firm’s operating income in a given
year. The sensitivity variable does not predict changes in the long-term rate of return in this
specification, but firms about to make acquisitions are more likely to raise their rate of return
assumptions. The magnitude of the acquirer effect and the marginal effects are roughly constant
across the specifications using different measures of the sensitivity.17
17 We further considered the possibility that particular types of mergers – stock financed mergers – would be more closely associated with increases in assumed returns. This investigation is clouded by empirical and conceptual difficulties. First, our source on merger data has coarse groupings on the type of financing and manual inspection of the data for one company, IBM, relative to their 10-K’s suggests only a crude mapping between the two sources. Second, as Fama and French (2003) point out, equity issuance through mergers is isomorphic with other forms of equity issuance and may be associated with additional monitoring costs further clouding the predicted relationship
19
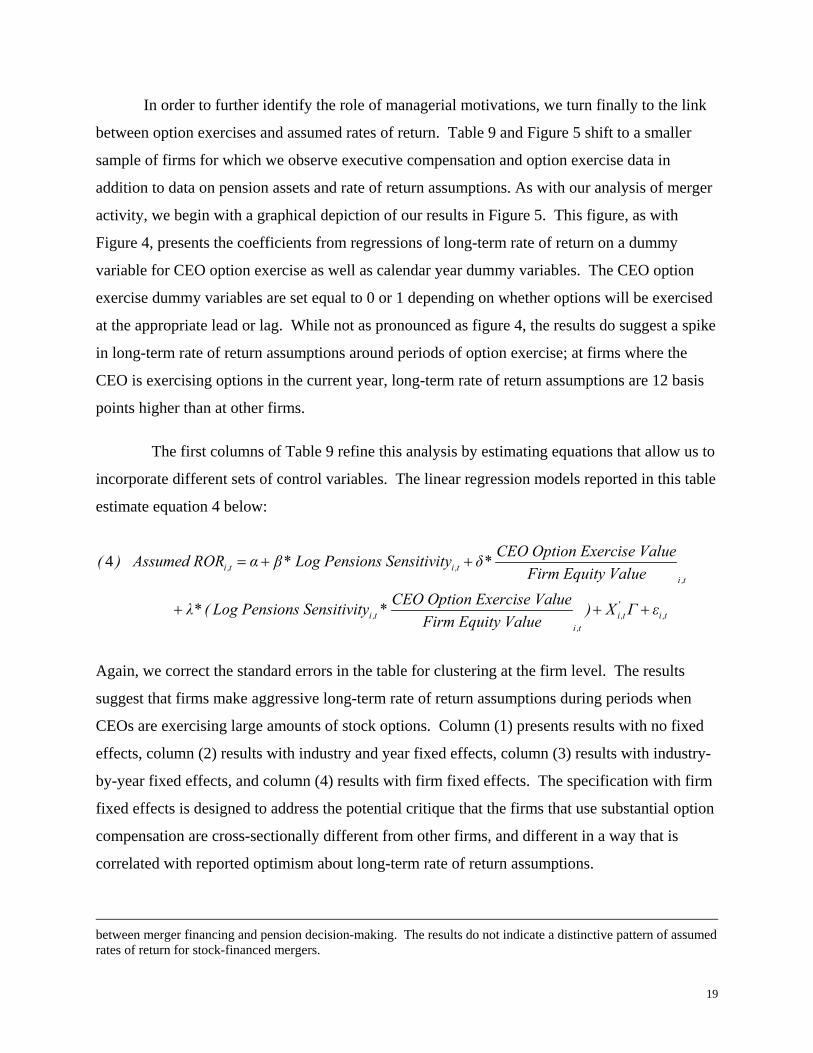
In order to further identify the role of managerial motivations, we turn finally to the link
between option exercises and assumed rates of return. Table 9 and Figure 5 shift to a smaller
sample of firms for which we observe executive compensation and option exercise data in
addition to data on pension assets and rate of return assumptions. As with our analysis of merger
activity, we begin with a graphical depiction of our results in Figure 5. This figure, as with
Figure 4, presents the coefficients from regressions of long-term rate of return on a dummy
variable for CEO option exercise as well as calendar year dummy variables. The CEO option
exercise dummy variables are set equal to 0 or 1 depending on whether options will be exercised
at the appropriate lead or lag. While not as pronounced as figure 4, the results do suggest a spike
in long-term rate of return assumptions around periods of option exercise; at firms where the
CEO is exercising options in the current year, long-term rate of return assumptions are 12 basis
points higher than at other firms.
The first columns of Table 9 refine this analysis by estimating equations that allow us to
incorporate different sets of control variables. The linear regression models reported in this table
estimate equation 4 below:
4 i ,t i ,ti ,t
'i ,t i ,t i ,t
i ,t
CEO Option Exercise Value( ) Assumed ROR α β* Log Pensions Sensitivity δ*Firm Equity Value
CEO Option Exercise Valueλ* ( Log Pensions Sensitivity * ) X Γ εFirm Equity Value
= + +
+ + +
Again, we correct the standard errors in the table for clustering at the firm level. The results
suggest that firms make aggressive long-term rate of return assumptions during periods when
CEOs are exercising large amounts of stock options. Column (1) presents results with no fixed
effects, column (2) results with industry and year fixed effects, column (3) results with industry-
by-year fixed effects, and column (4) results with firm fixed effects. The specification with firm
fixed effects is designed to address the potential critique that the firms that use substantial option
compensation are cross-sectionally different from other firms, and different in a way that is
correlated with reported optimism about long-term rate of return assumptions.
between merger financing and pension decision-making. The results do not indicate a distinctive pattern of assumed rates of return for stock-financed mergers.
20
The coefficient estimates range form 0.014 in the specification with firm fixed effects to
0.028 in the specification with industry by year effects. A coefficient estimate of 0.020 would
imply that a one-standard deviation increase in exercise (1.780) would be associated with a 3.5
basis point increase in the assumed rate of return on pension assets. Again the marginal effect is
larger at firms where pension sensitivity is larger; in the first specification, the coefficient of
0.011 on the interaction term implies that at the 25th percentile of pension sensitivity the
marginal effect of CEO option exercise is 0.009. At the 75th percentile of pension sensitivity
estimated marginal effect of CEO option exercise is 0.033.
The remaining two columns explore a different way to control for potentially spurious
correlation between firms’ propensity to compensate executives through options and firms’
optimism about long-term rates of return. These columns use measures of CEO option exercise
and grants that are normalized by the number of options held by the CEO. Like the fixed-effects
specification reported in column (4), the goal here is to control for cross-sectional differences in
firms’ tastes for option compensation. Column (5) uses these independent variables in a
specification with no other controls. In this specification the coefficient on normalized option
exercise is positive and significant, and the coefficient on option grants is negative and
significant. This suggests that long-term rate of return assumptions are unusually high at firm-
year observations where the CEO is exercising a large share of his options, and are unusually
low in periods of large option grants. Finally, column (6) adds firm fixed effects. The result on
normalized CEO option exercise is a bit weaker in this specification; though the coefficient
remains significant at the 10 percent level.
Taken together, the results in Tables 6 through 9 and Figures 4 and 5 suggest that
managerial opportunism — as measured by the importance of pension earnings to operating
earnings, the timing of merger activity and the timing of option exercises — is a critical
determinant of the choice of assumed rates of return. That managers capitalize on inflated
earnings through increased merger activity and greater exercises further illustrates that other
managerial decisions are impacted by the potential manipulation of pension earnings.
5. The determinants of asset allocation decisions
21
The managerial incentives we have identified may have effects not just on financial
reporting and investment decisions by firms and managers but also on asset allocation decisions
within pension plans. This section investigates the possibility that managers shift pension assets
towards equity in order to justify a higher long-term rate of return assumptions in periods around
mergers. To investigate this possibility, we use the merged DB pension equity allocation data
described in section 3. Our empirical approach is to fit two stage least squares regressions of
equity allocation share on the long-term rate of return, with the long-term rate of return
instrumented with the explanatory variables explored in the previous section: acquisition dummy
variables and measures of CEO option exercise.
The first two columns of Table 10 show the results of an OLS regression of equity shares
on the assumed long-term rate of return. In the first column, for each percentage point higher the
long-term rate of return assumption is, the percentage of the pension fund allocated to equity is 6
percentage points higher. The second column adds a full set of industry-by-year controls and
this effect becomes 4.5 percentage points. There are a number of potential reasons we might
observe a correlation between these two variables. One is that mangers increase the allocation of
risky assets in their pension funds to justify increases long-term rates of return, but there are
several alternatives. It might be the case that the long-term rate of return assumption responds to
shorter term increases in the actual rate of return on pension assets, a variety of excessive
extrapolation (see Benartzi and Thaler (2001)). Alternatively, pension plans with higher equity
allocations might have higher assumed rates given greater exposure to assets that earn risk
premia.
In the third and fourth columns we attempt to address these endogeneity concerns by
estimating the relationship between the equity allocation and the long-term rate of return using
instrumental variables. We estimate the system of equations below:
titititi
tititi
tititititi
XDummyAcquirorySensitivitPensionLog
DummyAcquirorySensitivitPensionLogRORAssumed
XRORAssumedaySensitivitPensionLogaaallocationEquity
,,,,3
,2,10,
,,,2,10,
')*(*
**)''5(
'**)'5(
νβ
βββ
ε
+Λ++
++=
+Γ+++=
by two-stage least squares. The first stage equation (5'') is analogous to specifications in the first
through third columns of Table 7, although we are now focusing on the smaller asset allocation
22
sample. The terms represented by the matrix X are included in the fourth column specification
only and represent industry-by-year controls.18
The identifying assumption behind this specification is that the merger decision affects
equity shares in the pension fund only through its effect on the assumed long-term rate of return.
Instrumenting in this manner provides a much larger effect of the long-term rate of return on the
equity share. The specification in column 3 suggests that one percentage point difference in the
assumed long-term rate of return (such as from 8.00% at the 25th percentile to 9.00% at the 75th
percentile) is associated with an increase of 28 percentage points in the equity allocation. The
inclusion of industry-year effects only modestly reduces this effect to a 20 percentage point
increase in response to a one percentage point increase in assumed returns. While these
magnitudes seem large, it useful to remember that most one-time changes in assumed rates are
considerably more modest than a one percentage point change. As such, it is useful to scale
these effects for modest assumed rate of return changes and view them as associating 25 basis
point changes in assumed rates with five percentage point changes in equity allocation.
Columns (5) and (6) use a different set of instrumental variables based on CEO option
exercise. These variables include a dummy variable, set equal to one if the CEO option exercise
data is unavailable for that observation. Including this dummy allows us to use the entire 3202
observations for which we observe equity allocations; if we just exclude observations with no
Executive Compensation data we are left with a tiny number of observations. For observations
that can be linked to the Compustat Executive Compensation dataset, the instruments also
include the value of CEO option exercise as a share of the market value of the firm and the
interaction between this value and log pension sensitivity.
18 Due to the fact that our equity allocation data is compiled from two separate sources which each have different samples over different time periods, we do not move to the full firm-fixed effects specification.
23
titi
ti
ti
ti
ti
ti
titi
tititititi
XeUnavailablDataExecuComp
ValueEquityFirm
ExerciseOptionCEOySensitivitPensionLog
ValueEquityFirm
ExerciseOptionCEO
ySensitivitPensionLogRORAssumed
XRORAssumedaySensitivitPensionLogaaallocationEquity
,,4
,
,
,3
,
,
2
,10,
,,,2,10,
')(*
)*(*
*
*)''6(
'**)'6(
νβ
β
β
ββ
ε
+Λ++
⎟⎟⎟
⎠
⎞
⎜⎜⎜
⎝
⎛+
⎟⎟⎟
⎠
⎞
⎜⎜⎜
⎝
⎛+
+=
+Γ+++=
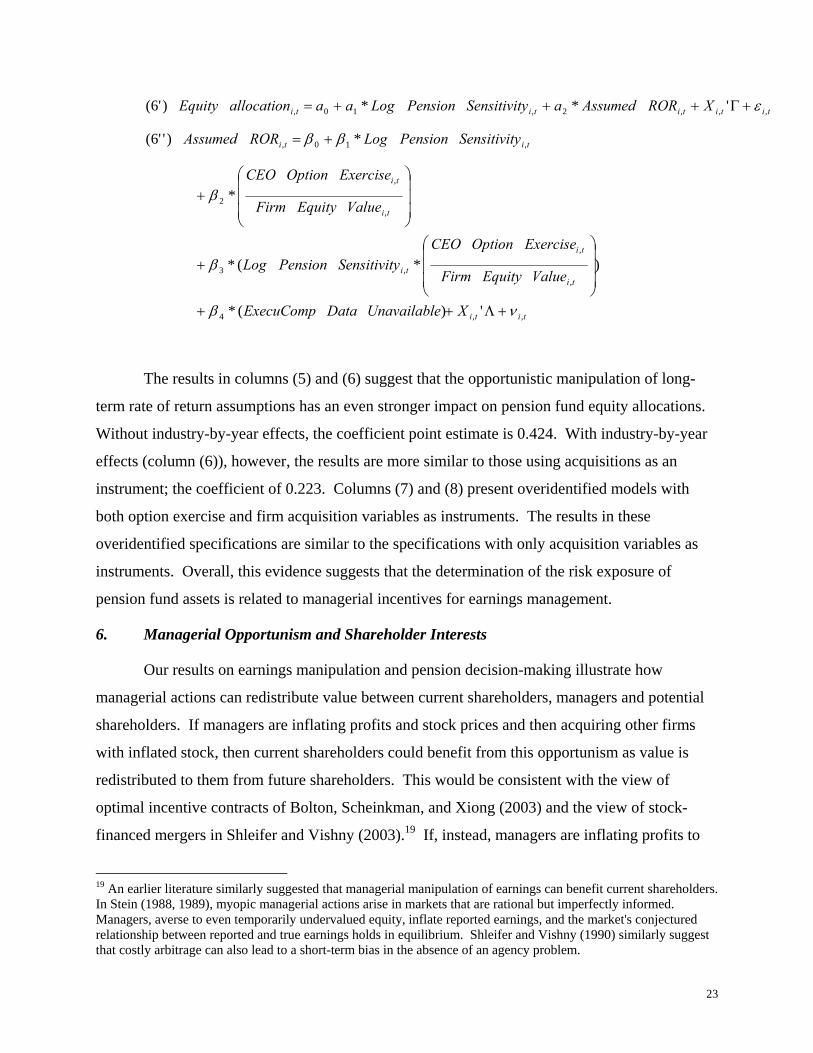
The results in columns (5) and (6) suggest that the opportunistic manipulation of long-
term rate of return assumptions has an even stronger impact on pension fund equity allocations.
Without industry-by-year effects, the coefficient point estimate is 0.424. With industry-by-year
effects (column (6)), however, the results are more similar to those using acquisitions as an
instrument; the coefficient of 0.223. Columns (7) and (8) present overidentified models with
both option exercise and firm acquisition variables as instruments. The results in these
overidentified specifications are similar to the specifications with only acquisition variables as
instruments. Overall, this evidence suggests that the determination of the risk exposure of
pension fund assets is related to managerial incentives for earnings management.
6. Managerial Opportunism and Shareholder Interests
Our results on earnings manipulation and pension decision-making illustrate how
managerial actions can redistribute value between current shareholders, managers and potential
shareholders. If managers are inflating profits and stock prices and then acquiring other firms
with inflated stock, then current shareholders could benefit from this opportunism as value is
redistributed to them from future shareholders. This would be consistent with the view of
optimal incentive contracts of Bolton, Scheinkman, and Xiong (2003) and the view of stock-
financed mergers in Shleifer and Vishny (2003).19 If, instead, managers are inflating profits to
19 An earlier literature similarly suggested that managerial manipulation of earnings can benefit current shareholders. In Stein (1988, 1989), myopic managerial actions arise in markets that are rational but imperfectly informed. Managers, averse to even temporarily undervalued equity, inflate reported earnings, and the market's conjectured relationship between reported and true earnings holds in equilibrium. Shleifer and Vishny (1990) similarly suggest that costly arbitrage can also lead to a short-term bias in the absence of an agency problem.
24
enable empire-building and self-enrichment through option exercises, then value is likely being
transferred from current shareholders toward managers. This view would be consistent with the
managerial power view of Bebchuk, Fried and Walker (2002) and others.20
We frame our discussion of managerial opportunism and pension decision-making within
this debate by investigating the relationship between assumed rates of return and the corporate
governance environment of the firm. Specifically, we expect that if current shareholders are the
beneficiaries of managerial opportunism in setting pension return assumptions, then high
assumptions will be more prevalent in firms where managers are more constrained to behave in
the interest of shareholders. Alternatively, if firms where managers are least constrained by
shareholder interests indulge in aggressive assumed rates of return, this would be more
supportive of the rent-extraction view.
Figure 6 provides evidence that long-term rate of return assumptions on pension assets
are substantially higher at firms where current shareholders have weaker control over managers.
Firm-year observations are sorted on the basis of the nearest preceding measure of the Gompers,
Ishii, and Metrick (2003) corporate governance index. This index aggregates 24 different
dummy variables representing mechanisms that firms can employ to insulate managers from
shareholders. These include devices like staggered board elections, which impose delays on any
contestant seeking to take over board seats. We aggregate observations into categories ranging
from 1, those where shareholders have the most control over mangers, to 6, those where
managers are the most insulated from shareholders. There is a substantial increase in long-term
rates of return as managers become more insulated from current shareholders. At the most
democratic firms, assumed long-term rates of return are below 8.5 percent, while at the most
dictatorial, they are above 9 percent. While the analysis of Figure 6 is only suggestive, it does
indicate that managerial opportunism in pension decision-making does not appear to be guided
by shareholder interests.
Finally, it is useful to consider the potential magnitude of these redistributive effects for a
specific example. We return to IBM to consider the effects of the inflated stock prices arising
from inflated pension earnings. Specifically, we attempt to outline the scale of managerial
20 For example, Yermack (1997) and Bertrand and Mullainathan (2001) note that various aspects of compensation arrangements do not correspond purely to incentive purposes, suggesting that managers use incentive compensation to extract these rents.

25
enrichment during that period due to opportunistic pension decision-making. While this exercise
is necessarily speculative, it is useful for scaling the potential redistribution in this instance. The
first panel of Table 11 provides information on IBM market values and acquisition activity from
1997 to 2001, the period emphasized in Table 1. This period saw an increase in market value of
almost $100 billion as well as robust acquisition activity. IBM made 41 acquisitions during this
period valued at over $4 billion. The second panel combines the estimates from Table 1
regarding the effect of the deviations from an assumed rate of return of 9.25% on income with
the Coronado and Sharpe (2003) estimates suggesting that pension earnings are capitalized in the
same manner as operating earnings. This assumption gives an estimated stock price in the
absence of those deviations from the 9.25% long-term rate of return assumption. Finally,
Gerstner’s option exercise activity is employed to arrive at an estimate of the dollar value
garnered by Gerstner that arose from the deviations from the 9.25% rate. This estimate totals
more than $12 million for the period.
How reliable is this $12 million estimate? Obviously, it relies on numerous assumptions
– several of which may be construed to be conservative or aggressive. The most aggressive
assumption is the one borrowed from Coronado and Sharpe (2003) – that markets completely fail
to distinguish between pension and operating earnings and capitalize them similarly. Having
said that, the estimate may be quite conservative – particularly if one believes that the reduced
growth rates (which would have been negative in some years) that would have been apparent
without the changed assumptions would have changed the capitalization rate of all earnings. If
this was the case even to a limited degree, the scope of managerial enrichment resulting from the
changed assumptions would be substantially larger. Specifically, the final column considers an
alternative scenario where the capitalization rate of all earnings is altered by the changed growth
rates noted in introduction.21 Under these assumptions, this estimate rises to nearly $76
million.22
21 The calculations on the changed capitalization rates require a discount rate and two alternative growth rates. For these purposes, we use a 12% discount rate and the difference in multiples, using a growing perpetuity formula, arising from a growth rate changing from 6.7% to 5.6%. Such a calculation is necessarily conjectural but does provide a useful alternative to the baseline assumption of no changed capitalization effect. 22 It is useful to frame these figures in the context of Gerstner’s overall compensation during the period from 1997 to 2001. Execucomp data indicates that Gerstner received $45 million in cash compensation and $366 in total compensation, including option exercises, during that period.
26
If between $12 million and $76 million from these changed assumptions were directed
toward Gerstner, where did it come from? This discussion of who benefited from this earnings
manipulation is necessarily even more conjectural. Given the overall scope of market value
gains experienced by IBM shareholders during this period, this amount may be trivial and may
have resulted from an optimal compensation arrangement. Indeed, if merger activity financed by
stock or employee ownership was enabled by these assumptions, preexisting shareholders may
be the beneficiaries of value transfers from these new shareholders.23 Our reading of their 10-Ks
suggest that approximately 25% of the $4 billion of target value was financed through share
issuance. Given that over $10 billion of market capitalization by the end of 2001 is calculated to
reflect capitalized pension earnings arising from these increases, it does not appear that a
substantial fraction was value transfers accomplished through mergers. Finally, it is possible that
these rate of return changes and resulting incremental compensation was facilitated to enable
exercises of options and transfers of value away from current shareholders and toward
management. Obviously, it is impossible to distinguish with certainty between these
alternatives. Having said that, subsequent to Gerstner’s departure, the assumed rate of return
was revised downward to 9.5% in 2002 and IBM’s market value fell by $70 billion during 2002
to return to 1998 levels. These coincident changes, while tantalizing, were undoubtedly related
to many other factors in the capital markets and IBM’s competitive environment.
7. Conclusion
In a setting of considerable managerial discretion where manipulated earnings are
capitalized into stock prices, managers appear to actively exploit this opportunity and alter
investment decisions to justify and capitalize on those manipulated earnings. The latitude
managers enjoy in pension accounting and the inability of the market to fully distinguish
between inflated pension earnings and operating earnings combine to provide managers with a
powerful incentive to opportunistically characterize pension assets. Managers facing large
incentives to manipulate earnings through pension decisions — either because of the sensitivity
of firm earnings to changed assumptions, impending merger activity, or large incentive
compensation contracts — appear to alter their assumed returns significantly in response to these
incentives. The evidence on merger activity and option exercises confirms the role of earnings
23 IBM 10-Ks are somewhat unclear on the financing of each transaction making it somewhat problematic to
27
manipulation but also makes clear that reporting distortions induced by managerial motivations
can alter manager and firm investment decisions. Furthermore, rationalizing these higher
assumed returns is easier in the context of higher equity allocations and our IV analysis indicates
that higher assumed returns are, in fact, associated with higher equity allocations.
Previous studies of managerial opportunism and earnings manipulation have emphasized
large indiscretions in small samples, as in Erikson et. al. (2003) on earnings fraud, or on more
aggregated measures of misreporting through accrual accounting, as in Bergstresser and
Philippon (2003). In this paper, we emphasize a simple, transparent but influential reporting
decision that in a large sample appears to be used opportunistically. In addition, we show that
this opportunism has further effects in enabling merger activity and option exercises and in
determining asset allocation within those plans.
To the degree that pension earnings are capitalized into market prices, the opportunistic
use of assumed rates of return may lead to aggregate levels of overvaluation, as suggested by
Coronado and Sharpe (2003). Our results on asset allocation add another mechanism by which
pension accounting could have contributed to market overvaluation as increased assumed rates
also appear to be associated with higher equity allocations. While market participants were
capitalizing pension earnings, firms were increasing equity exposures to justify those very
pension earnings.
determine the precise degree to which IBM issued shares to finance their acquisitions.
28
References
Amir, E. and S. Benartzi, 1998. “The expected rate of return on pension funds and asset allocation as predictors of portfolio performance,” Accounting Review, Vol. 73, No. 3., pp. 335-352.
Bebchuck, L. A., J. M. Fried, D. I. Walker, 2002. “Managerial Power and Rent Extraction in the Design of Executive Compensation,” University of Chicago Law Review 69:3, pp. 751-846..
Benartzi, S. and R. Thaler, 2001. “Excessive extrapolation and the allocation of 401(k) accounts to company stock,” Journal of Finance, Vol. 56, No. 5.
Bergstresser, D. and T. Philippon, 2003. “CEO incentives and earnings management: evidence from the 1990s,” mimeo, Harvard Business School.
Bertrand, M. and S. Mullainathan. 2001. “Are CEO’s Rewarded for Luck? The Ones Without Principals Are.” Quarterly Journal of Economics, pp. 901-932.
Bodie, Z., J. Light, R. Mørck and R.Taggart, 1985. “Corporate pension policy: An empirical investigation,” Financial Analysts Journal, Vol. 41, No. 5, pp. 10-16.
Bolton, P., J. Scheinkman, and W. Xiong, 2003. “Executive Compensation and Short-termist Behavior in Speculative Markets,” Princeton University Working Paper.
Chan, Konan, Louis K.C. Chan, Narasimhan Jegadeesh, and Josef Lakonishok, 2001. “Earnings quality and stock returns,” NBER working paper #8308.
Coronado, J. and S. Sharpe, 2003. “Did pension plan accounting contribute to a stock market bubble,” mimeo, Board of Governors of Federal Reserve System.
Desai, M., and D. Dharmapala, 2003. “High Powered Incentives and Tax Avoidance Activity,” Working Paper, Harvard University.
Erickson, M., M. Hanlon, and E. Maydew, 2003. “How much are nonexistent earnings worth?,” mimeo, University of North Carolina.
Fama, E. F., and K. R. French, 2003. “Financing Decisions: Who Issues Stock?,” University of Chicago Working Paper.
Feldstein, M. and R. Mørck, 1983. “Pension funding decisions, interest rate assumptions and share prices,” Financial Aspects of the U.S. Pension System, edited by Z. Bodie and J. Shoven. Chicago: UCP, (1984), pp. 177-210.
Feldstein, M. and S. Seligman, 1981. “Pension Funding, Share Prices, and National Savings.” Journal of Finance 36(4): 801-24.
29
Frank, M., 2002. “The impact of taxes on corporate defined benefit pension plan asset allocation,” Journal of Accounting Research 40:4, 1163-1190.
Franzoni, F. and J. M. Marin, 2003. “Pension Plan Funding and Stock Market Efficiency,” Working Paper, HEC School of Management.
Friedman, B., 1983. “Pension funding, pension asset allocation, and corporate finance: Evidence from individual company data,” Financial Aspects of the U.S. Pension System, edited by Z. Bodie and J. Shoven. Chicago: UCP, (1984), pp. 107-147.
Gold, J. 2003, “Accounting/Actuarial Biases Enables Equity Investment by Defined Benefit Pension Plans,” Working Paper, University of Pennsylvania.
Gompers, P., Ishii, J., and A. Metrick, 2003. “Corporate governance and equity prices,” The Quarterly Journal of Economics 118(1), February, pp. 107-155.
Hall, Brian J., and Kevin J. Murphy, 2003. “The trouble with executive stock options,” The Journal of Economic Perspectives.
Hawkins, D., 2001. “Retiree Benefits,” Harvard Business School case 9-197-021.
Healy, Paul H. and James M. Wahlen, 1999. “A review of the earnings management literature and its implications for standard setting,” Accounting Horizons, 13(4), pp. 365-383.
Langbein, John H. and Bruce A. Wolk, 2000. Pension and Employee Benefit Law, 3rd ed. New York, NY: Foundation Press.
Maclean, B., 2002. “That old financial magic,” Fortune, February 18, 2002.
Obinata, T., 2000, “Choice of pension discount rate in financial accounting and stock prices,” mimeo, University of Tokyo.
Papke, L., 1992, Trends in Pensions. eds., John Turner and Daniel Beller, Department of Labor Pension and Welfare Benefits Administration.
Rauh, J., 2003. “Investment and financing constraints: evidence from the funding of corporate pension plans,” mimeo, Massachusetts Institute of Technology.
Shleifer, A. and R. W. Vishny, 2003. “Stock market driven acquisitions,” Journal of Financial Economics, forthcoming.
Shleifer, A. and R. W. Vishny. 1990. “Equilibrium short horizons of investors and firms,” American Economic Review, 80:2, 148-153.
Sloan, Richard G., 1996. “Do stock prices fully reflect information in accruals and cash flows about future earnings?” Accounting Review, 71(3), pp. 289-315.
Stein, J. 1988. “Takeover threats and managerial myopia,” Journal of Political Economy, 96, 61-80.

30
Stein, J. 1989. “Efficient firm and inefficient markets,” Quarterly Journal of Economics, 104:4, 655-669.
Teoh, S.H., I Welch, and T.J. Wong, 1998a. “Earnings management and the post-issue performance of seasoned equity offerings,” Journal of Financial Economics 50 (October), pp. 63-99.
Teoh, S.H., I. Welch, and T.J. Wong, 1998b. “Earnings management and the long-term market performance of initial public offerings,” Journal of Finance 53 (December), pp. 1935-1974.
Welch, I. 2001. “The equity premium consensus forecast revisited,” Cowles Foundation discussion paper 1325. Journal of Business, forthcoming.
Xie, H., 2001. “The mispricing of abnormal accruals,” Accounting Review, 76(3), pp. 357-373.
Yermack, D. 1997. “Good Timing: CEO Stock Option Awards and Company News Announcements.” Journal of Finance 52, pp. 449-476.
Zion, D. and B. Carcache, 2002. The Magic of Pension Accounting. Credit Suisse First Boston.
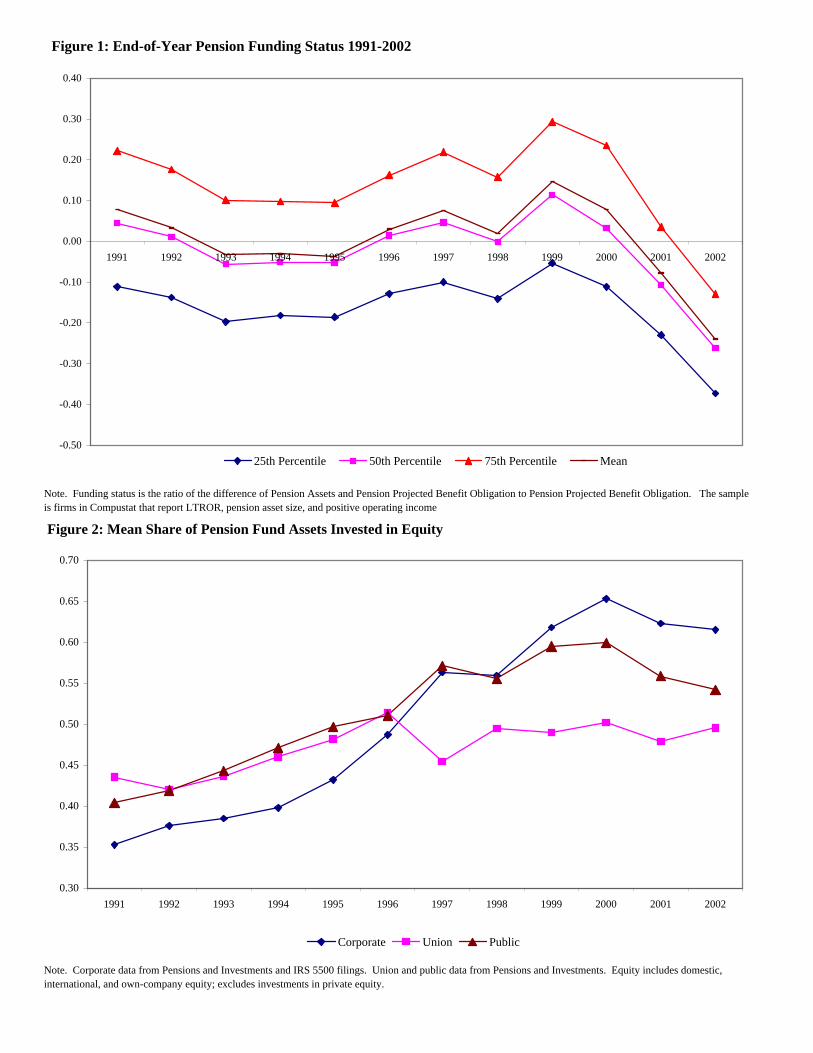
Note. Funding status is the ratio of the difference of Pension Assets and Pension Projected Benefit Obligation to Pension Projected Benefit Obligation. The sample is firms in Compustat that report LTROR, pension asset size, and positive operating income
Note. Corporate data from Pensions and Investments and IRS 5500 filings. Union and public data from Pensions and Investments. Equity includes domestic, international, and own-company equity; excludes investments in private equity.
Figure 1: End-of-Year Pension Funding Status 1991-2002
-0.50
-0.40
-0.30
-0.20
-0.10
0.00
0.10
0.20
0.30
0.40
1991 1992 1993 1994 1995 1996 1997 1998 1999 2000 2001 2002
25th Percentile 50th Percentile 75th Percentile Mean
Figure 2: Mean Share of Pension Fund Assets Invested in Equity
0.30
0.35
0.40
0.45
0.50
0.55
0.60
0.65
0.70
1991 1992 1993 1994 1995 1996 1997 1998 1999 2000 2001 2002
Corporate Union Public
Note. Median long-term rate of return assumption from Compustat. Yield on 10-year bond from Federal Reserve. Implied return on equity is the expected return on a portfolio of 40% equity and 60% bonds.
Note. Figure shows long-term rate of return assumptions reported by firms in periods around mergers. This averages are regression-adjusted for calendar-year effects. The estimate for period 0 is the average assumption for firms reporting acquisitions of another firm in that year. The estimate for period 1 is the average assumption for firms reporting acquisition of another firm in previous year, but not current year. The estimate for period -1 is the average LTROR assumption for firms reporting acquisitions of another firm in next year, but not current year. Long-term rate of return assumption data from Compustat.
Figure 3: The Distribution of Long Term Rate of Return Assumptions
0.04
0.06
0.08
0.1
0.12
0.14
0.16
1991 1992 1993 1994 1995 1996 1997 1998 1999 2000 2001 200250th Percentile Assumed eq ret, R=.9, 40/60 Yield on 10 year bond
0
0.05
0.1
0.15
0.2
0.25
0.3
0.35
0.4
-6 -5 -4 -3 -2 -1 0 1 2 3 4 5 6
LTROR, merging firms - 2 standard errors + 2 standard errors
Figure 4: Long-Term Rate of Return Assumption Around Mergers, All Firms
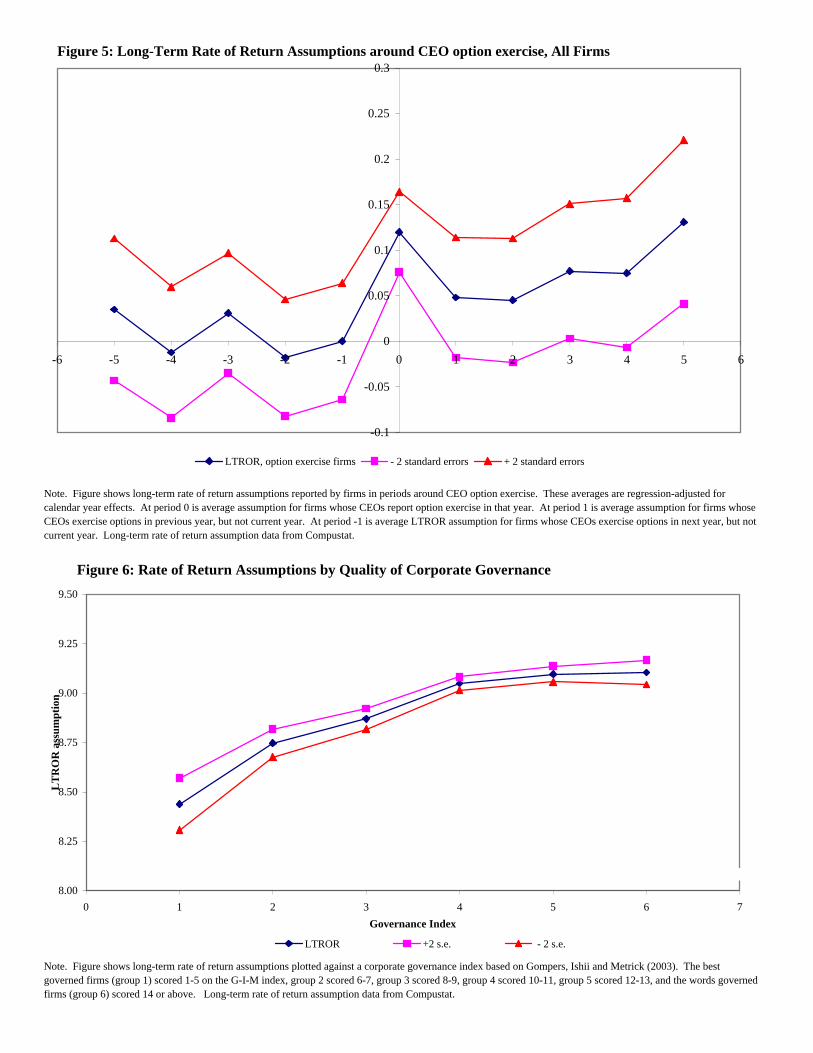
Note. Figure shows long-term rate of return assumptions reported by firms in periods around CEO option exercise. These averages are regression-adjusted for calendar year effects. At period 0 is average assumption for firms whose CEOs report option exercise in that year. At period 1 is average assumption for firms whose CEOs exercise options in previous year, but not current year. At period -1 is average LTROR assumption for firms whose CEOs exercise options in next year, but not current year. Long-term rate of return assumption data from Compustat.
Note. Figure shows long-term rate of return assumptions plotted against a corporate governance index based on Gompers, Ishii and Metrick (2003). The best governed firms (group 1) scored 1-5 on the G-I-M index, group 2 scored 6-7, group 3 scored 8-9, group 4 scored 10-11, group 5 scored 12-13, and the words governed firms (group 6) scored 14 or above. Long-term rate of return assumption data from Compustat.
-0.1
-0.05
0
0.05
0.1
0.15
0.2
0.25
0.3
-6 -5 -4 -3 -2 -1 0 1 2 3 4 5 6
LTROR, option exercise firms - 2 standard errors + 2 standard errors
Figure 5: Long-Term Rate of Return Assumptions around CEO option exercise, All Firms
Figure 6: Rate of Return Assumptions by Quality of Corporate Governance
8.00
8.25
8.50
8.75
9.00
9.25
9.50
0 1 2 3 4 5 6 7Governance Index
LT
RO
R a
ssum
ptio
n
LTROR +2 s.e. - 2 s.e.
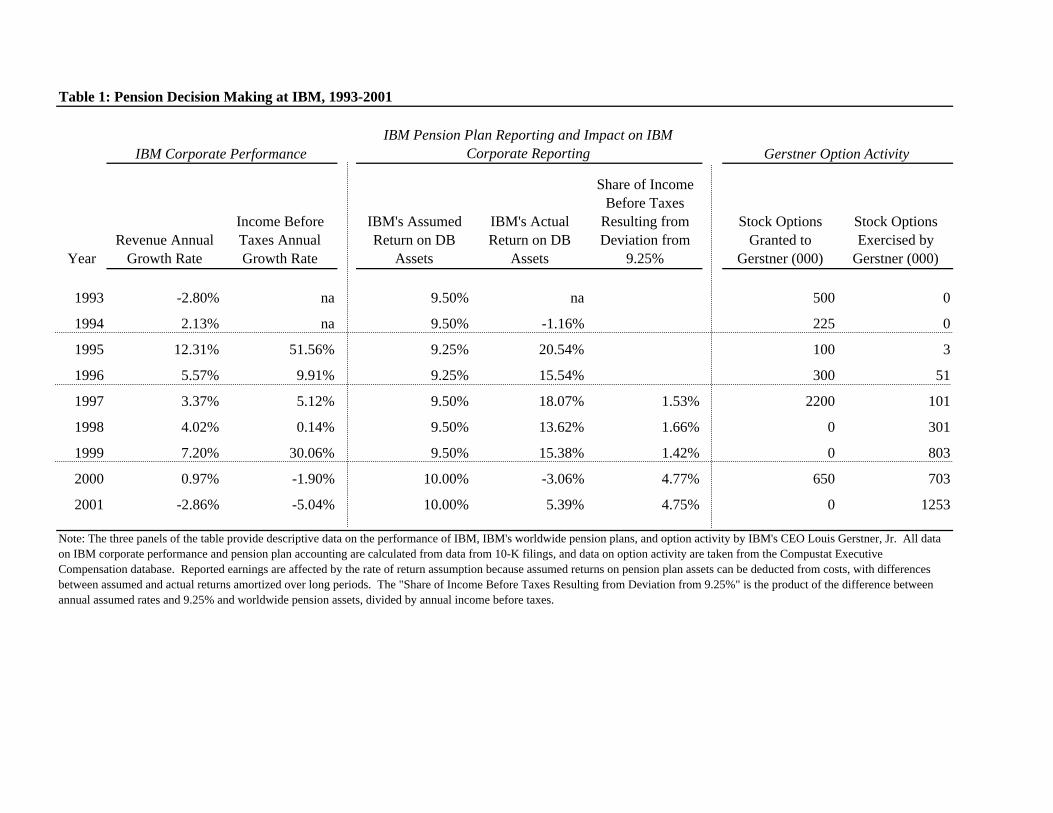
YearRevenue Annual
Growth Rate
Income Before Taxes Annual Growth Rate
IBM's Assumed Return on DB
Assets
IBM's Actual Return on DB
Assets
Share of Income Before Taxes
Resulting from Deviation from
9.25%
Stock Options Granted to
Gerstner (000)
Stock Options Exercised by
Gerstner (000)
1993 -2.80% na 9.50% na 500 0
1994 2.13% na 9.50% -1.16% 225 0
1995 12.31% 51.56% 9.25% 20.54% 100 3
1996 5.57% 9.91% 9.25% 15.54% 300 51
1997 3.37% 5.12% 9.50% 18.07% 1.53% 2200 101
1998 4.02% 0.14% 9.50% 13.62% 1.66% 0 301
1999 7.20% 30.06% 9.50% 15.38% 1.42% 0 803
2000 0.97% -1.90% 10.00% -3.06% 4.77% 650 703
2001 -2.86% -5.04% 10.00% 5.39% 4.75% 0 1253
Note: The three panels of the table provide descriptive data on the performance of IBM, IBM's worldwide pension plans, and option activity by IBM's CEO Louis Gerstner, Jr. All data on IBM corporate performance and pension plan accounting are calculated from data from 10-K filings, and data on option activity are taken from the Compustat Executive Compensation database. Reported earnings are affected by the rate of return assumption because assumed returns on pension plan assets can be deducted from costs, with differences between assumed and actual returns amortized over long periods. The "Share of Income Before Taxes Resulting from Deviation from 9.25%" is the product of the difference between annual assumed rates and 9.25% and worldwide pension assets, divided by annual income before taxes.
Table 1: Pension Decision Making at IBM, 1993-2001
IBM Corporate PerformanceIBM Pension Plan Reporting and Impact on IBM
Corporate Reporting Gerstner Option Activity
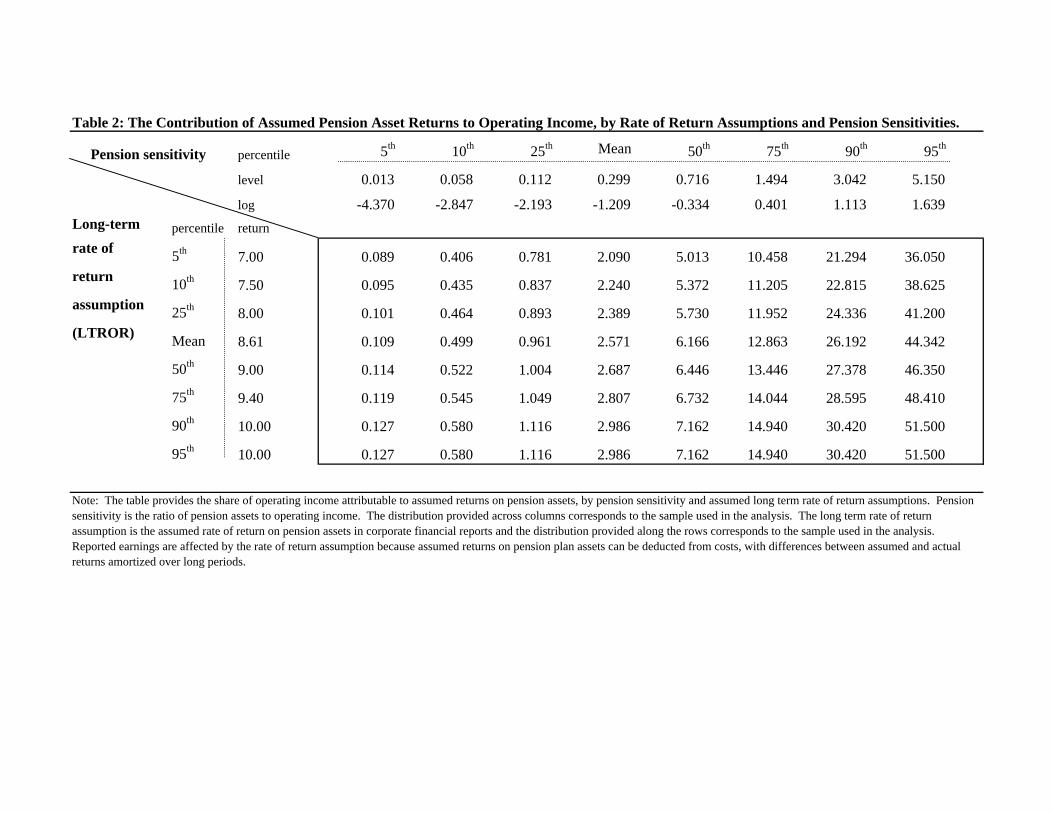
Pension sensitivity percentile 5th 10th 25th Mean 50th 75th 90th 95th
level 0.013 0.058 0.112 0.299 0.716 1.494 3.042 5.150 log -4.370 -2.847 -2.193 -1.209 -0.334 0.401 1.113 1.639Long-term percentile returnrate of 5th 7.00 0.089 0.406 0.781 2.090 5.013 10.458 21.294 36.050return 10th 7.50 0.095 0.435 0.837 2.240 5.372 11.205 22.815 38.625assumption 25th 8.00 0.101 0.464 0.893 2.389 5.730 11.952 24.336 41.200(LTROR) Mean 8.61 0.109 0.499 0.961 2.571 6.166 12.863 26.192 44.342
50th 9.00 0.114 0.522 1.004 2.687 6.446 13.446 27.378 46.350 75th 9.40 0.119 0.545 1.049 2.807 6.732 14.044 28.595 48.410 90th 10.00 0.127 0.580 1.116 2.986 7.162 14.940 30.420 51.500 95th 10.00 0.127 0.580 1.116 2.986 7.162 14.940 30.420 51.500
Table 2: The Contribution of Assumed Pension Asset Returns to Operating Income, by Rate of Return Assumptions and Pension Sensitivities.
Note: The table provides the share of operating income attributable to assumed returns on pension assets, by pension sensitivity and assumed long term rate of return assumptions. Pension sensitivity is the ratio of pension assets to operating income. The distribution provided across columns corresponds to the sample used in the analysis. The long term rate of return assumption is the assumed rate of return on pension assets in corporate financial reports and the distribution provided along the rows corresponds to the sample used in the analysis. Reported earnings are affected by the rate of return assumption because assumed returns on pension plan assets can be deducted from costs, with differences between assumed and actual returns amortized over long periods.
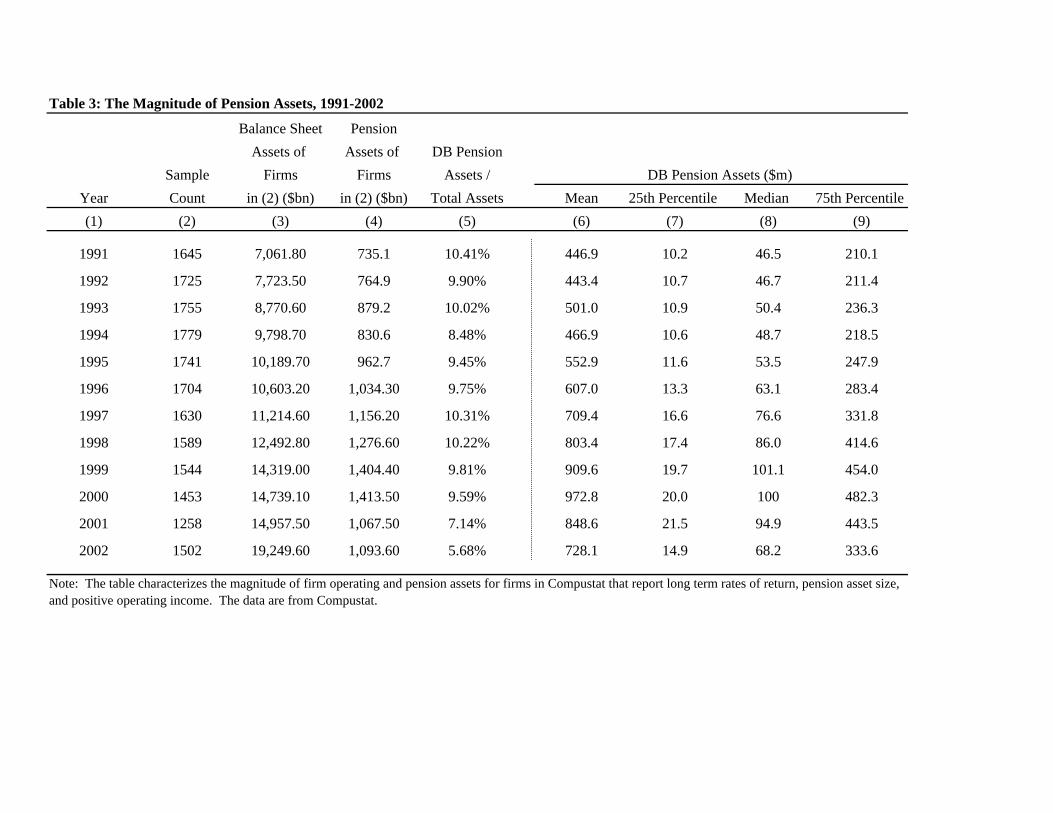
Balance Sheet PensionAssets of Assets of DB Pension
Sample Firms Firms Assets /Count in (2) ($bn) in (2) ($bn) Total Assets Mean 25th Percentile Median 75th Percentile
(1) (2) (3) (4) (5) (6) (7) (8) (9)
1991 1645 7,061.80 735.1 10.41% 446.9 10.2 46.5 210.1
1992 1725 7,723.50 764.9 9.90% 443.4 10.7 46.7 211.4
1993 1755 8,770.60 879.2 10.02% 501.0 10.9 50.4 236.3
1994 1779 9,798.70 830.6 8.48% 466.9 10.6 48.7 218.5
1995 1741 10,189.70 962.7 9.45% 552.9 11.6 53.5 247.9
1996 1704 10,603.20 1,034.30 9.75% 607.0 13.3 63.1 283.4
1997 1630 11,214.60 1,156.20 10.31% 709.4 16.6 76.6 331.8
1998 1589 12,492.80 1,276.60 10.22% 803.4 17.4 86.0 414.6
1999 1544 14,319.00 1,404.40 9.81% 909.6 19.7 101.1 454.0
2000 1453 14,739.10 1,413.50 9.59% 972.8 20.0 100 482.3
2001 1258 14,957.50 1,067.50 7.14% 848.6 21.5 94.9 443.5
2002 1502 19,249.60 1,093.60 5.68% 728.1 14.9 68.2 333.6
Note: The table characterizes the magnitude of firm operating and pension assets for firms in Compustat that report long term rates of return, pension asset size, and positive operating income. The data are from Compustat.
YearDB Pension Assets ($m)
Table 3: The Magnitude of Pension Assets, 1991-2002
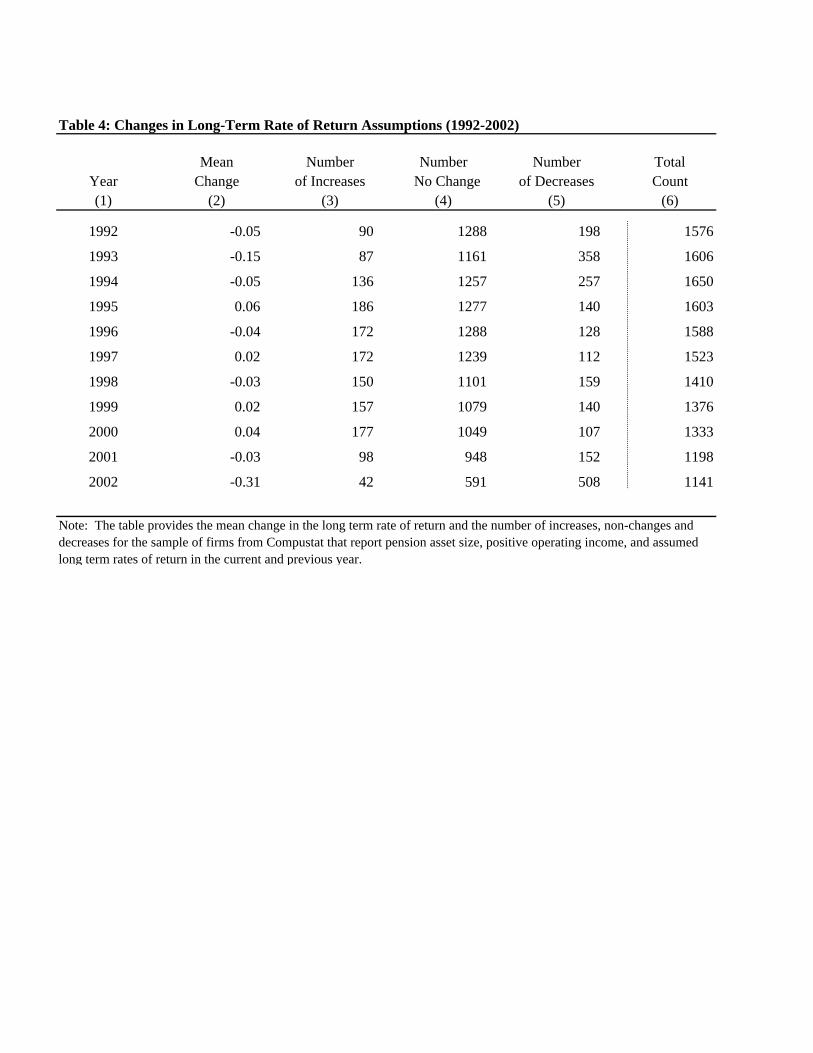
Mean Number Number Number TotalYear Change of Increases No Change of Decreases Count(1) (2) (3) (4) (5) (6)
1992 -0.05 90 1288 198 1576
1993 -0.15 87 1161 358 1606
1994 -0.05 136 1257 257 1650
1995 0.06 186 1277 140 1603
1996 -0.04 172 1288 128 1588
1997 0.02 172 1239 112 1523
1998 -0.03 150 1101 159 1410
1999 0.02 157 1079 140 1376
2000 0.04 177 1049 107 1333
2001 -0.03 98 948 152 1198
2002 -0.31 42 591 508 1141
Table 4: Changes in Long-Term Rate of Return Assumptions (1992-2002)
Note: The table provides the mean change in the long term rate of return and the number of increases, non-changes and decreases for the sample of firms from Compustat that report pension asset size, positive operating income, and assumed long term rates of return in the current and previous year.
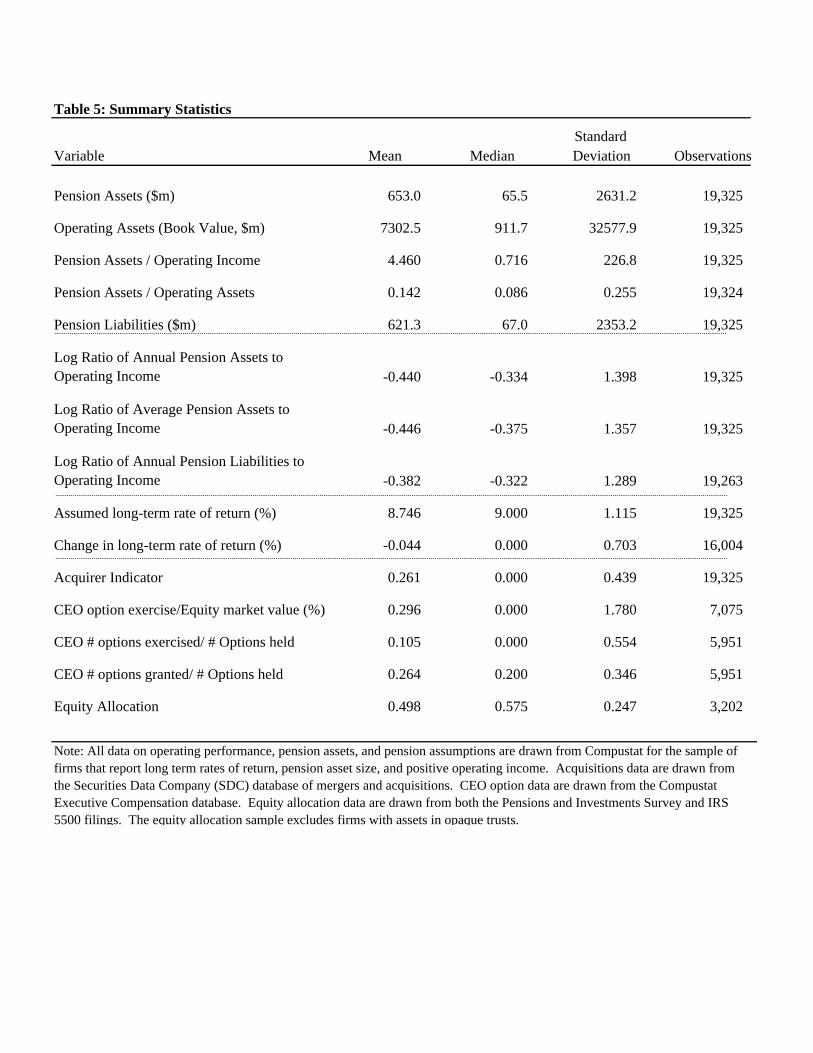
StandardVariable Mean Median Deviation Observations
Pension Assets ($m) 653.0 65.5 2631.2 19,325
Operating Assets (Book Value, $m) 7302.5 911.7 32577.9 19,325
Pension Assets / Operating Income 4.460 0.716 226.8 19,325
Pension Assets / Operating Assets 0.142 0.086 0.255 19,324
Pension Liabilities ($m) 621.3 67.0 2353.2 19,325
Log Ratio of Annual Pension Assets to Operating Income -0.440 -0.334 1.398 19,325
Log Ratio of Average Pension Assets to Operating Income -0.446 -0.375 1.357 19,325
Log Ratio of Annual Pension Liabilities to Operating Income -0.382 -0.322 1.289 19,263
Assumed long-term rate of return (%) 8.746 9.000 1.115 19,325
Change in long-term rate of return (%) -0.044 0.000 0.703 16,004
Acquirer Indicator 0.261 0.000 0.439 19,325
CEO option exercise/Equity market value (%) 0.296 0.000 1.780 7,075
CEO # options exercised/ # Options held 0.105 0.000 0.554 5,951
CEO # options granted/ # Options held 0.264 0.200 0.346 5,951
Equity Allocation 0.498 0.575 0.247 3,202
Table 5: Summary Statistics
Note: All data on operating performance, pension assets, and pension assumptions are drawn from Compustat for the sample of firms that report long term rates of return, pension asset size, and positive operating income. Acquisitions data are drawn from the Securities Data Company (SDC) database of mergers and acquisitions. CEO option data are drawn from the Compustat Executive Compensation database. Equity allocation data are drawn from both the Pensions and Investments Survey and IRS 5500 filings. The equity allocation sample excludes firms with assets in opaque trusts.
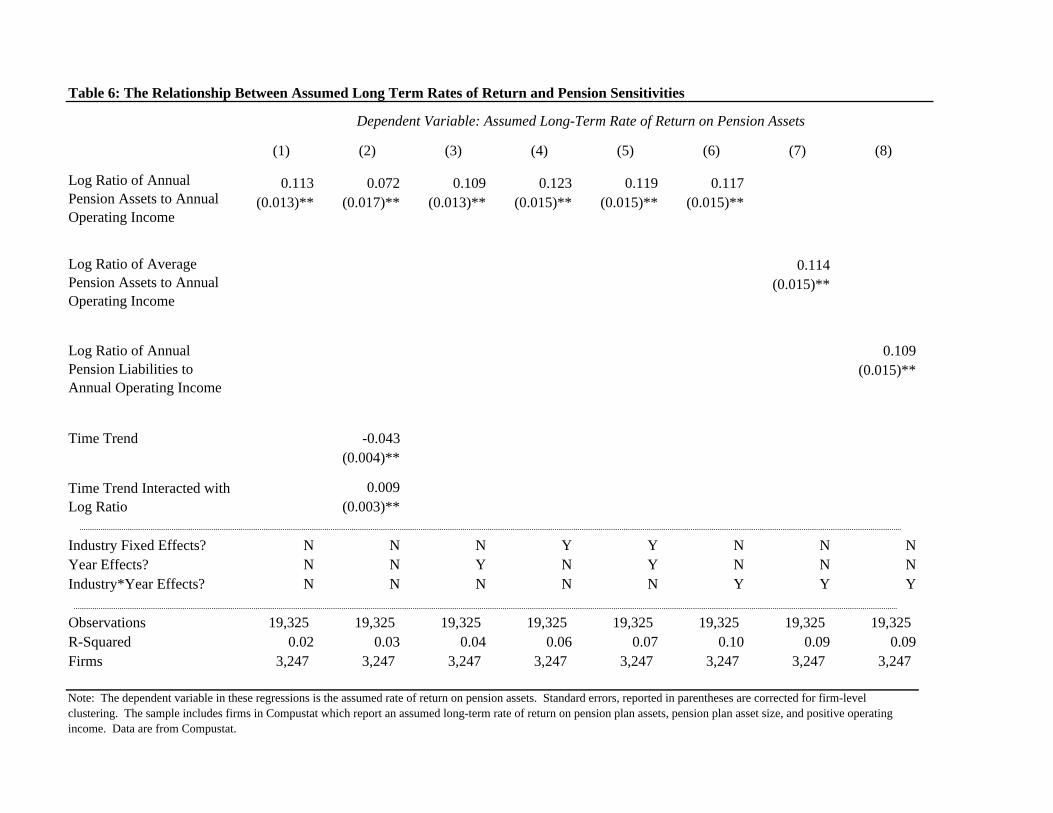
(1) (2) (3) (4) (5) (6) (7) (8)
0.113 0.072 0.109 0.123 0.119 0.117(0.013)** (0.017)** (0.013)** (0.015)** (0.015)** (0.015)**
0.114(0.015)**
0.109(0.015)**
Time Trend -0.043(0.004)**
0.009(0.003)**
Industry Fixed Effects? N N N Y Y N N NYear Effects? N N Y N Y N N NIndustry*Year Effects? N N N N N Y Y Y
Observations 19,325 19,325 19,325 19,325 19,325 19,325 19,325 19,325 R-Squared 0.02 0.03 0.04 0.06 0.07 0.10 0.09 0.09Firms 3,247 3,247 3,247 3,247 3,247 3,247 3,247 3,247
Note: The dependent variable in these regressions is the assumed rate of return on pension assets. Standard errors, reported in parentheses are corrected for firm-level clustering. The sample includes firms in Compustat which report an assumed long-term rate of return on pension plan assets, pension plan asset size, and positive operating income. Data are from Compustat.
Log Ratio of Annual Pension Liabilities to Annual Operating Income
Time Trend Interacted with Log Ratio
Table 6: The Relationship Between Assumed Long Term Rates of Return and Pension Sensitivities
Log Ratio of Annual Pension Assets to Annual Operating Income
Log Ratio of Average Pension Assets to Annual Operating Income
Dependent Variable: Assumed Long-Term Rate of Return on Pension Assets
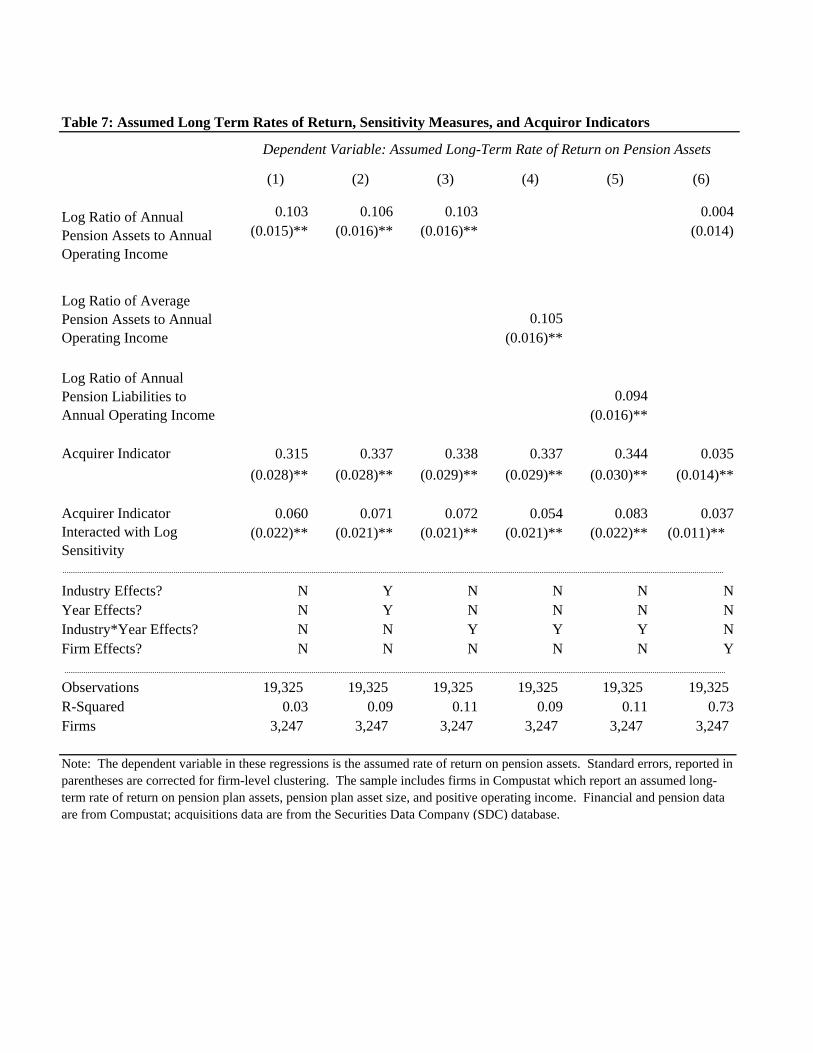
(1) (2) (3) (4) (5) (6)
0.103 0.106 0.103 0.004(0.015)** (0.016)** (0.016)** (0.014)
0.105(0.016)**
0.094(0.016)**
0.315 0.337 0.338 0.337 0.344 0.035(0.028)** (0.028)** (0.029)** (0.029)** (0.030)** (0.014)**
0.060 0.071 0.072 0.054 0.083 0.037(0.022)** (0.021)** (0.021)** (0.021)** (0.022)** (0.011)**
Industry Effects? N Y N N N NYear Effects? N Y N N N NIndustry*Year Effects? N N Y Y Y NFirm Effects? N N N N N Y
Observations 19,325 19,325 19,325 19,325 19,325 19,325 R-Squared 0.03 0.09 0.11 0.09 0.11 0.73Firms 3,247 3,247 3,247 3,247 3,247 3,247
Table 7: Assumed Long Term Rates of Return, Sensitivity Measures, and Acquiror Indicators
Log Ratio of Annual Pension Assets to Annual Operating Income
Log Ratio of Average Pension Assets to Annual Operating Income
Dependent Variable: Assumed Long-Term Rate of Return on Pension Assets
Log Ratio of Annual Pension Liabilities to Annual Operating Income
Acquirer Indicator
Acquirer Indicator Interacted with Log Sensitivity
Note: The dependent variable in these regressions is the assumed rate of return on pension assets. Standard errors, reported in parentheses are corrected for firm-level clustering. The sample includes firms in Compustat which report an assumed long-term rate of return on pension plan assets, pension plan asset size, and positive operating income. Financial and pension data are from Compustat; acquisitions data are from the Securities Data Company (SDC) database.
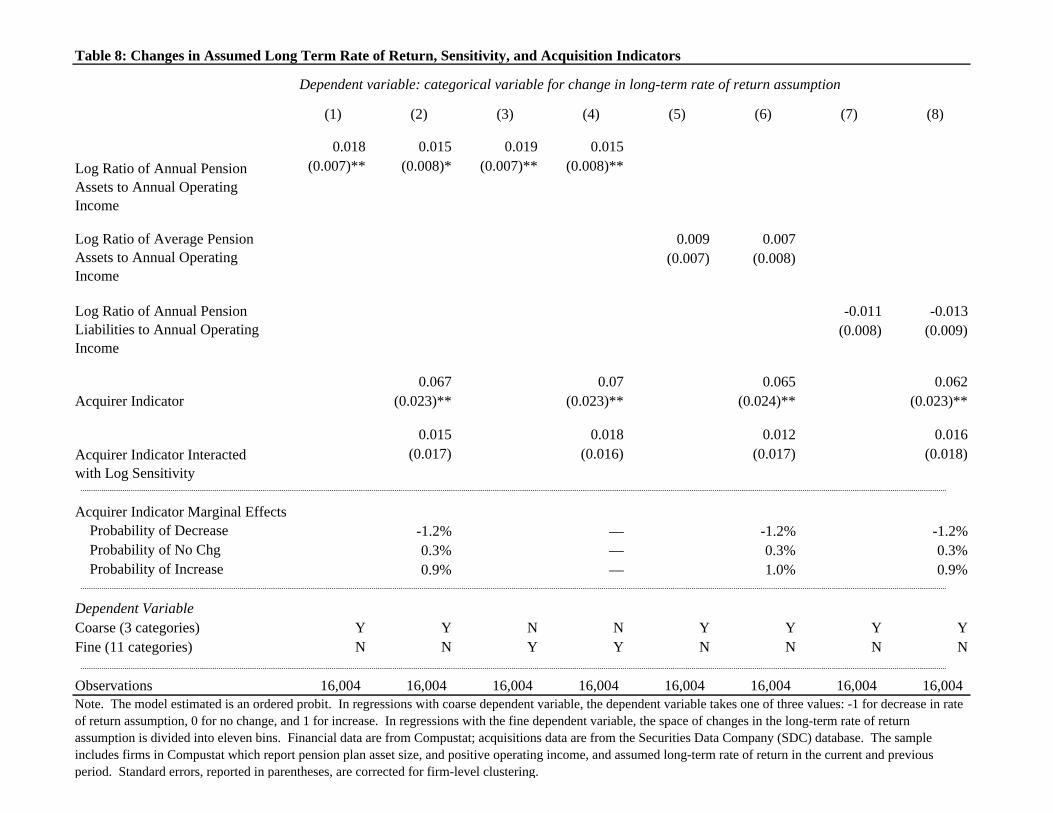
Dependent variable: categorical variable for change in long-term rate of return assumption
(1) (2) (3) (4) (5) (6) (7) (8)
0.018 0.015 0.019 0.015(0.007)** (0.008)* (0.007)** (0.008)**
0.009 0.007(0.007) (0.008)
-0.011 -0.013(0.008) (0.009)
0.067 0.07 0.065 0.062(0.023)** (0.023)** (0.024)** (0.023)**
0.015 0.018 0.012 0.016(0.017) (0.016) (0.017) (0.018)
Acquirer Indicator Marginal Effects Probability of Decrease -1.2% — -1.2% -1.2% Probability of No Chg 0.3% — 0.3% 0.3% Probability of Increase 0.9% — 1.0% 0.9%
Dependent VariableCoarse (3 categories) Y Y N N Y Y Y YFine (11 categories) N N Y Y N N N N
Observations 16,004 16,004 16,004 16,004 16,004 16,004 16,004 16,004 Note. The model estimated is an ordered probit. In regressions with coarse dependent variable, the dependent variable takes one of three values: -1 for decrease in rate of return assumption, 0 for no change, and 1 for increase. In regressions with the fine dependent variable, the space of changes in the long-term rate of return assumption is divided into eleven bins. Financial data are from Compustat; acquisitions data are from the Securities Data Company (SDC) database. The sample includes firms in Compustat which report pension plan asset size, and positive operating income, and assumed long-term rate of return in the current and previous period. Standard errors, reported in parentheses, are corrected for firm-level clustering.
Table 8: Changes in Assumed Long Term Rate of Return, Sensitivity, and Acquisition Indicators
Log Ratio of Annual Pension Assets to Annual Operating Income
Acquirer Indicator
Acquirer Indicator Interacted with Log Sensitivity
Log Ratio of Average Pension Assets to Annual Operating Income
Log Ratio of Annual Pension Liabilities to Annual Operating Income
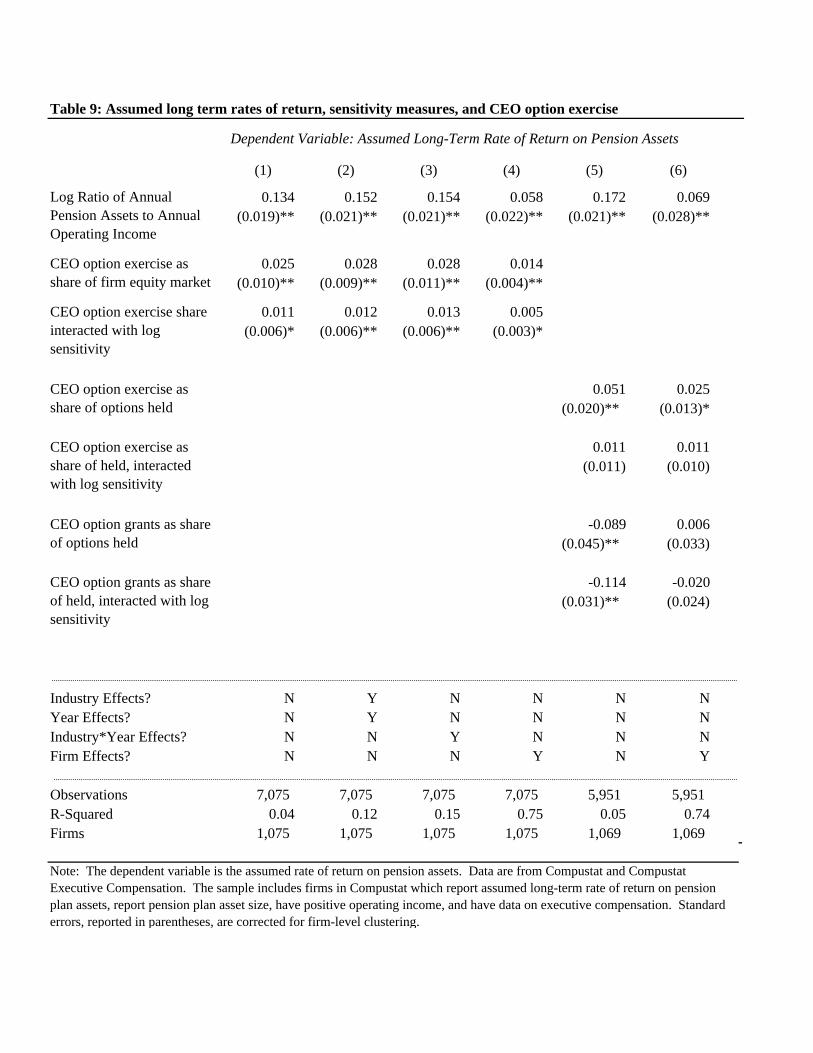
(1) (2) (3) (4) (5) (6)
0.134 0.152 0.154 0.058 0.172 0.069 (0.019)** (0.021)** (0.021)** (0.022)** (0.021)** (0.028)**
0.025 0.028 0.028 0.014 (0.010)** (0.009)** (0.011)** (0.004)**
0.011 0.012 0.013 0.005 (0.006)* (0.006)** (0.006)** (0.003)*
0.051 0.025 (0.020)** (0.013)*
0.011 0.011(0.011) (0.010)
-0.089 0.006(0.045)** (0.033)
-0.114 -0.020(0.031)** (0.024)
Industry Effects? N Y N N N NYear Effects? N Y N N N NIndustry*Year Effects? N N Y N N NFirm Effects? N N N Y N Y
Observations 7,075 7,075 7,075 7,075 5,951 5,951 R-Squared 0.04 0.12 0.15 0.75 0.05 0.74Firms 1,075 1,075 1,075 1,075 1,069 1,069
Table 9: Assumed long term rates of return, sensitivity measures, and CEO option exercise
Log Ratio of Annual Pension Assets to Annual Operating Income
Dependent Variable: Assumed Long-Term Rate of Return on Pension Assets
Note: The dependent variable is the assumed rate of return on pension assets. Data are from Compustat and Compustat Executive Compensation. The sample includes firms in Compustat which report assumed long-term rate of return on pension plan assets, report pension plan asset size, have positive operating income, and have data on executive compensation. Standard errors, reported in parentheses, are corrected for firm-level clustering.
CEO option exercise as share of firm equity market
CEO option exercise share interacted with log sensitivity
CEO option exercise as share of options held
CEO option exercise as share of held, interacted with log sensitivity
CEO option grants as share of options held
CEO option grants as share of held, interacted with log sensitivity
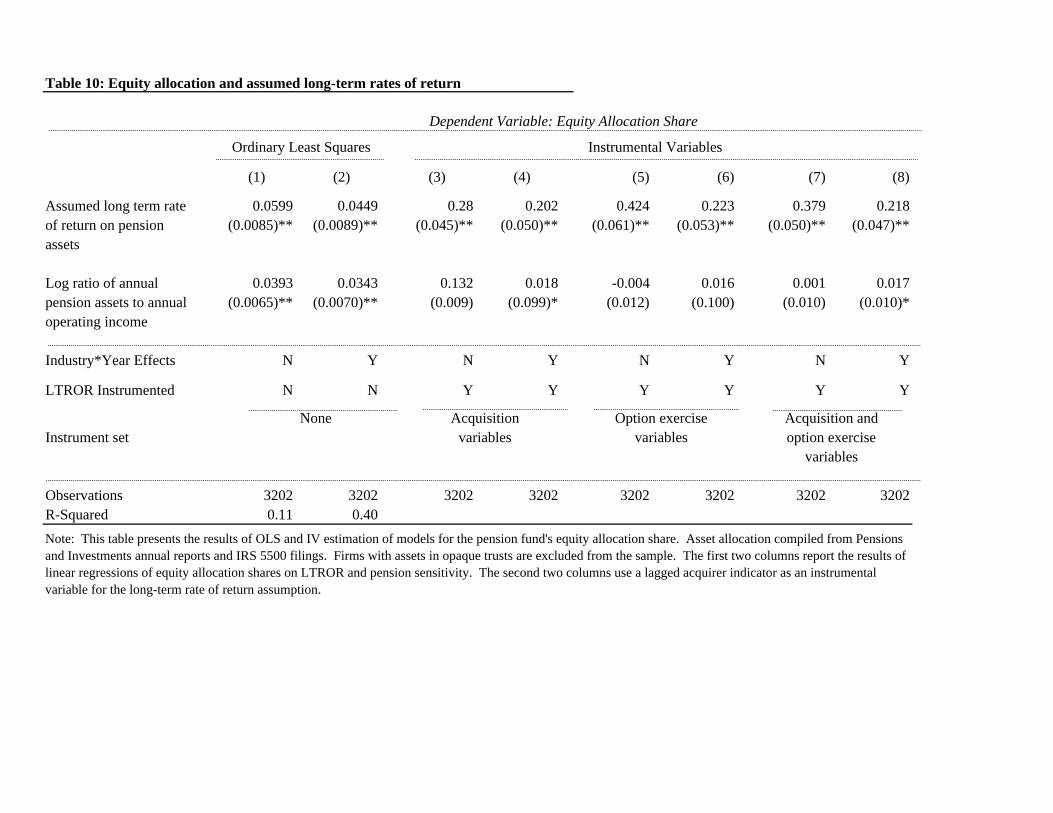
(1) (2) (3) (4) (5) (6) (7) (8)
Assumed long term rate 0.0599 0.0449 0.28 0.202 0.424 0.223 0.379 0.218of return on pension (0.0085)** (0.0089)** (0.045)** (0.050)** (0.061)** (0.053)** (0.050)** (0.047)**assets
Log ratio of annual 0.0393 0.0343 0.132 0.018 -0.004 0.016 0.001 0.017pension assets to annual (0.0065)** (0.0070)** (0.009) (0.099)* (0.012) (0.100) (0.010) (0.010)*operating income
Industry*Year Effects N Y N Y N Y N Y
LTROR Instrumented N N Y Y Y Y Y Y
Instrument set
Observations 3202 3202 3202 3202 3202 3202 3202 3202R-Squared 0.11 0.40
Instrumental Variables
Dependent Variable: Equity Allocation Share
Table 10: Equity allocation and assumed long-term rates of return
Ordinary Least Squares
Acquisition andoption exercise
variables
None Acquisition variables
Option exercise variables
Note: This table presents the results of OLS and IV estimation of models for the pension fund's equity allocation share. Asset allocation compiled from Pensions and Investments annual reports and IRS 5500 filings. Firms with assets in opaque trusts are excluded from the sample. The first two columns report the results of linear regressions of equity allocation shares on LTROR and pension sensitivity. The second two columns use a lagged acquirer indicator as an instrumental variable for the long-term rate of return assumption.
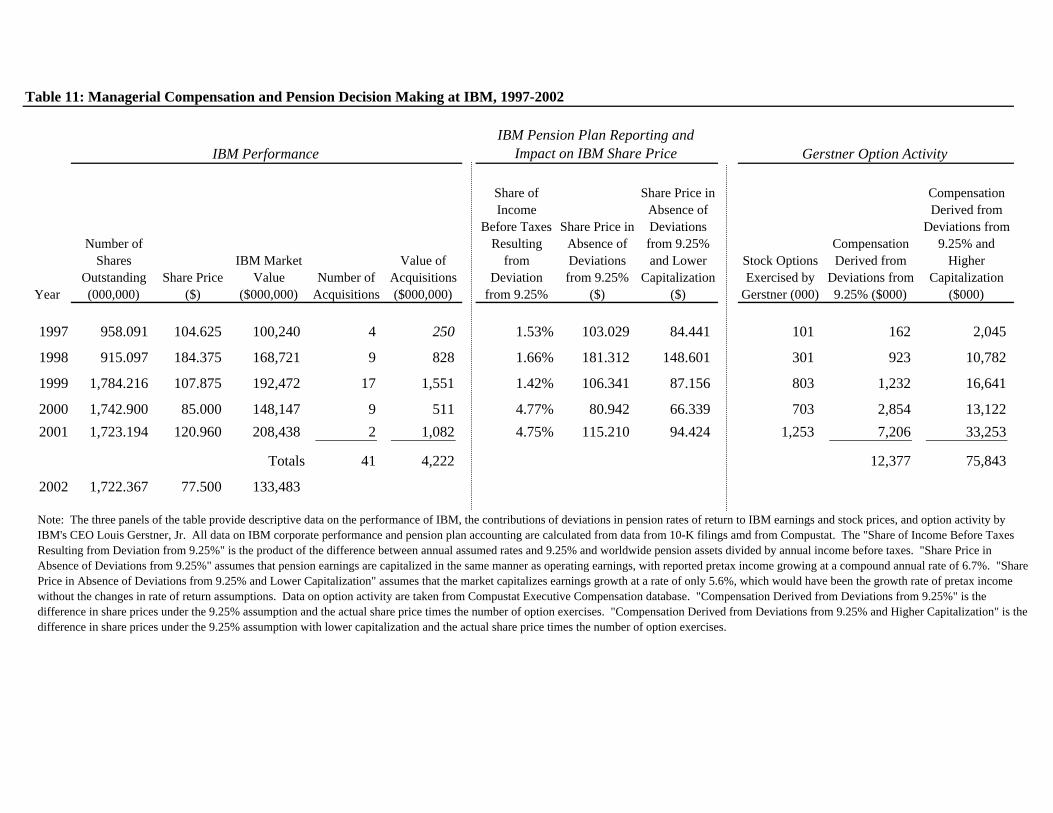
Year
Number of Shares
Outstanding (000,000)
Share Price ($)
IBM Market Value
($000,000)Number of
Acquisitions
Value of Acquisitions ($000,000)
Share of Income
Before Taxes Resulting
from Deviation
from 9.25%
Share Price in Absence of Deviations from 9.25%
($)
Share Price in Absence of Deviations from 9.25% and Lower
Capitalization ($)
Stock Options Exercised by
Gerstner (000)
Compensation Derived from
Deviations from 9.25% ($000)
Compensation Derived from
Deviations from 9.25% and
Higher Capitalization
($000)
1997 958.091 104.625 100,240 4 250 1.53% 103.029 84.441 101 162 2,045
1998 915.097 184.375 168,721 9 828 1.66% 181.312 148.601 301 923 10,782
1999 1,784.216 107.875 192,472 17 1,551 1.42% 106.341 87.156 803 1,232 16,641
2000 1,742.900 85.000 148,147 9 511 4.77% 80.942 66.339 703 2,854 13,122 2001 1,723.194 120.960 208,438 2 1,082 4.75% 115.210 94.424 1,253 7,206 33,253
Totals 41 4,222 12,377 75,843
2002 1,722.367 77.500 133,483
Table 11: Managerial Compensation and Pension Decision Making at IBM, 1997-2002
IBM PerformanceIBM Pension Plan Reporting and
Impact on IBM Share Price Gerstner Option Activity
Note: The three panels of the table provide descriptive data on the performance of IBM, the contributions of deviations in pension rates of return to IBM earnings and stock prices, and option activity by IBM's CEO Louis Gerstner, Jr. All data on IBM corporate performance and pension plan accounting are calculated from data from 10-K filings amd from Compustat. The "Share of Income Before Taxes Resulting from Deviation from 9.25%" is the product of the difference between annual assumed rates and 9.25% and worldwide pension assets divided by annual income before taxes. "Share Price in Absence of Deviations from 9.25%" assumes that pension earnings are capitalized in the same manner as operating earnings, with reported pretax income growing at a compound annual rate of 6.7%. "Share Price in Absence of Deviations from 9.25% and Lower Capitalization" assumes that the market capitalizes earnings growth at a rate of only 5.6%, which would have been the growth rate of pretax income without the changes in rate of return assumptions. Data on option activity are taken from Compustat Executive Compensation database. "Compensation Derived from Deviations from 9.25%" is the difference in share prices under the 9.25% assumption and the actual share price times the number of option exercises. "Compensation Derived from Deviations from 9.25% and Higher Capitalization" is the difference in share prices under the 9.25% assumption with lower capitalization and the actual share price times the number of option exercises.
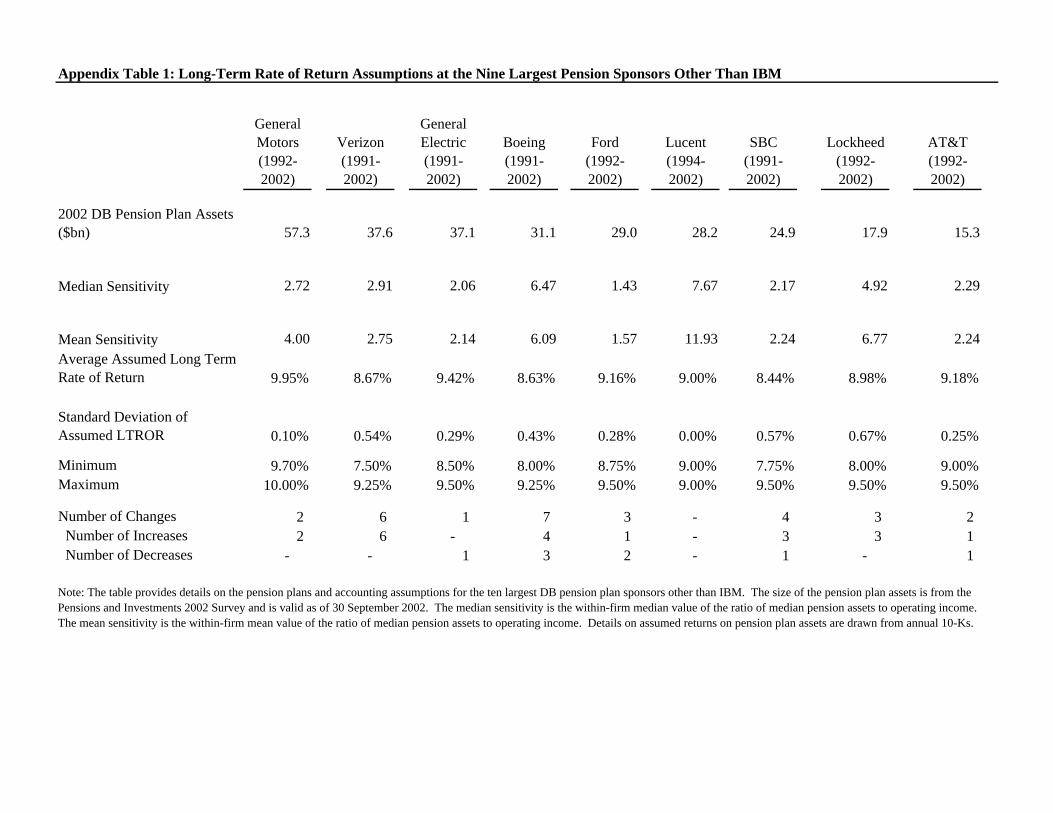
General Motors (1992-2002)
Verizon (1991-2002)
General Electric (1991-2002)
Boeing (1991-2002)
Ford (1992-2002)
Lucent (1994-2002)
SBC (1991-2002)
Lockheed (1992-2002)
AT&T (1992-2002)
2002 DB Pension Plan Assets ($bn) 57.3 37.6 37.1 31.1 29.0 28.2 24.9 17.9 15.3
Median Sensitivity 2.72 2.91 2.06 6.47 1.43 7.67 2.17 4.92 2.29
Mean Sensitivity 4.00 2.75 2.14 6.09 1.57 11.93 2.24 6.77 2.24Average Assumed Long Term Rate of Return 9.95% 8.67% 9.42% 8.63% 9.16% 9.00% 8.44% 8.98% 9.18%
Standard Deviation of Assumed LTROR 0.10% 0.54% 0.29% 0.43% 0.28% 0.00% 0.57% 0.67% 0.25%
Minimum 9.70% 7.50% 8.50% 8.00% 8.75% 9.00% 7.75% 8.00% 9.00%Maximum 10.00% 9.25% 9.50% 9.25% 9.50% 9.00% 9.50% 9.50% 9.50%
Number of Changes 2 6 1 7 3 - 4 3 2 Number of Increases 2 6 - 4 1 - 3 3 1 Number of Decreases - - 1 3 2 - 1 - 1
Appendix Table 1: Long-Term Rate of Return Assumptions at the Nine Largest Pension Sponsors Other Than IBM
Note: The table provides details on the pension plans and accounting assumptions for the ten largest DB pension plan sponsors other than IBM. The size of the pension plan assets is from the Pensions and Investments 2002 Survey and is valid as of 30 September 2002. The median sensitivity is the within-firm median value of the ratio of median pension assets to operating income. The mean sensitivity is the within-firm mean value of the ratio of median pension assets to operating income. Details on assumed returns on pension plan assets are drawn from annual 10-Ks.
Recommended