
Management of Cyclone Disaster in Agriculture Sector in Coastal Areas
Editors
Dr. Ashwani Kumar, Director Dr. P.S. Brahmanand, Sr. Scientist and Course Convener Dr. Ashok K. Nayak, Sr. Scientist and Course Convener
Directorate of Water Management
NRM Division (ICAR) Chandrasekharpur, Bhubaneswar‐751023, Odisha
Management of Cyclone Disaster in Agriculture Sector in Coastal Areas
Editors
Dr. Ashwani Kumar, Director Dr. P.S. Brahmanand, Sr. Scientist and Course Convener Dr. Ashok K. Nayak, Sr. Scientist and Course Convener
Directorate of Water Management
NRM Division (ICAR) Chandrasekharpur, Bhubaneswar, Odisha‐751023

Citation
Ashwani Kumar, P.S. Brahmanand and Ashok K. Nayak. 2014. Management of Cyclone
Disaster in Agriculture Sector in Coastal Areas. Directorate of Water Management.
Bhubaneswar. P108.
Directorate of Water management
Opp. Rail Vihar, Chandrasekharpur
Bhubaneswar – 751023, Odisha, India
Website : http://www.dwm.res.in

PREFACE
Agriculture sector in India faces severe challenges in the form of natural disasters like
cyclones resulting in crop damage and poor crop productivity. At the same time, we have to
feed the evergrowing human population to ensure food security. This necessitates us to
develop a multi-pronged and integrated long term cyclone management. Preventive, mitigation
and preparedness measures are equally important as response and rehabilitation measures.
This will address the cyclone prone ecosystems in coastal areas which account for 8% of total
area in India. Keeping these points in consideration, a one week short course on “Management
of cyclone disaster in agriculture sector in coastal areas” is being organized by Directorate of
Water Management (NRM division, ICAR) at Bhubaneswar.
Important topics related to cyclone disaster management such as concept of disaster
management, integrated approach for cyclone risk mitigation, engineering, soil and crop
management interventions for cyclone prone areas, subsurface water harvesting structures for
cyclone affected areas and impact of cyclone on socio-economic condition of farming
community have been covered during this short course. These topics have been compiled in the
form of a training manual. This would be of immense use to various stake holders like
researchers, policymakers, government functionaries and academicians in the field of cyclone
disaster management. We would like to express our heartfelt thanks to Dr. A.K.Sikka, Hon’ble
Deputy Director General (NRM) and Dr. S.K. Chaudhari, Assistant Director General (SWM) for
extending their valuable guidance for smooth organization of short course.
Editors

CONTENTS
Sl.
No
Title and Authors Page
No.
1. Concept of natural disaster management and integrated cyclone management
strategies
Dr. Ashwani Kumar
1-6
2. Technological Interventions for Rehabilitation of Cyclone Affected Areas
Dr. R. C. Srivastava
7-14
3. Development of Micro-Water Resources for Enhancing Agricultural
Productivity in Cyclone Affected Areas
Dr. Susanta Kumar Jena and Dr. Narayan Sahoo
15-23
4. Integrated long term management plan for cyclone risk mitigation
Dr. R. K. Panda
24-29
5. Cyclonic disturbances in the eastern India: implications and predictions
Dr. D. K. Panda
30-36
6. Assessment of severity and extent of cyclone damage on crop production and
some measures to reduce the impacts
Dr. Gouranga Kar
37-51
7. Significance of GIS and remote sensing in cyclone management
Dr. Ashok Kumar Nayak
52-56
8. Soil management intervention in cyclone affected coastal areas
Dr. Madhumita Das
57-66
9. Role of Disaster Management Acts and Policies in Cyclone Mitigation Planning
in India
Dr. S. Roy Chowdhury
67-75
10. Contingency planning and Crop management interventions for cyclone risk
mitigation
Dr. P.S. Brahmanand, Dr. S. Roy Chowdhury and Dr. K.G. Mandal
76-86
11. Tropical Cyclone and Crop Management Strategies
Dr. S.K. Rautaray, Dr. P. Panigrahi and Dr. P.K. Panda
87-93
12. Concept of Community nurseries and seed banks for climate resilient
horticulture
P. Srinivas and H.S. Singh
94-99
13. Socio Economic Impact of Cyclone and Other Climate Induced Natural
Disasters- Some Case Studies
Dr. Prabhakar Nanda
100-108

1
Concept of natural disaster management and integrated cyclone management
strategies
Dr. Ashwani Kumar
Director
Directorate of Water Management (ICAR), Bhubaneswar – 751023, Odisha
The low productivity in agriculture sector in India will affect the food security negatively. One of
the main reasons for poor productivity in agriculture is uncertain weather and its associated
natural disasters. Though the average annual rainfall of India is considerably high i.e. about
1200mm, the crop productivity is not satisfactory in several agro-climatic zones. The main
reason for this is the uneven distribution of rainfall and extreme climatic events. Most
importantly, the natural disasters like cyclones result in heavy rainfall thereby causing flood in
the vicinity. Cyclone disaster always accompanies with major storms and heavy wind in addition
to flood and it is highly detrimental to agriculture. It is true that the cyclone events cannot be
stopped fully, however, we can make ourselves well prepared to reduce the risk reduction. This
holds more importance in agriculture sector as the crop establishment and crop productivity is
severely influenced by frequency and intensity of natural disasters. This necessitates us to create
awareness among the stakeholders about the concept of natural disaster management which in
turn aids in development of integrated disaster management strategies.
What is a natural disaster?
A natural disaster can be defined as a major adverse event caused by the natural processes of the
Earth. During occurrence of natural disaster, higher level of force will be resulted with in small
period causing enormous loss to the crops, animals and human beings. Hence, natural disasters
can cause loss of life or property damage, and result in severe economic damage during the
process. Some factors like the affected population's resilience, and ability to recover will
influence the severity of natural disaster. The common examples of natural disasters are floods,
cyclones, earthquakes, drought etc.
Hazard vs Disaster
Several times, hazards may not translate in to disasters. In other words, an adverse event will not
rise to the level of a disaster if it occurs in an area without vulnerable population or in an area
with sparse population. This may become a severe disaster if vulnerability is very high and social
and economic capacity measures have to be implemented for reducing the extent of damage (Fig
1).

2
Fig 1: Process of disaster risk
World scenario
There were 905 natural catastrophes experienced by us worldwide in 2012. Out of them, 93%
have been identified as weather-related disasters. The economic damage caused by these events
was estimated as INR 10,20,000 lakhs and the agriculture sector was the worst affected one. If
we look in to the categories of natural disasters experienced during this period, 45% were
classified as meteorological in nature (storms), 36% were hydrological (floods), 12% were
climatological (heat waves, cold waves, droughts etc.) and 7% were geophysical (earthquakes
and volcanic eruptions).
Indian scenario
Food security in India is severely challenged by natural disasters such as floods, cyclones and
drought. India is prone to flood in about 49.8 million hectares which accounts for 12.3% of the
geographical area (NRAA, 2013). Out of the total geographical area of India, about one-sixth
area with 12% of the population is found to be susceptible to drought and 8% of the total area of
India is cyclone prone.
Most severely cyclone and flood affected areas
India is quite susceptible to cyclones and floods due to its geographical location surrounded by
water on three sides. West Bengal, Odisha, Andhra Pradesh, Tamil Nadu, Kerala and Gujarat
come under most severely cyclone and flood affected areas of India. In each of these states there
is a need to identify the most severely flood affected districts and blocks so that contingency
measures can be taken at accurate level. For example, the districts such as Kendrapara,
Jagatsinghpur, Balasore, Bhadrak, Puri and Cuttack districts fall under most severely cyclone
and flood affected areas in Odisha.
3
Major consequences of cyclones
Negative impact of cyclone and its associated flood on soil and crop condition
The cyclone and its associated flood incidence causes severe damage to agriculture in several
ways. The crops get affected both in terms of establishment and productivity. The stagnation of
water inside the crop fields result in crop damage. The pulses and oil seeds and vegetable crops
are highly susceptible to flood and the flood will result in their complete crop loss. In case of
paddy, the duration of flood will decide the extent of damage to crop. The average annual flood
damage was found to be about 3.57 m ha of cultivated area based on the survey of 47 years
between 1953 and 1999 (http://www.mapsofindia.com/top-ten/geography/india-flood.html).
Cyclone associated flood water also brings sand and silt along with it to the crop fields and
thereby resulting in change in soil physical condition. The top soil was found to be severely
altered for a longer period due to deposition of clay which was witnessed in case of flash flood
damage in Uttarakhand in 2013. Approximately 30% of the cultivated area in Uttarakhand was
severely affected resulting crop loss and several water conservation and harvesting structures
were damaged due to this flood event.
Resilient agricultural system as major objective of integrated cyclone management plan
What is resilient agricultural system?
The resilience capacity of the community plays positive role in reducing the vulnerability of the
community (UNESCO-IHE, 2009). The role of both Mitigation and adaptation of climate
change impacts in minimizing the yield losses is significant (Adger, N., & Kelly, M. (1999).
Resilient agricultural system can be defined as a combination of different agricultural practices
which aim at providing better resistance and adoptability to the crops to various natural disasters
such as floods and drought.
Scope for resilient agricultural systems for management of natural disasters
The natural disasters cannot be stopped, but at the same time, we can improve the level of
preparedness to face such disasters. There are some practices which can provide better resistance
to cyclones and floods and hence have potential to reduce the extent of crop damage. In this
context, there exists a tremendous scope for cyclone and flood resilient agricultural systems.
Important resilient agricultural systems and multi-pronged approach for cyclone/flood
management
Sub surface water harvesting structures (SSWHS)
SSWHS were developed by Directorate of Water Management is highly useful for coastal
cyclone prone and waterlogged areas where fresh water floats above the saline water below

4
ground could be tapped. The depth of structure should be restricted with in sandy zone below
ground up to 5 meter. SSWHS can be created in 0.1 ha with 4 m depth which will create a
structure of 4000m3 and on an average, it has the potential to enhance the water productivity to
Rs. 36/m3 by involving pisci-culture and rabi vegetables. This has been well adopted by the
farmers in super cyclone affected areas of Erasama block, Jagatsinghpur district, Odisha.
Cyclone and flood resistant / tolerant rice varieties
Flash floods are frequently witnessed due to heavy rains caused by cyclone with in short period
resulting in huge crop loss. The flash flood tolerant rice varieties such as Swarna Sub-1 should
be used by the farmers to reduce the yield loss under such conditions. Farmers in coastal Odisha
which is cyclone and flood prone area have taken the benefit of this variety, but there is a need to
generate more awareness among the farmers and to supply adequate quantity of the seed.
Waterlogging tolerant varieties of rice such as Durga, Hangseswari, Varshadhan are being
suggested for areas of the deep waterlogged and cyclone/flood prone areas which have resulted
in additional rice yield and economic returns of the farmers. The agro-economic analysis of
improved crop management interventions conducted by Directorate of Water Management,
Bhubaneswar revealed that the pod yield of green gram variety SML-668 (0.680 t/ha) was found
to be superior compared to that of local green gram variety (0.586 t/ha) under post flood situation
in Garadpur block of Kendrapada district. It recorded about 16% higher pod yield compared to
traditionally grown green gram variety. As a result, the economic net returns obtained from the
cultivation of SML-668 variety of green gram was found to be higher by Rs. 5,600/- per ha
compared to the local variety.
Over-aged rice seedlings
The level of submergence at the time of transplanting is found to be higher than the seedling age
in cyclone and flood prone waterlogged areas which makes the establishment of seedlings
difficult. To overcome this constraint, Directorate of Water Management, Bhubaneswar has
developed a cyclone and flood resilient mechanism in the form of over aged seedlings of 60 days
old. This has provided an yield advantage of about 32% over the normal seedlings (30 days old)
and most importantly this practice has helped successful establishment of seedlings in cyclone
and flood prone areas (Roy Chowdhury et al., 2011).
Flood resistant aquatic crops with economic importance
In areas of perennial waterlogging and cyclone prone areas where even rice cultivation is
difficult, Directorate of Water Management, Bhubaneswar has standardized a technique for
cultivation of aquatic crops with economic importance such as water chestnut. It was revealed
that water chestnut either as sole crop or with fish which has potential to provide net income of
famers by Rs.33,000/ha. The package of practices for cultivation of other aquatic crops such as
Typha sp. And Colocasia sp. were also standardized for flood prone waterlogged areas.

5
Contingency crop planning and post flood management
Contingency crop planning helps in providing better resilience in post cyclone and flood period
resulting in lesser extent of crop damage. The contingent crop plans were prepared for
Kendrapara, Puri, Cuttack, Bhadrak, Jagatsinghpur and Balasore districts of Odisha for better
cyclone/flood resilience. The practice of zero tillage as crop management intervention helped in
better crop establishment and productivity of sunflower, okra and bitter gourd under post flood
situation.
Land modification techniques for better cyclone / flood resistance
In medium and lowlands under high rainfall region and cyclone and flood prone areas, land
modification such as raised and sunken bed technique would be highly effective in utilization of
the available water, higher crop productivity, cropping intensity and economic net returns. The
adoption of the technology increased kharif paddy and pointed guard yield from 4.2 t/ha to 5.2
t/ha and 4.24 t/ha to 4.74 t/ha respectively in addition to fish yield of 1 t/ha. Raised and sunken
bed system facilitated conservation of available water resources and crop diversification
resulting in higher economic net returns to the farmers (Rs. 60,000/- per hectare).
Bio-drainage options for better cyclone and flood resilience
In cyclone and flood prone and waterlogged areas, the practice of bio-drainage using Casuarina
and Eucalyptus plantations would act as a viable flood resilient system as they improve soil
drainage and operates better micro climate. This allows intercrop cultivation and helps in
advanced planting of rabi crop resulting in higher water and land productivity. The farmers will
get higher economic net returns due to fuel wood, intercrop and rabi crop produce.
In addition, water and soil conservation measures in flood catchments in cyclone prone areas are
needed to moderate peak flows and water suspended sediments and siltation of water ways. The
practice of de-sanding, de-siltation and land shaping will help in bringing desirable shift in soil
physical condition under post flood situation.
Conclusion
The frequent occurrence and major area of incidence of cyclones and floods significantly limit
agricultural productivity in India which in turn affects the socio-economic prospects of farmers
and food security. Cyclone disaster risk cannot be minimized successfully through application of
isolated management measures. We have to enhance the accuracy of cyclone preparedness and
implement the potential agricultural techniques and structural measures as part of the
multipronged and integrated management approach in cyclone prone areas. Immediate attention
must be paid to contingency crop planning and integrated cyclone and flood management
strategies for reducing the extent of damage. Both structural and non structural measures along
with the strong coordination and communication among various stakeholders and community

6
management would provide better cyclone and flood resilience. The identification of agro-
climatic zone based resilient agricultural system for different situations of cyclone and flood
incidence in would certainly provide necessary relief in this direction. The strong coordination
among the Ministry of Home Affairs (nodal agency for natural disaster management in India)
and other agencies such as Ministry of Agriculture, Water Resources, Civil Supplies, Heath,
Science and Technology, Department of Space, Indian Meteorological Department, Relief
commissions of State governments and Non Governmental organizations would help in
implementing cyclone and flood resilient agricultural systems.
References
Adger N, & Kelly M, 1999.Social vulnerability to climate change and the architecture of
entitlement. Mitigation and Adaptation Strategy for Global Change, 253-266.
Indian Meteorological Department. 2014. Frequently asked questions. Cyclone page, Indian
Meteorological Department. http://www.imd.gov.in.
Mishra, A., Ghosh, S., Mohanty, R.K. and Brahmanand, P.S. 2013.Performance evaluation of
rehabilitated minor irrigation project and augmentation of its water resource through secondary
storage reservoir. Agricultural Water Management. 128 : 32-42.
Roy Chowdhury, S., Brahmanand, P.S., Kumar, A., Kundu, D.K. and Behera, M.S. 2011.
Growth and yield of over-aged rice (Oryza sativa) seedlings under different nitrogen levels in
waterlogged situations. Indian Journal of Agricultural Sciences. 81 (12) : 1149-1152.
UNESCO-IHE.2009. Flood Vulnerability Indices. Delft, The Netherlands: Institute for Water
Education.
***

7
Technological Interventions for Rehabilitation of Cyclone Affected Areas
Dr. R. C. Srivastava
Principal Scientist
Directorate of Water Management, Bhubaneswar (Odisha) India &
Ex- Director, Central Agricultural Research Institute, Port Blair (A & N Islands), India
Introduction
Natural disasters like cyclone, tsunami, typhoons are major natural disasters in coastal areas. The
devastation to lives, infrastructure, and agricultural lands and animals leave the people in the
region to lose hopes of reviving their lives after such catastrophe. The farming community is
worst affected by destruction of standing crops by seawater influx, contamination of wells from
salt water, uprooting of coconut trees in coastal areas, loss of productive lands due to salt water
ponding, degradation of lands due to sediment deposits or erosion, loss of agricultural tools, loss
of small livestock and draft animals, and destruction of fisheries.
After each such disaster in first phase, the people survive on cash grants given by the
government and nongovernmental organizations (NGOs) and on their savings, with their self-
confidence at very low levels. The government/NGO initiate a work for cash programme that
provided immediate relief and incomes around Rs 1500–2000 per month, but the reduction in
status from honourable farmers to daily wage labourers badly affect their self-esteem. Surveys of
farmers’ behavioral changes, using open-ended questionnaires, has suggested that nearly 80% of
respondents decide to abandon agriculture and were expecting the government to announce relief
packages for their livelihood and alternative employment opportunities.
Thus the challenge is restore farming through interventions aimed towards restoring natural
resources and the self-esteem and confidence of farmers. There are very few case studies on level
of interventions to rehabilitate agriculture in post disaster situation. Post tsunami of 2004, a study
was conducted in the Andaman Islands with the objective of restoring livelihoods through
agricultural technologies.
Methodology
A study was conducted by the Central Agricultural Research Institute, Port Blair, during 2005–
2008 to evaluate various agricultural technologies for use in tsunami-affected areas of the
Andaman Islands to restore the livelihood of farmers. Immediately after the tsunami, damage and
losses in terms of crops, land, livestock and fisheries for four selected villages were assessed
through the Participatory Rural Appraisal (PRA) technique. On the basis of this assessment, low-
lying coastal areas were categorized in different situations, and agricultural technologies were
identified for each situation and evaluated in the study area.
8
Results and Discussion
There were three situations out of which, only two will be prevalent and therefore presented
here:
Situation I: Tidal Inundation
Assessment of Spatial and Temporal Variability in Soil
One of the main impacts of the tsunami was salt accumulation, raising fears of strong decreases
in soil fertility and productivity.
The texture of typical soils in the study area is sandy clay loam with medium organic carbon
content (0.55%) in the upper 25 cm. The soil is acidic (pH 5.9), and its electrical conductivity
(ECe) is 0.32 and 0.04 dS m–1
at 0–15 and 15–30 cm depths, respectively. Exchangeable calcium
and magnesium content are typically 1.8 c mol (p+)/kg soil at 0–12 cm depth and 3.3 c mol
(p+)/kg soil at 55 cm depth. After seawater intrusion, the surface soil (0–15 cm) became highly
saline, with ECe ranging from 7.6 to 34.4 dS m–1
and pH ranging from 5.3 to 6.9. The salinity
increased (ranging from ECe 9.7 to 28.4 dS m–1
) as soluble salts percolated downward from the
surface soil.
After one rainy season, there was appreciable reduction in soluble cation and anion
concentrations in all tsunami-affected soils, which in turn resulted in reduced ECe values. The
surface-soil ECe of the School line soil series (Guptapara) went from 11.2 to 6.8 dS m–1
, and a
similar trend was observed in the Dhanikari series. In the Mithakhari, Loha Barrack, and New
Manglutan surface soils (Thushnabad series), the ECe decreased from 34.4 to 14.1 dS m–1
, from
20.2 to 9.4 dS m–1
, and from 7.6 to 4.5 dS m–1
, respectively. Similar trends were observed in the
subsurface soils. The reason is leaching of soluble salts by high rainfall of the 2005 rainy season
(3774 mm, greater than the average rainfall of 3075 mm). These results were in tune to other
studies conducted in the region (Ghosal Choudhary, 2009; Ghosal Choudhary et al., 2009; Nayak
et al., 2009; Rajat et al., 2009).
After two rainy seasons, there was a drastic reduction in soluble salt concentration of tsunami-
affected agricultural lands. The surface soil ECe ranged from 3.9 to 8.3 dS m–1
, and the
subsurface soil ECe ranged from 3.7 to 7.6 dS m–1
. The soil pH was also approaching the pre-
tsunami level in most cases. It appears that the construction of low barriers (bunds) along the
shore has prevented the entry of seawater into agricultural lands. However, this has also resulted
in stagnation in many places, for which interventions are required. Water samples collected
immediately after the tsunami showed contamination of both wells and ponds by seawater, with
ECe ranging from 2.3 to 11.8 dS m–1
from chlorides and sulphates of sodium. However, the level
has reduced after one rainy season. The ECe level has further decreased after two rainy seasons,
and in most places it is below 2 dS m–1
. Methodologies for reclaiming saline and saline-sodic
soils after irrigation in arid and semiarid regions may not be suitable for the Andaman and
Nicobar Islands. In the Andamans, the analytical results revealed that the 2Na+/Cl
– + SO4
2– and

9
CO32–
+ HCO3–/Cl
– + SO4
2– ratios were less than one. Thus, application of amendments like
gypsum is not required, and leaching through rainwater impoundment alone will be effective in
reclamation of the tsunami-affected agricultural lands. Construction of raised embankments
along with sluice gates to regulate the ingress of seawater in these areas will improve the
productivity of degraded natural resources by restricting the entry of seawater into the field
during high tide and allowing drainage of rainwater that may collect during the rainy season
during low tide.
Technological Interventions for Managing Degraded Natural Resources
A sea dyke along with a self-operated sluice structure was constructed to arrest intrusion of
seawater into agricultural land. Once the ingression was stopped, three interventions were made
in the area to enhance productivity.
Raised Beds
Seven farmers’ fields were selected and converted into cultivable land by the raised bed method.
Raised beds 1 m wide and 0.3 m high were created after field preparation (Figure 9). Chopped
coconut husks (Figure 10), followed by soil mixed with compost, were applied before planting
crops of high-value vegetables. The raised beds facilitated survival of vegetable crops against
heavy rains as well as rising seawater. An average net profit of about Rs 50,000 to 75,000 was
recorded from a 1 ha area. This technology also helps in increasing the soil microbial content and
pH. The coconut husk serves as a rich source of potash on decomposition, which was aided by a
fortnightly spray of glyricidia liquid manure.
Broad Bed and Furrow System
Vegetable and fodder production have been hampered by a shortage of land after the tsunami and
excess rainfall during the rainy season (June–December). Other major problems for vegetable
production are extensive damage by giant African snails, bacterial wilt, and water shortages.
Broad bed and furrow (BBF) is a technique for growing vegetables and fodder in the midst of
rice fields while managing salinity and harvesting water in furrows for dry season vegetable
production. It involves the use of alternating broad beds (4 m wide, 1 m high) and furrows (6 m
wide, 1 m deep) to provide drainage for vegetables and standing water for rice. The BBF system
permits fish rearing in the furrows and fodder crops on the beds, both of which help to include
animal components in the agricultural system. Net returns of Rs 62,000/ha were obtained in the
first year. In the second year, income of Rs 117,000/ha was recorded from sale of vegetables,
rice, and fish. Due to the initial cost of BBF, the return in the first year was low. Cropping
intensity and cultivated land utilization index (CLUI) were 100% and 0.38, respectively, before
the tsunami and almost zero afterward. However, after this intervention, cropping intensity
increased to 300% in beds and 200% in furrows, and the CLUI was 0.78. Moreover, the
harvested water in the furrows was available for irrigation during the dry season. The income

10
from the intervention was much higher due to the high value of vegetables during the monsoon
season.
Brackish-Water Based Integrated Farming System
Affected land was also converted to brackish-water aquaculture ponds using spillways to
regulate the entry of seawater. Along the dyke were planted crops such as spinach, amaranth,
okra, bitter gourd, bottle gourd, and pumpkin (Figure 12). Sweet potatoes were also planted
along the slopes of the dykes. Plantation crops of coconut, banana, and morinda have been
planted. Fodder slips of hybrid napier and para grass were planted along the sides of the ponds.
Apart from the income from fish, the crops on the embankments yielded an additional initial
income of Rs 2000 from fruits and vegetables in one year. The native fodder on the inner and
outer slopes of the embankments was identified as a variety of buffalo grass whose palatability
and nutrient analysis suited it for feeding to cattle and goats. This intervention produced a
considerable increase in income from fields that were almost completely destroyed by the
tsunami. Morinda and coconut crops on the embankments will provide long-term income.
Situation II: Temporary Submergence
Assessment of Soil and Water
The pH of surface soil (0–15 cm) under situation III varied between 4.7 and 6.8, and ECe ranged
from 7.2 to 22.9 dS m–1
, which indicates that the tsunami caused severe changes in pH and
soluble salt content. Sampling revealed that in all soil series, the surface soil had become saline
while the subsurface soil (15–30 cm) had smaller amounts of soluble salts, clearly indicating that
seawater intrusion during the tsunami did not affect the subsurface soil. Distance from the
seashore and inherent soil salinity may also account for part of the variation in soluble salt
concentration in different locations.
Surface Soils
In the tsunami-affected areas, soil pH (6.93) was slightly higher than in unaffected areas (6.35).
Coastal areas were mildly alkaline to slightly acidic and became more strongly acidic away from
the coast. Among the three soil series studied, Dhanikhari soils, which are developed on coastal
marshes and are strongly acidic, became neutral to alkaline after the tsunami. EC increased in the
tsunami-affected areas (17.89 dS m-1
), with greater variability (S.D. = 6.31), than unaffected
areas (5.27 dS m-1
). Dhanikhari series was found to have the greatest variability (6.68–33.2 dS
m-1
) of the three series studied. ECe was higher in affected areas of Wandoor and Dhanikhari
series soils, which might be influenced by the duration of flood, soil texture, drainage, and other
factors. The correlation (r = 0.173) between the spatial distribution of ECe and the duration of
flood was not significant, but in gently sloping to flat lands toward the coast, ECe increased with
duration of flood.

11
Sodium adsorption ratio (SAR), a measure of the relationship between soluble sodium and
divalent cations (calcium + magnesium) in soil, indicates the degree of soil deterioration. SAR
was 2.69 in the unaffected areas and 19.14 in the affected areas. Among the three soil series
studied, Dhanikhari had the highest SAR values (6.48–48.18), followed by Wandoor and School
line. There was no significant pattern in the spatial distribution of SAR in the affected areas. The
excessive concentrations of sodium in the soil may create sodicity problems leading to structural
deterioration and poor infiltration.
Subsurface soils
Soil samples were collected from different depths (0–25, 25–45, 45–60 cm) and analyzed for pH,
ECe, and SAR in affected and unaffected areas. In all the soil series, the soil pH increased from
surface (0–25 cm) to subsurface (45–60 cm) levels in both affected and unaffected areas. The
soil pH was acidic (0–60 cm) in all three soil series from unaffected areas. However, neutral to
slightly alkaline pH was observed in the tsunami-affected areas of School line soils at 45–60 cm
depth. In general, surface soils had higher ECe than subsurface soils, except unaffected School
line soils, where ECe was higher in the subsurface. The vertical distribution of pH and ECe
indicated that the Dhanikhari series is a potential acid saline soil. This has a profound influence
on the availability of nutrients at the root zone and the distribution of microflora and microfauna
in the soil profile.
Total dissolved solids (TDS) were higher in the surface soils of the Dhanikhari series than in the
Wandoor and School line, due to its finer soil texture that affects the rate of infiltration. Sodium
toxicity to plants was severe, and the effects of Na on soil pH and structure were significant. In
tsunami-affected soils, SAR increased and varied significantly at the surface soils of the three
series. Wandoor soils recorded the highest SAR of all, and this higher sodium content might
underlie the impeded drainage conditions after the tsunami.
After one rainy season in situation III areas, there was appreciable reduction in soluble cation
and anion concentrations in all soil series, which in turn resulted in reduced ECe values.
After two rainy seasons, surface soil ECe ranged from 0.6 to 5.9 dS m–1
, and the subsurface soil
ECe ranged from 0.4 to 5.3 dS m–1
. The soil pH was also approaching the pre-tsunami level in
most cases. After two rainy seasons, in most places it was below 2 dS m–1
. Hence, agricultural
lands in this situation can be easily reclaimed by high annual rainfall that can effectively leach
out the accumulated salts.
Technological Interventions for Productivity Enhancement
Natural resources were not damaged significantly temporary submergence; hence, interventions
were made to increase productivity to compensate for losses in other situations. These are
described in this section.

12
Impact of Tsunami on Rice Yield
In South Andaman, traditional rice varieties (C 14-8) are very common and high-yield varieties
(HYV) (BTS-24; Sumathi; CSR7-1) occupy nearly 20% of the area planted to rice
(Balakrishnana et al., 2006). Grains of the variety C 14-8 present at the time of the tsunami were
collected and analyzed for various quality parameters. Grains that were submerged in seawater
became softer in consistency and had cooking times up to 15 minutes shorter than the control
rice. There was no significant difference in yield between traditional varieties and HYV before
the tsunami; however, traditional varieties had higher variability and lower yield than HYV in
the affected areas. This indicates that HYV adapted better than the traditional varieties in the
affected areas. Rice yield was 59% of that in unaffected areas where the tsunami damage was
estimated to be severe after one rainy season. Reduction of 37% was observed in areas
considered moderately affected. The higher standard deviation (0.44) for moderately affected
areas indicates that localized distribution of salts causes a wide variation in rice crop
performance in these areas. Hence, the spatial variability of reduction in rice yield seems to be
correlated with the spatial pattern of SAR and ECe in the tsunami-affected areas.
Mat Nursery and System of Rice Intensification
The mat nursery technique was demonstrated in the adopted villages (figure 13) for the first time
in the Andaman and Nicobar Islands. Various paddy varieties (Taichung-sen-Yu and Quing
Livan No. 1 in normal soil, BTS 24, SR 26B, and CST 7-1 in problem soil) were raised in a flat
field as a field demonstration for the benefit of the farmers. The System of Rice Intensification
(SRI) was applied under this project using Taichung-sen-Yu, Milyang 55, BTS 24, and Nanjing
varieties. The critical stage is the first 20 days after transplanting, when seedlings are vulnerable
to damage by continuous rainfall. The mat nursery technique yielded a savings of Rs 1600/ha in
field preparation and seed costs compared to conventional nursery preparation. The SRI method
produced significantly higher yields (3.95 t/ha) than conventional planting methods (2.00 t/ha).
Crop Diversification
Crop diversification with vegetable and fruit crops was the main technological intervention in the
affected villages. Vegetables like spinach, coriander, chillies, capsicum, and French beans were
introduced in the appropriate seasons using varieties that had already been developed and
screened in research farms. These varieties performed well in the farmers’ fields (Figure 14) with
the proper management practices and organic substitution of nutrients.
Freshwater Pond Based Integrated Farming System
Existing freshwater ponds were augmented by others constructed by the government for tsunami
rehabilitation. An integrated farming system was adopted to fully utilize this resource. Pond
embankments were used effectively to grow crops like coconut, arecanut, banana, and papaya
along with vegetables like pumpkin, bitter gourd, and others (Figure 15). Fodder crops, whose
scarcity was a major constraint in the milk production system, were introduced on the inner and

13
outer slopes, which also protected the ponds against erosion. Poultry was introduced as an
additional income source over the ponds, and droppings were utilized as the manure source for
crop plants. It is evident from Fig. 4 that income from the land area in situation III increased
significantly from Rs 12,860 to Rs 31,280 in one year from a 1500 m2 pond.
Participatory Water Resource Development
Irrigation facilities are a major constraint in island agriculture. With this in view, water resources
were developed using a combination of recharge structures and open dug wells. A series of
gabion structures were emplaced across a stream to enhance groundwater recharge, and open dug
wells 2 m in diameter were dug along the stream to harvest the recharged water. To involve
stakeholders in water resource development and management, a Water Users Association was
formed by farmers with active support of the research team. The purpose of the association was
to involve farmers in creation and management of the irrigation facilities, inculcating a sense of
ownership of the assets created (Srivastava et al., 2009 a). The association was registered with
the registrar under the Societies Act. The association performed the following activities:
Farmers participated in the creation and management of their irrigation facilities, along
with other interventions undertaken by the Central Agricultural Research Institute
(CARI).
Members participated in the bidding, and the contract for ring well, gabion construction,
and tank construction was won and carried out by the association with community
participation.
Seedlings of vegetables were raised by youth members in the community nursery and
distributed to other members and other farmers of nearby villages, generating revenue of
Rs 500/month.
The youth wing of the association volunteered for agricultural activities in the village, for
example, sharing of labour charges among themselves.
The concept of selling produce to a middleman was abolished; one member of the
association now sells the association’s whole output directly to retailers.
After three years of persuasion and motivation by the project intervention in the village,
the unemployed youths of Manjeri formed a self-help group under the umbrella of the
Water Users Association.
Impact of Water Resources Development
Crop diversification was introduced using high-value and nutritious vegetables and fruits and
applying scientific methods such as composting technologies, and using pesticides after
irrigation facilities were developed. The area under cultivation before the tsunami during the dry

14
season was 5 ha (29%) out of 17 ha available to the association. This area increased to 12.5 ha
(71%) after creation of water resources (Srivastava et al., 2007, 2009 b).
Conclusion
The interventions changed the entire socio-economic setting of the village. The technologies
introduced have spread. The nutritional status of the adopted village was also improved
(Srivastava et al, 2009 c). The experience leads to the following conclusions:
• The soils of the affected land area became saline due to intrusion of seawater; these salts
are leached by rain and the soil returned to pre-tsunami status without the need to apply
any amendments. However, reclamation can be hastened by strengthening bunds for
storing rainwater.
• It was possible to restore agricultural livelihoods with suitable technological interventions
compatible with the farming system.
• Where cultivated land was lost (situation I), the farming livelihood could be restored
through introduction of livestock based systems. Suitable measures should be taken to
introduce quality livestock and improve productivity of existing livestock through better
management practices.
• For situation II (partial submergence), the productivity of available natural resources can
be restored by arresting seawater intrusion using sea dykes and self-operated sluice gates.
• Interventions and management practices developed for natural resources in situation III
(temporary submergence) can lead to enhanced production and productivity that
compensate for land lost to permanent inundation.
• The integrated agricultural technological intervention model applied in the Andaman
Islands after the 2004 tsunami can be used to manage natural resources and agricultural
livelihoods after similar kinds of disasters.
The impact of interventions was recognized by Government of India and it was included in 101
success stories selected from all over India depicted in Coffee Table Book of Ministry of
Agriculture & Cooperation of Government of India (Srivastava et al., 2009 d).
***
15
Development of Micro-Water Resources for Enhancing Agricultural
Productivity in Cyclone Affected Areas
Dr. Susanta Kumar Jena (Principal Scientist) & Dr. Narayan Sahoo (Retd. Principal Scientist)
Directorate of Water Management (ICAR), Bhubaneswar – 751023, Odisha
Increasing agricultural production, improving agricultural productivity and conserving and
managing natural resources through intellectual capital combined with people's effort and
appropriate technology, would bring food security, improve standard of living, promote income
generation, ensure poverty alleviation and production of market surpluses (Sahoo et al., 2003).
These have a very high relevance in the coastal area, recurrently affected by cyclone and flood.
The super cyclone, which had hit coastal Odisha, caused considerable damage to agriculture and
allied enterprises. Besides, after deluge of water in the monsoon season and a huge wastage of
surface water (Sen etal., 2000), the crops suffer from drought during winter. In addition to this,
the coastal area very near to sea (0-10 km) faces problem of salinity also, severely limiting the
scope of its use for irrigation. Construction of deep tube wells to draw good quality water is
feasible, despite certain geo-hydrological constraints, but has not been taken up adequately due
to economic reasons.
On an average for Odisha, 663 mm rainfall is in excess during the monsoon and may be utilized
for irrigation during second crop, provided it could be properly stored. In this context, there is a
good scope of expansion of area under micro water resource development by creating integrated
farming system units as well as sub-surface water harvesting structure.
DWM had taken the land modification technology for micro water resource development in
Satakabat village of Biswanathpur in Khurda district after the super cyclone. The total
waterlogged area was 2212m2. Two ponds of size 600 m
2 and 1022 m
2 were constructed and the
excavated soil was spread around in an area of 590m2. The height of the raised bed was 1 m
above the surrounding field level. The idea of constructing two ponds was to rear fry in small
ponds for about two months and then release fish in big pond at fingerling stage. A space of 553
m2 was provided for cultivation of vegetable crop both in kharif and Rabi. During Rabi season,
the performance of different vegetable crops such as ladies finger and tomato was good in low
lying areas. The increase in yields in the raised bed cultivation system was 20 to 40 percent more
than that in the prevailing low land cultivation system for different crops. This was due to timely
plantation of the crops in the raised bed and protective irrigation using pond water which was
maintained by pumping from bore well during Rabi and summer season. In the low lying land
rabi crop production has a setback due to delayed planting caused by excessive soil wetness for a
significant part of post monsoon season and scarcity of irrigation water.

16
Table 1. Yield and Economics of pond and raised bed system*
Season Crop Crop yield
(q)
Gross
return (Rs)
Cost of
cultivation (Rs)
Net return
(Rs)
Kharif Ladies finger 2.08 2496.00 543.00 1953.00
Brinjal 3.00 3000.00 271.00 2729.00
Rabi Tomato 1.20 1200 302.00 898.00
Ladies finger 2.08 2496 543.00 1953.00
Summer Chilli 2.00 1800 1357.00 443.00
Bund
plantation
Pumpkin 0.50 200 50.00 150.00
Papaya 3.00 900 150 750.00
Banana 9 bunch 1350 81 1269.00
Cowpea 0.5 250 15 235.00
Leafy
vegetable
0.05 50 10 40.00
Pond Bitter gourd 0.62 620 35.00 585.00
Fingerling 1200 nos. 1200.00 450.00 750.00
Big fish 0.75 3150.00 950.00 2200.00
*A space of 183 m2 for vegetable and 224 m
2 for bund vegetables and 90 m
2 for scaffold was
earmarked. The study was initiated in 2001.
The study of comparative economics between pond cum raised bed system and low-lying
adjoining land reveals that benefit cost ratio (B: C) in the improved system is 2.45 where as in
the low lying system (original condition) it is only 0.7.
The other land modification technology is complete conversion of the low land into pond and
dyke system. It was developed in Khentalo village of Nischintakoili block in the district of
Cuttack. The total area of the system (2.47 ha) consisted of 1.5 ha swampy area and rest 0.97 ha
waterlogged area which was being cultivated with long duration variety of local paddy (yield 1.1
t/ha). Out of 2.47 ha of low productive swampy waterlogged low land, a pond was constructed in
1.64 ha and the dug out earth was put in the bund to raise it for horticultural crops. The bund area
was 0.83 ha. The width of bund in north side was 21 meter and 10 meter each in east, south and
west side. The pond dimension was 195m x 84 m. The depth of pond was 2 m.
The details of year-wise input and returns from the pond as well as bund system (integrated
farming system) are given in Table 2.

17
Table 2. Economics of integrated farming system
Year A: Input cost (Rs) B: Gross return (Rs) Net
return
in
rupees
(B-A)
Net
return
in
Rs/ha
Pond
construc
tion &
infrastru
cture
Hortic
ulture/
vegeta
ble
seed,
fertiliz
er etc.
***
Fish
and
prawn
seed
Fish
feed
Labo
ur
Miscel
laneou
s. *
Total in
rupees
Fruits &
Vegetab
le
Fish &
prawn
Coconu
t
Poultr
y **
Total in
rupees
1988 1,23,91
0
(excavat
ion)
- - - - 20,000 143910 - - - - - -
1989 - 12600 12000 28730 14000 13000 80330 110400 70100 - - 180500 100170 40,554
1990 - 12000 14700 29750 14000 13500 83950 114000 88000 - - 202000 118050 47,793
1991 - 12000 16400 31200 14000 14800 88400 98600 96750 - - 195350 106050 42,935
1992 - 10400 18000 36900 17500 14500 97300 44000 17280
0
30000 - 246800 149500 60,526
1993 - 8700 23000 42850 17500 16000 108050 42800 19900
0
45000 - 286800 178750 72,368
1994 - 8900 28300 48700 17500 19000 122400 46000 26920
0
48500 - 363700 241300 97,692
1995 - 7500 30100 54225 21000 30500 143325 52100 32970
0
59000 - 440800 297475 1,2043
5
1996 - 3200 33200 64650 21000 28600 150650 47200 34500
0
76900 - 469100 318450 1,28,92
7
1997 - 2850 35500 81000 24500 29000 172850 35450 37240
0
93250 - 501100 328250 1,32,89
4
1998 130000
(stone
lining)
2900 48900 86800 28000 23000 319600 48300 38390
0
105000 - 537200 217600 88,097
1999 320000
(poultry
shed)
3000 53100 69500 28000 38000
0
753600 14000 21820
0
80500 32400
0
636700 (-)
116900
(-)
47,327
2000 - 2660 42200 92000 17500 31000 185360 1300 24950
0
2400 - 253200 67840 27,465
2001 - 2550 58700 10600
0
17500 34550 219300 12900 54100
0
6000 - 559900 340600 1,37,89
4
2002 - 2500 69615 15640
0
17500 42580 288595 23000 61716
0
10950 - 651110 362515 1,46,76
7
Grand Total on 15 year basis 29,57,6
20
55,24,2
60
25,66,6
40
10,39,1
25
*Miscellaneous includes lime, cow dung, pumping, irrigation system, masonry work etc.
**Poultry was added in the year 1999
*** Horticulture including banana, papaya, pineapple, mango, areca nut etc.
18
Average net return per ha per year on 15 year basis from IFS = Rs. 69,275
The system suffered loss only the year 1999 to the tune of Rs 1,16,900 due to devastation caused
by super cyclone (Table 2). Further the impact of cyclone affected the net return in the
subsequent year 2000 in which the net return was only Rs. 67.840. The net return was Rs,
1,00,170 in the first year of operation of the system, which has enhanced to the maximum of Rs.
3,62,515 in the year 2002. The comparative net return from the IFS was in the tune of Rs. 70000
and rice cultivation was around 5000 rupees per hectare per year.
Improvement of Capacity of Natural storage of drains
In lowland, there are many localized pockets which are completely unfit and unsuitable for
growing rice. Sometimes the water depth reaches more than2 m. In those cases, the storage space
should be reconstructed and made further deep during summer season, to receive more water.
This will help adjoining lands to moderately suffer from drainage congestion. Such pockets are
there in Gobari Doab in Kendrapara and Rajnagar area. Even in the Chilika lake region, the
coastal areas are silted up, due to which lowland drainage waters could not be discharged. Tanks
in the lowland area should be deepened to store more water as in case of Puri, Ganjam, Balasore
districts of Odisha.
Sub-surface Water Harvesting Structures (SSWHS)
In the coastal saline area (0-10 km from sea) there is a large patch near the Hansua creek
traversing adjacent to Erasama block of Jagatsinghpur district. This waterlogged patch varies
from 10-15 km in length and 5-7 km in width. Huge amount of water is stored in the sandy zone
present up to 5-l 0 m below the ground level. Water table in the area rises 0-1.5 m above ground
level during monsoon and declines to 1-2 m below ground level during post monsoon season.
The depth of saline water table due to ingress of sea water varies from 3-7 m below ground
surface and fresh water due to of rainfall floats above it. This fresh water can be harvested for
irrigation and fish production (Sahoo et al.,2004).With this background, our institute (DWM) had
developed a design for sub-surface water harvesting structure (SSWHS) in the form of excavated
tank. Tanks have been constructed in the super cyclone affected area on participatory basis to
make the project sustainable. In this system small SSWHS were constructed up to a depth of 3-4
m or less to harvest surface water in the rainy season and to harvest sub-surface seepage water in
the rabi season.This structure will provide water for raising paddy nursery in June and will
irrigate additional area during rabi as well as in summer. It can also be used for aquaculture and
other crops. This system has been found very effective in providing assured irrigation. As,
neither the individual resource poor farmers nor the government can bear the full cost, a
participatory approach with the involvement of the farmers group under coastal area
management programme could be successful to ensure sustainable water resources development.

19
Selection of Site
This system can be installed at any place nearer to the creek and where a sand zone is found
underneath within 10m below ground level. This zone is locally called Bellary in Odisha. In
Paradip and Erasama zone, this type of land is available in a vast stretch of areawithin5-l0 km
from the sea. There should be arable land and habitation nearby for taking up farming in both
kharif and rabi seasons. Seepage rate should be more than 10 mm/day and a clayey zone should
exist below the surface till the first 3-4m.
Design and Construction of Sub Surface Water Harvesting Structure.
The design of the SSWHS depends upon the expected rate of inflow/seepage. If the rate of
seepage is high, then the area of tank is reduced and vice versa. The recuperation rate by
pumping test at different sites in 556m3 to 899m
3 tanks varied from 1.58 m
3/h to 4.07 m
3/h in
sandy zone and from 1.01 m3/h to 3.4m
3/h in clayey zone. Capacity of structure may vary from
200m3 to 1500m
3. The depth of structure may also vary from 2-4 m.
Participatory Approach
To make the project sustainable, a participatory approach was adopted. After selection of a site,
irrigation user group was formed around the site. Each group member was advised to pay a small
percentage of the cost of the project either through labour or cash or material. In the first year it
was decided for the irrigation user group to pay40% of the cost of the project. The initial
hesitation of the farmers to participate was overcome by seeing the successes of one of the
farmer with this participatory approach and several such farmer's groups were formed in
different cyclone hit villages of Ambiki Panchayat. At the site, layout of the structure was
marked in two parts (60% & 40%) and the group was asked to complete40% work first. For
example for a 30m x20mx2m structure layout is given for 30m x 8m x 2m for the farmer group
to complete and then project functionary comes forward to complete the remaining
30mx12mx2m earthwork through the same user group by providing wages. By this the group
feels their ownership in the project. For subsequent repair and maintenance, they take care of the
entire expense. In the 2nd year, seeing the success of the project the subsidy was reduced from
60% to 33%. Still 13 irrigation user groups were formed in 7 different villages. The procedure of
construction remained the same.
Performance and Economics of the System
A properly designed and constructed sub-surface water harvesting structure based on the above
principle will mitigate the early drought in the kharif season and provide irrigation during the
rabi and summer seasons. The evaluation of such a system has shown its effectiveness in dealing
with early drought in kharif and an area of 8.8ha was saved. The details of the structures are
given in Table 3.

20
Table3 . Detailsofthefarmers in Erasama block, capacity and cost of the tank (2001).
Name of the Head of the
farmers’ group and
address
capacity
(m3)
vol. of
earth
work
(m3)
Total
cost,A
(Rs.)
Farmers’
share
(40% of
A)(Rs.)
Project
share
(60% of
A)(Rs.)
Area
saved
(kharif,
2002)ha
No. of
farmers in
the group
Sh. M. Mandal,
Baghadi
1287.4 865 17733 7093 10640 2.4 11
Sh. Puspak Nayak,
Baghadi
899.0 737 15110 5044 9066 2.2 10
Sh. Subal Behera,
Kiyada
1011.5 665 13646 5458 8188 2.2 10
Sh. Sunil Samal,
Chaulia
1571.0 793 16255 7541 11313 2.6 17
Sh. Sabyasachi Jena,
Kiyada
1152.3 741 15200 6080 9120 2.4 11
Sh. Babaji Pradhan,
Ambiki
556.2 365 7490 2996 4494 1.9 6
Sh. Srikanta Rana,
Ambiki
779.0 361 7409 2964 4445 3.1 6
In this table it is seen that capacity has increased in different proportions in comparison to
volume of earth work (Rs.20.50/m3 of earth work in 2001) in different groups due to varying
nature of soil at different sites.
The irrigation rotation schedule was developed for the group both for kharif (for paddy nursery
in case of drought) and for rabi vegetable and pulses. Area irrigated during rabi was 27.9 ha for
71 farmers whereas area irrigated in summer is only 2.3 ha for 11 farmers. The total income from
the paddy and rabi crop for each SSWHS was determined from crop harvest. The total amount of
fish captured from each SSWHS was determined and the income from fish varied from Rs.
3000toRs. 17,600. Income from fish per cubic meter capacity of SSWHS varied from Rs. 2.96 to
Rs. 12.23. Generally, as the capacity increases the income from fish also increases. The total
income from SSWHS varied from Rs. 12.93/m3capacity to Rs. 47.201m
3capacity in the first year
itself. Low income from crop is sustained by high income from fish as the SSWHS is being fed
continuously by sub-surface seepage water in coastal waterlogged area. The total income from

21
SSWHS with respect to cost of construction varied from 0.98 to 3.43 in the first year itself. In the
2ndyear 13 irrigation user groups was formed when the farmers participation was up to 67%of
the project cost. The performance index is given in the Table 4. Benefit cost ratio for the initial
years is calculated on the basis of net benefit and cost of construction of the SSWHS. This would
increase in subsequent years when bund plantation would yield benefit.
Table 4. Economics of sub surface water harvesting structure (*)
Name of the
Head of the
farmers’ group
Cost of
SSWHS
(Rs.)
Kharif Rabi From
fish
Total Total
expenditure
(Rs.)
Net
benefit
(Rs.)
B.C.
Ratio
Crop
intensity
(%)
Sh. M.
Mandal,
17733 9000 37250 14600 60850 20050 40800 2.3 177
Sh. Sunil
Samal
16255 8000 24650 17600 50250 16570 33680 2.07 182
Sh. Puspak
Nayak
15110 5000 21300 11000 37300 12130 25170 1.66 192
Sh. Subal
Behera
13646 9000 19650 3000 31650 10650 21000 1.53 132
Sh. Srikanta
Rana
7409 2500 11770 4950 18220 6735 11485 1.55 190
Sh. Babaji
Pradhan
7490 3000 8900 4300 16200 5315 10885 1.45 185
Sh. Sabyasachi
Jena
15200 5000 61000 3800 14900 4675 10225 0.67 175
*two years after super cyclone (2002-2005)
IFS in coastal waterlogged area
One experiment was under taken in 1.75 ha of low lying area, which suffered water logging
located in Khurda district and susceptible to cyclone. During monsoon the depth of ponding
water was more than 50 cm and during driest period (May) of a year the water table was varying
between 50-150 cm below ground level. The water quality was good and only paddy was grown
in kharif in some years with 0.5 t ha-1
average yield. The soil was acidic with low available
nutrient and iron toxicity was present. The land was only suitable for ploughing during May and
early June and high water table restricted growing of any other crop during rabi season. The
22
hydrologic data analysis resulted the design dimensions of the three ponds in series which were
27 m x 27 m, 30 m x 30 m, and 34 m x 34 m at the top with 2 m depth and side slope 1:1. The
excavated soils were spread around the pond to elevate the surrounding area so as to keep the
water table below 2 m from ground surface. Hume pipes of 30 cm diameter and 4 m length were
used as inlet and emergency outlet of the pond. Since the objective of the study was to store
excess water for reclamation of waterlogged area, the area of the ponds are kept within 20 to
25% of the total area considering the water balance component of the study area.
Design and construction of three micro water resources covering water surface area of 625 (P1),
785 (P2) and 1025m2 (P3) was completed in March 2006. Treatment implementation and
stocking of fish fingerling (Magur, 12.2g MBW) was done as the first crop. Population density
was maintained at 1200, 2100 and 1700 for P1, P2 and P3 respectively. In this experiment,
average growth performance of Magur was highest inP1 (163.5g) followed by P3 (141.0g) and P2
(130.5g). In this crop Yield of fish ranged between 1632-1710kg/ha/ 200days, SR%- 61-64.75,
FCR- 1.39-1.47, PDI– 0.595-0.623.
Indian major carps (IMC) was taken as second crop and released during 4th
week of August
2007. All growth parameters were undertaken regularly. The catla has recorded a maximum
growth in comparison to rohu and mrigal. As age of the pond increased the quality of water
improved as the sides of the bunds have been stabilized, hence IMC was undertaken in place of
magur to reduce the input cost and preference in market.
Under on-dyke horticulture activities, there were 114 papaya, 89 banana, and 16 coconut plants
around 1st pond, 69 banana, 9 papaya and 4 coconut plants around 2
nd pond and 70 banana plants
were planted around the 3rd
pond. Besides another 90 banana plants were planted in adjacent
area. The different varieties of tissue culture banana planted are G-9, Bantal, and Robosta.
Papaya variety was “farm selection”.
In the first year under on-dyke horticulture activities vegetable such as bottle gourd in 386 m2
area (7.8 t/ha), tomato in 252 m2 area (2 t/ha) and brinjal on 66 m
2 (1.52 t/ha) were taken up.
Different varieties of paddy such as Khandagiri, Swarna, CR-1009 and Surendra were grown in
four different plots showed average yield of 2.72 t/ha.
In 2nd year, 220 bunches of banana were harvested. Different varieties of paddy such as
Khandagiri, Swarna, CR-1009 and Surendra were grown in four different plots. During kharif
the yield of Khandagiri was 2.1 t/ha, Surendra gave 3.2 t/ha and Swarna showed average yield of
2.7 t/ha. During rabi Khandagiri paddy gave a yield of 2.3 t/ha. Different vegetable were taken
as on-dyke horticultural activities as well as intercrops such as brinjal (6.25 t/ha), cowpea (1.5
t/ha), Bean (2 t/ha), ladies finger (4.9 t/ha) and 200 kg of bottle gourd was also obtained.
23
Conclusion
From the above studies, it is established that micro water resources are to be developed in coastal
areas which is experiencing regular cyclones, so that in case crops fail due to cyclone, the
aquaculture in the pond and the water stored in the pond would be used for rabi and summer crop
cultivation for enhancing the livelihood options of the rural poor. In favourable geo-hydrologic
condition where fresh water floats above saline water with an impervious clay interface, sub-
surface water harvesting structures are to be undertaken. Also for sustainability of a system,
farmer's participation is essential. Farmers’ paying capacity must be increased from the system to
make it sustainable in the long run. Mere distribution of seed, fertilizer, planting material has not
helped much and after the withdrawal of the technology adoption reduced drastically.
Participation of farmer by paying 40% of the cost of SSWHS on the 1st year and 67% of the cost
in the 2nd year gave them the ownership feeling and they do not take it as government donation
or work. Since the system worked with cyclone ravaged poor people successfully this will also
work in all coastal areas. This gives a new insight for development of small scale water resources
in coastal areas.
***

24
Integrated long term management plan for cyclone risk mitigation
Dr. R. K. Panda
Principal Scientist
Directorate of Water Management (ICAR), Bhubaneswar – 751023, Odisha
Indian coasts are highly vulnerable to tropical cyclones and consequent recurrent loss of life and
property. As the tropical cyclones are caused by atmospheric disturbances around a low-pressure
area distinguished by swift and often destructive air circulation, these are usually accompanied
by violent storms and bad weather. The World Meteorological Organisation uses the term
'Tropical Cyclone’ to cover weather systems in which winds exceed ‘Gale Force’ (minimum of
63 kmph). In addition to strong winds and rain, tropical cyclones are capable of generating high
waves, damaging storm surge. They typically weaken rapidly over land, where they are cut off
from their primary energy source. For this reason, coastal regions are particularly vulnerable to
damage from a tropical cyclone as compared to inland regions. Heavy rains can cause significant
flooding inland and storm surges can produce extensive coastal flooding up to 40 kms from the
coastline. Their effects on human populations are often devastating. The major Tropical cyclones
which struck the coastal districts in Odisha during the period 1891-2006 are Balasore (32),
Cuttack (32), Puri (19), Ganjam (15) total amounting to 98 numbers. Recognizing this, the
Government of India has considered the hazard risk mitigation approach through short term and
long term management plan, which lays greater emphasis on prevention, preparedness and
mitigation. The high vulnerability coastal states to this calamity are Andhra Pradesh, Gujarat,
Odisha, Tamil Nadu and West Bengal.
Strategic mitigation options
Broad risk mitigation strategies available and applicable to all the coastal hazards can be
classified into three main types namely; protection, accommodation and retreat. These strategies
include both structural and nonstructural measures. Structural measures refer to any physical
(natural or artificial) construction to reduce or avoid possible impacts of hazards. Structural
measures can range from engineering structures that are added to the landscape to protect from
hazards. Non-structural measures refer to policies, regulations and plans that promote good
coastal management practices to minimize risks from coastal hazards. Education and outreach
campaigns that increase the public’s awareness of risks, vulnerability and preparedness responses
can be considered as non-structural measures.
“Protection” involves the use of natural or artificial measures to protect landward development.
Traditionally, protection against coastal erosion, flooding, storm surge and tsunami inundation
has been approached through mitigation by hard structural response. Examples of common
protection measures include constructing groynes, seawalls, offshore breakwaters. In some
25
heavily populated areas susceptible to storm surges, dykes, levees, dams, and flood gates have
been built to protect coastal communities during extreme sea-level events.
Multi-pronged approach
As no single approach will be able to address the community’s vulnerability to hazards, a multi-
pronged most effective approach is required to reduce the risks, incorporating protection,
accommodation and retreat options to handle the cyclone risk. Once an overall strategy is
identified, comprising protection, accommodation, retreat or a combination thereof, specific
measures are applied to handle the hazard. Selection of specific measures will depend on a wide
variety of factors including: the hazard(s) being addressed; the geographical scope and level of
development of the area to be managed; priorities identified through the vulnerability and risk
analyses; the timeframe that is being addressed; the existing and potential capacity of the
community (e.g., funds, expertise, administrative capacity); and the political, legal and socio-
economic context.
Lessons learnt from Phailin
Let us recall the success story of the recent cyclone “Phailin” that hit Odisha and Andhra Pradesh
coast of India. The coordination was prompt and organised in case of Phailin in comparison to all
major cyclones that hit the east coast - Aila, Thane and Nilam since 2009. In case of phailin have
the loss to human life was minimal. Odisha proved that what is required to face natural
calamities is perfect coordination between the Centre, State and several Government agencies,
and trained personnel, apart from political will. About eight lakh people were evacuated to safer
places. Odisha has developed a system of communicating cyclone warnings through mass media,
public address systems and religious places. This was made possible because of accurate
forecasts from the Indian meteorological department. Not only the Indian prediction on the
strength of the cyclone proved right but also the cyclone path was accurately predicted. Within
hours of the cyclone striking Odisha, relief workers were in action. Not only did they help
contain damage to property and life, they also ensured that the evacuated people were returned to
their homes after the cyclone had passed. What is heartening is that the loss of life was minimal
against the fury of the terrible storm. Even media played a positive role. Bulletins from the
interiors of Odisha kept people informed as reporters went into the remotest areas. The Odisha
government did not forget to learn from the 1999 incident when a super cyclone killed 10,000
people. Since then, cyclone shelters have been built in possible cyclone hit locations. A strong
lesson emerges from how the cyclone Phailin was handled - when there is a will to do something,
India has the competence, capability and resources. The special representative of the UN
secretary general for disaster risk reduction said, “Odisha’s handling of the very severe cyclone
will be a landmark success story in disaster management”. The UN highlighted Odisha’s efforts
in dealing with cyclone Phailin as a successful case study globally.

26
Long term management plan
The following are the long term plan for extenuating the threat of cyclone.
1. Construction of cyclone shelter
2. Construction / renovation of canals and embankments for improved drainage
3. Shelter belt plantation
4. Construction of missing road links
5. Institutional capacity building and hazard reduction studies
6. Improvement of on-shore warning system
7. Retrofitting of life-line /key /vital installations (roads / culverts / bridges)
8. Awareness generation for cyclone risk mitigation
1. Construction of cyclone shelter
A large number of people in the coastal area do not have access to safe shelters, which could
withstand the fury of cyclone. So studies along the entire coastline needs to be conducted to find
out villages, where people do not have access to safe shelters within a range of 1.5 km and
without having to cross a natural barrier. Cyclone shelters may be constructed in such places to
ensure physical safety of people those who have no access to safe shelters. Livestock need to be
provided with shelter to ensure their sustenance during a disaster.
Therefore, the cyclone shelters should be designed for multi-purpose use such as school building,
community center, or any other public utility buildings so as to ensure that these building are
used and maintained during normal times. For proper maintenance of these specially designed
buildings in hostile terrains communities should have a sense of ownership of these. Therefore,
Cyclone shelter management and maintenance committees may be constituted for upkeep of
these shelters. A corpus fund may be placed with the committee for routine maintenance of the
buildings. The committees may be encouraged to generate funds by collecting fees from people
for using the buildings for social / cultural functions. Designing and building of robust cyclone
proof shelters, which have storage and resting areas sufficiently high above the ground using
corrosion resistant and durable materials need to be addressed.
Design criteria
If the storm- surge level is more than 1.5 m and less than 4.5 m, then the plinth should be taken
as 1.5 meters and the ground floor should be used as stilt with a height varying from 2.5 meters
to 4.5 meters. If the storm-surge level is more than 4.5 m, then, the roof of the first floor / terrace
could be used as cyclone shelter. To make use of the space provided as stilt on the ground floor
the temporary partitions could be erected and concrete benches could be provided, which are
easy to maintain and clean after a cyclone. Rain water harvesting technique could be adopted so
as to make drinking water available to people in the cyclone shelter at the time of cyclone /

27
storm-surge. In general the shelters are in RCC frame with non-load bearing, laterally supported
filler walls and deeper foundation on elevated ground so as to avoid submergence of the main
structure during cyclonic events.
2. Construction / renovation of canals and embankments for improved drainage
In the deltaic areas surface communication is a major handicap for response activities. The
widths of the tidal rivers are linked to the sea tide and may not have a stable embankment. This
makes it difficult to construct bridges on these. An alternative to road communication could be a
coastal canal system. A canal network in the coast would also be an effective tool of water
management.
Besides improvement to minor drains in the coastal areas may be considered for effective
drainage of water, which may include repair and reconstruction of damaged and other vulnerable
flood embankments. Saline embankments protect people, live stocks and agricultural fields from
saline water inundation / storm surge. Hence, there is a need to protect vulnerable areas by
renovating the existing embankments and creating new ones.
3. Shelter belt plantation
Shelterbelts are barriers of trees that are planted to reduce wind velocities and prevent wind
erosion. In coastal areas shelterbelt plantation of Casuarinas is one of the most suitable and
effective alternative to minimize the impact of wind velocity and saline ingress. They also
provide direct benefits to provide shelter to livestock. Main objective of windbreaks and
shelterbelts is to protect the human habitations and agricultural crops. Shelterbelt protects an area
over a distance up to its own height on the windward side and up to 20 times its height on the
leeward side, depending on the strength of the wind. When designing shelterbelt, the direction of
the wind must be considered. A barrier should be established perpendicular to the direction of the
prevailing wind for maximum effect. The trees selected for such salt-breaks must have some
degree of salt tolerance. Species that has been used successfully tried in India include Casuarina
equisetifolia. In the selection of tree or shrub species for shelterbelts, the characteristics like
rapid growth, straight stems, wind firmness, deep root system which does not spread into nearby
field, resistant to drought are considered very important. If there is a Cyclone shelter / building or
a construction projects with ≥20,000 sq. m and <150,000 sq. m of built-up area, it will require
prior Environmental Clearance as per the EIA notification of 2006.
4. Construction of missing road links
Effective road connectivity ensures fast deployment of men, materials and machinery to affected
areas. It helps in ensuring speedy evacuation of people from vulnerable places to safer areas in

28
the face of an impending disaster threat. Thus there is a need for development of a reliable road
network in the vulnerable areas so as to ensure coordination of relief and response in the event of
a cyclone. The link roads to existing cyclone shelters are also very crucial for evacuation of
people. Roads are always associated with culverts and bridges to make them fit throughout the
year.
5. Capacity building and hazard reduction studies
While the hazards due to tropical cyclones cannot be reduced, mitigation strategies to reduce
their impacts can be devised. Mitigation measures like timely communication of warnings, land
use planning, enforcement of cyclone resistant construction etc. go a long way in reducing the
vulnerability of structures to cyclonic impacts and the resulting losses. Assessment of risks to
physical assets is fundamental before devising any successful mitigation strategies or plans. Thus
the institutional capacity building measures need to be emphasized for knowledge updation to
handle the unforeseen hazards.
6. Improvement of on-shore warning system
Early reliable warning is one of the important short term mitigation measures that can reduce the
severity of the cyclone related disasters if acted upon timely. The degree to which this reduction
can be effected will depend upon the accuracy of the warning, the length of time between the
warning’s being issued and the expected onset of the event and the state of pre-disaster planning
and readiness. The public response to warning in the form of correct precautionary action is
another important component for the reduction of loses of lives and properties. It is often seen
that the fishermen out at sea and unorganized weaker section of the coastal communities are
among the first causalities of tropical cyclone disasters. The strengthening of onshore warning
communication system is therefore an important intervention that can save many valuable human
lives.
7. Retrofitting of vital installations (roads / culverts / bridges)
Roads/culverts/bridges in the cyclone prone areas need to be maintained well. If they are in a bad
shape their repair and strengthening works also needs to be given utmost attention. Roads are
always associated with culverts and bridges and routine maintenance of these infrastructures is
crucial for post disaster response. Bridge foundations in alluvial soils lead to deep scour near
some piers when large discharges due to cyclonic storms occur which may result in tilting of
foundations. Where the general road condition is found to be bad their restoration work has to be
accorded high priority. Repair and retrofitting work is a specialized job and requires the use of
special materials and expertise.

29
8. Awareness generation for cyclone risk mitigation
The public awareness programme is an important component of disaster risk management.
Involvement of community under threat is essential for the success of any disaster risk reduction
programme. Prior knowledge about the warning system and its limitations, source of warnings
makes the community better equipped to fight a disaster. Mechanisms like distribution of
circulars, Dos and Don’ts, posters and publicity about precautionary measures through media are
in existence but past experience shows that such actions are not sufficient and more need to be
done. Man to man contact is essential for the success of awareness programme. Such activities
not only to be continued but also these are to be frequent and regular. A well informed awareness
programme involving the community is essential.
Thus a multi-pronged approach is needed to mitigate the risk of tropical cyclone, which shall be
certainly helpful for minimal loss of life and resources.
References:
National Cyclone Risk Mitigation Programme (NCRMP). 2005. World Bank assisted Guidelines
for preparing cyclone risk mitigation investments in states/UTs, Government of India, Ministry
of Home Affairs, National Disaster Management Division, PP 71.
National Cyclone Risk Mitigation Project II (A World Bank Funded Project). 2014. Environment
and Social Management Framework Volume I : Main Report, PP 88.
Hazard awareness and risk mitigation in Integrated Coastal Area Management (ICAM). 2009.
Intergovernmental Oceanographic Commission, UNESCO Headquarters, Paris, France, PP 145.
***

30
Cyclonic disturbances in the eastern India: implications and predictions
Dr. D. K. Panda
Senior Scientist
Directorate of Water Management (ICAR), Bhubaneswar – 751023, Odisha
E-mail: [email protected]
Introduction
The Orissa state of India is the most climate change-affected region due to frequent occurrence
of hydrologic extremes in the recent past (Swiss Re, 2002; Mirza, 2003). The Center of
Environmental Studies (CES, 2007) reported that the erratic behavior of climate of Orissa is
primarily due to the combination of anthropogenic factors such as deforestation, extensive
construction activities, uncontrolled mining, elimination of water bodies and extensive carbon
consumption over a period of time. Further, a minor change in the pressure anomaly of the Bay
of Bengal can have profound hydrological impact on the land mass of Orissa due to its
geographical location at the head of the Bay where the weather forms (CES, 2007). Therefore, it
is imperative to explore the long-term changes in rainfall of the study area and also changes in
the synoptic disturbances.
Methodology
Test of structural changes
Test of structural change is a general form of the Chow test, commonly used in forecasting
(Johnston and Dinardo, 1997). If the parameters of interest in a model differ from one subset of
data to another, then structural breaks or change occurs in that time series. The parametric linear
regression of response variable i.e. rainfall with time (year) can be defined as
y= +X + u
where, y is represents the dependent variable, is the intercept, is the slope, X is the
independent variable year, and u is the random error. This model can be defined in the matrix
form as
y= X + u
y is a vector of n observation representing the dependent variable, X is a matrix of independent
variable, is a column vector of parameters i.e. and , and u is the column vector of errors
which is normally distributed with mean 0 and constant variance 2.

31
In this study, for simplification of the procedure, we investigate the structural change in two
subsets of data that form the complete time series, although there is possibility of several subsets
with structural breaks. Let the total time series of n observation be divided into two subsets of
samples with n1 and n2 observation i.e. n= n1+n2.The structural change may occur between the
subset of time series due to the change in intercept or change in slope or combination of both the
parameters.
The models representing the subsets of time series can be defined as
y1 = X11 + u1
y2 = X22 + u2
i.e.
2
1
y
y=
2
1
0
0
X
X
2
1
+ u
Here, X1= [ i1 X1*] and X2=[ i2 X2*], where, i1 and i2 are n1 and n2 vectors of ones, and X1*
and X2* are subset vectors of years. Further, the vectors can be partitioned to a conformable
form as
`1=[ 1 1*`] `2=[2 2*`]
Null hypothesis of no structural breaks is H0: 1 = 2
Under null hypothesis of common parameters
I.
2
1
y
y=
22
11
Xi
Xi
+ u (common parameters: RSS1)
II.
2
1
y
y=
22
11
0
0
Xi
Xi
2
1
+ u (different intercept, common slope: RSS2)
III.
2
1
y
y=
22
11
00
00
Xi
Xi
2
1
2
1
+ u (different intercept, common slope: RSS3)
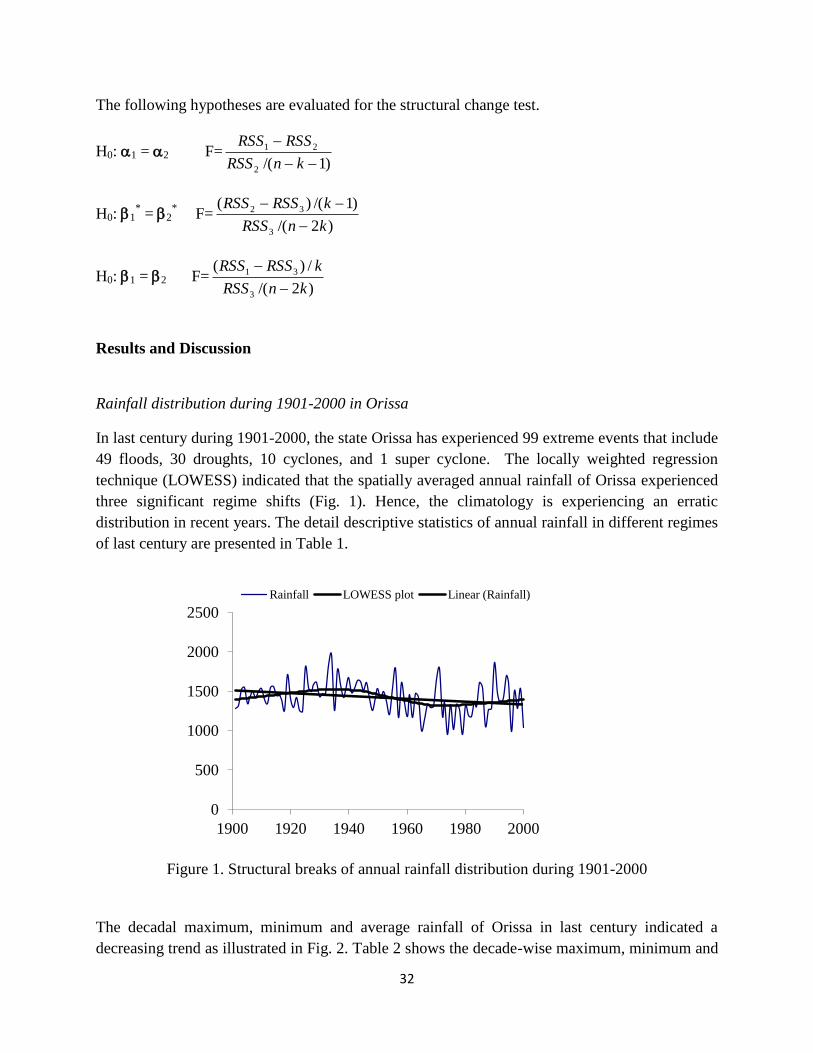
32
The following hypotheses are evaluated for the structural change test.
H0: 1 = 2 F=)1/(2
21
knRSS
RSSRSS
H0: 1* = 2
* F=
)2/(
)1/()(
3
32
knRSS
kRSSRSS
H0: 1 = 2 F=)2/(
/)(
3
31
knRSS
kRSSRSS
Results and Discussion
Rainfall distribution during 1901-2000 in Orissa
In last century during 1901-2000, the state Orissa has experienced 99 extreme events that include
49 floods, 30 droughts, 10 cyclones, and 1 super cyclone. The locally weighted regression
technique (LOWESS) indicated that the spatially averaged annual rainfall of Orissa experienced
three significant regime shifts (Fig. 1). Hence, the climatology is experiencing an erratic
distribution in recent years. The detail descriptive statistics of annual rainfall in different regimes
of last century are presented in Table 1.
Figure 1. Structural breaks of annual rainfall distribution during 1901-2000
The decadal maximum, minimum and average rainfall of Orissa in last century indicated a
decreasing trend as illustrated in Fig. 2. Table 2 shows the decade-wise maximum, minimum and
0
500
1000
1500
2000
2500
1900 1920 1940 1960 1980 2000
Rainfall LOWESS plot Linear (Rainfall)

33
average rainfall amount follow decreasing trend and standard deviations of rainfall follow
increasing trend.
Table 1. Descriptive statistics of annual rainfall (mm) in different periods of last century
Period 1901-1940 1941-1969 1970-2000 1901-2000
Observations 40 29 31 100
Mean 1487.25 1403.33 1344.51 1418.67
Standard
deviation (SD) 167.59 180.67 244.48 205.18
Skewness 0.84 -0.20 0.22 -0.01
Kurtosis 0.79 -0.20 -0.50 0.17
Minimum 1240 997 950.7 950.7
P10 1270 1160 1012.9 1169.9
Q1 1395 1296 1179.9 1286.6
Median 1470 1417.9 1325.6 1420
Q3 1555 1530 1535.9 1545
P90 1745 1620 1654 1662
Maximum 1970 1790 1865.8 1970
sapiro-wilk 0.942 0.984 0.970 0.989
p<w 0.042 0.922 0.521 0.581

34
Table 2. Descriptive statistics of decadal annual rainfall (mm) in last century
Decade
Minimum
rainfall
Maximum
rainfall
Average
rainfall S.D.
1910 1280 1550 1437 97.64
1920 1260 1710 1450 127.28
1930 1240 1810 1468 178.75
1940 1250 1970 1594 215.88
1950 1260 1630 1501 114.74
1960 1160 1790 1412 202.75
1970 997 1654 1322.07 190.37
1980 951 1791 1246.81 249.54
1990 1052 1866 1367.09 242.08
2000 985 1700 1388.69 233.19
Study of structural breaks in different regimes during 1901-2000 in Orissa
The parametric method of structural breaks was studied using the theory presented in theory
section. In last century, the annual rainfall of Orissa experienced three significant breaks. The
average of annual rainfall during these three regimes were: 1487 mm with standard deviation 167
mm during 1901-1940, 1412 mm with standard deviation 184 mm during 1940-1969, and 1354
mm with standard deviation 241 mm during 1970-2000 respectively. This indicates that the
average rainfall is decreasing, but the standard deviation is increasing over rainfall regimes.
Table 3 Test of structural breaks during 1901-1940 and 1941-1969
Id Parameters SE t-cal P value F-cal P
1 -8725.99 4128.30 -2.11 0.04 22.05 0.003
2 23435.41 6809.50 3.44 0.00
1 5.32 2.15 2.47 0.02
2 -11.27 3.48 -3.24 0.00

35
Study of structural breaks/ regime shifts during the period 1901-1940 and 1941-1969 indicated a
significant test of structural breaks both in slope as well as the intercepts (Table 3). During the
period 1901-1940, the annual rainfall exhibited a significant increasing trend having positive
slope (1=5.32), whereas during 1941-1969 it experienced a significant decreasing trend with a
negative slope (2=-11.27). Further, the intercepts are significant in both the regimes of the study
period.
Results of structural breaks analysis during the period 1941-1969 and 1970-2000 indicated a
non-significant test of structural breaks (Table 4). During the period 1941-1969, the annual
rainfall exhibited a significant decreasing trend having slope (1=-11), whereas during 1941-
1969 it experienced a non-significant increasing trend with a slope (2= 2.88). Further, the
intercepts are significant in both the regimes of the study period.
Table 4 Test of structural breaks during 1941-1969 and 1970-2000
Id Parameters SE t-cal P value F-cal P
1 23435 9036 2.59 0.01 7.89 0.103
2 -4381 8300 -0.53 0.60
1 -11 4.62 -2.44 0.02
2 2.88 4.18 0.69 0.49
Study of structural breaks in annual cyclonic disturbances (depression) over during 1901-2000 in
Orissa. The annual cyclonic disturbances (depression) over the Bay of Bengal during 1901-2000
indicated a structural change in 1948 (Fig. 3).
Figure 3. Structural breaks of annual depression over the Bay of Bengal during 1901-2000.
Dep
ress
ion
Year
Depression LOWESS Regression
36
Descriptive statistics indicated that an average of 10.7 depressions occurred during 1901-1948 in
comparison to 9.6 during 1949-2000. It is evident that the depression frequency increased
significantly during 1901-1948. In contrast, a marked decrease took place from 1949 onwards.
This may have decreased the rainfall in recent decades in Orissa and adjacent regions. Since
structural change provide enough evidence of climate change, more research need to be carried
out to know the reason of these structural breaks in climatic variables.
References
CES (2007). ENVIS Newsletter. 8(1), Center of Environmental Studies (CES), Forest and
Environment Department, Government of Orissa, Bhubaneswar. http://www.envisorissa.org
(accessed on February 24, 2010).
Johnston, J. and Dinardo, J. 1997. Econometric methods. Fourth Edition. Mcgraw-Hill
international editions. 126-133.
Mirza, M.Q. (2003). Climate change and extreme weather events: can developing countries
adapt? Climate Policy, 3: 233-248.
Swiss Re (2002). Natural catastrophes and man-made disasters in 2001: Man-made losses take
on a new dimension. Swiss Reinsurance Company Publication, Zurich, Sigma No. 1/2002.
***

37
Assessment of severity and extent of cyclone damage on crop production and
some measures to reduce the impacts
Dr. Gouranga Kar
Principal Scientist
Directorate of Water Management (ICAR), Bhubaneswar – 751023, Odisha
Cyclone and its Classification
Cyclones arc caused by atmospheric disturbances around a low-pressure are distinguished by
swift and often destructive air circulation. They are usually accompanied by violent storms and
bad weather. The air circulates inward in an anticlockwise direction in the northern hemisphere
and clockwise in the southern hemisphere. Tropical revolving storms (TRS) form in the vast
expanses of the warm tropical oceans. They are violent whirls spiralling upward from the ocean
surface to great heights, sometimes upto the tropopause and moving across the ocean, generally
from east to west. They are characterized by huge pressure deficit at the centre, cyclonic
circulation, violent winds and severe weather. TRSs are known as 'cyclones' in the Indian Ocean,
'Typhoons' in the Western Pacific, 'Hurricanes' in the Atlantic and Eastern Pacific, 'Baguios' in
the Philippine region and 'Willy Willies' in the Australian waters. More than one cyclone can
exist on the chart at a given time. For purposes of identification, names are allotted to the
hurricanes in the USA in the alphabetical order in each year eg. Anna, Betty, Clara,Dora, etc. In
Japan the number followed by the year is used for identifying the typhoons eg. 1/81, 2/81 etc.
Earlier in India the cyclones were referred to by the place of landfall i.e. where they strike coast
eg. Midnapur, Puri, Rameswaram etc. Now particular names are given to identify a cyclone in
India too like ‘Phailin’.
Cyclones arc classified as: (i) Extra-Tropical cyclones, also known as temperate cyclones); and
(a) Tropical cyclones. Extra tropical cyclones occur in temperate zones and high latitude regions,
though they are known to originate in the Polar Regions. Cyclones that develop in the regions
between the tropics of Capricorn and Cancer arc called Tropical cyclones. Tropical cyclones are
weather systems in which winds equal or exceed gale force (minimum of 34 knot, i.e., 62 kmph).
These are large-scale weather systems developing over tropical or subtropical waters, where they
get organized into surface wind circulation.
A cyclone is originated from a “low pressure area’, followed by ‘depression’ and ‘deep
depression’. Cyclones can be classified mainly according to the wind speeds and type of
disturbances. Different types of disturbances from origin to final form are given in Table-2.

38
Table-2: Types of disturbances from origin to final form and associated wind speed.
Sl. No. Type of Disturbances Associated Wind Speed in the Circulation
1 Low pressure Area Less than17 knots (<31 kmph)
2 Depression 17 to 27 knots (31 to 49 kmph)
3 Deep Depression 28 to 33 knots (50 to 61 kmph)
4 Cyclonic Storm 34 to 47 knots (62 to 88 kmph)
5 Severe Cyclonic Storm 48 to 63 knots (89 to 118 kmph)
6 Very Severe Cyclonic Storm 64 to 119 knots (119 to 221 kmph)
7 Super Cyclonic Storm 120 knots and above (222 kmph and above
When fully developed, a cyclone is a vast whirlwind of extraordinary violence spiraling around a
centre and progressing along the surface of the sea. The speed of wind within 50 to 100 km of
the centre in a mature storm can reach 160 km per hour or more. The winds associated with such
storms are among the most violent and the rainfall accompanying them is always very heavy.
The cyclonic storm transfers its whirling movements to the sea water and, since the storm itself
moves comparatively slowly, the winds act for a long time on the water surface producing strong
currents of water up to depths of 20 to 25 m. When the storm approaches a coastal belt, the sea
level rises, rather suddenly to an overwhelming extent causing dangerous inundations over the
coastal areas. The sudden rise in the sea level associated with cyclonic storms also called 'storm
tide’ strike the coast, causing large scale devastation in a matter of minutes.
Cyclones are also classified into five different levels on the basis of wind speed, and according to
their damage capacity (Table-1).
Table -1: Classification of cyclone based on damage capacity
Cyclone Category Wind Speed, km/h Damage Capacity
01 120-150 Minimal
02 150-180 Moderate
03 180-210 Extensive
04 210-250 Extreme
05 250 and above Catastrophic
39
Formation of Cyclone
Cyclones develop only under favourable conditions when certain pre-requisites are fulfilled.
They originate in large sea or ocean areas where the sea surface temperature (SST) is over 26°C.
This apparently is the threshold value to maintain a steep vertical lapse rate. This temperature is
also required to ensure that the air from the lowest layers which undergoes adiabatic expansion
and condensation remains warmer than the surroundings to about 12 km. Tropical cyclones
generally form in a preexisting synoptic system such as: wave in the equatorial trough, easterly
wave, mid-tropospheric trough or a low pressure area on the surface. This is the starting
mechanism.
All disturbances do not develop into cyclones. Only a few grow under a combination of
favourable circumstances. A certain minimum value of the Coriolis force is required to provide
the initial torque. This means that cyclones do not form near the equator (about 5° latitude on
either side). A mechanism is required to remove the rising air in the upper troposphere by rapid
divergence in order to facilitate the deepening of the surface low. That is why cyclones intensify
when the low level disturbance is situated underneath a high level anticyclone. The vertical wind
shear in the basic current must be weak. This condition limits the formation of cyclones to
latitudes far equator-ward of the STJ. Cyclones develop near the ITCZ, away from the equator
where the SST is over 26°C. That is probably why no cyclones form in the South Atlantic Ocean
where the ITCZ remains always north of the equator and the SST is lower than 26°C.
Mechanism of Formation: The energy for the development of the intense vertical storms is
provided by the coupling and interaction of large scale low level convergence and deep cumulus
convection. Thus a weak tropical disturbance amplifies into a tropical revolving storm under
favourable moisture conditions. The threshold SST > 26°C enables intense and sustained
convection in an oceanic region of radius of nearly 100km. The convection is concentrated along
asymmetric spiral bands. Tangential wind speeds reach 100 to 200 kt. The large vertical shears
prevent local accumulation of the released latent heat of condensation which gets advected in
different directions by the spiral cloud and rain bands. Cyclonic circulation, however, falls off
rapidly with height. A temperature maximum occurs at the centre of the storm. When mature, the
original cold core of the system becomes warm. The transformation of the cold core system into
a warm core system is due to the latent heat released by the many Cb 'hot towers' surrounding the
storm centre. This heat provides the energy for the maintenance of the cyclone and also acts as a
link in the transport of heat from the tropics to the poles in the general circulation.
A well-developed cyclone has four distinct phases:
i. Formative Stage— A tropical disturbance is noticed in a large oceanic area where winds
become variable with thunder-squalls. This stage extends from low pressure area to

40
severe cyclonic when an eye and eyewall are formed. Pressure falls slowly and the
central pressure deficit is of the order of 10 mb.
ii. Immature Stage— There is rapid fall in the central pressure, reaching the lowest limit.
Clouds and rain get organized into spiral bands. Area of strong winds remain small but
winds attain the maximum speed. The entire process is very quick.
iii. Mature Stage— Pressure fall and wind increase are arrested. The circulation expands
outwards and asymmetry sets in as the area of rain and gales extends much more to the
right in the direction of motion of the system. The process lasts a few days.
iv. Dissipating Stage- The decay starts when the system enters land or an oceanic region
where SST is lower than 26 C. Over land the moisture supply is drastically curtailed,
cutting off the energy input and also there is dissipation due to increased frictional drag.
The winds decrease, the cyclone fills up and weakens, though the rainfall may persist for
a day or two more.
Horizontal Structure: A full-fledged cyclone has three fell-defined components:
(I) Eye: The innermost or central portion of the mature cyclone is the 'eye'. It is about 10 to 30
km in diameter, depending upon the size of the storm and is a more or less calm region with little
or no clouds and some subsidence. The eye or the calm centre can be described variously as the:
—pressure eye: where msl pressure is lowest,
— wind eye: light or calm wind conditions,
— Radar eye: the eye seen in radar echoes,
— satellite eye: clear or dark spot seen in the cloud mass in satellite imagery.
The various types of 'eyes' described above may not always coincide. In the warm core systems
the temperature inside the eye region can be higher by as much as 10°C than the surroundings.
All cyclones do not develop an eye or become warm core systems. Above the warm core is a
cold top in the stratosphere.
(II) Eye Wall or Inner Ring: Surrounding the eye is a tight 'inner ring' of hurricane winds (over
63 kt, attaining 100 to 200 kt in severe cyclones). This core of maximum winds is at the centre of
a solid thick wall of towering Cumulonimbus clouds, 30 to 50 km wide round the eye and is
referred to as the 'eye wall'. The Cumulonimbus Cb towers rise from the sea surface to the
Tropopause level, nearly 18 km or more high and sometimes extend a km or so into the
stratosphere. Incessant lightning keeps the entire eye wall-illumined, making it a fascinating and
awesome spectacle. This is a region of violent thundersqualls, torrential rains etc with

41
mountainous waves reaching 20 metres or more in the sea. The eye and eye wall together
constitute the core of the cyclone.
(III) Outer Ring: Beyond the eye wall is an 'outer ring' of cyclonic circulation where the wind
speed decreases steeply and clouds, rain etc diminish rapidly outwards. The winds fall off to
about 40 kt at a distance of approximately 200 km. In some types of cyclones, however, the
decrease of wind outside the wall cloud is gradual. Hurricane speed winds (over 63 kt) may
extend to nearly 100 km from the centre and winds of 40 kt spread out to 400 to 600 km. In the
periphery of the storm is an outermost field of weak cyclonic circulation and scattered clouds.
The cyclones vary in size. The smallest ones are only about 150 km in diameter. These are
‘midgate’ cyclones. Big cyclones can have a diameter of 1,500 km.
Vertical Structure: Vertically a cyclone falls into clear-cut layers:
(I) The Inflow Layer: Inward radial motion takes place in the lower troposphere roughly up
to 3 km in the cyclone with the most pronounced motion in the planetary boundary layer (up to 1
km). Air entering the storm field rises up as spiral rain bands along the ‘Eyewall’. The cyclonic
wind vortex has maximum diameter at the surface. This remains nearly the same upto roughly 6
km and then diminishes rapidly aloft.
(II) The Mid-tropospheric Layer: This layer can be taken to be between 3 km and 8 km, Radial
motion practically ceases in this layer.
(III) The Outflow Layer: The air spiralling up from the inflow layer flows outwards in all
directions from the top of the storm. The outflow is found to be maximum above the cyclonic
circulation, at about 12 km (200 mb level) where an anticyclone with divergence appears. This
outflow serves as the ventilation, so essential for the cyclone to deepen and be sustained. Cirrus
cloud streams out in all directions and appears as the cirrus shield. The outflow sinks at the edge
of the cirrus shield where it is seen as a cloud-free 'annular zone' (AZ). There is an outer
convective band (OCB) on the outside of this annular zone. There is some subsidence in the eye
also, which again is cloudless or nearly so.
The three-dimensional picture of tropical revolving has been constructed out of the composite
data accumulated over two decades from radar pictures, aircraft raccee probes, satellite imagery
etc, mainly over the Atlantic and the Pacific. Data from the Indian Ocean have been meagre. In
spite of wide variations and differences in the characteristics of individual storms, a generalized
but fairly realistic structure of TRSs has been built up. Horizontally air spirals inwards, speed
increasing gradually and then becoming zero at the centre. From the centre, proceeding in any
direction, wind speed increases to reach a maximum and then decreases. The locus of the points
of maximum speed is the ring of maximum wind. The maximum inflow is found in the eastern
semicircle and the maximum winds occur to the right of the direction of movement. The ring of
maximum winds is in the middle of the eye wall which is an area of most intense convection.

42
The heaviest rainfall takes place in this region as spiral bands. Upward motion is concentrated in
these bands. The height of the Cb towers is related to the intensity of the storm.
Impacts of tropical cyclone on Indian sub-continent
The Indian subcontinent is one of the worst affected regions in the world. Past records of
destructive cyclones (human deaths numbering around 10,000 and above) are given in Table 3.
This list does not include Tropical Cyclone which have caused severe loss to properties (such as
'Katrina' in USA in 2005, the severest Tropical Cyclone ever recorded in terms of intensity. In its
combination of violence, duration and size of areas affected, the tropical cyclones appears to be
unrivalled, amongst all the natural phenomena, for the sum total of destruction it can cause.
Though the life span of cyclonic storms passing over the coast of India does not exceed 3 to 6
days, the devastation caused is phenomenally high. Extensive damages are caused on account of
the strong winds that blow up to 160 km per hour, heavy rainfall, sometimes, as much as 25 cm
in 12 hours and the gigantic tidal waves of 5 to 6 m that roll over the coastal belt of 20 to 30 km.
The winds uproot innumerable trees and cause serious damage to hutments, public buildings,
engineering works, telephone and power lines and standing crops. The rain causes inundation
and drainage congestion that paralyses human activity apart from damaging crop and property in
places which are not normally affected by river Hoods. The sea floods engulf all that comes in
their way, leaving only mute remnants of pucca buildings and lives that could seek shelter in
upper storey's or on high ground. The cumulative effects of these tremendous forces are loss of
thousands of human lives, millions of cattle and livestock, washing away of complete villages,
damage to standing crops in millions of hectares, flooding and water logging in low lying lands
over vast stretches, salinity of soil in thousands of sq. kms, sand casting in extensive areas and
damage to private and Government property and public utilities like Railway lines, arterial and
feeder roads, power and communication lines, water supply, etc.
Most lives are lost during a cyclone on account of floods and the devastating storm surge that
often accompany cyclones. In case of severe cyclonic storms with storm surges, more than 90%
of the fatalities occur due to drowning, either during the incoming water phase or during the out
surges.
It can be seen that since the year 1737 of the 23 major cyclone disasters (in terms of loss of lives)
in the world 21 have occurred over the Indian subcontinent (India and Bangladesh). Tropic
cyclones in the Bay of Bengal striking the east coast of India and Bangladesh usually produce
higher storm surge as compared to elsewhere in the world because of the special nature of
coastline, shallow coastal bathymetry and characteristics of tides. Their coastal impact
significant because of the low flat coastal terrain, high density of population, low awareness of
the community, inadequate response and preparedness and absence of any hedging mechanism.

43
Table-3: Some major Tropical Cyclone Disasters in Terms of Humanloss (With Human
Deaths 10,000 or more)
SI. No. Year Country Deaths
1 1737 Hooghly, West Bengal, India 300,000
2 1779 Manchilipatnam, Andhra Pradesh, India 20,000
3 1782 Coringa, Andhra Pradesh, India 20,000
4 1787 Corings, Andhra Pradesh, India 20,000
5 1788 The Antilles, Carribbean Islands, West Indies 22,000
6 1822 Barisal/Backergunj, Bangladesh 50,000
7 1831 Balasore, Odisha, India 22,000
8 1833 Sagar Island, West Bengal, India 30,000
9 1839 Coringa, Andhra Pradesh, India 20,000
10 1864 Machilipatnum, Andhra Pradesh, India 30,000
11 1867 Contai, West Bengal, India 50,000
12 1876 Backergunj, Bangladesh 20,000-250,000
13 1881 China 300,000
14 I897 Bangladesh 175,000
15 1942 Contai, West Bengal, India 15,000
16 1961 Bangladesh 11,468
17 1963 Bangladesh 11,520
18 1965 Bangladesh 19,229
19 1970 Bangladesh 300,000
20 1971 Paradip, Odisha, India 10,000
21 1977 Divi Seems, Andhra Pradesh, India 10,000
22 1991 Bangladesh 1 38,000
23 1999 Sough of Paradip, Odisha, India 9,893
24 2010 Andhra pradesh --
25 2013 Phalin, Ganjam, Gajapati --
Source: Rangachari et al., 2011
The subcontinent with a long coastline of 8041 kilometers is highly prone to tropical cyclones;
the majority of them has their initial genesis over the Bay of Bengal and strikes the east coast of
India. On an average, five to six tropical cyclones occur every year, of which two or three could
be severe. More cyclones occur in the Bay of Bengal than the Arabian Sea and the ratio is
approximately 4:1.

44
Cyclones occur frequently on both the coasts. An analysis of the frequency of cyclones on the
east and west coasts of India between 1891 and 1990 shows, that nearly 262 cyclones occurred
(92severe) in a 50 km wide strip on the east coast. Less severe cyclonic activity has been noticed
on the west coast, with 33 cyclones occurring in the same period, out of which 19 of these were
severe.
Tropical cyclones occur in the months of May-June and October-November. The cyclones of
severe intensity and frequency in the north Indian Ocean are bi-modal in character, with their
primary peak in November and secondary peak in May. The disaster potential is particularly high
in the north Indian Ocean (Bay of Bengal and the Arabian Sea) due to the accompanying
destructive wind, storm surges and torrential rainfall. Of these, storm surges are the greatest
killers of a cyclone, by which sea water inundates low lying areas of coastal regions and causes
heavy floods, erodes beaches and embankments, destroys vegetation and reduces soil fertility.
Cyclones vary in diameter from 50 to 320 km but their effects dominate thousands of square
kilometers of ocean surface and the lower atmosphere. The perimeter may measure 1,000 km but
the powerhouse is located within the 100-km radius. Nearer the eye, winds may hit 320 km/h.
Thus tropical cyclones, characterized by destructive winds, torrential rainfall and storm surges
disrupt normal life with accompanying the phenomena of floods due to the exceptional level of
rainfall and storm surge inundation into Inland areas. Cyclones are characterized by their
devastating potential to damage structures, viz. houses; lifeline infrastructure- power and
communication towers: hospitals; food storage facilities; roads, bridges and culverts; crops etc.
The most facilities come from storm surges and the torrential rain flooding the low land areas of
the coastal territories. The cyclonic disturbances of the monsoon season (June to September)
known as "monsoon depressions” are as a rule, of smaller intensity. They form at the head of the
Bay and follow a north westerly course and the damages caused by them are mainly due to heavy
rain rather than due to strong winds. October and November are the two months to be dreaded
most as regards cyclones originating both in the Bay of Bengal and the Arabian Sea, though
some exception have been there also. In general, the meteorologists feel that the post and pre-
monsoon cyclones usually unleash all their fury on striking the coast and collapse soon after. But
the monsoon cyclones possess the unique capacity of travelling without collapsing, on both water
and land surfaces. The monsoon depressions, in general, yield copious rain along their tracks, as
they move across the country.
Vulnerable areas in India affected by Cyclones
There are 13 coastal states and union territories (UTs) in the country, encompassing 84 coastal
districts which are affected by tropical cyclones. Among these, four states (Tamil Nadu, Andhra
Pradesh, Odisha and West Bengal) and one UT (Puducherry) on the east coast and one state

45
(Gujarat) on the west coast are highly vulnerable to cyclone disasters. The details of cyclones
which crossed the coastal districts of India during the period 1891-2013, is presented in Table 3.
Table-3: Number of Cyclones crossing various Coastal Districts of (the East and West Coasts of
India during the Period 1891-2013
West Coast East Coast
State Coastal
Districts
No of
Cyclones
State Coastal Districts No. of
Cyclones
Kerala (3) Malappuram
Kozikode
Kannur
1
1
1
W. Bengal(69) 24 Parganas (North
and South),
Midnapur
35
34
Karnataka (2)
Dakshina
Kannada
Uttar
Kannada
1
1
Odisha (99) Balasore
Cuttack
Puri
Ganjam
32
32
19
16
Maharashtra (13) Sindhudurg
Ratnagiri
Mumbai
Thane
3
3
3
4
Andhra
Pradesh (80)
Srikakulam
Visakhapatnam
East Godavari
West Godavari
Krishna
Guntur
Prakasam
Nellore
14
9
8
5
15
5
7
17
Goa(2) Goa 2 Tamil
Nadu(54)
Chennai
Cuddalore
Southarcot
Tanjavur
Pudukkottai
Ramnathpuram
Tirunelveli
Kanyakumari
18
7
5
12
5
3
2
2
Gujarat(28) Surat
Kaira
Bhavnagar
Amreli
Junangarh
Jamiiagar
Kachchh
1
1
4
4
7
6
5
Puducherry
(UT)
Puducherry 8
Source: Rangachari et al., 2011

46
The most vulnerable states to cyclone are given below:
Andhra Pradesh
Andhra Pradesh has a long coastline stretching approximately 1,030 km and equally long history
of varying intensity over the past 100 years. More than 500 villages perched along the coastline
are within 5 km swathe extending inside from the coast. A good number of coastal villages are
within 5-20 km. The flat deltaic plain lands on either side of the Godavari and the Krishna rivers
are between 1.5-2 m above mean sea level and are most vulnerable to surges. The coastal
districts are primarily agricultural – which have highly productive, network of irrigation canals
fed from the Krishna and Godavari rivers. These also face the brunt of floods during the
monsoons. The coastline of the state is affected by at least one cyclone every year.
Odisha
In Odisha, the cyclones are usually experienced in the months of October and November. At this
time, the Kharif paddy is generally in the flowering stage. The flowers being blown off by strong
winds, damage the paddy crops seriously. When lashed with severe cyclonic storms as in Andhra
Pradesh, the very economic structure gets hit in the coastal district. The affected fertile land of
the coastal districts of the state may extend 25 km inland. 75 per cent of the people in this area
depend on agriculture and 5 per cent on fishing. About 90 per cent of the populations live in
thatched-roof houses. The communication system of the area is extremely poor, weaker sections
of the society in these coastal districts have not been able to improve their economic condition on
account of frequent floods, saline inundation and severe cyclones. The state has in recent past
suffered extensive losses due to "Super Cyclones” in 1999 and “Phailin” in 2013.This cyclone
prone region has a number of inlets into sea which allow the tidal waters to be driven inland for
considerable distances causing damage on both the sides of the creeks.
Tamil Nadu
The coast of Tamil Nadu has been hit by cyclonic storms with disastrous effects, almost once in
'two years. In some years, the coast has been hit more than once. The districts affected by
cyclones in the State are, Kanyakumari, Thirunelveli, Rama-nathapuram, Thanjavur, South Arcot
and Chen-galpattu.
West Bengal
In West Bengal also, the severe cyclones are usually experienced in October and November. The
cyclone of October 1942 with a wind speed of 161 km per hour caused a storm surge of 3.5
metres above the normal tide level and caused serious devastation in 24-Parganas and Midna-

47
pore districts. Thousands of lives were reported to have been lost apart from tremendous loss of
property. Subsequently, the cyclone of September 1976 recorded a wind speed of 160 km and
caused widespread devastation in the same districts viz., 24-Parganas and Midnapore.
Tracks of a Cyclone
The life span of a cyclone averages a week. The larger the sea area, the more intense the storm
grows. When fully developed, a storm is a violent whirl 200 km (midget) to 1,500 km across, 6
km to 8 km high, spiralling round a centre and progressing like a spinning top on the ocean
surface, at a speed of 10 to 30 km/hr, covering a distance of 300 km to 500 km a day. It moves
from east to west, steered by the high level zonal easterlies. The movement can be erratic,
sometimes with wobbles and even loops. Storms get pulled poleward and hence generally move
northwest in the northern hemisphere and southwest in the southern hemisphere. There is a
tendency to move into areas of warm waters. They weaken if they enter colder waters (less than
26°C).
Extent of damage by Cyclone and Strom surge
Damage and devastation due to a storm are mainly from hurricane winds, torrential rain and
storm surge. Hurricane wind damages houses, uproots plants and trees and torrential rain creates
flood and damages to standing crop. Generally cyclones occur at November and December,
during that time rice crop is at flowering to grain filling stage and cyclone creates damage and
devastation to rice. Storm surge is also greatly responsible for the greatest damage, 90% of the
deaths are attributable to the sudden deluge owing to the instantaneous onrush of water and rise
in water level with hurricane winds, often covering nearly 25 km inside the coast.
In a cyclonic storm in the open sea, there is a rise in the water level due to the low pressure and
this is known by the name 'inverted barometer wave'. Raging winds in the storm whip up
mountainous waves over the ocean surface. Waves as high as 20 metres travel long distances
affecting i the waters to a depth of nearly 20 metres. Compensating subsurface counter-currents
are set up and hence the water does not pile up very high in the open ocean. When the storm
approaches the coast, the counter-current gets ratarded, making the water level rise. This rise in
level combined with the inverted barometer wave pauses huge piling up of water. This is the
'storm surge’ which hits the coasts as a solid wall of water with the speed of the hurricane winds.
This is also known as 'Tidal wave' and 'Storm wave.'
The surge height depends on the area of spread if the piled up water. The height is determined by
various factors. The shape of the coastline is important. The height gets amplified if:

48
Water is funnelled into enclosed regions such as Bays and Estuaries, The continental slope is
gentle, retarding the counter-current, The angle between the coastline and the right semicircle of
the storm track is 90O or less.
The storm surge coincides with the astronomical tide, leading to super-imposition (hence the
name tidal wave),
(a) Convergence of wind-driven currents takes place along a line near the coast in shallow
waters,
(b) Super-imposition of the short-period waves, breakers or swells takes place.
The inland limit of inundation depends on the topography and the contours. River mouths appear
to be the preferred areas of landfall of most cyclones, that too at the high tide epoch. The river
mouths are usually flat alluvial plains devoid of trees facilitating rapid and easy inflow of water.
The exact time of impact of storm surges is difficult to predict. They are known to occur in
advance, during or after the passage of the storm across the coast, depending on the orientation
of the coast. Surges can occur with onshore winds even when the storm is passing alongside
without actually striking or crossing the coast
Cyclone disaster response mechanism.
The various phases of cyclone disaster response mechanism cover following aspects.
• Early Warning
In view of availability of satellite images and remote sensing, cyclone forecasting has become
more sophisticated and accurate, but the dissemination of warning percolates down on the low
levels rather late, mainly due to inadequate communication network and difficulty in reaching
the inaccessible villages.
• Evacuation
Forecasting plays a crucial role in facilitating evacuation. Though it is regarded as a costly and
difficult method, more often it becomes inevitable. Refusal of people to leave houses, fields and
lack of initiative from officials hampers the evacuation process.
Rescue and Relief: This ‘sandwich’ phase usually lasts for 204 weeks, and involves the services
of armed forces. Government agencies, NGOs etc. the political and bureaucratic factors
influence this phase.

49
Rehabilitation and Development
Rehabilitation is a long-term slog and it should ideally include restoring life sustenance systems
as rebuilding the social fabric of the affected communities. The rehabilitation programme should
take care of health, education, special needs of women and children, farmers, agricultural
labourers, artisans, marginalized and vulnerable groups. Several factors including the political
considerations determine the exgratia payments extended to the affected people.
Gender Issues
By virtue of their lower economic, social and political status and position, women tend to be
among the most vulnerable to disasters and as such, need considerate when disbursing relief
ignored after the disaster. For house sites for the constructs of houses has invariably been in the
name of husband or son. As such women who lose their men in the family or the single women
headed households suffer.
Health Care
Health care must take priority over everything else in the aftermath of a "clone, as every aspect
of disaster management from food to medication to accommodation is related to health.
Guidelines for management of cyclones
The National Disaster Management Authority (NDMA) which had already prepared and released
guidelines for a number of disasters like Earthquake, chemical and industrial disasters etc.,
released guidelines for management of cyclone in April 2008 aimed at helping various ministries
and departments in centre and the state to prepare plans and to minimize loss of life & proper's.
NDMA in its guidelines has identified 10 key areas of cyclone management:
• Establishing a state-of-the-art cyclone early warning system involving observations,
predictions, warnings and user friendly advisories.
• Commissioning of the 'National Disaster Communication Infrastructure' to provide
dedicated and fail-safe communications to the National, State and District Disaster.
• Expanding the warning dissemination outreach by introducing 'Last Mile Connectivity',
this will include providing public address system along the entire coast line, using VHP
technology. This will be done along with putting in place all other options currently in
vogue internationally.

50
• Implementing the National Cyclone Risk Mitigation Project in all the 13 coastal states and
UTs.
• Taking up structural mitigation measures like improving structural lifeline infrastructure;
construction of multi-purpose cyclone shelters and cattle mounds, ensuring cyclone
resistant design standards in rural and urban housing schemes, building all-weather road
links, bridges, culverts and saline embankments etc.
• Management of coastal zones to include mapping and delineation of coastal wetlands,
patches of mangroves and shelter belts and identification of potential zones for expanding
bio-shield spread based on remote sensing tools.
• Setting up of an exclusive eco-system monitoring network to study the impact of climate
change.
• Establishing a comprehensive 'Cyclone Disaster Management Information System'
covering all phases of Disaster Management.
• Setting up of a 'National Cyclone Disaster Management Institute' in one of the coastal
states to address all issues related to cyclone risks.
• Commissioning of "Aircraft Probing of Cyclone facility" to fill the critical observational
data gaps and significantly reduce the margin of error in predicting cyclone track, intensity
and landfall.
Conclusion
There has been a paradigm shift in the Government of India's focus from the earlier rescue and
relief-centric approach to a holistic approach covering all aspects of cyclone management.
However, concerted efforts are required to evolve sound national strategies for the management
of cyclones by emphasizing research and development needs in the following aspects. .
• Strengthening of cyclone tracking and monitoring system
• Early warming dissemination
• Storm surge modeling
• Preparation of Disaster Management Plans at different levels
• Conservation and regeneration of mangrove Forests
• Coastal shelterbelt plantation
• Construction of Saline embankments
• Construction of cyclone shelters
51
• Coastal canal system
• Dredging of river mouths
• Industries in coastal zones
• Use of remote sensing and GIS techniques
• Strengthening of training institutions
• Training of engineers/masons in cyclone resistant construction
• Involvement of prost graduate and research students
References
Menon, P.A. (1989). Our weather. National book Trust, India
Rangachari, R., Kanija, V.K., Gupta, AC. And Baweja (2011). (eds.).Water resources
development scenario in India. CWC, MoWR, GoI.
***

52
Significance of GIS and remote sensing in cyclone management
Dr. Ashok Kumar Nayak
Senior Scientist
Directorate of Water Management (ICAR), Bhubaneswar – 751023, Odisha
Natural Disasters occur frequently around the world and their incidence and intensity seem to be
increasing in recent years. The Disasters such as cyclones and floods often cause significant loss
of life, large-scale economic, social impacts and environmental damages. India is one among the
disaster prone geographical zones of the world and suffers losses huge money as a result of
damages due to different types of disasters annually. Cyclone is a disaster resulting from nature's
fury and is beyond human control. It causes damage to agriculture, human lives, livestock,
infrastructure and communication facilities. The crucial part here is the information collection,
mapping and its dissemination. The real-time operation of satellite remote sensing has
demonstrated the translation of information derived from space technology to ground reality.
Remote sensing techniques are invaluable for collecting the data rapidly and mapping the
affected areas extensively, particularly in developing countries for which conventional resource
mapping sources are limited. Mapping the disaster areas would help in the management of rescue
and rehabilitation operations. The ancillary information has to be used alongwith remotely
sensed data for better assessment. One direct method to estimate the damages is to procure
satellite data before, during and after the event and analyze them together for change detection.
From the satellite images prior to the cyclone and after cyclone, the situation can be mapped. The
satellite images during event reveal the inundation extent. The post-cyclone satellite data shows
the residual effects of the damaged area.
Cyclones
Among the coast based natural disasters, storm surges arising during cyclones, abnormal waves
during tsunamis are the most prominent ones. The Bay of Bengal being a cyclogenic area,
generates cyclones every year. The cyclonic storms, which cross the coastal regions cause
sudden abnormal rise of sea water, called surges and this is the primary cause for coastal
flooding in the adjoining land. The Bay of Bengal is one of the ocean basins for the
transformation of regions of low-pressure in the atmosphere into cyclonic storms. Between the
years 1891 and 1977 the Bay of Bengal has generated about 400 cyclonic storms with different
degrees of intensity. The effects of these storms are more pronounced in the states located on the
East Coast of India, namely West Bengal, Odisha, Andhra Pradesh and Tamil Nadu. Sometimes,
the surges along the coast accompanying these storms are abnormally high and form the most
destructive component of this coupled ocean-atmosphere phenomenon. A Very Severe Cyclonic
Storm (VSCS) PHAILIN originated from a remnant cyclonic circulation from the South China

53
Sea. The cyclonic circulation lay as a low pressure are over Tenasserim coast on 6th
October
2013. It lay over north Andaman Sea as a well-marked low pressure area on 7th
October. It
concentrated into a depression over the same region on 8th
October near latitude 12.00N and
longitude 96.00E. Moving west-northwestwards, it intensified into a deep depression on 9
th
morning and further into cyclonic storm (CS), ‘PHAILIN’ in the same day evening. Moving
northwestwards, it further intensified into a severe cyclonic storm (SCS) in the morning and into
a VSCS in the forenoon of 10th
Oct. 2013 over east central Bay of Bengal.
Role of GIS and Remote Sensing in Disaster Management
A Geographic information system (GIS) has a graphic database of geo-referenced information
system, which is linked to the descriptive database. It uses high-powered graphic and processing
tools that are equipped with procedures and applications for inputting, storing, analyzing and
visualizing geo-referenced information. GIS and remote sensing (RS) are very useful and
effective tools in disaster management. Various disasters like cyclones, floods, earthquakes,
tsunamis and other natural hazards that kill lots of people and destroy property, infrastructures
every year. Remotely sensed data can be used very efficiently to assess the severity and impact
of damage due to these disasters. In the disaster relief part, GIS, grouped with global positioning
system (GPS) is extremely useful in search and rescue operations in areas that have been
devastated. Remote sensing is emerging as a popular means of map preparation while GIS can be
used for storage, analysis and retrieval. Under remote sensing techniques, maps can be prepared
using satellite data or aerial photographs and then digitized and stored on computers using GIS
software. GIS and remote sensing technologies have been the object of substantial interest for all
countries and bodies concerned with space and in exacting emergency services and disaster
management. In disaster management, the objectives of the disaster experts are to monitor the
situation, simulate the complicated disaster occurrence as accurately as possible so as to come up
with better prediction models, suggest appropriate contingency plans and prepare spatial
databases. Remotely sensed data can be used very effectively for quickly assessing severity and
impact of damage due to cyclones and other disasters. Disaster maps generally show risk zones
as well as disaster impact zones. These are marked areas that would be affected increasingly with
the increase in the magnitude of the disaster.
During the disaster prevention stage, GIS is used in managing the huge levels of data required
for vulnerability analysis and hazard assessment. It is useful mainly because of its capacity to
build models or representations of the real world from information in databases. It is therefore
important for aiding hazard prevention and for simulating the damage that would be caused in
the event of a natural disaster. GIS can also be used to interpret information by creating thematic
maps that show the spatial distribution of the information. These maps show spatial patterns,
trends or relationships, making it easier to analyze the information. This is the case in the various
successive stages of the process of assessing the damage caused by a disaster. In the disaster

54
preparedness stage, it is a tool for planning evacuation routes, designing emergency operations
centres and for the integration of satellite data with other relevant data in the design of disaster
warning systems. In the disaster rehabilitation stage, GIS is used to organize the damage
information and post-disaster information and in the evaluation of sites for reconstruction.
Natural hazard information should be included routinely in developmental planning and
investment projects preparation. They should include cost/benefit analysis of investing in hazard
mitigation measures and weigh them against the losses that are likely to occur if these measures
are not taken. The application of remote sensing and GIS has become a well-developed and
successful tool in disaster management. It allows for the combination of the different kinds of
spatial data with non-spatial data, attribute data and use them as useful information in the various
stages of disaster management.
Disaster mapping
Disaster mapping is a tool for assessing, storing and conveying information on the geographical
location and spread of the effects or probable effects of disasters. It is the drawing of areas
disturbed through excessive natural or manmade troubles resulting in loss of life, property and
national infrastructures. The delineation can occur through the use of ground based observations
and also using the remote sensing data. From the information gathered, it is possible to map the
affected areas and provide information to the relief supplying groups. The difficulty with
traditional manual maps is that they are tedious and time consuming to prepare, difficult to
update and inconvenient to maintain.
Cyclone Forecasting - The Early Warning System
Tropical Cyclones are intense low pressure systems which develop over warm sea. They are
capable of causing immense damage due to strong winds, heavy rains and storm surges. The
frequency of the Tropical Cyclones in the Bay of Bengal is 4 to 5 times more than in the Arabian
Sea. Indian Meteorological Department (IMD) is mandated to monitor and give warnings
regarding Tropical Cyclone (TC). Data resources are crucial to early forecasting of cyclones.
Satellite based observations are being extensively utilized. Satellite integrated automated weather
stations have been installed on islands, oilrigs and exposed coastal sites. Buoys for
supplementing the surface data network in the tropical ocean have been deployed. The
Government has also started a National Data Buoy Programme. A set of 12 moored buoys have
been deployed in the northern Indian Ocean to provide meteorological and oceanographic data.
Dynamic forecasting of TCs requires knowledge of the vertical structure of both the Cyclone and
the surrounding environment.
The goal of any warning system is to maximize the number of people who take appropriate and
timely action for the safety of life and property. All warning systems start with detection of the
event and with people getting out of harm’s way. Such warning systems encompass three
equally important elements namely; Detection & Warning; Communication and Response.
55
The second stage of “Cyclone Alert” is sounded 48 hours in advance of the expected
commencement of adverse weather over the coastal areas. Forecasts of commencement of strong
winds, heavy precipitation along the coast in association with arrival of cyclone are issued at the
alert stage. Landfall point is usually not identified at this stage.
The third stage warning known as “Cyclone Warning” is issued 24 hours in advance. Landfall
point is forecast in this stage of cyclone warning. In addition to the forecasts for heavy rains and
strong winds, the storm surge forecast is also issued. Since the storm surge is the biggest killer
so far as the devastating attributes of a storm are concerned, information in this regard is most
critical for taking follow up action for evacuation from the low lying areas likely to be affected
by the storm.
Search and rescue operation
Search, rescue and evacuation procedures are carried out immediately after disaster strikes a
certain area. These are major operations, usually performed by local volunteers, voluntary
organizations and district and state agencies. The basic aim of all such operations is to ensure the
survival of the maximum possible number of victims. A plan is worked out with the help of local
people through aerial surveys and appropriate steps are then taken by the various teams involved
to carry out the operations. Besides bringing material relief, the aim is also to control panic and
confusion and to provide moral support.
Assessment of Cyclone Damage (immediately during Cyclone)
During cyclone, Remote sensing data provide timely and detailed information that are required
by the authorities to locate and identify the affected areas and to implement corresponding
damage mitigation. It is essential that information be accurate and timely, in order to address
emergency situations i.e. dealing with diversion of inundated water, evacuation, rescue,
resettlement, water pollution, health hazards and handling the interruption of utilities etc. Some
important spatial outputs produced and analyzed in real time. The disaster extent maps, real time
monitoring by remote sensing data and of damage to buildings and infrastructure maps were
prepared. Moreover, meteorological reports based on real-time remote sensing data are required
to show intensity/estimates, movement and expected duration of rainfall for the next 3 hours.
Relief (after the Cyclone)
In this stage, re-building of destroyed/damaged facilities and adjustments of the existing
infrastructure will occur. The time factor is not as critical as in the last stage. Nevertheless, both
medium and high-resolution remote sensing images, together with an operational geographic
information system, can help to plan many tasks. The medium resolution data can establish the
extent of the damages where as high-resolution data are suitable for pinpointing locations and the

56
degree of damages. They can also be used as reference maps to rebuild bridges, washed-out
roads, homes and other facilities.
Conclusion
Disaster Management has to be a multidisciplinary and proactive approach. Besides various
measures for putting in place institutional and policy framework, disaster prevention, mitigation
and preparedness enunciated and initiatives being taken by the Central and State Governments
and other organizations and media also have a key role to play in achieving our goal of moving
together, towards a safer country. Remote sensing data and techniques alongwith GIS have
proven their usefulness in disaster management plan especially in mapping the new situation
after the disaster which help in updating the geographical database. This can be used for the
reconstruction of the damaged area. GIS helped to interpret information by creating satellite
based thematic maps that show the spatial dimension of the affected areas. It has become easier
to carry out the disaster management operations efficiently. Studies have helped in making it
possible to forecast and simulate disaster occurrences with regard to specific locations - helping
in the initial stages of search and rescue operations. Techniques like satellite imagery and GIS
help to identify areas that are disaster prone, zoning them according to risk magnitudes,
inventory populations and assets at risk, and simulating damage scenarios. These tools are even
useful in managing disasters as they provide instant access to information required in
management decisions. Modern communication systems have also proved very useful,
particularly in search and rescue operations. They not only help in providing warnings before the
disaster, but also help in creating awareness which helps in reducing panic, confusion and mental
stress. A communication network system helps in establishing contacts between relief teams
which, with better central coordination, can work more efficiently.
References
Azaz, L.K. 2010. Using remote sensing and GIS for damage assessment after flooding, the case
of Muscat, Oman after Gonu tropical cyclone 2007: Urban planning perspective. REAL CORP
2010 Proceedings.Pp. 879-888.
Banger S. K.: Remote Sensing and Geographical Information System for Natural Disaster
Management: GISdevelopment.net
National Disaster Management Guidelines: Management of Cyclones. 2008. National Disaster
Management Authority, Government of India. P156.
Very Severe Cyclonic Storm, PHAILIN over the Bay of Bengal (08-14 October 2013): A Report.
(October 2013), India Meteorological Department, New Delhi. P42.
***

57
Soil management intervention in cyclone affected coastal areas
Dr. Madhumita Das
Principal Scientist and Programme Leader (OFTD)
Directorate of Water Management (ICAR), Bhubaneswar – 751023, Odisha
Saline soils in coastal areas occur in river deltas and in narrow strips of land ranging from a few
kilometers to about 50 km close to the sea coast along the low lying lands, estuaries and inland
depressions (Yadav, 1979). The coastal saline soil has been used by various workers almost
synonymously with coastal soil per se which is not correct since all coastal soils are not saline in
nature. Velayutham et al. (1999) revealed that saline soil resources and their potentials for
different Agro-ecological Sub Regions (AESR) of India. It shows total 10.78 million hectare area
under this ecosystem (including the islands) in India, which was the first scientific approach for
delineation of the coastal soils.
General characteristics of coastal saline soils
In coastal saline soil, the salinity status widely fluctuates from ECe 0.5 dS m-1
in monsoon to 50
dS m-1
in summer/ dry month. Mostly NaCl followed by Na2SO4 are the dominant soluble salts,
with abundance of soluble cations in the order of Na>Mg>Ca>K. Chloride is the predominant
anion, and bicarbonate is found in traces. In India, the soils are, in general, free of sodicity except
in a few pockets in the South and West coast. Saline soil can be classified as the soils having pH
less than 8.5, ESP less than 15, and preponderance of chlorides and sulfates of sodium, calcium
and magnesium.
Bandyopadhyay et al. (1987) observed that coastal saline soils are characterized by clay loam
with varied presence of silt and sand. The electrical conductivity ranges from 0.5 to 9.2 dS m-1
with sodium as dominating castion in the salts. Biswas et al. (1990) observed that coastal saline
soils generally have highly saline shallow underground water table with gradual upward
movement of saline water during summer months and subsequent evaporation of the water that
contributes to soil salinity during dry periods. Salinity is one of the major obstacles to crop yield
in deltas, estuaries and coastal fringes in the humid tropics. It is a serious impediment to growth
of irrigated rice (Ponnamperuma, 1972). The salinity of the soil varies with the season. It reaches
the maximum between January and May and decreases thereafter with the onset of monsoon
(Bandyopadhyay and Bandyopadhyay, 1984). This cyclic salt accumulation and intermittent
flood make these regions predominant in rice cultivation.

58
A. Salinity build – up
The main obstacle to intensification of crop production in the coastal areas is seasonally high
content of salts in the root zone of the soil. The salts enter inland through rivers and channels,
especially during the later part of the dry (winter) season, when the downstream flow of fresh
water becomes very low. During this period, the salinity of the river water increases. The salts
enter the soil by flooding with saline river water or by seepage from the rivers, and the salts
become concentrated at the surface through evaporation. The saline river water may also cause
an increase in salinity of the ground water and make it unsuitable for irrigation. Agarwal (1983)
observed that in coastal saline soils, the problem is further complicated by inundation through
backwash from sea, tidal waters, wind borne salts and underground intrusion of sea water in sub
soils.
B. Productivity constraints
Coastal soils in a number of situations are constrained by various factors limiting agricultural
productivity, which are: (i) Excess accumulation of soluble salts and alkalinity in soil, (ii) Pre-
dominance of acid sulphate soils, (iii) Toxicity and deficiency of nutrients in soils,(iv) Intrusion
of seawater into underground aquifers, (v) Shallow depth to underground water table rich in
salts, (vi) Periodic inundation of soil surface by the tidal water vis-à-vis climatic disaster and
their influence on soil properties, (vii) Fine soil texture and poor infiltrability of soil in many
areas, (viii) Eutrophication, hypoxia and nutrient imbalance, (ix) Erosion and sedimentation of
soil, and (x) High population density.
Nutrient availability and management in cyclone affected coastal areas
A. Nitrogen
Most of the coastal saline soils are deficient in nitrogen. Besides lesser utilization of
nitrogeneous fertilizers, especially in coastal areas, the mineralization of soil organic nitrogen,
and thus the release of native soil nitrogen to the plant available form, is also slowed down in the
salt-affected soils due to decrease in the population as well as activity of microbes with increase
in soil salinity. It was revealed from a study at CSSRI, Regional Station Canning that the rates of
both mineralization and immobilization of nitrogen in soil were considerably reduced at soil
salinity of ECe 10 dSm-1
and above. Under salt-stress conditions, the uptake of N by crop plants
is generally affected (Alam, 1999). A substantial number of laboratory and greenhouse studies
have shown that salinity reduces N nutrition in plants. It has been reported that an increase in Cl-
uptake and accumulation is accompanied by a decrease in shoot nitrate concentration. In their
experiment, Aslam et al. (1984) have reported that Cl-
inhibited NO3- uptake more than SO4
2-
when these anions were present on an equal molarity basis. In contrast to the effect of Cl- on
NO3- uptake, reported data indicated that increased NO3
- in the substrate decreased Cl
- uptake
and accumulation. The possible decrease in N uptake by increasing salinity has been partly

59
attributed to a probable substitution of Cl- for NO3
-. Both the chloride salts of Na and K inhibited
the nitrate uptake similarly, suggesting that the process was more sensitive to anionic salinity
than to cationic salinity (Aslam et al.,1984). Although, Cl- salts were primarily responsible for
reduced NO3-
uptake by plants, NO3- reduction in plants was not affected by salinity in studies
with barley (Aslam et al.,1984). Salinity also stimulated nitrate reductase activity in peanut
plants but decreased the nitrate reductase activity in tomato and cucumber (Cucumis sativus L.)
plants. Reduction in NRA may be due to inhibition of NO3-uptake by Cl- in plant species
(Abdul-Kadir and Paulsen, 1982).
In the coastal areas, the excess rainfall during monsoon cause flooding and deep water
submergence leading to enormous nutrient losses and low crop yields (Yadav, 1996). Rice is
grown as a major crop in most of the coastal areas during the North East monsoon season. The
increasing loss of nitrogen through NH3 volatilization from applied nitrogeneous fertilizer with
increase in soil salinity was studied under field condition at Canning in West Bengal. While
comparing among different sources at two soil salinity levels, viz. ECe 3-4 and 7-8 dSm-1
, the
loss was found to be maximum under ammonium sulphate, followed by prilled urea, and
minimum under placement of urea (in paper packet) at 5 cm depth, whereas the conventional
slow-release sources as lac-coated urea, sulphur-coated urea, and placement of urea briquette
occupied the intermediate positions. Reduction in loss when compared with prilled urea
broadcast under cropped condition was maximum (73.1%) for placement of urea.
B. Phosphorus
Phosphorus, which plays crucial role in the energy metabolism of cells, is involved in a number
of anabolic and catabolic pathways (Alam, 1999). A recent study indicates that salinity may
increase the P requirement of certain plants. Awad et al. (1990) found that when NaCl increased
in the substrate from 10 to 50 or 100 mM, the P content in the tomato leaf increased from 58 to
70 and 97 mmol kg-1
of dry weight. The influence of salinity on P accumulation in crop plants is
variable and depends on the plant and experimental conditions. In many cases, salinity decreased
the P concentration in plant tissue (Sharpley et al., 1992). It is unlikely that Cl and H2PO4 ions
are competitive in terms of plant uptake. However, it has also been observed that Cl may have a
suppressing effect on P uptake in tomato shoots (Papadopoulos and Rendig, 1983). The presence
of Cl as well as SO4 reduced P uptake in barley and sunflower plants. In other cases, a reduction
in plant P concentration by salinity may result from the reduced activity of P in the soil solution
due to the high ionic strength of the growth media (Awad et al.,1990). Phosphate solubility and
its availability are reduced in saline soils not only because of ionic strength effects that reduce
the activity of phosphate but also the P concentration in soil solution is tightly controlled by
sorption processes and by the low solubility of Ca-P minerals. It is, therefore, understandable
that P concentrations in field-grown agronomic crops decreased as salinity increased in the
media. When plants are P-deficient, they may be more sensitive to salinity (Sharpley et al.,
1992).

60
Gibson (1988) observed that adequate phosphorus nutrition was essential for effective ion
compartmentation by contributing to efficient carbohydrate utilization in salt-stressed wheat.
The level of phosphorus in the coastal saline soils is highly variable, and depends largely on the
nature and degree of salinity. The availability of soil phosphorus largely depends on the pH of
the soil developed after hydrolysis of salt. An increase in soil pH on hydrolysis reduces the
availability of soil phosphorus. Very little work has been done on the transformation and
availability of P to crops in coastal saline soils.
C. Potassium
The availability of potassium depends largely on the parent material, clay minerals and
weathering conditions. It also depends on the nature and amount of salts in the soil. It was
reported from CSSRI, Regional Station Canning that the coastal saline soils are rich in water
soluble, exchangeable, non-exchangeable and available K. Thus, with regard to soil fertility, the
coastal soils are usually rich in available K and micronutrients (except Zn), low to medium in
available N, and are variable in available P status (Bandyopadhyay et al., 1985, Bandyopadhyay,
1990, Maji and Bandyopadhyay, 1991). Major portion of the applied N fertilizer is lost through
volatilization (Sen and Bandyopadhyay, 1987).
The higher K/Na ratio in shoots of barley cultivars compared with that in root medium solution
indicated selective uptake of K, which seems to be among the processes involved in tolerance of
cultivars to salinity stress (Alam, 1999, Niazi et al., 1992). Addition of K suppressed the uptake
of other cations by rice and tomato plants in the order of Na>Mg>Ca. The depression of K
uptake by Na could be due to the antagonism between the two cations. It is widely recognized
that a high Na concentration inhibits K uptake by plants. On the other hand, Na appeared to
stimulate the K uptake by plants. Salinity stress has significant inhibitory effects on the
concentrations of K, Ca, and Mg as well as stimulatory effects of these nutrient elements on
different crop plants (Alam, 1999). With the increasing concentration of NaCl salts, K
concentration decreased in the leaves, stems and roots, and was accompanied by a substantial
increase of Na in the organs.
In lowland rice, plants adapt to saline conditions and avoid dehydration by reducing the osmotic
potential of plant cells. Antagonistic effects on nutrient uptake may occur, causing deficiencies,
particularly of K and Ca under conditions of excessive Na content. For example, Na is
antagonistic to K uptake in sodic soils with moderate to high available K, resulting in high Na:K
ratio in the rice plant and reduced K transport rates. Sodium-induced inhibition of Ca uptake and
transport limits shoot growth. Increasing salinity inhibits nitrate reductase activity, decreases
chlorophyll content and photosynthetic rate, and increases the respiration rate and N content in
the plant. Plant K and Ca contents decrease but the concentrations of NO3- –N, Na, S, and Cl in
shoot tissue increase.

61
D. Secondary nutrients
Calcium plays a vital nutritional and physiological role in plant metabolism. Calcium, which like
K also is an essential mineral nutrient, helps in maintaining membrane integrity, is important in
senescence processes, and is known to counteract the harmful effects of Na on crops (Lahaye and
Epstein, 1971). Plant growth is dependent on Ca2+
, and both cell division and cell elongation
processes are affected by the Ca2+
ion concentration.
The presence of Ca2+
as the dominant cation in agricultural soils generally ensures that the
absolute Ca2+
level is not a primary growth-limiting factor. As salinity increases, the requirement
of plants for Ca2+
increases. The uptake of Ca2+
from the soil solution may decrease because of
ion interactions, precipitation, and increases in ionic strength that reduce the activity of Ca2+
. In
citrus, Ca was found to be effective in reducing the transport of both Na and Cl from the roots to
leaves. Maintaining an adequate supply of Ca2+
in the soil solution is an important factor in
controlling the severity of specific ion toxicities.
The magnesium content of the leaves of saline-treated bean plants increased, whereas it
decreased in the root. Hodson et al. (1982) found potentially toxic concentrations of Mg in salt-
marsh soil solution samples and demonstrated that a salt-marsh clone, Agrostis stolonifera, was
considerably more tolerant to Mg2+
than was an inland clone. Magnesium concentration of
avocado leaves was decreased with an increase in the exchangeable Na in the soil. In rice, Mg
transport to the tops was suppressed by Na compared with Mg uptake (Song and Fujiwara,
1996). The Mg content in the roots revealed the competition between Mg and Na uptake and
transport to the tops (Alam, 1999, Alfocea et al., 1993).
E. Micronutrients
The concentrations of micronutrients in the soil solutions, with the exception of Cl, seem to be
low and depend on the physical and chemical characteristics of the soil bodies. The availability
of most micronutrients depends on the pH of the soil solution as well as the nature of binding
sites on organic and inorganic particle surfaces. In saline soils, the solubility of micronutrients
such as Fe, Mn, Zn and Cl is particularly low and plants grown in these soils often experience
deficiencies in these elements (Alam, 1999, Page et al., 1990). Nevertheless, the micronutrient
concentration in plant shoots may increase, decrease, or have no effect depending on the type of
plant tissue, salt tolerance of plant species, salinity, micronutrient concentration, environmental
conditions, and/ or abrupt changes in the permeability of the crop cell membranes.
Work done so far on the role of micronutrients in coastal saline soils is meagre. The soils are
generally rich in micronutrients, such as Fe, Mn, Zn, Cu, B and Mo. In the coastal sands of
Andhra Pradesh in India the soils are deficient in Zn as well as in N, P and K. Iron chlorosis is
common to crops like sugarcane (Saccharum officinarum L), jowar (Sorghum bicolor L.
Moench), rainfed rice (Oryza sativa L.), etc. In Andhra Pradesh salinity accentuated the zinc
deficiency. In coastal saline soils, it was found that the amount of Zn available to the plants

62
decreased with submergence (Maji and Bandyopadhyay, 1990). High amount of CaCO3 (up to
15%) is congenial to Zn and Fe deficiency disorders. High dose of Zn application is
recommended in rice as foliar spray. Zn deficiency was noted from various laterite and lateritic
soils in other coastal states in India. Besides, Al and Fe toxicities too have been reported from a
few acid lateritic soils along the coast. Both Fe and Mn contents were reported to increase in all
parts of the salt-treated peanut plants (Chavan and Karadge, 1980). The increase in Fe contents
was more prominent than that of Mn. Salinity increased the Fe concentration in the shoots of pea
and rice and decreased its concentration in the shoots of barley and corn (Hassan et al., 1970).
Alleviation of nutrient deficiency in cyclone affected coastal areas
Additions of N and P generally increase the growth of plants grown in N- and P-deficient
environments, provided that the plant is not experiencing severe salt stress. When both salinity
and nutrient deficiency are responsible for limiting growth, relief of the most limiting factor will
promote growth more than the relief of the less limiting factor. Therefore, addition of a limiting
nutrient can either increase, decrease, or have no effect on relative plant tolerance to salinity,
depending on the level of salt stress. Failure to account for the severity of salt stress when
interpreting salinity and nutrient interactions has caused considerable confusion among
researchers in the past.
Saline soils can successfully be cultivated by removing excessive soluble salts through
reclamation techniques. Reclamation of saline soils depends on the local conditions, available
resources and the kind of crops that can be grown during reclamation. Reclamation can be
accomplished in the long run by continued irrigation and cropping, inclusion of rice in cropping
system together with incorporation of large quantities of organic manure (Gupta and Abrol,
1990). Reclamation of saline soils is by reducing the soil salinity to acceptable levels. In saline
soils, maintenance of crop productivity at optimum level requires consideration of salt
distribution within root zones that is influenced by the water extraction pattern of the crop, the
method of water application, soil profile modifications, mulching, rain water leaching and
adoption of an appropriate crop rotation involving salt tolerant cultivars (U.S. Salinity
Laboratory, 1954).
Long term field experiment in coastal saline soils in India showed that rice and wheat yield could
be maintained with 50% NPK used in conjunction with FYM or green manure (DARE, 2003-
04). In another detailed long term experiment conducted (CSSRI, 1990) in Sundarbans (India) it
was observed that grain yield of crops in a rice-barley rotation increased significantly only due to
the application of N. Application of P did not show any significant increase in the yield of crops
in the initial 8 years, after which the yield of barley alone increased due to P application.
Available K content was high in the soil. The experiments conducted so far showed that a basal
dose of 11 kg P ha-1
for rice and 5.5 kg P ha-1
for barley or for similar upland crops should
maintain the fertility status of the soil, whereas the K application may be omitted without any
detrimental effect on soil fertility or crop growth. The K removal by the crop was compensated

63
by K added through accumulation and release of non-exchangeable sources. In Sri Lanka
addition of Gliricidia muculata in combination with phosphate and a small dose of inorganic
fertilizer was effective to secure high rice yields (Deturckl et al.,
http://www2.alterra.wur.nl/Internet/webdocs/ilri-publicaties/publicaties/Pub53/pub53-h8.pdf). In
India, for the coastal acid sulphate soils of Sundarbans, application of lime, superphosphate and
rock phosphate have been found beneficial in improving the soil properties and rice growth
(Bandyopadhyay, 1989). Application of Ca-rich oystershell, which is available in plenty, was
found beneficial, if applied in powdered form, as an inexpensive alternative soil ameliorating
agent. In this soil continuous submergence for one year could not improve the soil properties
substantially. Effect of salinity on the microbial and biochemical parameters of the salt-affected
soils in Sundarbans (India) was studied at nine different sites. The study revealed that the
average microbial biomass C (MBC), average basal soil respiration (BSR), and average
fluorescein diacetate hydrolyzing activity (FDHA) were lowest during the summer season,
indicating the adverse effect of soil salinity (Tripathi et al., 2006). It was suggested that
integrated nutrient management should be very effective for increasing its use efficiency for
higher and sustainable yield of crops (Bandyopadhyay et al., 2006, Tripathi et al., 2007).
Bandyopadhyay and Rao (2001) were of the opinion to introduce systems approach involving
organic, inorganic and biofertlizers compatible with the farmers’ practice. In coastal soil at Tamil
Nadu (India), application of agro-industrial wastes significantly improved soil organic carbon,
pH, EC and soil bacteria, fungus and actinomycetes population and enhanced the soil fertility
status (macro and micro nutrients) and improved the crop productivity of finger millet.
Application of pressmud @12.5 t ha-1
recorded better growth and yield of finger millet followed
by composted coirpith @ 12.5 t ha-1
(Rangaraj et al., 2007).
References
Abdul-Kadir, S.M. and Paulsen, G.M. (1982). Effect of salinity on nitrogen metabolism in
wheat. Journal of Plant Nutrition 5: 1141.
Alam Syed Manjoor (1999). Nutrient uptake by plants under stress conditions. In Handbook of
Plant and Crop Stress (2nd Edn.), Mohammad Pessarakli (ed.), pp.285-313, Marcel Dekker, Inc.
Alfocea, F.P., Estan, M.T., Caro, M. and Bolarin, M.C. (1993). Response of tomato cultivars to
salinity. Plant & Soil 150: 203.
Aslam, M., Huffaker, R.C. and Rains, D.W. (1984). Early effects of salinity on nitrate
assimilation in barley seedlings. Plant Physiology 76: 312.

64
Awad, A.S., Edwards, D.G. and Campbell, L.C. (1990). Phosphorus enhancement of salt
tolerance of tomato. Crop Science 30: 123.
Bandyopadhyay, A.K. (1989). Effect of lime, superphosphate, powdered oystershell, rock
phosphate and submergence on soil properties and crop growth in coastal saline acid sulphate
soils of Sundarbans. Paper presented in International Symposium on Rice Production on Acid
Soil of the Tropics, held at the Institute of Fundamental Studies, Kandy, Sri Lanka, 26-30 Jun
1989.
Bandyopadhyay, B.K., Bandyopadhyay, A.K. and Bhagava,G.P. (1985). Characterization of soil
potassium and quality intensity relationship of potassium in some coastal soils. Journal of Indian
Society of Soil Science 3: 548-554.
Bandyopadhyay, B.K. (1990). Fertility of salt affected soils in India – An overview. Journal of
Indian Society of Coastal Agricultural Research 8: 61-78.
Bandyopadhyay, B.K., Sen, H.S. and Maji, B. (1995). Reduction of sulphate salts and black
colour formation in coastal saline soils of Sundarban under paddy cultivation. Proceedings
National Seminar on Challenges and Opportunities of Research and Development in Coastal
Agriculture, held at OUAT, Bhubaneswar, 26-29 Dec. 1995, Indian Society of Coastal
Agriculture Research, CSSRI, RRS Canning, West Bengal, India.
Bandyopadhyay, B.K. and Rao, D.L.N. (2001). Integrated nutrient management in saline
soils. Journal of Indian Society of Coastal Agricultural Research 19 (1&2): 35-58.
Bandyopadhyay, B.K., Burman, D., Majumder, A., Prasad, P.R.K., Dawood, M. Sheik and
Mahata, K.R. (2006) Integrated nutrient management for coastal salt affected soils of India under
rice-based cropping system. Journal of Indian Society of Coastal Agricultural Research 24(1):
130-134
Biswas, C.R. et al.(1990). J. Indian Soc. Coastal Agric. Res., 8 (1):37 – 41.
Bandyopadhyay, A. K., and Bandyopadhyay, B.K. (1984). Fertil News, 29(8):18-22
Chavan, P.D. and Karadge, B.A. (1980). Influence of salinity on mineral nutrition of peanut
(Arachis hypogea L.). Plant & Soil 54: 5.
CSSRI (1990). Annual Report 1989-90, Central Soil Salinity Research Institute, Karnal,
Haryana, India, 265p

65
DARE (2003-04). Natural Resource Management
(http://www.dare.gov.in/report/NATURAL_RESOURCE_MANAGEMENT.pdf).
Deturckl, P., Weerasinghe, K.D.N., Gunarathna, D.A.B.N., Lexa, J.P. and Vlassak,K. Rice
production on acid sulphate soils of Sri Lanka (http://www2.alterra.wur.nl/Internet/webdocs/ilri-
publicaties/publicaties/Pub53/pub53-h8.pdf).
Gibson,T.S. (1988). Carbohydrate metabolism and phosphorus/salinity interactions in wheat
(Triticum aestivum L.) Plant and Soil 111: 25-35.
Gupta, R.K. and Abrol, I.P. (1990). Salt-affected soils; their reclamation and management for
crop production. In “Advances in Soil Science” (R. Lal, & B.A. Stewart, eds.), pp. 223-288.
Springer, New York
Hassan, N.A.K., Drew, J.V., Knudson, D. and Olson, R.A. (1970). Influence of soil salinity on
production of dry matter and uptake and distribution of nutrients in barley and corn. 1. Barley.
Agronomy Journal 62: 43.
Hodson, M.J., Smith, M.M., Wainwright, S.J. and Opik, H. (1982). Cation cotolerance in a salt-
tolerant alone of Agrostis stolonifera L. New Phytology 90: 253.
Lahaye, P.A. and Epstein, E. (1971). Calcium and salt tolerance by bean plants. Plant Physiology
25: 213.
Maji, B. and Bandyopadhyay, B.K. (1991). Micro nutrient research in coastal salt affected soils.
Journal of Indian Society of Coastal Agricultural Research 9: 219-223.
Niazi, M.L.K., Mohmood, K., Mujtaba, S.M. and Malik, K.A. (1992). Salinity tolerance in
different cultivars of barley (Hordium vulgare L.). Biologia Plantarum 34: 30.
Page, A.L., Chang, A.C. and Adriano, D.C. (1990). Deficiencies and toxicites of trace elements.
In Agricultural Salinity Assessment and Management, K.K.Tanji (ed.), pp. 138-160, ASCE
Manuals and Reports on Engineering Practice No. 71, ASCED.
Papadopoulos, I. and Rendig, V.V. (1983). Interactive effects of salinity and nitrogen on growth
and yield of tomato plants. Plant & Soil 73: 47.
Ponnamperuma, F.N. (1972). Ad. Agron., 24: 29 – 92.

66
Rangaraj, T., Somasundaram, E., Mohamed Amanullah, M., Thirumurugan, V., Ramesh, S.
and Ravi, S. (2007). Effect of agro-industrial wastes on soil properties and yield of irrigated
finger millet (Eleusine coracana L. Gaertn) in coastal soil. Research Journal of Agriculture and
Biological Sciences, 3(3): 153-156.
Scandalios, J.G. (1993). Oxygen stress and superoxide dismulases. Plant Physiology 101: 7.
Sen, H.S. and Bandyopadhyay, B.K. (1987). Volatilization loss of nitrogen from submerged rice
soil. Soil Science 143: 34-39.
Sharpley, A.N., Meisinger, J.J., Power, J.F. and Suarez, D.L. (1992). Root extraction of nutrients
associated with long-terms soil management. In Advances in Soil Science, B. Steward (ed.), pp.
151-217, Berlin: Springer-Verlag.
Song, J.Q. and Fujiwara, H. (1996). Ameliorative effect of potassium on rice and tomato
subjected to sodium salinization. Soil Science & Plant Nutrition 42: 493.
Szabolcs, I. (1979). Review of research in salt-affected soils. Natural Resource Research 15,
UNESCO, Paris, 137p.
Szabolcs, I. (1979). Review of research in salt-affected soils. Natural Resource Research 15,
UNESCO, Paris. 137p.
Tripathi Sudipta, Kumari Sabitri, Chakroborty Ashis, Gupta Arindam, Chakrabarti Kalyan and
Bandyopadhyay Bimal (2006). Microbial biomass and its activities in salt-affected coastal
soils. Biology and Fertility of Soils 42(3): 273-277.
Tripathi, S., Chakraborty, A., Bandopadhyay, B.K. and Chakraborty, K. (2007). Effect of
integrated application of manures and fertilizer on soil microbial, bio-chemical properties and
yields of crops in a salt-affected coastal soil of India. Proceedings International Symposium on
“Management of Coastal Ecosystem: Technological Advancement and Livelihood Security”,
held at Kolkata, India, 27-30 Oct 2007, pp. 58. Indian Society of Coastal Agricultural Research.
Velayutham, M., Sarkar, D., Reddy, R.S., Natarajan, A., Shiva Prasad, C.R., Challa, O.,
Harindranath, C.S., Shyampura, R.L., Sharma, J.P. and Bhattacharya, T. (1999). Soil resources
and their potentialities in coastal area of India. J. Indian Soc. Coastal agric. Res., 17(1&2), 29-4
Yadav, J.S.P. (1979). Fert. News, 24:67-74.
Yadav, J.S.P., Bandyopadhyay, A.K. and Bandyopadhyay, B.K. (1983). Extent of coastal saline
soils of India. Journal of Indian Society of Coastal Agricultural Research 1(1): 1-6.
Yadav, J.S.P. (1996). J. Indian Soc. Coastal Agric. Res., 14 (1 & 2):17-29.
Yadav, J.S.P. (2008). Sustainable management of coastal ecosystem for livelihood security: a
global perspective. Journal of Indian Society of Coastal Agricultural Research 26(1): 5-11.
***

67
Role of Disaster Management Acts and Policies in Cyclone Mitigation
Planning in India
Dr. S. Roy Chowdhury
Principal Scientist
Directorate of Water Management (ICAR), Bhubaneswar – 751023, Odisha
The agriculture sector in India faces severe challenges in the form of natural disasters causing
heavy crop loss and poor crop productivity. Several times, these disasters create more havoc as
they result in another unfavorable event. For example, cyclone disaster always accompanies with
major storms, floods and heavy wind and it is very common to witness significant caused by
associated events in addition to the main event itself. Tropical cyclogenesis is very common in
the northern reaches of the Indian Ocean in and around the Bay of Bengal which result in
cyclones. The frequency of occurrence of cyclone is a major worry in India. In India, the cyclone
season runs from April to December, with peak activity between May and November. Low
intensity storms with sustained wind speeds greater than 63 km per hour are very frequent and it
is observed that a major cyclone (Category 3 or higher) develops every alternate year.
The main cause of the cyclone event in India is intense heating in the Bay of Bengal during
summer resulting in humid and unstable air masses. As a result, India witnessed significant
number of cyclones including worst ever cyclones like the 1737 Calcutta cyclone, the 1970
Bhola cyclone, the 1991 Bangladesh cyclone and the 1999 Odisha super cyclone. This resulted in
severe crop loss affecting food security of the nation. The major states that get affected due to
cyclone are Andhra Pradesh, Odisha, Tamil Nadu, and West Bengal located on eastern coast. In
western coast, the frequency and extent of damage by cyclones is relatively less and they mainly
affect Gujarat and Kerala. Some cyclone events like super cyclone in Odisha (1999) resulted in
peak winds of more than 250 kmph (equivalent to category 5 hurricane) causing damage to lakhs
of hectares of agricultural land in addition to disruption of 20 million people and death of more
than 10000 people.
The natural disasters like cyclone can be predicted before their occurrence though the accuracy
varies from event to event. At the same time, we also understand the fact that cyclone affects
some coastal states very frequently. This calls for an urgent need to chalk out a strategy to face
the cyclone events in an integrated manner. A good forecasting and well prepared multipronged
strategy can result in reduction of disruption of human life and it can potentially reduce the
damage to agricultural sector (Roy and Kovordanyi, 2012). This can be very much witnessed
from the experience of successful management of phailin in 2013. In other words, the balanced
combination of science (prediction of cyclone and forecasting) and policy (development of
different acts related to pre and post cyclone management) is required for reducing the damage

68
of cyclone on agriculture sector. The role of resilience building among the communities in
management of super cyclone affected areas in Odisha is well acknowledged now (Chhotray and
Few, 2012).At the same time, we have developed regulations and acts on disaster management in
common which includes floods, cyclones, drought, earthquakes etc. and it is really difficult to
study them in segregation with respect to individual event like cyclone.
In this context, various stakeholders working in the field of cyclone disaster management must
have awareness about various disaster management acts enacted in India.
Disaster Management Act, 2005
The Disaster Management Act, 2005 has 11 chapters and 79 sections and it extends to the whole
of India. The Act provides for "the effective management of disasters and for matters connected
therewith or incidental thereto. The Act lays down institutional, legal, financial and coordination
mechanisms at the National, State, District and Local levels. These institutions are not parallel
structures and will work in close harmony. The new institutional framework is expected to usher
in a paradigm shift in DM from relief-centric approach to a proactive regime that lays greater
emphasis on preparedness, prevention and mitigation.
Institutional Framework under the Act
National Disaster Management Authority (NDMA)
The NDMA, is the apex body for disaster management, headed by the Prime Minister and has
the responsibility for laying down policies, plans and guidelines for DM and coordinating their
enforcement and implementation for ensuring timely and effective response to disasters. The
guidelines will assist the Central Ministries, Departments and States to formulate their respective
DM plans. It will approve the National Disaster Management Plans and DM plans of the Central
Ministries/Departments. It will take such other measures, as it may consider necessary, for the
prevention of disasters, or mitigation, or preparedness and capacity building, for dealing with a
threatening disaster situation or disaster. Central Ministries/Departments and State Governments
will extend necessary cooperation and assistance to NDMA for carrying out its mandate. It will
oversee the provision and application of funds for mitigation and preparedness measures. NDMA
has the power to authorize the Departments or authorities concerned, to make emergency
procurement of provisions or materials for rescue and relief in a threatening disaster situation or
disaster. The general superintendence, direction and control of the National Disaster Response
Force (NDRF) is vested in and will be exercised by the NDMA. The National Institute of
Disaster Management (NIDM) works within the framework of broad policies and guidelines laid
down by the NDMA.

69
The NDMA is mandated to deal with all types of disasters; natural or man-made. Whereas, such
other emergencies including those requiring close involvement of the security forces and/or
intelligence agencies such as terrorism (counter-insurgency), law and order situations, serial
bomb blasts, hijacking, air accidents, CBRN weapon systems, mine disasters, port and harbor
emergencies, forest fires, oilfield fires and oilspills will continue to be handled by the extant
mechanism i.e., National Crisis Management Committee (NCMC).
NDMA may, however, formulate guidelines and facilitate training and preparedness activities in
respect of CBRN emergencies. Cross-cutting themes like medical preparedness, psycho-social
care and trauma, community based disaster preparedness, information and communication
technology, training, preparedness, awareness generation etc., for natural and man-made
disasters will also engage the attention of NDMA in partnership with the stakeholders concerned.
Resources available with the disaster management authorities at all levels, which are capable of
discharging emergency support functions, will be made available to the nodal
Ministries/Agencies dealing with the emergencies at times of impending disaster(s).
National Executive Committee (NEC)
The NEC comprises the Union Home Secretary as Chairperson, and the Secretaries to the GoI in
the Ministries/Departments of Agriculture, Atomic Energy, Defence, Drinking Water Supply,
Environment and Forests, Finance (Expenditure),Health, Power, Rural Development, Science
&Technology, Space, Telecommunications, Urban Development, Water Resources and the Chief
of the Integrated Defence Staff of the Chiefs of Staff Committee as members. Secretaries in the
Ministry of External Affairs, Earth Sciences, Human Resource Development, Mines, Shipping,
Road Transport & Highways, and the Secretary, NDMA will be special invitees to the meetings
of the NEC.
The NEC is the executive committee of the NDMA, and is mandated to assist the NDMA in the
discharge of its functions and also ensure compliance of the directions issued by the Central
Government. The NEC is to coordinate the response in the event of any threatening disaster
situation or disaster. The NEC will prepare the National Plan for Disaster Management based on
the National Policy on Disaster Management. The NEC will monitor the implementation of
guidelines issued by NDMA. It will also perform such other functions as may be prescribed by
the Central Government in consultation with the NDMA. State Disaster Management Authority
(SDMA)
At the State level, the SDMA, headed by the Chief Minister, will lay down policies and plans for
DM in the State. It will, inter alia approve the State Plan in accordance with the guidelines laid
down by the NDMA, coordinate the implementation of the State Plan, recommend provision of
funds for mitigation and preparedness measures and review the developmental plans of the
70
different Departments of the State to ensure the integration of prevention, preparedness and
mitigation measures.
The State Government shall constitute a State Executive Committee (SEC) to assist the SDMA
in the performance of its functions. The SEC will be headed by the Chief Secretary to the State
Government and coordinate and monitor the implementation of the National Policy, the National
Plan and the State Plan. The SEC will also provide information to the NDMA relating to
different aspects of DM.
District Disaster Management Authority (DDMA)
The DDMA will be headed by the District Collector, Deputy Commissioner or District
Magistrate as the case may be, with the elected representative of the local authority as the Co-
Chairperson. The DDMA will act as the planning, coordinating and implementing body for DM
at the District level and take all necessary measures for the purposes of DM in accordance with
the guidelines laid down by the NDMA and SDMA. It will, inter alia prepare the District DM
plan for the District and monitor the implementation of the National Policy, the State Policy, the
National Plan, the State Plan and the District Plan. The DDMA will also ensure that the
guidelines for prevention, mitigation, preparedness and response measures laid down by the
NDMA and the SDMA are followed by all the Departments of the State Government at the
District level and the local authorities in the District.
Local Authorities
For the purpose of this Policy, local authorities would include Panchayati Raj Institutions (PRI),
Municipalities, District and Cantonment Boards, and Town Planning Authorities which control
and manage civic services. These bodies will ensure capacity building of their officers and
employees for managing disasters, carry out relief, rehabilitation and reconstruction activities in
the affected areas and will prepare DM Plans in consonance with the guidelines of the NDMA,
SDMAs and DDMAs. Specific institutional framework for dealing with disaster management
issues in mega cities will be put in place.
National Institute of Disaster Management (NIDM)
The NIDM, in partnership with other research institutions has capacity development as one of its
major responsibilities, along with training, research, documentation and development of a
national level information base. It will network with other knowledge-based institutions and
function within the broad policies and guidelines laid down by the NDMA. It will organize
training of trainers, DM officials and other stakeholders. The NIDM will strive to emerge as a
‘Centre of Excellence’ in the field of Disaster Management.

71
National Disaster Response Force (NDRF)
For the purpose of specialized response to a threatening disaster situation or
disasters/emergencies both natural and man-made such as those of CBRN origin, the Act has
mandated the constitution of a National Disaster Response Force (NDRF). The general
superintendence, direction and control of this force shall be vested in and exercised by the
NDMA and the command and supervision of the Force shall vest in an officer to be appointed by
the Central Government as the Director General of Civil Defence and National Disaster
Response Force. Presently, the NDRF comprises eight battalions and further expansion may be
considered in due course. These battalions will be positioned at different locations as maybe
required. NDRF units will maintain close liaison with the designated State Governments and will
be available to them in the event of any serious threatening disaster situation. While the handling
of natural disasters rests with all the NDRF battalions, four battalions will also be equipped and
trained to respond to situations arising out of CBRN emergencies. Training centres will be set up
by respective paramilitary forces to train personnel from NDRF battalions of respective Forces
and will also meet the training requirements of State/UT Disaster Response Forces. The NDRF
units will also impart basic training to all the stakeholders identified by the State Governments in
their respective locations. Further, a National Academy will be set up to provide training for
trainers in disaster management and to meet related National and International commitments.
Mitigation Reserves
Experience in major disasters in the last decade has clearly established the need for
prepositioning of some essential reserves at crucial locations, including some for the high
altitude areas. These reserves are intended to augment the resources at the State level. Mitigation
reserves will be placed at the disposal of the NDRF for enhancing their emergency response
capabilities for assisting the State Governments during a disaster or disaster-like situation.
Existing Institutional Arrangements
Cabinet Committee on Management of Natural Calamities (CCMNC) and the Cabinet
Committee on Security (CCS).
CCMNC had been constituted to oversee all aspects relating to the management of natural
calamities including assessment of the situation and identification of measures and programmes
considered necessary to reduce its impact, monitor and suggest long-term measures for
prevention of such calamities, formulate and recommend programmes for public awareness for
building up society’s resilience to them. The CCS deals with issues related to defence of the
country, law and order and internal security, policy matters concerning foreign affairs that have
internal or external security implications, and economic and political issues impinging on
National security.

72
High Level Committee (HLC)
In the case of calamities of severe nature, Inter-Ministerial Central Teams are deputed to the
affected States for assessment of damage caused by the calamity and the amount of relief
assistance required. The Inter-Ministerial Group (IMG), headed by the Union Home Secretary,
scrutinizes the assessment made by the Central Teams and recommends the quantum of
assistance to be provided to the States from the National Calamity Contingency Fund (NCCF).
However, assessment of damages by IMG in respect of drought, hail storm and pest attack will
continue to be headed by the Secretary, Ministry of Agriculture and Cooperation. The HLC
comprising the Finance Minister as Chairman and the Home Minister, Agriculture Minister, and
Deputy Chairman of the Planning Commission as members approves the Central assistance to be
provided to the affected States based on the recommendations of the IMG. The constitution and
composition of HLC may vary from time to time. The Vice Chairman, NDMA will be a special
invitee to the HLC.
Central Government
In accordance with the provisions of the Act, the Central Government will take all such
measures, as it deems necessary or expedient, for the purpose of DM and will coordinate actions
of all agencies. The Central Ministries and Departments will take into consideration the
recommendations of the State Government Departments while deciding upon the various pre-
disaster requirements and for deciding upon the measures for prevention and mitigation of
disaster. It will ensure that the Central Ministries and Departments integrate measures for the
prevention and mitigation of disasters into their developmental plans and projects, make
appropriate allocation of funds for pre-disaster requirements and take necessary measures for
preparedness and to effectively respond to any disaster situation or disaster. It will have the
power to issue directions to NEC, State Governments/SDMAs, SECs or any of their officers or
employees, to facilitate or assist in DM, and these bodies and officials shall be bound to comply
with such directions. The Central Government will extend cooperation and assistance to the State
Governments as required by them or otherwise deemed appropriate by it. It will take measures
for the deployment of the Armed Forces for disaster management. The Central Government will
also facilitate coordination with the UN Agencies, International Organisations and Governments
of Foreign Countries in the field of disaster management. The Ministry of External Affairs in
coordination with the Ministry of Home Affairs (MHA) will facilitate external
coordination/cooperation.
Role of Central Ministries and Departments
As disaster management is a multidisciplinary process, all Central Ministries and Departments
will have a key role in the field of disaster management. The nodal Ministries and Departments
of the GoI (i.e., the Ministries of Agriculture, Atomic Energy, Civil Aviation, Earth Sciences,
Environment & Forests, Home Affairs, Health, Mines, Railways, Space, Water Resources etc.)
will continue to address specific disasters as assigned to them.

73
National Crisis Management Committee (NCMC)
The NCMC, comprising high level officials of the GoI headed by the Cabinet Secretary, will
continue to deal with major crises which have serious or National ramifications. It will be
supported by the Crisis Management Groups (CMG) of the Central nodal Ministries and assisted
by NEC as may be necessary. The Secretary, NDMA may be a member of this Committee.
State Governments
The primary responsibility for disaster management rests with the States. The institutional
mechanism put in place at the Centre, State and District levels will help the States manage
disasters in an effective manner. The Act mandates the State Governments inter alia to take
measures for preparation of Disaster Management Plans, integration of measures for prevention
of disasters or mitigation into development plans, allocation of funds, establishment of early
warning systems, and to assist the Central Government and other agencies in various aspects of
Disaster Management.
District Administration
At the District level, DDMAs will act as the District planning, coordinating and implementing
body for disaster management and will take all measures for the purposes of disaster
management in the District in accordance with the guidelines laid down by NDMA and SDMA.
Management of Disasters Impacting more than one State
At times, the impact of disasters occurring in one State may spread over to the areas of other
States. Similarly, preventive measures in respect of certain disasters, such as floods, etc., maybe
required to be taken in one State, though the impact of their occurrence may affect another. The
administrative hierarchy of the country is organized into National, State and District level
administrations. This presents some difficulties in respect of disasters impacting more than one
State. Management of such situations calls for a coordinated approach, which can respond to a
range of issues quite different from those that normally present themselves, before, during and
after the event. NDMA will encourage identification of such situations and promote the
establishment of mechanisms on the lines of Mutual Aid Agreement for coordinated strategies
for dealing with them by the States, Central Ministries and Departments and other agencies
concerned.
Other Institutional arrangements
Armed Forces
Conceptually, the Armed Forces are called upon to assist the civil administration only when the
situation is beyond their coping capability. In practice, however, the Armed Forces form an
important part of the Government’s response capacity and are immediate responders in all

74
serious disaster situations. On account of their vast potential to meet any adverse challenge,
speed of operational response and the resources and capabilities at their disposal, the Armed
Forces have historically played a major role in emergency support functions. These include
communication, search and rescue operations, health and medical facilities, and transportation,
especially in the immediate aftermath of a disaster. Airlift, heli-lift and movement of assistance
to neighbouring countries primarily fall within the expertise and domain of the Armed Forces.
The Armed Forces will participate in imparting training to trainers and DM managers, especially
in CBRN aspects, heli-insertion, high-altitude rescue, watermanship and training of paramedics.
At the National level, the Chief of the Integrated Defence Staff to the Chairman Chiefs of Staff
Committee has already been included in the NEC. Similarly, at the State and District levels, the
local representatives of the Armed Forces may be included in their executive committees to
ensure closer coordination and cohesion.
Central Paramilitary Forces
The Central Paramilitary Forces (CPMFs), which are also the Armed Forces of the Union, play a
key role at the time of immediate response to disasters. Besides contributing to the NDRF, they
will develop adequate disaster management capabilities within their own forces and respond to
disasters which may occur in the areas where they are posted. The local representatives of the
CPMFs may be co-opted/invited in the executive committee at the State level.
State Police Forces and Fire Services
The State Police Forces and the Fire Services are crucial immediate responders to disasters. The
Police Forces will be trained and the Fire Services upgraded to acquire multi-hazard rescue
capability.
Civil Defence and Home Guards
The mandate of the Civil Defence and the Home Guards will be redefined to assign an effective
role in the field of disaster management. They will be deployed for community preparedness and
public awareness. A culture of voluntary reporting to duty stations in the event of any disaster
will be promoted.
State Disaster Response Force (SDRF)
States will be encouraged to create response capabilities from within their existing resources. To
start with, each State may aim at equipping and training one battalion equivalent force. They will
also include women members for looking after the needs of women and children. NDRF
battalions and their training institutions will assist the States/UTs in this effort. The States/UTs
will also be encouraged to include DM training in their respective Police Training Colleges and
basic and in-service courses, for gazetted and non-gazetted officers.

75
Role of National Cadet Corps (NCC), National Service Scheme (NSS) and Nehru Yuva
Kendra Sangathan (NYKS)
Potential of these youth based organizations will be optimized to support all community based
initiatives and DM training would be included in their programmes.
International Cooperation
Disasters do not recognize geographical boundaries. Major disasters may often may often
simultaneously affect several countries. It will be the National endeavor to develop close
cooperation and coordination with International organizations working in the area of disaster
management.
The nature and extent of damage caused by cyclones and their associated floods is well known
and at the same time, we also have awareness about most frequent cyclone affected coastal
states. This necessitates us to evolve a strategy to face the cyclone events in an effective manner.
A well prepared and scientific based multipronged approach is the need of the hour in which the
role of various stakeholders working in the line of disaster management play significant role.
Hence, the awareness about various acts and policies related to cyclone disaster management in
India is highly essential. This will certainly pave the way for developing an integrated cyclone
management plan thereby reducing the extent of damage to agriculture sector in India.
References
Chhotray, V. and Few, R. 2012. Post cyclone recovery and ongoing vulnerability: Ten years after
the super cyclone of 1999 in Orissa, India. Global Environment Change, 22 (3): 695-702.
http://en.wikipedia.org/wiki/Disaster_Management_Act,_2005
http://www.ndma.gov.in/images/guidelines/national-dm-policy2009.pdf
National Policy on Disaster Management, 2009, GOI, MHA, New Delhi.p56.
Roy, C. and Kovordanyi, R. 2012. Tropical cyclone track forecasting techniques: A review.
Atmospheric research. 104-105 : 40-69.
***

76
Contingency planning and Crop management interventions for cyclone risk
mitigation
Dr. P.S. Brahmanand, Senior Scientist, Dr. S. Roy Chowdhury, Principal Scientist and
Dr. K.G. Mandal, Senior Scientist,
Directorate of Water Management (ICAR), Bhubaneswar – 751023, Odisha
Introduction
Agriculture sector is the backbone of India as it feeds ever growing population and provides
employment to about 58% of the population. Several new advanced techniques have been
developed to enhance the crop productivity further. However, it is mainly dependent on monsoon
and hence faces severe challenge in the form of natural disasters. This trend is clearly visible if
we look in to agricultural production in good and bad monsoon years. The natural disasters like
floods, drought and cyclone are primarily responsible for crop loss and low crop productivity
resulting in poor socio-economic condition of the farmers. Cyclone is one of the natural disasters
which occurs very frequently in India (on an average of six per year) and causes severe crop
damage. The frequency of severe cyclonic storms is more in months of October, November and
May whereas depressions are more common during south west monsoon period (Fig 1). Its
frequency in Eastern Coast of India (Bay of Bengal) is about four times higher than that of
western coast (Arabian sea). The higher intensity of cyclones occurred in the last four decades is
a major worry for agriculture sector (Table 1).
Fig 1: Trend of cyclonic storms in different months in a year
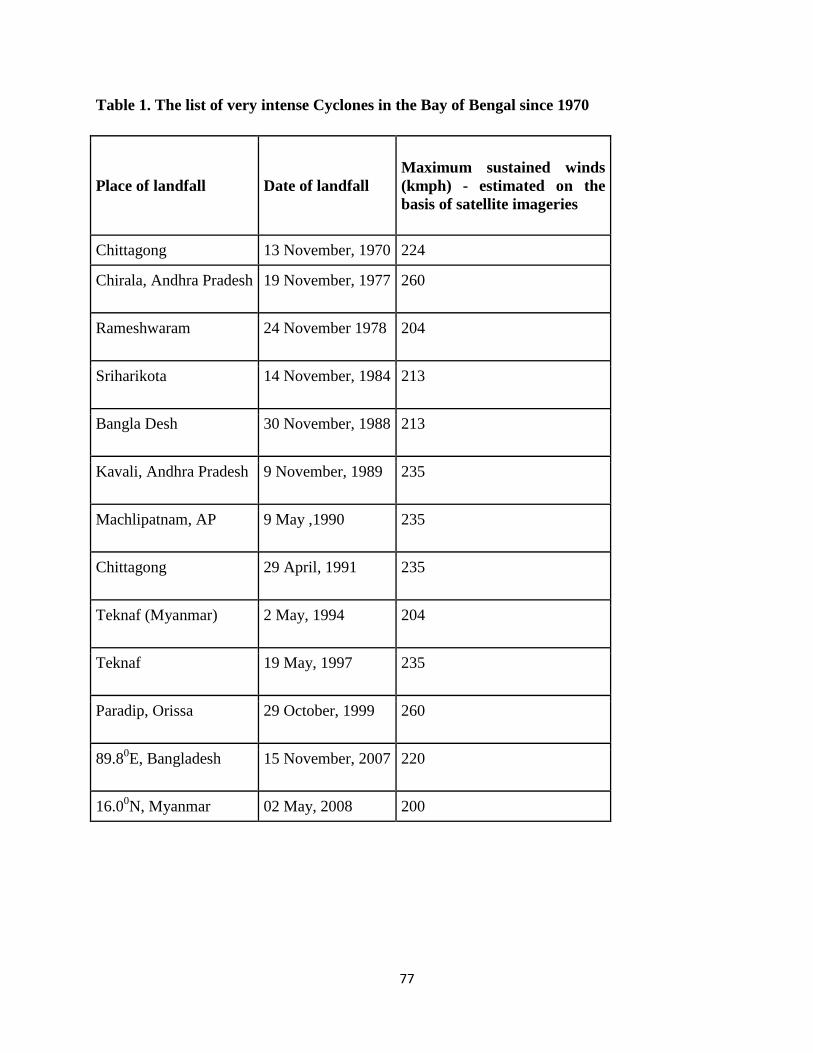
77
Table 1. The list of very intense Cyclones in the Bay of Bengal since 1970
Place of landfall Date of landfall
Maximum sustained winds
(kmph) - estimated on the
basis of satellite imageries
Chittagong 13 November, 1970 224
Chirala, Andhra Pradesh 19 November, 1977 260
Rameshwaram 24 November 1978 204
Sriharikota 14 November, 1984 213
Bangla Desh 30 November, 1988 213
Kavali, Andhra Pradesh 9 November, 1989 235
Machlipatnam, AP 9 May ,1990 235
Chittagong 29 April, 1991 235
Teknaf (Myanmar) 2 May, 1994 204
Teknaf 19 May, 1997 235
Paradip, Orissa 29 October, 1999 260
89.80E, Bangladesh 15 November, 2007 220
16.00N, Myanmar 02 May, 2008 200
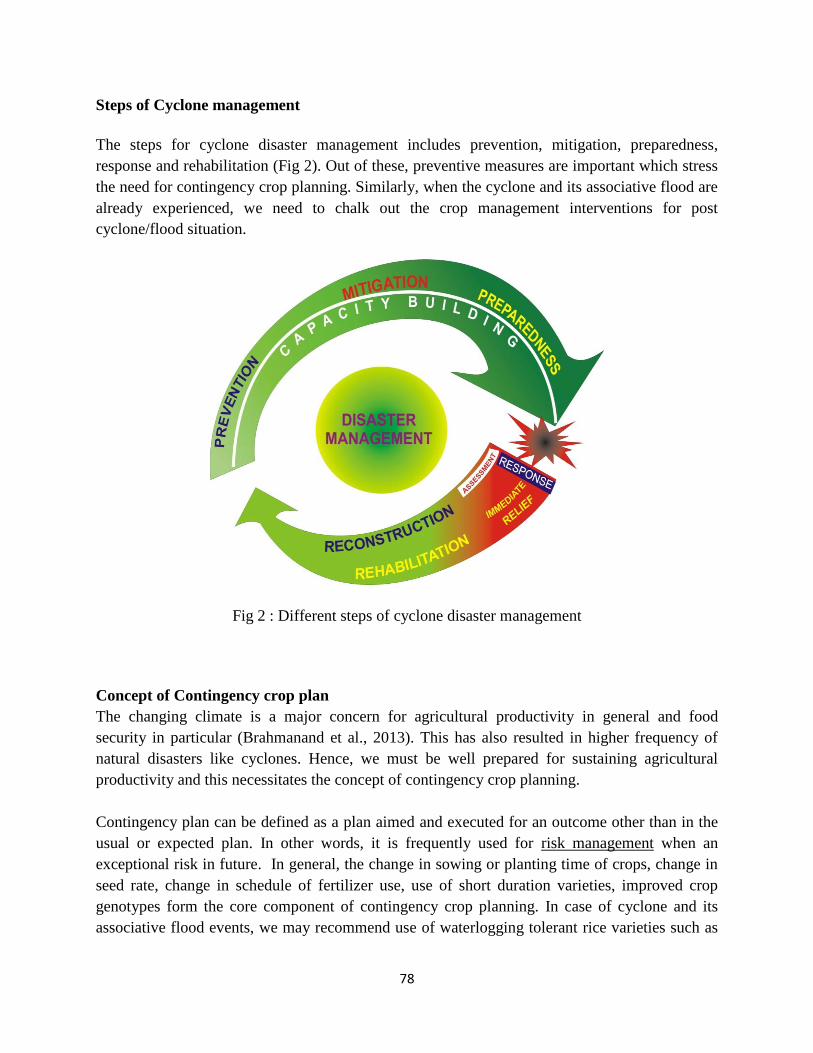
78
Steps of Cyclone management
The steps for cyclone disaster management includes prevention, mitigation, preparedness,
response and rehabilitation (Fig 2). Out of these, preventive measures are important which stress
the need for contingency crop planning. Similarly, when the cyclone and its associative flood are
already experienced, we need to chalk out the crop management interventions for post
cyclone/flood situation.
Fig 2 : Different steps of cyclone disaster management
Concept of Contingency crop plan
The changing climate is a major concern for agricultural productivity in general and food
security in particular (Brahmanand et al., 2013). This has also resulted in higher frequency of
natural disasters like cyclones. Hence, we must be well prepared for sustaining agricultural
productivity and this necessitates the concept of contingency crop planning.
Contingency plan can be defined as a plan aimed and executed for an outcome other than in the
usual or expected plan. In other words, it is frequently used for risk management when an
exceptional risk in future. In general, the change in sowing or planting time of crops, change in
seed rate, change in schedule of fertilizer use, use of short duration varieties, improved crop
genotypes form the core component of contingency crop planning. In case of cyclone and its
associative flood events, we may recommend use of waterlogging tolerant rice varieties such as

79
Varshadhan, Hanseswari, Durga for better resilience. However, in case of flash floods, the use of
swarna sub-1 should form the core component of contingency plan. Similarly, the use of over
aged rice seedlings of 45 days and 60 days old are recommended for cyclone and flood prone
areas. The development of community nursery and seed bank is critical in supply of seedlings of
rice in case of cyclone damage. Atleast seed bank should be developed for 10% of the area under
each block which can be utilized for transplanting in post cyclone period.
Crop management interventions for post cyclone / flood situation: Case study
In considerable area in Eastern India, water starts accumulating in the field with onset of
monsoon season and water depth rises up to 60 cm or more and continues till maturity of the
crop (Jahn et al., 2001 and Biswas et al., 1986). This situation becomes more vulnerable when
cyclone and its associated flood occurs. All the engineering and cropping interventions fail in
addressing the farming problems during the cyclone/flood season. However, when the flood
water recedes gradually, there is an ample scope to implement alternate crop strategies if proper
planning is done. Hence, the post cyclone/flood management assumes prime importance for
enhancing the crop productivity in India. Eastern India is frequently subjected to cyclone and
floods and hence the successful post flood management through contingency crop planning
would be of paramount importance in enhancing the crop productivity and thereby ensuring the
food security of our nation. Odisha is one of the most important states in Eastern India which is
endowed with plenty of natural resources. However, its crop productivity has been found to be
quite poor due to waterlogging and cyclone / flood problem. Kendrapada district in Odisha is
most susceptible to cyclone associated flood as well as floods due to water inundation from
Mahanadi and Paika rivers.
Rice is the major food grain crop grown in Kendrapada district during kharif season and its
productivity is very poor due to flood occurrence. The cultivation of flood tolerant long duration
rice varieties would certainly boost the crop productivity. However, when flash floods occur, the
survival of rice crop becomes difficult leaving the farming community in negative economic
situation. After the harvest of rice crop, generally greengram is grown which is harvested in the
month of January-February. After the harvest of greengram, the residual moisture left in the soil
can be utilized by growing alternate crops that require less amount of water.
Sunflower is an important oilseed crop that is grown under sub tropical climate in wide range of
soils. It doesn’t require higher amount of irrigation for its survival and completion of active life
cycle. Its water requirement accounts to approximately 500 – 600mm because of which it can be
fitted in rice based cropping system in Odisha. The growing demand for the oilseeds in the recent
years has brought tremendous scope for the higher profit generation by cultivating sunflower.
Sweet potato is an important tuber crop that can be grown well under light texture soils and
hence Odisha provides congenial platform for its commercial cultivation. It also requires lesser

80
amount of moisture for its completion of active life cycle and for production of economic yield
i.e. tubers. Its water requirement is approximately 400-500mm and hence can be adjusted well
under rice based cropping systems in Orissa. Sweet potato can also be grown in marginal lands
where people are suffering from malnutrition.
Okra is an important vegetable crop that is suitable for cultivation in summer season. It doesn’t
require much water and its water requirement is about 600mm and can also be fitted well under
rice-pulse-vegetable cropping system in Odisha. Similarly, bittergourd is a cucurbit crop that can
be grown in summer season with less water requirement and its potential for getting adjusted
under rice based cropping system is enormous.
All these above mentioned crops have to be tested for their resistance to water shortage under
post cyclone/flood situation. At the same time provision of conservation agriculture practices
might be helpful in successful establishment of crops. The moisture conservation practices like
mulching and zero tillage would be instrumental in saving considerable amount of moisture
under such situation.
A field experiment was conducted in the farmer’s field at Raisar village, kendrapada district,
Odisha during post rainy season in 2010 to study and evaluate the impact of zero tillage on crop
growth performance, yield attributes and yield of sunflower, sweet potato, okra and bittergourd
in post flood situation and to critically analyze the suitable crops under post flood situation along
with their associating factors. The experiment was laid out in split plot design with type of tillage
as main plot treatments i.e. M1: Conventional tillage and M2: Zero tillage and type of crop as
sub plot treatments i.e. C1: Sunflower, C2: Okra, C3: Bittergourd and C4: Sweet potato with
three replications. The results revealed that zero tillage influenced the growth parameters and
fruit yield of okra, bitter gourd and sunflower positively compared to that of conventional tillage.
Effect on yield attributes
The zero tillage resulted in superior yield attributes of sunflower, bittergourd and okra compared
to conventional tillage. In case of sunflower, the head diameter was found to be highest with zero
tillage (15.7 cm) compared to conventional tillage (14.8 cm) (Fig 3). The number of seeds per
head of sunflower were also found to be highest with zero tillage (236.2) compared to that of
conventional tillage (224.5) (Fig 4). In case of okra, the number of fruits were found to be higher
with zero tillage (13.2) relative to conventional tillage (11.4) (Fig 5). Similarly, the number of
fruits of buttergourd were found to be superior with zero tillage (7.3) compared to conventional
tillage (6.8) (Fig 6). However, in case of sweet potato, the reverse trend was observed. The
number of tubers per plant in sweet potato were found to be higher with conventional tillage
(3.6) compared to that of zero tillage (3.1) (Fig 7).

81
Fig 3 : Effect of tillage on head diameter (cm) of sunflower
Fig 4: Effect of type of tillage on number of seeds per head in sunflower
Fig 5 : Effect of type of tillage on number of fruits per plant in Okra
Effect of type of tillage on number of seeds / head in
sunflower
236.2224.5
0
25
50
75
100
125
150
175
200
225
250
CT ZT
Type of tillage
Seed
nu
mb
er
/ h
ead
Effect of type of tillage on number of fruits per plant
(Okra)
13.2
11.4
0
2
4
6
8
10
12
14
CT ZT
Type of tillage
Nu
mb
er
of
fru
its p
er
pla
nt
Effect of tillage on head diameter of sunflower
15.714.8
0
2
4
6
8
10
12
14
16
18
CT ZT
Type of tillage
Head
dia
mete
r (c
m)

82
Fig .6 : Effect of type of tillage on fruit number per plant in bittergourd
Fig 7 : Effect of type of tillage on tuber number per plant in sweet potato
Effect on Productivity
Conventional tillage resulted in lower crop yield compared to zero tillage in sun flower, okra and
bitter gourd. Sun flower resulted in seed yield of 0.91 t/ha under zero tillage compared to 0.82
t/ha under conventional tillage (Table 2). This might be attributed to superior number of seeds
per head and larger head diameter under zero tillage. However, the superiority noticed was
statistically non significant.
Effect of type of tillage on fruit number per plant in bitter
gourd
7.3
6.8
0
1
2
3
4
5
6
7
8
CT ZT
Type of tillage
Fru
it n
um
ber
per
pla
nt
Effect of type of tillage on tuber number per plant in
sweet potato
3.1
3.6
0
0.5
1
1.5
2
2.5
3
3.5
4
CT ZT
Type of tillage
Tu
ber
nu
mb
er
per
pla
nt

83
Okra resulted in superior fruit yield of 3.73 t/ha under zero tillage compared to 3.26 t/ha under
conventional tillage. Bitter gourd resulted in fruit yield of 4.30 t/ha under zero tillage compared
to 4.06 t/ha in conventional tillage. This is due to higher number of fruits per plant and fruit
weight under zero tillage. However, the superiority noticed was statistically non significant. Zero
tillage resulted in lower tuber yield in sweet potato (5.90 t/ha) compared to conventional tillage
(6.63 t/ha). Though the crop establishment was good under zero tillage, the tuber penetration and
tuber development was facilitated by better aeration under conventional tillage in case of sweet
potato.
Table 2: Productivity of sunflower, okra, bitter gourd and sweet potato (t/ha) as affected by type
of tillage
Treatment Sunflower
(Seed yield)
Okra
(Fruit yield)
Bitter gourd
(Fruit yield)
Sweet potato
(Tuber
yield)
Mean
Conventional
tillage
0.82 3.26 4.06 6.63 3.69
Zero tillage 0.91 3.73 4.30 5.90 3.71
Mean 0.86 3.50 4.18 6.26
CD (Main) NS
CD (Sub) 0.17
CD (MxS) 0.25
Case study on impact of phailin
A case study was conducted to assess the impact of phailin on crop situation in Jajpur and
Balasore districts of Odisha and farmers were suggested to take up better crop management
practices in post cyclone phase. Some farmers responded quickly and implemented the
interventions successfully thereby reducing the negative impact on agriculture which is reflected
in values of cultivated land utilization index (CLUI).
Impact of crop management interventions on CLUI
The cultivated land utilization index (CLUI) is estimated by summing the products of land area
to individual crop component, multiplied by the actual duration of that crop divided by the total
cultivated land times 365 days (Chuang, 1973)

84
∑inaidi
CLUI = ________x100
Ax365
Where, i = 1, 2, 3… n,
n = total number of crops.
ai = area occupied by the ith crop,
di = days that the ith crop occupied and
A = total cultivated land area available for 365 days.
In case of Jajpur district, the CLUI in normal years in the command area studied was found to be
56.5% which has come down to 42.3% in phailin affected year i.e. 2013-14 (Fig 8). However,
the CLUI was found to be quite satisfactory (53.9%) even in phailin affected year where the
progressive farmers have adopted the advanced crop management interventions. The area under
kharif rice was same, however, the jump in area under other crops like groundnut, mustard,
vegetables and yam resulted in satisfactory CLUI in progressive village. This is very important
finding for formulating the cyclone mitigation and adaptation strategies in the back drop of
climate change in future.
Fig 8: Impact of crop management interventions on cultivated land utilization index (CLUI)
due to Phailin in Jajpur district, Odisha.
0
10
20
30
40
50
60
Normmal Year Phailin year : Traditional Farmer
Phailin year : Progressive Farmer
56.5
42.3
53.99
CLU
I (%
)

85
In case of Balasore district, the CLUI in normal years in the command area studied was found to
be 54.1% which has come down to 43.2% in phailin affected year i.e. 2013-14 (Fig 9). However,
the negative impact on CLUI was found to be reduced (46.9%) even in phailin affected year
where the progressive farmers have adopted the advanced crop management interventions
including crop diversification. The area under kharif rice, banana and other vegetables was found
to be same, however, the increase in area under crops like groundnut, mustard, chilli, radish,
brinjal, cabbage and other vegetables resulted in satisfactory CLUI in progressive village. There
is ample scope to improve CLUI from the present level in this village as plenty of ground water
is available. Hence, ground water exploitation in cyclone affected areas would provide a better
adaptation strategy in the back drop of climate change in future.
In post cyclone affected period, the intercropping of Groundnut + Mustard would be best
practice in terms of utilization of available soil moisture and crop yield and economics. The
advancement of sowing time by 10 days from 3rd
week of November to 1stweek of November in
green gram is recommended to enhance the pod yield up to 16% under post Phailin cultivation
scenario.
Fig 9: Impact of crop management interventions on cultivated land utilization index (CLUI)
due to Phailin in Balasore district, Odisha.
Conclusion
Contingency crop planning would certainly result in reducing the crop loss and productivity in
the event of cyclone / flood and it forms the core component of prevention strategy. However, in
case of post cyclonic phase, advanced crop management interventions and moisture conservation
techniques should form the main component and they should be adopted by the farmers on large
scale to sustain the cultivated land utilization index.
0
10
20
30
40
50
60
Normal Year Phailin Year Non Progressive
Farmer
Phailin Year Progressive
Farmer
54.1
43.2 46.9
CLU
I (%
)

86
References
Biswas, S., S. Mallick and N.K. Mitra. (1986), Integrated Breeding Programme for Medium-
Deep, Stagnant Water, Rainfed Rice in India, in Progress in Rainfed Lowland Rice, IRRI (eds.)
IRRI, Los Banos, Phillippines, pp. 207-216.
Brahmanand, P.S., Kumar, A., Ghosh, S., Roy Chowdhury, S., Singandhupe, R.B., Singh, R.,
Nanda, P., Chakraborthy, H.C., Srivastava, S.K. and Behera, M.S. 2013. Challenges to Food
Security in India. Current Science, 104 (7). 841-846.
Indian Meteorological Department. 2014. Frequently asked questions. Cyclone page, Indian
Meteorological Department. www.imd.gov.in.
Jahn, G.C., B. Khiev, C. Pol, N. Chhorn, S. Pheng and V. Preap. (2001), Developing Sustainable
Pest Management for Rice in Cambodia. pp. 243–258, in “Sustainable Agriculture: Possibility
and Direction” Proceedings of the 2nd Asia-Pacific Conference on Sustainable Agriculture, by S.
Suthipradit, C. Kuntha, S.
***
87
Tropical Cyclone and Crop Management Strategies
Dr. S.K. Rautaray, Principal Scientist, Dr. P. Panigrahi, Scientist (SS) and Dr. P.K. Panda,
Senior Scientist
Directorate of Water Management (ICAR), Bhubaneswar – 751023, Odisha
Tropical Cyclone
A tropical cyclone is a rapidly rotating storm system with a low-pressure center, strong winds,
and a spiral arrangement of thunderstorms that produce heavy rain. The term "tropical" refers to
its origin over tropical seas. The term "cyclone" refers to their cyclonic nature, with wind
blowing counterclockwise in the Northern Hemisphere and clockwise in the Southern
Hemisphere. Warm tropical oceans lead to high evaporation, high humidity and relatively light
winds. If these conditions persist long enough, they can combine to produce the violent winds,
high waves, torrential rains, and floods. Cyclones typically weaken rapidly over land where they
are cut off from their primary energy source. Also, the energy gets weakened after collision with
vegetation and infrastructures on land mass. For this reason, coastal regions are particularly
vulnerable to damage from a tropical cyclone as compared to inland regions. Heavy rains,
however, can cause significant flooding inland, and storm surges can produce extensive coastal
flooding up to 40 km from the coastline. Most of the tropical cyclone occurs during six months
period from June to November. Tropical cyclone occurs both at sea and/or on land. Worldwide
about 1.9 million people have died in the last two centuries due to tropical cyclones. Wide spread
flooding after cyclone lead to increased infection and mosquito-borne illnesses. Unsanitary
conditions in cyclone shelters increase the risk of disease propagation. Tropical cyclones
significantly interrupt infrastructure, leading to power outages, bridge destruction, and the
hampering of reconstruction efforts.
Classification of cyclone
Depending on location and strength, a tropical cyclone is referred to by names such as, typhoon,
tropical storm, cyclonic storm, tropical depression, and simply cyclone. People use different
names for these storms in different places. In the Atlantic and Northeast Pacific, the term
“hurricane” is used. The same type of disturbance in the Northwest Pacific is called a “typhoon”
and “cyclones” in the South Pacific and Indian Ocean. Based on increased intensity, tropical
cyclones are categorized as tropical depressions, tropical storms, and intense storms. A tropical
depression is an organized system of clouds and thunderstorms with a defined, closed surface
circulation and maximum sustained winds of less than 63 km/h. It has no eye and does not
typically have the organization or the spiral shape of more powerful storms. However, it is
already a low-pressure system, hence the name "depression". A tropical storm is an organized
system of strong thunderstorms with a defined surface circulation and maximum sustained winds

88
between 63 km/h to 119 km/h. At this point, the distinctive cyclonic shape starts to develop,
although an eye is not usually present. A tropical cyclone is systems with sustained winds with at
least speed of 119 km/h. A cyclone of this intensity tends to develop an eye, an area of relative
calm (and lowest atmospheric pressure) at the center of circulation. The eye is often visible in
satellite images as a small, circular, cloud-free spot. Surrounding the eye is the eyewall, an area
about 16 km to 80 km wide in which the strongest thunderstorms and winds circulate around the
storm's center. The maximum sustained wind in the strongest tropical cyclones is reported as 314
km/h. Intensity of cyclone are represented in The Beaufort scale (Table 1).
Table 1. Classification of tropical cyclones in Indian Ocean as per intensity
The Beaufort scale 1-minute sustained
windspeed (km/h)
10-minute
sustained winds
North Indian
Ocean (IMD)
SW Indian Ocean
(Meteo France)
0–7 59 52 Depression Zone of Disturbed
Weather
7 61 54 Deep Depression Tropical
Disturbance
8 69 56-61 Tropical
Depression
9-10 70-100 63-87 Cyclonic Storm
Moderate Tropical
Storm
11 102-117 89-102 Severe Cyclonic
Storm
Severe Tropical
Storm
12 and more
119-131 104-117
133-152 119-133
Very Severe
Cyclonic Storm
Tropical Cyclone 154-176 135-154
178-180 156-157
181-207 159-181 Intense Tropical
Cyclone 209-226 183-198
228-239 200-209
241-252 211-220 Super Cyclonic
Storm
Very Intense
Tropical Cyclone ≥254 ≥220
Effects of Cyclone on Agriculture
The agricultural sector includes field crops, horticultural crops, agro-forestry plants, livestock
and fisheries. Cyclones in coastal areas severely affect all these components of agriculture sector
through direct damage by high speed wind, torrential rain and extensive flooding. High tide may
bring in saline water and sand mass making the fields unsuitable for agriculture. The indirect

89
effects include infection and disease of farm animals, fish and crop plants. Agricultural
marketing and trade is adversely affected due to lean season of animal, fish and crop production.
Super cyclone in 1999 and phailin in 2013 severely affected crop production and livelihood of
farmers in coastal areas in Eastern Coast of India.
Contingent Measures for Agriculture Sector
Direct and indirect effects of cyclone disaster adversely affect the economic back bone of the
affected farmers. Government support is required for revival of agriculture. Contingent measures
should be adopted to help farmers and farming in the region. Post-cyclone contingent measures
may be discussed under different time frame considering the nature of urgency.
(a) Immediate measures(Day 1-7 of cyclone hit)
The most important measure is protecting the livestock of affected farm families.
Livestock must be provided shelter and feed immediately. This should be followed by medicines,
de-wormers, and vaccinations as per the situation. Arrangements should be made for providing
seeds, fertilizers, plant protection chemicals and farm machineries, if the planting season is
immediate. Provisions should be made for supplying polythene sheets of appropriate thickness
(50 to 100 µ) so that affected farmers can make low cost poly houses for raising vegetable
seedlings, advance in the season.
(b) Short-term measures (Week 2-8 of cyclone hit)
Agricultural inputs like seeds, fertilizers, plant protection chemicals and farm
machineries must be provided to severely affected farmers if not provided under immediate
measures. Provision of agricultural inputs under immediate or short term measure depends on the
planting season of the crops in the affected area. Attempts should be made to restore production
and livelihoods consisting of crop/horticulture, livestock, and fisheries. Capacity development
and training on best utilization of available resources need to be taken care.
(c) Medium term measures (Month 2-6 of cyclone hit)
Within 2 to 6 months of cyclone hit, rehabilitation of damaged agricultural and other
rural infrastructure needs to be completed. Farmers should be assisted for resumption of
agricultural activities towards a normal agricultural calendar. Technology-based Capacity
Development and training for affected farmers, livestock keepers and fishermen is required to
prepare for efficient agricultural production. Financial support for crop raising, harvest and post-
harvest operations through zero or low interest agricultural credit is needed. Livestock farmers
should be helped by arranging feed, fodder and veterinary support. Restocking of birds and
arrangement of feeds and medicines are to be arranged for poultry revival. Fish farmers should
be provided with fish fingerlings and feed, boats and nets as per need.

90
(d) Long-term measures (Month 7-18 of cyclone hit)
Rehabilitation of damaged and degraded lands and water courses should be attempted.
Restocking of livestock and animal feed/fodder, restocking of fish fingerlings, rehabilitation of
damaged orchards, promotion of agro-forestry for firewood and timber, training on crop
production and livestock management including disaster preparedness need to be attended. Flood
protection dams should be constructed and on-farm water control structures should be developed.
Flood tolerant crops and suitable varieties need to be introduced. Threshing floor, drying yard,
mechanized farm operations need to be envisaged to avoid harvest and post-harvest losses.
Service providers for essential agricultural services are to be promoted in the community.
Crop Management Strategies
1. Provision of wind-brake plantation
Wind-brake help in reducing the wind speed. Promotion of several tiers of wind-brake plants
near the sea coast effectively reduce wind speed. Also, it helps reducing the adverse effects of
high tides by lowering the amount of saline water and sand mass. Suitable plant species for
wind-brake system include casuarina, eucalyptus and acacia. Provision of wind-brake at village
level or even at farm level will be added advantage. In lowlying coastal areas, village boundaries
are often provided with embankments to prevent flood water. Drainage channels (Khalasi) are
provided for effective drainage. Provision of wind-brake plantation on such embankments is
useful for reducing the wind speed and providing fuel wood and timber.
2. Nursery management technology
Cyclonic rainfall and waterlogging forces the farmer for delaying field preparation and planting
of winter season vegetables. Post-cyclone rainfall may damage the vegetable nursery. Vegetable
seedlings should be raised under low cost poly houses for getting healthy seedlings, advance in
the season. Creeper vegetables like water melon, pumpkin, ridge gourd, cucumber, and bitter
gourd are planted at a wider spacing and these crops are not suitable for transplanting. Seedlings
of these crops can be raised in disposable plastic cups using fertile soil in poly houses or other
protected places. Such seedlings can be planted early the cropping season can be advanced by 3
to 4 weeks.
3. Bio-drainage plants
Waterlogging in coastal region due to high and unusual rainfall during cyclone coupled with
insufficient drainage lead to flooding in wider areas. Biological drainage by specific kind of
vegetation like casuarina, eucalyptus is a promising tool to improve drainage situation. Cyclones
occurring in the months of October and November affect the paddy crop in grain filling to
maturity stage. Bio-drainage plants help to reduce the water table at a faster rate and thereby,
facilitate in growing the winter season crops like water melon, black gram, ridge gourd,
cucumber, cowpea.

91
4. Rice Production Technology
In several occasions, flood is accompanied by cyclone due to heavy rainfall associated with the
process which increases the extent of damage to agriculture. Rice is the most important and best
suited crop for waterlogged and cyclone prone coastal areas. Suitable variety for specific
situation and appropriate crop management technology can reduce the adverse effects of
waterlogging and cyclone.
a) Tolerance to submergence under prolonged waterlogging
Crop submergence at any growth stage limits rice productivity. Tolerance to
submergence, in general, is associated with 1) elongation of leaf sheath, culm and leaf or
combination of these factors,2) higher oxygen liberation by roots,4) higher amylase and acid
phosphatase activity of stem, 5) greater pre-submergence stored carbohydrate ,and 6) high
specific leaf weight and maintenance of greater chlorophyll content during submergence.
Submergence tolerant rice donors include Fukoku, T 1808, Hatipanjari, CR 383-10, Sarubhujini,
T 300,B 24-92, T 535. Recommended rice genotypes for semi deep water situations include
Rambha, Tulsi, Kanchan, Durga, Sarla, Kalashree, Panidhan, CR 1014, while for deep water
situations Suresh, Biraj, Jalmagna, Jogen, Sabita, Bhudev, Hanseswari are useful.
b) Tolerance to flash flood
Flash floods are short staying (10 to 12 days) in nature. Rice variety suitable for this
situation should have very little elongation. Thus available carbohydrate is not wasted for
elongation; rather it is used for self-sustenance till the flood is receded back. Suitable rice
varieties for these situations include Sarala, Piolee, Panikekoa.
c) Crop management
i) Management objective should be to get high carbohydrate level before submergence stress.
This can be achieved by early sowing/transplanting, using high density grain, sparse
seed/seedling density, use of vigorous seedling (0.8-1.0 g as fresh weight/seedling), and optimum
plant nutrition.
ii) Community nursery raising, scheduling bushenings, re-transplanting in damaged fields using
detached tillers and/or fresh seedlings and transplanting new areas or direct seeding using short
duration rice varieties are some crop management strategies.
d) Salinity tolerance
Coastal salinity due to intrusion of sea water affects crop productivity. Salinity tolerant varieties
like Rambha, and Lunishree should be grown. Soil amelioration using organic manures like
FYM, compost and green manure helps in reducing soil salinity.
92
e) Lodging tolerance
Use of tolerant and semi-tolerant rice varieties in waterlogged condition makes the plant
susceptible to lodging. Receding water level in post-monsoon season and grain filling stage of
the crop are congenial for lodging. Cyclone in this stage results in lodging followed by
submergence leading complete damage of grains. Rice variety like CR 1014 has strong stem and
it can partially overcome lodging problem.
f) Selecting rice variety with kneeing ability
The upward bend of the terminal part called kneeing that keeps the reproductive part of rice plant
above water after lodging of plant with the receding of flood water. This helps in keeping rice
grain above water level and protects from being damaged. Tiller angle should be more than 450
for more than 25% tillers. Rice varieties like Hanseswari, Durga with kneeing ability score less
than 3 are desirable.
g) Escaping peak cyclone period at maturity stage
Maturity stage coinciding with the peak period of intense cyclone (mid October to mid
November) results in severe damage for rice crop. Selection of rice varieties, to escape maturity
during this peak period of cyclonic disturbances is one option. Rice varieties like Durga and
Varsha Dhan maturing after mid December may be adopted in suitable ecosystem.
h) Enhancing maturity to escape peak cyclone period
Spraying diaquat 0.05% or paraquat 0.1% or common salt 10% on the earhead at the rate of 1000
litre/ha at 20 to 25 days after 50% flowering helps in enhancing maturity by 5 to 7 days. This can
be done to escape peak period of cyclone occurrence.
i) Facilitation for quick harvest and post-harvest management
Quick harvest, threshing and drying the grains before the cyclonic system through early warning
is the best option. Covered threshing floor cum drying yard helps in preventing grain damage.
Communities drying yards and polythene sheets to cover so that grains do not get moist are
possible options to prevent grain damage. Preparing beaten rice from moist grains is also
possible to avoid damage.
5. Banana Production technology
Banana is a water loving crop and grows well in humid climate coastal areas. This is a very
popular crop in coastal areas. Also, this crop is very susceptible to high speed wind of cyclones.
Large scale damage leads to immediate surplus of banana in market followed by a lean period for
10 to 12 months. Crop management strategies listed below may partly overcome this situation.

93
a) Staggered planting
This helps in planting over a wider window and large scale damage at one time will be avoided.
Planting time should be adjusted so that reproductive stage of banana does not coincide with the
peak period of cyclone occurrence.
b) Canopy removal
Plant should be subjected partial removal of canopy if it is in reproductive stage. There may be
yield reduction, but some check in damage is possible. Partial or complete removal of canopy
before cyclone is possible younger suckers or even older plants before reproductive phase.
c) Crop management
Provision of support to bunch using stakes made of bamboo often overcomes moderate wind
speed. Use of healthy suckers for replanting after cyclone damage is recommended. Survived
plants having banana fingers in fruit filling stage may be provided with additional nutrition
through bunch tip.
6. Preparation of crop calendar based on tropical monsoon season and peak period
Tropical Storm / Cyclone Season
Yearly Crops Jan Feb Mar Apr May Jun Jul Aug Sep Oct Nov Dec
Early) rice
(Sowing)
√
Shallow
lowland rice
(Transplant)
√
Semi-deep and
deep water rice
(Sowing)
√
Summer rice
(Transplant)
√
Mung
(summer)
√
Water Melon √
Seasame
(summer)
√
***

94
Concept of Community nurseries and seed banks for climate resilient
horticulture
P. Srinivas, Senior Scientist and H.S. Singh, Head
Central Horticultural Experiment Station (IIHR-ICAR), Aiginia, Bhubaneswar
Agriculture has been facing the wrath of the changing climate in recent years. The climate
change in terms of the unpredictability and irregularity of different climatic events especially
rains and hailstorms have increased the risk quotient of agriculture profession in India. Since
ancient times the farmer has tried to adapt to the changing climate in situations. Farmers have
been into selective collection and conservation of seeds with better yields and resistance to biotic
and abiotic resistance. However, there has been a drastic change in the agriculture since last
century. Whereas earlier agriculture was primarily to cater the food and nutrition requirement of
the members of the family and the community, today the agriculture has become a profession or
a semi-industry which produces goods in bulk in response to the consumer preference and
market demand. The profession now requires better inputs like hybrid seeds, fertilizers and
pesticides, and better technologies like mechanized cultivation, protected cultivation, postharvest
processing and management. However, agriculture for sustenance is still prevalent in most parts
of the developing and underdeveloped nations around the world. The small and marginal farmers
practicing agriculture in smaller scale catering own families and disposing off the remainder in
local markets. The changing climate has become a curse to such small and marginal farming
communities because loss of even a single crop can lead to starvation or malnutrition of the
family.
Majority of the sustenance agriculture in India is rainfed. Hence the major reason of crop failure
stems from the untimely or insufficient rains at critical growth periods. Loss of standing crop at
initial stages could be compensated by re-sowing immediately; however there may not be
sufficient seed left with anybody in the community for re-sowing. Moreover it would be difficult
for the public and private seed sectors to meet the demand of the cost effective seeds by the rural
and tribal farmers residing the far flung and inaccessible areas at that moment. Complete crop
failures due to floods and droughts, pest and disease incidence, or fire, can lead to loss of a
traditional variety if it is not preserved with other members of the community. Such a situation
can be primarily addressed by the community nurseries and seed banks.
Seed banks:
Seed banks serves multiple purposes and largely self sustainable. Traditionally the seed banks
are aimed at identifying important local seed varieties, especially that of cereals and vegetables,
and orienting the local agricultural community towards conserving and cultivating them, with an

95
broad aim to enhance the livelihood security of small and marginal farmers through conservation
of indigenous genetic resources and make the community self sustainable. Seeds of these
traditional varieties normally are not available commercially in the market rather the rural people
exchange seeds within their village and with people from neighboring villages. These seed
exchanges are important for seed supply, diffusion and conservation. The establishment of
community seed bank empowers local people to conserve, and multiply seed of crops and
varieties of their traditional choice. Such mechanism is likely to make the community more
resistant to the devastation of abrupt weather furies. The member of such seed bank can deposit
his seed lot with the seed bank for next season. Seed banks equipped with better traditional and
modern storage facility can store the seeds while protecting them from damage by any pests. The
requisite seed can be loaned from the banks with an obligation to return more than loaned seed
lot. The addition seed returned in previous season by the farmers creates a buffer for contingency
arising from juvenile crop loss due to natural fury. Further, access to seed banks often encourage
and sustain cultivation of traditional varieties for creating community seed security. Local seed
banks also protects the traditional varieties from extinctions due to agricultural modernization
which promotes farmers to purchase more of commercial hybrids or varieties which in longer run
can replace traditional genetic base in many communities. Hence, besides offering the farmers
more choice over what they grow, Seed banks also enable rural tribal villages to become less
dependent on expensive seeds in the markets. Community seed banks helps in bringing up self
sustainability in terms of seed supply and ultimately ensures local food security.
Constitution and formalization of Seed banks
1. Creation of awareness and constitution of management committee: Creation of awareness
about the seed banks and its virtues is the foremost requirement for the project to be successful.
However with the strong basic concept it won't be difficult. Once the need is understood a
management committee can be democratically constituted preferably with participation of
regional agriculture and horticultural officers, researchers from KVKs and members of active
NGOs. Alternatively a Self help group can be made for the purpose with participation of active
farmers. The seed money can be obtained from Village development Committee or any other
funding agency. The fund is primarily required to create storage facility for the seeds, office and
stationary. If the panchayat office can spare a room for the purpose the venture can be initiated
right away. The constituted committee can make the bylaws and charter of rules and regulation
for smooth functioning of the bank. The bank can run either on barter system or on payment
system. In the barter system the farmer loaning the seeds should agree to return 1.5 times of the
loaned seeds of same variety and quality.
2. Eligibility of participating farmers: The participating farmers inclining to avail the facility
of the community seed bank should agree to abide by the rules and regulations framed by the
committee. The farmers should be cultivating the crop that is included in the schedule of the seed
bank. The farmer should allow the committee to monitor the crop at different stages to ascertain
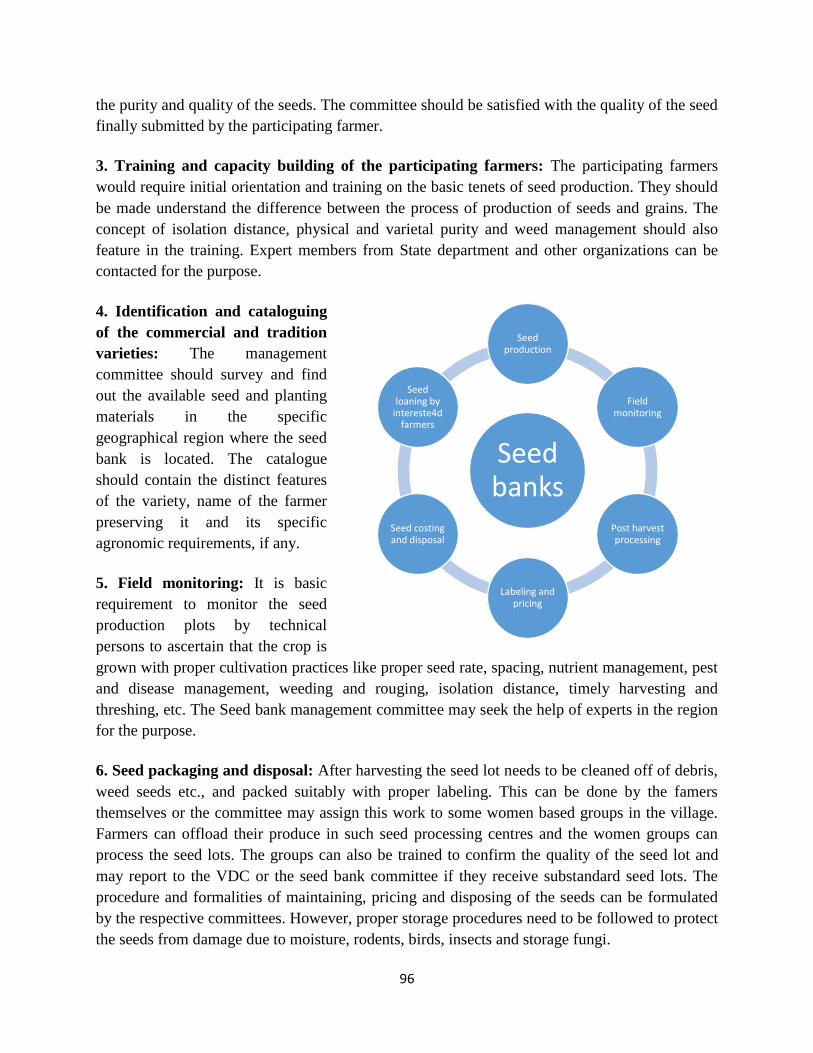
96
the purity and quality of the seeds. The committee should be satisfied with the quality of the seed
finally submitted by the participating farmer.
3. Training and capacity building of the participating farmers: The participating farmers
would require initial orientation and training on the basic tenets of seed production. They should
be made understand the difference between the process of production of seeds and grains. The
concept of isolation distance, physical and varietal purity and weed management should also
feature in the training. Expert members from State department and other organizations can be
contacted for the purpose.
4. Identification and cataloguing
of the commercial and tradition
varieties: The management
committee should survey and find
out the available seed and planting
materials in the specific
geographical region where the seed
bank is located. The catalogue
should contain the distinct features
of the variety, name of the farmer
preserving it and its specific
agronomic requirements, if any.
5. Field monitoring: It is basic
requirement to monitor the seed
production plots by technical
persons to ascertain that the crop is
grown with proper cultivation practices like proper seed rate, spacing, nutrient management, pest
and disease management, weeding and rouging, isolation distance, timely harvesting and
threshing, etc. The Seed bank management committee may seek the help of experts in the region
for the purpose.
6. Seed packaging and disposal: After harvesting the seed lot needs to be cleaned off of debris,
weed seeds etc., and packed suitably with proper labeling. This can be done by the famers
themselves or the committee may assign this work to some women based groups in the village.
Farmers can offload their produce in such seed processing centres and the women groups can
process the seed lots. The groups can also be trained to confirm the quality of the seed lot and
may report to the VDC or the seed bank committee if they receive substandard seed lots. The
procedure and formalities of maintaining, pricing and disposing of the seeds can be formulated
by the respective committees. However, proper storage procedures need to be followed to protect
the seeds from damage due to moisture, rodents, birds, insects and storage fungi.
Seed banks
Seed production
Field monitoring
Post harvest processing
Labeling and pricing
Seed costing and disposal
Seed loaning by
intereste4d farmers
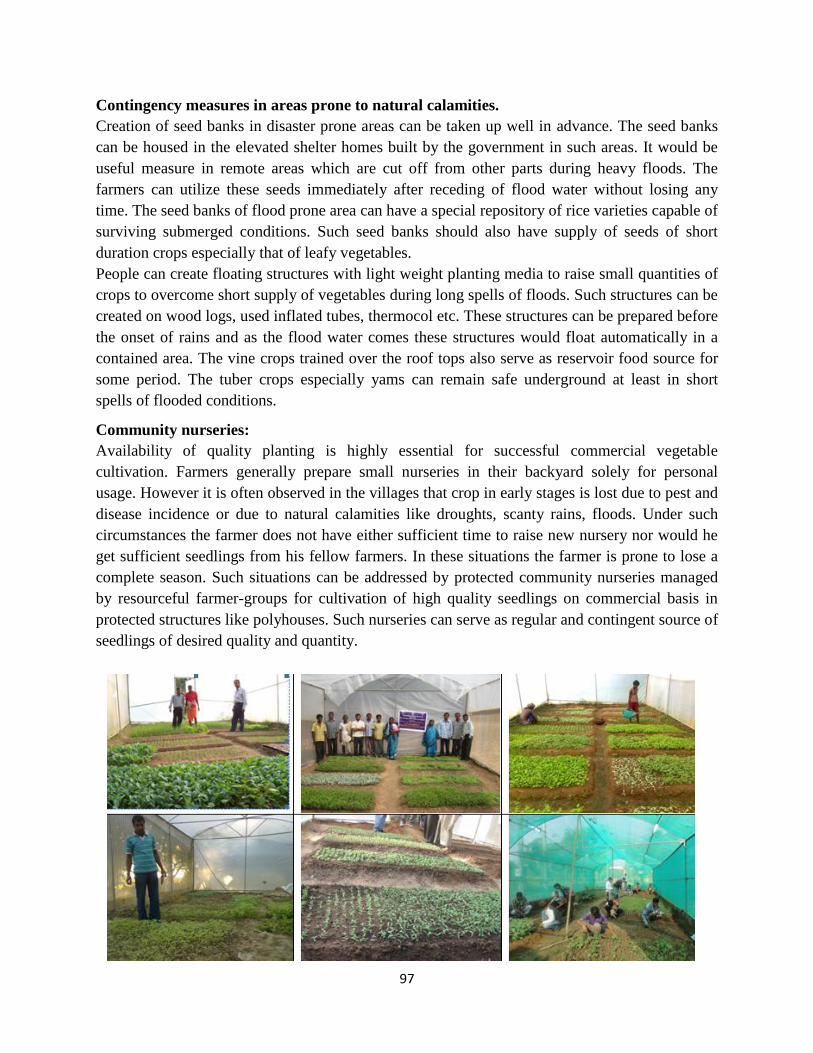
97
Contingency measures in areas prone to natural calamities.
Creation of seed banks in disaster prone areas can be taken up well in advance. The seed banks
can be housed in the elevated shelter homes built by the government in such areas. It would be
useful measure in remote areas which are cut off from other parts during heavy floods. The
farmers can utilize these seeds immediately after receding of flood water without losing any
time. The seed banks of flood prone area can have a special repository of rice varieties capable of
surviving submerged conditions. Such seed banks should also have supply of seeds of short
duration crops especially that of leafy vegetables.
People can create floating structures with light weight planting media to raise small quantities of
crops to overcome short supply of vegetables during long spells of floods. Such structures can be
created on wood logs, used inflated tubes, thermocol etc. These structures can be prepared before
the onset of rains and as the flood water comes these structures would float automatically in a
contained area. The vine crops trained over the roof tops also serve as reservoir food source for
some period. The tuber crops especially yams can remain safe underground at least in short
spells of flooded conditions.
Community nurseries:
Availability of quality planting is highly essential for successful commercial vegetable
cultivation. Farmers generally prepare small nurseries in their backyard solely for personal
usage. However it is often observed in the villages that crop in early stages is lost due to pest and
disease incidence or due to natural calamities like droughts, scanty rains, floods. Under such
circumstances the farmer does not have either sufficient time to raise new nursery nor would he
get sufficient seedlings from his fellow farmers. In these situations the farmer is prone to lose a
complete season. Such situations can be addressed by protected community nurseries managed
by resourceful farmer-groups for cultivation of high quality seedlings on commercial basis in
protected structures like polyhouses. Such nurseries can serve as regular and contingent source of
seedlings of desired quality and quantity.
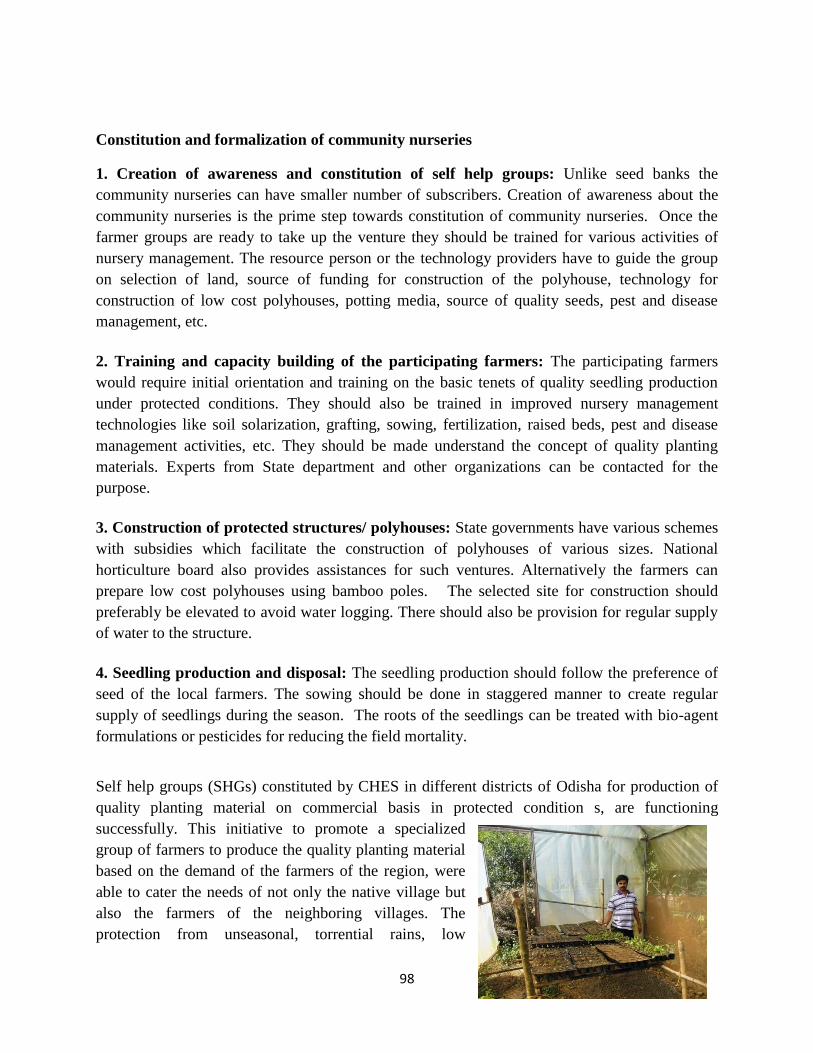
98
Constitution and formalization of community nurseries
1. Creation of awareness and constitution of self help groups: Unlike seed banks the
community nurseries can have smaller number of subscribers. Creation of awareness about the
community nurseries is the prime step towards constitution of community nurseries. Once the
farmer groups are ready to take up the venture they should be trained for various activities of
nursery management. The resource person or the technology providers have to guide the group
on selection of land, source of funding for construction of the polyhouse, technology for
construction of low cost polyhouses, potting media, source of quality seeds, pest and disease
management, etc.
2. Training and capacity building of the participating farmers: The participating farmers
would require initial orientation and training on the basic tenets of quality seedling production
under protected conditions. They should also be trained in improved nursery management
technologies like soil solarization, grafting, sowing, fertilization, raised beds, pest and disease
management activities, etc. They should be made understand the concept of quality planting
materials. Experts from State department and other organizations can be contacted for the
purpose.
3. Construction of protected structures/ polyhouses: State governments have various schemes
with subsidies which facilitate the construction of polyhouses of various sizes. National
horticulture board also provides assistances for such ventures. Alternatively the farmers can
prepare low cost polyhouses using bamboo poles. The selected site for construction should
preferably be elevated to avoid water logging. There should also be provision for regular supply
of water to the structure.
4. Seedling production and disposal: The seedling production should follow the preference of
seed of the local farmers. The sowing should be done in staggered manner to create regular
supply of seedlings during the season. The roots of the seedlings can be treated with bio-agent
formulations or pesticides for reducing the field mortality.
Self help groups (SHGs) constituted by CHES in different districts of Odisha for production of
quality planting material on commercial basis in protected condition s, are functioning
successfully. This initiative to promote a specialized
group of farmers to produce the quality planting material
based on the demand of the farmers of the region, were
able to cater the needs of not only the native village but
also the farmers of the neighboring villages. The
protection from unseasonal, torrential rains, low

99
temperatures, insect and airborne pathogens has been a major contributing factor in the success
of these protected commercial nurseries. This intervention has given a protection to the farmers
of region not only against the accidental loss of planting material in the personal nurseries but
also against loss of crop season with the availability of alternate source of ready to plant quality
planting material. Introduction of other novel interventions like production of seedlings in
potrays and on stall beds were particularly helpful in the avoiding the loss of seedlings during
heavy rains and floods. Seedlings raised in potrays could be easily moved to higher places in the
event of rising of water level in the nursery. The elevated nursery beds with lighter cocopeat
media with have also been proposed to combat the unforeseen flash floods. These innovative
interventions were particularly helpful in the avoiding the loss of seedlings during heavy rains
and floods.
In the days to come protected production of seedlings would be the helpful in reducing untimely
losses of crops due to natural calamities and climate change, besides creating an alternate source
of ready to plant quality planting material in a region.
Participation of women in community seed banks and nurseries: Women are the mainstay of
any developmental programme in the villages. As mentioned earlier women self help groups
have tremendous potential for self engagement in post harvest processing of seed lots in seed
bank initiative. Commercial fruit and vegetable
nurseries are invoking increasing participation from
farm women, due to ease of operations and flexibility
of timing. It is seen that in nursery SHGs, family
women directly and indirectly contributed in various
operations in nurseries like soil solarization, bed
preparation, seed treatment, line sowing, polythene
preparation, grafting, watering, fertilizer application,
pest management, seedling bundle preparation etc.
***

100
Socio Economic Impact of Cyclone and Other Climate Induced Natural
Disasters- Some Case Studies
Dr. Prabhakar Nanda
Principal Scientist
Directorate of Water Management (ICAR), Bhubaneswar – 751023, Odisha
Introduction
Climate induced natural disasters (CINDs) like drought, flood and cyclone have become serious
problems to Orissa. CINDs are of regular occurrence particularly in coastal Orissa and have
become the part of normal life. The poor people are the worst affected. In most years, adjustment
in household activities combined with relief works provides the minimal succors (employment,
food, etc.). However, occasionally the situation gets worsen like the case in coastal Orissa since
late 1990s. The farmers and fishermen who are the traditional food producers living in such
fragile environments become ecologically, geographically and economically marginalized.
However, over time they have evolved certain coping mechanisms and adaptive strategies to
reduce drought, flood and cyclone vulnerability.
This communication focuses on coping strategies of the poor to drought, flood and cyclone
vulnerability in coastal Orissa. The vulnerability towards all these three extreme events and the
rural household's coping strategies are discussed. Rural people's perception and attitudes about
natural disasters are also reported. For the study, a simple random sample was adopted and
interviews were carried out through questionnaire. From the study a picture of coping responses
was built up.
The common perception of rural households in the study area is that climate has changed for the
worse with increased frequency as well as intensity of CIND events in recent years. Although
the warning system was also developed and found to be timely and largely accurate, the rainfall
forecasting in drought years were misleading. Further, the cyclone warning was ignored by the
rural households which resulted in higher causality than expected. As with most other warning
systems, there appears to be a missing link between the warning signals and follow up action.
Discussion
Natural resources are prime mover for a society for sustainable growth and development. The
coastal economy is more prone to its control due to enormous contribution it makes to
livelihoods of the people. The village Naladiapalda under Mahakalpara block of Kendrapara

101
district in Orissa, a perpetual victim to the climatic turbulences testifies this. The NRM group
along with other colleagues carried out focused group discussion with the people of different age
groups to ascertain the symbiotic relationship of natural resources within the coastal ecosystem
and the livelihoods of the people.
Case Studies
The initial discussion with the villagers revealed that the soil and vegetation of yester years are
no more reassuring to make up whatever loss is caused to the people due to floods and droughts
in the village. The elderly people recalled their memory that with little or no application of
fertilizer, the paddy and groundnut yields were bumper in kharif and post kharif respectively.
There were floods, but the duration of floods was less due to large spread area of the Paika river
which has been narrowed down on either side with construction of embankments. The river was
also flowing almost round the year and severity of salinity was not there till mid April or month
of May. The people were mostly using “Janta” for water lifting from the river and the traditional
“Chua” or water hole in the riverbeds was a permanent source of fresh water. However, the
control of Mahanadi water at different places like Hirakud, Naraj barrage at Munduli and Jobra
barrage in Cuttack intensified the woes of villagers due to reduced lean flow of the river and
resulting salinity intrusion in as early as month of March. The dug wells use to supply water
round the year. The village had a good part of area under forest, which used to supply fuel woods
and minor forest produce for daily livelihoods of the people. The land, water resources and
vegetation endowment in the village took care of immediate needs of livelihoods that have
dwindled with the progress of time.
Dynamics of land resource management
Reacting to our query on quality of land resources, the villagers reacted that the land in the
village has become less fertile over the years. Earlier they used to get 30 to 40 quintals of paddy
per hectare of land put under kharif, which declined with the passage of time, and presently they
used to get hardly 12 to 15 quintals of paddy. Even the productivity of HYV paddy is also
declining. The villagers opined that the land resources under private and common property
management are low productive due to top soil washout in floods or drought, which are common
in the village. The soils have low water holding capacity. The private holdings are fragmented
and distributed in 4 to 5 parcels in some cases. The general perception of the villagers towards
management of natural resources especially land was that there is little scope for any contingent
measures to prevent flood and drought as the problem is so severe that, human endeavor is not
strong enough to prevent it. As per the villagers perception, around 70% of land was under low
land category in the Tikhiri Gram panchayat. However the villagers opined that upland counts
for more than 40% in Naladiapalda village alone. Rest of the land resources come under medium
and low land category. The uplands suffer maximum in the event of a drought. The low lands do
not get ready for a second crop due to unfavourable edaphic condition. When the fields are
ready, irrigation facilities are not available for the crop. Around 10% of land is perpetually in

102
saturated condition in the village, indicating problem of waterlogging. The villagers used to grow
local waterlogging varieties of paddy like “Baunsa Gaja”, Rajamalli and Dhuruva Khuda, which
were low, productive but water logging resistant. The degradation of land over the years has
forced some farmers to penury and out migration as no other sources are available for livelihoods
in the village. The villagers are of the opinion that due to application of fertilizer the soil natural
productivity decreases.
Scientific land management in the monsoon has little scope except putting some land under
paddy and backyard vegetables. The local varieties like Baunsa Gaja, Rajamalli, Dhuruva khuda,
Pakhira are popular local varieties practiced in kharif in low and medium lands. The lowland
paddy cultivation is called “Sarada” in the local area. The average yields vary from 0.5t/ha to as
high as 1.5 tons for the local paddy. In the event of waterlogging and flooding Raja Malli and
Dhuruba khuda perform better and can give 30-40% of potential yields even if flooded for 15-20
days. In relatively uplands the people take Khandagiri (HYV), which gives a yield of 1.5 to 2.0
t/ha. The short duration pure upland paddy cultivation is called “Biali” in local parlance, which
is highly susceptible to droughts. Almost all the farmers use broadcasting method of seed sowing
in kharif and transplanting for rabi “Dalua” crop where ever taken up. Only 10% of land is put
under transplanting (medium lands) in kharif. The concept of intercropping or strip cropping,
crop diversification, which are considered drought hedging land management practices are not
prevalent in the area. The farmers view that yields get affected due to intercropping. Early
sowing is also not possible due to hard soil condition in the month of May. Uttam Nayak a
progressive farmer has the contingent crop planning in the event of a flood. He goes for early
winter vegetable and groundnut as he has control over a tube well installed in his field (50ft
deep). He also charges Rs. 50 for one hour pumping if pump is hired out.
Decrease in wetland area
The villagers reported that the wetlands that were around 20-25% of total geographical area
decreased over the years due to encroachment for agriculture and habitation. The wetlands used
to modulate heat waves in the extreme summer and lot of birds and reptiles were seen that was
conducive for maintenance of ecosystem. However the wetlands have reduced to less than 10%
presently.
Impact of climatic hazards on land resources
Uttam Nayak reported a grim picture of natural hazard that has forced him almost to penury.
Consecutively he faced crop loss for 3 years out of last 5 years either due to flood or drought. In
2001 there was severe flood. In 2002 there was drought and again in 2003 there was flood. River
Paika proved to be sorrow of Naladiapalda village. The embankment has worsened their plight.
The 26 households caught outside the flood embankment are worst sufferers. One Shri Surendra
Nath Samantray lost 2.5 acres of land to sand casting in the super cyclone. In the 2003 floods he
lost 100 % of crop 2.5 acres of land. The floods usually come in the months of July and August
and most of the land is put under kharif paddy by then. The flood not only affects the crop but

103
also washes away field bunds and sometimes the topsoil is also affected. However the huge silt
load also helps in improving soil quality due to sediment deposit which sometimes prompt the
farmers to apply less fertilizer. The duration of flood sometimes last for month that completely
destroys any sort land based enterprise. Black gram or groundnut is taken up after flood instead
of paddy wherever irrigation is available otherwise the field is left fallow. Black gram is
considered as best as the post flood crop as it does not require irrigation and fertilizer application
is almost nill due to improved soil condition because of siltations. In the event of flood coming in
the maturity of the crops, farmers used to cut top portion of the paddy and leave the rest in water.
In the event of drought, the common land management practice is to strengthen bunding to
prevent runoff and close rat holes in the fields.
The quality of soil is generally good as perceived by the farmers due to repeated flooding and
siltation. However sometimes due to washout of topsoil under high velocity flood current, the
yields do not commensurate the potentials of the soil, which is compounded by low fertilizer use.
Land management has little relevance for land less categories of population except some
economic activities like grazing in common lands (which is scanty) and digging for mud wall
construction. However they are indirectly affected in terms of availability of wage employment
that gets affected due to flood or drought. The leasing in system though prevails in the area, the
land less people seldom go for it due to high rental fixed for produces. The land less people who
constitute around 20% of population in the village migrate in the event of severe drought and
flood.
Traditional Water resource management
Some old villagers recall that river Paika had been meeting their water requirements almost in all
season and the current salinity problem the month of April to June was not there some fifty years
back. The village has no community irrigation pond and the private ponds are scarcely used for
irrigation purpose as the ponds are shallow and get dried by February leaving little scope for
irrigating a second crop. In total 5 shallow tube wells owned by private individuals are in
operation in the village that irrigate around 60 to 80 acres of land in kharif and 30 acres in rabi
through diesel pumps. Around 40-50 people are water users from private tube wells. The
common method of irrigation in ayacut under private tubewell is through field channels and
mutually decided scheduling among the beneficiaries. Large distance conveyance channel is not
economic due to unleveled field conditions. As little common land is available in the villages,
community pond system is conspicuous in its absence. As the river Paika is nearby, pond water
gets emptied by January due to lower riverbed. The traditional water lifting devices in the area
are “Janta” or “Sena” for small and marginal farmers for surface water. Bund raising is
practiced in the event of an imminent drought. They know the utilization of dew for blacgram
and green gram as they term it “Kakar pani” for crops. They traditionally know In-situ water
harvesting system through maintenance of bunds. But repair and maintenance of field bunds are
costly and get little attention by the farmers. Mulching, as a method of soil and water

104
conservation is known to the people and sometimes practiced for vegetable cultivation to reduce
ET. The people opine that large investment in river lift system using Paika river could irrigate
around 500 acres of land and people are ready to form Pani Panchayat for the same. However
the river water gets saline by April and hence summer crop is also constrained in the absence of
assured irrigation. The drinking water problem is severe due to drying up of existing sources and
salinity ingress due to over drafting in tube wells. Most of the hand pumps are defunct or dried
due to non-maintenance. The absence of a strong water market prevents private investment on
water resources. The water market is at nascent stage.
Recycling of drainage water
The villagers used to recycle drainage water for life saving and supplemental irrigation when
the crops are stressed especially in kharif. The quality of recycled drainage water is not bad as
perceived by the farmers due low fertilizer and pesticide use. In the rabi the fields nearby the
surface drainage system used to have vegetables or summer paddy by utilizing drainage water.
Sometimes the community uses it for sanitary purpose also.
Dwindling Vegetation
The village had around 10-15% of land under forest cover 50 years back in community as well as
private lands. The fuel wood requirement was met from the forest. Though the forest was not
dense, the people were meeting the requirement of traditional forest species for religious
functions and the bamboo was major species that was contributing to the household
requirements. The timber species were not available in the forest. Rampant Cutting of bamboo
and other trees denuded the forest cover and exposed them to repeated grazing by cattle. The
shrubs also dwindled in the process. The flower species like “Champak” etc are no more
available in the area. The private forest plantations are also becoming rare. A species of wood
apple that was plenty is hard to get now. The smell of “Kadamba” a traditional forest species are
extinct now. Earlier people used to plant these in the common forest land and private lands. The
most preferred species now is “Chakunda” in private lands due to speedy growth and log
availability. The preference has also shifted to eucalyptus due to economic reasons. But
plantation activities are not common in the area. Cashew nut plantation in private lands is seen in
backyards of some farm family. Organised orchards are not available in the area.
Common Property Resource Management
Earlier the village used to have small area under village forest, which dwindled with the passage
of time. The villagers used to gather minor forest produce and fuel woods from the forest.
However the forestlands are no more in existence and encroachments have taken the toll of
forestlands. The community pond system is also not prevalent in the village. The publicly
provided drinking water tube wells are mostly defunct due to ill maintenance and drying up of
source. The use of tube wells for drinking water sometimes has caste biasness where upper castes
getting easy assess. Previously the forestland used to be a grazing land for the cattle. With
forestland gone, the grazing is a big problem for the cattle. Community Pastureland is not
105
available in the village and the cattle are set free in rabi for open grazing in fallow private lands.
The stalk feeding is practiced in kharif only. Around 120 cows and 70 number of bullock
population face severe deficit in feed availability and are under nourished. Total goat population
is around 300 but sold early due to absence of grazing facility.
Coping Mechanism
Relief anticipation is immediate behavioral pattern in the event of a flood or drought. (It is a
bureaucratic joke that Orissa has three cropping season. These are kharif, rabi and relief) The
common approach to any imminent flood is to provide higher basement for grain storage and
leave the crops to destiny. Some farmers cut down in inputs from the beginning anticipating
drought and/or flood. The seed rate is lower than recommended doses and fertilizer use is also
minimal. If flood comes in the month of August or September the kharif paddy gets destroyed
and people do not go for paddy again. Instead they sow black gram and groundnut after receding
of the flood and the field is ready edaphically. However some farmers (10%) go for transplanted
paddy by procuring sapling from Marshaghai or Kujanga (Nearest block headquarters) if flood
recedes in last week of August. Land draining in the event of excess rainfall is commonly
practiced by constructing “adinallaha’. No other conservation method is practiced. Varietal
choice is not much influenced by calamities. However the preference is always for HYV due to
promise higher yields even though risky. The people are of the opinion that due to destruction of
plantations and village forest the severity of floods are more. Preparing land for vegetable
cultivation after flood or drought are common crop management practices.
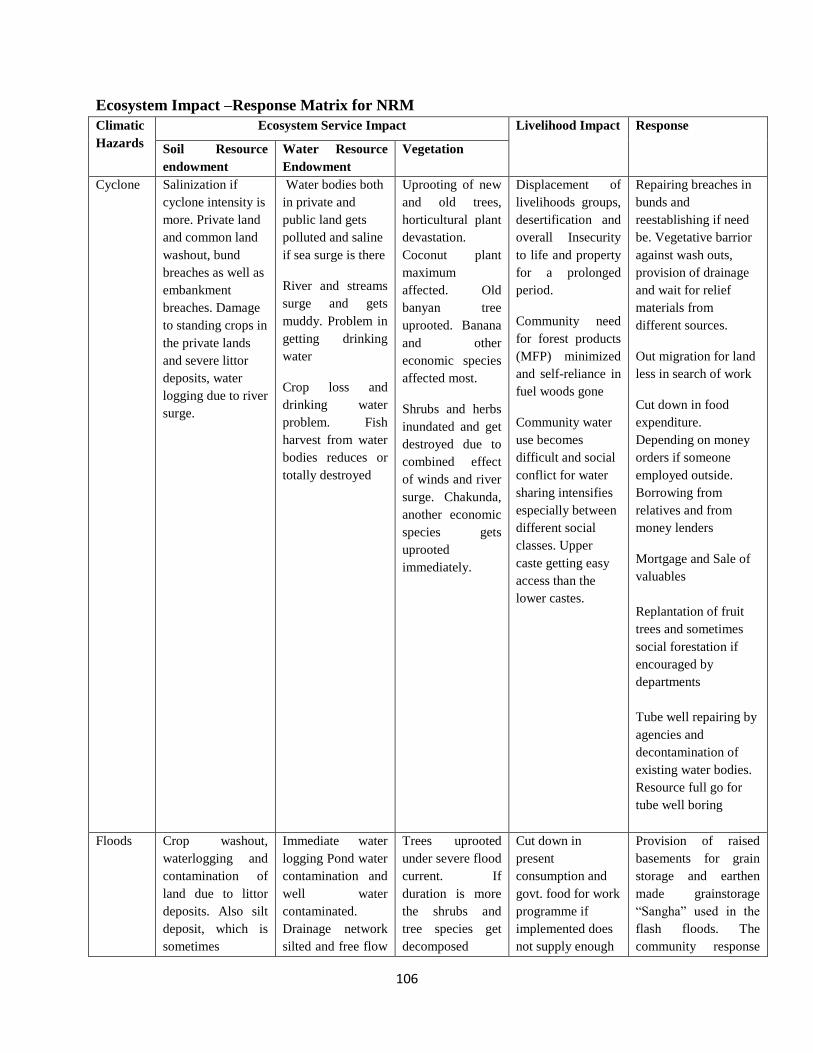
106
Ecosystem Impact –Response Matrix for NRM
Climatic
Hazards
Ecosystem Service Impact Livelihood Impact Response
Soil Resource
endowment
Water Resource
Endowment
Vegetation
Cyclone Salinization if
cyclone intensity is
more. Private land
and common land
washout, bund
breaches as well as
embankment
breaches. Damage
to standing crops in
the private lands
and severe littor
deposits, water
logging due to river
surge.
Water bodies both
in private and
public land gets
polluted and saline
if sea surge is there
River and streams
surge and gets
muddy. Problem in
getting drinking
water
Crop loss and
drinking water
problem. Fish
harvest from water
bodies reduces or
totally destroyed
Uprooting of new
and old trees,
horticultural plant
devastation.
Coconut plant
maximum
affected. Old
banyan tree
uprooted. Banana
and other
economic species
affected most.
Shrubs and herbs
inundated and get
destroyed due to
combined effect
of winds and river
surge. Chakunda,
another economic
species gets
uprooted
immediately.
Displacement of
livelihoods groups,
desertification and
overall Insecurity
to life and property
for a prolonged
period.
Community need
for forest products
(MFP) minimized
and self-reliance in
fuel woods gone
Community water
use becomes
difficult and social
conflict for water
sharing intensifies
especially between
different social
classes. Upper
caste getting easy
access than the
lower castes.
Repairing breaches in
bunds and
reestablishing if need
be. Vegetative barrior
against wash outs,
provision of drainage
and wait for relief
materials from
different sources.
Out migration for land
less in search of work
Cut down in food
expenditure.
Depending on money
orders if someone
employed outside.
Borrowing from
relatives and from
money lenders
Mortgage and Sale of
valuables
Replantation of fruit
trees and sometimes
social forestation if
encouraged by
departments
Tube well repairing by
agencies and
decontamination of
existing water bodies.
Resource full go for
tube well boring
Floods Crop washout,
waterlogging and
contamination of
land due to littor
deposits. Also silt
deposit, which is
sometimes
Immediate water
logging Pond water
contamination and
well water
contaminated.
Drainage network
silted and free flow
Trees uprooted
under severe flood
current. If
duration is more
the shrubs and
tree species get
decomposed
Cut down in
present
consumption and
govt. food for work
programme if
implemented does
not supply enough
Provision of raised
basements for grain
storage and earthen
made grainstorage
“Sangha” used in the
flash floods. The
community response

107
beneficial. Sand
casting is severe
problem and eats
away arable land.
Sometimes frees
land from toxicity
of water reduces.
Drinking water
source polluted.
Water bodies get
extinct if current
washes away
bunds. Fish
resources washed
away from ponds.
under silt load.
Some species gets
completely
washed away.
wage employment
to all categories of
people. Social
functions are
postponed.
Temporary
migration to urban
areas for
employment.
Borrowing money
from relatives and
from
moneylenders. Sale
of gold if
possessed.
build up in the form of
joint effort for
embankment
protection and sharing
food and shelter
among themselves.
Drinking Water
transported from
unaffected area by boat
some times. Wells are
drained out after
receding of floods. The
water hyacinth in the
ponds naturally gets
washed out making it
clean of weeds.
Drought Parch land devoid
of green cover.
Speedy wind
erosion of topsoil
due to drying up of
moisture. Soils get
hard for plowing.
Transplanting not
possible and “Gaja
marudi” if just after
sowing or
transplanting
drought unsets.
Severe rat holes in
the fields appear.
Immediate drinking
water problem and
drying up of water
bodies like ponds
as well as tube
wells. Seasonal
streams and
perennial streams
dry up. Ground
water gets saline
and river water also
unfit for irrigation
and drinking. Fish
population severely
affected due to
drying of water
bodies.
Vegetations also
reduced due to
excessive drying
of soil and
depleting ground
water table.
Unavailability of
fodder for cattle
and canopy cover
for after noon
resting or escape
from scorching
heat.
Severe crop
damage and cut
down in
consumption
expenditure. On
farm Investment
ability reduced.
Low yields create
food insecurity and
imbalance diet.
Non availability of
fodder reduces
cattle milking.
Social spending
reduced. Marriages,
religious ceremonies
cut down. Preparation
for early second crop.
Migration for wage
employment, Sale of
cattle, Sale of
valuables, Reduced
food consumption.
Government and other
agencies food for work
programme intensified
but inadequate for
family maintenance
Heat
wave
Less land based
activities and
drying up of water
bodies. Summer
ploughing
suspended causing
delay in kharif
operation
Water bodies
heated and become
unfit for human
and cattle use. Fish
dies. Faster
decompose of
aquatic weeds.
Trees become less
vigor and loose
green lusture.
Wage employment
is also difficult due
to rising
temperature. Loss
in horticultural
crops like less
coconut production
and less buying and
selling activities in
agricultural
produce.
Thatching intensifies.
People do not venture
out for land based
economic activities

108
Appendix-I
A checklist of NRM approach in Coping with natural disasters and Village preparedness for the same as
responded by the livelihoods groups.
Planning: No planning strategy is adopted in the village and the response is spontaneous and fatalistic.
Capacity building: People have developed inherent strength to face the calamities and little training or
awareness camp organized except common Govt. advertisement for use of hygienic methods for drinking
water or sanitation.
Insurance and other adapting mechanism: Crop insurance available and subscribed by around 50% of
farmers but no compensation due to complicated procedures.
Social Response and adaptability: Group response in terms of sharing of common space and building
group pressure on public machineries for relief and rehabilitation
Mitigation: Activities to prevent or reduce impacts of a catastrophic event prior to its occurrence, such as
land use planning; retrofitting, building codes and public education are not prevalent in the area.
Disaster risk mitigation Structural approaches are almost nil
Non-structural approaches employ land-use controls, information dissemination, and economic
incentives to reduce or prevent disaster vulnerability. No such control is available in the villages
Risk spreading measures: Adopted sometimes through crop management strategies and keeping lands
fallow.
Institutions: NGOs, community-based organisations and government agencies. The village committee in
position and other agencies step in after event. No coordination among the agencies for common
strategies.
Conservation and Adapting to Climate Change: Conservation methods though known not adopted.
Intercropping: Seldom practiced
Soil Management - This approach for increasing the stability and productivity of soil is a general term
that involves a range of specific techniques such as fallow cycling, forest buffering, selective planting,
managed grazing, etc. Soil management is not systematically carried out due to lack of scientific approach
and severity of problem.
Water harvesting: No water harvesting method practiced
Crop management strategy: Sometimes followed
Multiple cropping in waterlogged area: Not carried out
Sequence Cropping: Practiced to some extent (10-15% area)
Drainage Management in Waterlogged area: Field drains provided in excess rainfall situation
Pasture management: Not practiced
Water management methodology: Sometimes practiced.
Short Course
on
Management of Cyclone Disaster in Agriculture Sector in Coastal Areas
(16th to 22nd July 2014)
Course Director Dr. Ashwani Kumar
Course Conveners
Dr. P.S. Brahmanand Dr. Ashok K. Nayak
Organised by
Directorate of Water Management NRM Division (ICAR)
Bhubaneswar‐751023, Odisha
Recommended
![Cyclone Handbook, Section I. Cyclone FPGA Family Data Sheet1]EP1C12F256C8.pdf · Section I. Cyclone FPGA Family Data Sheet ... Cyclone Device Handbook, ... Vertical migration means](https://img.pdfslide.us/doc/110x75/5b3a24897f8b9a600a8f2cfc/cyclone-handbook-section-i-cyclone-fpga-family-data-sheet-1ep1c12f256c8pdf.jpg)


![Hydro-Meteorological Trends in Southwest Coastal ...saciwaters.org/periurban/pdfs/peer-reviewed-papers... · the world [2]. Cyclone, storm surge induced flooding, riverine coastal](https://img.pdfslide.us/doc/110x75/601efb99750b226b2f1dfc9d/hydro-meteorological-trends-in-southwest-coastal-the-world-2-cyclone-storm.jpg)