PASS
MANAGEMENT ACCOUNTING TECHNICAL
REVIEW
2018 CFE

© Professional Accounting Supplementary School (PASS) Page 1
INTRODUCTION
Under the CPA certification program, management accounting is one of the chief competencies
tested on the CFE and it will therefore be critical for students to have a strong grounding in this
area. Management accounting can come up on the Day 2 - Elective Comp as a common area that
needs to be addressed by all students regardless of the depth area chosen. It can also be tested
heavily on the Day 3 – Multis, which has thus far been the case for all of the CFEs.
The purpose of the Management Accounting Technical Review Tab is to provide a detailed
review of the major management accounting topics that could be tested on the CFE.
The topics covered are based on the CPA Competency Map Knowledge Supplement.
Given that there is a short history for the CFE, at this point it is impossible to say which topics
from the CPA Competency Map Knowledge Supplement will often be tested on the CFE. An
attempt was therefore made to cover off all of the major topics. However, those topics that are
more theoretical and are therefore much less likely to be tested on a case exam like the CFE,
have been placed in an Appendix. Minimal time should be spent on the topics in the Appendix.
Most topics are covered at a relatively high level of depth, given that at this point it is impossible
to determine with certainty the precise level of depth that will be required on the CFE for
management accounting. It was therefore felt that students are better off possibly knowing more
than they need to know for the CFE than knowing less.
For example, the notes demonstrate how to calculate all of the different variances, as at this point
it is impossible to determine whether students will be required to do these calculations on future
CFEs. Variances did come up on the 2017 CFE, but in that particular exam the variances were
provided and students only had to explain them. This however is no guarantee that on a future
exam, students will not have to perform variance calculations.
As the whole purpose of these notes is to prepare students for the CFE, in every section of the
notes there is a discussion of how a particular topic may be tested on the CFE.
These notes should be used in conjunction with the case scenarios which are intended to be
reflective of the types of scenarios that may come up on the CFE. It is also important to go over
the problems which provide examples of various calculations students could be called upon to do
on the CFE.

© Professional Accounting Supplementary School (PASS) Page 2
MANAGEMENT ACCOUNTING TECHNICAL REVIEW
TABLE OF CONTENTS
TOPIC
PAGE
1. Lecture 3
2. Problems 102
3. Case Scenarios 126

© Professional Accounting Supplementary School (PASS) Page 3
© Professional Accounting Supplementary School (PASS) Page 4
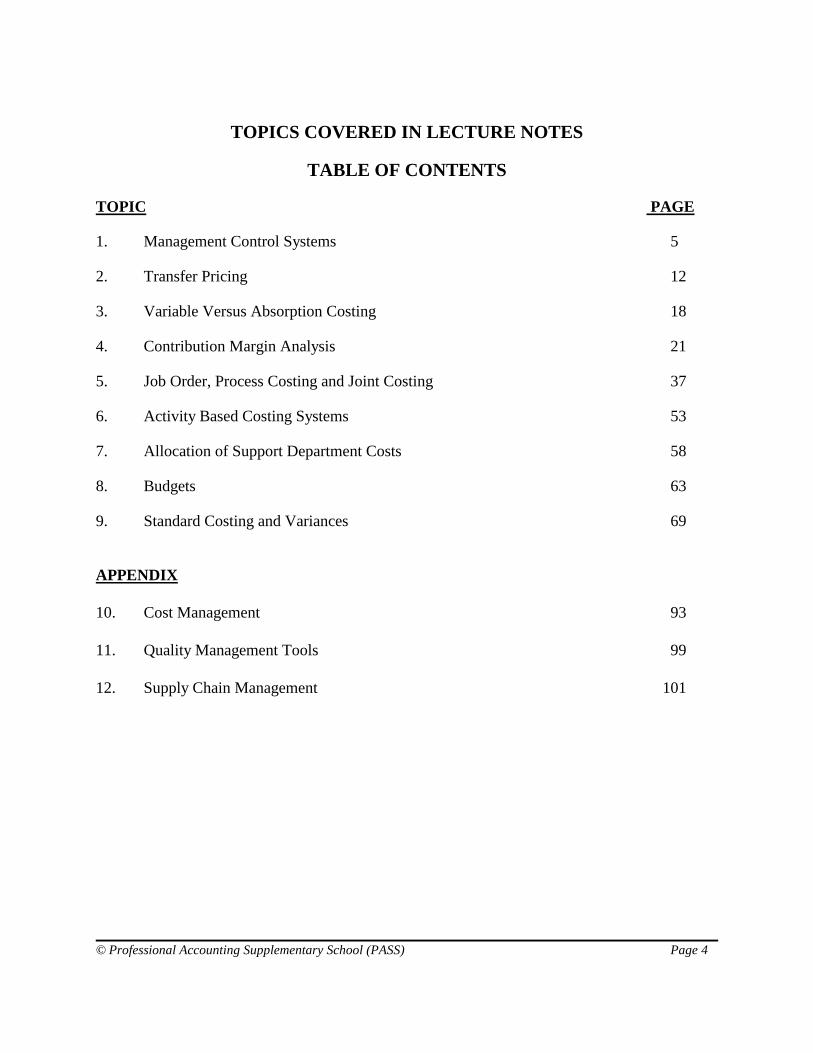
TOPICS COVERED IN LECTURE NOTES
TABLE OF CONTENTS
TOPIC PAGE
1. Management Control Systems 5
2. Transfer Pricing 12
3. Variable Versus Absorption Costing 18
4. Contribution Margin Analysis 21
5. Job Order, Process Costing and Joint Costing 37
6. Activity Based Costing Systems 53
7. Allocation of Support Department Costs 58
8. Budgets 63
9. Standard Costing and Variances 69
APPENDIX
10. Cost Management 93
11. Quality Management Tools 99
12. Supply Chain Management 101

© Professional Accounting Supplementary School (PASS Page 5
MANAGEMENT CONTROL SYSTEMS
DECENTRALIZATION
Why Decentralize?
• Top management focus on long range planning
• Better decision making
• Better training of managers
• Increased job responsibility
• Better measurement of managers performance
Why Not To Decentralize?
• Can lead to sub-optimal decisions - manager of division may make decision that is good for
division but not good for company overall
• Duplication of services leading to inefficiencies (e.g. advertising, accounting, Human
Resources)
• Increased reporting costs
Management Control Systems
A management control system is a responsibility centre is a point in an Organization where there is
control over costs or revenues.
Cost centres - controls costs only
Revenue centre – controls revenue only
Profit centres - controls costs and revenues
Investment centre - controls costs, revenues and investment funds

© Professional Accounting Supplementary School (PASS Page 6
Evaluating Responsibility Centres
• Managers and divisions should only be evaluated on controllable costs
Evaluation of Investment Centres
Two common methods that are used to evaluate investment centres are:
1) Return on Investment (ROI)
2) Residual Income (RI)
Return on Investment (ROI)
ROI = (Net operating inc./sales) x (sales/ave. operat. assets)
Net operating income = inc. before interest & taxes
Ave. operating assets = excluding non-operating assets
ROI measures money 1 dollar of sales will bring in and times
(I.e. - margin x turnover)
Example of Return on Investment
Net operating income $ 10,000
Sales 100,000
Operating assets 50,000
ROI = (10,000/100,000) x (100,000/50,000) = 20%
Impacting ROI
To increase ROI:
1) Increase income (by reducing expenses)
2) Increase sales
3) Decrease assets

© Professional Accounting Supplementary School (PASS Page 7
Impacting ROI
Increase Net Income
A B
Net operating income $10,000 $ 20,000
Sales 100,000 100,000
Operating assets 50,000 50,000
ROI 20%* 40%**
*(10,000/100,000) x (100,000/50,000) = 20%
**(20,000/100,000) x (100,000/50,000) = 40%
Increase Sales
A B
Net operating income $10,000 $ 30,000
Sales 100,000 120,000
Operating assets 50,000 50,000
ROI 20%* 60%**
*(10,000/100,000) x (100,000/50,000) = 20%
**(30,000/120,000) x (120,000/50,000) = 60%
Decrease Assets
A B
Net operating income $10,000 10,000
Sales 100,000 100,000
Operating assets 50,000 30,000
ROI 20%* 33%**
*(10,000/100,000) x (100,000/50,000) = 20%
**(10,000/ 100,000) x (100,000/30,000) = 33%
Residual income (RI)
RI = Net operating income - (Req. ROR. x Ave Operat. Assets)
ROR = required rate of return (on assets)
RI - A project should be accepted if it produces a return greater than the required rate of return.

© Professional Accounting Supplementary School (PASS Page 8
(i.e. - the residual income is positive)
Example
Average operating assets $100,000
Net operating income $ 20,000
Minimum ROR assumed (15%) 15,000
Residual income $ 5,000
Therefore, project is providing a return greater than 15%, and should be accepted.
ROI vs RI
• RI concentrates on maximizing a number (income)
• ROI maximizes a percentage (rate of return)
Strengths of ROI
• Utilizes both earnings and capital
• Different divisions with different sizes can be compared
Weaknesses of ROI
• Easy to manipulate through shifting expenses
• Sub-optimal decisions possible (as divisions maximize their rate of return, not necessarily
companies)
• Does not tie to discounted cash flow analysis - i.e. time value of money not considered
• Penalizes managers for newer investment - as it will mean a higher asset base
Strengths of RI
• Focuses on an income dollar amount
• Easy to understand
© Professional Accounting Supplementary School (PASS Page 9
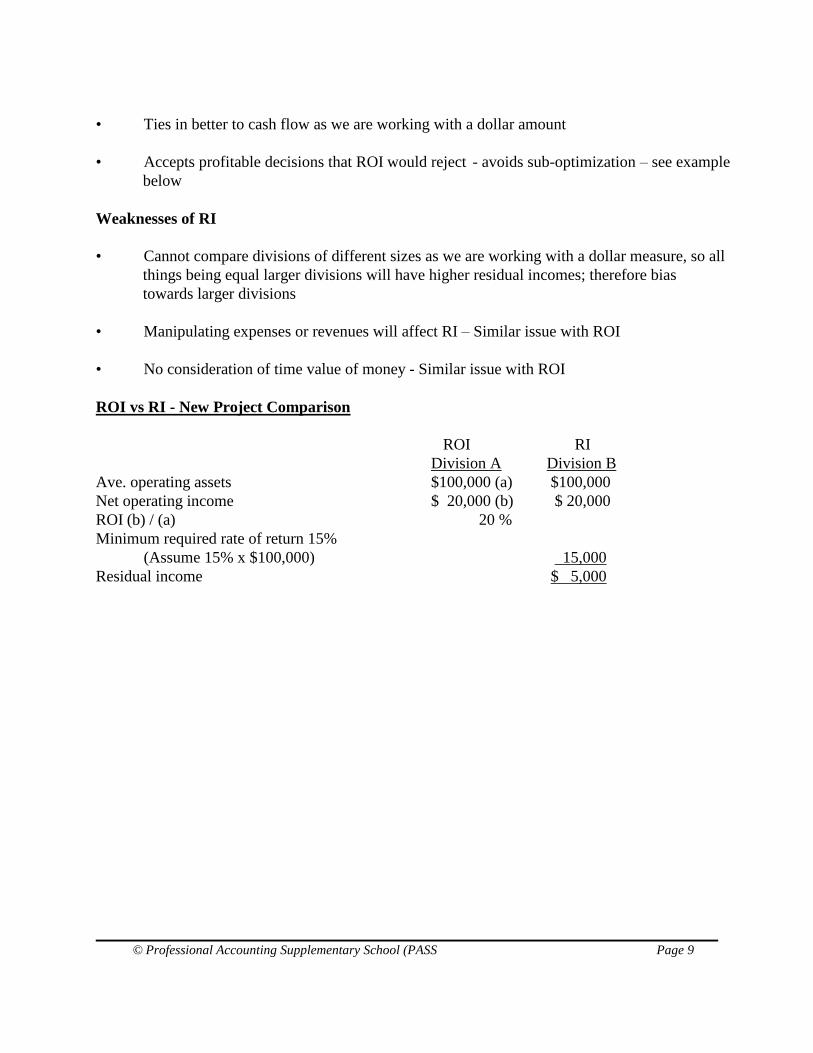
• Ties in better to cash flow as we are working with a dollar amount
• Accepts profitable decisions that ROI would reject - avoids sub-optimization – see example
below
Weaknesses of RI
• Cannot compare divisions of different sizes as we are working with a dollar measure, so all
things being equal larger divisions will have higher residual incomes; therefore bias
towards larger divisions
• Manipulating expenses or revenues will affect RI – Similar issue with ROI
• No consideration of time value of money - Similar issue with ROI
ROI vs RI - New Project Comparison
ROI RI
Division A Division B
Ave. operating assets $100,000 (a) $100,000
Net operating income $ 20,000 (b) $ 20,000
ROI (b) / (a) 20 %
Minimum required rate of return 15%
(Assume 15% x $100,000) 15,000
Residual income $ 5,000

© Professional Accounting Supplementary School (PASS Page 10
Required:
Will a new project with a required investment of $25,000 and return of 18% on invested
assets be accepted by division A and division B ?
Division A
New Project Present Overall
Ave. operating assets (a) $25,000 $100,000 $125,000
Net operating income (b) 4,500* 20,000 24,500
ROI (b) / (a) 18% 20% 19.6%
*$25,000 x 18 % = $4,500
Division B
New Project Present Overall
Ave. operating assets $25,000 $100,000 $125,000
Net operating income 4,500 20,000 24,500
Minimum required rate of return 15%
(assume 15% x $25,000) 3,750 15,000 18,750
Residual income $ 750 $ 5,000 $ 5,750
Conclusion
· Division A will refuse new project as overall rate of return is only 19.6%,
decrease from 20%
· Division B will accept project as overall residual income increases.

© Professional Accounting Supplementary School (PASS Page 11
TESTING OF MANAGEMENT CONTROL SYSTEMS ON CFE Very easy to test evaluation of management on the CFE You may be provided with a multi divisional company and you may need to determine whether the management evaluation system for each division is appropriate. Most important factor to consider is control – managers should be evaluated based on what they have control over If management is rewarded or penalized for things over which they have no control that would be a deficiency – conversely, if factors over which management have control are not built into the management evaluation system, that would also be a deficiency e.g. management of division has control over income and investment but management is only evaluated based on profit rather than say ROI or residual income. May also need to consider allocated costs – if divisional management is being evaluated based on profitability it is questionable whether corporate costs should be allocated to divisions in calculating divisional profitability as even though the division may benefit from corporate costs, divisional management does not have control over corporate costs. May also have to consider the reasonableness of corporate allocations as in some cases they may be arbitrarily allocated; student would then be expected to adjust divisional profits based on a more appropriate allocation before assessing divisional management performance. The issue of responsibility centres came up in the 2017 CFE.

© Professional Accounting Supplementary School (PASS Page 12
APPENDIX
THEORETICAL TOPICS ON COMPETENCY THAT
WOULD BE DIFFICULT TO TEST IN CASE

© Professional Accounting Supplementary School (PASS Page 13
COST MANAGEMENT
Strategic Cost Management
Definition
Strategic cost management is the application of cost management techniques to
simultaneously improve the strategic position of a firm and reduce costs (while at the same
time preserve the key parts of the business)
The development of cost management information to facilitate the principal management
function - strategic management
Strategic cost management can be applied in service and manufacturing settings and in
NPO settings
Strategic cost management includes techniques which aim to: 1) provide correct
information about cost development; 2) quantify exactly every product or service delivered
and every customer served; 3) Minimize costs
Strategic cost management goes beyond a single transaction or a single supplier
relationship. It involves taking cost management tools (described below) and applying
them across the supply chain, measured on supply chain results
Types of Cost Management Initiatives
1) Those that strengthen the firm’s competitive position
Example - A hospital redesigns its admissions process for patients so that it is simpler,
faster and less stressful on the patients to be admitted. If patients have a choice of
hospitals, this hospital will now be more attractive to them. The strategic position of the
firm has been strengthened.
2) Those that have no impact on the firm’s position
Example - An insurance company redesigns its accounts payable system to make it more
efficient. The only purpose is to make the firm more profitable. Therefore, the strategic

© Professional Accounting Supplementary School (PASS Page 14
position of the firm remains unchanged.
3) Those that weaken the firm’s position
Example - An airline reduces headcount and no longer has people asking customers waiting
in line what flight they are waiting for. Customers become upset as they wait in one line
for a long period of time, only to be told they are in the wrong line and must move to a
different line. The cost reduction initiative leads to extreme customer dissatisfaction and
weakens the airlines strategic position.
As a rule of thumb, anything that weakens the strategic position (even if management
believe it is worth it to save costs), is not in the firm’s best interest and should not be
undertaken
Contemporary Management Techniques to Achieve Strategic Cost Analysis
Benchmarking
Total Quality Management (TQM)
Continuous Improvement
Activity Based Costing (ABC) and Management (ABM)
Re-engineering
Theory of Constraints (TOC)
Mass Customization
Target Costing
Life-cycle Costing
The Balanced Scorecard
Key components in these analytical tools include:
1) Cost driver analysis - focus on costs with high impact and trace the unit and volume
components driving them;
2) Root cause analysis - trace the underlying factors behind problems; combines with cost
driver analysis to make a powerful “search engine” for identifying costs;
3) Activity based costing - quantity costs associated with work (projects, processes or ongoing
activities) so that companies can determine the true cost of doing the work;
4) Process re-engineering - techniques for mapping and optimizing throughput, and analyzing
work flow;
5) Organization analysis - techniques for spotting problems with structure, span of control,
accountability, or decision-making that have cost impact.

© Professional Accounting Supplementary School (PASS Page 15
Activity Based Management (ABM)
ABM focuses on the effective and efficient management of activities as the route to
continuously improving the value received by customers and the profit received by
providing this value
ABM utilizes cost information gathered through activity based costing
ABM manages activities rather than resources. It can determine what drives the activities
of your organization and how these activities can be improved to increase profitability
Some of the Benefits of ABM and ABC:
– Improve the effectiveness and efficiency of the processes in your organization
– Eliminate non value adding work
– Improving specific operations, by managing activities that cause incurred costs
– To make effective decisions on product lines, market segments and customer
relationships
– Measure your performance, efficiency and quality
Players Involved in Strategic Cost Management
Top Management
They make the commitment to the SCM approach - incorporate the philosophy, allocate
resources etc.
They set the targets and guide the focus of the effort
They set the tone and communicate the objectives and purpose
They take the action to ensure the changes are made
They monitor progress and results
Key Employees
Work together as a cross-functional team
© Professional Accounting Supplementary School (PASS Page 16
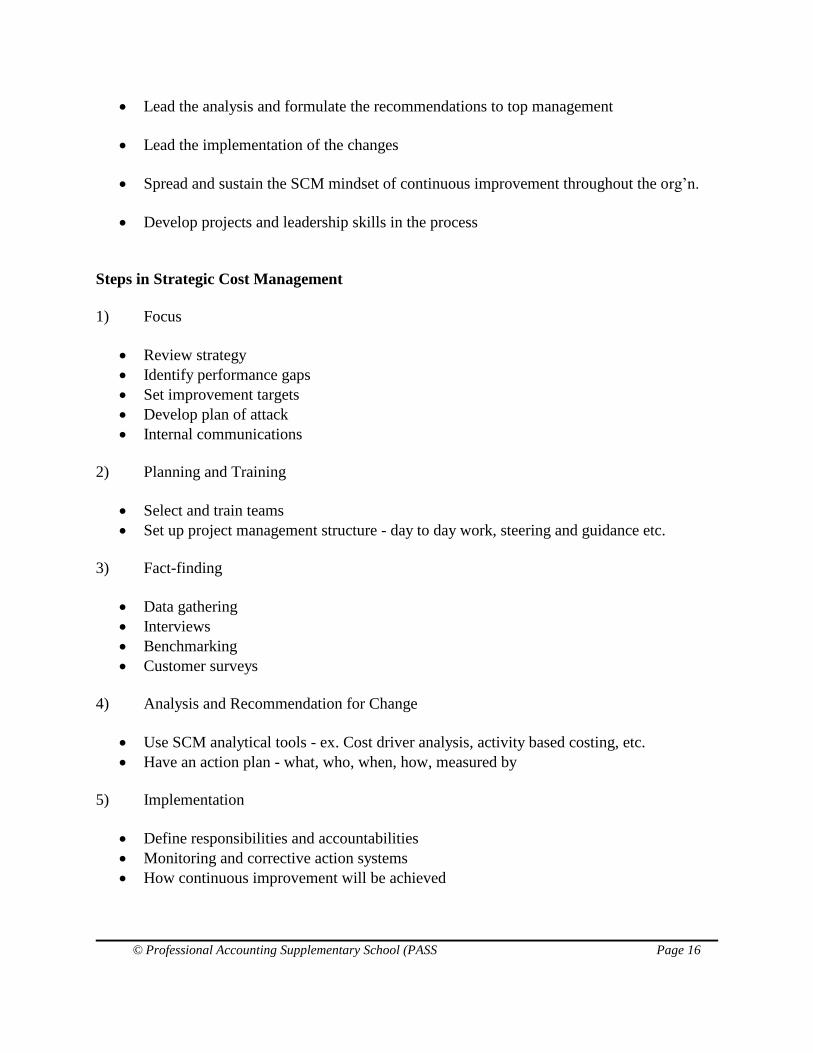
Lead the analysis and formulate the recommendations to top management
Lead the implementation of the changes
Spread and sustain the SCM mindset of continuous improvement throughout the org’n.
Develop projects and leadership skills in the process
Steps in Strategic Cost Management
1) Focus
Review strategy
Identify performance gaps
Set improvement targets
Develop plan of attack
Internal communications
2) Planning and Training
Select and train teams
Set up project management structure - day to day work, steering and guidance etc.
3) Fact-finding
Data gathering
Interviews
Benchmarking
Customer surveys
4) Analysis and Recommendation for Change
Use SCM analytical tools - ex. Cost driver analysis, activity based costing, etc.
Have an action plan - what, who, when, how, measured by
5) Implementation
Define responsibilities and accountabilities
Monitoring and corrective action systems
How continuous improvement will be achieved

© Professional Accounting Supplementary School (PASS Page 17
#3, #4 and #5 are all part of continuous improvement
Key Characteristics About Strategic Cost Management
Structured approach to identify problems and build solutions
Solutions are often creative
Requires a sense of urgency and unity of purpose - teamwork at all levels
Must produce short-term results
Requires new, creative thinking and willingness to consider and accept change
Solutions must be practical and accepted by those who have implement them
Self-driven - key employees are empowered to lead the way
Not a one-off exercise - must create lasting solutions and foster continuous improvement
Organizations must have the personnel in place
Organizations must be flexible
Other Cost Management Methodologies
1) Total Quality Management
A total quality approach strives to produce products and services with extremely low defect rates.
This approach is expected to reduce costs to the organization caused by poor quality including
internal costs (e.g., scraps, reworking) and external costs (e.g., customer complaints, warranty,
repairs).
Quality assurance is a proactive process that strives to prevent quality issues from arising in
production.
Quality control is the reactive process that strives to detect quality issues that have already
arisen in production.

© Professional Accounting Supplementary School (PASS Page 18
2) Business Process Management
Business process management is an approach to improve a company’s business processes using
collaboration between information technology and employees. Organizations use Business Process
Management to identify, design, execute, document, monitor, control and measure business
processes to achieve results consistent with the organization’s strategic goals.
3) Lean Management
A lean management approach considers how the organization can maintain value with fewer costs.
Lean management seeks to identify wasteful processes in the organization and seeks ways to
reduce them.
Characteristics of lean management include:
Involvement of workers from all levels of the organization in providing suggestions for
process improvement.
Relatively high degree of employee participation to increase productivity and overall cost
efficiencies.
Maintaining low levels of inventory to avoid overproduction of goods and inventory
mismanagement issues.
Use of a series of production cells to produce similar products.
Focus on total quality control.

© Professional Accounting Supplementary School (PASS Page 19
© Professional Accounting Supplementary School (PASS Page 20
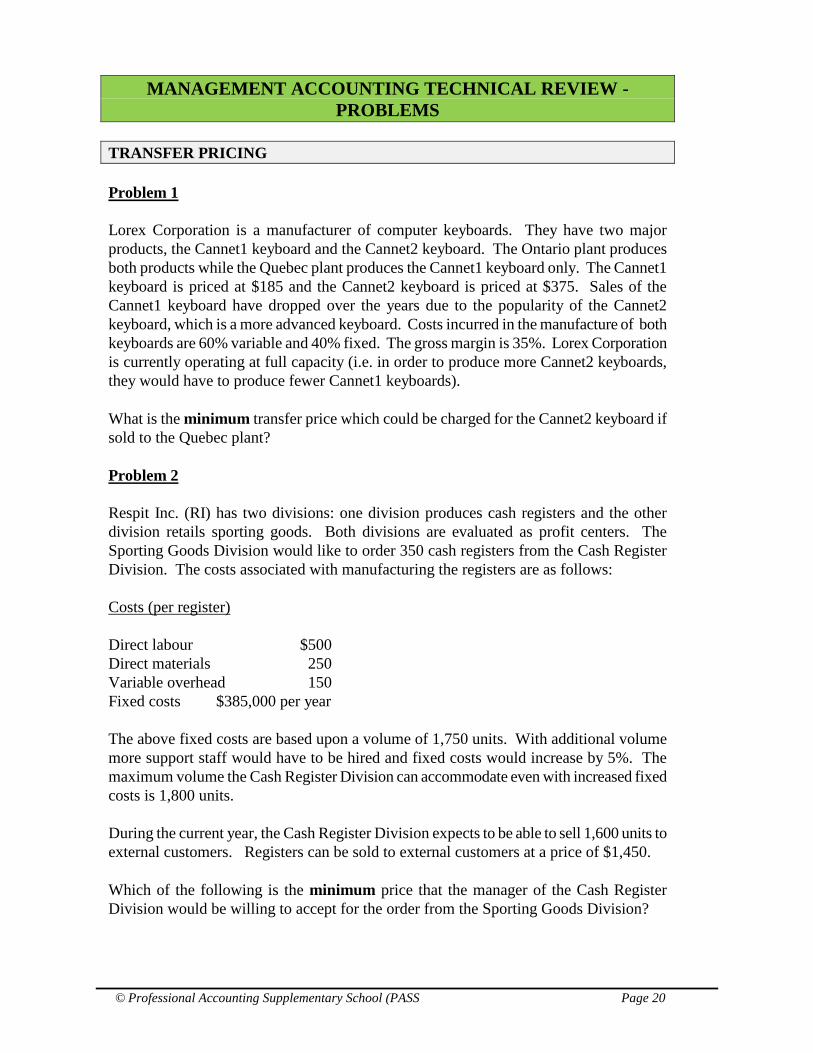
MANAGEMENT ACCOUNTING TECHNICAL REVIEW -
PROBLEMS
TRANSFER PRICING
Problem 1
Lorex Corporation is a manufacturer of computer keyboards. They have two major
products, the Cannet1 keyboard and the Cannet2 keyboard. The Ontario plant produces
both products while the Quebec plant produces the Cannet1 keyboard only. The Cannet1
keyboard is priced at $185 and the Cannet2 keyboard is priced at $375. Sales of the
Cannet1 keyboard have dropped over the years due to the popularity of the Cannet2
keyboard, which is a more advanced keyboard. Costs incurred in the manufacture of both
keyboards are 60% variable and 40% fixed. The gross margin is 35%. Lorex Corporation
is currently operating at full capacity (i.e. in order to produce more Cannet2 keyboards,
they would have to produce fewer Cannet1 keyboards).
What is the minimum transfer price which could be charged for the Cannet2 keyboard if
sold to the Quebec plant?
Problem 2
Respit Inc. (RI) has two divisions: one division produces cash registers and the other
division retails sporting goods. Both divisions are evaluated as profit centers. The
Sporting Goods Division would like to order 350 cash registers from the Cash Register
Division. The costs associated with manufacturing the registers are as follows:
Costs (per register)
Direct labour $500
Direct materials 250
Variable overhead 150
Fixed costs $385,000 per year
The above fixed costs are based upon a volume of 1,750 units. With additional volume
more support staff would have to be hired and fixed costs would increase by 5%. The
maximum volume the Cash Register Division can accommodate even with increased fixed
costs is 1,800 units.
During the current year, the Cash Register Division expects to be able to sell 1,600 units to
external customers. Registers can be sold to external customers at a price of $1,450.
Which of the following is the minimum price that the manager of the Cash Register
Division would be willing to accept for the order from the Sporting Goods Division?

© Professional Accounting Supplementary School (PASS Page 21
MANAGEMENT ACCOUNTING TECHNICAL REVIEW – SOLUTIONS
TRANSFER PRICING
Solution to Problem 1
The fixed costs are:
Cannet1 ($185 - (.35 x $185)) x 40% = $48
Cannet2 ($375 - (.35 x $375)) x 40% = $98
The variable costs are:
Cannet1 ($185 - (.35 x $185)) x 60% = $72
Cannet2 ($375 - (.35 x $375)) x 60% = $146
Therefore, the minimum transfer price which could be reasonably justified on the Cannet2
product is:
Variable costs of Cannet2 $146
Plus Contribution Margin of
Cannet1 ($185 - $72) 113
$259
Solution to Problem 2
As the Cash Register Division is evaluated as a profit center, they would not be willing to
accept a price below the amount necessary to at least recover their incremental costs
associated with the order, as well as any lost contribution margin on sales to external
customer, forfeited as a result of the internal sale.
By accepting the order the Cash Register Division will have to give up sales of 150 units
as they have demand for 1,600 units; the order from the other division is 350 units and full
capacity is only 1,800 units.
Therefore, the Division will not sell the registers at an amount below the incremental
variable costs per unit of $900 for the first 200 units (which can be sold without giving up
sales) and for the next 150 units they will need to recover not only the variable costs but
also the lost contribution margin on the sales. Therefore they will need to recover the full
sales price of $1,450. In addition they will need to recover the additional fixed costs of
$19,250 which are only being incurred due to the increased volume generated by the order
from the Sporting Goods Division.
Thus the Cash Register Division will have to recover an amount in excess of $416,750
based upon the following calculation:
$900 (total variable costs) X 200 registers plus $1,450 X 150 registers plus $19,250

© Professional Accounting Supplementary School (PASS Page 22
(incremental fixed costs) = $416,750.

© Professional Accounting Supplementary School (PASS Page 23
CASE 1
QUESTION AND SOLUTION

© Professional Accounting Supplementary School (PASS Page 24
CASE 1
Watkins Inc. (Watkins) is a small publicly traded manufacturer with various divisions.
Initially, the Electronics Division (Electro) assembled electronic products for industrial
users. This division was quite successful and Watkins was profitable at an early stage in its
existence. Management soon discovered that the electronic circuitry, which was common
to all of the products Watkins made, and was originally outsourced, could be made
internally at a lower cost. Consequently, Watkins started the Circuitry Division (Circuit) to
make the required electronic circuitry. Circuit transferred the circuitry to Electro and also
developed external markets for the excess capacity. As Watkins continued to grow, it
became aware of an opportunity to use its technological competitive advantage in
electronic products for consumers. It added the Consumer Products Division (Consumer).
Again, the electronic circuitry required was internally provided by Circuit. Electro
employs 100 people; Circuit and Consumer employ 60 and 40 people respectively.
Up until very recently, profits for Watkins exceeded expectations. However, increased
competition and a recent downturn in demand for electronic products have caused a
considerable drop in profits for the company. Information about the profitability of its
divisions for the first nine months of the latest fiscal year and about the costs associated
with Circuit are provided in Appendix I. Senior management now believes that sourcing
the circuitry externally might be more cost effective than producing it internally.
Management believes, based on the volume of electronic circuitry required for Electro and
Consumer, that they can negotiate a purchase price of $28 per unit with an outside
supplier. The price is based on receiving large volume discounts.
At the May 1, 2018 board meeting, a proposal was presented to the Board to outsource the
circuitry for Watkins other divisions and to dispose of Circuit. Some Board members
were surprised by senior management’s suggestions and questioned the underlying belief
that outsourcing the circuitry will be more cost effective. The Board tentatively approved a
plan to outsource the circuitry and dispose of Circuit, but requested further analysis
supporting the profitability of this course of action.
It is now May 15, 2018 and the president of Watkins, Jeff Watkins, has approached you,
CPA, an analyst in the corporate office, to assist in answering the Board s requests.
“CPA, please prepare a report to me analyzing the concerns raised by the Board. Also,
the discussion at the Board meeting raised a question in my mind about our divisional
transfer pricing policy. I’m assuming that the policy does not need to change. What do you
think? Also our general manager of Circuit, Edward Norton, seems to have some strong
concerns about our transfer pricing system and the overall way in which his division is
evaluated. I would like you to address his concerns."
After your conversation, you started gathering information. You started by obtaining the
divisional financial statements for the current year. You then met with the general manager
of Circuit, Edward Norton. Your notes from the meeting are summarized in Appendix II.

© Professional Accounting Supplementary School (PASS Page 25
APPENDIX I
DIVISIONAL FINANCIAL INFORMATION
For the nine months ended April 30, 2018
Electro Circuit Consumer Total
Sales revenue External $ 6,000,000 $ 825,000 $ 7,000,000 $ 13,825,000
Sales revenue Internal - 1,410,000 - 1,410,000
6,000,000 2,235,000 7,000,000 15,235,000
Cost of goods sold 3,600,000 2,600,000 3,500,000 9,700,000
Gross margin
2,400,000
( 365,000)
3,500,000
5,535,000
Divisional selling, general,
and administration costs 1,000,000 400,000 2,000,000 3,400,000
Operating income 1,400,000 ( 765,000) 1,500,000 2,135,000
Corporate cost allocation
(Note)
500,000 500,000 500,000 1,500,000
Income (loss) $900,000 $(1,265,000) $1,000,000
$635,000
Note
Corporate costs allocated include costs relating to marketing, corporate accounting, legal
costs, human resources and Information Technology (IT) Services. All of the divisions
are highly computerized (especially Electro which has twice as many computers as the
other two divisions) so all of the divisions require ongoing IT support. IT also develops
computer systems used for manufacturing operations, administration and accounting.
CIRCUITRY DIVISION
Cost breakdown for Electronic
Units per
year
Units to
April. 30,
2018
Capacity of manufacturing
facility 133,333
Internal transfers 75,000**
External sales
25,000
External unit selling price $ 33
Costs incurred per unit:
Materials $ 6
Labour 8
Manufacturing overhead* 12
Total $ 26
*Approximately 40% of the manufacturing overhead is variable. ** 1/3 of the units
transferred internally were sold to Electro and 2/3 of the units were sold to Consumer
© Professional Accounting Supplementary School (PASS Page 26
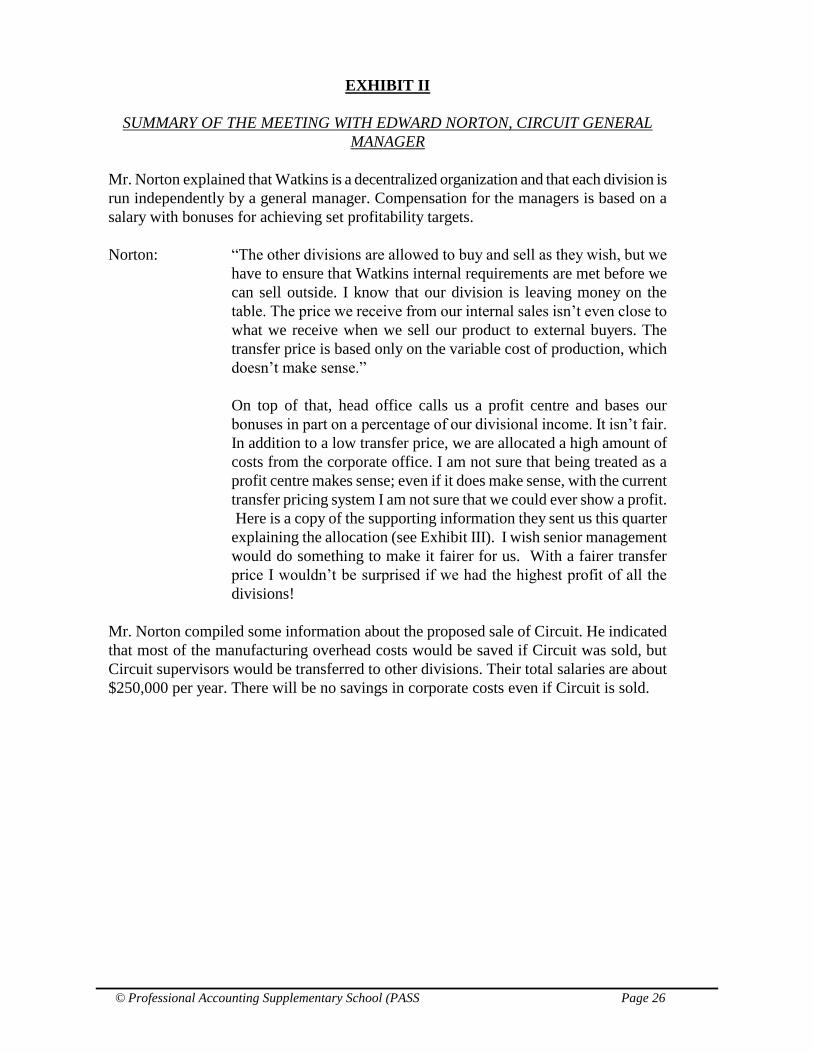
EXHIBIT II
SUMMARY OF THE MEETING WITH EDWARD NORTON, CIRCUIT GENERAL
MANAGER
Mr. Norton explained that Watkins is a decentralized organization and that each division is
run independently by a general manager. Compensation for the managers is based on a
salary with bonuses for achieving set profitability targets.
Norton: “The other divisions are allowed to buy and sell as they wish, but we
have to ensure that Watkins internal requirements are met before we
can sell outside. I know that our division is leaving money on the
table. The price we receive from our internal sales isn’t even close to
what we receive when we sell our product to external buyers. The
transfer price is based only on the variable cost of production, which
doesn’t make sense.”
On top of that, head office calls us a profit centre and bases our
bonuses in part on a percentage of our divisional income. It isn’t fair.
In addition to a low transfer price, we are allocated a high amount of
costs from the corporate office. I am not sure that being treated as a
profit centre makes sense; even if it does make sense, with the current
transfer pricing system I am not sure that we could ever show a profit.
Here is a copy of the supporting information they sent us this quarter
explaining the allocation (see Exhibit III). I wish senior management
would do something to make it fairer for us. With a fairer transfer
price I wouldn’t be surprised if we had the highest profit of all the
divisions!
Mr. Norton compiled some information about the proposed sale of Circuit. He indicated
that most of the manufacturing overhead costs would be saved if Circuit was sold, but
Circuit supervisors would be transferred to other divisions. Their total salaries are about
$250,000 per year. There will be no savings in corporate costs even if Circuit is sold.

© Professional Accounting Supplementary School (PASS Page 27
EXHIBIT III
CORPORATE COSTS
THIRD QUARTER SUMMARY
Information Technology Department
(Note 1) $ 475,200
Legal Department (Note 2) 221,500
Marketing and Sales Department (Note 3) 463,000
Human Resource Department 110,000
Accounting Department (Note 3) 230,300
Year-to-date corporate costs $ 1,500,000
In accordance with corporate policy, these costs have been allocated evenly to each of the
divisions.
Notes:
1. Watkins is in the process of implementing a new payroll system this year for
Consumer, so the cost allocation is about $300,000 higher than the same period
last year. The implementation should be completed by the end of the year.
2. The lawsuit in which Electro is involved is currently being fought in court by a
team of outside lawyers. We have incurred an estimated $200,000 in this case. We
anticipate returning to lower, more normal legal costs in the next quarter.
3. Approximately 80% of resources of the marketing and sales departments as well as
the accounting department is expended on Consumer, as they do not yet have a
significant marketing and sales departments or accounting department.

© Professional Accounting Supplementary School (PASS Page 28
CASE 1 - SOLUTION
The following issues are addressed in this report:
1. An assessment of the profitability of internally manufacturing circuitry
compared to the alternative of outsourcing.
2. The implications of the current transfer-pricing policy.
3. Allocation of corporate costs to divisions.
4. Performance evaluation (bonus) for Circuit.
Issues 2 through 4 are very much intertwined as the transfer price used and allocation
of corporate costs impact the bonus.
OUTSOURCING AND SALE OF CIRCUIT
Management is proposing to outsource the circuitry being made for other divisions by
Circuit and then to dispose of Circuit. Some board members were surprised by this
proposal and have asked for an analysis supporting the decision. My quantitative
analysis of the profitability of manufacturing the circuitry compared to sourcing it
externally is included in Appendix 1. The analysis compares the costs of producing
the electronic circuitry to the outside purchase price. It is clear that the division can
produce the units at a lower price than Watkins can purchase them for. The full cost to
produce the units is $26 (at full capacity) compared to an external price of $28. There
is a net cost to purchasing the units, based on a full production capacity of 133,333
units, of $516,666 (partly due to the fact that $250,000 of supervisor salaries will not
be saved if a decision to outsource the production is taken).
There is one additional consideration. Management’s plan also entails selling the
division. Watkins would then also be giving up the revenues generated by the outside
sales of Circuit, but will also not incur the selling, general and administrative costs of
$400,000 associated with the administration, sales and marketing functions of the
division. Based on my calculations, Watkins would be saving $366,668 annually by
closing down the division and eliminating the administrative and selling costs
associated with the division. The net cost of the decision must therefore be decreased
by this amount. Therefore, overall, the net cost appears to be closer to $150,000
annually.
Based on the above, it appears better for Watkins, at a company-wide level, to
manufacture the circuitry internally. I recommend not proceeding with management s
plan to outsource circuitry and dispose of Circuit. The better course of action at
present is to continue to produce internally.

© Professional Accounting Supplementary School (PASS Page 29
Achieving Competent
In order to achieve competent it would have been necessary to perform a reasonable
analysis of the outsourcing proposal, including a recognition of fixed and/or
opportunity costs, and recommend a course of action.
The precise recommendation made would not have been important as long as a
reasonable recommendation consistent with one’s analysis was made.
© Professional Accounting Supplementary School (PASS Page 30
TRANSFER PRICING, PERFORMANCE EVALUATION AND ALLOCATION
OF CORPORATE COSTS
Transfer pricing
Circuit’s divisional results are misleading, as the losses are being driven by the transfer
price that is not reasonable. Currently, the transfer price is based on variable cost,
which is a much lower cost than the market value of the circuitry. Using variable
costing makes sense when the division is not at capacity or cannot sell its product
outside the company but not in Circuit’s situation where the division can sell
externally. Management should consider changing its transfer price to better reflect the
opportunity cost of selling the units internally. There are a couple of options:
1. Treat as a profit centre using market price
Circuit is at capacity and appears able to sell its product to external clients. In fact,
Mr. Norton claims he could sell more to the outside market if management would
let him. As a market price is readily available ($33 or could use $28), Watkins
could use that market price as the divisional transfer price. However, the market
seems to be in decline, so a transfer price of $28 might be more reasonable,
particularly since the other divisions could argue that they can buy the same unit
from an outside supplier at this price. I have calculated the impact on profit
allocation in Appendix 2, using a transfer price of $28, the price at which the
divisions could purchase the units externally. The other two divisions may be
unhappy about having to absorb the higher cost, but if they were to buy the circuitry
externally, they would be paying that cost, and should therefore be willing to accept
the higher transfer price.
2. Treat as a cost centre
An alternative is to re-examine Watkins policy of classifying divisions as cost
centres or profit centres for transfer-pricing purposes. Since the purpose of Circuit
is to supply the other two divisions at an economical price, an argument could be
made to treat it as a cost centre rather than as a profit centre. In this case, Circuit
would be evaluated on its ability to control costs. The circuitry would continue to
be transferred at cost in this case.
Achieving Competent
It should be noted that the above 2 options are not the only options students could
have considered. What was critical for achieving competent was:
a) recognizing that the current transfer pricing policy is not appropriate (with
adequate reasoning) and needs to be changed

© Professional Accounting Supplementary School (PASS Page 31
b) providing a reasonable discussion of transfer pricing alternatives that the
company could use in place of its existing policy
Corporate cost allocation
Currently, each division is being arbitrarily allocated one-third of the corporate costs
which distorts the performance and hence evaluation of the divisions. The list of
corporate costs suggests that costs of different types are lumped into the allocation
regardless of their nature. These costs should be allocated to the divisions on different
bases which take into account the extent to which corporate costs relate to a given
division in order to provide a fairer allocation. In Appendix 2 corporate costs are
allocated in a fairer manner. Explanations for the basis of allocation for each of the
costs are provided in the notes to the Appendix.
After allocating corporate costs in a more reasonable manner (and a more appropriate
transfer price is used), divisional results are more representative of performance which
allows for a better assessment of overall divisional performance by management and
the board. It is critical to note that after adjusting for the inappropriate transfer price
and allocation of corporate costs, Circuit is actually not only profitable but more
profitable than Consumer.
Performance evaluation (bonus)
It is questionable whether corporate costs should be allocated to divisions at all as
managers are being evaluated on costs they cannot control. While the divisional
managers need to be aware of these costs, they cannot control them and therefore could
object to their performance bonuses being impacted by their allocation. One option is
for Watkins to evaluate performance based on divisional operating income, rather the
divisional net income. Only controllable costs would then impact the assessment of
divisional performance.
On the other hand divisions do benefit from the corporate costs and therefore it can be
argued that an allocation should be made to take that into account.
In the final analysis, based on Appendix II even after allocating corporate overhead,
(on a reasonable basis), Circuit shows a profit, which should positively impact bonuses
for Circuits management which are in part based on a percentage of profit.
Achieving Competent
In order to achieve competent a student would not necessarily have to allocate
corporate costs in the exact manner in which they were allocated in the solution.
What was critical for achieving competent was:
a) recognizing that the original allocation of corporate costs was completely
arbitrary and not reasonable/fair which distorts divisional evaluation
b) re-allocating the corporate costs in a reasonable manner with explanation

© Professional Accounting Supplementary School (PASS Page 32
c) concluding on the profitability of Circuit compared with the other divisions
(in light of Norton’s comment that with a fairer transfer price he wouldn’t be
surprised if his division had the highest profit of all the divisions)
d) discussing the bonus (given that Norton was concerned about the bonus)
which is based in part on divisional income.

© Professional Accounting Supplementary School (PASS Page 33
APPENDIX I
ANALYSIS OF OUTSOURCING PROPOSAL
Additional costs to purchase versus produce the units full capacity of 133,333 units ($28 - $26) X 133,333
$ 266,666
Supervisors' salary that will continue to be incurred
250,000
Increase in cost to purchase versus produce
516,666
Opportunity cost of lost contribution from outside sales (equal to external sales contribution less SGA costs)
External sales gross margin ($33 - $28) x 33,333 units*
166,665
Elimination of selling, general and administrative costs of the division on annualized basis (400,000 x (12/9)
-533,333
Net cost of outsourcing
$ 149,998
* Based on annualized external sales (i.e. 25,000 x 12/9)
© Professional Accounting Supplementary School (PASS Page 34
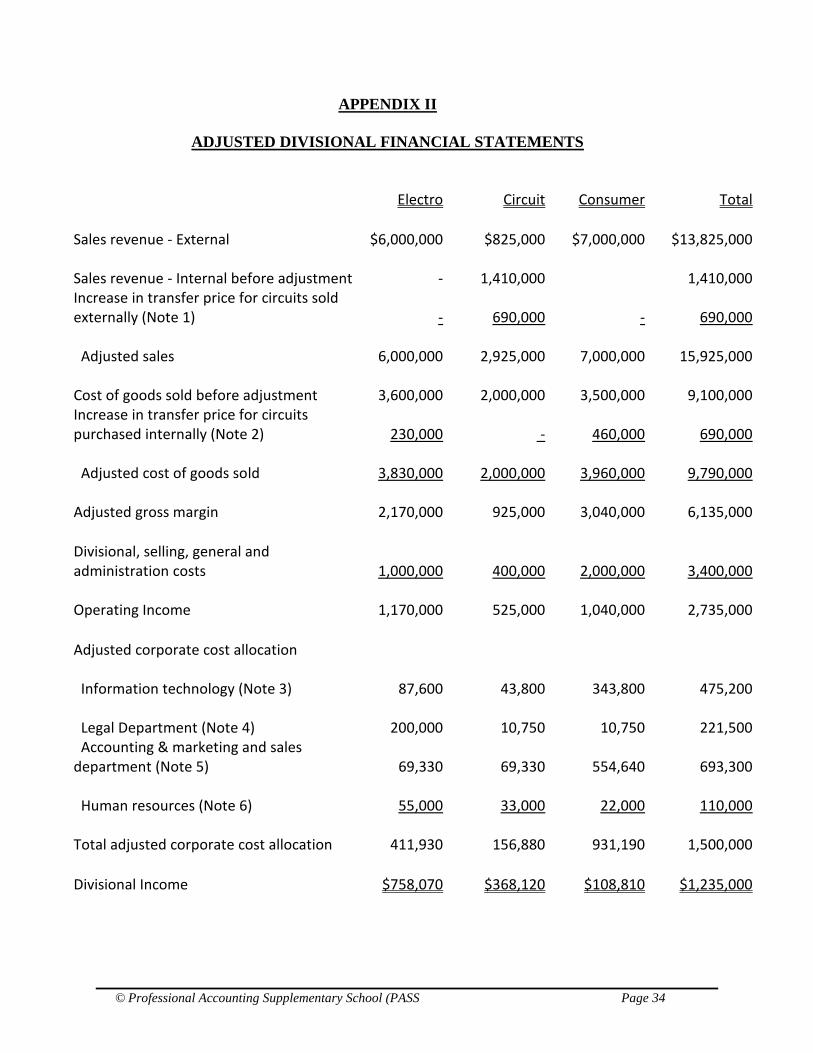
APPENDIX II
ADJUSTED DIVISIONAL FINANCIAL STATEMENTS
Electro Circuit Consumer Total Sales revenue - External $6,000,000 $825,000 $7,000,000 $13,825,000
Sales revenue - Internal before adjustment -
1,410,000
1,410,000 Increase in transfer price for circuits sold externally (Note 1) - 690,000 -
690,000
Adjusted sales
6,000,000
2,925,000
7,000,000
15,925,000
Cost of goods sold before adjustment
3,600,000
2,000,000
3,500,000
9,100,000 Increase in transfer price for circuits purchased internally (Note 2)
230,000 -
460,000
690,000
Adjusted cost of goods sold
3,830,000
2,000,000
3,960,000
9,790,000
Adjusted gross margin
2,170,000
925,000
3,040,000
6,135,000 Divisional, selling, general and administration costs
1,000,000
400,000
2,000,000
3,400,000
Operating Income
1,170,000
525,000
1,040,000
2,735,000 Adjusted corporate cost allocation
Information technology (Note 3)
87,600
43,800
343,800
475,200
Legal Department (Note 4)
200,000
10,750
10,750
221,500 Accounting & marketing and sales department (Note 5)
69,330
69,330
554,640
693,300
Human resources (Note 6)
55,000
33,000
22,000
110,000
Total adjusted corporate cost allocation
411,930
156,880
931,190
1,500,000 Divisional Income $758,070 $368,120 $108,810 $1,235,000

© Professional Accounting Supplementary School (PASS Page 35
APPENDIX II
ADJUSTED DIVISIONAL FINANCIAL STATEMENTS
Notes
1. Based on the $9.20 difference between the recommended transfer price of $28
and the original transfer price of $18.80 multiplied by the 75,000 units sold by
Circuit internally.
2. Based on the $9.20 difference between the recommended transfer price and the
original transfer price multiplied by the number of units purchased by each of
Electro and Consumer from Circuit. Electro purchased 1/3 of the units which
amounts to 25,000 units and Consumer purchased 2/3 of the units which
amounts to 50,000 units.
3. For IT the full $300,000 relating to implementing the payroll system for
Consumer was allocated to Consumer. The remaining $175,200 was allocated
between the 3 divisions based on the number of computers on the assumption
that divisions with more computers would require more support. As Electro has
twice as many computers as the other 2 divisions it was allocated twice as much
of the remaining $175,200 as the other 2 divisions.
On that basis Consumer was allocated $300,000 for the payroll system plus
$43,800 (i.e. ¼ of the remaining $175,100) for a total of $343,800. Electro was
allocated ½ of the $175,200 and Circuit was allocated ¼ of the $175,200.
4. For legal costs the $200,000 relating to the lawsuit in which Electro is involved
was fully allocated to Electro. The remaining $21,500 was allocated evenly
between Circuit and Consumer.
5. As approximately 80% of resources of the marketing and sales departments as
well as the accounting department are expended on Consumer, $554,640 of
these costs was allocated to Consumer. The remaining $138,660 was allocated
evenly between Circuit and Elelctro.
6. Human resources costs were allocated based on the head counts in each of the
divisions on the basis that these costs correlate with the number of employees in
a given department. As 50% of the employees are in Electro it was allocated
half of the cost. Circuit and Consumer were allocated 30% and 20% of the
costs respectively based on the percentage of employees in each of these
departments.
Recommended