Managed Care and
Low-Income Populations:
A Case Study of
Managed Care in California
Authors:
Debbie Draper
Marsha Gold
Mathematica Policy Research, Inc.
Julie Hudman
The Henry J. Kaiser Family Foundation
Kaiser/Commonwealth
Low-Income Coverage
and Access Project

KAISER/COMMONWEALTH LOW-INCOME COVERAGE AND ACCESS PROJECT
The Henry J. Kaiser Family Foundation and The Commonwealth Fund are jointly sponsoring
The Low-Income Coverage and Access Project to examine how changes in the Medicaid program and the
movement toward managed care are affecting health insurance coverage and access to care for the
low-income population. This large-scale project, initiated in 1994, has examined the impact of
changes in eight states: California, Florida, Maryland, Minnesota, New York, Oregon, Tennessee,
and Texas. Information is being collected through case studies, surveys and focus groups to assess
changes in health insurance coverage and access to care from the perspectives of numerous key
stakeholders — consumers, state officials, managed care plans, and providers.

MANAGED CARE AND LOW- INCOME POPULATIONS: A CASE STUDY OF MANAGED CARE IN CALIFORNIA
December 1999
Authors: Debbie Draper Marsha Gold Mathematica Policy Research, Inc. and Julie Hudman The Henry J. Kaiser Family Foundation

1
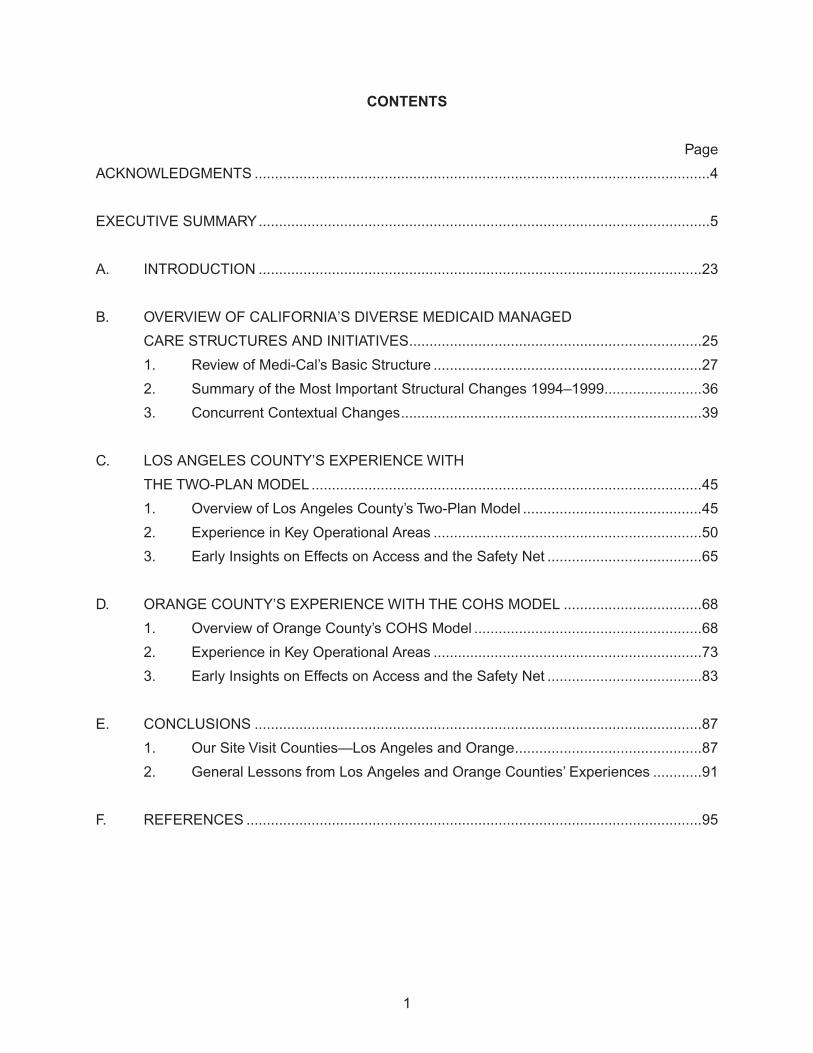
CONTENTS
Page
ACKNOWLEDGMENTS ................................................................................................................4
EXECUTIVE SUMMARY...............................................................................................................5
A. INTRODUCTION .............................................................................................................23
B. OVERVIEW OF CALIFORNIA’S DIVERSE MEDICAID MANAGED
CARE STRUCTURES AND INITIATIVES........................................................................25
1. Review of Medi-Cal’s Basic Structure ..................................................................27
2. Summary of the Most Important Structural Changes 1994–1999........................36
3. Concurrent Contextual Changes..........................................................................39
C. LOS ANGELES COUNTY’S EXPERIENCE WITH
THE TWO-PLAN MODEL ................................................................................................45
1. Overview of Los Angeles County’s Two-Plan Model ............................................45
2. Experience in Key Operational Areas ..................................................................50
3. Early Insights on Effects on Access and the Safety Net ......................................65
D. ORANGE COUNTY’S EXPERIENCE WITH THE COHS MODEL ..................................68
1. Overview of Orange County’s COHS Model ........................................................68
2. Experience in Key Operational Areas ..................................................................73
3. Early Insights on Effects on Access and the Safety Net ......................................83
E. CONCLUSIONS ..............................................................................................................87
1. Our Site Visit Counties—Los Angeles and Orange..............................................87
2. General Lessons from Los Angeles and Orange Counties’ Experiences ............91
F. REFERENCES ................................................................................................................95
2
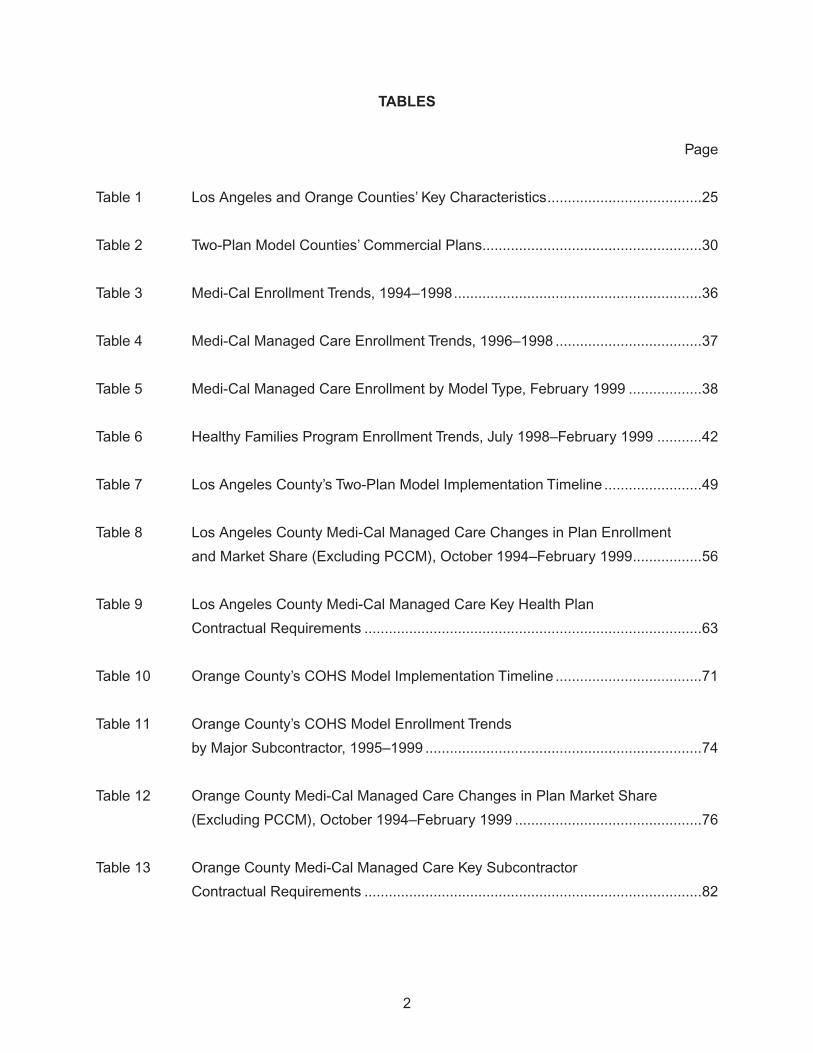
TABLES
Page
Table 1 Los Angeles and Orange Counties’ Key Characteristics......................................25
Table 2 Two-Plan Model Counties’ Commercial Plans......................................................30
Table 3 Medi-Cal Enrollment Trends, 1994–1998.............................................................36
Table 4 Medi-Cal Managed Care Enrollment Trends, 1996–1998 ....................................37
Table 5 Medi-Cal Managed Care Enrollment by Model Type, February 1999 ..................38
Table 6 Healthy Families Program Enrollment Trends, July 1998–February 1999 ...........42
Table 7 Los Angeles County’s Two-Plan Model Implementation Timeline ........................49
Table 8 Los Angeles County Medi-Cal Managed Care Changes in Plan Enrollment
and Market Share (Excluding PCCM), October 1994–February 1999.................56
Table 9 Los Angeles County Medi-Cal Managed Care Key Health Plan
Contractual Requirements ...................................................................................63
Table 10 Orange County’s COHS Model Implementation Timeline ....................................71
Table 11 Orange County’s COHS Model Enrollment Trends
by Major Subcontractor, 1995–1999 ....................................................................74
Table 12 Orange County Medi-Cal Managed Care Changes in Plan Market Share
(Excluding PCCM), October 1994–February 1999 ..............................................76
Table 13 Orange County Medi-Cal Managed Care Key Subcontractor
Contractual Requirements ...................................................................................82

3
FIGURES
Page
Figure 1 Los Angeles County’s Two-Plan Model Structure ................................................48
Figure 2 Orange County’s COHS Model Structure ............................................................72

4
ACKNOWLEDGMENTS
Many people helped make this update possible. Among them are the numerous individuals in
California—including state officials, plan representatives, providers, advocates, and other market
observers—who generously contributed their time, granting interviews, furnishing written materi-
als, and reviewing drafts. We are deeply grateful for their efforts.
Barbara Lyons of the Henry J. Kaiser Family Foundation and Cathy Schoen of The Common-
wealth Fund developed this follow-up study to our earlier case studies. We are grateful for their
guidance and that of Diane Rowland, executive vice-president of the Kaiser Family Foundation,
who developed the concept for the original study.
We also greatly appreciate the contributions of Jim Verdier and Jessica Mittler of Mathematica
Policy Research for comments on an earlier draft and Hilary Frazer for here assistance in plan-
ning the site visit. We are also grateful to Donna Dorsey and Tina Scipio, who provided secretarial
support, and Elizabeth Hurley, who provided editorial assistance.
5
EXECUTIVE SUMMARY
This report updates a case study of Medicaid managed care in California that Mathematica
Policy Research, Inc. (MPR) conducted in 1994. In reviewing the evolution of California’s Medic-
aid program, Medi-Cal, during the past four years, we focused especially on Los Angeles and
Orange counties. Because California uses multiple managed care models, covering them all in a
single case study would be nearly impossible.
The report builds on the ongoing study of managed care for low-income populations in seven
states that MPR is conducting for The Henry J. Kaiser Family Foundation and The Common-
wealth Fund. During week-long site visits to California in October 1994 and February 1999, MPR
focused on the different Medi-Cal managed care initiatives, paying specific attention to the struc-
ture, operational experience, and implications for health care access and the safety net for low-
income individuals.
BACKGROUND
California incorporated managed care in its Medicaid program since the 1970s, but poorly
designed systems and unethical practices by some health plans plagued many early efforts. In
1994, just over 900,000 Medi-Cal beneficiaries, or 17 percent of the Medi-Cal population, were
enrolled in some form of managed care, predominantly prepaid health plans. The state, how-
ever, wanted to use managed care more extensively to improve access for beneficiaries as well
as to create a long-term cost-containment strategy. California set a goal of enrolling 2.8 million
beneficiaries, or 50 percent of the Medi-Cal population, in managed care by the end of 1996. Cur-
rently, Medi-Cal managed care operates in 26 of California’s 58 counties and includes 46 percent
of the state’s total Medicaid enrollment.
California uses three predominant managed care models for its Medi-Cal program—the county
organized health system (COHS), geographic managed care (GMC), and the two-plan model.
Although the three models provide counties with a basic design for their managed care initiative,

6
each county must individualize its program to reflect local circumstances. COHSs, which have
been in use in California since the 1980s, are health insuring organizations authorized by a
county’s board of supervisors to contract with Medi-Cal on a capitated basis. The COHSs develop
and maintain a network of contracted providers to deliver care to Medi-Cal beneficiaries. Five
COHSs operate in the state: one each in Orange, San Mateo, Santa Barbara, and Santa Cruz
counties and another in Solano County that also serves Napa County. Federal legislation passed
in 1991 limits the number of COHSs to no more than the five currently in operation and holds total
COHS model enrollment to no more than 10 percent of the state population.
In the GMC model, the state contracts with multiple commercial health plans on a capitated
basis to provide services within a designated geographic area. It was first implemented by Sac-
ramento County in 1994, followed by San Diego County in 1998. Currently, these are the only two
counties using the GMC model. In Sacramento County, the state contracts with six plans; in San
Diego County, it contracts with seven.
The two-plan model is the newest of California’s Medi-Cal managed care models. In use since
1996, it was developed to provide some protection for traditional providers while also encourag-
ing broader provider participation in the Medi-Cal program. Under the two-plan model, Medi-Cal
beneficiaries can enroll in either a local initiative plan—a county-operated or community-based
entity that is required to contract with traditional providers—or a commercial plan. In Los Angeles
County, the local initiative actually consists of seven subcontracting plans from which individuals
can choose, including a number that are commercially based. The two-plan model currently oper-
ates in Alameda, Contra Costa, Fresno, Kern, Los Angeles, San Francisco, San Joaquin, Santa
Clara, and Stanislaus counties, and implementation is under way in Riverside, San Bernardino,
and Tulare counties.
Depending on the individual county, enrollment in managed care is mandatory for some or
most of the Medi-Cal population. Enrollment under the COHS model is mandatory for most Medi-
Cal beneficiaries, including the aged, blind, and disabled, but not for those who are dually eligible
for Medicare and Medicaid. Under the GMC and two-plan models, enrollment is mandatory for
certain eligibility groups—recipients of Aid to Families with Dependent Children/Temporary Assis-
tance for Needy Families (AFDC/TANF), the medically needy with no share of cost, and medi-
cally indigent children with no share of cost. In addition to covering individuals who receive cash

7
assistance from the government, Medi-Cal offers health care coverage to individuals and families
who have incomes too high to qualify for welfare, but too low to cover health care costs. Medi-
Cal requires some of these recipients to contribute to their health care by paying a share of the
cost of the services they receive. Share of cost is a term that refers to the amount of health care
expenses a recipient must accumulate each month before Medi-Cal begins to offer assistance.
Once a recipient’s health care expenses reach a predetermined amount, Medi-Cal will pay for any
additional covered expenses for that month.” (Medi-Cal Policy Institute, Share of Cost Fact Sheet,
August 1998). The state uses an enrollment broker, Maximus, to assist with beneficiary outreach,
enrollment, and education in the GMC- and two-plan-model counties. COHSs conduct their own
beneficiary outreach, enrollment, and education activities.
Plans and subcontractors participating in the three primary models of Medi-Cal managed
care are paid a capitated rate in return for providing a prescribed set of services to their Medi-
Cal enrollees. The state exempts, or “carves out,” certain services, including mental health
care and services for children with special needs. In the COHS and GMC models, capitation
rates are based on past Medi-Cal fee-for-service (FFS) expenditures and utilization, with various
other adjustments also made. Capitation rates in the two-plan model depend on federal “section
1915(b)” Medicaid waiver requirements, under which managed care expenditures cannot exceed
those which would have been incurred under FFS. The extensive managed care experience of
Santa Barbara County, which has taken part in the Medi-Cal program for a relatively long period,
is also factored into the development of the two-plan model rates, as are many of the same adjust-
ments made under the COHS and GMC rate-setting process. Because California has been oper-
ating in a managed care environment for some time, the reliance on FFS data in setting rates is
growing increasingly problematic. Soon, the state will need to find a new rate-setting method as
the relevance of FFS declines.
California’s Department of Health Services (DHS) has primary responsibility for the various
Medi-Cal initiatives. DHS sets capitation rates for the two-plan model and selects the commercial
plans in two-plan model counties, develops rate ceilings for the COHS and GMC models, and
monitors health plan quality and performance. The Department of Corporations has a broader
responsibility, including licensing and enforcement of all health plans in the state—not just those
participating in Medi-Cal. Finally, the California Medical Assistance Commission, using ceilings
set by DHS, negotiates capitation rates with the COHSs and commercial plans participating in the
GMC-model counties.

8
Under Medi-Cal managed care, DHS delegates certain administrative and oversight respon-
sibilities to the primary entities with whom it contracts—the COHSs, the commercial plans in the
GMC model, and the local initiatives and commercial plans in the two-plan model. Depending on
how the individual county’s model is structured, additional responsibilities may be delegated to
participating plans. For example, in Los Angeles County, the seven plans subcontracting with the
local initiative and the three with the commercial plan have a set of delegated responsibilities for
which they are allowed to retain a portion of the capitation payment as compensation. This is in
addition to the amounts withheld by the local initiative plan and the commercial plan.
Although California’s Medicaid landscape continues to evolve, a number of factors potentially
threaten the future stability of the Medi-Cal program. One of these is declining enrollment. Since
1994, Medi-Cal enrollment has declined by nearly 7 percent, fueled in large part by the 1996 fed-
eral welfare reform legislation, which eliminated the automatic linkage between cash assistance
(AFDC) and Medicaid. However, when California first implemented the welfare program changes
in January 1998, the state did not separate AFDC and Medicaid as required, since it needed
more time to develop final rules for determining continued eligibility. In the interim, people moving
off the welfare rolls were placed in a temporary aid category (Aid Code 38) until eligibility redeter-
minations could be made. In September 1998, the state issued final eligibility rules, and by the
time of our visit in early 1999, the redetermination process was under way. For some counties,
particularly the larger ones, this process is a massive, time-consuming effort; consequently, the
exact impact on Medi-Cal enrollment is unknown. Many observers believe, however, that once
the process has been completed, a substantial percentage of the 400,000 people statewide who
are in the temporary aid code category will no longer qualify for Medi-Cal, further reducing enroll-
ment.
Another factor threatening Medi-Cal are low capitation rates. Medi-Cal payment rates in Cali-
fornia have historically been very low—and under managed care they are even lower. A 1998
survey of state Medicaid programs found that California’s Medicaid capitation rates were 52 per-
cent less than the national average and ranked lowest among the 36 states (including the District
of Columbia) analyzed. Many observers believe that the Medi-Cal program is severely under-
funded and that unless there is an infusion of funds, the entire system may destabilize.

9
Finally, the administrative layering characteristic of California’s Medi-Cal managed care models
not only creates complexity, but comes at a price. With each additional layer, a portion of the
capitation payment is directed toward overhead costs. Consequently, the amount passed along
for beneficiary care is substantially reduced. Beyond the monetary considerations, such layering
also increases the complexity of the managed care model, making it more difficult for all partici-
pants—beneficiaries, plans and providers—to negotiate the system.
Los Angeles County
When we visited Los Angeles in 1994, Medicaid managed care enrollment—which was then
voluntary—totaled 374,000 beneficiaries. With implementation of the two-plan model in January
1998, enrollment became mandatory for certain eligibility groups, including the AFDC/TANF
population. By the time of our visit in February 1999, just under 1 million Medi-Cal beneficiaries
were enrolled in the two-plan model.
Implementation of the two-plan model in Los Angeles was problematic from the beginning.
The Health Care Financing Administration delayed implementation several times because of its
concern that the state had not made adequate preparations for mandatory enrollment. These
delays proved costly: many plans and providers shifted activities away from implementation,
addressing instead the financial problems created when start-up was delayed and enrollment
did not increase as expected. For many traditional providers, the lack of preparation has been
particularly damaging.
Both the public and the private sides of the model had development issues. On the public side,
there was concern that the county-owned and -operated health maintenance organization (HMO)
was too small and inexperienced to handle the massive increase in volume that would result from
mandatory enrollment. In response, the county board of supervisors authorized the creation of
the local initiative, L.A. Care. L.A. Care then contracted with seven plan partners—including some
commercial plans—which continue to participate today. On the private side, CIGNA, the largest
Medi-Cal participating plan at the time, withdrew completely from the program when it lost the
commercial contract award to Foundation Health (now Health Net) and its three subcontractors.
Other commercial plans that lost bids arranged to contract with L.A. Care.
Los Angeles County’s two-plan model was developed to balance safety net protection with
expanded access through managed care. The county’s publicly sponsored hospital and health

10
care system—the second largest in the country—underwent a financial crisis in 1995 that resulted
from a $655 million budget deficit. Relief came in the form of a section 1115 waiver of federal
Medicaid requirements, the terms of which entailed a major restructuring of health care services
provided by the county, including an aggressive shift from inpatient and emergency room care to
ambulatory care. L.A. Care is providing assistance to the county in meeting this objective by way
of a guarantee of enrollees. L.A. Care contractually guarantees a minimum of 100,000 enrollees
for the county-owned health plan as well as an additional 65,000 enrollees to be served by other
health plans working through the county health system.
Orange County
When we visited Orange County in 1994, enrollment in Medi-Cal managed care was volun-
tary. At the time, 40,000 beneficiaries were enrolled in risk-based plans. In October 1995, the
county implemented the COHS model, with mandatory enrollment for most Medicaid beneficiaries,
including the aged, blind, and disabled populations. CalOPTIMA was created to implement and
manage the COHS model in Orange County. Although it does not have an HMO license—which
in California is regulated under Knox-Keene law—CalOPTIMA does have an application pending.
At the time of our visit in February 1999, just under 200,000 beneficiaries were enrolled.
Unlike other COHS models in the state that contract with individual health care providers,
Orange County opted to build on the county’s existing managed care infrastructure. CalOPTIMA
contracts with both Knox-Keene-licensed HMOs and physician-hospital consortia (PHCs) to pro-
vide care delivery. PHCs, a unique feature of the CalOPTIMA model, are provider-sponsored
organizations and provide a mechanism for CalOPTIMA to contract directly with physician groups
and hospitals without a health plan intermediary. When we visited in February 1999, 17 HMOs
and PHCs were participating in Medi-Cal through the CalOPTIMA model, but a reduction to
around 12 was imminent.
KEY FINDINGS
Findings on California in General
1. The California Medicaid context is complex.
California has the largest Medicaid program in the nation, with nearly 5 million beneficiaries.
Other features, too, make the state unique. First, the state is very diverse—culturally, ethnically,
11
and economically. By the year 2025, an estimated 66 percent of California’s population will belong
to a minority group. Second, individual markets vary in their managed care readiness across the
state and also across payer lines. Managed care is more developed in urban than rural areas of
the state. In the commercial market, managed care has been a force for some time. Southern
California is also the largest Medicare managed care market in the country. However, in the Med-
icaid market, managed care is a new phenomenon for many traditional providers. Third, California
has implemented Medicaid managed care on a county-specific basis. Statewide, there are at
least three models, each of which has been rolled out in various counties at different times and
with individual refinements. As a result, each county has a unique program.
2. California’s managed care market for low-income populations is changing as Medi-Cal
enrollment decreases and the number of uninsured increases.
Since 1994, California’s Medicaid enrollment has decreased by nearly 7 percent, which largely
reflects a 29 percent decline in the number of AFDC/TANF recipients during the same period.
Immigration fears further contribute to declining welfare rolls. In addition, there are concerns that
yet a further decline in enrollment will result from the Medi-Cal eligibility redetermination process
currently under way for the nearly 400,000 people who have recently been removed from the
welfare rolls.
At the same time, the number of uninsured Californians grows at an approximate rate of
50,000 per month; more than 7 million nonelderly persons are without health insurance cover-
age. The state’s Children’s Health Insurance Program, known as Healthy Families, has helped to
reduce the number of uninsured children, but many people consider the 76,000 children enrolled
as of February 1999 (129,000 as of June 1999) to be too few. Advocates and others have blamed
low enrollment on a cumbersome application and enrollment process, poorly targeted outreach
efforts, immigration concerns, cultural issues, and dislike of government programs.
3. While the use of multiple Medicaid managed care models has allowed California to tailor
initiatives to local circumstances, the approach has also added to administrative load
and created the potential for disruption in service and confusion for beneficiaries.
The two-plan model, which at the time of our visit was operational, or in the process of becom-
ing operational, in 11 counties, serves 72 percent of the state’s Medi-Cal managed care enroll-
ees. Los Angeles County’s two-plan model alone accounts for 41 percent of the state’s Medi-Cal
managed care enrollees. Six counties, encompassing 14 percent of enrollees, are served by the
COHS model; two counties, representing 13 percent of enrollees, use the GMC model.
12
Operating several Medicaid managed care models presents both opportunities and chal-
lenges. One key advantage is that models can be developed in ways that reflect local nuances
in the health care market. With their enhanced flexibility, county-specific designs allow for a more
individualized response to changing market conditions. But California’s approach also presents
challenges: mostly, the operation of multiple models requires more resources not only for develop-
ment and implementation, but also management and oversight. Demand for resources affects
states and localities as well as health plans that operate in more than one county because the
requirements for participation depend on a given county’s model. The state’s use of multiple
models may be problematic for beneficiaries, too, especially those who are moving from one
county to another. Services may be initially disrupted because of the lag in updating beneficiary
records to reflect the change in residence. In addition, the new county’s particular eligibility
requirements and program features may create confusion for beneficiaries.
4. Low Medicaid capitation rates, coupled with extensive program requirements, leads
many stakeholders to perceive Medi-Cal to be severely underfunded, thus threatening
the program’s stability.
Historically, California’s Medicaid payment rates have been very low. Under managed care,
they are even lower; in fact, the state has the lowest Medicaid capitation rates in the country.
Plans, providers, and other market observers universally view the Medi-Cal program as under-
funded. Furthermore, many plans and providers consider Medi-Cal program requirements to be
excessively burdensome. Intended, in part, as a safeguard against the type of problems that
occurred in the early 1970s during the California’s initial forays into Medicaid managed care, these
extensive requirements are significantly more demanding than commercial market requirements.
Many people believe that the low capitation rates and excessive demands may push plans and
providers to leave the Medi-Cal program, which could destabilize the entire system.
Aside from the rates themselves, there is an impending issue with the rate-setting process.
Historically, the California has primarily used Medi-Cal FFS expenditure and utilization experi-
ence to set capitation rates. The state, however, is quickly exhausting this FFS experience as the
program rapidly converts to managed care. State officials say that very soon they will have to use
a method other than FFS experience to set the rates.

13
5. Advocates in particular are concerned that the state’s monitoring and oversight activi-
ties of health plans participating in Medi-Cal managed care are weak.
Although several state agencies are involved in health plan monitoring and oversight, DHS
has primary responsibility for Medi-Cal program participants. Concerned that no agency—includ-
ing DHS—is adequately monitoring the quality of care rendered by Medi-Cal participating plans,
advocates have succeeded in persuading the state auditor to examine DHS’s effectiveness in
monitoring health plan quality in 1999. The issue of health plan quality, however, is more complex
than is outwardly apparent: some believe that health plan performance is partially a reflection of
low payment rates and burdensome program requirements. DHS officials say they are struggling
with how best to carry out their monitoring functions, desiring a more collaborative relationship
with health plans rather than one that is sanctions-based. Officials also acknowledge that the
state’s dual role as purchaser and regulator of Medi-Cal managed care services sometimes cre-
ates conflicts. Among the state legislature’s health care priorities is to determine how to improve
health plan monitoring and oversight, particularly in the area of quality of care.
6. Data and data collection systems are weak and underdeveloped.
Various data reporting requirements exist for Medi-Cal plans and providers, but compliance is
often problematic. The difficulty stems not only from data collection, but from how the state pro-
cesses and analyzes the information. An example is the requirement that plans submit encoun-
ter data. Physicians do not understand why, under a capitated system, they have to complete
encounter forms if this process is no longer linked to payment. Physicians also complain that
they do not receive adequate compensation for complying with the encounter data requirements,
which they consider both costly and time-consuming. Complicating the issue is the seeming lack
of a standardized format or process for reporting such data.
Problems are also encountered at the state level. Because California did not specify a stan-
dardized system when it developed specifications for encounter data systems, the state is now
struggling to interface with many different systems. Plans have found this frustrating: although
they send data to the state, plans are not sure what is being done with it since they receive no
feedback. Advocates are especially concerned with what they perceive as a lack of data from the
state, particularly with regard to plan performance and quality.

14
Another dimension of the data issue specifically, and requirements more broadly, is that
reporting and other requirements may vary, depending upon the county. Therefore, a plan or
a provider who participates under multiple models may have different requirements for different
counties, which can be extraordinarily frustrating and burdensome.
7. Quasi-government organizations created to participate in Medi-Cal managed care are
seen as different from commercial plans participating in the program.
Based on the interviews we conducted, our perception is that stakeholders hold quasi-govern-
ment organizations, such as L.A. Care and CalOPTIMA, to a higher standard of operation than
commercial plans participating in Medi-Cal managed care. This view may reflect the fact that
these organizations were created by county governments to oversee the health care interests
of the vulnerable populations served by the Medi-Cal program. Both L.A. Care and CalOPTIMA
operate in a very open and public forum, and many observers say that they expect this extra scru-
tiny. Commercial plans like Health Net are much less visible, but there appears to be little expecta-
tion that these plans’ (i.e. Health Net) Medicaid business should operate in a public forum.
Findings on Los Angeles County and the Two-Plan Model
1. The two-plan model is extremely complex, at least in Los Angeles County.
The structure of Los Angeles County’s two-plan model varies substantially from the two-plan
model first envisioned by the state. The original design, which is used in other counties operating
under the model, provides for a comparatively simple structure consisting of two plans—a local
initiative and a commercial plan—with protections built in for traditional providers. In contrast, Los
Angeles County’s two-plan model is much more complex, as evidenced by the multiple players
and administrative layers as well as the contracted protection of the county’s publicly sponsored
health care system.
In fact, many observers comment that the two-plan model is a misnomer because in addition
to L.A. Care and Health Net, 10 other plans participate through subcontracting—all of whom
bear risk. Adding to the model’s complexity is the fact that health care in the county, and the
state overall, is largely organized and delivered around medical groups and independent practice
associations (IPAs). The physician organizations participating in Medi-Cal are largely capitated,
and many participate on both sides of the model and in several plans on each side. Hospitals
also tend to have multiple participation arrangements. This layering makes enrollment confusing,
because it entails sorting out the relationships among the many plans, providers, and hospitals.
Furthermore, multiple layers of oversight add to the burden on plans and providers, owing to the
extensive delegation of administrative responsibilities within the model.

15
A key question, then, is whether this complexity adds value, especially considering that fewer
resources are available for delivering health services. The two-plan model has been operational
for little more than a year, and its value as yet is unproven. Many observers say that it is too soon
to tell how the two-plan model will evolve and what its impact will be. Most agree, however, that
the model’s complexity adds to uncertainty about its future.
2. The enrollment process in Los Angeles is complicated for beneficiaries, requiring them
to make multiple choices.
To enroll in Los Angeles County’s Medi-Cal managed care initiative, beneficiaries must first
complete an enrollment form, which Maximus, the state’s enrollment broker, sends when it is noti-
fied about a beneficiary’s eligibility. Beneficiaries must make three decisions in completing the
form: they must decide between L.A. Care and Health Net; they must select a primary care physi-
cian; and they must choose a subcontracting health plan. The process is viewed as complicated
and burdensome. Beneficiaries often choose a physician, but not a plan; beneficiaries who do
not select a plan are assigned to one in which their physician participates. Beneficiaries may not
be aware of the plan to which they are assigned, and some assignments may be inconsistent
with their preferences. Because physicians often participate in more than one network, some
subcontracting plans also express concern that they are not enrolling all the members to which
they feel they are entitled.
3. Los Angeles County’s default assignment rate has been high and, by design, favors
certain plans and providers.
Beneficiaries who fail to complete the enrollment form or make a selection are given a default
assignment. When the two-plan model first became operational in Los Angeles, the default
assignment rate was more than 40 percent—a source of concern among advocates and others.
The default rate has since declined, most recently to less than 20 percent. However, some main-
tain that the rate is still too high.
As designed, the default assignment mechanism in the Los Angeles model favors traditional
providers. Assigning a primary care provider requires up to four steps: 1) the state splits the
default assignment between L.A. Care and Health Net; 2) L.A. Care and Health Net assign ben-
eficiaries to their subcontracting plans; 3) the subcontracting plans assign beneficiaries either
directly to a primary care provider or to an IPA or medical group; and 4) the provider or group
assigns beneficiaries to a primary care provider.
16
Originally, L.A. Care was to receive 60 percent of the default assignment and Health Net
the remaining 40 percent. In actuality, L.A. Care has received the majority of default assignment
because regulations require all such enrollment be assigned to the local initiative until it reaches a
pre-determined minimum enrollment level. In turn, the county-owned HMO has been the primary
benefactor of the default assignment process because of L.A. Care’s contractual obligation with
the county that guarantees the HMO a minimum of 100,000 lives plus an additional 65,000 lives
to be served by other health plans working through the county’s publicly sponsored health care
system. More recently, as L.A. Care reached its minimum enrollment level, each side of the model
began receiving a more equal number of assignments aligning with current market shares—L.A.
Care at 60 percent and Health Net at 40 percent.
4. Several dominant plans drive the Medi-Cal managed care market.
For different reasons, three participating plans—the county-owned Community Health Plan
(CHP), Blue Cross, and Health Net—drive the dynamics of the market. CHP’s enrollment rose
more than eight-fold since our visit in 1994, an increase largely attributable to the guarantee of
100,000 lives afforded by L.A. Care through its contract with the county. Because of the guaran-
tee, CHP has received the majority of default assignments. As Medi-Cal enrollment continues to
decline, however, the protection provided to CHP may create controversy as other plans enroll
fewer of those beneficiaries who do not explicitly choose them.
Blue Cross did not participate in Los Angeles County’s Medicaid managed care prior to the
two-plan model, but the plan made a commitment to compete in Medi-Cal when managed care
expanded statewide. By February 1999, Blue Cross had more than 166,000 Medi-Cal enrollees
in Los Angeles, accounting for 17 percent of the market. Market observers note that Blue Cross
is the plan of choice for many Medi-Cal beneficiaries, who perceive they are signing up for a
commercial plan—even though Blue Cross’s Medi-Cal network is separate from its commercial
network. (Blue Cross is also one of the few plans that pay providers on an FFS basis.)
Health Net’s position in Los Angeles County’s Medi-Cal market reflects both its success in
securing the commercial plan contract and its history. With the implementation of the two-plan
model, Health Net and its subcontractors brought a substantial enrollment of nearly 240,000 ben-
eficiaries, a figure that includes the transfer of CIGNA’s enrollment when that plan exited the Medi-
Cal program. Health Net is also a popular choice among Medi-Cal beneficiaries.
17
Other plans participating in the Los Angeles initiative are each differently situated, but all
seem to be looking for ways to position themselves strategically. Some are creating niches, such
as specialty services for their culturally and ethnically diverse enrollment. Others are looking to
expand beyond the Medi-Cal market into Medicare and commercial lines of business. Several
participating plans say they expect eventual consolidation among the plans now subcontracting
under L.A. Care.
5. The transfer of risk and financial responsibilities is complex because of the way the
two-plan model is structured.
Risk is borne by each of the two plans in the model, and they, in turn, transfer it to participat-
ing subcontracting plans and providers. L.A. Care retains 6 percent of the capitation payment it
receives from the state to cover administrative costs. It then passes the remainder on to its plan
partners, who may keep up to 15 percent of the payment to cover their administrative costs and
profit. What is left is then passed on to the network, primarily through intermediate entities such
as IPAs and medical groups. The number of these entities accepting risk is large; L.A. Care has
more than 100 such arrangements. The payment structure for the Health Net side is similar in
that it may retain up to 15 percent of the capitation payment for administrative costs and profit and
pass the rest along to its subcontractors. Some observers express concern that many of the IPAs
and medical groups are struggling to remain financially viable because of low payment rates and
the inability to manage risk properly.
Many participating providers contract with multiple IPAs and medical groups—a situation that
causes confusion, particularly with regard to billing. Billing for emergency room care, for example,
is complicated because it is often not clear to the hospital where to send the bill when the sub-
contracting plan has transferred risk to an IPA or medical group. The physician organization that
is responsible for paying the bill is not indicated on the beneficiary’s Medi-Cal card. We were
told that one hospital had more than $10 million in outstanding accounts receivable because the
hospital did not know whom to bill.
18
6. Most stakeholders agree that Medi-Cal managed care has improved access by making
physicians more accessible.
Most people we interviewed said that access to providers has substantially improved under
Medi-Cal managed care, largely because the numbers of participating physicians, including spe-
cialists, appear to have increased. Many recounted stories of beneficiaries under the FFS system
trying unsuccessfully to locate a provider willing to treat them. Under managed care, the respon-
sibility for locating a provider is borne by the health plan and not the Medi-Cal beneficiary.
Whether Medi-Cal beneficiaries actually have more choice, including more mainstream pro-
viders, is not as clear. Many participating plans use their commercial provider network to serve
their Medi-Cal enrollees, but others have developed exclusive Medi-Cal provider networks. Con-
sequently, some Medi-Cal beneficiaries may have a greater choice of physicians generally, but it
may be limited to those who have always served the Medi-Cal program. It may be, too, that man-
aged care makes the ability to choose more readily apparent.
7. The two-plan model and the challenges Los Angeles County faces in restructuring its
publicly sponsored health care system are increasing the fragility of the safety net.
The two-plan model was developed to build on Los Angeles County’s extensive publicly spon-
sored health care system. The success of the model, however, is limited in part by the challenges
Los Angeles County faces in restructuring its system under a federal 1115 waiver. A key restruc-
turing strategy aims to build ambulatory care capacity through partnership arrangements with the
network of private community clinics that also comprise the safety net. Many of these clinics
have not fared well under managed care; they often enter late and find it difficult to forge network
relationships with health plans participating in the two-plan model. These factors, combined with
decreasing Medi-Cal enrollment and an increasing number of uninsured, appear to be adding to
the fragility of Los Angeles County’s safety net.

19
Findings on Orange County and the COHS Model
1. Although challenges remain, CalOPTIMA’s operations are stabilizing, and the
organization is expanding its scope.
CalOPTIMA has been operational since October 1995. As it matures, the organization is
expanding its scope and looking for future opportunities. In June 1998, CalOPTIMA assumed
responsibility for long-term care, which includes all nursing home care in the county as well as
home health. When we visited in February 1999, it had just received a grant from the California
HealthCare Foundation to explore ways to work more effectively with the dually eligible in man-
aged care. CalOPTIMA has also applied for Knox-Keene licensing, which may open up additional
opportunities, including the development and marketing of products such as Medicare and com-
mercial lines of business. The challenge for CalOPTIMA will be to balance its focus and resources
appropriately between its core Medicaid business and new opportunities.
2. PHCs are an innovative feature of the CalOPTIMA model that comprise a large share
of Orange County’s Medi-Cal market, but they also pose challenges for administration
and oversight.
Physician Hospital Consortia (PHC) arrangements have been very popular among Medi-Cal
beneficiaries, many of whom voluntarily select them. CalOPTIMA representatives say that benefi-
ciaries tend to base their health plan and provider decision not on the health plan but on the hos-
pitals and physicians from whom they directly receive care. PHCs account for almost 71 percent
of CalOPTIMA’s total enrollment, and 40 percent of that is in three PHCs: Fountain Coast Health
Network, Children’s Hospital of Orange County Health Alliance, and University of California at
Irvine (UCI) Medical Center.
Under PHC arrangements, the hospital and physician components have combined negotia-
tions with CalOPTIMA. Separate risk-based contracts, however, are entered into with each party,
as required by California statute. CalOPTIMA determines the capitation payment allocation
between the hospital and physician sides and has the flexibility to shift funds between the two.
But some hospitals believe that the allocation decisions should be made by the PHCs themselves,
not by CalOPTIMA. They perceive that the current process leads to a reallocation of monies
from hospitals to physicians, and they are concerned that not all physician groups are equally
sophisticated in managing risk. The general sentiment is that while some physician groups are
doing well financially under Medi-Cal managed care, others are struggling.
20
3. As CalOPTIMA reduces the number of subcontractors to streamline administration
and oversight, the impact on access to care—while not expected to be problematic
—requires further monitoring.
Over time, CalOPTIMA has moved to encourage consolidation among PHCs as a vehicle
for increasing scale and reducing administrative burden. When the CalOPTIMA model was first
implemented, there were 38 subcontractors, including PHCs and Knox-Keene-licensed HMOs.
At the time of our visit in February 1999, there were 17 subcontractors, including 12 PHCs and 5
licensed HMOs, and CalOPTIMA was planning to reduce the number further to about 12.
The reductions have generally resulted from two factors. First, CalOPTIMA sets minimum
member thresholds for participating subcontractors. Initially, the threshold was set at 2,500 mem-
bers, but more recently it was raised to 5,000 members. The threshold requirements have forced
the consolidation of many of the smaller subcontractors, primarily PHCs. Second, a few HMOs,
such as Pacificare and Blue Shield, terminated their participation with CalOPTIMA as part of
statewide strategies to discontinue their relationship with the Medi-Cal program.
CalOPTIMA does not expect any access problems from reducing the number of subcontrac-
tors. It believes that enough subcontractors will remain and that much of the reduction will be
achieved by consolidation, thus maintaining provider capacity. The reductions, however, do appear
to have led remaining subcontractors to focus on traditional providers. Whether this ultimately
leads to a lesser commitment by mainstream providers initially attracted to the CalOPTIMA model
remains to be seen.
4. CalOPTIMA had some initial problems with managing the needs of its Supplemental
Security Income (SSI) enrollees, but the situation appears to have stabilized.
Under CalOPTIMA, as in other COHS models in the state (but not other managed care
models in Medi-Cal), enrollment is mandatory for SSI beneficiaries, including aged, blind, and
disabled persons. Thirty percent of CalOPTIMA’s enrollees are SSI beneficiaries. During the
first two years of mandatory enrollment, the SSI population proved particularly challenging for
CalOPTIMA. Early on, legal advocates filed a lawsuit in Sacramento County on behalf of several
Orange County Medi-Cal beneficiaries who were developmentally disabled, claiming that the dis-
abled were not getting the same services under managed care as they did under FFS. The litiga-
tion was eventually dropped; CalOPTIMA believes it may have been a test case that arose out of
advocacy groups’ fears of managed care for the disabled.

21
There were also accounts during the first two years of disabled people not being provided
adequate access to necessary care in the CalOPTIMA system. CalOPTIMA claims it has worked
hard to improve access for this population by substantially increasing the number of specialists
in the network relative to the former FFS system. Nevertheless, there are concerns—not limited
to California—about just how well vulnerable groups such as the SSI population will fare under
managed care in the long run. Because CalOPTIMA has only been operational for a little more
than three years, long-term outcomes for SSI beneficiaries are not yet known.
5. Debate is growing in the county as to how best to manage the health care needs of the
medically indigent population.
Under California law, each county is responsible for providing care to its medically indigent
population. In Orange County, uninsured low-income adults, when they are injured or become
ill and require medical care, can qualify for the county’s Medical Services for Indigents (MSI)
program and have their medical services paid for on a proportional FFS basis.
One of the early expectations of CalOPTIMA was that its managed care delivery model would
encompass not only the approximately 200,000 Medi-Cal beneficiaries in Orange County, but
also the county’s identified 20,000 MSI adults. In establishing CalOPTIMA, the county board of
supervisors specified that the program would initially cover Medi-Cal beneficiaries and that at
some later date, the MSI population would be added. This has not yet occurred. CalOPTIMA
and other market observers have concerns over the financial implications of integrating the MSI
population into a managed care environment, as well as whether state Medi-Cal funds can be
used to subsidize the county’s indigent care.
The issue of the medically indigent is a growing concern, especially as the number of unin-
sured residents in the county increases. Although CalOPTIMA acknowledges its commitment to
the MSI population, it is reluctant to take on the responsibility for a population whose utilization
and cost experience is not only unknown, but difficult to project. Others in the county believe that
CalOPTIMA should assume responsibility for the MSI program as originally intended.
The MSI issue has been a point of contention between CalOPTIMA and the county. While
CalOPTIMA is a separate entity from the county, a good working relationship is essential to both
parties. Many people believe that CalOPTIMA and the county are at a critical juncture in their
relationship and that a recent change in leadership in the county’s health care agency provides
an opportunity for the two organizations to build a better and mutually beneficial relationship.

22
6. Medi-Cal managed care is forcing some traditional safety net providers to rethink
their roles.
Unlike Los Angeles County, Orange County does not have a publicly sponsored health care
system. Instead, it relies primarily on UCI Medical Center and Children’s Hospital, both tertiary
care facilities, to fill the void. In addition to these facilities, several other hospitals, as well as
a small system of community clinics, serve a high volume of the county’s poor and uninsured.
But facilities such as UCI Medical Center are moving away from their traditional safety net roles,
saying that they alone can no longer carry the burden and that all providers in the county must
share the responsibility for treating the poor and uninsured. Safety net providers say low Medi-Cal
payment rates and declining disproportionate share hospital funds have forced them to rethink
their roles.
CONCLUSION
California’s experience reflects a diverse approach to Medicaid managed care. More than any
other state, California concurrently operates multiple large-scale Medicaid managed care initia-
tives, each unique to the county that it represents. Los Angeles and Orange counties, California’s
two largest initiatives, are illustrative.
The initiatives in Los Angeles and Orange counties differ from each other, both structurally
and operationally. Structurally, both models have multiple layers, but Los Angeles County’s
appears more complex in terms of the types and numbers of participating plans and the overlaps
among providers. These structural problems largely add to administrative costs, and they also are
often confusing for beneficiaries, plans, providers, and other stakeholders. It remains to be seen
whether these structural issues will diminish over time as programs adapt.
Whether California’s approach to Medi-Cal managed care will prove successful in the long run
is unclear. For most of the initiative, operational experience is generally limited. California’s mul-
tiple, complex efforts in many ways reflect a particularly ambitious strategy of providing all things
to all people. Eventually, California may have to streamline and simplify its approach, and in so
doing make some hard choices about what the state can and cannot do. California’s diversity and
scale make it a particularly valuable setting for building understanding of many of the more chal-
lenging issues faced as states proceed to develop Medicaid managed care. Further monitoring of
the California’s progress and the lessons gained from its experience will be especially valuable.
23
A. INTRODUCTION
California’s Medicaid program, known as Medi-Cal, has nearly 5 million beneficiaries and is
the largest Medicaid program in the nation (HCFA 1998a). The state has included managed care
in its Medicaid program since the 1970s, but until recently it has been limited, particularly after an
early push toward Medicaid managed care proved problematic (Iglehart 1995). Only in the last
several years has California actively expanded its Medi-Cal managed care initiatives and included
a significantly larger group of beneficiaries Department of Health Services (DHS). Now, almost
half of California’s Medi-Cal population is enrolled in some form of managed care, primarily in full
risk-based arrangements (HCFA 1998a).
California’s Medicaid managed care is exceedingly complex. Many factors contribute to the
complexity, but the most prominent are the state’s size, diversity, and variation in managed care
readiness, and its preference for incremental implementation and a multi-model approach. The
state’s two largest Medi-Cal managed care initiatives operate in Los Angeles and Orange coun-
ties. Los Angeles County has just under 1 million Medi-Cal managed care enrollees (DHS 1999a).
No state has a larger Medicaid managed care enrollment, and only eight states have larger total
Medicaid enrollment. Although Orange County’s initiative is one-fifth the size of Los Angeles
County’s, it is still larger than the Medicaid managed care programs in 23 states (HCFA 1998a;
DHS 1999a). Five other counties in California each have more than 100,000 Medi-Cal enrollees
in managed care (DHS 1999a).
The state is culturally and ethnically diverse, with large African American, Latino, Asian, Arme-
nian, and Russian communities (Coye and Alvarez 1999; NHPF 1998). This reflects California’s
history of attracting large numbers of immigrants entering the United States, through both legal
channels and other mechanisms. In addition, the state is economically diverse. Despite its cur-
rently healthy economy, the numbers of people living in poverty in California continue to increase.
Recent estimates are that 7 million nonelderly Californians, or 22 percent of the state’s population,
are without health insurance. Ethnic and racial minorities, especially Latinos, have the highest
rates of uninsurance (Schauffler and Brown 1999).
Managed care readiness seems to vary by both market and product line. For some time,
commercial managed care has been pervasive in California, with particular concentrations in met-
ropolitan areas that have large employer-sponsored insurance programs (Enthoven and Singer
1998; Sparer et al. 1996). California’s Medicare managed care market is extensive; Southern
California is the largest such market in the country (Thompson and Brown 1998). In contrast,
managed care is much less developed in Medi-Cal, although this varies across markets. Many
traditional providers have served the Medi-Cal population exclusively, and as a result they have

24
had limited exposure to managed care. We were told that even in Los Angeles the infrastruc-
tures of many traditional providers were designed for the fee-for-service (FFS) Medicaid busi-
ness. Thus, in the new world of managed care, many traditional providers are novices despite the
perception that California is the “Mecca” of managed care.
Counties individually play an important role in Medi-Cal managed care. In contrast, most other
states have only one, state-run managed care initiative. California has carried out its Medi-Cal
managed care expansion using an incremental, county-by-county approach. Each of the coun-
ties where Medi-Cal managed care exists has a somewhat different initiative. This results in a
range of experience levels overlaid with vastly varied operating structures by county. Most coun-
ties’ Medi-Cal managed care initiatives are developed around one of three models established
by the state. These include the county-organized health system (COHS), geographic managed
care (GMC), and the two-plan models (Zuckerman et al. 1998; Medi-Cal Policy Institute 1998a;
DHS 1998a; Medi-Cal Community Assistance Project 1997). The specific operational features of
each of these models are described in more detail later. These features of California managed
care and the way they translate into intra-state diversity are important to consider in studying the
state’s experience and in explaining our decision to focus on two markets within the state rather
than the whole state, as in other case studies.
This update and report is based largely on a week-long site visit to California, specifically
to Los Angeles and Orange counties, in late February 1999. We interviewed a wide range of
relevant stakeholders, including advocates, plans, providers, and other market observers. For
this report, we also draw on document review and on our earlier work on Medi-Cal managed
care, which involved a week-long visit to California in late 1994. We included both Los Angeles
and Orange counties in that visit, and also Sacramento County, which at the time was the only
new urban county with a year’s operational experience in Medicaid managed care. Los Angeles
County uses the two-plan model, Orange County uses the COHS model, and Sacramento uses
the third major state model, GMC (Sparer et al. 1996). State contacts were interviewed on both
occasions, in 1994 in person and in 1999 by telephone.
Because GMC in Sacramento County has not changed much, we focused on updating Los
Angeles and Orange counties in our return visit. Los Angeles and Orange counties have the
two largest initiatives in the state; together they account for nearly 50 percent of the state’s total
Medi-Cal managed care enrollment (DHS 1999a). While geographically proximate, these coun-
ties illustrate divergent approaches and contexts. The two-plan model in Los Angeles County
highlights the challenges a county faces when it incorporates safety net providers in a managed

25
care environment. The COHS model in Orange County is particularly instructive about the feasi-
bility of delegating responsibilities such as managed care contracting and oversight to the local
level. Table 1 provides key characteristics of Los Angeles and Orange counties.
B. OVERVIEW OF CALIFORNIA’S DIVERSE MEDICAID MANAGED CARE STRUCTURES
AND INITIATIVES
California’s Medi-Cal program has been operational for more than 20 years, since the early
1970s. The state was one of the first to experiment with managed care for its Medicaid popula-
tion (DHS 1998a). These early efforts gained national attention when the rapid push to managed
care led to unethical marketing practices by some health plans, coupled with poorly designed or,
in a few cases, nonexistent delivery systems (Iglehart 1995). As a result, federal prohibitions on
mandatory managed care models were put in place that were not loosened until the early 1980s
under President Reagan. California’s efforts were scaled back, and, until very recently, the Medi-
Cal program operated predominantly as an FFS system, although a voluntary health maintenance
organization (HMO) option was available (DHS 1998a).
TABLE 1
LOS ANGELES AND ORANGE COUNTIES’ KEY CHARACTERISTICS
Feature Los Angeles County Orange County
Demographics:
Populationa (July 1998 Estimate) 9,213,533 2,721,701
Medi-Cal Managed Care Initiative:
Modelb Two-Plan COHS
Date Implementedb January 1998 October 1995
Mandatory Eligibility Groupsb Mandatory-AFDC/TANF Mandatory-Most
Enrollment (February 1999)b 979,519 197,167
Other Characteristics:
Publicly Sponsored Health Care System Yes No
Advocacy Community Large and Organized Small and Less Organized
Sources: aU. S. Bureau of the Census 1998
bDHS 1999a

26
While California continues to operate both FFS and managed care programs, the emphasis
since our visit in 1994 has clearly been on moving beneficiaries into managed care. This reflects
the goal the state set in 1993 to enroll 2.8 million beneficiaries, or 50 percent of the Medi-Cal
population, in managed care by the end of 1996. In pursuing managed care for its Medicaid
beneficiaries, the state wanted to improve access and to create a long-term cost-containment
strategy (Sparer et al. 1996). Mandatory enrollment in Medi-Cal managed care for at least the
Aid to Families with Dependent Children/Temporary Assistance for Needy Families (AFDC/TANF)
population is now in place in 26 of California’s 58 counties (DHS 1999a; Medi-Cal Policy Institute
1998a). Forty-six percent of the state’s total Medicaid population is enrolled in managed care
(HCFA 1998a).
The California study is one of a number of state case studies that Mathematica Policy
Research, Inc., is conducting under grants from The Henry J. Kaiser Family Foundation and The
Commonwealth Fund. Other states being studied are Florida, Maryland, Minnesota, Oregon, Ten-
nessee, and Texas, each of which is restructuring its health care system for Medicaid and other
uninsured populations. By focusing on how the movement to managed care is affecting low-
income populations and their access to health care services, these analyses will be useful to other
states and other efforts to shape the rapidly evolving development of managed care systems and
health reforms for these populations.
In this section, we examine the different Medi-Cal managed care models that California uses.
We then review important structural changes in the Medi-Cal program since our visit in 1994.
Finally, we address concurrent contextual changes that have the potential to significantly affect
the Medi-Cal program. Those already familiar with California’s Medicaid managed care program
may want to skip to the next section.

27
1. Review of Medi-Cal’s Basic Structure
Within the framework of three basic managed care models—COHS, GMC, and the two-plan
model—counties in California have the flexibility to design individualized Medi-Cal initiatives (DHS
1998a; DHS 1999a; Medi-Cal Policy Institute 1998a; McCall et al. 1998). When we visited Cali-
fornia in 1994, the Medi-Cal program was predominantly FFS and was centrally administered
by the state. The managed care infrastructure in most urban counties involved voluntary enroll-
ment in full or partially capitated managed care through prepaid health plans (PHPs)1 and primary
care case management (PCCM). Although five COHSs were authorized in 1994, only three were
operational at the time (Santa Barbara, San Mateo, and Solano counties). Statewide, 84 percent
of Medi-Cal beneficiaries were in FFS, 11 percent in PHPs, 3 percent in PCCMs, and 2 percent
in COHSs (Sparer et al. 1996).
a. Managed Care Models
COHS Model. In 1994, three COHSs were operational, and the model was just starting up
in Orange and Santa Cruz counties (Sparer et al. 1996). In 1999, these COHSs continue to
operate. In addition, the Solano County COHS expanded to Napa County in 1998 (DHS 1999a).
Under the COHS model, a county board of supervisors authorizes the creation of a health insur-
ing organization (HIO) to contract with the state’s Medi-Cal program on a capitated basis. As
HIOs, the COHSs are responsible for managing and paying for services provided by a network of
contracted providers (DHS 1998a; Medi-Cal Policy Institute 1998a).
Federal legislation passed in 1991 imposes certain restrictions on the operation of COHSs in
California. The legislation limits the number to no more than the five that are currently operating
in the state (DHS 1998a; Medi-Cal Policy Institute 1998a; Sparer et al. 1996). In our discussions
with state officials, we learned that the legislation also limits enrollment in COHSs to no more
than 10 percent of the state’s population. Although there can be no increase in the number of
COHSs without congressional approval, their operations can expand into other counties as long
as the 10 percent maximum population limit is not exceeded. Federal waiver approval is required
for expansion activities. Pending federal approval, Santa Cruz County’s COHS is scheduled to
expand into Monterey County in late 1999.
Many people we spoke with discussed the growing interest in some counties that currently
operate under other Medi-Cal managed care models to move to a COHS model. San Francisco
County, we were told, is especially interested in changing to this model. In 1998, federal legislation
was introduced, with the support of numerous counties, that would have allowed for an expansion
in the number of COHSs. While the legislation was defeated, many think that this issue is still

28
very active because counties want more control over their Medi-Cal programs, and, specifically,
more control over where beneficiaries are being referred for services. This is particularly true for
those counties that own and operate their own health care systems. The belief is that a COHS
model allows counties to improve program oversight as well as protect county-operated facilities
from competition. One knowledgeable managed care staffer said the COHS model is becoming
even more attractive to counties as competition increases for Medi-Cal beneficiaries in a time of
overall declining Medicaid enrollment.
GMC Model. In early 1994, about a year before our first visit to California, the state
implemented the GMC model in Sacramento County (Sparer et al. 1996). In 1998, the model
was implemented in San Diego County, following an earlier unsuccessful attempt by the county to
develop a Medi-Cal managed care program (DHS 1999a; Medi-Cal Policy Institute 1998a; Sparer
et al. 1996). The program as initially proposed would have required Medi-Cal beneficiaries to
choose from a menu of HMOs and PCCMs, but there was strong opposition because the plan
covered a broad population, including the elderly (Sparer et al. 1996).
Under the GMC model, the state enters into capitated contracts with multiple commercial
health plans within a designated geographic area. The state currently contracts with six plans in
Sacramento County and seven in San Diego County (DHS 1999a). A federal 1915(b) waiver is
required before a county can implement the GMC model (DHS 1998a; Medi-Cal Policy Institute
1998a).
Two-Plan Model. In 1993, as part of the overall strategic plan to expand the number of bene-
eficiaries in MediCal managed care, California developed the two-plan model, which was to be
implemented in 13 counties. When we visited the state in 1994, planning for the 1996 implementa-
tion of the two-plan model had just started (Sparer et al. 1996). Today, the two-plan model is fully
operational in nine counties: Alameda, Contra Costa, Fresno, Kern, Los Angeles, San Francisco,
San Joaquin, Santa Clara, and Stanislaus. As currently envisioned, 12 counties will eventually
operate under the model, which is authorized under a Section 1915(b) federal Medicaid waiver
(DHS 1998a; DHS 1999a; Medi-Cal Policy Institute 1998a; McCall et al. 1998; Medi-Cal Com-
munity Assistance Project 1997). San Diego County was also selected for the two-plan model,
but it was subsequently chosen for the GMC model instead (DHS 1998a). In Riverside and San
Bernardino counties, implementation of the two-plan model is in progress, and in Tulare County,
the process is just beginning (DHS 1999a).

29
Counties were selected to implement the two-plan model based on two criteria. First, the
county had to have a sufficiently large Medicaid population to support the model. Second, the
local managed care market had to be both receptive and developmentally able to undertake the
initiative (Medi-Cal Policy Institute 1998a). As the name implies, two-plan model counties must
offer Medi-Cal beneficiaries the choice of two managed care plans (DHS 1998a; Medi-Cal Policy
Institute 1998a; McCall et al. 1998; Medi-Cal Community Assistance Project 1997; Sparer et al.
1996). One of the plans is a local initiative, and the other is a commercial HMO (DHS 1998a). The
local initiative is operated by either the county government or a community-based entity and is
required to contract with traditional providers such as federally qualified health centers (FQHCs)
and disproportionate share hospitals (DSHs) (McCall et al. 1998; Zuckerman et al. 1998; Sparer
et al. 1996). This requirement is to protect the safety net as these traditional providers make
the transition to managed care, an area in which many have little experience. In contrast, the
commercial plan is private and is selected by the state on a competitive bid basis (McCall et
al. 1998). It is often referred to as the mainstream plan. Fresno County, an exception, offers
beneficiaries the choice of two commercial plans.1 The state selected a second commercial plan
because the county chose not to establish a local initiative (DHS 1999a; DHS 1998a). Table 2 lists
the commercial plan for each of the two-plan counties. Blue Cross of California and Health Net
(Foundation Health Plan) are the most prevalent commercial plans in the two-plan model.
Other Models. In addition to the three predominant models discussed, other types of Medi-
Cal managed care program are operated in six counties. El Dorado and Madera counties have
PCCMs in place. Placer and Sonoma counties operate fee-for-service/managed care networks
(FFS/MCNs). Marin County contracts with a PHP. Yolo County operates a mixed model encom-
passing both PCCM and PHP plans (DHS 1999a).
While the multiple models in California create significant complexity, there are distinct advan-
tages and disadvantages to the approach. The advantages are (1) an array of county programs
that fit the uniqueness of the local market and (2) the potential to respond faster to changing
market conditions because of localized operations. In addition, several county stakeholders com-
mented that they like the localness of the Medi-Cal initiatives because decisions are not being
made in some far-off place where the county’s specific circumstances are not considered. But a
county focus also has disadvantages. In California, no two Medi-Cal managed care initiatives are
1 Even though there are two commercial plans in Fresno County, one is required to serve as the local initiative, with all of the requirements that entails.

30
exactly alike, and many are quite different from one another. Consequently, state administration
and oversight is more complicated and demanding, and there is also some inevitable duplication
of functions at the state and county levels as well as across counties. In addition, experiences
differ widely from one county to another, so counties learn less from each other than might have
otherwise been the case. Health plans and providers participating in multiple counties said that
the different structures increase the burden of participation because there are varying require-
ments, depending upon the initiative. We were also told that for beneficiaries, a change in resi-
dence from one county to another may create a disruption in services because it may take a
month or more for records to be updated. A change from one county to another may also be con-
fusing for beneficiaries because, for example, different counties require different eligibility groups
to enroll in managed care.
b. Eligibility and Enrollment
In March 1998, the state implemented a Medi-Cal expansion for children only as part of its
Children’s Health Insurance Program (CHIP) plan. The expansion includes a resource disregard
and increases eligibility to all children under age 19 with family incomes at or below 100 percent of
TABLE 2
TWO-PLAN MODEL COUNTIES’ COMMERCIAL PLANS
County Commercial Plan
Alameda County Blue Cross of California
Contra Costa Blue Cross of California
County Fresno County (2 Commercial Plans) Blue Cross of California
Health Net (Foundation Health Plan)
Kern County Blue Cross of California
Los Angeles County Health Net (Foundation Health Plan)
Riverside/San Bernardino Counties Molina Medical Centers
San Francisco County Blue Cross of California
San Joaquin County Omni Healthcare
Santa Clara County Blue Cross of California
Stanislaus County Omni Healthcare
Tulare County Health Net (Foundation Health Plan)
Source: DHS 1999a
31
the federal poverty level (FPL) (HCFA 1998b; Medi-Cal Policy Institute 1998d). Before the expan-
sion, family assets were considered in determining eligibility for children. In addition, children
ages 14 to 19 were covered only up to 84 percent of the FPL (Medi-Cal Policy Institute 1998d).
Other than CHIP, there have been no other Medi-Cal eligibility expansions since 1994.
While the state’s DHS establishes Medi-Cal eligibility criteria, its Department of Social Ser-
vices determines eligibility through the county welfare departments. The state uses four criteria:
eligibility category, income, resources, and state residency. Applicants who fall into one of the
designated eligibility categories but whose family income or resources exceed the Medi-Cal limit
may qualify for coverage by spending down their resources to the required levels. U.S. citizenship
is not a requirement for eligibility, but immigration status determines whether full or emergency
benefits are available (KFF 1998; Medi-Cal Policy Institute 1998a). Generally, only emergency
benefits are available to undocumented immigrants (Western Center on Law and Poverty 1999).
The state requires a quarterly redetermination of continued Medi-Cal eligibility (KFF 1998).
Medi-Cal eligibility criteria vary for children, based on age and family income. For infants,
eligibility is set at 200 percent of the FPL. For children ages 1 through 5, the family income limit is
133 percent of the FPL. From ages 6 to 19, the limit is 100 percent of the FPL.2 While Medi-Cal
coverage is generally provided to the beneficiary at no cost, certain people who fall into eligible
categories but whose incomes are too high may be required to share in the cost of coverage.
The share-of-cost requirement most often applies to people in the Medically Needy and Medically
Indigent eligibility categories (KFF 1998; Medi-Cal Policy Institute 1998b).
The state contracts with an enrollment broker, Maximus, to assist with beneficiary outreach,
education, and enrollment activities for managed care in the GMC and two-plan counties.3 In
contrast, the COHS model counties handle their own beneficiary activities. Depending upon the
county, enrollment in managed care may be mandatory for certain Medi-Cal eligibility groups
(Medi-Cal Policy Institute 1998a). Enrollment in the COHS model is mandatory for most Medi-
Cal beneficiaries, including the aged, blind, and disabled, but not those who are dually eligible for
2 After our visit in February 1999, the state legislature passed several bills expanding coverage of the Medi-Cal program. Among the provisions, the family income eligibility threshold, then at 75 percent, was increased to 100 percent of the and the resource test was dropped. The governor was expected to sign the bills at the end of July 1999.
3 Before Maximus, the state used a different enrollment broker, Benova. The state terminated its contract with Benova at the end of 1996, primarily because of poor performance (Kertesz and Shinkman 1997).

32
both Medicaid and Medicare. In contrast, enrollment in both the GMC and two-plan models is
mandatory for certain eligibility groups, including AFDC/TANF, medically needy with no share of
cost, and medically indigent children with no share of cost. For other groups such as the aged,
blind, and disabled, enrollment is voluntary (DHS 1998a; Medi-Cal Policy Institute 1998a; McCall
et al. 1998; Medi-Cal Community Assistance Project 1997).
c. Benefit Package and Rate-Setting
Fully capitated plans participating in Medi-Cal managed care are required to offer a compre-
hensive set of benefits to their Medi-Cal enrollees. Under these arrangements, the capitation
rate encompasses various services, including physician care, hospital (inpatient and outpatient)
care, substance abuse treatment, family planning, enhanced support for pregnant women and
at-risk infants and children, long-term care for the first two consecutive months, and transporta-
tion. Although they are not included in the capitation rate, participating plans must also offer case
management and translation services (Ben-Avi et al. 1997). DSH payments for those hospitals
serving a disproportionate number of Medi-Cal beneficiaries are not included in the capitation
rates (Zuckerman et al. 1998).
Under Medicaid managed care, the state carves out mental health benefits. The system is
financed like a block grant; the counties receive an allocation from the state to provide mental
health services. The allocation is not premised on a capitation methodology, and the state has
made no decision as to if or when capitation will be used (Zuckerman et al. 1998). The Depart-
ment of Mental Health oversees all mental health services in the state, which are separate from
other health care services provided through the Medi-Cal program (Ben-Avi et al. 1997). For
mental health services, the state delegates to the individual counties the responsibility for deter-
mining how the services will be provided in their locales (Zuckerman et al. 1998). Some counties
provide the services themselves. Others contract with behavioral health organizations (BHOs).
Still others use a combined approach, and both the county and BHOs provide services.
Services specific to children with special health care needs also are carved out of Medicaid
managed care and continue to operate as before through the California Children Services (CCS)
program (Ben-Avi et al. 1997). CCS program responsibility is limited to the services related to the
eligible condition. The responsibility for other, non-condition-related services remains with Medi-
Cal (for those so covered), and health plans are expected to provide these services when chil-
dren are enrolled, as most of them are (Medi-Cal Policy Institute 1998c). Coordinating services
between these two systems under network-based managed care models is problematic at times.
We heard from some providers that the enrollment process in CCS is very cumbersome because

33
of extensive paperwork requirements. In addition, some providers say it is often difficult to dif-
ferentiate between services related to the eligible condition and others. Consequently, providers
perceive they bear an inordinate level of risk if CCS retroactively refuses to pay.
For the COHS and GMC models, historic Medi-Cal FFS expenditure and utilization experience
is used to develop rate ceilings or upper payment limits—UPLs as they are often called. For each
county operating under these models, rates are calculated separately, based on five eligibility
categories (family, aged, disabled, child—non-AFDC/TANF, and adult—non-AFDC/TANF) and six
service types (physician, pharmacy, inpatient, outpatient, long-term care, and other services).
In total, there are 30 eligibility/service type cells, each with a per-member, per-month base
rate. County-specific adjustments are then made to the base rates, premised on (1) age/sex
differences; (2) aid code distribution variations; (3) area-specific expenditure differences; (4)
service exclusions (mental health, long-term care after two months, and ophthalmic lenses); (5)
interest lost by the state because of the timing difference of payments under capitation versus FFS;
(6) cost implications of annual legislative changes; and (7) inflation trends. Further adjustments
are then made for administrative allowances, estimated costs of new Early Periodic Screening,
Diagnosis, and Treatment (EPSDT) services, and estimated collections from third-party payers
for services rendered to Medi-Cal beneficiaries (Ben-Avi et al. 1997).4 The California Medical
Assistance Commission (CMAC) negotiates capitation rates with the COHSs and commercial
plans participating in the GMC model counties, using the UPLs provided by DHS.5,6
The method used to set capitation rates for the two-plan model is different. Two steps are
involved. First, the state calculates a limit on total program expenditures. This calculation is
necessary to ensure compliance with the two-plan model’s 1915(b) waiver requirement that
expenditures under managed care cannot exceed those that would have been incurred under
FFS. Second, the state develops capitation rates for each county. The managed care experience
of Santa Barbara County’s COHS provides the basis for developing these rates. The rationale
behind using Santa Barbara’s data is that the county has operated under managed care for an
extended period, and its data more accurately reflect utilization and costs under a managed care
4 The same capitation rate-setting method is used for PCCM and PHP models.5 The UPL is derived from the FFS experience. According to state officials, the capitation
rate is usually set between 94 percent and 99 percent of the UPL. Actual rates are not publicly available.
6 CMAC’s role is limited to contract negotiations on behalf of DHS, which in addition to capitation rates includes negotiating contracts with hospitals in the state to provide inpatient services for FFS Medi-Cal patients. CMAC has no oversight or enforcement responsibilities.
34
system than does the existing FFS information. In addition to the 30 eligibility/service type cells
and adjustments previously mentioned,7 other adjustments to the two-plan model rates reflect the
requirement that the local initiative must contract with FQHCs as well as DSHs (Ben-Avi et al.
1997). DHS sets the rates for the local initiative and commercial plan in those counties operating
under the two-plan model.
The FFS linkage to the development of capitation rates is becoming increasingly problematic
as more of the program shifts to managed care, state officials say. California has the lowest
capitation rates in the country (Holahan et al. 1999; McCall et al. 1998). In a 1998 survey of
state Medicaid programs, California’s $83 monthly capitation rate was reportedly 52 percent
lower than the national average of $126 and considerably less than half of the highest reported
rate, which was Connecticut’s at $183 (Holahan et al. 1999).8 This is a major concern among
plans, providers, and other observers that we interviewed. They describe the program as grossly
underfunded and say that unless the issue is addressed soon, the entire system may destabilize.
d. State Administration and Oversight
DHS continues to have primary responsibility for the Medi-Cal program. Its role in the various
managed care initiatives includes setting capitation rates,9 selecting the commercial plans in
the two-plan model counties, and monitoring health plan quality and performance. In addition,
the Department of Corporations (DOC) continues to have responsibility for licensing HMOs and
enforcement.10
DOC’s role is broader than Medi-Cal managed care and encompasses all licensed
plans in the state (Sparer et al. 1996).
Among the advocacy community, there is concern that DHS is not effectively carrying out
its oversight responsibilities, particularly with regard to monitoring the quality of care provided
by health plans participating in Medi-Cal managed care. In September 1998, the Community
Health Councils, a Los Angeles-based advocacy group, asked the state auditor to audit DHS
7 Currently, FFS data are used to calculate the adjustments. As experience under managed care continues to grow, however, these data will eventually be used as the basis for the adjustments.
8 California’s rates as reported are based on Los Angeles County’s two-plan model.9 Technically, DHS sets the rates only for the two-plan model counties. For counties operating
under the COHS and GMC models, DHS sets rate ceilings (UPLs), and CMAC negotiates the actual rates based on these ceilings.
10 In California, HMO licensing is administered through the Knox-Keene regulations. An HMO licensed in California is often referred to as having a Knox-Keene license.

35
to assess the agency’s effectiveness in monitoring health plan quality. In our interview, the
group’s executive director expressed concern that DHS is collecting a lot of data on health plan
quality including quality studies, annual audits, and external quality review organization (EQRO)
reports but appears to have done little analysis to determine how things are really working. Other
advocates expressed similar concerns. The audit was approved by the state and was completed
in 1999.11
It targets three counties operating under the two-plan model—Alameda, Los Angeles,
and Stanislaus counties (JLAC 1998). Many advocates expressed hope that the audit would force
the state to clarify responsibility for monitoring the quality of care provided by health plans and to
improve overall accountability. Others outside the advocacy community view the quality issue as
more complicated. A key concern for them is that health plan performance is in part a function
of Medi-Cal policy, which they feel sets rates too low, pays slowly, and audits extensively, each of
which heightens the burden of participating in the program.
State officials acknowledge they are grappling with how best to carry out their monitoring
responsibilities. Officials say they don’t want to be the “strongman,” with sanctions always the
first reaction. Rather, they prefer to work with the health plans to resolve problems. In addition,
coordination among all of the state agencies involved in Medi-Cal managed care regulation
is challenging at times because of the different agendas involved. Officials also acknowledge
conflicts between the state’s dual role of purchaser and regulator of Medi-Cal managed care
services, which they believe results in sometimes incompatible goals.
11 The audit was completed after our visit, and a report was issued in July 1999. The audit report notes deficiencies in DHS’s monitoring efforts, but the limited data examined did not suggest that the two-plan model adversely affects quality of and access to health care. The report does state, however, that DHS has difficulty obtaining the necessary information from health plans to effectively evaluate the overall quality of care being provided. The report also notes that DHS’s health plan monitoring efforts overall have been incomplete and poorly organized. The audit suggests that unless the deficiencies are remedied, there is the potential for quality and access to be affected (California State Auditor 1999).

36
2. Summary of the Most Important Structural Changes, 1994–1999
Since 1994, overall enrollment in Medi-Cal has decreased by nearly 7 percent (Table 3)
(Medi-Cal Policy Institute 1998a). Much of this decline is the result of a reduction in the number
of AFDC/TANF recipients in the state. Since 1994, total AFDC/TANF recipients have declined
by 29 percent in California. The largest reductions have occurred since 1996, the year that
federal welfare reform legislation, known as the Personal Responsibility and Work Opportunity
Reconciliation Act, was passed (DHHS 1999). Concurrently, the numbers of uninsured continue
to grow at an estimated rate of 50,000 per month (Schauffler and Brown 1999).
In 1998, the Henry J. Kaiser Family Foundation (KFF) sponsored focus groups throughout
the state with parents of potentially eligible Medi-Cal children to learn more about enrollment
barriers. Participants cited immigration concerns, language problems, confusion about eligibility,
and the lengthy, invasive, and demeaning application process as barriers to enrolling their children
in Medi-Cal (Perry et al. 1998). Many people we interviewed voiced the same reasons for why
they thought Medi-Cal enrollment was declining while the numbers of uninsured were increasing.
In addition, we heard primarily from advocates that the state’s outreach efforts have been poorly
targeted and have not actively involved key community-based organizations.
TABLE 3
MEDI-CAL ENROLLMENT TRENDS
1994–1998
Year Medi-Cal Enrollment % Annual Change % Cumulative Change
1994 5,390,717
1995 5,421,262 0.6 0.6
1996 5,378,706 -0.8 -0.2
1997 5,146,850 -4.3 -4.5
1998 5,024,400 -2.4 -6.7
Source: Medi-Cal Policy Institute 1998a

37
Although overall enrollment in Medi-Cal has declined since 1994, managed care enrollment is
increasing, and it accounts for a growing share of the total Medicaid population. Table 4 illustrates
the growth trend in Medi-Cal managed care since 1996. By 1998, 2.2 million beneficiaries,
representing approximately 46 percent of the total Medi-Cal population, were enrolled in some
form of managed care. While this enrollment reflects a substantial increase over 23 percent in
1996 and 39 percent in 1997, it remains below the state’s original goal of enrolling 2.8 million
beneficiaries, or 50 percent of the Medi-Cal population, in managed care in 1996 (Sparer et al.
1996). Reaching the numerical goal in absolute enrollment is now more complicated because
enrollment in Medi-Cal is on the decline.
TABLE 4
MEDI-CAL MANAGED CARE ENROLLMENT TRENDS
1996–1998
Number of % Total
Year Managed Care Enrollees Medicaid Enrollment
1996 1,251,791 23.1
1997 1,854,294 38.7
1998 2,246,406 45.8
Sources: HCFA 1996, 1997a, 1998a
Table 5 breaks down beneficiaries enrolled in managed care by county and managed care
model type as of February 1999. As the table shows, the two-plan model counties represent the
majority of the state’s Medi-Cal managed care enrollees, accounting for 72 percent of the total. In
comparison, the COHS model counties have 14 percent and the GMC model counties 13 percent.
The remaining 1 percent of Medi-Cal managed care enrollees are served by the six counties
offering PCCM, FFS/MCN, or PHP programs. While Los Angeles’s large enrollment drives the
disparity, the two-plan model would still be dominant without it.

38
TABLE 5
MEDI-CAL MANAGED CARE ENROLLMENT BY MODEL TYPE,
FEBRUARY 1999
Model and County Enrollment
Two-Plan Model
Alameda County 104,744
Contra Costa County 46,225
Fresno County 122,103
Kern County 79,905
Los Angeles County 979,519
Riverside/San Bernardino Counties 156,873
San Francisco County 36,400
San Joaquin County 68,028
Santa Clara County 68,109
Stanislaus County 43,400
Subtotal Two-Plan Counties 1,705,306
COHS Model
Orange County 197,167
San Mateo County 36,755
Santa Barbara County 34,390
Santa Cruz County 18,617
Solano/Napa Counties 37,900
Subtotal COHS Model Counties 324,829
GMC Model
Sacramento County 154,297
San Diego County 149,578
Subtotal GMC Model Counties 303,875
Subtotal PCCM, FFS/MCN, PHP Model Counties 30,174
Total 2,364,184
Source: DHS 1999a

39
3. Concurrent Contextual Changes
In this section, we examine five changes that will continue to influence Medi-Cal managed
care in California. The changes are the state’s approach to, and the implications of, TANF, CHIP,
immigration, cultural competency, and the political climate in California.
a. Approach to TANF and Implications
The 1996 federal welfare reform legislation eliminated the automatic linkage of AFDC and
Medicaid. As a result, California implemented its TANF program, CalWORKS, in January 1998.
When CalWORKS was implemented, however, the state did not concurrently separate AFDC
and Medi-Cal as the new law required because state officials needed more time to develop final
rules.
It implemented an interim plan instead. The state instructed counties to place all people
moving off the welfare rolls into the state’s designated Medi-Cal Aid Code 38 indefinitely.2 Under
this system, people in Aid Code 38 remain eligible for Medi-Cal coverage, and health plans
continue to receive the related capitation fee. In September 1998, the state issued rules for
redetermining eligibility by the counties, with a targeted completion date of April 1999. The Aid
Code 38 eligibility redetermination is a massive undertaking, affecting nearly 400,000 people
statewide (Medi-Cal Policy Institute 1999).
For Aid Code 38 people deemed ineligible for continued benefits, or for those leaving
CalWORKS as a result of increased earnings, Medi-Cal coverage may be extended for up to 24
months through the Transitional Medi-Cal (TMC) program. Eligibility is based on certain criteria,
including earned income,12
state residency, the previous receipt of aid, and having a child in the
home (Medi-Cal Policy Institute 1998f). Several advocates and providers expressed concern
that TMC may not be working as intended and that only a fraction of eligible people are actually
enrolled. They cite two primary reasons for their concern. First, they think many people leaving
welfare do not understand that they may still be entitled to Medi-Cal benefits. Second, they
believe there may be a stigma attached to having to go to the county welfare office to enroll. Now
that people are working and are no longer receiving assistance, they do not consider themselves
“welfare” cases and they are reluctant to seek public aid.
12 The first six months of TMC are provided to families regardless of income. After that, families remain eligible if their earned income is at or below 185 percent of FPL (Medi-Cal Policy Institute 1998f).

40
Overall, plans and providers were especially concerned with the potential outcome of the Aid
Code 38 redetermination process. They fear that a substantial number of these people will lose
eligibility, be terminated from the Medi-Cal program, and further contribute to the already declining
enrollment in Medi-Cal. Aside from the effect on beneficiaries, health plans are concerned
because it would lessen their enrollment, thus limiting scale-based economies and aggregate
growth potential. Their fears may have merit if San Diego County is representative. San Diego
County recently completed its redetermination process, and a DHS spokesperson said that 40
percent of the Aid Code 38 people who were sent redetermination packets did not respond and
were terminated. Of the 60 percent returning packets, 15 percent to 25 percent were found
ineligible for continued benefits.
While the ultimate impact of welfare reform on Medi-Cal is unknown, it will likely result in
fewer Medi-Cal beneficiaries. Some counties, such as Los Angeles, however, are attempting to
counter the decline through expanded outreach efforts with targeted populations. Spokespersons
for Los Angeles County’s Department of Public Social Services (DPSS) say their current outreach
focus is on enrolling by the end of the year 100,000 children who are eligible for the program but
currently not covered in Medi-Cal. This focus on children is distinctly different from the county’s
past efforts, which were aimed primarily at pregnant women.
Declining Medi-Cal enrollment may also have other repercussions. The situation may force
some consolidation among health plans and providers, particularly those with small or Medi-Cal-
dominated operations. Pressure on the safety net may also increase because an unknown, but
potentially sizable, share of individuals who lose coverage may remain uninsured.
b. Approach to Children’s Health Insurance Program and Implications
California’s CHIP was set up as a combination program to include the Medi-Cal expansion as
well as a stand-alone program. The program was designed so that the stand-alone component
would receive twice the enrollment of the Medi-Cal expansion (HCFA 1998b). The stand-alone
component, the Healthy Families program, began accepting enrollment in July 1998, three months
after HCFA approved the state’s plan (KFF 1998; Medi-Cal Policy Institute 1998a).
41
The Healthy Families program provides low-cost health care coverage for children ages 1 to
5 whose family incomes are between 133 percent and 200 percent of FPL and for children ages
6 to 19 whose family incomes are between 100 percent and 200 percent of FPL (KFF 1998;
Medi-Cal Policy Institute 1998a; HCFA 1998b; Managed Risk Medical Insurance Board [MRMIB]
1998).13
Families participating in the Healthy Families program choose their health plans and
pay premiums of $4 to $9 per child per month, with a maximum payment per family of $27 per
month (KFF 1998; MRMIB 1998). Each county has a designated community provider plan (CPP),
which is the health plan that has contracts with the most safety net providers. There is a $3 per
month premium reduction if the family selects the CPP. In comparison with the Medi-Cal program,
health care coverage under the Healthy Families program is for a narrower set of benefits. Unlike
Medi-Cal’s quarterly redetermination requirement, the Healthy Families program has an annual
eligibility redetermination (MRMIB 1998).
The MRMIB has primary administrative responsibility for the Healthy Families program. DHS
coordinates all outreach and educational activities for the program, which are undertaken jointly
with the Medi-Cal program (HCFA 1998b). The application form and process for Healthy Families
is the same as for pregnant women and children in the Medi-Cal program (Medi-Cal Policy Institute
1998e). The Healthy Families program is a statewide initiative with a centralized administration; the
Medi-Cal program is a county-specific initiative with an increasingly decentralized administration.
While opinions vary on the Healthy Families program’s initial success, there is concern
that it has not reached more of the target population. Initially, the state expected to enroll
approximately 200,000 children in the program during its first year (Medi-Cal Policy Institute
1998e). As of February 1999, 76,000 children were participating in the program.14
Enrollment in
the Healthy Families program since its beginning in July 1998 is shown in Table 6. Children in the
Healthy Families program are enrolled in 26 health plans across the state; the largest enrollment
concentrations are in Los Angeles and Orange counties (MRMIB 1999a, 1999d). Most of the
program’s plans also participate with the Medi-Cal program.
13 After our visit in February 1999, the state legislature passed a bill expanding coverage of the Healthy Families program. Among the provisions of the legislation, the eligibility threshold was increased to 250 percent of FPL.
14 Enrollment in Healthy Families has grown. As of June 1999, just under 129,000 children were enrolled (MRMIB 1999e).
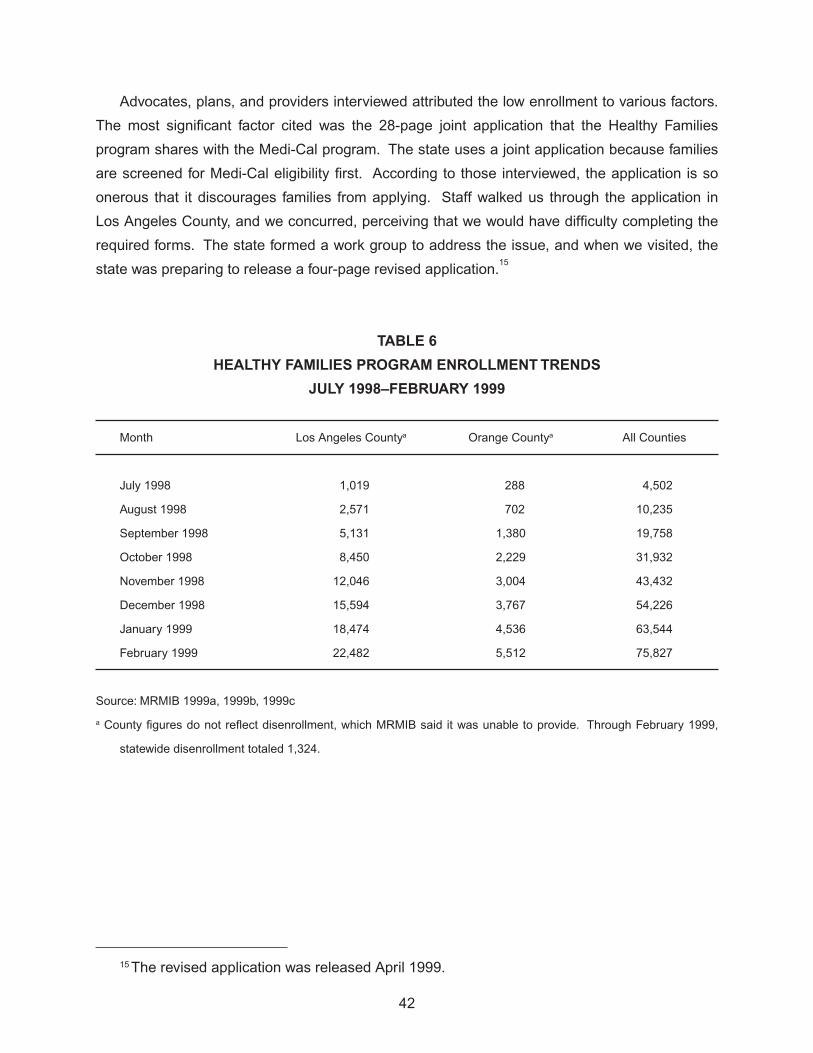
42
Advocates, plans, and providers interviewed attributed the low enrollment to various factors.
The most significant factor cited was the 28-page joint application that the Healthy Families
program shares with the Medi-Cal program. The state uses a joint application because families
are screened for Medi-Cal eligibility first. According to those interviewed, the application is so
onerous that it discourages families from applying. Staff walked us through the application in
Los Angeles County, and we concurred, perceiving that we would have difficulty completing the
required forms. The state formed a work group to address the issue, and when we visited, the
state was preparing to release a four-page revised application.15
TABLE 6
HEALTHY FAMILIES PROGRAM ENROLLMENT TRENDS
JULY 1998–FEBRUARY 1999
Month Los Angeles Countya Orange Countya All Counties
July 1998 1,019 288 4,502
August 1998 2,571 702 10,235
September 1998 5,131 1,380 19,758
October 1998 8,450 2,229 31,932
November 1998 12,046 3,004 43,432
December 1998 15,594 3,767 54,226
January 1999 18,474 4,536 63,544
February 1999 22,482 5,512 75,827
Source: MRMIB 1999a, 1999b, 1999c
a County figures do not reflect disenrollment, which MRMIB said it was unable to provide. Through February 1999,
statewide disenrollment totaled 1,324.
15 The revised application was released April 1999.

43
Aside from the application itself, there appear to be other barriers to enrollment. Many of the
barriers cited in the KFF focus groups were echoed by those we interviewed as they discussed
the Healthy Families program—immigration concerns, cultural factors, confusion about eligibility,
dislike of government programs, and the lengthy application process. There was widespread
sentiment, too, that the state’s outreach efforts have been ineffective, especially with targeted
groups such as Latinos.
c. Approach to Immigration and Implications
Immigration has been and continues to be a major policy issue in California. The core of
the issue centers around “public charge,” which refers to immigrants who have become or will
become dependent on public benefits. People may be denied entry into the United States or
denied permanent residency if the Immigration and Naturalization Service (INS) believes they will
become a public charge (KFF 1998). The state is attempting to get clarification from the INS as to
the public charge issue and how it applies to public programs such as Medi-Cal. When we visited,
the state was still awaiting clarification.16
Advocates told us the immigrant community in California is very fearful of the government. The
KFF focus groups confirmed this fear (Perry et al. 1998). Many immigrants come from countries
where the government persecuted or otherwise mistreated them. Advocates in particular feel
that actions by the state that have specifically targeted immigrants in California have done little to
alleviate the fear. Until very recently, border enforcement targeted immigrants (legal or otherwise)
who had used Medi-Cal benefits in the past. These people were required to pay the state back
for benefits or jeopardize their immigration status, including the right to reenter the United States.
This practice was discontinued within the past year, and there is litigation pending that was filed
on behalf of several people who made repayments (KFF 1998). Many commented, however, that
the impact of these practices continues to be felt. The KFF focus groups found that, particularly
among Latinos, fear of the government discourages many immigrants from seeking any type of
public support, even aid they are legally entitled to (Perry et al. 1998).
16 After our visit, the INS issued clarification, but many observers speculate that distrust and fear of the government in the immigrant community will likely continue to limit enrollment. For further information on the public charge clarification, go to the public affairs page of the INS’s website at http://www.ins.usdoj.gov.

44
d. Approach to Cultural Competency and Implications
The substantial diversity of California’s population creates unique challenges for public
programs such as Medi-Cal. By the year 2025, 66 percent of California’s population are
projected to be members of minority groups (Coye and Alvarez 1999). Considering this diversity,
the assurance of cultural competency is a concern. Coye and Alvarez (1999) define cultural
competency as “the efforts on the part of health plans and providers to deliver specialized services
to their non-English speaking, ethnically diverse enrollees.”
The Medi-Cal program requires its participating plans to ensure cultural competency. In
addition, plans are required to make available linguistic services such as interpreters and translated
outreach/marketing materials in those areas that meet the state’s threshold and concentration
standards per language groupCa threshold of 3,000 beneficiaries in an area or a concentration
of 1,000 beneficiaries in a single ZIP code or 1,500 in two contiguous ZIP codes. In many
counties, plans are required to provide, as needed, specialized services for multiple languages.
For example, in Los Angeles County, Medi-Cal regulations require plans to provide linguistic
services for six languages other than English to those enrollees who need help. The languages
are Spanish, Vietnamese, Cantonese, Cambodian, Armenian, and Russian (Coye and Alvarez
1999). Plans in Orange County, on the other hand, are required to provide language services
in Spanish and Vietnamese, as needed. Some of the health plans discussed the cultural
competency requirements, noting that these requirements provide a good example of how the
Medi-Cal business is distinctly different from and often more burdensome than their commercial
business.
e. Changes in Political Environment
California has a new governor, Gray Davis, a Democrat who assumed office in January 1999,
replacing Pete Wilson, a Republican who had served for eight years. Many people said they
thought the focus this year would be on education rather than health. Among health issues, three
administrative priorities are (1) consolidating responsibility for health plan regulation and oversight
in a single agency with a particular emphasis on monitoring quality of care; (2) debating new
legislation on health plan accountability, including independent medical reviews, limiting the ability
of health plans to prior authorize (pre-certify) services, and holding health plans liable for medical
decisions; and (3) addressing the widespread concern over the large number of uninsured people

45
in the state. California ranks as one of the top five states in the rate of uninsured (California
HealthCare Foundation 1998). Both the governor and the legislature are interested in expanding
coverage through the Medi-Cal and Healthy Families programs. Several interviewees, however,
felt it was unlikely that any expansion would take place in 1999 because the state was anticipating
a budget deficit.17
C. LOS ANGELES COUNTY’S EXPERIENCE WITH THE TWO-PLAN MODEL
When we visited Los Angeles County in 1994, enrollment in Medi-Cal managed care was
voluntary. There were 374,000 Medi-Cal beneficiaries enrolled in 11 HMOs (338,000 enrollees)
and 8 PCCMs (36,000 enrollees). This represented 20 percent of the county’s total Medi-Cal
population. While Los Angeles had been selected as one of 13 original counties to implement
the two-plan model, the initiative was not expected to become operational until December 1996.
When we were there in 1994, the county was just beginning the planning process (Sparer et al.
1996).
Since then, the two-plan model has been fully implemented in Los Angeles. We review here
the structure of the two-plan model in Los Angeles and its implementation, followed by a review
of the county’s more significant experiences under the model, and then we give some preliminary
insights into the early effects of the initiative on access and the safety net.
1. Overview of Los Angeles County’s Two-Plan Model
Developing the two-plan model for Los Angeles County involved issues on both sides of the
model—the local initiative, or public, side and the commercial, or private, side.
a. Structure of the Two-Plan Model
On the local initiative or public side, a key issue was to decide on a sponsoring entity. While
a preexisting, county-owned HMO, Community Health Plan (CHP), was fully licensed, its total
enrollment was just over 12,000 members, and county officials perceived it was too small and
inexperienced to handle the massive volume that would come about with mandatory enrollment.
Consequently, the county board of supervisors authorized the creation of a local initiative in
October 1994. The local initiative, known as L.A. Care Health Plan, was initially set up as a limited
Knox-Keene-licensed plan. Reflecting L.A. Care’s limited license, as well as the decision by local
officials not to develop a separate provider network, L.A. Care sought risk-based contracts with
17 Despite the initial prediction of a budget deficit, a budget surplus resulted. In addition, the state legislature did pass legislation to expand coverage for both the Medi-Cal and Healthy Families programs.

46
fully licensed plans, including several that were commercially based (Kertesz and Shinkman
1997; Sparer et al. 1996). Ultimately, they subcontracted with seven plans to provide care delivery.
The plan partners have remained the same since the model’s implementation. They are Blue
Cross of California, Care 1st Health Plan, CHP, Kaiser Permanente, Maxicare, Tower Health, and
UHP Healthcare (Watts) (L.A. Care 1999a). A potential eighth plan partner, Chinese Health Plan,
did not receive a Knox-Keene license and was therefore excluded.
The commercial plan for the model was selected by DHS based on a review of competing
proposals. Four HMOs submitted bids in April 1995 to be the commercial plan. They were
California All Health,3 Foundation Health Plan, Maxicare, and Tower Health (Sparer et al. 1996).
One of the California All Health plans indicated that a late start and difficulty presenting itself
as a unified entity with clearly delineated accountability possibly limited the strength of the
collective bid. In contrast, Foundation Health Plan reportedly submitted a better proposal, and
in October 1995 the state awarded it the commercial plan contract. After the contract award,
Foundation Health became Health Net as a result of a merger (Sparer et al. 1996). Health
Net’s subcontractors are Friendly Hills,18
Molina Medical Centers, and Universal Care (Health Net
1999).
The state’s award of the commercial contract to Foundation Health led to repositioning among
plans that lost the commercial plan bid. The first major shift was the withdrawal of CIGNA,
a California All Health plan, from the Medi-Cal program. At the time, CIGNA had the largest
voluntary enrollment in the county, which it subsequently transferred to Foundation Health. The
second major shift occurred when many of the remaining California All Health plans switched to
the local initiative side of the model and partnered with L.A. Care.
The two-plan model structure for Los Angeles is illustrated in Figure 1. As the illustration
depicts, the model is very complicated, with multiple players and layers. Many observers say that
the two-plan model used in Los Angeles County, unlike the two-plan model used in other counties,
is a misnomer, because in fact there are 12 participating health plans (L.A. Care, Health Net, and
the subcontractors on both sides of the model), each with its own unique structure. The model
is further complicated because Los Angeles County’s medical care tends to be organized around
18 Friendly Hills is a large independent practice association that has a limited Knox-Keene license. It is an affiliate of MedPartners, a physician practice management company, whose California operations were recently seized by the DOC and placed in Chapter 11 bankruptcy because of concerns about solvency (Shinkman 1999). When we visited MedPartners in February, a spokesperson told us that the company was attempting to sell off the physician components of its California operations. At the time, however, the exact fate of Friendly Hills was unknown.

47
medical groups and independent practice associations (IPAs). Many of these physician entities
are capitated and contract with multiple plans on both sides of the two-plan model. This multiple
contracting similarly occurs with hospitals. The exception is Kaiser, which owns its hospitals and
uses a dedicated physician group. The dual-sided design also seems to influence expectations
and style in the public and private components. Whereas L.A. Care operates in a public forum,
Health Net is much less visible.
b. Implementation of the Two-Plan Model in Los Angeles County
Table 7 provides a timeline of the implementation events in Los Angeles County. As the table
shows, it took five years from DHS’s strategic plan calling for the implementation of the two-plan
model to the model’s actual implementation in Los Angeles County.
The model itself was developed in part to protect traditional providers as they made the
transition from FFS to managed care (DHS 1998a; Kertesz and Shinkman 1997). For Los
Angeles, this was especially important because of the large publicly sponsored health system
the county operates. When the state issued its strategic plan in 1993, the two-plan model was to
have been fully implemented in Los Angeles by December 1996 (Sparer et al. 1996). That did not
happen, and a new implementation date was set for July 1997. The plan was in fact implemented
in January 1998. Overall, the delays reflect the complex issues raised by the model despite the
thought that went into its strategic development.

48

49
TABLE 7
LOS ANGELES COUNTY’S TWO-PLAN MODEL
IMPLEMENTATION TIMELINE
Year Month Implementation Activity
1993 March DHS issues managed care strategic plan that contains the
two-plan model.
1994 October Los Angeles County Board of Supervisors authorizes the local
initiative.
1995 April Four HMOs submit bids to be the commercial plan.
October Health Net (Foundation Health) is selected as the commercial
plan.
1996 December Initial target date for full implementation.
1997 March HCFA delays implementation scheduled for July 1997.
April L.A. Care begins operations as the local initiative.
June HCFA again delays implementation scheduled for July 1997.
July Second target date for full implementation. Foundation Health
begins operations as the commercial plan. HCFA again delays
implementation scheduled for July 1997.
October HCFA approves full implementation scheduled for January
1998.
1998 January The two-plan model is implemented.
Sources: Marquis 1997a, 1997b; American Healthline 1997a, 1997b; Sparer et al. 1996

50
There are multiple individual reasons for the delays. HCFA was reluctant to approve
implementation and stopped the process in March, June, and July 1997, further delaying the
actual start date. HCFA felt that the state was not adequately prepared to take on a large-scale
mandatory enrollment process, a sentiment that was echoed by advocates and others in the
community as well. In particular, HCFA stated that the instructions given to beneficiaries about
health plan selection were confusing. Other issues centered mostly around beneficiary outreach
and education. The concern was that these activities were weak and poorly targeted (American
Healthline 1997a, 1997b; Marquis 1997a, 1997b; Kertesz and Shinkman 1997). The state
contended that many of the issues were the result of performance problems with Benova, the
enrollment broker at the time (Kertesz and Shinkman 1997). But advocates say that even
with the transition to Maximus at the end of 1996, problems continued, including incomplete
enrollment packets and a lack of translated enrollment packets. During the delays, L.A. Care
began operations as the local initiative in April 1997 and began accepting voluntary enrollment.
Three months later, in July 1997, Foundation Health, which already had an existing voluntary
enrollment, became operational as the commercial plan (DHS 1999a). HCFA finally granted
approval in October 1997 for the two-plan model to be implemented in January 1998 (Marquis
1997b).
The delays were costly because the financial uncertainty that they created led many plans
and providers to shift emphasis from implementation preparations. Many plans and providers
expected a large influx of enrollment resulting from the transition from a voluntary to a mandatory
Medi-Cal managed care program. The increase in enrollment was projected to offset the
costs of implementation, including expansion activities required by some plans and providers to
accommodate the expected volume increase. But with the continuing delays, enrollment did not
materialize as expected (Kertesz and Shinkman 1997; Marquis 1997b). For example, L.A. Care
incurred expenses of nearly $1 million per month during this time, with only a minimal revenue
stream coming from voluntary enrollment (Kertesz and Shinkman 1997).
2. Experience in Key Operational Areas
In the following discussion, we analyze Los Angeles County’s experience from 1998 until
early 1999 with eligibility and enrollment, plan participation, payment rates and methods, provider
participation and network development, and administration and oversight. Despite numerous
attempts, we were unable to arrange an interview with Health Net. Thus, our information on
Health Net’s experience is based on our conversations with subcontractors, network providers,
and other observers, as well as document review.
51
a. Eligibility and Enrollment
Enrollment in Los Angeles County’s two-plan model was phased in under state rules that
became effective in July 1996. Under these rules as applied to Los Angeles, until the two-plan
model was implemented, beneficiaries had a choice of remaining in FFS or voluntarily enrolling in
Medi-Cal managed care by selecting one of the plans already participating in the county. Newly
eligible beneficiaries and those whose eligibility was redetermined were also required to make a
choice. If they didn’t choose, these beneficiaries were defaulted into one of the participating plans
beginning in September 1996 (Medi-Cal Community Assistance Project 1997).
When the initiative was fully implemented in January 1998, those Medi-Cal enrollees already
participating in managed care were transitioned along with their respective health plan, if the
plan participated. All other FFS beneficiaries in eligibility groups mandated for inclusion in
managed care had to choose a plan. Mandatory eligibility categories in Los Angeles County are
AFDC, medically needy with no share of cost, and medically indigent children with no share of
cost. For certain other eligibility groups, including the aged, blind, and disabled, enrollment is
voluntary (DHS 1998a). An average of 95,000 new Medi-Cal beneficiaries were converted to the
mandatory system each month during the first six months of the initiative (DHS 1998b).
For beneficiaries, enrollment in the two-plan model is a multi-step process. The county’s
DPSS first determines Medi-Cal eligibility. People can apply for Medi-Cal at various locations
throughout the county. Once eligibility is established, new beneficiaries receive a permanent
Medi-Cal card within 10 days. A temporary Medi-Cal card is issued only if the beneficiary requires
immediate care.
The state’s enrollment broker, Maximus, routinely provides presentations for CalWORKS/
TANF applicants to tell them about their health care choices and how to complete the enrollment
packet. These presentations are conducted in the various DPSS offices as well as at community-
based organizations located throughout the county. Included in the enrollment packet are an
enrollment form and provider directories for both L.A. Care and Health Net. Beneficiaries must
complete the enrollment form, which requires three decisions. They must first choose between
L.A. Care and Health Net, then choose a physician, and finally choose a health plan. The process
is perceived to be confusing because of the multiple selections. Many people said the selection
process also can be problematic because many physicians participate with more than one plan,
often on both sides of the model. While beneficiaries often choose a physician, they do not always
select a plan. Consequently, some plans complain that they lose membership when beneficiaries

52
are assigned to other plans the physician also participates in. The issue is complex because
beneficiaries may not be aware of or may not understand the various relationships that exist
between plans and physicians.
Beneficiaries must return completed forms to Maximus within 30 days of receipt. New
enrollment information is provided to L.A. Care and Health Net weekly. Welcome letters and other
information are sent to beneficiaries by the receiving health plans. Beneficiaries are covered
under FFS until the enrollment process is complete and they are assigned to a health plan.
Beneficiaries who do not return the enrollment form or fail to make a selection are assigned by
default. The default assignment rate in Los Angeles County has been a major point of contention,
particularly among advocacy groups. During the two-plan model’s first month of operation, the
default assignment rate was higher than 40 percent. After eight months of operation, the rate
dropped by almost half, to just under 24 percent (DHS 1998b). Most recently, the rate has been
below 20 percent (DHS 1999b). While the rate of default assignment is lower than in the past,
many people feel it is still unacceptably high. Especially among the advocacy community, the
concern is that the high default rates are indicative of the system’s failure to prepare and educate
beneficiaries adequately for the transition to managed care (Medi-Cal Community Assistance
Project 1997).
As designed, the default assignment mechanism under the two-plan model affords greater
protection to providers who have traditionally served the Medi-Cal population (DHS 1998a;
McCall et al. 1998; Zuckerman et al. 1998). Because the local initiative is required to contract
with these traditional providers, the model’s design gives them a disproportionate share of the
default assignment. The default assignment process in Los Angeles County is complex and
encompasses multiple steps. While the number varies depending on the way subcontractors
are structured, there can be up to four steps between beneficiary non-selection and the ultimate
assignment to a PCP.
In the first step, default assignment is split between L.A. Care and Health Net. In the initial
design of the model, L.A. Care was to receive 60 percent of the default assignment and Health
Net was to receive 40 percent. This has not occurred. For the first seven months of the initiative,
L.A. Care received all default assignment because regulations require that all such enrollment
be assigned to L.A. Care until it reaches a pre-determined minimum enrollment level. As a
consequence of the minimum enrollment level requirement, at least until very recently, there were
no individuals remaining in the default assignment pool to pass along to the commercial side of
the model. In August 1998, enrollment in L.A. Care reached its minimum enrollment level and

53
Health Net began receiving a small number of default enrollees (DHS 1998b; L.A. Care 1998a).
L.A. Care told us that during the last three months of 1998, DHS assigned 100 percent of the
default assignments to Health Net, and at the time of our visit, both plans were receiving an equal
number of assignments. These recent actions have aligned the 60/40 default assignment design
with current market shares—L.A. Care at 60 percent and Health Net at 40 percent (Health Net
1999; L.A. Care 1999b).
In the second step, L.A. Care and Health Net assign enrollees by default to the respective plan
partners and subcontractors. The county-owned health plan, CHP receives, at least historically,
the majority of default assignment because of its contract with L.A. Care. Through this contract,
L.A. Care guarantees the county a minimum of 100,000 lives for CHP plus an additional 65,0000
lives to be served by other health plans working through the county’s publicly sponsored health
care system (LA DHS 1999a).19
Consequently, other plans on the local initiative side get fewer
default assignments. All of the participating plans accept default assignment, with the exception
of Kaiser. Kaiser staff said the plan does not accept default assignments because its Medi-Cal
enrollment caps are reached through current enrollment, so the plan is closed to new Medi-Cal
members most of the year. Kaiser also said it did not want dissatisfied members, which it believes
are more likely to result when beneficiaries do not choose their own health plan.
In the final two steps of the process, the plan partners and subcontractors either assign
beneficiaries directly to a PCP or assign them to an IPA or medical group, which in turn assigns
them to a PCP. Overall, Medi-Cal enrollment projections in the Los Angeles initiative have not
fully materialized. While 1.2 million beneficiaries were initially projected for mandatory enrollment,
there are just under 1 million actually enrolled, largely because of the concurrent decline in
the state’s Medi-Cal rolls (Sparer et al. 1996; DHS 1999a; Medi-Cal Policy Institute 1998a).
Health plans and providers are fearful that enrollment will be further reduced by the Aid Code
38 redeterminations. Los Angeles County now has 100,000 Aid Code 38 enrollees. When we
visited, the county’s social services agency had started the redetermination process, mailing
notices to 60,000 enrollees, of which 3,000 were returned because of bad addresses.
19 The guarantee relates to a Section 1115 federal waiver granted to Los Angeles County in 1995 for the purpose of creating a partnership of county, state, and federal governments to restructure and stabilize the county’s financially troubled, publicly sponsored health care system (L.A. DHS 1999a). Further details of the federal waiver are discussed in a subsequent section.

54
b. Trends in Plan Participation
As shown in Table 8, the composition of participating plans has changed considerably from
1994, and many plans that have participated since then also have experienced a dramatic shift in
enrollment and market share.
The most substantial plan exit associated with the implementation of the two-plan model was
CIGNA, which had the largest pre-initiative enrollment (more than 108,000 beneficiaries). Other
exits since 1994 are Pacificare and FHP, but both of these plans had relatively low Medi-Cal
enrollment, and the impact of their withdrawal was less significant. New risk-based Medi-Cal
managed care market entrants since 1994 are Blue Cross, Care 1st Health Plan, Tower Health,20
and Friendly Hills.21
As of February 1999, these four plans accounted for nearly 40 percent of the
county’s total Medi-Cal managed care enrollment.
Aside from CIGNA’s withdrawal from Medi-Cal, the extensive growth in CHP, Blue Cross, and
Health Net (and its subcontractors) are arguably the most notable changes and ones that drive
many other dynamics within the market. The manner in which these plans have achieved growth
also provides an interesting contrast. Much, if not the majority, of growth in CHP reflects the
impact of the guarantee of lives provided the plan by L.A. Care. In 1994, CHP had just over
12,000 members, but by 1999, its membership had grown to nearly 100,000, with the increase
primarily attributable to the guarantee (Sparer et al. 1996; Health Net 1999; L.A. Care 1999b).
Some plans perceive the default assignment process in Los Angeles as inequitable because
of the large number of enrollees funneled to CHP. Some commented that default assignment is
further complicated because voluntary disenrollment from CHP is considerably higher than for
other plans, a factor that was acknowledged by L.A. Care and confirmed by document review
(L.A. Care 1998a; 1998b; 1999b; 1999c). As a result, L.A. Care must continue to funnel CHP
large numbers of enrollees to ensure compliance with the contractual guarantee. But as the
default assignment rate drops, there are fewer beneficiaries to assign. Plans generally expressed
concern that with overall declining Medi-Cal enrollment, the default assignment will become an
even greater issue as they scramble to retain membership.
20 In 1994, Tower Health participated in the PCCM program, but not as an HMO.21 Under voluntary enrollment, Friendly Hills participated in Medi-Cal through an affiliation with
CIGNA.
55
Blue Cross had no Medi-Cal enrollees in Los Angeles County before the two-plan model’s
implementation (Sparer et al. 1996). By February 1999, however, the plan had more than 166,000
enrollees, accounting for 17 percent of the market (Health Net 1999; L.A. Care 1999a, 1999b).
Much of Blue Cross’s growth has occurred because beneficiaries voluntarily choose the plan.
Providers and advocates told us that Blue Cross is well-liked among Medi-Cal beneficiaries and
has evolved as the plan of choice. Much of the attraction seems to be that, at least to the Medi-Cal
beneficiary, the plan looks more commercial than Medicaid, with such benefits as a large provider
network. Blue Cross also is attractive to providers because it is one of the few plans that pay
providers on a FFS basis, as discussed later. According to John Monahan, the general manager
of Blue Cross of California, the plan wants the Medi-Cal business and is aggressively going after
it. Blue Cross initially entered Medi-Cal under Sacramento’s GMC model in 1994. Since then,
it has expanded into 12 other counties, including Los Angeles. It currently has nearly 550,000
enrollees statewide and expects to expand further.
In comparison with the substantial growth on the local initiative side, Health Net and its
subcontractors brought with them a sizable enrollment (nearly 240,000 beneficiaries) that had
been amassed under voluntary enrollment. This included the membership transfer by CIGNA
when that plan exited the Medi-Cal managed care market (DHS 1998b). Mandatory enrollment
has increased membership in Health Net (including its subcontractors) by more than 60 percent
since January 1998, mostly through voluntary selection (DHS 1998b; Health Net 1999). The
market dynamics created by CHP, Blue Cross, and Health Net (and its subcontractors) are
important because they constrain the ability of other participating plans to maneuver strategically
within the market. UHP Healthcare (Watts) and Care 1st provide two good, yet different, examples
of how these other plans are responding to the existing Medi-Cal managed care market dynamics
in Los Angeles County.

56
TABLE 8
LOS ANGELES COUNTY MEDI-CAL MANAGED CARE
CHANGES IN PLAN ENROLLMENT AND MARKET SHARE
(EXCLUDING PCCM), OCTOBER 1994–FEBRUARY 1999
Health Plan October February % October February %
1994 1999 Change 1994 1999 Change
Enrollees Enrollees Market Market
Share (%) Share (%)
L.A. Care
Blue Cross of California 0 166,281 + 0.0 17.0 +
Care 1st Health Plan 0 72,201 + 0.0 7.4 +
Community Health Plan 12,014 97,275 709.7 3.6 9.9 166.7
(CHP)
Kaiser Permanente 27,303 26,369 -3.4 8.1 2.7 -66.7
Maxicare 13,961 92,531 562.8 4.1 9.4 129.3
Tower Healtha 0 57,614 + 0.0 5.0 +
UHP Healthcare (Watts) 54,411 75,438 38.6 16.1 7.7 -52.2
Subtotal - L.A. Care 107,689 587,709 445.7 31.9 60.0 88.1
Health Net
Foundation Health/Health 58,781 91,909 56.4 17.4 9.4-46.0
Net Plansb
Friendly Hills 0 79,984 + 0.0 8.2 +
Molina Medical Centersa 16,921 94,289 457.2 5.0 9.6 92.0
Universal 33,915 125,582 270.3 10.0 12.8 28.0
Subtotal - Health Net 109,617 391,764 257.4 32.4 40.0 23.5
Other
CIGNA 108,469 0 - 32.0 0.0 -
FHP 1,044 0 - 0.3 0.0 -
Pacificare 11,471 0 - 3.4 0.0 -
Subtotal - Other 120,984 0 - 35.7 0.0 -
Total 338,290 979,473c 189.5 100.0 100.0
SOURCES: Sparer, Gold, and Simon 1996; Health Net 1999; L.A. Care 1999a+ New since 1994; - Exit since 1994.aParticipated in PCCM in 1994.bFoundation Health Plan became Health Net as the result of acquisition.cDiffers from the 979,519 figure reported in Table 5. There are different sources of data for the two tables, and thedifference of 46 is not significant.
57
When we visited UHP, a Medicaid-dominant plan (which had originated out of the War on
Poverty and Community Health Center programs), it had just over 54,000 Medi-Cal enrollees in
1994, representing 16 percent of the market (Sparer et al. 1996). Since the two-plan model’s
implementation, enrollment has increased by 39 percent to nearly 76,000 enrollees, but overall
market share has dropped to less than 8 percent (Health Net 1999; L.A. Care 1999a). UHP staff
perceive that they have been adversely affected by the shift to the two-plan model for several
reasons. First, for Medi-Cal managed care statewide, door-to-door marketing activities by health
plans now are prohibited (Sparer et al. 1996). UHP says it was very effective in its door-to-door
marketing efforts and has lost this competitive advantage. Second, the plan says it has lost mem-
bership because of the multiple choices beneficiaries have to make during enrollment. Staff said
beneficiaries often assume that when they select a physician they will automatically go to the plan
they desire, not realizing that physicians often participate with multiple plans. Third, the plan had
initially hoped it would receive a good volume of new members through the default assignment
process, but this has not occurred. UHP views its Medi-Cal business in Los Angeles as somewhat
tenuous, and, in response, the plan is positioning itself to participate more actively in Orange
County’s Medi-Cal managed care market under the CalOPTIMA model. The plan is also looking
to reduce its dependence on the Medi-Cal business by increasing Medicare enrollment.
Care 1st Health Plan is a new Medi-Cal HMO entrant since 1994. This Medicaid-only plan
has more than 72,000 Medi-Cal members, representing more than 7 percent of the Los Angeles
market (Health Net 1999; L.A. Care 1999a). While the plan has grown in membership under the
two-plan model, it, too, is cautious about the future of its Medi-Cal business in Los Angeles. The
plan perceives a need to grow that likely won’t be met by Medi-Cal. But it isn’t looking to add
products such as Medicare or commercial lines of business at this time because it believes that
breaking into these markets would be very difficult for a new entrant. Instead, one of its strategies
for growth is to build its physician network base, which has increased six-fold in the past few
years. Care 1st believes it can achieve enrollment growth by increasing the number of affiliated
physicians, who will bring their Medi-Cal patients with them to the plan. Another strategy is to
develop an operational niche for the plan by being strong in care for enrollees who have special
needs, with a particular focus on health education for various ethnic populations served by the
Medi-Cal program. Although the plan serves all of Los Angeles, its enrollment is concentrated
in the downtown and San Gabriele Valley areas of the county, each of which has significant
Asian and Latino populations. As plan staff note, because certain ethnic groups approach health
care very differently, health education that specifically addresses these enrollees’ unique cultural
circumstances is essential to achieve not only good health outcomes, but cost-effective care as
well.

58
The experience of Kaiser is much different from that of the other plans participating in the two-
plan model in Los Angeles, reflecting primarily internal strategy rather than the market dynamics.
Between 1994 and 1999, Kaiser’s Medi-Cal membership in Los Angeles has been relatively flat,
as shown in Table 8 (Sparer et al. 1996; Health Net 1999; L.A. Care 1999a). Although Kaiser
participates in Medi-Cal, the plan has made a statewide strategic decision to limit the extent to
which it does by capping enrollment. Because of the cap, enrollment in the plan is generally
closed to new Medi-Cal members except for those who previously participated with Kaiser either
through Medi-Cal or through a commercial-based program. Kaiser staff said the decision was
made because Medi-Cal is an unprofitable line of business; it has low payment rates that do not
cover costs, and it has extensive program requirements that differ substantially from those for
other non-Medi-Cal enrollees and are difficult to implement because of the way the Kaiser system
is organized.
The evolving dynamics in Los Angeles County may eventually change the landscape of Medi-
Cal participating plans, many of which are Medicaid-only or Medicaid-dominated plans. Much of
what happens will depend on how specific market factors evolve, such as Medi-Cal enrollment
levels, payment rates, and state Medi-Cal policy (e.g., default assignment method). The current
perception among some plans and providers is that the future of the Medi-Cal market in Los
Angeles is uncertain, which translates into increased uncertainty for their operations, many of
which are heavily dependent on this line of business. As one of the smaller plans commented,
it doesn’t expect to survive in its current form, but it anticipates eventually being acquired by or
merging with another health plan.
c. Trends in Payment Rates and Methods
DHS contracts directly with L.A. Care and Health Net (as illustrated by Figure 1). Both
plans are paid under a capitation arrangement, and the rates are adjusted for various factors
(Ben-Avi et al. 1997). After taking 6 percent of the capitation payment for administrative costs, L.A.
Care passes the remaining amount to its plan partners. All of the plan partners have the same
capitation arrangement with L.A. Care. Each of the plan partners may retain up to 15 percent
of the capitation payment for administrative costs and profit (Kertesz and Shinkman 1997). The
exact amount retained is decided by the individual plan partner. The amount remaining after
these deductions and a risk pool withhold is paid to providers, often through an intermediary entity
such as an IPA or medical group. The payment structure for Health Net is similar; the plan may
retain up to 15 percent of the capitation payment for administrative costs and profit and pass the
remainder, less a risk pool withhold, to the provider network.
59
Many provider contracts with IPAs and medical groups are on a risk basis, and the number of
contracts involved is large. For example, L.A. Care commented that 135 IPAs and medical groups
in its network take risk. The process is complex because physicians often participate with multiple
IPAs, medical groups, and plans. Although plans place providers at risk, at least conceptually,
they are ultimately responsible for the IPAs and medical groups with whom they contract. But this
issue of ultimate accountability has some ambiguity in California. An example is the recent failure
of FPA, a physician practice management company. Pacificare contracted with FPA in several
states, including California. When the company declared bankruptcy, many physicians weren’t
paid, and apparently, California law was unclear on who was accountable in such a bankruptcy
(Jaklevic 1998). In Nevada, at least, Pacificare was ultimately held liable.
Some plans are concerned that many IPAs and medical groups are accepting risk without the
infrastructures needed to manage it properly, which is perceived as a particular issue in California,
with its low Medi-Cal capitation rates. We heard the issue of rate adequacy repeatedly, with the
overall sentiment from plans, providers, and other observers that the Medi-Cal program is vastly
underfunded. Market observers speculate that as many as 90 percent of physician groups may
be struggling to meet their financial obligations under these rates.
Although capitation is the typical physician payment method in Los Angeles County’s two-
plan model, Blue Cross has approached physician payment differently. Blue Cross has separate
provider networks for its commercial and Medi-Cal businesses. While its commercial network is
fully capitated, Blue Cross offers its Medi-Cal network different payment options, including some
form of capitation or FFS. Blue Cross said it uses this strategy because provider sophistication
varies significantly under managed care. The majority of the Medi-Cal network, 80 percent,
has opted for the FFS payment arrangement. Although Blue Cross’s approach to physician
compensation has reduced some stress on traditional providers, it may also perpetuate the
infrastructure barriers these providers face in a competitive managed care environment.

60
In addition to Blue Cross, Kaiser provides another unique spin on provider compensation. The
plan has an exclusive arrangement with the Southern California Permanente Medical Group for
physician services. Kaiser’s contract with the Permanente Medical Group does not distinguish
between payers; the same rates are paid for a Medi-Cal enrollee as for a commercial enrollee. If
Kaiser receives capitation rates lower than what it pays under its physician services arrangement,
the plan takes the hit. Medi-Cal’s low payment rates, therefore, are of particular concern.
The structure of the two-plan model in Los Angles has resulted in a complicated set of
delegated risks and responsibilities that appears to have increased administrative costs. An
example cited was emergency room care the billing of facility and physician charges. An enrollee’s
Medi-Cal card provides the primary care physician’s name, but not the IPA or medical group that
has assumed the risk for that beneficiary. It is not always clear where to send the bill because
the organization that is financially responsible for the beneficiary’s care may not be listed on the
individual’s Medi-Cal card. The problem becomes even more complex if the beneficiary does not
present the card at the time of service. One hospital, we were told, has more than $10 million,
representing 10 percent of its accounts receivable, tied up with Medi-Cal because it doesn’t know
where to send the bills. Consequently, accounts are given to third parties, who retain a sizable
percentage of any money they succeed in collecting.
Another example of the complications created by Los Angeles County’s two-plan model’s
structure concerns risk pool management. Periodically, risk pool funds are distributed to
participating network providers after contractual obligations are paid (e.g., out-of-network services).
According to one provider, the risk pool distribution process is complex because of the extensive
delegation of risk in the model, which complicates the determination of who should get what.
We were told that the process is also becoming increasingly expensive because consultants
representing the various parties are being hired to negotiate distribution amounts.
Hospital staff perceive that the two-plan model has dramatically increased the overall cost
structure. Staff say they have to do more work, including manual billing and pulling patient
records, than they did in the FFS system. The billing process is much less smooth than under
FFS, where staff knew to bill the state. In addition, electronic billing capability and the state’s use
of a fiscal intermediary in the FFS system reportedly facilitated a faster payment turnaround than
currently exists.
61
d. Trends in Provider Participation and Network Development
The provider networks in Los Angeles County’s two-plan model are largely built around IPAs
and medical groups, and this structure reflects the way health care is organized and delivered
in California generally. In a study of medical groups and capitation in California, Casalino and
Robinson (1997) found that HMOs pass along a substantial portion of the financial risk for the
costs of medical care to physician-controlled groups, and that HMOs delegate a substantial share
of the responsibility for managing enrollee care to these physician organizations.
Plans and providers discussed how competitive the Medi-Cal business has become. We
heard no reports of plans being unable to attract a sufficient number of providers to serve Medi-
Cal enrollees. There also are more providers in the system now than under FFS. L.A. Care
noted that before the two-plan model’s implementation, there were 1,500 primary care physicians
serving Medi-Cal beneficiaries in the county, but under the current system, there are 3,600. Also,
declining enrollment appears to have heightened the level of competition, with more providers for
fewer beneficiaries.
e. Administration and Oversight
DHS oversees both L.A. Care and Health Net, each of which in turn is ultimately responsible
for its side of the two-plan model (as illustrated in Figure 1). In our meeting with L.A. Care,
staff described their primary administrative and oversight responsibilities as encompassing
member services, network operations, quality improvement, and distribution of enrollment to the
plan partners. Responsibilities delegated to the plan partners include utilization management,
quality assurance, and credentialing. The plan partners, in turn, delegate a large share of the
responsibility for care management to the IPAs and medical groups. Participating IPAs and
medical groups are required to oversee their contracted physicians to ensure compliance with
program requirements. We were told that Health Net’s approach is similar. The manner in which
the administrative and oversight responsibilities are carried out is conceptually similar to the
layered distribution that occurs with the capitation payment. That is, certain administrative and
oversight responsibilities are delegated throughout the various layers.
A key concern of plans, providers, and other observers involves the value added by L.A. Care,
given the additional layer of administrative oversight that the model generates. County officials
envision L.A. Care, at least in the short term, as a holding company exercising good policy options
for the Medi-Cal population, as desired by the state. Other observers question whether this role
can be served only by L.A. Care. The issue is likely to be debated for some time.

62
To participate in Medi-Cal, plans must comply with various contractual requirements. While
not all-inclusive, Table 9 highlights many of the key requirements. Plans and providers view the
requirements of the Medi-Cal program as both more demanding and more extensive than the
requirements of the commercial market. One health plan likened the requirements to an iceberg:
Only a small part is visible, but there are considerable invisible requirements associated with
running a Medi-Cal business. Plans perceive that Medi-Cal gets involved at an operational level
of detail that makes it more difficult for them to serve enrollees. While they commented that
physicians know who their Medi-Cal patients are because they have to do more work, this is
not always desirable. In fact, it may run counter to the state’s desire to mainstream Medi-Cal
beneficiaries into health plans so they are treated like commercial members.
Three specific concerns about program requirements appear particularly salient. First, some
plans participate in initiatives in several counties, each with different, demanding requirements.
Second, participating plans may interpret the program requirements differently and give conflicting
direction. For a provider that participates with several plans, this can become extraordinarily
frustrating and burdensome. Third, the multiple layers add to the complexity. For example, one
plan told us that it is required to send duplicate information to L.A. Care and the plan partner
with whom it is affiliated. Finally, plans and providers note that the large number of program
requirements forces plans to accept a substantial Medi-Cal volume.
Among the various Medi-Cal requirements, those related to encounter data collection and
submission seem to be particularly troublesome in the Los Angeles initiative. The problem is
not only collecting the information, but how the state processes and analyzes it. When the state
developed its specifications for encounter data systems, it did not specify software systems. Now,
it is trying to interface with a multitude of systems in Los Angeles County alone (one for each
participating plan) and is having major difficulties. The problem is frustrating for plans that comply
with the requirement. One plan noted that it keeps sending information to the state, but it doesn’t
know what’s being done with the data because it gets no feedback.

63
TABLE 9
LOS ANGELES COUNTY MEDI-CAL MANAGED CARE
KEY HEALTH PLAN CONTRACTUAL REQUIREMENTS
Area Requirement
Emergency Services Ensure availability and access to emergency services 24 hours/day, 7 days/week.
Telephone Coverage Maintain a process to triage enrollee’s telephone calls and provide telephone medical advice.
Physician Coverage Ensure physician or nurse (under physician supervision) availability 24 hours/day, 7 days/week.
Urgent Care Ensure that an enrollee needing urgent care services is seen within 48 hours.
Access Make available a network of PCPs that are located within 10 miles or 30 minutes of the enrollee’s place of residence. Ensure network achieves the following enrollee-provider ratios: 1:2,000 primary care physicians and 1:1,200 total physicians.
Initial Health Assessment Schedule an initial health assessment for each enrollee within 120 days of enrollment.
Days to Appointment Schedule first prenatal visit within one week.
Linguistic and Cultural Sensitivity Provide interpreters, translated signage, translated written materials, and referrals to culturally and linguistically appropriate community ser-vices programs for the threshold languages.
Choice of primary care Offer enrollees the opportunity to select a PCP within the first 30 days provider (PCP) of enrollment. Assign a member to a PCP within 40 days of notification
of enrollee’s enrollment in cases of non- selection. Allow enrollees the opportunity to change PCPs every 30 days.
Traditional Provider Ensure broad participation and broad representation of traditional and safety-net providers within the county.
Quality Develop, implement, and operate a quality improvement program. Per-form focused studies using the most recent Health Employer Data and Information Set (HEDIS) indicators on an ongoing basis (e.g., pediatric preventive services, obstetrical care, adult preventive care, access to care)
Encounter Data Submit encounter-level data on a monthly basis, 90 days following the end of the reporting month.
Facility Review Conduct facility reviews on all network PCP sites as part of the credentialing/recredentialing process.
SOURCE: DHS 1998c

64
Aside from the encounter data, the advocacy community says the state has not been
forthcoming with information about plan performance generally. When we visited in February,
Community Health Councils, Inc., of Los Angeles County was about to release a report card on
plan performance for those participating in the county’s Medi-Cal managed care initiative. The
organization said the report card was the result of increasing frustration among the advocacy
community on the lack of information about plan performance and accountability. The report cards
rate the individual plans based on criteria developed by the Community Health Councils, using
information from focus groups and other sources. The organization wants to raise awareness of
health plan quality and accountability and establish a baseline against which future results will
be compared. The project is also intended to help beneficiaries make better and more informed
choices in health plan selection. But some plans and providers are concerned that such efforts
don’t adequately consider the challenges they face in the Medi-Cal program. Low capitation
rates, coupled with excessive program requirements and demands, may negatively affect plan
performance.
When we visited, there was no formal evidence on Medi-Cal plan performance in Los Angeles.
Although the first round of EQRO reviews had been completed, the results were not expected
for some time. The EQRO reviews focused on plan performance surrounding such services as
childhood immunizations, prenatal visits, and well-baby care. We were told, though, that EQRO
studies done in other regions of the state suggest overall poor performance by the health plans
reviewed, and some of those plans also participate in Los Angeles’s initiative. Many plans could
not locate enrollee medical records for the review, and that was a major factor in the poor results.
The plans contend, however, that they were expected to pull a large number of medical records
within an unrealistically short time.
Generally, we got a sense that plans and providers were disgruntled as they talked about
the requirements associated with the Medi-Cal program, including demands for which there is
no additional compensation. One example often cited for its uncompensated burden was the set
of requirements surrounding linguistic and cultural sensitivity interpreters or translated marketing/
enrollment materials, for example. But while there is dissatisfaction with the Medi-Cal program
requirements, some people acknowledge that the requirements have also forced a certain level
of self-auditing among providers. Although the activity is largely process-oriented instead of
outcome-oriented, it has made providers more cognizant of quality-of-care issues and made them
provide a higher level of discipline, oversight, and control. At least some plans, providers, and
market observers view this favorably as the beginning of a better system.

65
3. Early Insights on Effects on Access and the Safety Net
In this section, we look at the preliminary impact of Los Angeles County’s Medi-Cal initiative
on access and the safety net. The analysis is obviously limited by the county’s short period of
operational experience under the initiative.
a. Access
There is a consensus that access to providers has substantially improved under the two-plan
model because more providers participate. Under the FFS structure, there were numerous
examples of Medi-Cal beneficiaries being unable to find a provider willing to treat them. The
problem was even more acute for specialty care services such as obstetrics. Improvement has
come about because the burden of locating providers no longer falls on Medi-Cal beneficiaries; it
falls on the health plan responsible for their care.
By improving access, it was also hoped that Medi-Cal beneficiaries would have increased
choice among both traditional and mainstream providers. Although the assumption has been that
this has happened, the answer may not be that clear. Many of the participating health plans use
their regular commercial provider networks to serve Medi-Cal beneficiaries. These plans often
include language in their contracts requiring that a specified percentage of Medi-Cal work be
provided as a condition of network participation. For other health plans, such as Blue Cross, a
separate network has been developed exclusively for the Medi-Cal program. Advocates say they
don’t know what the degree of participation is among mainstream providers because they have
not seen any related data. While it may be true that beneficiaries have increased choice, for some
it may be limited to providers who have always participated in Medi-Cal. The mechanisms of
managed care may have merely made the ability to choose more apparent.
b. Safety Net and Spillover Effects
Los Angeles County operates the second largest publicly sponsored health care system in
the United States, exceeded only by New York City’s. The system’s six acute care hospitals and
approximately 45 community health centers have served the county in a traditional safety net role.
They provide services of last resort to the poor and uninsured, including a large Medi-Cal patient
base. Through its various facilities, the county provides primary care and public health services
(L.A. DHS 1999a; Hoovers 1998). In 1995, the system was in a financial crisis, resulting from
a $655 million budget deficit. The county applied for and was granted a Section 1115 federal
waiver, which prevented the system’s bankruptcy. Through the five years of the waiver, until the
year 2000, financial assistance is projected to total $1.2 billion (L.A. DHS 1999b).
66
Under the terms of the federal waiver, the county agreed to reduce the average daily census
in its hospitals by 40 percent over the five-year period and to increase ambulatory access by 50
percent. It also agreed to reduce inappropriate service use in the inpatient and emergency room
areas. To accomplish these goals, various reengineering strategies are being implemented. For
example, the county is pursuing public-private partnerships with key providers in the community,
including the nearly 40 community clinics, of which 13 are FQHCs (L.A. DHS 1999a, 1999b).
Since the waiver’s inception in 1995, Los Angeles County officials cite results that include
a 24 percent decline in inpatient bed capacity, a 25 percent decline in the number of inpatient
days, a 13 percent increase in the number of outpatient visits, a 16 percent reduction in the
size of the workforce, and a 235 percent increase in the number of service access points in the
county, primarily through the public-private partnership arrangements (L.A. DHS 1999a). County
officials attribute these accomplishments to more focused management, resulting from the budget
crisis. But whether these or subsequent improvements will prove sufficient to stabilize the county’s
health care system is uncertain.
In addition to the county-owned facilities, the network of community clinics have been
instrumental safety net providers in Los Angeles County. But the transition to managed care for
these clinics has been problematic. According to clinic association staff, many community clinics
were ill-prepared for the implementation of Medi-Cal managed care. The multiple implementation
delays meant a shift in focus for the clinics, and many did not use the time to pursue relationships
with plans or redesign their infrastructures to meet the new requirements. When the two-plan
model was finally implemented, many clinics found themselves locked out of participation
agreements because relationships had already been developed between providers and health
plans, IPAs, and medical groups. In addition, some clinics were unable to meet the contracting
requirements for network participation. Now trying to enter managed care late in the game, many
clinics are finding it very difficult to break into the networks.
When a clinic does participate in Medi-Cal managed care, it is usually through affiliation with
two or three health plans. Not all plans are willing to contract with the clinics, which is viewed
as especially problematic. While two FQHCs are in Health Net’s network, they are viewed as
limited in number, and a plan includes them as a means of succeeding in its bid to be the county’s
commercial plan. Many current arrangements with plans (e.g., UHP and Blue Cross) are a
reflection of relationships that existed before managed care. The county, through its owned HMO,
CHP, just recently began contracting with the community clinics.

67
According to one clinic advocate, many of the small- to medium-sized clinics are not positioned
to function in a managed care environment. Unlike larger clinics that have aggressively pursued
the Medi-Cal business, some smaller clinics question whether this is really the business they
want to be in. The clinics feel that the infrastructures and operational changes required under
managed care are very costly and time-consuming. Many clinics incurred substantial debt
during the numerous delays in implementing the two-plan model, waiting for enrollment that
never materialized. While Medi-Cal program requirements demand more sophisticated and costly
infrastructures, enrollments are small and do not offset the related expenses.
T.H.E. Clinic’s experience is a good example. According to its executive director, payer mix
has changed dramatically since the two-plan model was implemented. Previously, the clinic’s
payer mix consisted of 40 percent Medi-Cal and 60 percent uninsured. Now, the mix is 15
percent Medi-Cal and 85 percent uninsured. With this change, the types of patients seen have
shifted from less of the “well” poor to more of the “sick” poor. Often, these sicker patients have
multiple and neglected medical conditions, which makes them more costly to treat. Through its
public-private arrangement with the county, the clinic receives $62 per visit, including pharmacy.
The clinic estimates that after the cost of pharmaceuticals is removed, it actually receives
approximately $30 per visit, which falls short of the cost of providing care.
To meet the needs of its changing patient mix and comply with Medi-Cal requirements, the
clinic’s expenditures are increasing. One reason is that it has had to contract with more physicians,
where it previously relied heavily on nurse practitioners. These increased expenditures come
at a time when payor mix is eroding and revenues are decreasing, which places the clinic in
a precarious financial situation. When we visited, the clinic was projecting to lay off part of its
72-member staff and cut salaries. The clinic cited lack of attention in the design of the two-plan
model, rather than any direct malice, as the major threat to its financial viability.
The two-plan model also creates problems for reimbursement. For example, T.H.E. Clinic
often receives checks for clinic services made out to the contracted physicians. The clinic has
to track down the physician to have the check endorsed over. This creates a major paperwork
problem. especially for tax purposes, because physicians are shown as being paid more than they
actually receive.

68
The two-plan model, combined with lower Medi-Cal enrollment and higher numbers of
uninsured, appears to have added to the fragility of Los Angeles County’s safety net. Other
pressures on the safety net include low Medi-Cal payment rates and the struggle many traditional
providers experience operating in a managed care environment. Low Medi-Cal payment rates
preclude the cross-subsidization of care for the uninsured, the manner in which such care has
historically been funded. Some traditional providers, such as the community clinics, were late
getting into the managed care game, and as a result they have been excluded from participation
in plan networks. Consequently, these providers’ ability to grow or even maintain their client base
is severely threatened. Federal assistance provided to the county’s publicly sponsored health
care system through the Section 1115 waiver and protection afforded under the two-plan model
(e.g., default assignment) may not be enough to make a difference in the safety net’s continued
viability. All of these factors, both individually and combined, pose significant challenges for the
safety net.
D. ORANGE COUNTY’S EXPERIENCE WITH THE COHS MODEL
When we visited Orange County in 1994, Medi-Cal beneficiaries were voluntarily enrolled
in managed care. There were 40,000 beneficiaries enrolled in four HMOs (34,000 enrollees)
and three PCCMs (6,000 enrollees), accounting for 11 percent of the county’s total Medi-Cal
enrollment. Orange County’s initiative was scheduled to begin in October 1995, and when we
visited, the county was actively preparing for implementation (Sparer et al. 1996).
Since 1994, the COHS model has been fully implemented in Orange County. While the county
had previous experience with Medi-Cal managed care, the current initiative is much broader in
scope. We examine below the structure of the county’s COHS model, the county’s experience in
key operational areas, and its preliminary insights on the impact of the initiative on access and
the safety net.
1. Overview of Orange County’s COHS Model
Orange County operates one of five COHS models in the state, but its structure departs from
that used by other counties employing the model (Sparer et al. 1996). The county instead opted
for a design that it felt fit better with its circumstances.
a. Orange County’s COHS Model’s Structure
In August 1993, the Orange County Board of Supervisors approved the creation of the COHS,
known as CalOPTIMA (CalOPTIMA 1998b). In the traditional model, the COHS contracts with
individual providers to deliver care to Medi-Cal beneficiaries. Unlike counties such as San Mateo
69
and Santa Barbara that had previously implemented COHS models, Orange County decided to
use the large managed care infrastructure that was already in place to contract with existing
commercial health plans (Sparer et al. 1996).
Under the CalOPTIMA structure, a new physician-hospital contracting option was also created.
These entities are known as physician-hospital consortia (PHCs) (CalOPTIMA 1998b). Figure
2 illustrates the CalOPTIMA structure. The PHCs are a unique dimension of the CalOPTIMA
structure and are akin to provider-sponsored organizations (PSOs) (CalOPTIMA 1998b). Although
the hospital and physician components negotiate together in the PHC arrangements, CalOPTIMA
enters into separate risk-based contracts with each party, as the corporate practice of medicine
statute in California requires. Each PHC may include multiple IPAs and medical groups. However,
CalOPTIMA contracts with only one IPA or medical group for each PHC. This contracted group
is then responsible for managing the other participating IPAs, medical groups, and physicians
participating through the PHC.
CalOPTIMA is a separate entity from the county government, with almost no structural linkage.
Yet, a good relationship is essential to ensure political and other support for ongoing operations
and future endeavors. Some market observers say that CalOPTIMA’s “honeymoon” with the
county government is over and that it is at a critical juncture in the relationship. Leadership in
the county’s health care agency22
recently changed, and the belief is that this change provides a
good opportunity to build a better and mutually beneficial relationship. But we were told that for
CalOPTIMA to accomplish this successfully, it must be more visible and accommodating to the
county than in the past. While CalOPTIMA and the county’s health care agency coordinate efforts
on a range of health delivery issues, we got the impression from several of those interviewed that
there are points of contention between the two. Although the specific reasons behind the friction
are varied, one important factor is a difference of opinion on how care should be provided to the
county’s medically indigent population, an issue we examine later in this report. Another factor
alluded to was CalOPTIMA’s salary structure, which is higher than the county’s.
CalOPTIMA has an application pending for Knox-Keene licensing. Pending licensing, the
option of developing and marketing additional products such as Medicare and commercial lines
of business has not been ruled out.
22 Orange County’s health care agency serves in a traditional public health role. The agency’s responsibilities encompass both public health and mental health services.
70
b. Implementation of the COHS Model in Orange County
The COHS model in Orange County was formally implemented in October 1995. Table 10
highlights major implementation events. CalOPTIMA issued a request for proposals (RFP) from
potential subcontractors in December 1994. Those submitting bids had to demonstrate such
operational features as an adequate provider network, a primary care physician-to-enrollee ratio
of at least 1:2,000, and 24-hour physician coverage. Subcontractors were also required to have at
least 30 percent of their primary care network made up of traditional Medi-Cal providers or contract
with 10 traditional physicians (those serving more than 200 Medi-Cal clients in 1993), whichever
was less. In addition, traditional specialist physicians had to make up at least 10 percent of the
subcontractor’s specialist network. HMOs were required to meet DOC capitalization and reserve
requirements. PHCs were required to make a $100,000 solvency deposit to CalOPTIMA and to
reserve 25 percent of one month’s capitation payment. All bidders meeting the RFP requirements
were allowed to participate (Sparer et al. 1996).23
Thirty-eight subcontractors were accepted
for participation by September 1995, including 28 PHCs and 10 HMOs. CalOPTIMA officials
said they considered a competitive bidding process, but decided against it because it might drive
payment rates below what plans needed to provide good quality of care.
During CalOPTIMA’s initial stages of implementation, Orange County declared bankruptcy in
December 1994. Although CalOPTIMA is a separate legal entity from the county, its finances were
temporarily set back because funds were initially frozen. Even though the county’s bankruptcy
created problems, some market observers say that it also shifted the focus away from CalOPTIMA
when it was just starting up and allowed CalOPTIMA officials to work through the challenges of
implementation with less public scrutiny and pressure than might otherwise have been the case.
As a result, implementation was less problematic.
23 These same requirements still exist for subcontractors participating through CalOPTIMA.
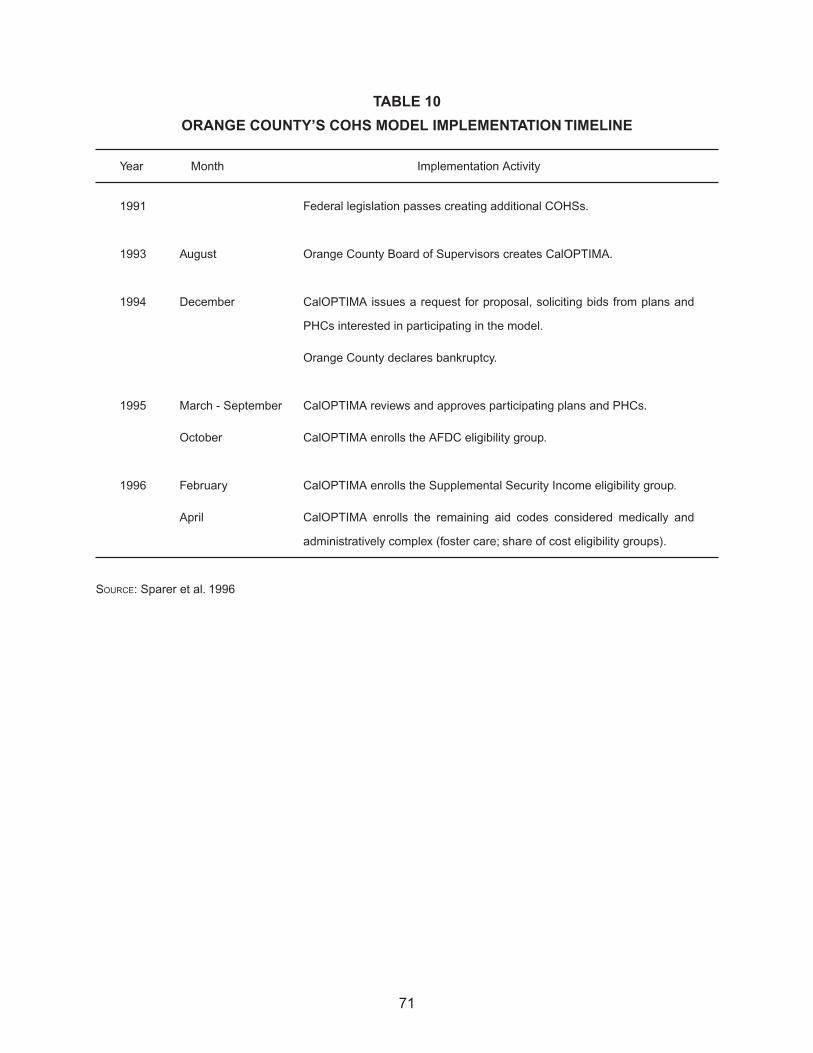
71
TABLE 10
ORANGE COUNTY’S COHS MODEL IMPLEMENTATION TIMELINE
Year Month Implementation Activity
1991 Federal legislation passes creating additional COHSs.
1993 August Orange County Board of Supervisors creates CalOPTIMA.
1994 December CalOPTIMA issues a request for proposal, soliciting bids from plans and
PHCs interested in participating in the model.
Orange County declares bankruptcy.
1995 March - September CalOPTIMA reviews and approves participating plans and PHCs.
October CalOPTIMA enrolls the AFDC eligibility group.
1996 February CalOPTIMA enrolls the Supplemental Security Income eligibility group.
April CalOPTIMA enrolls the remaining aid codes considered medically and
administratively complex (foster care; share of cost eligibility groups).
SOURCE: Sparer et al. 1996

72
73
2. Experience in Key Operational Areas
Next, we review Orange County’s experience under the COHS model with eligibility and
enrollment, plan participation, payment rates and methods, provider participation and network
development, and administration and oversight from 1995 until early 1999.
a. Eligibility and Enrollment
With few exceptions, enrollment in CalOPTIMA is mandatory for most eligibility groups,
including the SSI population (DHS 1998a). When the initiative was rolled out, enrollment was
phased in by eligibility group. The AFDC group was first to enroll, on October 1, 1995. This
was followed by the SSI population on February 1, 1996, and other groups, including the nursing
home population, on April 1, 1996 (Sparer et al. 1996). More recently, in June 1998, CalOPTIMA
assumed responsibility for long-term care, encompassing all nursing home care in the county,
including home health. CalOPTIMA commented that it always had responsibility for acute and
medical care for the nursing home population, and this arrangement just extends the scope of
services to include the non-acute, long-term care. To compensate CalOPTIMA for this added
responsibility, the state increased the capitation rate for the aged and disabled. CalOPTIMA has
replicated the state’s FFS method for long-term care, paying intermediate care, sub-acute care,
and other nursing facilities providing services on a per diem arrangement. Treatment authorization
requests for services in these facilities are reviewed every six months, with CalOPTIMA’s objective
being to ensure that the level of care is appropriate.
Enrollment in CalOPTIMA begins with the determination of eligibility. With the exception
of SSI beneficiaries, the Orange County Department of Social Services handles all Medi-Cal
eligibility determinations. Within seven days of receiving notification of eligibility from the state,
CalOPTIMA sends the beneficiary an enrollment packet containing an enrollment form, provider
directories, and other information about the program. The beneficiary must complete and return
the enrollment form, selecting a health plan or a PHC and a physician within two weeks of receipt.
CalOPTIMA reported that only 20 percent of beneficiaries choose both. If a plan or PHC is
selected, but not a physician, CalOPTIMA requires the plan or PHC to tell the beneficiary to
choose a physician. If a physician is selected, but not a plan or PHC, the beneficiary is assigned
by default to a plan in which the physician participates.

74
On average, default assignment runs about 30 percent per month, according to CalOPTIMA.
It says its default assignment process favors safety net providers and is based on a weighting
method. Higher weights are given to safety net providers and community clinics that have
historically served the county’s Medi-Cal and medically indigent populations. An overwhelming
majority of default assignments are given to UCI Medical Center and Children’s Hospital of Orange
County (CHOC) Health Alliance.
Table 11 details CalOPTIMA’s enrollment trends by major subcontractor from its inception
in 1995. Since 1997, Medi-Cal managed care enrollment levels in Orange County have been
relatively stable. However, the impending outcome of the Aid Code 38 redetermination efforts
could lead to a drop in enrollment. When we visited in February, there were 28,000 Aid Code
38 beneficiaries enrolled in CalOPTIMA, representing approximately 18 percent of the total
enrollment. CalOPTIMA believes enrollment will decrease, but it is not sure of the extent.
TABLE 11
ORANGE COUNTY’S COHS MODEL ENROLLMENT TRENDS
BY MAJOR SUBCONTRACTOR,
1995–1999
Subcontractor 1995 1996 1997 1998 1999a
Fountain Coast Health Network 22,188 26,943 24,650 23,210 23,486
CHOC Health Alliance 15,677 21,884 21,039 19,915 20,893
UCI Medical Center 20,356 17,520 16,017 17,452 19,632
Blue Cross of California 5,377 12,557 14,219 16,504 16,633
Universal Care 24,775 20,432 16,287 14,852 14,149
Noble Mid-Orange County 12,199 12,951 10,398 8,161 7,728
Blue Shield HMO 724 4,438 5,849 7,913 7,434
Arta Western Medical Group 3,660 6,145 6,214 7,823 8,309
Santa Ana-Chapman Health Network 4,689 8,878 7,873 7,695 8,035
St. Jude Providers Health Plan 4,506 5,246 4,893 5,646 5,575
St. Joseph/Mission Alliance 0 0 4,143 5,413 5,714
Kaiser Permanente 3,355 4,011 4,844 5,336 5,173
Others 39,531 38,036 19,819 15,893 16,269
Totalb 157,037 179,041 156,245 155,813 159,030
SOURCE: CalOPTIMA 1996, 1997, 1998a, 1999aFebruary 1999bThe totals do not include those people in CalOPTIMA Direct. However, they are included in the total enrollment figures
previously reported.

75
The SSI population accounts for 30 percent of CalOPTIMA’s total enrollment (CalOPTIMA
1998b). SSI enrollment in CalOPTIMA was not without controversy. Advocates in particular
were concerned that these medically fragile beneficiaries would have difficulty negotiating the
CalOPTIMA system to get the care they need. Almost concurrently with CalOPTIMA’s bringing
the SSI population into the system in February 1996, a Los Angeles-based legal advocacy
group sued in Sacramento County on behalf of several of Orange County’s developmentally
disabled Medi-Cal beneficiaries. The suit claimed that under managed care, disabled Medi-Cal
beneficiaries were not getting the same services that they had in FFS. The litigation never went
forward. CalOPTIMA officials say the real issue may have been less CalOPTIMA than a test case
spurred by the fear of managed care.
The first two years of SSI enrollment were challenging for CalOPTIMA. There were reports of
service disruptions for disabled people, and some SSI beneficiaries did not have adequate access
to essential medical care and equipment (Warren 1998; Marsh 1996). CalOPTIMA officials
acknowledged that there were problems early on, but said they have worked hard to reach out
to their disabled beneficiaries both directly and through the advocacy community. A particular
emphasis by CalOPTIMA has been to improve access to care for this population. Most of those
interviewed perceive that the numbers of specialist physicians in the network have increased.
According to one report, the increase in specialist physicians has been nearly 200 percent from
the former FFS program (Warren 1998). But some market observers caution that the number
of specialist physicians contracting through the CalOPTIMA model does not necessarily equate
to those actually seeing Medi-Cal beneficiaries, a number that they believe may be far smaller.
The press has reported favorably on CalOPTIMA’s efforts generally and on its work with the
disabled in particular (Warren 1998; Los Angeles Times 1998). CalOPTIMA officials told us
that the needs of the disabled are very different from those of the AFDC population. They note
that a disabled individual’s broader social needs must be addressed because of the unique
circumstances disabling conditions often create.
CalOPTIMA Direct is an FFS model that covers the dually eligible (essentially providing
Medigap coverage) and others, including foster children and newly eligible Medi-Cal beneficiaries
who are not yet enrolled in a plan. Enrollment in CalOPTIMA Direct averages 50,000 enrollees.
When we visited, CalOPTIMA told us it had just received a grant from the California HealthCare
Foundation to examine ways to work more effectively with the dually eligible in managed care.
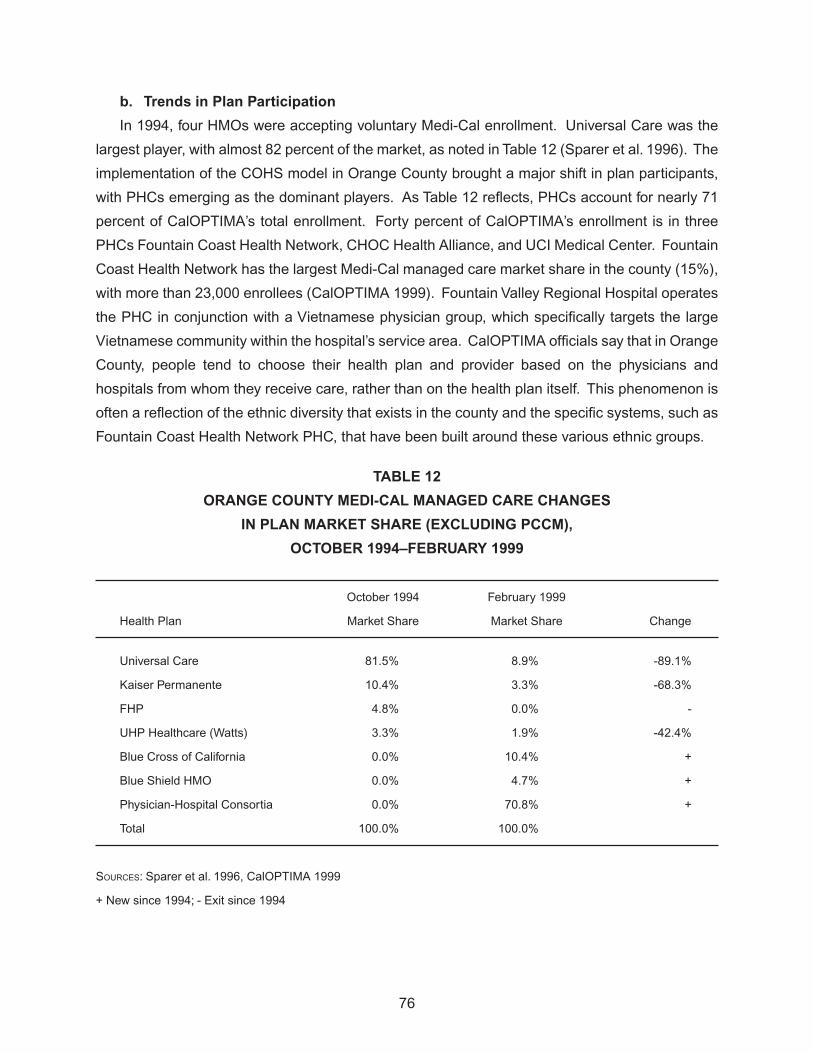
76
b. Trends in Plan Participation
In 1994, four HMOs were accepting voluntary Medi-Cal enrollment. Universal Care was the
largest player, with almost 82 percent of the market, as noted in Table 12 (Sparer et al. 1996). The
implementation of the COHS model in Orange County brought a major shift in plan participants,
with PHCs emerging as the dominant players. As Table 12 reflects, PHCs account for nearly 71
percent of CalOPTIMA’s total enrollment. Forty percent of CalOPTIMA’s enrollment is in three
PHCs Fountain Coast Health Network, CHOC Health Alliance, and UCI Medical Center. Fountain
Coast Health Network has the largest Medi-Cal managed care market share in the county (15%),
with more than 23,000 enrollees (CalOPTIMA 1999). Fountain Valley Regional Hospital operates
the PHC in conjunction with a Vietnamese physician group, which specifically targets the large
Vietnamese community within the hospital’s service area. CalOPTIMA officials say that in Orange
County, people tend to choose their health plan and provider based on the physicians and
hospitals from whom they receive care, rather than on the health plan itself. This phenomenon is
often a reflection of the ethnic diversity that exists in the county and the specific systems, such as
Fountain Coast Health Network PHC, that have been built around these various ethnic groups.
TABLE 12
ORANGE COUNTY MEDI-CAL MANAGED CARE CHANGES
IN PLAN MARKET SHARE (EXCLUDING PCCM),
OCTOBER 1994–FEBRUARY 1999
October 1994 February 1999
Health Plan Market Share Market Share Change
Universal Care 81.5% 8.9% -89.1%
Kaiser Permanente 10.4% 3.3% -68.3%
FHP 4.8% 0.0% -
UHP Healthcare (Watts) 3.3% 1.9% -42.4%
Blue Cross of California 0.0% 10.4% +
Blue Shield HMO 0.0% 4.7% +
Physician-Hospital Consortia 0.0% 70.8% +
Total 100.0% 100.0%
SOURCES: Sparer et al. 1996, CalOPTIMA 1999
+ New since 1994; - Exit since 1994
77
At the start, CalOPTIMA had 38 subcontractors, including both PHCs and HMOs. It now has
17 subcontractors, composed of 12 PHCs and 5 licensed HMOs (Warren 1998). The reduction
was the result of two key factors. First, a few subcontractors such as Pacificare and Blue
Shield terminated their contracts with CalOPTIMA as part of statewide strategies to discontinue
participation in the Medi-Cal program. Second, several subcontractors, primarily PHCs with small
membership, consolidated operations (CalOPTIMA 1996, 1997, 1998a, 1999).
Over the next several months, the number of subcontractors is expected to drop to around 12,
and CalOPTIMA hopes that will decrease the administrative complexity associated with managing
a large network. The reductions are expected to come largely from an increase in the minimum
member threshold requirement recently implemented by CalOPTIMA. After the first year of
operation, the minimum was 2,500 members, but more recently the threshold has been raised to
5,000 members. Many of the smaller subcontractors, which are generally PHCs, simply lack the
infrastructures to support an increased membership, and several of the smaller subcontractors are
likely to consolidate. Our sense was that individual providers generally aren’t terribly threatened
by the consolidation because they know they will continue to participate in the initiative through
another contracting entity. One hospital that has several PHCs that are being affected by the
change told us that it is very supportive of CalOPTIMA’s efforts because it believes the reductions
are reasonable.24
c. Trends in Payment Rates and Methods
CMAC negotiates capitation rates with CalOPTIMA, which, in accordance with state policy,
are not publicly available. CalOPTIMA is paid different rates based on eligibility category, age,
and gender. While CMAC negotiates rates, DHS holds the actual contract with CalOPTIMA. After
taking 6 percent of the capitation rate for overhead, CalOPTIMA passes the remainder to its
subcontractors. All subcontractors have the same capitation arrangement with CalOPTIMA, and
there is no differential for safety net providers.
Some hospitals participating in the PHCs perceive CalOPTIMA’s allocation of the capitation
rate between the hospital and physician components to be controversial, particularly because
24 Kaiser’s response to the increase in the minimum member threshold, however, is much different because of its statewide strategy of limited Medi-Cal participation. Although the plan is usually closed to new Medi-Cal members, the increase in the threshold requirement by CalOPTIMA required it to reopen enrollment to reach 5,000 members, which Table 11 reflects (CalOPTIMA 1999).

78
hospital rates are decreasing while physician rates are increasing. They say that the allocation
decision should be made by the individual PHCs, who better understand the specific circumstances
of the arrangements. Other observers say, however, that hospitals want the decision to be
made at the PHC level because they can exercise more control there. These observers note
that the CalOPTIMA model is predicated on shifting from inpatient and emergency room care to
ambulatory care, and under such a scenario, hospitals and physicians should be compensated to
reflect this change in care delivery. CalOPTIMA believes that its role in the allocation decision is
necessary to ensure payment adequacy on both sides of the PHC arrangement. The substantial
excess hospital capacity in Orange County appears to provide an advantage for CalOPTIMA in
setting hospital rates. Safety net hospitals in particular are said to be willing to accept lower rates
because they need the Medi-Cal days to fill their excess capacity and to maintain DSH funding.
As in California generally, low Medi-Cal capitation rates in Orange County are a concern, but
to varying degrees. Some hospitals said that they are actually getting higher rates now than under
Medi-Cal’s FFS system.25
These hospitals tend to be smaller facilities that have not traditionally
served in a large safety net capacity. On the other hand, providers such as UCI Medical Center
say that they have been hurt financially because there is no longer a differential for safety net
providers. UCI Medical Center officials say that not only have its rates dropped substantially
under the COHS model, but it is being adversely selected because of its tertiary care and trauma
services. Under FFS, the hospital performed enough routine work to offset some of the high costs
associated with the more acute patient load. Now, the hospital is getting sicker patients and is
being paid less overall to treat them. The experience of physicians appears to be mixed under
the current capitation arrangement. One PHC representative said some IPAs were doing well
and others not. The difference, we were told, is the variation among the groups in their ability to
manage risk. Several health plans said the rates were very low statewide, and the problem was
not unique to Orange County.
d. Trends in Provider Participation and Network Development
CalOPTIMA’s structure strongly emphasizes the role of providers, as evidenced by the multiple
PHC arrangements that account for a majority of the enrollment (CalOPTIMA 1999). CalOPTIMA
estimates that the number of physicians serving Medi-Cal beneficiaries has increased significantly
25 Reportedly, too, hospital systems that operate facilities in both Orange and Los Angeles counties receive a higher rate of reimbursement in Orange County. In the Orange County model, hospitals are largely capitated directly by CalOPTIMA through the PHC arrangement. Under the two-plan model in Los Angeles County, health plans represent an intermediate layer of administrative costs between the capitation rate and the payment passed along to the network for hospital care.

79
under its system compared with the FFS system, from 1,900 total physicians in 1993 to an
estimated 4,000 in 1998.26
CalOPTIMA limits the number of networks in which a primary care
physician can participate to three, to minimize fragmentation of accountability. No such limit is
imposed on specialist physicians, reflecting CalOPTIMA’s attempt to resolve the historical problem
of beneficiaries, including the disabled, in gaining ready access to specialty services.
There are many traditional providers in the current system, in part because of CalOPTIMA’s
contractual requirement that plans and PHCs must include a certain number in their networks.
For some of these traditional providers, the transition to managed care has been difficult. One
community clinic director commented that when Medi-Cal managed care hit, a “feeding frenzy”
broke out. All of a sudden, there was a lot of competition for Medi-Cal patients. The clinic lost
many clients who opted to go to other providers. The clinic is just now rebuilding its Medi-Cal
base with the help of CalOPTIMA, which the clinic says recognizes the need to protect community
clinics and is providing the clinic with direct default assignment. Also, the traditional provider
network contracting requirements help the clinic’s situation.
Some traditional providers are finding that changes in their delivery systems are needed if
they are to remain competitive. For example, UCI Medical Center is now using more hybrid clinic
arrangements instead of the traditional resident-run model. In these newer models, the role of
the attending physician is heightened, and patients no longer see a different physician each time
they visit the clinic. The restructuring was prompted not only by Medi-Cal but also by changes
in Medicare requirements. Further, some observers note that Medi-Cal beneficiaries no longer
tolerate features that they found undesirable in the traditional delivery settings, such as long wait
times. Now that they have a choice in providers, they are selecting those that best accommodate
their individual needs.
e. Administration and Oversight
The manner in which administrative and oversight responsibilities are carried out is consistent
with the structure of Orange County’s COHS model, as reflected in Figure 2. DHS oversees
CalOPTIMA, which in turn is responsible for its network of subcontractors. CalOPTIMA delegates
certain activities such as utilization management, quality assurance, and credentialing to its
subcontractors, but it performs other administration and oversight functions itself. These functions
include carrying out quality studies, assessing financial solvency, conducting compliance audits,
and monitoring the network. The state conducts an annual audit of CalOPTIMA and each
26 CalOPTIMA is in the process of updating its provider counts.
80
subcontractor. The subcontractors are responsible for the individual network of providers. IPAs
and medical groups participating through either an HMO or a PHC arrangement are responsible
for their individual contracted physicians. Table 13 lists the key requirements that subcontractors
must comply with to participate in the CalOPTIMA model.
Several people we talked with discussed the advantages and disadvantages of the
administrative and oversight functions performed by an intermediary entity such as CalOPTIMA.
A key advantage is oversight by a local organization and not some faraway entity making arbitrary
decisions. Being local, CalOPTIMA better understands the unique features of the market and
can respond to changing conditions more quickly and more appropriately. From the beginning,
CalOPTIMA has been perceived as a community effort with local control. The Orange County
structure is also more attractive to providers than are other models, such as GMC, because
providers can contract for Medi-Cal business through CalOPTIMA without having an HMO in the
middle. One important disadvantage is the potential for additional requirements to be imposed by
an intermediary organization such as CalOPTIMA. Some providers feel they are constantly being
audited by CalOPTIMA for one reason or another (e.g., specialist payment, credentialing, patient
educational materials, cultural competency). Providers are unable to discern a state or federal
requirement from a CalOPTIMA requirement.
Beyond the distinction between CalOPTIMA versus state or federal requirements, the perceived
burden of participating in the Medi-Cal program appears to be an issue for many plans and
providers, who say that demands keep growing, but the payment rates keep getting smaller.
Unless there is a large Medi-Cal enrollee base, compliance may be very difficult can outcome that
some view in fact to be desirable because it reflects legitimate economies of scale.
Of the CalOPTIMA participation requirements, submitting encounter data and the 120-day
health assessment are viewed as especially problematic. Although CalOPTIMA requires the
encounter data from its subcontractors, it does not get it consistently, nor is it in a standardized
format when it is received. Furthermore, CalOPTIMA’s system for encounter data submission
has not yet passed the testing stage with DHS, even though other similar organizations with less
experience have fully operational systems and are submitting relatively complete information.
The most significant problem appears to be getting the information from the primary source of
care. Several subcontractors said it is difficult to get physicians to provide the information. This
is because physicians don’t understand why, under capitation, they have to complete encounter
forms if this process is no longer the trigger for payment as it was in the FFS system. Physicians

81
also complain that the encounter data requirements are both costly and time-consuming and they
are not compensated for the extra work. DHS acknowledges that it too has had problems with
encounter data systems and processes, and as a result it has formed a statewide work group to
address the issue.
For some subcontractors, the 120-day initial health assessment requirement has also been a
problem. To comply, subcontractors must perform a health assessment on new members within
120 days of enrollment. Subcontractors noted that it is not always easy to get enrollees into the
office, either because they can’t be reached or because they refuse.
In addition to the specific program requirements discussed, subcontractors commented on
the continuing and frequent demands by either the state or CalOPTIMA for information. While
subcontractors view Health Employer Data and Information Set (HEDIS) and National Committee
for Quality Assurance (NCQA) requirements as relatively straightforward, plans say that with Medi-
Cal they are subjected to frequent audits and medical record requests, which are administratively
and financially burdensome (one hospital provider said, for example, that a medical record request
may cost up to $45 per chart), and they have concerns about discrimination and services being
inappropriately withheld from Medi-Cal patients.
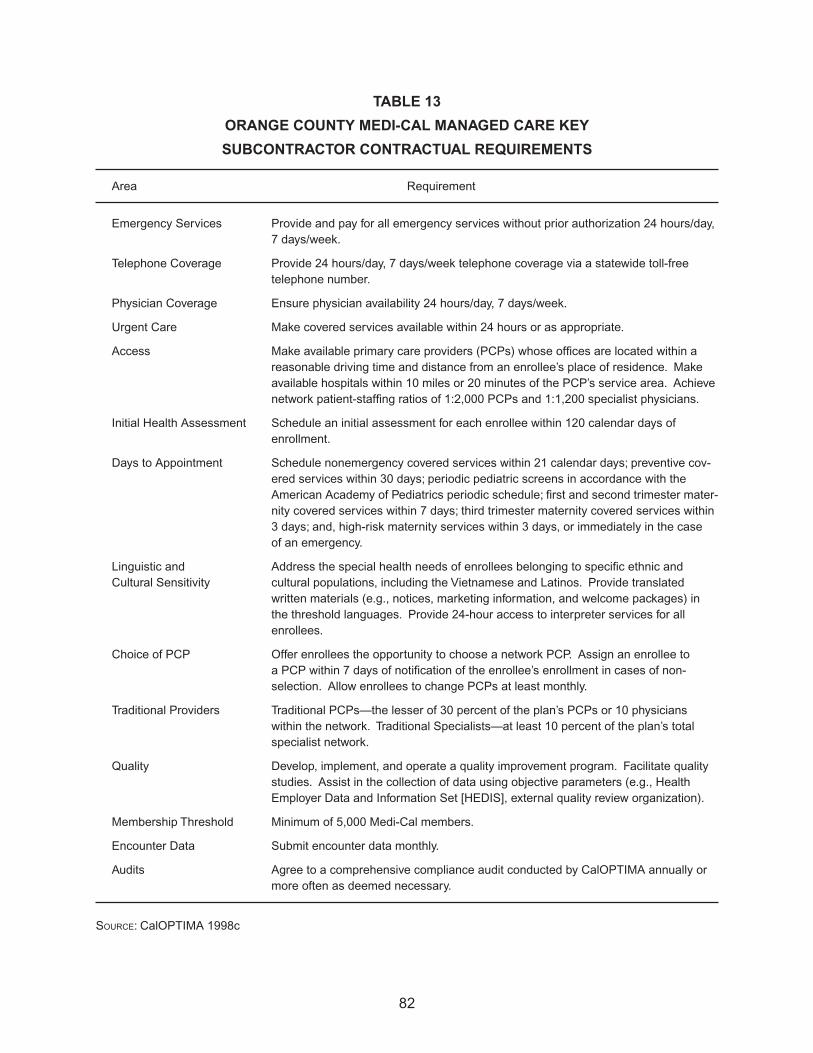
82
TABLE 13
ORANGE COUNTY MEDI-CAL MANAGED CARE KEY
SUBCONTRACTOR CONTRACTUAL REQUIREMENTS
Area Requirement
Emergency Services Provide and pay for all emergency services without prior authorization 24 hours/day, 7 days/week.
Telephone Coverage Provide 24 hours/day, 7 days/week telephone coverage via a statewide toll-free telephone number.
Physician Coverage Ensure physician availability 24 hours/day, 7 days/week.
Urgent Care Make covered services available within 24 hours or as appropriate.
Access Make available primary care providers (PCPs) whose offices are located within a reasonable driving time and distance from an enrollee’s place of residence. Make available hospitals within 10 miles or 20 minutes of the PCP’s service area. Achieve network patient-staffing ratios of 1:2,000 PCPs and 1:1,200 specialist physicians.
Initial Health Assessment Schedule an initial assessment for each enrollee within 120 calendar days of enrollment.
Days to Appointment Schedule nonemergency covered services within 21 calendar days; preventive cov-ered services within 30 days; periodic pediatric screens in accordance with the American Academy of Pediatrics periodic schedule; first and second trimester mater-nity covered services within 7 days; third trimester maternity covered services within 3 days; and, high-risk maternity services within 3 days, or immediately in the case of an emergency.
Linguistic and Address the special health needs of enrollees belonging to specific ethnic and Cultural Sensitivity cultural populations, including the Vietnamese and Latinos. Provide translated
written materials (e.g., notices, marketing information, and welcome packages) in the threshold languages. Provide 24-hour access to interpreter services for all enrollees.
Choice of PCP Offer enrollees the opportunity to choose a network PCP. Assign an enrollee to a PCP within 7 days of notification of the enrollee’s enrollment in cases of non-selection. Allow enrollees to change PCPs at least monthly.
Traditional Providers Traditional PCPs—the lesser of 30 percent of the plan’s PCPs or 10 physicians within the network. Traditional Specialists—at least 10 percent of the plan’s total specialist network.
Quality Develop, implement, and operate a quality improvement program. Facilitate quality studies. Assist in the collection of data using objective parameters (e.g., Health Employer Data and Information Set [HEDIS], external quality review organization).
Membership Threshold Minimum of 5,000 Medi-Cal members.
Encounter Data Submit encounter data monthly.
Audits Agree to a comprehensive compliance audit conducted by CalOPTIMA annually or more often as deemed necessary.
SOURCE: CalOPTIMA 1998c

83
3. Early Insights on Effects on Access and the Safety Net
In this section, we look at the initial effects of Orange County’s Medi-Cal initiative on access
and the safety net, to the extent it can be currently assessed from available information.
a. Access
Advocates, plans, providers, and other market observers appear to agree that access has
improved for Medi-Cal beneficiaries under CalOPTIMA. They say that beneficiaries complain less
now than under FFS that they are unable to find a provider willing to treat them. This is consistent
with the significant increase (111 percent) in the total number of physicians available under the
CalOPTIMA system.
Anecdotal evidence of improvement is also cited by an advocate who has a client in need of
ongoing specialty services because of the onset of blindness. Under the FFS system, the client
had difficulty getting access to the necessary care because she could not locate a provider who
specialized in treating the condition or who would provide a referral. Once she was enrolled in
CalOPTIMA, the client was referred to a physician in Los Angeles who is providing the necessary
specialty care. We also heard from community clinics about improved access. They say that
referrals under CalOPTIMA are less problematic than in FFS because there is a system in place,
which includes an expanded network of specialist physicians and a formal process that works well.
b. Safety Net and Spillover Effects
Orange County relies primarily on UCI Medical Center and Children’s Hospital, both tertiary
care facilities, to fill the void created by the absence of a county-operated health care system.
In addition to these facilities, several other hospitals that receive DSH funding are treating a high
volume of low-income and indigent patients. Beyond the hospitals, 16 community and free clinics
operating in the county, including one FQHC, also make up the safety net. But most community
clinics are small, relying heavily on a volunteer staff. The clinics are also limited in their capacity
to provide specialty services, a situation that is exacerbated by their increasing inability to refer
the uninsured to facilities such as UCI Medical Center, which is no longer accepting such referrals
carte blanche (Gordon 1999).
A key concern is the county’s situation with its more than 500,000 uninsured persons (Gordon
1999). In an initial step to understand better the health needs of the county’s population, and in
particular the needs of the uninsured, the health care community in the county recently completed
a countywide needs assessment. The results had not been released at the time of our visit. The

84
project was sponsored by various organizations representing the county’s health care community,
including CalOPTIMA, plans, providers, and the county’s health care agency. A primary objective
of the effort was to obtain a more accurate assessment of the size and characteristics (e.g.,
demographic) of the county’s uninsured population (Los Angeles Times 1999). Sponsors hope to
use the study to get the Orange County Board of Supervisors to apply the full tobacco settlement
amount to pay for health care services for the uninsured. Over the next 25 years, the county is
projected to receive $900 million from the settlement.
Another growing issue pertains to the county’s medically indigent population. Under California
law, each county is responsible for providing medical care to its medically indigent residents.
California has a history of including the medically indigent population in Medi-Cal, but because
of budget constraints during the 1980s, responsibility was transferred to the counties. In Orange
County, uninsured, low-income adults who are ill or injured and require medical attention can
qualify for the county’s program and have their medical services paid for on a proportional FFS
basis. Coverage for this population’s medical care is currently administered by the county through
its Medical Services for Indigents (MSI) program. CalOPTIMA, however, is under increasing
pressure, primarily by the county, to assume responsibility for the medically indigent.
The county’s MSI population is made up of approximately 20,000 adults ages 21 to 64 with
incomes below 200 percent of the FPL.27
Individuals access MSI benefits through a hospital,
community clinic, or physician provider where they go for the treatment of an illness or injury. The
conditions requiring treatment may be either acute or chronic in nature. Coverage for services is
not diagnosis-specific; the only clinical requirement is that patients must be ill or injured at the time
they present for treatment. There is no coverage under the MSI program for preventive services.
MSI eligibility is established by the Orange County Social Services Agency and is approved for
six months at a time (Orange County 1998).
State realignment funds, primarily from sales taxes, finance the MSI program. There is no
significant funding of the program through either local or county money. County officials told us
that the MSI program has an annual budget of $40 million, with 75 percent allocated for hospital
care and the remaining 25 percent for physician services.
27 The 20,000 represents only those adults who have been identified as being eligible for the MSI program. The actual number of adults in Orange County eligible for the program may be much higher.

85
Getting physicians to participate in the MSI program has been difficult because of the
historically low rate of reimbursement (Gordon 1998). One advocate estimated that physician
reimbursement under the MSI program runs between 10 and 30 percent of the amount billed.
But others say that while this may be the perception, the rate of reimbursement is actually much
higher, reaching 90 percent of Medicare’s RBRVS in the 1997–1998 fiscal year, a payment level
that is expected to continue at least through 1999 (Roth 1999).28
Reportedly, however, physicians
treating the MSI population often write off the related charges rather than attempt to collect from
the program because they perceive that the costs of collection exceed any payment they might
receive.
CalOPTIMA recently submitted a proposal to conduct a two-year pilot program for 1,000 of the
MSI program’s chronically ill persons. The county, which wants CalOPTIMA to take over the entire
MSI program, did not accept the proposal (Gordon 1998). There are multiple perspectives on the
issue of integrating a point-of-service indigent care program into a full-scope Medicaid managed
care program. Representatives from the county’s health care agency and other market observers
told us that one of the fundamental expectations in establishing CalOPTIMA was that the model
would eventually provide a systematic approach to care delivery for both Medi-Cal beneficiaries
and the medically indigent. Although CalOPTIMA acknowledges this expectation for the MSI
population, officials also note the challenges involved. Both CalOPTIMA and other stakeholders
are concerned about the potential financial risk of integrating a population whose utilization and
cost experience under managed care is not only unknown, but difficult to project. In addition,
there is the concern that moving the MSI program into a managed care model will create a
more visible system with better defined and improved access to care for indigent patients. These
changes may result in a “woodwork effect,” bringing out more indigent patients than are currently
being served by the county’s MSI program. Finally, CalOPTIMA has concerns about whether the
state and federal governments will allow Medicaid funds to be used to cross-subsidize a county-
level effort for indigent care.
28 In the 1997–1998 fiscal year, the initial rates of reimbursement under the MSI program were 60 percent and 40 percent of Medicare’s RBRVS for surgical codes and medical codes, respectively. At the end of the year, however, the MSI program had funds remaining, which were paid out, bringing the total payment rate to approximately 90 percent of RBRVS. The 90 percent effective payment rate was expected to continue through at least 1999. Beginning in the 1999–2000 program year, the rate of reimbursement for surgical codes is slated to increase to 80 percent (from the previous 60 percent) of the RBRVS (Roth 1999).
86
Other concerns for the uninsured and medically indigent result from increased pressure on
the existing safety net. First, safety net providers are increasingly less able to cross-subsidize
care of the indigent from other lines of business such as Medi-Cal. For example, much of the
community clinics’ business has traditionally been a Medi-Cal and indigent mix. Providers say that
payment received for treating Medi-Cal beneficiaries was higher under FFS than under managed
care and was used to subsidize care for the indigent population. But declining Medi-Cal rolls,
coupled with low capitation payments, are increasingly limiting the ability to cross-subsidize care.
Consequently, clinics rely more on funding from other sources such as private grants and fund-
raising, which does not always provide a consistent and reliable influx of funds.
Second, the way in which DSH payments are determined has generated financial risks. By
state policy, additional DSH subsidy is based on higher inpatient days. But under a capitated
payment system that is designed to reduce inpatient days, DSH funding decreases as inpatient
days decline. The larger safety net hospitals in Orange County have seen significant declines
in their Medi-Cal days under managed care. As examples, Medi-Cal patient days declined by
66 percent at CHOC and by 48 percent at UCI Medical Center from 1993 through 1997 (Warren
1998). This, coupled with the anticipated federally mandated reductions in DSH funding, is
expected to further hurt the financial health of these hospitals.
Finally, some providers are moving away from their traditional safety net roles. Traditional
providers such as UCI Medical Center, which have historically treated a disproportionate share
of the county’s indigent population, are no longer willing to continue in this capacity, arguing that
other hospitals and providers also need to share the responsibility (Gordon 1999). UCI Medical
Center’s leadership told us that the hospital is strategically repositioning itself in an attempt to
move away from its traditional safety net role toward one that is more balanced, with the objective
of improving its overall financial condition. To accomplish this, the hospital is working to change
its payer mix by relying less on Medi-Cal and attracting a larger base of commercial and Medicare
business, while at the same time being careful not to change the mix so much that it jeopardizes
DSH funding. But as UCI Medical Center moves away from its safety net role, some observers
say that CalOPTIMA will be required to rethink its support of the facility through the default
assignment process.

87
E. CONCLUSIONS
California is a large and diverse state, and its approach to Medi-Cal managed care reflects this
complexity. Instead of a single statewide strategy, California is implementing Medi-Cal managed
care using a multi-model approach individualized to each participating county. Most counties’
initiatives are designed from one of three basic models (COHS, GMC, and two-plan), which are
customized to incorporate the unique circumstances of the local markets. Medi-Cal managed
care currently operates in 26 counties in California. Since our visit in 1994, the number of
Medi-Cal beneficiaries enrolled in managed care has increased by 155 percent. Nearly 2.4
million beneficiaries are now enrolled in managed care, representing 46 percent of the Medi-Cal
population (DHS 1999a; Medi-Cal Policy Institute 1998a).
Although California’s Medi-Cal managed care approach provides significant opportunity for
innovation, particularly at the local level, it is also accompanied by challenges. Administration and
oversight of not only multiple, but differently constructed, initiatives is very difficult. Because no
two initiatives are exactly alike, there is also less aggregated experience to guide other counties
as they move ahead with Medicaid managed care. Counties need sufficient resources and
technical skills to support their efforts. At the state level, expanded knowledge and skills are also
required to manage these multiple efforts. In systems that are already constrained financially and
otherwise, the acquisition and retention of these additional resources may be problematic.
But California’s Medi-Cal program and other efforts targeting low-income populations face
additional challenges. Key among these are low Medi-Cal capitation rates, declining Medi-Cal
enrollment, and growing numbers of uninsured. Public charge, ethnic and cultural diversity, and
a new political climate also pose challenges for the state. Because of the ongoing changes in the
Medi-Cal context, further monitoring of the state’s response to these challenges is essential.
1. Our Site Visit Counties—Los Angeles and Orange
As we noted at the outset, our approach in this case study of California is different from the
approach of previous studies we have conducted. Instead of focusing on the whole state, as the
other case studies have done, here we specifically focused on Los Angeles and Orange counties,
to obtain a richer understanding of how the county-by-county approach plays out in California.
Los Angeles and Orange counties were selected because they have the two largest Medi-Cal
managed care initiatives in the state and they have at least a year’s operating experience.
88
a. Los Angeles County
In Los Angeles County, the existence of a large, publicly sponsored health care system led
to the implementation of the two-plan model, a model that is primarily designed to protect the
safety net and improve access. In Los Angeles, this design largely translates into L.A. Care’s
contractual obligation to the county, which guarantees the county 165,000 lives (100,000 for the
county-owned HMO [CHP] and 65,000 for other plans working through the county’s system). The
guarantee is an integral component of the county’s efforts to restructure its health care system
under a Section 1115 federal waiver, which through the federal government is also providing
monetary assistance to the financially tenuous system (L.A. DHS 1999a, 1999b). Because of the
guarantee, CHP receives the majority of default assignment from L.A. Care in the Los Angeles
model (DHS 1998b). Because of the high level of default assignments coupled with high rates of
beneficiary choice for Blue Cross and Health Net (including its subcontractors), these plans play
dominant roles and drive market dynamics.
There are other complexities of the Los Angeles model as well. Enrollment is large,
encompassing nearly 1 million Medi-Cal beneficiaries even though the initiative does not include
all eligibility groups, such as the SSI population (DHS 1999a). Besides the large-scale enrollment,
further complexity results from the multiple layers within the model, as well as within the
numerous participating plans and providers. Risk is passed throughout the model, as are
certain administrative and oversight responsibilities. Market observers are concerned that some
participants are assuming risk and other responsibilities without having the necessary expertise to
manage it properly. Plans and providers generally perceive program requirements as burdensome,
a situation exacerbated by low Medi-Cal capitation rates.
By most accounts, access under the two-plan model in Los Angeles has improved as the
number of participating physicians appears to have increased. Preliminary evidence on managed
care’s impact on the safety net indicates some difficulties. The county’s publicly sponsored
health care system, coupled with a system of community clinics, make up the safety net. But
many of these clinics were late entering managed care and now find themselves locked out of
provider networks, limiting their participation in Medi-Cal and eroding their Medi-Cal client base.
The decline in Medi-Cal business comes at a time when payment rates have decreased under
managed care and the numbers of uninsured continue to grow. The combined effect intensifies
the pressure on an already fragile safety net.
89
With just over a year’s operational experience, it is too early to determine how well Los
Angeles County’s two-plan model will perform. Most of those interviewed, however, agree that
there is much uncertainty about the model’s future. Consequently, important questions that
require further monitoring include:
* Will the two-plan model structure prove viable over the long run?
* Will the plans currently driving the dynamics within the market remain the same (e.g., CHP,
Blue Cross, and Health Net and its subcontractors)? Will default assignment continue to
favor CHP?
* Will the transfer of risk to provider entities continue as is? How successful will plans and
providers be in managing risk?
* What influence will Los Angeles County’s low Medi-Cal capitation rates and extensive
program requirements have on plan and provider participation?
* Will evidence emerge to provide an empirical basis for assessing how beneficiaries
ultimately are affected in diverse ways by the shift to managed care?
* How will the county’s publicly sponsored health care system perform under its Section
1115 federal waiver?
* How will the safety net fare under Medi-Cal managed care?
b. Orange County
In comparison with Los Angeles, the Medi-Cal managed care initiative in Orange County
seems less complex, even though it is still complex. This may reflect the major role of PHCs (the
PSO look-alikes) in the model, which provide a mechanism for CalOPTIMA to contract directly
with providers without an HMO middleman (CalOPTIMA 1998b). While PHCs are an innovative
component of the CalOPTIMA model, their ability to successfully manage risk is uncertain. For
the physician side of the arrangement, preliminary indications are that some IPAs and medical
groups are struggling to meet their financial obligations, which is of particular concern, considering
the low Medi-Cal capitation rates. By reducing the number of subcontractors from the current
17 to 12, CalOPTIMA hopes to simplify the model’s administrative costs and the complexity of
choices available to beneficiaries. CalOPTIMA does not expect the reduction to create access
problems, but the situation requires further monitoring.
90
There are other complexities associated with the CalOPTIMA model. Enrollment is large, with
just under 200,000 beneficiaries (DHS 1999a). The model incorporates SSI beneficiaries, who,
because of their disabling conditions, often have more extensive and different needs compared
with the AFDC population. As in Los Angeles County’s experience, plans and providers in Orange
County view capitation rates as too low and program requirements as overly demanding.
With the significant increase in the number of physicians participating in the CalOPTIMA
model, access appears to have improved, compared with FFS. Unlike Los Angeles, there is no
publicly sponsored safety net. UCI Medical Center, CHOC, and a system of small community
clinics are the predominant safety net providers in Orange County. Preliminary indications point
to some erosion in the county’s safety net. Traditional, large safety net providers such as UCI
Medical Center appear to be moving away from this role, desiring instead to focus on other
business opportunities.
CalOPTIMA doesn’t think pressure to take on the responsibility for the county’s medically
indigent will abate. The issue is a key concern, particularly as the numbers of uninsured increase.
The issue appears to be creating tension between CalOPTIMA and the county’s health care
agency. Many of those interviewed believe that a resolution on the medically indigent population
that considers the interests of both parties must be found soon.
The consensus among those interviewed in Orange County is that CalOPTIMA’s operational
priorities are changing. After operating for more than three years, CalOPTIMA is now changing
from a start-up organization to an organization dealing with day-to-day operational issues. The
context is very different, and it requires very different skills. CalOPTIMA’s context may also
change when it receives a Knox-Keene license, which will provide the organization with new
business opportunities. Change appears to be inevitable for CalOPTIMA, and it requires further
monitoring, especially as it relates to the following questions:
* What is the viability of the COHS model over time?
* Will PHCs continue to dominate in Orange County?
* Will access (especially to mainstream providers) be affected by reducing the number of
subcontractors?

91
* How will SSI beneficiaries fare in CalOPTIMA over the long run?
* How effectively will participating plans and PHCs manage risk?
* What will be the consequences of low capitation rates coupled with extensive demands in
Orange County’s initiative?
* How will the safety net evolve?
* Who will assume responsibility for the county’s medically indigent, and how will services
be provided?
* How will CalOPTIMA manage the transition from being a start-up operation to one focused
more on day-to-day operations?
* What effect will CalOPTIMA’s receipt of its HMO license have on its role in the Medi-Cal
program?
2. General Lessons from Los Angeles and Orange Counties’ Experiences
Although the Medi-Cal managed care initiatives in Los Angeles and Orange counties are
different, general lessons can derived from both experiences.
a. Implementation Takes a Long Time, a Lot Longer Than One Thinks
Implementation of any Medicaid managed care initiative requires a substantial commitment of
resources, both financial and human, for a protracted period of time. In Los Angeles, five years
elapsed from the release of the state’s 1993 strategic plan calling for the implementation of the
two-plan model in the county to its actual start-up in 1998 (Marquis 1997b; Sparer et al. 1996).
With just over a year’s experience, Los Angeles County’s two-plan model is still very much a
start-up operation. It will be some time yet before its operational focus is more day-to-day.
Similarly, it took several years for the COHS model to be implemented in Orange County.
Although the expansion of the COHS model was legislated in 1991, the Orange County initiative
did not get under way until four years later, in 1995 (DHS 1999a; Sparer et al. 1996). Now, more
than three years since it enrolled its first wave of beneficiaries, CalOPTIMA is just beginning to
move from being a start-up operation to an organization dealing with more day-to-day issues.
92
b. A Lot of Different People Have to Be Brought Along, Each Needing to Understand
the Initiative
Implementation of Medicaid managed care affects many different people, all with varying
levels of understanding and needs. For beneficiaries, effective and well-targeted education and
outreach efforts are essential. Otherwise, change can be very confusing and frightening, and
the likelihood of problems substantially increases. In Los Angeles, there were numerous delays
with the initiative’s implementation because of concerns by HCFA and others in the community
that beneficiary education and outreach efforts were weak (American Healthline 1997a, 1997b;
Marquis 1997a, 1997b; Kertesz and Shinkman 1997). During the first two years of Medi-Cal
managed care in Orange County, SSI beneficiaries reportedly encountered problems accessing
and using services under the CalOPTIMA system. Especially among the advocacy community,
there were concerns that SSI enrollees had not been adequately prepared to navigate a managed
care system (Warren 1998; Marsh 1996).
Advocates, plans, providers, and the community at large require an open dialogue and a
forum for an ongoing sharing of information. New relationships have to be forged, and trust has to
be developed among all of the stakeholders. There also has to be a significant commitment from
all for implementation to go smoothly, and more important, for the initiative itself to be successful
over time. In California generally, advocates have criticized the state for developing the various
Medi-Cal initiatives without what they perceive as input from key stakeholders. In Los Angeles
especially, advocates have criticized the lack of community involvement in the initiative. For
example, they say community-based organizations have not been appropriately utilized to assist
with the enrollment process (Medi-Cal Community Assistance Project 1997). Other advocate-
initiated activities, including the audit of DHS’s quality oversight of plans participating in Medi-
Cal and report cards on plan performance in Los Angeles County, are a response to a perceived
lack of information from the state to assist the public in evaluating the quality and performance of
participating health plans.
c. Regardless of the Initiative, There Are Similar Challenges to Be Faced
Every Medicaid initiative requires some common design decisions, including program eligibility,
managed care strategy, enrollment, and administration. While their individual models vary, each
of these factors was considered in designing the initiatives in Los Angeles and Orange counties.
Eligibility design requires a determination about which groups are to be covered under the
initiative, including any special provisions for exemptions. Safety net protections, contracting
requirements, payment method, and health plan and provider recruitment are all considerations in

93
developing the specific managed care strategy. Enrollment is another design feature that requires
decisions on method, beneficiary outreach and education, and method of default assignment.
Administrative and oversight policies, procedures, and methods are important design decisions
that also need to be made (Gold 1999).
d. The Markets in Los Angeles and Orange Counties Are Not as Advanced as
Thought
At least in the commercial managed care market, California is viewed as being a very
sophisticated state (Enthoven and Singer 1998; Sparer et al. 1996). It was surprising, therefore,
to find that the Medi-Cal managed care markets in both Los Angeles and Orange counties were
relatively immature. The anomaly seems to result from two factors. First, the mandatory initiative
in both counties is five times the size of voluntary enrollment before implementation. Operating
such large-scale initiatives is very different from operating the small programs that previously
existed. The change in scope requires substantially more sophisticated systems, which take time
to develop and mature.
Second, different types of providers serve the commercial versus the Medi-Cal markets. While
some crossover of providers occurs between the two markets, a very large group is Medi-Cal-
dominated or Medi-Cal-only. As designed, both Los Angeles and Orange counties’ initiatives
encompass a large volume of these traditional providers, many of whom have limited experience
with managed care. Their infrastructures were not designed for a managed care environment,
and many are struggling with the transition.
e. At Least Perceptually, the Public-Oriented Local Initiatives and COHSs Are
Different from Commercial Plans
In both Los Angeles and Orange counties, the perception is that L.A. Care and CalOPTIMA
are somehow different from the commercial plans participating in Medi-Cal managed care. The
general sentiment is that these two organizations should be held to a higher standard reflecting
a public stewardship of sortsCoverseeing the health care interests of the poor and indigent.
This perception may be rooted in the rationale behind the creation of the organizations. County
government played an integral role in the creation of both. L.A. Care was created to protect the
safety net. CalOPTIMA was established to provide managed care to Orange County Medi-Cal
beneficiaries, but the county sought to provide a unified system of care for the poor and indigent,
with linkages to health plans and providers that provide a virtual safety net.

94
The public-private difference, however, may be more than just perceptual. Both L.A. Care
and CalOPTIMA operate in a very open and public forum, with virtually every aspect of their
operations subject to public scrutiny. In our conversations with key stakeholders in both counties,
the “publicness” of L.A. Care and CalOPTIMA is clearly an expectation, perhaps grounded in
the Medicaid tradition of high public visibility. This is in sharp contrast to commercial plans such
as Health Net in Los Angeles. These plans’ operations are considerably less visible, and in Los
Angeles, interestingly, there appears to be less expectation of public scrutiny of a plan.
f. Complex Models Foster Further Complexity
The Medi-Cal managed care models in Los Angeles and Orange counties are both complex,
because of the large-scale initiatives that both counties have undertaken as well as unique
local circumstances reflected in the design. The complexity is evident by the multiple and often
overlapping layers that each model contains. But another dimension of complexity results from the
numerous model participants, including plans and providers whose idiosyncratic characteristics
and structures provide further influence and complication.
As we saw in both Los Angeles and Orange counties, the models foster further complexity.
For example, the manner in which risk is offloaded from one layer to another is quite complicated,
and trying to determine who exactly is financially responsible for a beneficiary’s care often results
in billing problems. Similarly, defining specific boundaries and responsibilities for administration
and oversight among and within the various layers becomes very complicated in these complex
models. Further, when the complexity increases, the likelihood of additional requirements and
duplicated efforts also increases.
In summary, California’s experience suggests that states can implement and concurrently
operate multiple, large-scale Medicaid managed care initiatives. The evidence from Los Angeles
and Orange counties provides key insight into how these initiatives may be designed, considering
unique local circumstances. But such differentiation comes with a price-the need for additional
resources to operate and manage diverse and complex models. California’s Medi-Cal managed
care strategy has been very ambitious, but eventually the state may realize that it must streamline
and simplify its approach, which will require some hard choices about what it can and cannot do.
Because most counties have limited operational experience in Medi-Cal managed care, it is too
early to determine whether California’s approach will prove successful.

95
REFERENCES
American Healthline. “California: L.A. County Managed Care Plan Hits Snag.” June 17, 1997a.
_____. “California: HCFA Delays New Managed Care Program.” July 28, 1997b.
Ben-Avi, A., R. Salit, and R. Schwalberg. “The Development of Capitation Rates Under Medicaid
Managed Care Programs: A Pilot Study. Volume II: State Summaries.” Washington, DC: The
Henry J. Kaiser Family Foundation, November 1997.
California Department of Health Services. “1998 Managed Care Annual Statistical Report.”
Sacramento, CA: DHS, Medical Care Statistics Section, March 1998a.
_____. “2-Plan Model Counties Enrollment, Disenrollment, & Defaults.” Sacramento, CA: DHS,
August 1998b.
_____. “Boilerplate Contract—Two-Plan Model Commercial Plan.” Sacramento, CA: DHS,
September 1998c.
_____. “Status of Managed Care—Summary by County.” Sacramento, CA: DHS, Medi-Cal
Managed Care Division, February 1999a.
_____. “M02 Monthly Enrollment/Disenrollment, Defaults, and Disenrollment by Reason.”
Sacramento, CA: DHS, April 1, 1999b.
California HealthCare Foundation. “California’s Uninsured: Understanding a Complex Issue.”
Oakland, CA: California Healthcare Foundation, February 1998.
California State Auditor. “Department of Health Services: Despite Shortcomings in the Department’s
Monitoring Efforts, Limited Data Suggest Its Two-Plan Model Does Not Adversely Affect
Quality of and Access to Health Care.” Sacramento, CA: California State Auditor, July 1999.
CalOPTIMA. “Health Plan Enrollment 1995–1996.” Orange, CA: CalOPTIMA, 1996.
_____. “Health Plan Enrollment 1997.” Orange, CA: CalOPTIMA, 1997.
96
_____. “Health Plan Enrollment 1998.” Orange, CA: CalOPTIMA, 1998a.
_____. “Through Better Health, a Better Community. 1998 Report to the Community.” Orange
County, CA: CalOPTIMA, 1998b.
_____. “HMO Contract for Health Care Services.” Orange, CA: CalOPTIMA, 1998c.
_____. “Health Plan Enrollment 1999.” Orange, CA: CalOPTIMA, 1999.
Casalino, L., and J. Robinson. “The Evolution of Medical Groups and Capitation in California.”
Menlo Park, CA: The Henry J. Kaiser Family Foundation, 1997.
Coye, M., and D. Alvarez. “Medicaid Managed Care and Cultural Diversity in California.” New
York, NY: The Commonwealth Fund, February 1999.
Enthoven, A., and S. Singer. “The Managed Care Backlash and the Task Force in California.”
Health Affairs. 17( 4): 95-110, July/August 1998.
Gold, M. “Making Medicaid Managed Care Research Relevant.” Health Services Research
33(6): 1639–1650, February 1999.
Gordon, D. “Managed-Care Test Project for Poor Residents Rejected.” Orange County Register,
November 5, 1998 (http://www.ocregister.com).
———. “Orange County Clinics Carry a Growing Burden.” Orange County Register, January 21,
1999 (http://www.ocregister.com).
Health Care Financing Administration (HCFA). “Medicaid Managed Care State Enrollment
June 30, 1996.” Washington, DC: HCFA, June 30, 1996.
_____. “Medicaid Managed Care State Enrollment June 30, 1997.” Washington, DC: HCFA, June
30, 1997a.
_____. “Medicaid Waivers.” Washington, DC: HCFA, 1997b.

97
_____. “Medicaid Managed Care State Enrollment June 30, 1998.” Washington, DC: HCFA,
June 30, 1998a.
_____. “California Title XXI State Plan Summary Fact Sheet.” Washington, DC: HCFA, March 24,
1998b.
Health Net. “Los Angeles Enrollment/Disenrollment Summary for February 1, 1999.” Los Angeles,
CA: Health Net, February 1, 1999.
The Henry J. Kaiser Family Foundation (KFF). “Medi-Cal Eligibility and Enrollment.” Washington,
DC: KFF, September 1998.
Holahan, J., S. Rangarajan, and M. Schirmer. “Medicaid Managed Care Payment Rates in 1998.”
Health Affairs 18(3): 217-227, May/June 1999.
Hoovers, Inc. “Los Angeles County Department of Health Services.” Austin, TX: Hoovers Online,
1998 (http://www.hoovers.com).
Hurley, R., D. Freund, and J. Paul. Managed Care in Medicaid. Lessons for Policy and Program
Design. Ann Arbor, MI: Health Administration Press, 1993.
Iglehart, J. “Medicaid and Managed Care.” New England Journal of Medicine 332(25): 1727-1731,
June 22, 1995.
Jaklevic, M. “Who Will Pay Up? FPA’s Chapter 11 Bankruptcy Filing Raises Doc Compensation
Issues.” Modern Healthcare 28(34): 16, August 24, 1998.
Joint Legislative Audit Committee (JLAC). “Analysis Fact Sheet—Medi-Cal Managed Care Two-
Plan Model Audit Request.” Sacramento, CA: JLAC, October 8, 1998.
The Kaiser Commission on Medicaid and the Uninsured (Kaiser Commission). “California:
Medicaid and Uninsured Facts.” Washington, DC: The Henry J. Kaiser Family Foundation,
1998.

98
Kertesz, L., and R. Shinkman. “Will It Work? L.A. Care Health Plan.” Modern Healthcare.
120–128, June 30, 1997.
L.A. Care. “Enrollment and Disenrollment by Plan Partner—September 1, 1998.” Los Angeles,
CA: L.A. Care, September 1, 1998a.
_____. “Enrollment and Disenrollment by Plan Partner—September 1, 1998.” Los Angeles, CA:
L.A. Care, November 1, 1998b.
_____. “L.A. Care Network Overview.” Los Angeles, CA: L.A. Care, 1999a.
_____. “Enrollment and Disenrollment by Plan Partner— February 1, 1999.” Los Angeles, CA:
L.A. Care, February 1, 1999b.
_____. “Enrollment and Disenrollment by Plan Partner— March 1, 1999.” Los Angeles, CA: L.A.
Care, February 1, 1999c.
Los Angeles County Department of Health Services (L.A. DHS). “Medicaid Demonstration
Project Annual Report Fiscal Year 1997/98.” Los Angeles, CA: L.A. DHS, 1999a.
_____. History of the 1115 Waiver. Los Angeles, CA: L.A. DHS, 1999b.
Los Angeles Times. “CalOPTIMA’s Success (editorial).” Metro Section, Orange County Edition,
p. B-10, November 15, 1998. [Q:Add web address?]
_____ (Orange County Commentary). “Windfall for Health Care. Millions to Come From Tobacco-
Related Funds.” February 14, 1999 (http://www.latimes.com).
Managed Risk Medical Insurance Board (MRMIB). “Affordable Health Care for Children and
Teens— Healthy Families Handbook.” Sacramento, CA: MRMIB, 1998.
_____. “Healthy Families Program—March 1999 Summary.” Sacramento, CA: MRMIB, 1999a
(http://www.mrmib.ca.gov).

99
_____. “Healthy Families Program—Subscribers Enrolled by County.” Sacramento, CA: MRMIB,
1999b (http://www.mrmib.ca.gov).
_____. “Healthy Families Program—Children Disenrollment Statistics.” Sacramento, CA: MRMIB,
1999c (http://www.mrmib.ca.gov).
_____. “Healthy Families Program—Subscribers Enrolled by Health Plan.” Sacramento, CA:
MRMIB, 1999d (http://www.mrmib.ca.gov).
_____. “Healthy Families Program—June 1999 Summary.” Sacramento, CA: MRMIB, 1999e
(http://www.mrmib.ca.gov).
Marquis, J. “Trepidation High as County Enters Managed Care Era.” Los Angeles Times, p. A-1,
March 31, 1997a.
_____. “County’s HMO Plan for Poor Approved.” Los Angeles Times, p. B-1, October 2, 1997b.
Marsh, B. “CalOPTIMA’s Rocky First Year Offers Lessons for Other Counties.” Los Angeles
Times, Orange County Edition, Business Section, p. D-6, July 21, 1996.
McCall, N., P. Turner, and G. Trapnell. “Analysis of California’s Two-Plan Medi-Cal Capitation
Rates.” Washington, DC: The Henry J. Kaiser Family Foundation, September 1998.
Medi-Cal Community Assistance Project. “Rush To Managed Care. The California Two-Plan
Model for Medi-Cal.” San Francisco, CA: Medi-Cal Community Assistance Project, March
1997.
Medi-Cal Policy Institute. “Understanding Medi-Cal: The Basics.” Oakland, CA: Medi-Cal Policy
Institute, 1998a.
_____. “Medi-Cal Facts: Share of Cost Medi-Cal.” Oakland, CA: Medi-Cal Policy Institute, August
1998b.
_____. “Medi-Cal Facts: The California Children Services Program (CCS) and Medi-Cal.” Oakland,
CA: Medi-Cal Policy Institute, August 1998c.
100
_____. “Medi-Cal Facts: Health Insurance Expansion for Children.” Oakland, CA: Medi-Cal Policy
Institute, June 1998d.
_____. “Opening the Door: Improving the Healthy Families/Medi-Cal Application Process (Executive
Summary).” Oakland, CA: Medi-Cal Policy Institute, October 1998e.
_____. “Medi-Cal Facts: Transitional Medi-Cal.” Oakland, CA: Medi-Cal Policy Institute, August
1998f.
_____. “Medi-Cal Facts: Section 1931(b) Medi-Cal.” Oakland, CA: Medi-Cal Policy Institute,
January 1999.
National Health Policy Forum (NHPF). “Plans and Providers: Risk, Accountability, and Staying
Power.” Washington, DC: NHPF, November 17–20, 1998.
Orange County. Medical Services for Indigents Provider Manual. 5th ed. Orange County, CA:
Health Care Agency, 1998.
Perry, M., E. Stark, and R. Valdez. “Barriers to Medi-Cal Enrollment and Ideas for Improving
Enrollment: Findings from Eight Focus Groups in California with Parents of Potentially Eligible
Children.” Menlo Park, CA: The Henry J. Kaiser Family Foundation, September 1998.
Roth, S. “MSI Physician Pay Levels to Increase under New Agreement.” The Bulletin. Orange
County: Orange County Medical Association, June 1999.
Rotwein, S., M. Boulmetis, P. Boben, et al. “Medicaid and State Health Care Reform: Process,
Programs, and Policy Options.” Health Care Financing Review 16(3): 104-120, Spring 1995.
Schauffler, H., and E. Brown. “The State of Health Insurance in California, 1998.” Los Angeles,
CA: UCLA Center for Health Policy Research, January 1999.
Shinkman, R. “MedPartners, Groups Closing in on a Deal.” Modern Healthcare, p. 4, April 19,
1999.

101
Sparer, M., M. Gold, and L. Simon. “Managed Care and Low-Income Populations: A Case Study
of Managed Care in California.” Washington, DC: The Henry J. Kaiser Family Foundation, May
1996.
Thompson, R., and R. Brown. “Medicare Beneficiaries and HMOs: A Case Study of the Los
Angeles Market.” Washington, DC: The Henry J. Kaiser Family Foundation, January 1998.
U.S. Bureau of the Census, Population Estimates Program, Population Division. “County
Population Estimates for July 1, 1998, and Population Change for July 1, 1997, to July 1,
1998.” Washington, DC: U.S. Bureau of the Census, 1998.
U.S. Department of Health and Human Services (DHHS), Administration for Children and Families.
“Change in Welfare Caseloads.” Washington, DC: DHHS, April 9, 1999.
Warren, P. “O.C. Largely Healing Service to Poor Patients.” Los Angeles Times, Orange County
Edition, p. A-1, October 25, 1998.[Q:Add web address?]
Western Center on Law and Poverty. “Immigrants and Health Care.” Health Consumer Alliance
Health Care Manual. Sacramento, CA: Western Center on Law and Poverty, 1999.
Zuckerman, S., T. Coughlin, L. Nichols, et al. “Assessing the New Federalism: Health Policy for
Low-Income People in California.” Washington, DC: The Urban Institute, 1998.


The Commonwealth Fund
1 East 75th Street,
New York, NY 10021
Tel: (212) 535-0400 Fax: (212) 606-3500
http://www.cmwf.org
The Henry J. Kaiser Family Foundation
2400 Sand Hill Road
Menlo Park, CA 94025
Tel: (650) 854-9400 Fax: (650) 854-4800
http://www.kff.org
Washington Office
1450 G Street, N.W., Suite 250
Washington, DC 20005
Tel: (202) 347-5270 Fax: (202) 347-5274
For additional copies of this report (#2169), please call
the Henry J. Kaiser Family Foundation publication request line
at 1-800-656-4533 or see http://www.kff.org.
Recommended