Magolego SNA - Lab 6
Contents
Motifs . . . . . . . . . . . . . . . . . . . . . . . . . . . . . . . . . . . . . . . . . . . . . . . . . . . . 1Visualisation . . . . . . . . . . . . . . . . . . . . . . . . . . . . . . . . . . . . . . . . . . . . . . . . 3Assortative Mixing . . . . . . . . . . . . . . . . . . . . . . . . . . . . . . . . . . . . . . . . . . . . . 17Basic network analysis pipeline . . . . . . . . . . . . . . . . . . . . . . . . . . . . . . . . . . . . . . 17
Motifs
Motifs are often defined as recurrent and statistically significant sub-graphs or patterns. Here, we considermotifs as sub-graphs of a given graph, which are isomorphic to defined sample.Here is our old beloved friend:
library('igraph')g = graph.famous("Zachary")
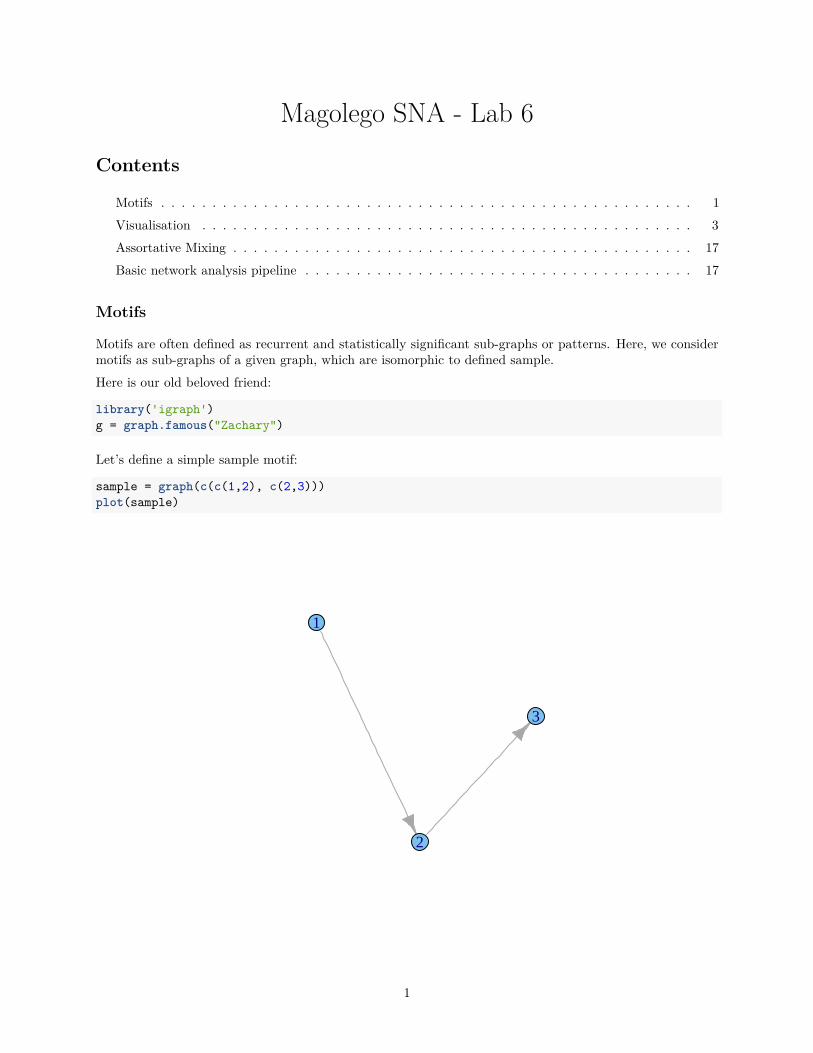
Let’s define a simple sample motif:
sample = graph(c(c(1,2), c(2,3)))plot(sample)
1
2
3
1

Now let’s calculate, if it is often in our graph:
isoclass_num = graph.isoclass(sample) # defining number of corresponding isoclassmotifs3 = graph.motifs(g, size = 3)motifs3[isoclass_num] # returns number of motifs
## [1] 45
Due to high computational time (isomorphism checks), graph.motifs are implemented for graps of sizes 3and 4 only. However, we can easy check numbers for all motifs of size 4 to find more frequent patterns:
motifs4 = graph.motifs(g, size = 4)
The most frequent pattern is fifth. Let’s draw it.
plot(graph.isocreate(size=4, number=5))
1
2
3
4
Not what we’re looking for.. Second most frequent (seventh):
plot(graph.isocreate(size=3, number=7))
2

1
2
3
That is certainly better.
Visualisation
There are currently three different functions in the igraph package which can draw graph in various ways:
• plot.igraph does simple non-interactive 2D plotting to R devices. Actually it is an implementation ofthe plot generic function, so you can write plot(graph) instead of plot.igraph(graph). As it used thestandard R devices it supports every output format for which R has an output device. The list is quiteimpressing: PostScript, PDF files, XFig files, SVG files, JPG, PNG and of course you can plot to thescreen as well using the default devices, or the good-looking anti-aliased Cairo device. See plot.igraphfor some more information.
• tkplot does interactive 2D plotting using the tcltk package. It can only handle graphs of moderatesize, a thousend vertices is probably already too many. Some parameters of the plotted graph can bechanged interactively after issuing the tkplot command: the position, color and size of the vertices andthe color and width of the edges. See tkplot for details.
• rglplot is an experimental function to draw graphs in 3D using OpenGL. See rglplot for some moreinformation.
Let’s draw a graph-ring using different three methods.
library(igraph)library(rgl)
3

g <- graph.ring(10)g$layout <- layout.circleplot(g)
1
2
34
5
6
7
8 9
10
#doesn't work in R Markdowntkplot(g)
## Loading required package: tcltk
## [1] 1
rglplot(g)
Layout
Either a function or a numeric matrix. It specifies how the vertices will be placed on the plot.Let’s demonstrate how it works on some graph. For example graph which based on barabashi model.
g <- barabasi.game(50)
• layout.auto - tries to choose an appropriate layout function for the supplied graph, and uses that togenerate the layout.
4

plot(g, layout=layout.auto, vertex.size=4,vertex.label.dist=0.5, vertex.color="red", edge.arrow.size=0.5)
1
23
4
5
6
7
8 9 1011
12
13
14
1516
17
18
19
20
21
22
23
24
25
26
27
28
2930
31
3233
34
35
36
37
38
39
40
41
42
4344
45
4647
48
49
50
• layout.random - simply places the vertices randomly on a square.
plot(g, layout=layout.random, vertex.size=4,vertex.label.dist=0.5, vertex.color="red", edge.arrow.size=0.5)
5

1
2
3
4
5
6
7
8
9
10
11
1213
1415
16
17
181920
21
22
23
24
25
26
27
28
2930
31
32
33
34
35
36
37
38
39
40
41
4243
44
45
46
4748
49
50
• layout.circle - places the vertices on a unit circle equidistantly.
plot(g, layout=layout.circle, vertex.size=4,vertex.label.dist=0.5, vertex.color="red", edge.arrow.size=0.5)
6

123
45
67
891011121314151617181920
2122
232425262728293031
32333435363738394041424344
454647484950
• layout.sphere - places the vertices (approximately) uniformly on the surface of a sphere, this is thusa 3d layout.
plot(g, layout=layout.sphere, vertex.size=4,vertex.label.dist=0.5, vertex.color="red", edge.arrow.size=0.5)
7

1
2
3
45
6
7
89
10
11
12
1314
15
16
17
18
1920
21
22
23
24
25 26
27
28
29
30
3132
33
34
35
36
3738
39
40
41
4243
44
45
46
47
4849
50
• layout.fruchterman.reingold uses a force-based algorithm proposed by Fruchterman and Reingold.
plot(g, layout=layout.fruchterman.reingold, vertex.size=4,vertex.label.dist=0.5, vertex.color="red", edge.arrow.size=0.5)
8

1
23
4
5
6
7
8
910
11
12
13
1415
16
17
18
19
20
21
22
23
24
2526
27
28
2930
31
32
33
34
35
36
37
38
3940
4142
43
4445
4647
48
49
50
• layout.kamada.kawai is another force based algorithm.
plot(g, layout=layout.kamada.kawai, vertex.size=4,vertex.label.dist=0.5, vertex.color="red", edge.arrow.size=0.5)
9

1
23
4
5
6
78
9
10
11
12
13
14
15
16
1718
19
20
21
22
23
24
2526
27
28
2930
31
32
33
34
35
36
37
38
39
40
41
42
4344
45
46
47
4849
50
• layout.spring is a spring embedder algorithm.
plot(g, layout=layout.spring, vertex.size=4,vertex.label.dist=0.5, vertex.color="red", edge.arrow.size=0.5)
10

1
23
4
5
6
7 89
10
11
12
13
1415
16
17
18
1920
21
22
23
2425 26
2728 29
3031
32
33
3435
36
37
38
39
40
414243
4445
46
47
48
49
50
• layout.fruchterman.reingold.grid is similar to layout.fruchterman.reingold but repelling force iscalculated only between vertices that are closer to each other than a limit, so it is faster.
plot(g, layout=layout.fruchterman.reingold.grid, vertex.size=4,vertex.label.dist=0.5, vertex.color="red", edge.arrow.size=0.5)
11
12
3
4
56
7
8910
11
12
13
14
15
1617
18
19
20
21
22
23
2425
2627
28
2930
31
3233
34
3536
37
38
39
4041
42
43
44
4546
4748
49
50
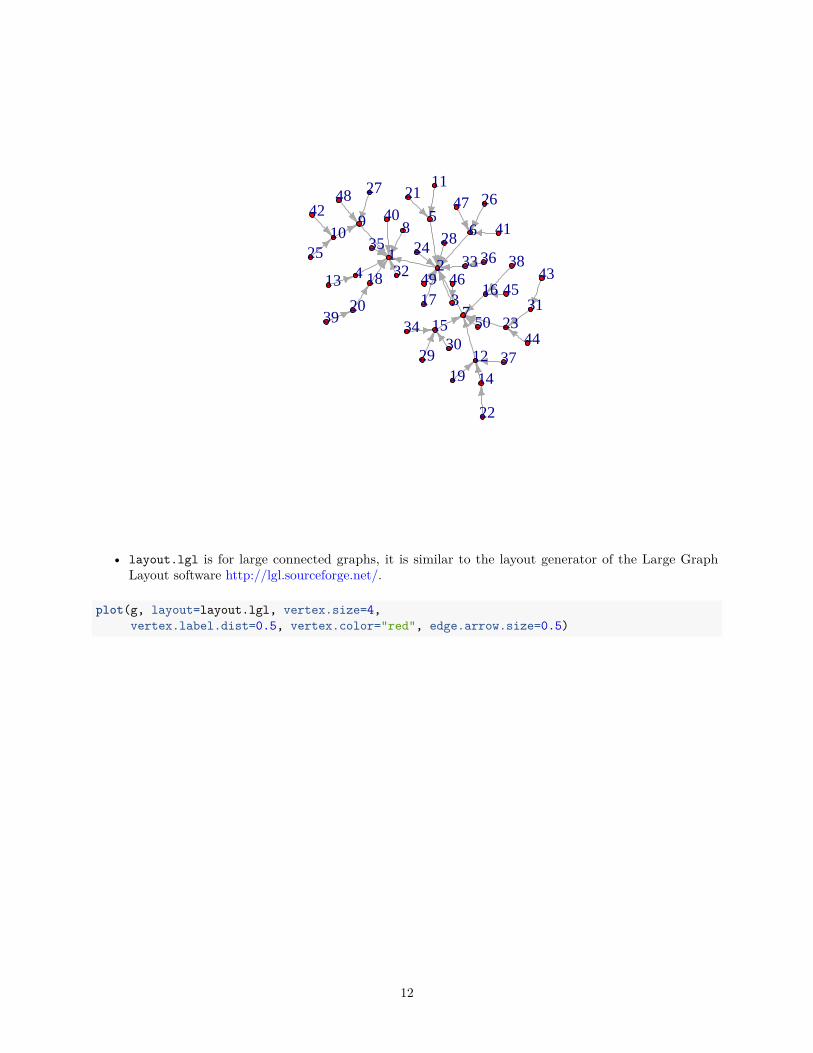
• layout.lgl is for large connected graphs, it is similar to the layout generator of the Large GraphLayout software http://lgl.sourceforge.net/.
plot(g, layout=layout.lgl, vertex.size=4,vertex.label.dist=0.5, vertex.color="red", edge.arrow.size=0.5)
12

1
23
4
5 6
7
8 910
11
12
13
14
15
16
17
18
19
20
21
22
23
24
25
26
27
2829
3031
32
3334
35
36
3738
39
4041
42
43
4445
46
47
48
49
50
• layout.graphopt is a port of the graphopt layout algorithm by Michael Schmuhl. graphopt version0.4.1 was rewritten in C and the support for layers was removed (might be added later) and a code wasa bit reorganized to avoid some unneccessary steps is the node charge (see below) is zero.
• layout.svd is a currently experimental layout function based on singular value decomposition.
• layout.norm normalizes a layout, it linearly transforms each coordinate separately to fit into the givenlimits.
• layout.drl is another force-driven layout generator, it is suitable for quite large graphs.
• layout.reingold.tilford generates a tree-like layout, so it is mainly for tree.
Highlight components
Let’s make different color for each graph component
g <- erdos.renyi.game(100, 1/100)
l <- layout.fruchterman.reingold(g)
op = par(mfrow = c(1,2))plot(g, layout=l, vertex.size=5, vertex.label=NA)
comps <- clusters(g)$membershipcolbar <- rainbow(max(comps)+1)
13

V(g)$color <- colbar[comps+1]
plot(g, layout=l, vertex.size=5, vertex.label=NA)
Highlight communities in graph
Let’s make different color for each community
g <- graph.full(5) %du% graph.full(5) %du% graph.full(5)g <- add.edges(g, c(1,6, 1,11, 6,11))
op = par(mfrow = c(1,2))plot(g, layout = layout.kamada.kawai)
com <- spinglass.community(g, spins=5)V(g)$color <- com$membership+1g <- set.graph.attribute(g, "layout", layout.kamada.kawai(g))plot(g, vertex.label.dist=1.5)
14

12
345
67
8 9
10
11
12
13
14
151
2
34
5
6
7
89
10
11
12 13
14
15
par(op)
Trees Visualization
plot(graph.tree(50, 2))
15

1
2
3
45
67
89
10
11
12
13
1415
16
171819
2021
2223
2425
2627
2829
3031
3233
3435
36373839
4041
4243
4445
4647
4849
50
We can use layout = layout.reingold.tilford to draw tree
plot(graph.tree(50, 2), vertex.size=3, vertex.label=NA, layout=layout.reingold.tilford)
16

tkplot(graph.tree(50, 2, mode="undirected"), vertex.size=10,vertex.color="green")
## [1] 2
Assortative Mixing
Assortative Mixing coefficient shows whether nodes with the same attribute values tend to form connections.Download Caltech.gml (or Caltech.mat) friendship network. Inspect nodes attributes and compute assortativitycoefficients with assortativity function
# Your code hereg <- read.graph(file = 'Caltech.gml', format = 'gml')assortativity.nominal(graph = g, types = V(g)$dorm+1, directed = F)
## [1] 0.3491531
Basic network analysis pipeline
The basic pipeline for exploratory graph analysis consists of:
Loading
See Seminar 1.
17
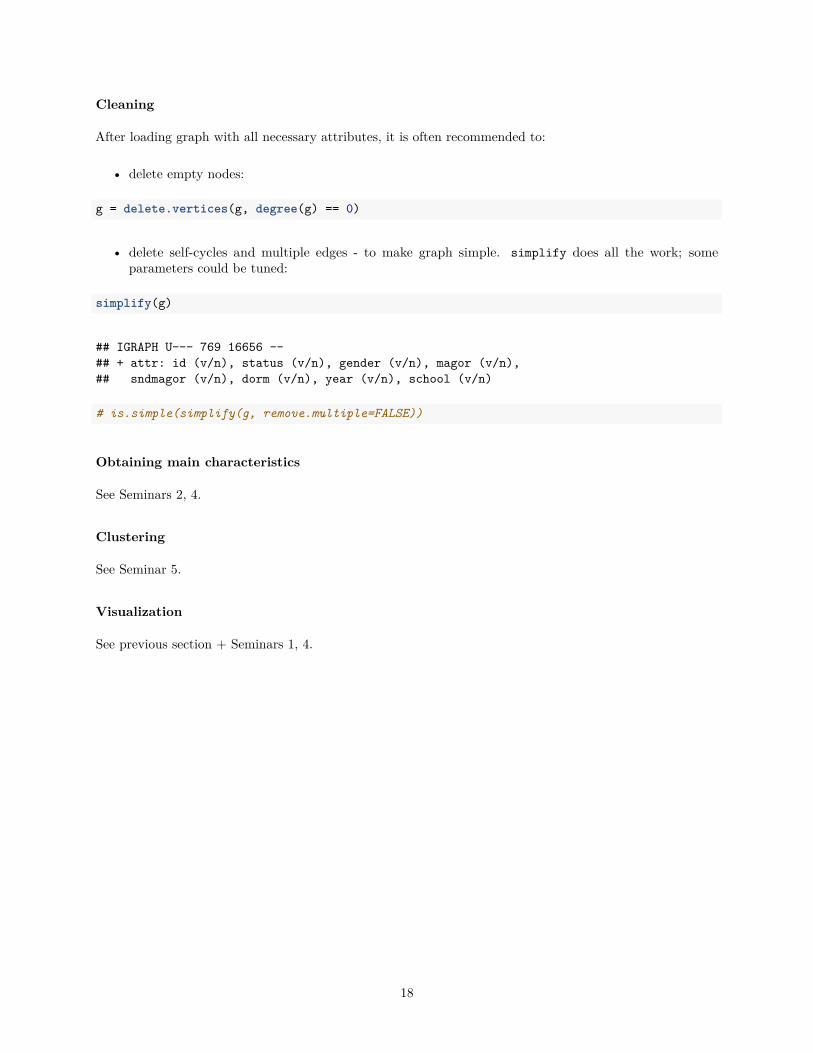
Cleaning
After loading graph with all necessary attributes, it is often recommended to:
• delete empty nodes:
g = delete.vertices(g, degree(g) == 0)
• delete self-cycles and multiple edges - to make graph simple. simplify does all the work; someparameters could be tuned:
simplify(g)
## IGRAPH U--- 769 16656 --## + attr: id (v/n), status (v/n), gender (v/n), magor (v/n),## sndmagor (v/n), dorm (v/n), year (v/n), school (v/n)
# is.simple(simplify(g, remove.multiple=FALSE))
Obtaining main characteristics
See Seminars 2, 4.
Clustering
See Seminar 5.
Visualization
See previous section + Seminars 1, 4.
18
Recommended