LUXURY GOODS WORLDWIDE MARKET STUDY, FALL–WINTER 2017
The New Luxury Consumer: Why Responding to the Millennial Mindset Will Be Key
By Claudia D’Arpizio, Federica Levato, Marc-André Kamel and Joëlle de Montgolfier

Copyright © 2017 Bain & Company, Inc. All rights reserved.
Claudia D’Arpizio and Federica Levato are Bain & Company partners based in the firm’s Milan office. Marc-André Kamel is a Bain partner in Paris, and he leads the firm’s Retail and Luxury practices in Europe, the Middle East and Africa. Joëlle de Montgolfier, also based in the Paris office, is the practice area senior director for Retail, Luxury and Consumer Products in EMEA. All four are leading members of Bain’s Global Retail and Luxury practices.
Luxury Goods Worldwide Market Study, Fall–Winter 2017 | Bain & Company, Inc.
Contents
Executive summary. . . . . . . . . . . . . . . . . . . . . . . . . . . . . . . . . . . . . . . . . pg ..1
1. Luxury spending trends in 2017 . . . . . . . . . . . . . . . . . . . . . . . . . . . . . . . . pg ..5
2. Regional highlights . . . . . . . . . . . . . . . . . . . . . . . . . . . . . . . . . . . . . . . . . pg ..9
3. Distribution trends. . . . . . . . . . . . . . . . . . . . . . . . . . . . . . . . . . . . . . . . . pg ..15
4. Customer shifts and individual category performance . . . . . . . . . . . . . . . . pg ..19
5. Outlook for the future . . . . . . . . . . . . . . . . . . . . . . . . . . . . . . . . . . . . . . pg ..23
Appendix. . . . . . . . . . . . . . . . . . . . . . . . . . . . . . . . . . . . . . . . . . . . . . . pg ..26
Page.i
Luxury Goods Worldwide Market Study, Fall–Winter 2017 | Bain & Company, Inc.
Page.ii
Luxury Goods Worldwide Market Study, Fall–Winter 2017 | Bain & Company, Inc.
Page.1
Executive summary
Luxury is back in fashion
The 16th edition of the Bain Luxury Study, published by Bain & Company for Fondazione Altagamma, the trade association of Italian luxury goods manufacturers, analyzed recent developments in the global luxury goods industry.
The overall luxury industry tracked by Bain comprises nine segments, led by luxury cars, luxury hospitality and personal luxury goods, which together account for more than 80% of the total market.
Considering all segments, the luxury market grew by 5% to an estimated €1.2 trillion globally in 2017. Sales of luxury cars continued to dominate the market, increasing by 6% to reach €489 billion in total. Luxury experiences remained very attractive to consumers, as illustrated by sales growth of high-end food and wine (both up 6% from last year), and sales of luxury cruises (up an impressive 14%).
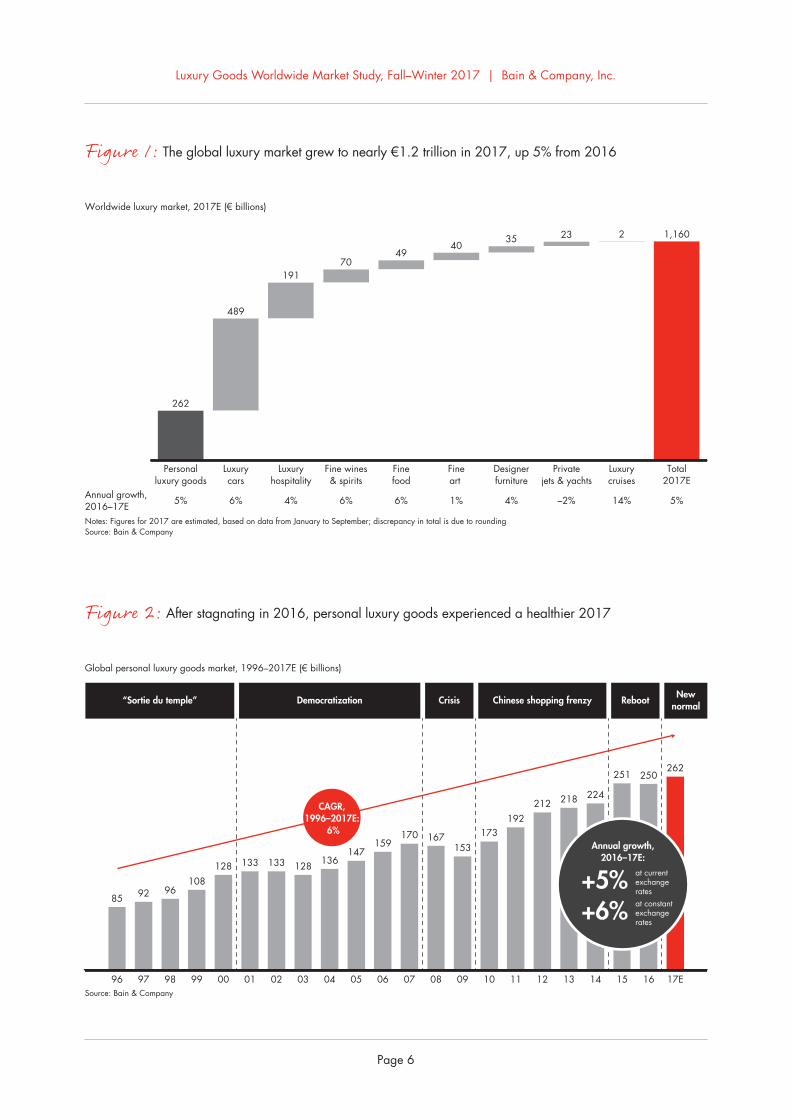
The market for personal luxury goods—the “core of the core” and the focus of this analysis—reached a record high of €262 billion, boosted by a revival of purchasing by Chinese customers both at home and abroad, as well as strong trends within other customer groups and in other regions. That represented 5% growth at current exchange rates, and 6% at constant exchange rates.
Personal luxury goods rebound, driven by sustained growth in key regions
Worldwide, the personal luxury goods market experienced growth across all regions, driven both by more robust local consumption (up 4%) and by strong tourist purchases (up 6%).
China was a clear top performer. Chinese consumption bounced back in 2017, fueled by renewed consumer confidence and the rapid emergence of a new—and increasingly fashion-savvy—middle class. Local buying by Chinese customers boosted sales in mainland China by a remarkable 15% at current exchange rates, to a total market size of €20 billion. Lower price differentials with the rest of the world also helped push the local market to new highs. Buying abroad increased, too. Globally, the share of personal luxury goods purchased by Chinese nationals reached 32% in 2017.
In Japan, the personal luxury goods market grew by 4% at current exchange rates, to €22 billion, boosted by a currency-driven rally in the second half of the year and increased spending by Chinese travelers.
Europe bounced back, growing by 6% at current exchange rates to reach €87 billion in sales and regain its place as the top region for luxury sales by value.
The American market (including both North and South America) struggled but managed to finish the year in positive territory, growing by 2% at current exchange rates. At €84 billion, it remains a crucial market for luxury brands.
Luxury Goods Worldwide Market Study, Fall–Winter 2017 | Bain & Company, Inc.
Page.2
Wholesale channels dominate, but retail is rising; online sales continue to climb
Wholesale remains the largest channel for personal luxury goods, accounting for roughly two-thirds of all sales. Yet the retail channel continued growing steadily—gaining 8% in 2017 alone—as companies increasingly seek to control the experience they deliver to customers. Wholesale grew by only 3%, as the strong performance of specialty stores was partially offset by the disappointing performance of department stores globally.
The relentless march toward e-commerce continued, with online sales jumping by 24% in 2017, reaching an overall market share of 9%.
The “millennialization” of luxury customers
The main growth engine of the luxury market is a generational shift, with 85% of luxury growth in 2017 fueled by Generations Y and Z. But a broader “millennial state of mind” is permeating the luxury industry and changing the purchasing habits of all generations. This shift in mindset is pushing luxury brands to redefine what they deliver to customers, and how they deliver it. As an illustration, luxury brands are reinterpreting streetwear to appeal to younger consumers. T-shirts, down jackets and sneakers were among the standout categories in 2017, growing by 25%, 15% and 10%, respectively.
Overall, shoes, jewelry and handbags ranked as the three fastest-growing product categories this year, but apparel, beauty and handbags still account for the bulk of the market.
The future of luxury
Bain estimates that growth will continue at a 4%–5% compound annual rate over the next three years (at constant exchange rates), with the market for personal luxury goods reaching €295–€305 billion by 2020.
Over the next decade, Bain expects that the luxury market’s distribution footprint will evolve significantly. Physical stores will still account for 75% of purchases, but the mix of store formats will shift toward off-price stores and airport stores, to the detriment of monobrand stores, department stores and specialty stores. In addition, Bain estimates that online sales of personal luxury goods will make up 25% of the market by 2025.
With the remarkable growth of the online channel, the role of physical stores will need to change. Stores haven’t lost their purpose, but brands need to reinvent them to better engage with customers, in a way that transcends channels. Stores will have to pivot from a transactional role to become venues for a broader range of customer interactions. Luxury brands have grown accustomed to presenting a monologue about themselves in stores that feel like temples. Increasingly, they will need to transform stores into places that feel like home, delivering distinctive, immersive experiences and engaging in a genuine dialogue with customers.
For brands that respond to the ongoing “millennialization” of the luxury industry, there is significant growth potential in the years ahead. But not every brand can win. Already, a clear polarization of performance is apparent. From 2014 to 2017, 65% of brands managed to grow revenue, but of that group, only 35% also managed to improve their profitability during the same period.
Luxury Goods Worldwide Market Study, Fall–Winter 2017 | Bain & Company, Inc.
Page.3
Brands that want to capitalize on the current growth opportunities will need to:
• Develop one-to-one relationships with younger generations, local consumers and tourists
• Implement a holistic, omnichannel approach to distribution, providing inspirational experiences through redesigned customer journeys and a revamped distribution footprint
• Interpret customer aspirations to reinvent offerings, while staying true to their own brand identities and legacies
• More effectively personalize products, services and messages
• Invest in mastering touchpoints throughout the customer’s lifetime
• Invest in the talent and capabilities required to win in this new luxury era

•. The. global. luxury. market. tracked. by. Bain. &.Company. comprises. nine. segments,. including.personal. luxury. goods,. luxury. cars,. luxury.hospitality,.luxury.cruises,.designer.furniture,.fine.food,. fine. wines. and. spirits,. private. jets. and.yachts,.and.fine.art .
•. Luxury. cars,. luxury. hospitality. and. personal.luxury. goods. together. account. for. more. than.80%.of.the.total.market .
•. The.overall.luxury.market.grew.by.5%.in.2017,.to.an.estimated.€1 .2.trillion.globally ..Most.luxury.segments.experienced.positive.growth .
•. Sales. of. luxury. cars. continued. to.dominate. the.market,.growing.by.6%.to.reach.€489.billion.in.total ..Asia.and.a.nascent.online.channel.propelled.the.segment’s.expansion .
•. Luxury.travel.saw.brisk.growth ..Luxury.hospitality.was. up. by. 4%,. and. sales. of. luxury. cruises.increased. by. an. impressive. 14%,. driven. by.strong.appeal.to.baby.boomers.and.millennials.(particularly.in.the.“expedition”.segment) ..
•. Sales.of.high-end.food.and.wine.both.grew.by.6% .. Growth. in. the. luxury. food. segment. is.accelerating.within.a.rapidly.evolving.ecosystem,.in.which.home-delivery.apps.now.“coopete”.with.fine. restaurants .. Spirits. outperformed. wines.globally,.as.growth.returned.to.the.Chinese.spirits.market ..
•. Yacht. sales. were. stable,. though. we. noted. an.underlying. trend:. Younger. generations. seem. to.have. adopted. chartering,. favoring. usage. over.possession .. The.private. jet.market. continued. to.contract.due.to.uncertainty.in.most.markets .
1.Luxury spending trends in 2017
Luxury Goods Worldwide Market Study, Fall–Winter 2017 | Bain & Company, Inc.
Page.6
262
489
19170
4940
35 23 2 1,160
Worldwide luxury market, 2017E (€ billions)
Notes: Figures for 2017 are estimated, based on data from January to September; discrepancy in total is due to roundingSource: Bain & Company
Annual growth, 2016–17E 5% 14% 5%6% 4% 6% 6% 1% 4% –2%
Personalluxury goods
Luxurycars
Luxuryhospitality
Fine wines& spirits
Finefood
Fineart
Designerfurniture
Privatejets & yachts
Luxurycruises
Total2017E
96
85
97
92
98
96
99
108
00
128
01
133
02
133
03
128
04
136
05
147
06
159
07
170
08
167
09
153
10
173
11
192
12
212
13
218
14
224
15
251
16
250
17E
262
Global personal luxury goods market, 1996–2017E (€ billions)
Source: Bain & Company
NewnormalRebootChinese shopping frenzyCrisisDemocratization“Sortie du temple”
Annual growth,2016–17E:
+5%+6%
at currentexchangeratesat constantexchangerates
CAGR,1996–2017E:
6%
Figure 1:.The.global.luxury.market.grew.to.nearly.€1 .2.trillion.in.2017,.up.5%.from.2016
Figure 2:.After.stagnating.in.2016,.personal.luxury.goods.experienced.a.healthier.2017

Luxury Goods Worldwide Market Study, Fall–Winter 2017 | Bain & Company, Inc.
Page.7
•. The.personal.luxury.goods.market.posted.positive.growth.across.all.key.regions ..More.robust.local.consumption.(up.4%).and.strong.tourist.purchases.(up.6%).contributed.to.the.strong.performance ..
•. Chinese. consumption. bounced. back. in. 2017,.fueled.by.renewed.consumer.confidence.and.the.rapid.emergence.of.a.new.middle.class ..Sales.in.mainland.China.grew.by.a. remarkable.15%.at.current.exchange.rates,. to.a.total.market.size.of.€20. billion .. Buying. abroad. also. increased ..Globally,. the. share. of. personal. luxury. goods.purchased.by.Chinese.nationals.reached.32% .
•. A.currency-driven.boost.in.the.second.half.of.the.year,. along. with. increased. Chinese. spending,.propelled.Japan.to.4%.growth.in.personal.luxury.goods. spending,. at. current. exchange. rates,. to.€22.billion ..
•. The.rest.of.Asia.(excluding.mainland.China.and.Japan). also. had. a. strong. showing,. with. sales.increasing. by. 6%. at. current. exchange. rates .. A.recovery.in.Hong.Kong.and.Macau.helped.push.growth.into.positive.territory,.with. the.market. for.personal.luxury.goods.reaching.€36.billion ..
•. Europe.continued.to.bounce.back,.growing.by.6%.at. current. exchange. rates. and. reaching. €87.billion.in.retail.sales.to.regain.its.place.as.the.top.region. for. luxury. sales. by. value .. Tourist. flows.continued.to.support.the.market.in.the.UK,.Spain.and.France,.and.local.consumption.strengthened.as.well,.particularly.in.Germany ..
•. The.American.market. (including.both.North.and.South.America).has.struggled.but.still.managed.to.finish.the.year.in.positive.territory,.growing.by.2% ..At. €84. billion,. it. remains. a. crucial. market. for.luxury.brands,.despite.the.challenging.environment.for.department.stores ..Canada.and.Mexico.were.among.the.bright.spots.in.the.region ..
•. In.other.regions,.growth.was.flat.at.1%,.with.the.Middle.East.restrained.by.economic.uncertainty ..
2.Regional highlights
Luxury Goods Worldwide Market Study, Fall–Winter 2017 | Bain & Company, Inc.
Page.10
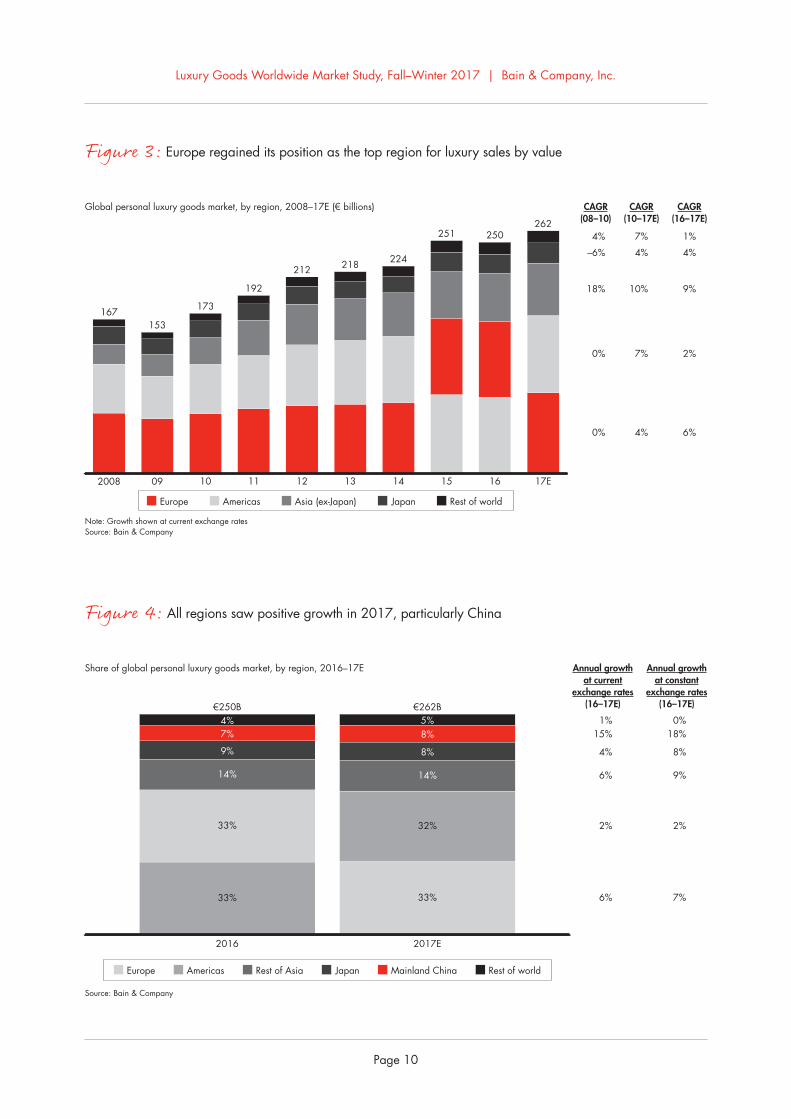
Global personal luxury goods market, by region, 2008–17E (€ billions)
Note: Growth shown at current exchange ratesSource: Bain & Company
2008
167
09
153
10
173
11
192
12
212
13
218
14
224
15
251
16
250
17E
262
0%
0%
–6%
18%
4%
CAGR(08–10)
Europe Americas Japan Rest of worldAsia (ex-Japan)
6%
2%
4%
9%
1%
CAGR(16–17E)
4%
7%
4%
10%
7%
CAGR(10–17E)
Share of global personal luxury goods market, by region, 2016–17E
Source: Bain & Company
Annual growthat current
exchange rates(16–17E)
Annual growthat constant
exchange rates(16–17E)
Europe Americas Japan Mainland China Rest of worldRest of Asia
2016
33%
33%
9%
7%
14%
4%€250B
2017E
33%
32%
8%
8%
14%
€262B5%
6%
2%
15%
6%
1%
7%
2%
18%
9%
0%
4% 8%
Figure 3:.Europe.regained.its.position.as.the.top.region.for.luxury.sales.by.value
Figure 4:.All.regions.saw.positive.growth.in.2017,.particularly.China
Luxury Goods Worldwide Market Study, Fall–Winter 2017 | Bain & Company, Inc.
Page.11
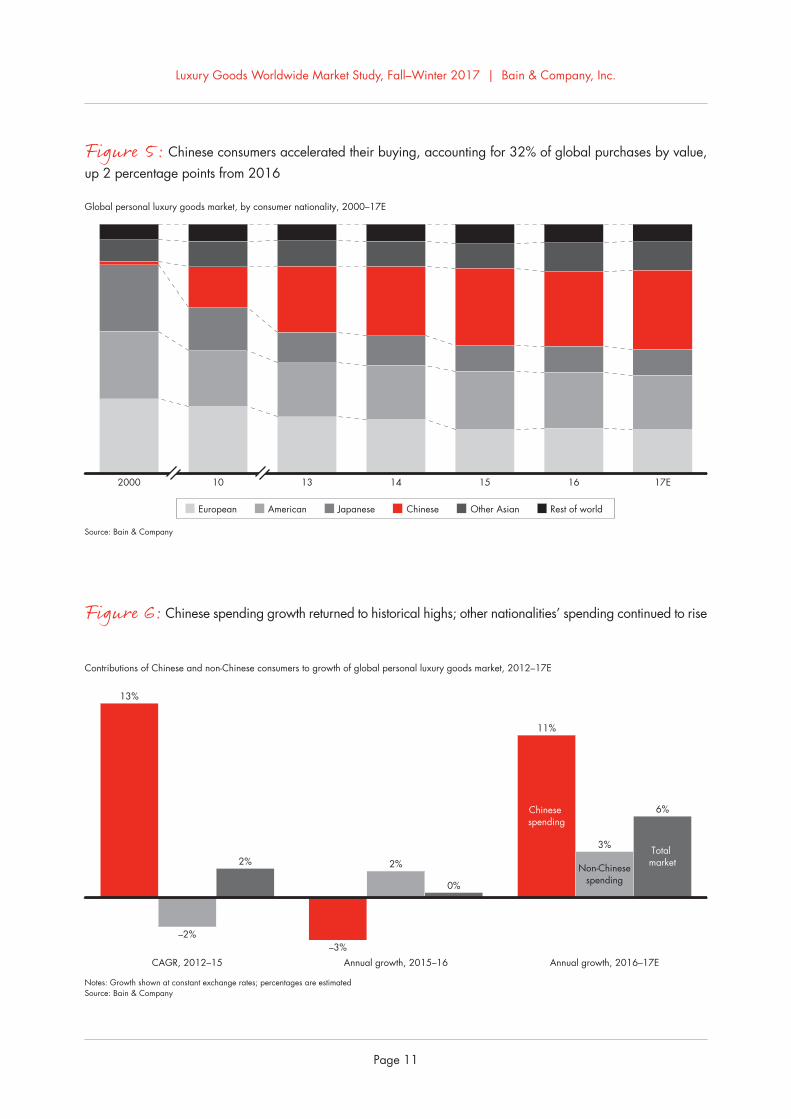
Global personal luxury goods market, by consumer nationality, 2000–17E
Source: Bain & Company
European American Chinese Other Asian Rest of worldJapanese
2000 10 13 14 15 16 17E
Contributions of Chinese and non-Chinese consumers to growth of global personal luxury goods market, 2012–17E
Notes: Growth shown at constant exchange rates; percentages are estimatedSource: Bain & Company
CAGR, 2012–15 Annual growth, 2015–16 Annual growth, 2016–17E
13%
–2%
2%
–3%
2%
0%
11%
3%
6%Chinese spending
Non-Chinesespending
Total market
Figure 5:.Chinese.consumers.accelerated.their.buying,.accounting.for.32%.of.global.purchases.by.value,.up.2.percentage.points.from.2016
Figure 6:.Chinese.spending.growth.returned.to.historical.highs;.other.nationalities’.spending.continued.to.rise
Luxury Goods Worldwide Market Study, Fall–Winter 2017 | Bain & Company, Inc.
Page.12
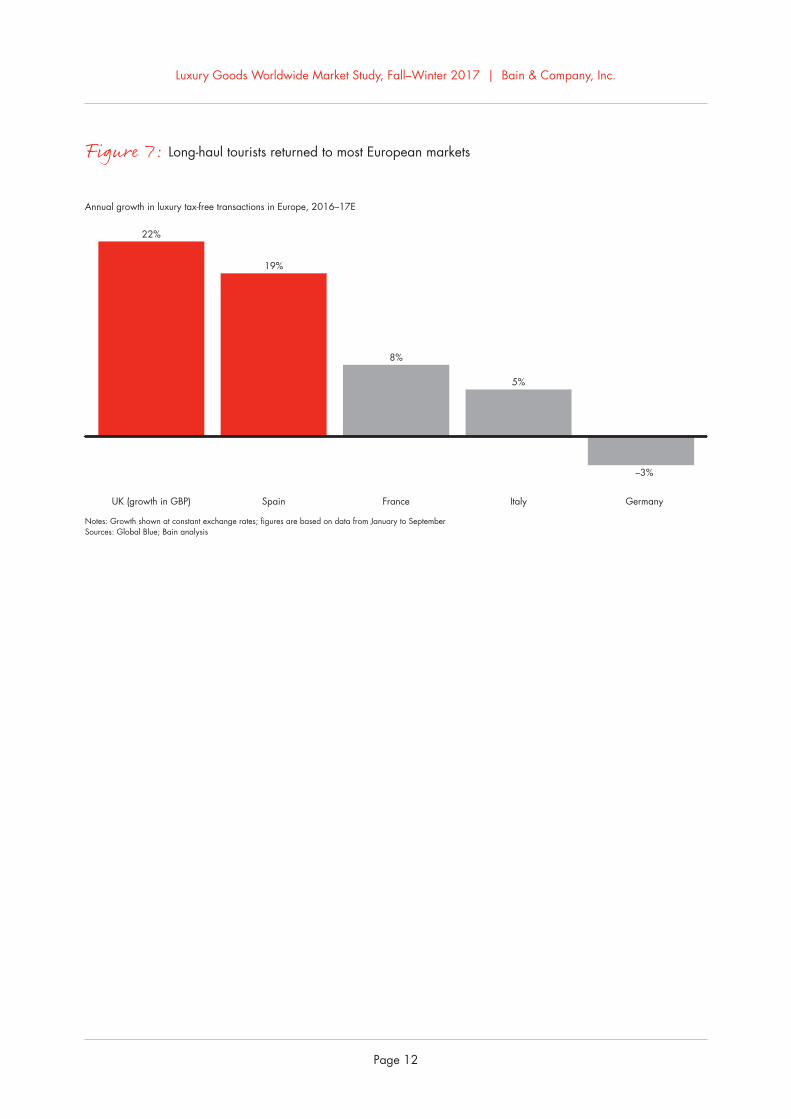
Annual growth in luxury tax-free transactions in Europe, 2016–17E
Notes: Growth shown at constant exchange rates; figures are based on data from January to SeptemberSources: Global Blue; Bain analysis
UK (growth in GBP) Spain France Italy Germany
22%
–3%
19%
8%
5%
Figure 7: Long-haul.tourists.returned.to.most.European.markets

Luxury Goods Worldwide Market Study, Fall–Winter 2017 | Bain & Company, Inc.
Page.13
•. Wholesale.remains.the.largest.channel.for.luxury.goods,. accounting. for. roughly. two-thirds. of. all.sales ..Yet. the. retail. channel. continued.growing.steadily—rising. 8%. in. 2017. alone—as.companies. increasingly. seek. to. control. the.experience. they. deliver. to. customers .. Of. that.gain,.3%.came.from.new-store.openings.and.the.remaining. 5%. came. from. same-store. sales.growth .. Wholesale. grew. by. only. 3%,. as. the.strong. performance. of. specialty. stores. was.partially.offset.by.the.disappointing.performance.of.department.stores.globally ..
•. Off-price.stores.and.airport.stores.showed.strong.growth.(up.8%.and.12%,.respectively) .
•. Online. sales. continued. their. relentless. climb,.increasing.by.24% ..The.Americas.market.makes.up.close. to.half.of.global.online. luxury.sales—which. total. €23. billion—but. growth. was.particularly. strong. in. Europe. and. Asia ..Accessories. (including. handbags. and. shoes).remained.the.top.category.sold.online,.ahead.of.apparel .. Beauty. and. hard. luxury. (jewelry. and.watches).were.both.on.the.rise ..Brands.are.finally.starting.to.be.proactive.about.making.their.mark.in.this.channel.by.establishing.their.own.websites,.which. now. account. for. 31%. of. sales .. But.specialized. luxury. e-tailers. still. earn. the. lion’s.share.of.online.sales ..
3.Distribution trends
Luxury Goods Worldwide Market Study, Fall–Winter 2017 | Bain & Company, Inc.
Page.16
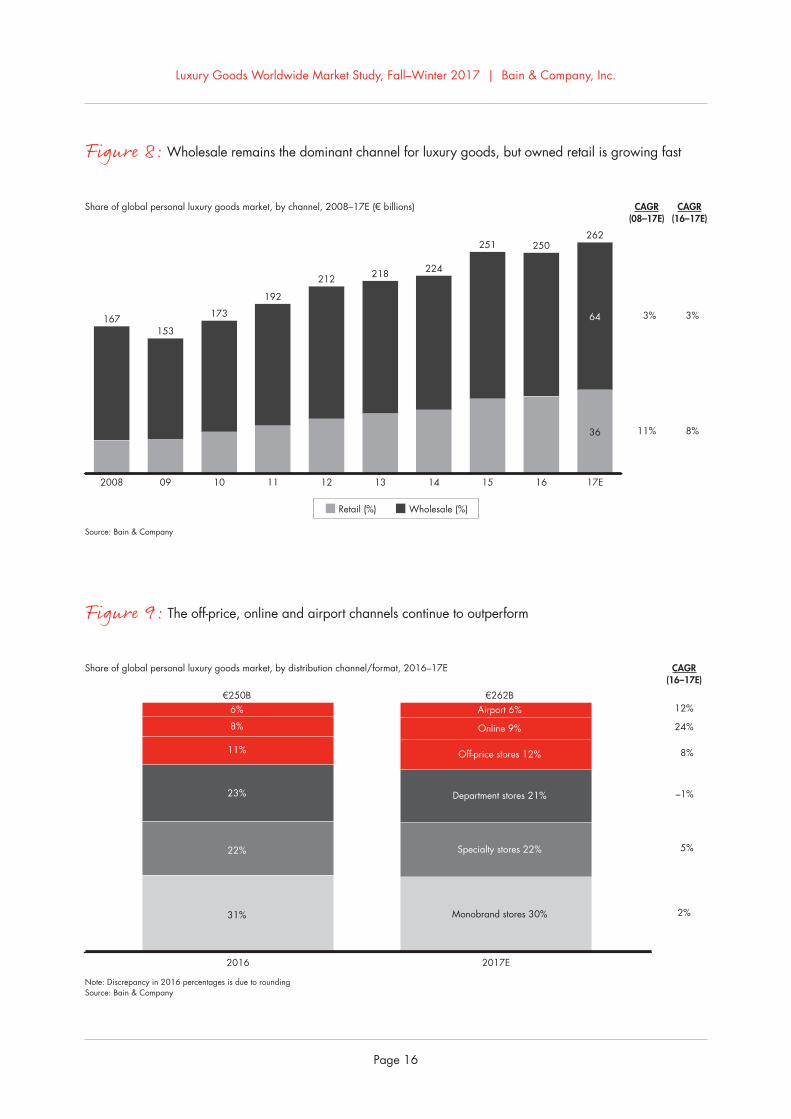
Share of global personal luxury goods market, by channel, 2008–17E (€ billions)
Source: Bain & Company
Retail (%) Wholesale (%)
CAGR(08–17E)
11%
3%
CAGR(16–17E)
8%
3%
2008 09 10 11 12 13 14 15 16 17E
167153
173
192
212 218 224
251 250262
64
36
Note: Discrepancy in 2016 percentages is due to roundingSource: Bain & Company
Share of global personal luxury goods market, by distribution channel/format, 2016–17E
2%
24%
12%
5%
–1%
8%
2016 2017E
31%
22%
23%
11%
8%
6%€250B
Online 9%
Airport 6%€262B
Off-price stores 12%
Department stores 21%
Specialty stores 22%
Monobrand stores 30%
CAGR(16–17E)
Figure 8:.Wholesale.remains.the.dominant.channel.for.luxury.goods,.but.owned.retail.is.growing.fast.
Figure 9:.The.off-price,.online.and.airport.channels.continue.to.outperform
Luxury Goods Worldwide Market Study, Fall–Winter 2017 | Bain & Company, Inc.
Page.17
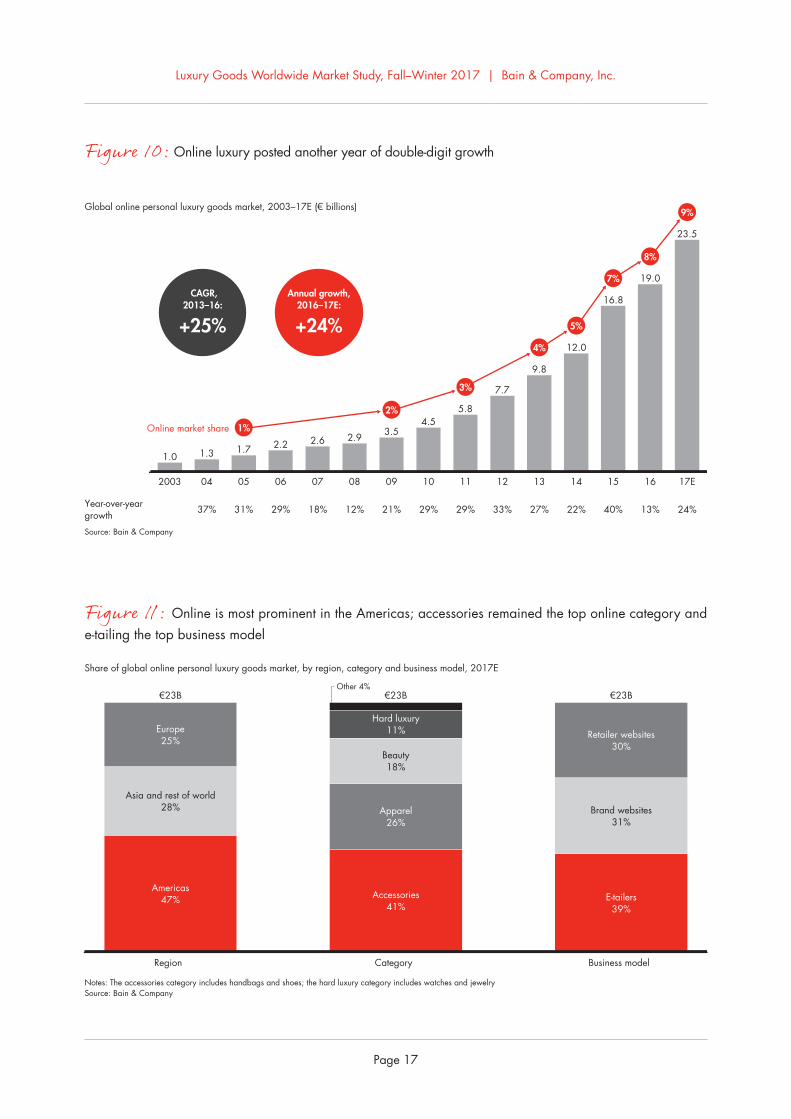
Global online personal luxury goods market, 2003–17E (€ billions)
Source: Bain & Company
2003 04 05 06 07 08 09 10 11 12 13 14 15 16 17E
1.0 1.3 1.7 2.2 2.6 2.9 3.54.5
5.8
7.7
9.8
12.0
16.8
19.0
23.5
33% 27% 22% 40% 13% 24%37% 31% 29% 18% 12% 21% 29% 29%Year-over-yeargrowth
Online market share 1%
2%
3%
4%
5%
7%
8%
9%
CAGR,2013–16:
+25%
Annual growth,2016–17E:
+24%
Notes: The accessories category includes handbags and shoes; the hard luxury category includes watches and jewelrySource: Bain & Company
Region Category Business model
Share of global online personal luxury goods market, by region, category and business model, 2017E
€23B €23B €23B
Europe25%
Asia and rest of world28%
Hard luxury11%
Beauty18%
Apparel26%
Accessories41%
Retailer websites30%
Brand websites31%
E-tailers39%
Americas47%
Other 4%
Figure 10:.Online.luxury.posted.another.year.of.double-digit.growth.
Figure 11: Online.is.most.prominent.in.the.Americas;.accessories.remained.the.top.online.category.and.e-tailing.the.top.business.model
•. The.main.growth.engine.of.the.luxury.market.is.a.generational.shift,.with.85%.of.luxury.growth.in.2017. fueled. by. Generations. Y. and. Z .. But. a.broader.“millennial.state.of.mind”.is.permeating.the. luxury. industry. and. changing. the. ways. in.which.all.generations.make.purchases ..This.shift.also.pushes.luxury.brands.to.redefine.what.they.deliver.to.customers,.and.how.they.deliver.it .
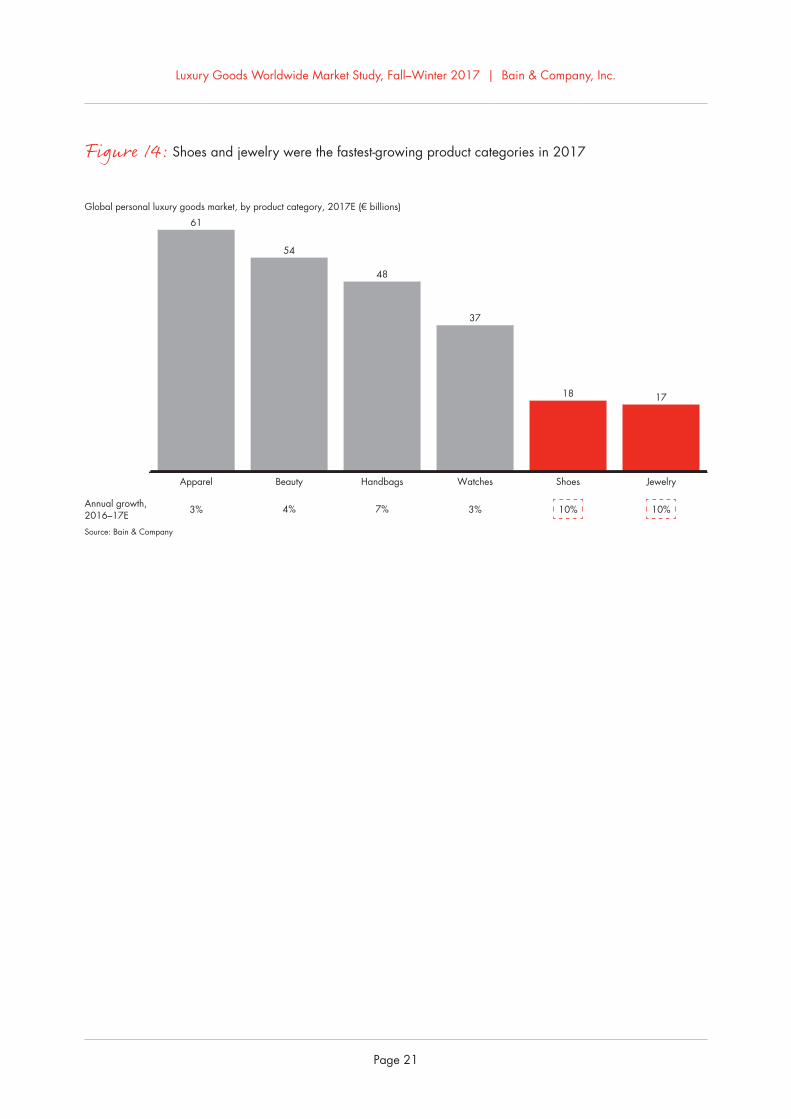
•. Shoes,.jewelry.and.handbags.ranked.as.the.three.fastest-growing.product.categories,.increasing.by.10%,.10%.and.7%,.respectively,.at.current.exchange.rates ..Apparel,.beauty.and.handbags.still.make.up.the.bulk.of.global. luxury.purchases,.amounting.to.€61.billion,.€54.billion.and.€48.billion,.respectively—and.collectively.representing.62%.of.the.personal.luxury.goods.market ..
4.Customer shifts and individual category performance
Luxury Goods Worldwide Market Study, Fall–Winter 2017 | Bain & Company, Inc.
Page.20
Source: Bain & Company
Share of global personal luxury goods consumers, by generation Share of global personal luxury goods sales value, by generation
2016 2017E2016 2017E
1%2%
30%
38%
29%31%
38%
27%
3%
38%
26%
26%28%
4%6%
6%4%
26%
36%
Z Y Baby boomer SilentX
1%
Global personal luxury goods market, by product category, 2008–17E (€ billions)
Source: Bain & Company
CAGR(08–10)
Accessories Apparel Beauty OtherHard luxury
CAGR(16–17E)
CAGR(10–16)
2008 09 10 11 12 13 14 15 16 17E
167153
173
192
212 218 224
251 250262
9%
–1%
2%
0%
–3%
9%
5%
7%
5%
1%
7%
3%
5%
4%
2%
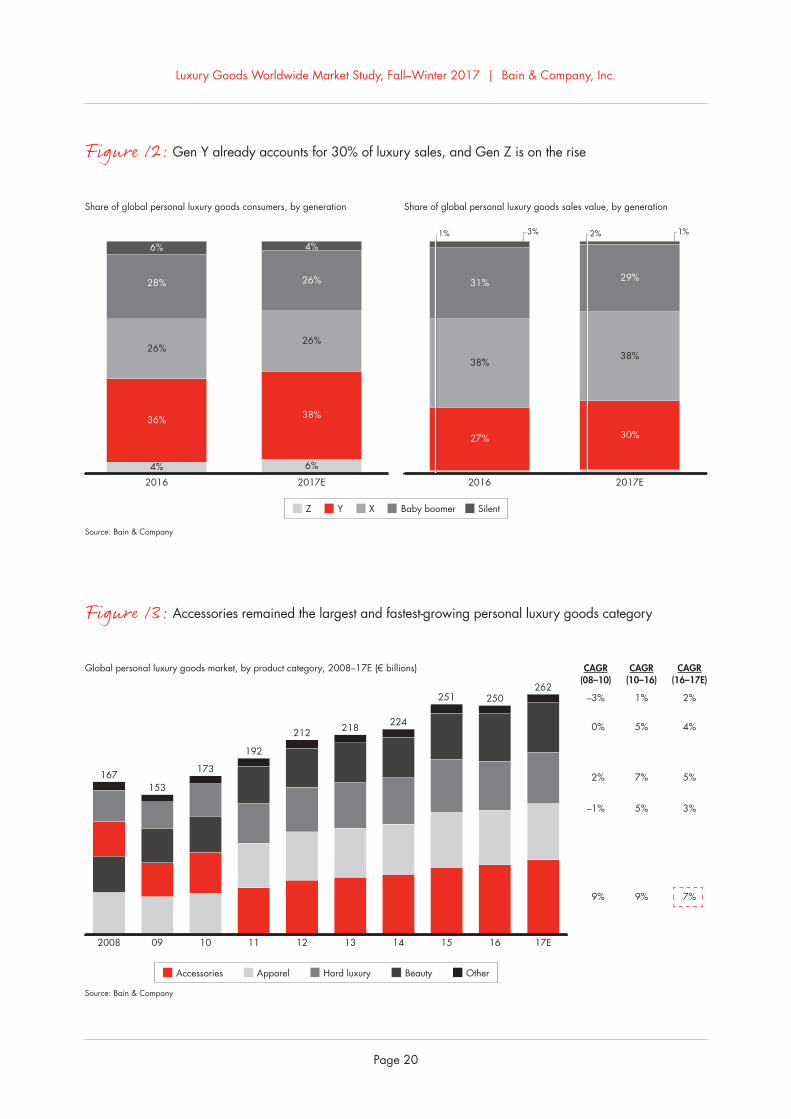
Figure 12:.Gen.Y.already.accounts.for.30%.of.luxury.sales,.and.Gen.Z.is.on.the.rise
Figure 13:.Accessories.remained.the.largest.and.fastest-growing.personal.luxury.goods.category
Luxury Goods Worldwide Market Study, Fall–Winter 2017 | Bain & Company, Inc.
Page.21
Global personal luxury goods market, by product category, 2017E (€ billions)
Source: Bain & Company
Apparel
61
Beauty
54
Handbags
48
Watches
37
Shoes
18
Jewelry
17
7% 10%3% 10%3% 4%Annual growth,2016–17E
Figure 14:.Shoes.and.jewelry.were.the.fastest-growing.product.categories.in.2017
•. We. expect. growth. to. continue. at. an. estimated.4%–5%. compound. annual. rate. over. the. next.three.years.(at.constant.exchange.rates),.with.the.market. for. personal. luxury. goods. reaching.€295–€305.billion.by.2020 ..
•. Over. the. next. decade,. the. luxury. market’s.distribution.footprint.is.likely.to.evolve.significantly ..Although.Bain.estimates.that.physical.stores.will.still. account. for. 75%. of. purchases,. the. mix. of.store. formats. will. shift. away. from. monobrand.stores,. department. stores. and. specialty. stores,.toward. off-price. stores. and. airport. stores .. In.addition,. we. estimate. that. online. sales. for.personal.luxury.goods.will.make.up.25%.of.the.market.by.2025 .
•. Overall. market. conditions. shifted. in. a. positive.direction.in.2017 ..Nearly.two-thirds.of.all.luxury.brands.(65%).experienced.growth,.up.from.only.50%.in.2016 ..
•. However,.long-term.performance.hurdles.remain.high,.given.a.clear.polarization.between.winners.and.losers ..Over.the.period.from.2014.to.2017,.among.the.65%.of.brands.that.managed.to.grow.revenue,.only.one-third.were.also.able. to.grow.their.profits ..
5.Outlook for the future
Luxury Goods Worldwide Market Study, Fall–Winter 2017 | Bain & Company, Inc.
Page.24
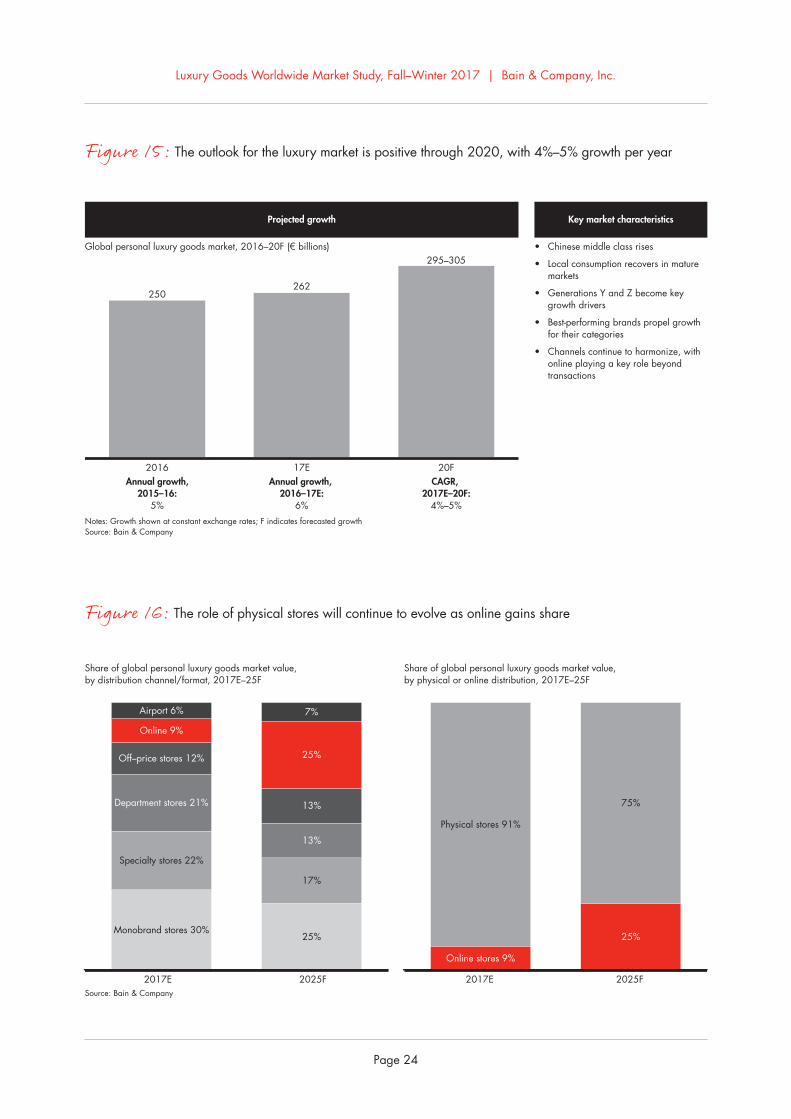
Global personal luxury goods market, 2016–20F (€ billions) • Chinese middle class rises
• Local consumption recovers in mature markets
• Generations Y and Z become key growth drivers
• Best-performing brands propel growth for their categories
• Channels continue to harmonize, with online playing a key role beyond transactions
Notes: Growth shown at constant exchange rates; F indicates forecasted growth Source: Bain & Company
Projected growth Key market characteristics
2016
250
17E
262
20F
295–305
Annual growth,2015–16:
5%
Annual growth, 2016–17E:
6%
CAGR, 2017E–20F:
4%–5%
Source: Bain & Company
Share of global personal luxury goods market value, by distribution channel/format, 2017E–25F
Share of global personal luxury goods market value, by physical or online distribution, 2017E–25F
2017E 2025F2017E 2025F
Online 9%
Airport 6%
25%
17%
13%
13%
25%
7%
Monobrand stores 30%
Specialty stores 22%
Department stores 21%
Off–price stores 12%
Online stores 9%
25%
75%
Physical stores 91%
Figure 15:.The.outlook.for.the.luxury.market.is.positive.through.2020,.with.4%–5%.growth.per.year
Figure 16:.The.role.of.physical.stores.will.continue.to.evolve.as.online.gains.share
Luxury Goods Worldwide Market Study, Fall–Winter 2017 | Bain & Company, Inc.
Page.25
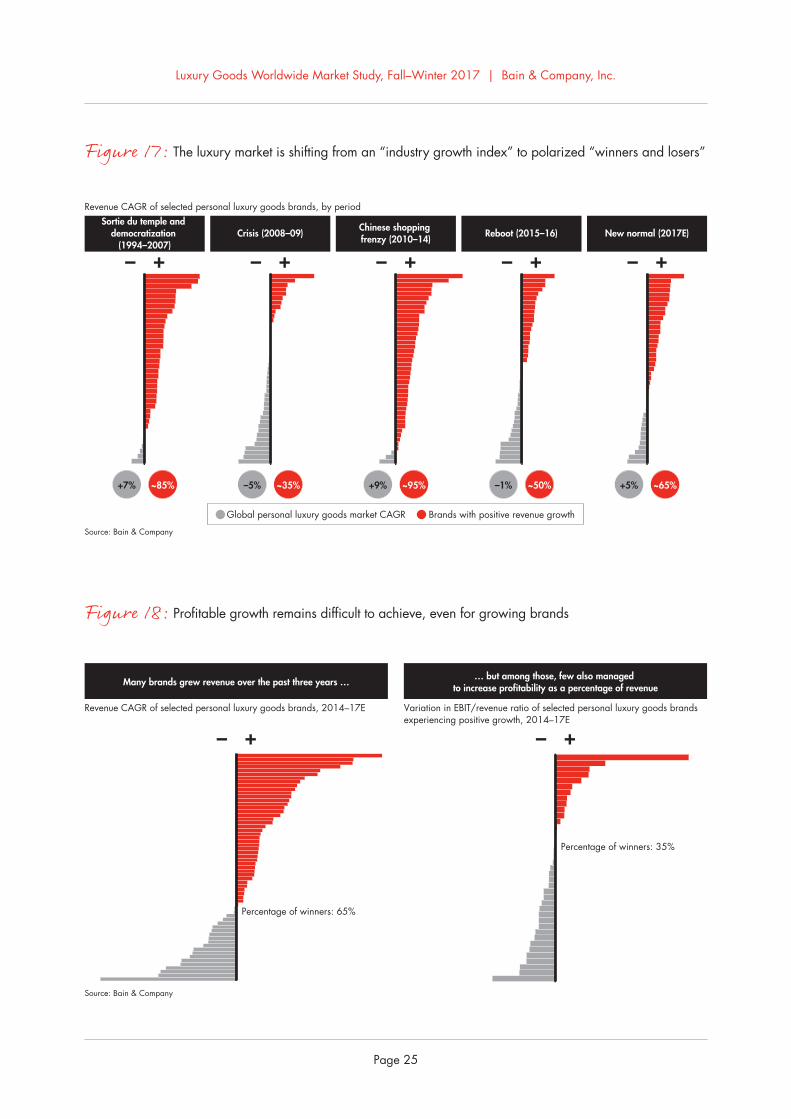
Revenue CAGR of selected personal luxury goods brands, by period
Source: Bain & Company
Sortie du temple and democratization
(1994–2007)Crisis (2008–09) Chinese shopping
frenzy (2010–14) Reboot (2015–16) New normal (2017E)
~65%+5%~50%–1%~95%+9%~35%–5%~85%+7%
Brands with positive revenue growthGlobal personal luxury goods market CAGR
Revenue CAGR of selected personal luxury goods brands, 2014–17E Variation in EBIT/revenue ratio of selected personal luxury goods brands experiencing positive growth, 2014–17E
Source: Bain & Company
Many brands grew revenue over the past three years … … but among those, few also managed to increase profitability as a percentage of revenue
Percentage of winners: 65%
Percentage of winners: 35%
Figure 17:.The.luxury.market.is.shifting.from.an.“industry.growth.index”.to.polarized.“winners.and.losers”
Figure 18:.Profitable.growth.remains.difficult.to.achieve,.even.for.growing.brands
Luxury Goods Worldwide Market Study, Fall–Winter 2017 | Bain & Company, Inc.
Page.26
Appendix
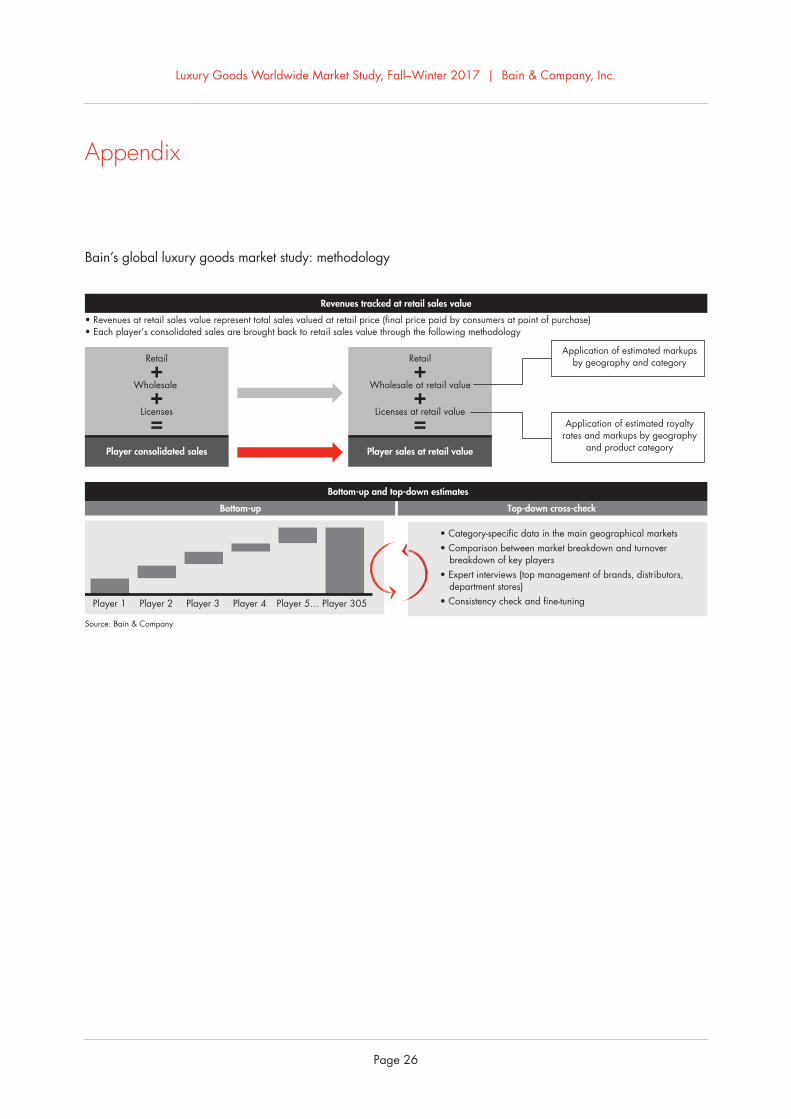
Source: Bain & Company
Revenues tracked at retail sales value
Bottom-up and top-down estimates
• Revenues at retail sales value represent total sales valued at retail price (final price paid by consumers at point of purchase)• Each player’s consolidated sales are brought back to retail sales value through the following methodology
Bottom-up Top-down cross-check
• Category-specific data in the main geographical markets• Comparison between market breakdown and turnover
breakdown of key players• Expert interviews (top management of brands, distributors,
department stores)• Consistency check and fine-tuning
Retail
Wholesale
Licenses
Player consolidated sales
Retail
Wholesale at retail value
Licenses at retail value
Player sales at retail value
Player 1 Player 305Player 2 Player 4Player 3 Player 5...
Application of estimated markups by geography and category
Application of estimated royalty rates and markups by geography
and product category
Bain’s.global.luxury.goods.market.study:.methodology
Key contacts in Bain’s Luxury practice
Europe, Middle East and Africa:
Claudia D’Arpizio in Milan ([email protected])
Federica Levato in Milan ([email protected]) Marc-André Kamel in Paris ([email protected]) Joëlle de Montgolfier in Paris ([email protected])
Americas:
Aaron Cheris in San Francisco ([email protected]) Vandana Radhakrishnan in New York ([email protected])
Suzanne Tager in New York ([email protected])
Asia-Pacific:
Bruno Lannes in Shanghai ([email protected])
About the Bain Luxury Goods Worldwide Market Study
Bain & Company analyzes for Fondazione Altagamma the market and financial performance of more than 300 leading luxury goods companies and brands. This database, known as the Luxury Goods Worldwide Market Observatory, has become a leading and much-studied source in the international luxury goods industry. Bain has published its annual findings in the Luxury Goods Worldwide Market Study since 2000. The study’s lead author is Claudia D’Arpizio, a Bain partner in Milan. Fondazione Altagamma is led by Andrea Illy, who was named chairman in 2013.
For more information, visit www.bain.com
Shared Ambition, True Results
Bain & Company is the management consulting firm that the world’s business leaders come to when they want results.
Bain advises clients on strategy, operations, technology, organization, private equity and mergers and acquisitions. We develop practical, customized insights that clients act on and transfer skills that make change stick. Founded in 1973, Bain has 55 offices in 36 countries, and our deep expertise and client roster cross every industry and economic sector. Our clients have outperformed the stock market 4 to 1.
What sets us apart
We believe a consulting firm should be more than an adviser. So we put ourselves in our clients’ shoes, selling outcomes, not projects. We align our incentives with our clients’ by linking our fees to their results and collaborate to unlock the full potential of their business. Our Results Delivery® process builds our clients’ capabilities, and our True North values mean we do the right thing for our clients, people and communities—always.
Recommended