Lung disease in Australia
Leanne M Poulos
Patricia K Correll
Brett G Toelle
Helen K Reddel
Guy B Marks
Woolcock Institute of Medical Research, University of Sydney, NSW
Prepared for Lung Foundation Australia
October 2014

i
Contents Executive Summary ................................................................................................................................. 1
INTRODUCTION ....................................................................................................................................... 3
Purpose of the report ......................................................................................................................... 3
Structure of the report .................................................................................................................... 3
Using the report .............................................................................................................................. 3
CHAPTER 1. LUNG DISEASE ................................................................................................................. 4
Health care utilisation due to lung disease in Australia...................................................................... 4
Burden (DALYs) attributable to lung disease in Australia ................................................................... 6
Deaths due to Lung Disease in Australia ........................................................................................... 10
Conclusion ......................................................................................................................................... 11
CHAPTER 2. CHRONIC RESPIRATORY DISEASES ................................................................................ 12
2.1 Asthma .................................................................................................................................. 12
Prevalence of asthma .................................................................................................................... 12
Health care utilisation due to asthma ........................................................................................... 13
Burden (DALYs) attributed to asthma ........................................................................................... 15
Deaths due to asthma ................................................................................................................... 17
Risk factors for asthma ................................................................................................................. 17
2.2 Chronic Obstructive Pulmonary Disease (COPD) ........................................................................ 18
Prevalence of COPD ...................................................................................................................... 18
Health care utilisation due to COPD ............................................................................................. 18
Burden (DALYs) attributed to COPD.............................................................................................. 20
Deaths due to COPD ...................................................................................................................... 21
Risk factors for COPD .................................................................................................................... 21
2.3 Pneumoconiosis .................................................................................................................... 22
Prevalence of Pneumoconiosis ..................................................................................................... 22
Health care utilisation due to pneumoconiosis ............................................................................ 22
Burden (DALYs) attributed to pneumoconiosis ............................................................................ 23
Deaths due to pneumoconiosis .................................................................................................... 24
2.4 Interstitial lung disease ......................................................................................................... 24
Health care utilisation due to interstitial lung disease ................................................................. 24
Burden (DALYs) attributed to interstitial lung disease ................................................................. 25
Deaths due to interstitial lung disease ......................................................................................... 25

ii
2.5 Cystic fibrosis ........................................................................................................................ 25
Health care utilisation due to cystic fibrosis ................................................................................. 26
Burden (DALYs) attributed to cystic fibrosis ................................................................................. 26
Deaths due to cystic fibrosis ......................................................................................................... 26
2.6 Non-CF Bronchiectasis .......................................................................................................... 26
Health care utilisation due to bronchiectasis ............................................................................... 27
Burden (DALYs) attributed to bronchiectasis ............................................................................... 27
Deaths due to non-CF bronchiectasis ........................................................................................... 27
CHAPTER 3. LUNG CANCER AND MESOTHELIOMA ........................................................................... 28
Risk factors ........................................................................................................................................ 28
Lung Cancer ................................................................................................................................... 28
Mesothelioma ............................................................................................................................... 28
Incidence ........................................................................................................................................... 29
Lung Cancer ................................................................................................................................... 29
Mesothelioma ............................................................................................................................... 30
Burden of disease ............................................................................................................................. 31
Deaths ............................................................................................................................................... 32
Lung cancer ................................................................................................................................... 32
Mesothelioma ............................................................................................................................... 33
Health Care Utilisation ...................................................................................................................... 33
Lung cancer ................................................................................................................................... 33
Mesothelioma ............................................................................................................................... 35
CHAPTER 4. INFECTIOUS DISEASE ..................................................................................................... 37
Introduction ...................................................................................................................................... 37
Notifiable diseases that cause respiratory infection ........................................................................ 37
Invasive pneumococcal disease .................................................................................................... 37
Influenza ........................................................................................................................................ 38
Pertussis ........................................................................................................................................ 38
Tuberculosis .................................................................................................................................. 38
Acute lower respiratory infections ................................................................................................... 39
Pneumonia .................................................................................................................................... 39
Bronchitis ...................................................................................................................................... 39
Bronchiolitis .................................................................................................................................. 40
Risk reduction for lower respiratory infections ............................................................................ 40

iii
Incidence of respiratory infection ..................................................................................................... 40
Burden of disease due to respiratory infection ................................................................................ 41
Mortality due to acute respiratory infection .................................................................................... 44
Healthcare utilisation for respiratory infections ............................................................................... 44
General practice encounters ......................................................................................................... 44
Hospitalisations ............................................................................................................................. 44
APPENDIX: ICD CODES USED TO CLASSIFY DISEASES ............................................................................ 50
References ............................................................................................................................................ 52

1
Lung disease in Australia
Executive Summary Lung disease accounted for 10.3% of the total burden of disease in Australia in 2010.
The contribution of lung disease to overall burden is greatest in children and older adults and
lowest in young adults.
Among infants (up to the age of one year) most of the burden of lung disease is due to lower
respiratory infections (pneumonia and bronchiolitis).
In children aged over one year and young adults, asthma is the major contributor to the burden
of lung disease.
In older Australians, lung cancer and COPD comprise the majority of the burden of lung disease.
Among people with lung disease in Australia:
Lower respiratory infections are the leading cause of hospitalisation
Asthma represents the leading cause of disability
Lung cancer represents the leading cause of death (40% of deaths from lung disease)
COPD contributes one-third of the burden
COPD contributes almost one-third of all deaths.
Lung disease was the cause of:
20,376 deaths in 2012, representing 13.9% of all deaths
276,505 hospitalisations in 2011-12, representing 2.99% of all hospitalisations
over 1.4 million hospital patient-days in 2011-12, representing 5.07% of all patient-days.
Chronic respiratory disease, which includes asthma, COPD, bronchiectasis, interstitial lung disease and pneumoconiosis was the cause of:
117,391 hospitalisations in 2011-12, representing 1.26% of all hospitalisations
579,910 hospital patient-days in 2011-12, representing 2.09% of all patient-days
Over 300,000 disability-adjusted life years (DALYs) in 2010, representing 6% of all DALYs
7,962 deaths in 2012 (5.41% of all deaths)
97,109 years of life lost due to premature death (in 2010).
Respiratory neoplasms (including lung cancer and mesothelioma) were the reason for:
Nearly 11,000 new neoplasm diagnoses in 2010
Around 20,000 hospitalisations in 2011-02, representing 0.2% of all hospitalisations
143,551 DALYs due to lung cancer in 2010, representing 17.5% of DALYs due to cancer
8,775 deaths in 2012, representing 6.0% of all deaths in Australia.
Acute respiratory infections, which include pneumonia, bronchitis, bronchiolitis, invasive pneumococcal disease (IPD), influenza, pertussis and tuberculosis (TB) were the reason for:
43,502 notifications (IPD, influenza, pertussis and TB) to the National Notifiable Diseases
Surveillance System in 2013
129,392 hospitalisations in 2011-12, representing 1.4% of all hospitalisations
44,788 DALYs due to lower respiratory disease and TB in 2010, comprising 0.9% of all DALYs
3,023 deaths in 2012, representing 2.1% of all deaths in Australia in that year.

2

3
INTRODUCTION
Purpose of the report This document provides data on the prevalence, burden and impact of lung disease in Australia,
derived from a range of available sources, for the Lung Foundation Australia to use for various
purposes including education, marketing and advocacy.
Structure of the report
The first chapter provides information about the burden and impact of lung disease as a whole in
Australia. The second chapter describes what is known about the prevalence of chronic respiratory
diseases, including COPD, asthma, interstitial lung disease, cystic fibrosis, pneumoconiosis and non-
CF bronchiectasis, and the level of health care utilisation, overall burden, and rate of deaths
attributable to these diseases. The third chapter includes information about the risk factors for and
incidence of lung cancer and mesothelioma in Australia. Data on disease burden, deaths and health
care utilisation due to these malignant diseases are also presented. The fourth chapter presents
information on the incidence of, and burden, deaths and health care utilisation due to, infectious
diseases affecting the lungs. These include non-specific lower respiratory infections (mainly
pneumonia and bronchiolitis) as well as whooping cough and tuberculosis.
In the Appendix we have listed the disease codes that were used to identify lung diseases within the
various data sources access for this report. This will facilitate updating of the report in future years
and for tracking change over time.
Using the report
We hope that readers will find the report a useful resource for summary information about the
burden and impact of lung disease in Australia. We have provided references for the sources of
information used to create this report and interested readers are recommended to view these
sources for more detailed information and description of how the data were obtained and analysed.

4
CHAPTER 1. LUNG DISEASE This chapter summarises information about health care utilisation and deaths attributed to lung
disease, as well as information from the Global Burden of Disease Study (2010) (1) on the burden of
lung disease in Australia. For the purposes of this report, we have classified lung diseases as follows:
1. chronic respiratory diseases (includes chronic obstructive pulmonary disease (COPD), asthma,
interstitial lung disease and sarcoidosis, pneumoconiosis (mainly asbestosis and silicosis), cystic
fibrosis (CF)),
2. lung cancer and mesothelioma
3. respiratory infection (includes lower respiratory infections, pertussis (whooping cough) and
tuberculosis (TB)), and
4. other respiratory diseases (includes non-CF bronchiectasis, pleural disease, unspecified
respiratory disease).
These groupings are largely consistent with those used in the Global Burden of Disease study (1). It
should be noted that for the burden of disease data, information about bronchiectasis is grouped in
‘other respiratory diseases’, while information about cystic fibrosis is not available separately.
However, we have reported information about deaths and health care utilisation due to
bronchiectasis and CF (under ‘chronic respiratory disease’). A full description of all the diseases (and
their associated ICD-10 codes) included can be found in the appendix (Table A1.1).
Health care utilisation due to lung disease in Australia In 2011-12, there were 276,505 hospitalisations for lung disease in Australia. This represented 3.0%
of all hospitalisations in Australia in that year (Table 1.1).
Respiratory infections accounted for 46.8% of all hospitalisations due to lung disease, with 129,392
hospitalisations, representing 1.4% of all hospitalisations due to any disease in that year. Lung
cancer accounted for 18,402, while COPD accounted for 65,224 hospitalisations, representing 0.2%
and 0.7% of all hospitalisations, respectively. Chronic respiratory disease was the cause of 117,391
hospitalisations in Australia in 2011-12, which represented 1.3% of all hospitalisations.
There were more hospitalisations for lung disease among males (146,708) than females (129,797) in
2011-12 and this was true for all types of lung disease except for asthma, bronchiectasis, cystic
fibrosis and pertussis, where there were more female admissions than male admissions.

5
Table 1.1 Number of hospitalisations due to Lung Disease, Australia, 2011-12, by sex
Disease Males Females Persons % All
hospitalisations
CHRONIC RESPIRATORY DISEASES
COPD 34,728 30,496 65,224 0.70%
Asthma 18,818 19,863 38,681 0.42%
Interstitial lung disease and sarcoidosis 2,209 1,855 4,064 0.04%
Cystic fibrosis 1,982 2,058 4,040 0.04%
Pneumoconiosis (mainly asbestosis and silicosis) 185 12 197 0.0021%
Bronchiectasis 1,712 3,473 5,185 0.05%
TOTAL CHRONIC RESPIRATORY DISEASES 59,634 57,757 117,391 1.26%
LUNG CANCER AND MESOTHELIOMA
Lung cancer 10,834 7,568 18,402 0.20%
Mesothelioma 1,676 353 2,029 0.02%
TOTAL LUNG CANCER AND MESOTHELIOMA 12,510 7,921 20,431 0.22%
RESPIRATORY INFECTION
Lower respiratory infections 67,497 59,657 127,154 1.37%
Pertussis (whooping cough) 453 511 964 0.01%
Tuberculosis 1,026 248 1,274 0.01%
TOTAL RESPIRATORY INFECTION 68,976 60,416 129,392 1.40%
OTHER RESPIRATORY DISEASES 5,588 3,703 9,291 0.11%
Hospitalisations due to ALL LUNG DISEASE 146,708 129,797 276,505 2.99% Notes: All diseases classified using ICD-10 codes (see Table A1.1). It should be noted that one person could have multiple hospitalisations.
Source: AIHW hospitals principal diagnosis data cubes.
Hospital patient-days represent the number of days of stay in hospital for patients who were
admitted to hospital for an episode of care.
In 2011-12, there were over 1.4 million hospital patient-days attributed to lung disease in Australia,
representing 5.1% of all hospital patient-days in Australia in that year (Table 1.2).
This figure included 636,142 patient-days attributable to respiratory infections in that year, which
accounted for 46.4% of all hospital patient-days due to lung disease and 2.3% of all hospital-patient-
days.
It also included 579,910 hospital-patient-days due to chronic respiratory diseases. COPD was the
leading cause of hospital patient-days due to chronic respiratory disease, with 389,008 patient-days
representing 1.4% of hospital patient-days due to any disease and 67% of hospital patient-days for
chronic respiratory disease.
Lung cancer accounted for 140,012 patient- days (0.5% of all patient-days). This relatively low rate of
hospitalisation reflects that fact that the majority of people with lung cancer do not have surgery
and do not require hospital- admission for management of their condition.

6
Table 1.2: Number of Patient-Days due to Lung Disease, Australia, 2011-12, by sex
Disease Males Females Persons % All patient-
days
CHRONIC RESPIRATORY DISEASES
COPD 202,807 186,201 389,008 1.40%
Asthma 32,212 49,411 81,623 0.29%
Cystic fibrosis 20,732 22,499 43,231 0.16%
Interstitial lung disease and sarcoidosis 15,446 13,053 28,499 0.10%
Pneumoconiosis (mainly asbestosis and silicosis) 985 55 1,040 0.00375%
Bronchiectasis 11,813 24,696 36,509 0.13%
TOTAL CHRONIC RESPIRATORY DISEASES 283,995 295,915 579,910 2.09%
LUNG CANCER AND MESOTHELIOMA
Lung cancer 79,370 60,642 140,012 0.50%
Mesothelioma 11,877 2,501 14,378 0.05%
TOTAL LUNG CANCER AND MESOTHELIOMA 91,247 63,143 154,390 0.56%
RESPIRATORY INFECTION
Lower respiratory infections 321,515 299,486 621,002 2.24%
Pertussis (whooping cough) 1,797 2,401 4,198 0.015%
Tuberculosis 7,108 3,834 10,942 0.04%
TOTAL RESPIRATORY INFECTION 330,420 305,721 636,142 2.3%
Other respiratory diseases 22,298 14,354 36,652 0.13%
Hospital patient-days due to ALL LUNG DISEASE 727,960 679,133 1,407,094 5.07% Notes: All diseases classified using ICD-10 codes (see Appendix table A1.1). It should be noted that one person could have multiple
hospitalisations.
Source: AIHW hospitals principal diagnosis data cubes.
There were more hospital patient-days for lung disease among males (727,960) than females
(679,133) in 2011-12 and this was true for all types of lung disease except for asthma, bronchiectasis
cystic fibrosis and whooping cough, where there were more patient-days among females compared
to males.
The average length of stay for all patients hospitalised with lung disease was 5.1 days. This is 1.7
times longer than the average length of stay for all-cause hospitalisations (3.0 days).
Burden (DALYs) attributable to lung disease in Australia Burden of disease can be quantified by adding the years of expected life that are lost due to
premature death (years of life lost, YLL) and the years lived with the disability due to the disease
(years of life disabled, YLD). The value of YLD for any given disease is determined by the magnitude
of the disability suffered by individuals with the disease and the duration of living with that
disability. The addition of these two components yields what is known as disability-adjusted life
years (DALYs). DALYs represent the burden of the disease.
7
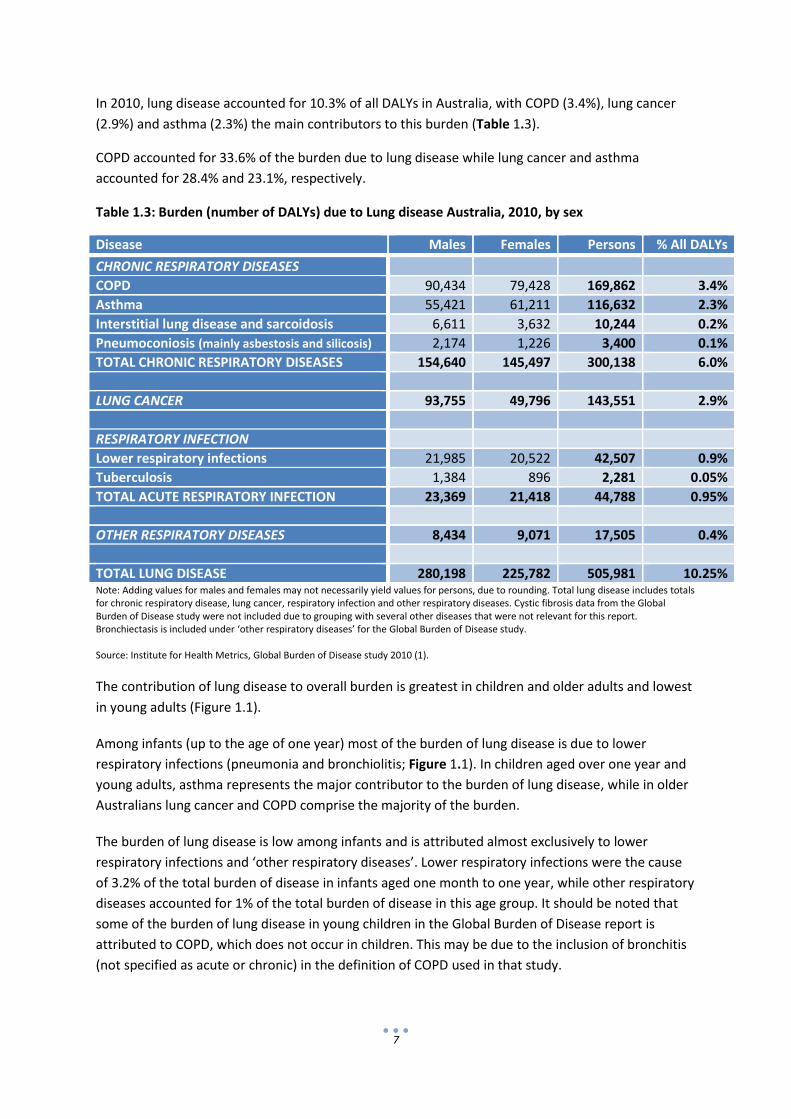
In 2010, lung disease accounted for 10.3% of all DALYs in Australia, with COPD (3.4%), lung cancer
(2.9%) and asthma (2.3%) the main contributors to this burden (Table 1.3).
COPD accounted for 33.6% of the burden due to lung disease while lung cancer and asthma
accounted for 28.4% and 23.1%, respectively.
Table 1.3: Burden (number of DALYs) due to Lung disease Australia, 2010, by sex
Disease Males Females Persons % All DALYs
CHRONIC RESPIRATORY DISEASES
COPD 90,434 79,428 169,862 3.4%
Asthma 55,421 61,211 116,632 2.3%
Interstitial lung disease and sarcoidosis 6,611 3,632 10,244 0.2%
Pneumoconiosis (mainly asbestosis and silicosis) 2,174 1,226 3,400 0.1%
TOTAL CHRONIC RESPIRATORY DISEASES 154,640 145,497 300,138 6.0%
LUNG CANCER 93,755 49,796 143,551 2.9%
RESPIRATORY INFECTION
Lower respiratory infections 21,985 20,522 42,507 0.9%
Tuberculosis 1,384 896 2,281 0.05%
TOTAL ACUTE RESPIRATORY INFECTION 23,369 21,418 44,788 0.95%
OTHER RESPIRATORY DISEASES 8,434 9,071 17,505 0.4%
TOTAL LUNG DISEASE 280,198 225,782 505,981 10.25% Note: Adding values for males and females may not necessarily yield values for persons, due to rounding. Total lung disease includes totals for chronic respiratory disease, lung cancer, respiratory infection and other respiratory diseases. Cystic fibrosis data from the Global Burden of Disease study were not included due to grouping with several other diseases that were not relevant for this report. Bronchiectasis is included under ‘other respiratory diseases’ for the Global Burden of Disease study. Source: Institute for Health Metrics, Global Burden of Disease study 2010 (1).
The contribution of lung disease to overall burden is greatest in children and older adults and lowest
in young adults (Figure 1.1).
Among infants (up to the age of one year) most of the burden of lung disease is due to lower
respiratory infections (pneumonia and bronchiolitis; Figure 1.1). In children aged over one year and
young adults, asthma represents the major contributor to the burden of lung disease, while in older
Australians lung cancer and COPD comprise the majority of the burden.
The burden of lung disease is low among infants and is attributed almost exclusively to lower
respiratory infections and ‘other respiratory diseases’. Lower respiratory infections were the cause
of 3.2% of the total burden of disease in infants aged one month to one year, while other respiratory
diseases accounted for 1% of the total burden of disease in this age group. It should be noted that
some of the burden of lung disease in young children in the Global Burden of Disease report is
attributed to COPD, which does not occur in children. This may be due to the inclusion of bronchitis
(not specified as acute or chronic) in the definition of COPD used in that study.

8
Figure 1.1: Burden (DALYs) due to lung disease as a proportion of total DALYs, Australia, 2010, by age
Source: Institute for Health Metrics, Global Burden of Disease study 2010 (1).
The burden of COPD increases with age and represents one of the major components of the total
burden of lung disease in older Australians. Among those aged 75-79 years, COPD accounts for
42.6% of the total burden of lung disease and 5.8% of the total burden of disease.
The burden of asthma peaks in children aged 5-9 years. In this age group, asthma represents 21% of
the burden of disease. In children aged 10-14 years asthma accounts for 18% of the total burden of
disease and then gradually decreases into adulthood and old age where the disease represents 0.8%
of the total burden among those aged 75-79 years.
Interstitial lung diseases and pneumoconiosis contribute up to 0.5% of the total burden of disease in
each age group. The burden of interstitial lung diseases and pneumoconiosis gradually increases
with age to 0.5% and 0.2%, respectively, among those aged 75-79 years.
The burden of lung cancer gradually increases with age, peaking at 6.2% of the total burden of
disease at 65-69 years. Among those aged 55-69 years, lung cancer accounts for almost half of the
burden of lung disease.
While COPD and lung cancer rank higher in terms of their total burden (Table 1.3), in 2010, asthma
was the leading cause of disability among people with lung disease in Australia (Table 1.4). This is
because asthma affects people of all ages, rather than affecting a predominantly older population
(as with COPD) and because asthma deaths occur mostly in older people, hence there is the
possibility of living with less than perfect health for a long period of time.
0
5
10
15
20
250
-6 d
ays
7-2
7 d
ays
28
-36
4 d
ays
1-4
yea
rs
5-9
yea
rs
10
-14
ye
ars
15
-19
ye
ars
20
-24
ye
ars
25
-29
ye
ars
30
-34
ye
ars
35
-39
ye
ars
40
-44
ye
ars
45
-49
ye
ars
50
-54
ye
ars
55
-59
ye
ars
60
-64
ye
ars
65
-69
ye
ars
70
-74
ye
ars
75
-79
ye
ars
% D
ALY
s
Age group
COPD
Asthma
Pneumoconiosis
Interstitial lung diseases
Other respiratory diseases
Lower respiratory infections
Tuberculosis
Lung cancer

9
Chronic respiratory disease accounted for 7.53% of all years lived with disability in Australia in 2010.
Asthma was responsible for 108,698 years of living with disability, that is 108,698 years lived with
less than perfect health (Table 1.4). Of all years lived with disability due to any disease, asthma
accounted for 4.0%, while COPD accounted for 3.4%. Respiratory infections were responsible for
6,452 years lived with disability (representing 0.3% of all years lived with disability due to any
disease) while lung cancer accounted for 0.1% of all years lived with disability. Respiratory infections
and lung cancer are both relatively short-duration illnesses. Hence people do not live with the
associated disability for very long.
Table 1.4: Years Lived with Disability (YLD) due to lung disease in Australia, 2010, by sex
Disease Males Females Persons % All YLDs
CHRONIC RESPIRATORY DISEASES
Asthma 51,931 56,767 108,698 4.0%
COPD 44,678 47,187 91,865 3.4%
Pneumoconiosis (mainly asbestosis and silicosis) 791 1,038 1,829 0.1%
Interstitial lung disease and sarcoidosis 387 250 637 0.03%
TOTAL CHRONIC RESPIRATORY DISEASES 97,787 105,242 203,029 7.53%
LUNG CANCER 1,300 716 2,016 0.1%
RESPIRATORY INFECTION
Lower respiratory infections 2,729 2,464 5,193 0.2%
Tuberculosis 756 503 1,259 0.1%
TOTAL RESPIRATORY INFECTION 3,485 2,967 6,452 0.3%
OTHER RESPIRATORY DISEASES 5,164 6,149 11,313 0.4%
ALL LUNG DISEASE 107,736 115,074 222,810 8.33% Note: “% All YLDs” refers to the proportion of total years of life lived with disability due to any disease. Cystic fibrosis data from the Global Burden of Disease study were not included due to grouping with several other diseases that were not relevant for this report. Bronchiectasis is included under ‘other respiratory diseases’ for the Global Burden of Disease study. Source: Institute for Health Metrics, Global Burden of Disease study 2010 (1).
10
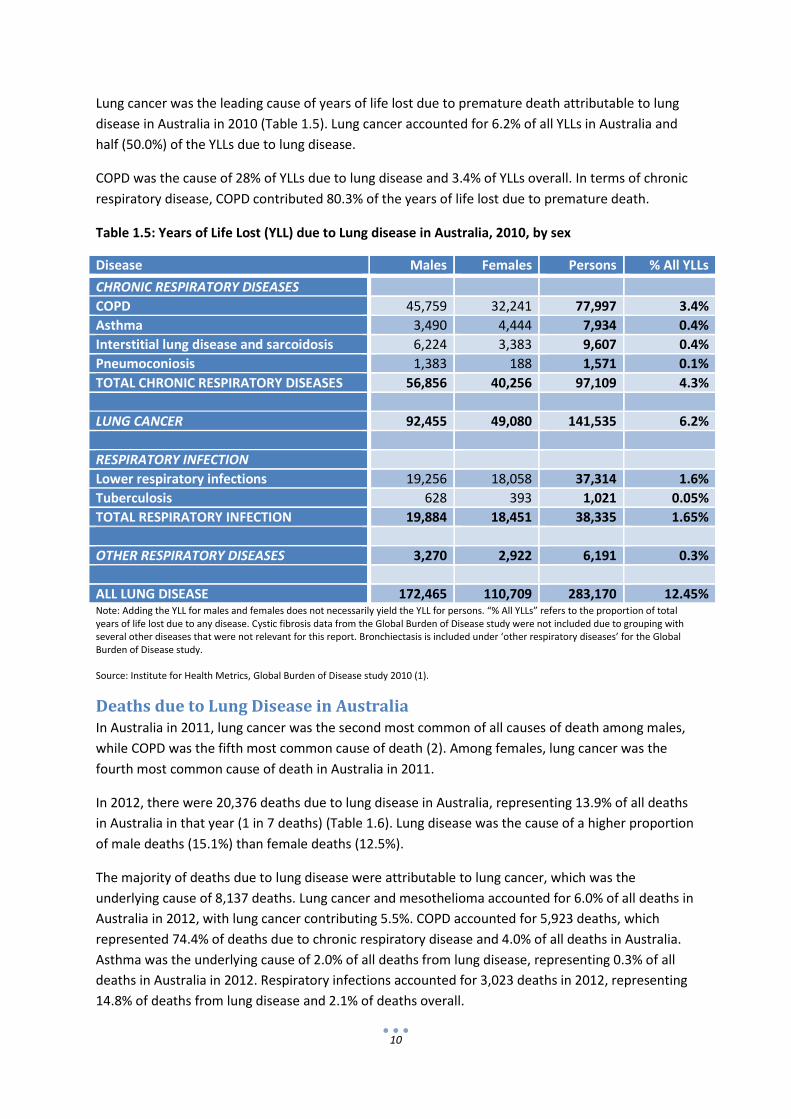
Lung cancer was the leading cause of years of life lost due to premature death attributable to lung
disease in Australia in 2010 (Table 1.5). Lung cancer accounted for 6.2% of all YLLs in Australia and
half (50.0%) of the YLLs due to lung disease.
COPD was the cause of 28% of YLLs due to lung disease and 3.4% of YLLs overall. In terms of chronic
respiratory disease, COPD contributed 80.3% of the years of life lost due to premature death.
Table 1.5: Years of Life Lost (YLL) due to Lung disease in Australia, 2010, by sex
Disease Males Females Persons % All YLLs
CHRONIC RESPIRATORY DISEASES
COPD 45,759 32,241 77,997 3.4%
Asthma 3,490 4,444 7,934 0.4%
Interstitial lung disease and sarcoidosis 6,224 3,383 9,607 0.4%
Pneumoconiosis 1,383 188 1,571 0.1%
TOTAL CHRONIC RESPIRATORY DISEASES 56,856 40,256 97,109 4.3%
LUNG CANCER 92,455 49,080 141,535 6.2%
RESPIRATORY INFECTION
Lower respiratory infections 19,256 18,058 37,314 1.6%
Tuberculosis 628 393 1,021 0.05%
TOTAL RESPIRATORY INFECTION 19,884 18,451 38,335 1.65%
OTHER RESPIRATORY DISEASES 3,270 2,922 6,191 0.3%
ALL LUNG DISEASE 172,465 110,709 283,170 12.45% Note: Adding the YLL for males and females does not necessarily yield the YLL for persons. “% All YLLs” refers to the proportion of total years of life lost due to any disease. Cystic fibrosis data from the Global Burden of Disease study were not included due to grouping with several other diseases that were not relevant for this report. Bronchiectasis is included under ‘other respiratory diseases’ for the Global Burden of Disease study. Source: Institute for Health Metrics, Global Burden of Disease study 2010 (1).
Deaths due to Lung Disease in Australia In Australia in 2011, lung cancer was the second most common of all causes of death among males,
while COPD was the fifth most common cause of death (2). Among females, lung cancer was the
fourth most common cause of death in Australia in 2011.
In 2012, there were 20,376 deaths due to lung disease in Australia, representing 13.9% of all deaths
in Australia in that year (1 in 7 deaths) (Table 1.6). Lung disease was the cause of a higher proportion
of male deaths (15.1%) than female deaths (12.5%).
The majority of deaths due to lung disease were attributable to lung cancer, which was the
underlying cause of 8,137 deaths. Lung cancer and mesothelioma accounted for 6.0% of all deaths in
Australia in 2012, with lung cancer contributing 5.5%. COPD accounted for 5,923 deaths, which
represented 74.4% of deaths due to chronic respiratory disease and 4.0% of all deaths in Australia.
Asthma was the underlying cause of 2.0% of all deaths from lung disease, representing 0.3% of all
deaths in Australia in 2012. Respiratory infections accounted for 3,023 deaths in 2012, representing
14.8% of deaths from lung disease and 2.1% of deaths overall.

11
Table 1.6: Deaths due to Lung Disease, Australia, 2012, by sex
Disease Males Females Persons % All deaths
CHRONIC RESPIRATORY DISEASES
COPD 3,292 2,631 5,923 4.0%
Interstitial lung disease and sarcoidosis 681 480 1,161 0.8%
Asthma 134 260 394 0.3%
Pneumoconiosis (mainly asbestosis and silicosis) 117 3 120 0.08%
Cystic fibrosis 12 20 32 0.02%
Bronchiectasis 116 216 332 0.2%
TOTAL CHRONIC RESPIRATORY DISEASES 4,352 3,610 7,962 5.41%
LUNG CANCER AND MESOTHELIOMA
Lung cancer 4,882 3,255 8,137 5.5%
Mesothelioma 538 100 638 0.4%
TOTAL LUNG CANCER AND MESOTHELIOMA 5,420 3,355 8,775 6.0%
RESPIRATORY INFECTION
Lower respiratory infections 1,264 1,737 3,001 2.04%
Pertussis (whooping cough) 3 0 3 0.002%
Tuberculosis 13 6 19 0.01%
TOTAL RESPIRATORY INFECTION 1,280 1,743 3,023 2.06%
OTHER RESPIRATORY DISEASES 279 337 616 0.4%
TOTAL DEATHS due to ALL LUNG DISEASE 11,331 9,045 20,376 13.9% Notes: All diseases classified using ICD-10 codes (see Appendix table A1.1).
Source: Causes of death, Australia, 2012 (3).
Conclusion Lung diseases are a major contributor to disability, premature mortality and health care utilisation in
Australia. The burden is evident in people of all ages although is greatest in the young and the
elderly.

12
CHAPTER 2. CHRONIC RESPIRATORY DISEASES In this chapter of the report, we present information on the prevalence, burden and health care
utilisation attributed to ‘chronic respiratory diseases’, by summarising information about asthma,
COPD, pneumoconiosis, cystic fibrosis, interstitial lung disease and bronchiectasis.
Chronic respiratory diseases accounted for:
7,962 deaths in 2012 (5.41% of all deaths in Australia)
97,109 years of life lost due to premature death (in 2010)
Over 300,000 DALYs in 2010
117,391 hospitalisations in 2011-12 (1.26% of all hospitalisations)
579,910 patient-days in 2011-12 (2.09% of all patient-days)
2.1 Asthma People with asthma experience breathlessness, chest tightness and episodes of wheezing, which are
associated with narrowing of the airways. Asthma affects people of all ages and represents a
substantial burden on the community, particularly among children.
Prevalence of asthma
In 2011-12, it was estimated that approximately 2.3 million people had asthma, representing 10.2%
of the Australian population (4). While the overall prevalence of asthma is similar in males
(1,047,300 males; 9.5%) and females (1,207,400 females; 10.9%), the pattern differs with age (Figure
2.1). The prevalence of asthma is higher in boys aged 0-14 years (11.4%) compared to girls of the
same age (7.2%) and higher in women compared to men from the age of 15 years onwards. Among
those aged 75 years and over, approximately 12.7% of females reported having the condition
compared to 8% of males.
Figure 2.1: Prevalence of asthma, Australia, 2011-12, by sex
Note: Based on self-reported doctor-diagnosed asthma and symptoms or treatment for asthma in the last 12 months.
Source: 2011-12 Australian Health Survey (4).
0
2
4
6
8
10
12
14
0-14 15-24 25-34 35-44 45-54 55-64 65-74 75+
Pre
vale
nce
(%
)
Age group (years)
Males
Females

13
Health care utilisation due to asthma
Asthma was managed at 2.2% of patient-GP encounters (visits) in 2012-13 (5).
In 2011-12, in Australia, there were 38,681 hospitalisations with a principal diagnosis of asthma
(Table 2.1). This represented 0.4% of all hospitalisations in Australia in that year and 173
hospitalisations per 100,000 people. The rate of hospitalisations for asthma was highest among
children aged 0-14 years, among whom the rate was 510 per 100,000 people, and was particularly
high in young boys (628 per 100,000 boys aged 0-14 years) (Figure 2.2). After the age of 15 years,
females have a higher rate of hospitalisation for asthma than males. This reflects the pattern of
prevalence of the disease by age and sex.
Table 2.1: Number and rate of hospitalisations for asthma, Australia, 2011-12, by sex
Age group (years)
Males Females Persons Males Females Persons
Number of hospitalisations Rate (per 100,000 population)
0-14 13,639 7,955 21,594 627.9 385.9 510.1
15-34 1,876 3,336 5,212 59.0 108.3 83.3
35-64 2,326 5,667 7,993 53.5 128.4 91.3
65-84 842 2,383 3,225 65.8 169.8 120.1
85 and over 135 522 657 97.1 197.3 162.8
ALL AGES 18,818 19,863 38,681 169.3 177.0 173.1 Note: Asthma classified according to ICD-10-AM codes J45 and J46.
Source: AIHW hospitals principal diagnosis data cubes.
Figure 2.2: Hospitalisations for asthma per 100,000 population, Australia, 2011-12, by sex
Note: Asthma classified according to ICD-10-AM codes J45 and J46.
Source: AIHW hospitals principal diagnosis data cubes.
0
100
200
300
400
500
600
700
0-14 15-34 35-64 65-84 85+ All ages
Ho
spit
alis
atio
ns
pe
r 1
00
,00
0 p
op
ula
tio
n
Age group (years)
Males
Females

14
There were 81,623 hospital patient-days attributed to asthma in 2011-12 (Table 2.2). There were
more hospital patient-days for asthma among females (49,411) than males (32,212).
Table 2.2: Number and rate of hospital patient-days for asthma, Australia, 2011-12, by sex
Age group (years)
Males Females Persons Males Females Persons
Number of patient days Rate (per 100,000 population)
0-14 19,617 11,974 31,591 903.1 580.9 746.2
15-34 3,650 7,035 10,685 114.8 228.5 170.7
35-64 5,685 16,754 22,439 130.8 379.6 256.2
65-84 2,726 10,628 13,354 212.9 757.1 497.5
85+ 534 3,020 3,554 384.0 1141.6 880.6
ALL AGES 32,212 49,411 81,623 289.7 440.3 365.4 Note: Asthma classified according to ICD-10-AM codes J45 and J46.
Source: AIHW hospitals principal diagnosis data cubes.
Overall, the rate of hospital patient-days for asthma in Australia in 2011-12 was 290 per 100,000
population among males and 440 per 100,000 among females (Table 2.2; Figure 2.3). Among
children, the rate of hospital patient-days was 903 per 100,000 population among boys and 581 per
100,000 population among girls aged 0-14 years. In older Australians, the rate of hospital patient-
days for asthma was much higher in females compared to males, particularly among those aged 65-
84 years where the rate among women (757 per 100,000 population) was 3.5 times higher than that
among men (213 per 100,000 population).
Figure 2.3: Hospital patient-days for asthma per 100,000 population, Australia, 2011-12, by sex
Note: Asthma classified according to ICD-10-AM codes J45 and J46.
Source: AIHW hospitals principal diagnosis data cubes.
0
200
400
600
800
1,000
1,200
0-14 15-34 35-64 65-84 85+ All ages
Pat
ien
t-d
ays
pe
r 1
00
,00
0 p
op
ula
tio
n
Age group (years)
Males
Females

15
Burden (DALYs) attributed to asthma
In 2010, asthma accounted for 116,632 DALYs which represented 2.3% of total DALYs in Australia
(Table 2.3). Overall, the burden was higher in females (2.6%) compared to males (2.1%) and much
higher in children compared to adults.
Table 2.3: Burden (number (%) of DALYs) attributed to asthma, Australia, 2010, by age and sex
Age group (years) Males Females Persons
1-4 1,172 (3.8) 1,168 (4.5) 2,339 (4.1)
5-9 6,879 (19) 6,896 (23) 13,775 (21)
10-14 8,814 (17) 8,957 (18) 17,771 (18)
15-19 6,018 (7.3) 6,144 (8.5) 12,162 (7.8)
20-24 4,173 (3.9) 4,314 (5.0) 8,487 (4.4)
25-29 3,158 (2.7) 3,382 (3.4) 6,540 (3.0)
30-34 2,466 (2.1) 2,784 (2.7) 5,249 (2.4)
35-39 2,499 (1.9) 2,866 (2.3) 5,366 (2.1)
40-44 2,583 (1.8) 2,858 (2.2) 5,441 (2.0)
45-49 2,752 (1.6) 3,206 (2.1) 5,958 (1.8)
50-54 2,776 (1.5) 3,197 (1.9) 5,973 (1.7)
55-59 2,670 (1.3) 3,092 (1.8) 5,762 (1.5)
60-64 2,630 (1.1) 3,036 (1.6) 5,666 (1.3)
65-69 2,132 (1.0) 2,415 (1.5) 4,547 (1.2)
70-74 1,682 (0.8) 2,024 (1.3) 3,706 (1.0)
75-79 1,300 (0.7) 1,711 (1.0) 3,012 (0.8)
ALL AGES 55,421 (2.1) 61,211 (2.6) 116,632 (2.3) Source: Institute for Health Metrics and Evaluation, University of Washington, GBD cause patterns.
Among children aged 0-14 years, there were 16,865 DALYs attributed to asthma among boys
(equivalent to 776 per 100,000 population) and 17,021 DALYs among girls (826 per 100,000
population). Among those aged 65 years and over, there were 5,115 DALYs due to asthma among
men (5,115 per 100,000 population) and 6,150 among women (6,150 per 100,000 population; Figure
2.4).
Figure 2.4: Burden (DALYs) due to asthma per 100,000 population, Australia, 2010, by age and sex
Source: Institute for Health Metrics and Evaluation, University of Washington, GBD cause patterns.
0
100
200
300
400
500
600
700
800
900
0-14 15-34 35-64 65+ All ages
DA
LYs
pe
r 1
00
,00
0 p
op
ula
tio
n
Age group (years)
Males
Females

16
Asthma represented 19% of the total burden of disease among boys and 23% among girls aged 5-9
years. Among children aged 10-14 years, asthma accounted for 17% and 18% of the total burden
among boys and girls, respectively (Figure 2.5).
In contrast, asthma represented less than 2% of the total burden of disease among males and
females aged 50 years or more. Among those aged 35-64 years, asthma accounted for 18,255 DALYs
among females and 15,911 DALYs among males. See also Figure 1.1.
Figure 2.5: Percent of total burden (DALYs) due to asthma, Australia, 2010, by age and sex
Source: Institute for Health Metrics and Evaluation, University of Washington, GBD cause patterns.
Asthma contributes the highest proportion of years lived with disability (YLD) of all lung diseases (see
Table 1.4). This is because asthma affects people of all ages, rather than affecting a predominantly
older population (as with other chronic respiratory diseases such as COPD) and because asthma
deaths occur mostly in older people. Therefore, there is the possibility of living with asthma (and
with its associated disability) for a long period of time.
In 2010, asthma was responsible for 108,698 years of living with disability, that is, 108,698 years
lived with less than perfect health. Of all years lived with disability due to any disease, asthma
accounted for 4.0%.
0
5
10
15
20
25
1-4
5-9
10
-14
15
-19
20
-24
25
-29
30
-34
35
-39
40
-44
45
-49
50
-54
55
-59
60
-64
65
-69
70
-74
75
-79
% D
ALY
s
Age group (years)
Males
Females

17
Table 2.4: Percent of total YLD, YLL and DALYs due to asthma, Australia, 2010, by age
Age group (years) % all YLD % all YLL % all DALYs
1-4 6.6 0.4 4.1
5-9 24.0 0.7 21.0
10-14 20.0 1.5 18.0
15-19 10.0 0.6 7.8
20-24 5.7 0.6 4.4
25-29 3.8 0.6 3.0
30-34 3.0 0.5 2.4
35-39 2.7 0.5 2.1
40-44 2.6 0.6 2.0
45-49 2.5 0.5 1.8
50-54 2.5 0.4 1.7
55-59 2.4 0.4 1.5
60-64 2.3 0.4 1.3
65-69 2.2 0.3 1.2
70-74 2.0 0.3 1.0
75-79 1.9 0.2 0.8
ALL AGES 4.0 0.4 2.3 Source: Institute for Health Metrics and Evaluation, University of Washington, GBD cause patterns.
Deaths due to asthma
About 1 in 50 deaths due to lung disease are attributed to asthma. In 2012, there were 394 deaths
due to asthma in Australia, which represented 0.27% of all deaths in Australia in that year (3). There
were 134 deaths due to asthma among males (representing 0.18% of all deaths among males) and
260 deaths due to asthma among females (representing 0.36% of all deaths among females).
Risk factors for asthma
Risk factors for the development of asthma include:
a family history of asthma, eczema or allergic rhinitis
exposure to environmental tobacco smoke in utero or in infancy
the presence of allergic disease (including allergic rhinitis or eczema) early in life
exposure to occupational sensitisers or irritants (e.g. chemicals).
Furthermore, among people with asthma, symptoms and airway narrowing can be triggered by viral
infections, irritants (for example tobacco smoke and other air pollutants), airborne allergen exposure
(for example house dust mites, pollens, mould spores, animal dander), occupational sensitisers and
irritants, certain food chemicals or additives and exercise.
18
2.2 Chronic Obstructive Pulmonary Disease (COPD) Chronic obstructive pulmonary disease (COPD) is a progressive, long-term disease of the lungs that
mainly affects older people. COPD is characterised by airflow limitation that is not fully reversible
with bronchodilator medications. In everyday language COPD is often referred to as emphysema or
chronic bronchitis.
People with COPD experience shortness of breath, which occurs initially on strenuous exertion but in
time with minimal or no exertion, as well as cough and wheeze. COPD is commonly associated with
comorbidities such as cardiovascular disease and diabetes mellitus, sometimes because of shared
outcomes from common risk factors, such as smoking, but also because of systemic effects of COPD
(6, 7).
Prevalence of COPD
In 2011-12, the Australian Health Survey estimated that 529,100 people had self-reported that they
had a diagnosis of emphysema, chronic bronchitis or COPD (4). The prevalence of COPD increases
with age. Among those aged 55-64, 65-74 and 75 years and over, approximately 4.6%, 6.5% and
6.7% of Australians, respectively, reported having COPD as a long-term condition.
The Burden of Obstructive Lung Disease (BOLD) study estimated, based on lung function testing, that
7.5% (95% CI 5.7-9.4) of Australians aged 40 years and over and 29.2% (95% CI 18.1-40.2) of people
aged 75 years and over had COPD, defined as post-bronchodilator forced expiratory volume in one
second (FEV1) to forced vital capacity (FVC) ratio of 0.70 or less and post-bronchodilator FEV1 less
than 80% of the predicted value for their age and sex (GOLD Stage II or higher) (8). That equates to
over 770,000 Australians, including 410,000 people aged 75 years and over (2011 population). In
total, 1.49 million (14.5%) Australians aged 40 years and over had airflow limitation defined as
FEV1/FVC ratio of <0.7 (8).
However, fewer people reported ever being diagnosed with chronic bronchitis, emphysema or
COPD, with only 5.2% (95% CI 4.2-6.2%) of people aged 40 years and over (approx. 534,000 people)
and 6.2% (95% CI 3.5-8.9%) of people aged 75 years and over (87,000 people) reporting ever being
diagnosed.
Health care utilisation due to COPD
COPD was managed at 0.5% of general practice encounters in 2012-13 (5).
The next section of the report presents statistics about hospitalisations due to COPD among those
aged 55 years and over, since the condition mainly affects older people.
In 2011-12 there were 59,265 hospitalisations for COPD among people aged 55 years and over in
Australia. This represented 1.2 % of all hospitalisations and 1,049 hospitalisations per 100,000
people aged 55 years and over in Australia in that year.

19
Table 2.4: Number & rate of hospitalisations for COPD, people aged 55+, Australia, 2011-12, by sex
Age group (years) Males Females Persons Males Females Persons
Number of hospitalisations Rate (per 100,000 population)
55-64 5,182 5,315 10,497 407 412 410
65-74 10,140 8,905 19,045 1,219 1,047 1,132
75-84 11,675 8,673 20,348 2,600 1,567 2,030
85+ 5,111 4,264 9,375 3,675 1,612 2,323
ALL PEOPLE AGED 55+ 32,108 27,157 59,265 1,192 918 1,049 Note: COPD classified according to ICD-10-AM codes J40- J44.
Source: AIHW hospitals principal diagnosis data cubes.
The rate of hospitalisations for COPD in 2011-12 increased with age (Table 2.4; Figure 2.6). The rate
was higher among males (1,192 per 100,000 males aged 55 and over) compared to females (918 per
100,000 females aged 55 and over). The disparity in the hospitalisation rate for COPD between
males and females was greatest among those aged 85 years and over. In this age group, the rate of
hospitalisations for COPD was more than twice as high among males (3,675 per 100,000 males aged
85 and over) compared to females (1,612 per 100,000 females aged 85 and over).
Figure 2.6: Hospitalisations for COPD per 100,000 population, people aged 55 years and over, Australia, 2011-12, by sex
Note: COPD classified according to ICD-10-AM codes J40-J44.
Source: AIHW hospitals principal diagnosis data cubes.
In 2011-12, there were 365,760 patient-days for COPD among people aged 55 years and over. Males
had more patient-days due to COPD (193,028) than females (172,732).
Overall, the rate of patient-days for COPD was 7,168 per 100,000 population age 55 years and over
among males and 5,841 per 100,000 population age 55 years and over among females.
0
500
1,000
1,500
2,000
2,500
3,000
3,500
4,000
55-64 65-74 75-84 85+ 55+
Ho
spit
alis
atio
ns
pe
r 1
00
,00
0 p
op
ula
tio
n
Age group (years)
Males
Females

20
Table 2.5: Number and rate of hospital patient-days for COPD, people aged 55 years and over, Australia, 2011-12, by sex
Age group (years) Males Females Persons Males Females Persons
Number of patient-days Rate (per 100,000 population)
55-64 24,728 28,194 52,922 1,942 2,188 2,066
65-74 57,817 54,370 112,187 6,953 6,394 6,670
75-84 73,828 58,700 132,528 16,443 10,607 13,221
85+ 36,655 31,468 68,123 26,357 11,896 16,879
ALL PEOPLE AGED 55+ 193,028 172,732 365,760 7,168 5,841 6,474 Note: COPD classified according to ICD-10-AM codes J40- J44. Data included here are only for people aged 55 years and over, but this
includes 95% of all patient-days attributed to COPD among males and 93% of all patient-days attributed to COPD for females.
Source: AIHW hospitals principal diagnosis data cubes.
Among males, the rate of patient-days for COPD increased with increasing age and was highest in
males aged 85 years and over (26,357 per 100,000 population). The disparity between the rate of
patient-days for COPD between males and females also increased with age. Among those aged 55-64
years, there were similar rates of hospital patient-days for COPD for males (1,942 per 100,000
population) and females (2,188 per 100,000 population) but among those aged 85 years and over,
the rate among males (26,357 per 100,000 population) was more than double the rate among
females (11,896 per 100,000 population).
Figure 2.7: Patient-days for COPD per 100,000 population, people aged 55 and over, Australia, 2011-12, by sex
Note: COPD classified according to ICD-10-AM codes J40-J44.
Source: AIHW hospitals principal diagnosis data cubes.
Burden (DALYs) attributed to COPD
Among older Australians, the burden of COPD represents one of the major components of the total
burden of lung disease (see Figure 1.1). In 2010, it was estimated that COPD accounted for 169,862
DALYs, which represented 3.4% of the total DALYs in Australia and one third of the burden due to
0
5,000
10,000
15,000
20,000
25,000
30,000
55-64 65-74 75-84 85+ 55+
Pat
ien
t-d
ays
pe
r 1
00
,00
0 p
op
ula
tio
n
Age group (years)
Males
Females

21
lung disease. The burden was higher in males (90,434 DALYs) than females (79,428 DALYs) and
increased with age (Figure 2.8).
COPD accounted for 3.4% of total DALYs among those aged 55-59 years and 5.8% of total DALYs
among those aged 75-79 years. Among those aged 55 years and over, there were 91,563 DALYs due
to COPD, including 49,666 DALYs among males and 41,897 DALYs among females.
Figure 2.8: Burden (DALYs) due to COPD per 100,000 population, people aged 55 and over, Australia, 2010, by age and sex
Source: Institute for Health Metrics and Evaluation, University of Washington, GBD cause patterns.
Deaths due to COPD
Approximately 1 in 3 deaths due to lung disease in Australia are attributed to COPD.
In 2012, there were 5,923 deaths due to COPD in Australia (all ages), which represented 4.0% of all
deaths in Australia in that year. There were 3,292 deaths due to COPD among males (representing
4.4% of all deaths among males) and 2,631 deaths due to asthma among females (representing 3.6%
of all deaths among females).
In Australia in 2011, there were 5,767 deaths due to COPD among people aged 55 and over (102 per 100,000 people aged 55+), which represented 4.4% of all deaths in that age group in that year (9).
Risk factors for COPD
The predominant cause of COPD is tobacco smoking (10), although COPD can also occur in non-
smokers, which indicates that genetic and/or other environmental factors are also likely to be
involved.
A diagnosis of COPD is more likely in individuals with a history of childhood respiratory infections,
pulmonary tuberculosis, or chronic asthma and among those who have been exposed to
occupational fumes and dusts, biomass fuels or outdoor air pollution (11).
0
500
1,000
1,500
2,000
2,500
3,000
3,500
4,000
4,500
5,000
55-59 60-64 65-69 70-74 75-79
DA
LYs
pe
r 1
00
,00
0 p
op
ula
tio
n
Age group (years)
Males
Females

22
2.3 Pneumoconiosis Pneumoconiosis is an occupational lung disease that leads to restriction of the lungs. The disease is
caused by the inhalation of mineral dust or inorganic particles. Most affected people have been
exposed to these dusts in the course of mining or tunnelling work. The most common forms of
pneumoconiosis that occur in Australia are asbestosis and silicosis. The disease can be prevented by
adequate occupational health and safety controls that limit exposure at work to these harmful dusts.
Pneumoconiosis is a disease with a long latency and in the early stages those who have the disease
are asymptomatic. However, as the disease progresses it is associated with significant
breathlessness causing disability and, for many, premature death (12).
Prevalence of Pneumoconiosis
There are no nationally representative datasets that allow for the estimate of the prevalence of
pneumoconiosis in Australia.
In the absence of these data there are two data sources that can provide information about
notifications about this disease. The Surveillance and Australian Workplace Based Respiratory
Events (SABRE) collected data from Victoria and Tasmania since 1997 and New South Wales from
2001. The National Data Set for Compensation-based Statistics (NDSCS) is maintained by The
National Occupational Health and Safety Commission (NOHSC). However, it is important to note that
these systems rely on voluntary notification and do not represent a complete enumeration of cases.
Reports from SABRE in NSW showed there were 366 notified cases of asbestosis and 87 notified
cases of silicosis from 2001 to July 2008 (website data, no longer accessible, but cited in AIHW report
referenced below). In Victoria and Tasmania, there were around 90 SABRE notifications of
pneumoconiosis from 1999 to 2005 (Report by Sim et al. 2005 original unavailable but cited in AIHW
report referenced here (13). Data from the NDSCS that was reported in the Compendium of
Workers' Compensation Statistics Australia 2005–06 showed that there were 245 successful
compensation claims for asbestosis and 20 claims for silicosis in 2004–05.
Health care utilisation due to pneumoconiosis
This section of the report presents statistics about hospitalisations due to pneumoconiosis. It is
limited to people aged 30 years and over, since the condition only affects adults.
23
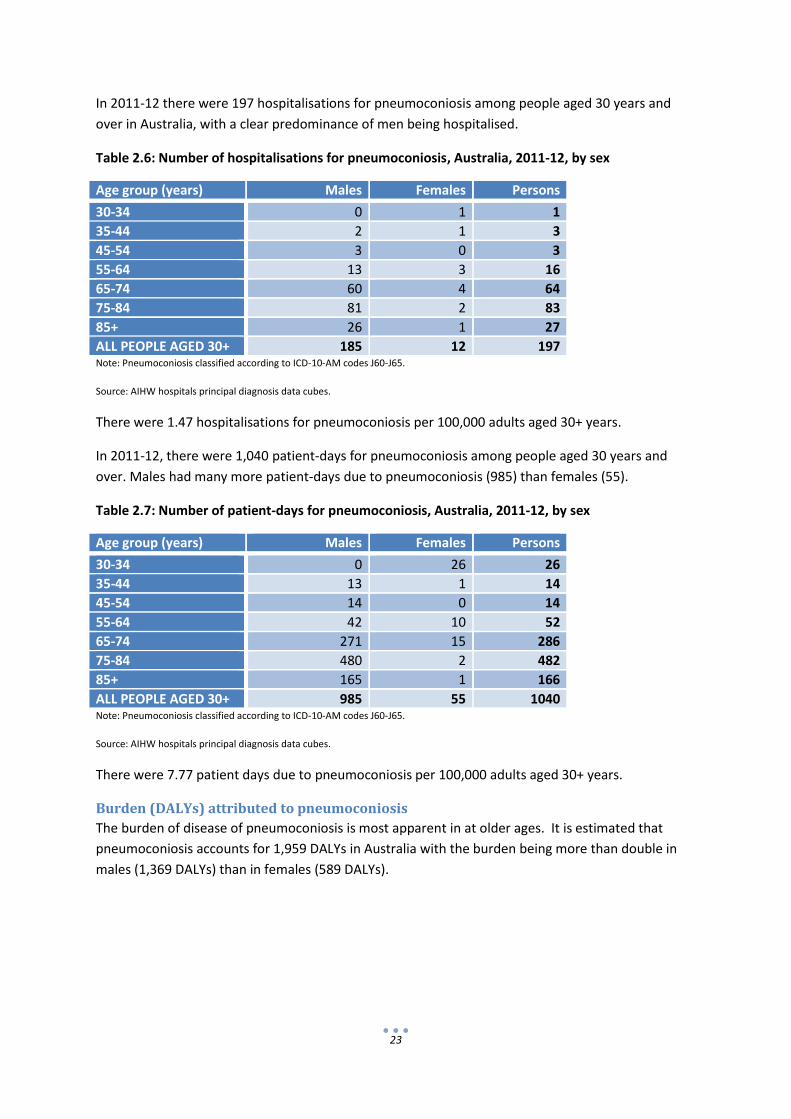
In 2011-12 there were 197 hospitalisations for pneumoconiosis among people aged 30 years and
over in Australia, with a clear predominance of men being hospitalised.
Table 2.6: Number of hospitalisations for pneumoconiosis, Australia, 2011-12, by sex
Age group (years) Males Females Persons
30-34 0 1 1
35-44 2 1 3
45-54 3 0 3
55-64 13 3 16
65-74 60 4 64
75-84 81 2 83
85+ 26 1 27
ALL PEOPLE AGED 30+ 185 12 197 Note: Pneumoconiosis classified according to ICD-10-AM codes J60-J65.
Source: AIHW hospitals principal diagnosis data cubes.
There were 1.47 hospitalisations for pneumoconiosis per 100,000 adults aged 30+ years.
In 2011-12, there were 1,040 patient-days for pneumoconiosis among people aged 30 years and
over. Males had many more patient-days due to pneumoconiosis (985) than females (55).
Table 2.7: Number of patient-days for pneumoconiosis, Australia, 2011-12, by sex
Age group (years) Males Females Persons
30-34 0 26 26
35-44 13 1 14
45-54 14 0 14
55-64 42 10 52
65-74 271 15 286
75-84 480 2 482
85+ 165 1 166
ALL PEOPLE AGED 30+ 985 55 1040 Note: Pneumoconiosis classified according to ICD-10-AM codes J60-J65.
Source: AIHW hospitals principal diagnosis data cubes.
There were 7.77 patient days due to pneumoconiosis per 100,000 adults aged 30+ years.
Burden (DALYs) attributed to pneumoconiosis
The burden of disease of pneumoconiosis is most apparent in at older ages. It is estimated that
pneumoconiosis accounts for 1,959 DALYs in Australia with the burden being more than double in
males (1,369 DALYs) than in females (589 DALYs).

24
Figure 2.9: Burden (DALYs) per 100,000 adults due to pneumoconiosis, Australia, 2010, by age and
sex
Deaths due to pneumoconiosis
In 2012, there were 120 deaths (0.14 per 100,000 adults aged 30 or more years) attributed to
pneumoconiosis in Australia, with males accounting for 117 (97.5%) of the deaths.
2.4 Interstitial lung disease Interstitial lung disease refers to over 200 entities that affect the interstitium of the lung. They share
similar radiological and clinical characteristics.
There are no nationally representative datasets with which to calculate an Australian prevalence
(14).
Health care utilisation due to interstitial lung disease
In 2011-12 there were 4,050 hospitalisations due to interstitial lung disease. The number of
hospitalisations increased with age.
Table 2.8: Number and rate of hospitalisations for interstitial lung disease, Australia, 2011-12, by
sex
Age group (years) Males Females Persons Male Female Persons
Number of hospitalisations Rate (per 100,000 population)
0-14 16 16 32 0.7 0.8 0.8
15-34 43 71 114 1.4 2.3 1.8
35-64 461 379 840 10.6 8.6 9.6
65+ 1,675 1,389 3064 118.0 83.3 99.2
ALL PEOPLE 2,195 1,855 4,050 19.7 16.5 18.1 Note: Interstitial Lung Disease classified according to ICD-10-AM codes D86.0, D86.2, D86.9, J84.
Source: AIHW hospitals principal diagnosis data cubes.
In 2011-12 there were 28,232 patient-days due to interstitial lung disease with males and females
being fairly evenly represented. The number of patient-days spent in hospital increased with age.
0
10
20
30
40
50
60
70
80
30-39 40-49 50-59 60-69 70+
DA
LYs
pe
r 1
00
,00
po
pu
lati
on
Age group (years)
Males
Females

25
Table 2.9: Number of and rate patient-days for interstitial lung disease, Australia, 2011-12, by sex
Age group (years) Males Females Persons Male Female Persons
Number of patient days Rate (per 100,000 population)
0-14 133 54 32 6.1 2.6 4.4
15-34 82 195 114 2.6 6.3 4.4
35-64 2,211 1,821 840 50.9 41.3 46.0
65+ 12,753 10,983 3064 898.4 658.3 768.7
ALL PEOPLE 15,179 13,053 28,232 137.5 116.3 126.4 Note: Interstitial Lung Disease classified according to ICD-10-AM codes D86.0, D86.2, D86.9, J84.
Source: AIHW hospitals principal diagnosis data cubes.
Burden (DALYs) attributed to interstitial lung disease
The burden of disease of interstitial lung disease is most apparent in the adult age range from 30
years and older. It is estimated that interstitial lung disease overall accounts for 7,611 DALYs in
Australia. The burden is 140 DALYs in ages less than 30 years. The burden due to interstitial lung
disease is more than double in males (5,032 DALYs) than in females (2,578 DALYs).
Figure 2.10: Burden (DALYs) per 100,000 adults due to interstitial lung disease, Australia, 2010, by age and sex
Deaths due to interstitial lung disease
In 2012, there were 1,161 (5.2 per 100,000 population) deaths due to interstitial lung disease in
Australia, with males accounting for 681 (58.7%) of the deaths.
2.5 Cystic fibrosis Cystic fibrosis is a recessively inherited (genetic) condition that mostly affects the lungs and digestive
system but has a range of other manifestations. In the lungs the secretions are thicker and less able
to be cleared which means that patients with this condition are predisposed to the development of
infections. It often leads to airflow limitation (obstruction) and bronchiectasis. The disease is
present from birth but is sometimes not diagnosed until some months or years after birth.
0
50
100
150
200
250
300
30-39 40-49 50-59 60-69 70+
DA
LYs
pe
r 1
00
,00
0 p
op
ula
tio
n
Age group (years)
Males
Females

26
In Australia, one in 2,500 babies is born with Cystic Fibrosis (data cited on
http://www.cysticfibrosis.org.au/all/learn/). The Australian Cystic Fibrosis Data Registry (ACFDR)
held records of 3,156 people of all ages with cystic fibrosis at 31 December 2012.
Health care utilisation due to cystic fibrosis
In 2011-2012 there were 4,040 hospitalisations due to cystic fibrosis with males and females being
fairly evenly represented. The number of hospitalisations decreased with age reflecting the reduced
life expectancy of people with cystic fibrosis.
Table 2.10: Number and rate of hospitalisations for cystic fibrosis, Australia, 2011-12, by sex
Age group (years) Males Females Persons Male Female Persons
Number of hospitalisations Rate (per 100,000 population)
0-14 461 479 940 21.2 23.2 22.2
15-34 1,080 1,198 2,278 34.0 38.9 36.4
35-64 440 373 813 10.1 8.5 9.3
65+ 1 8 9 0.1 0.5 0.3
ALL PEOPLE 1,982 2,058 4,040 17.8 18.3 18.1 Note: Cystic fibrosis classified according to ICD-10-AM code E84.
Source: AIHW hospitals principal diagnosis data cubes.
In 2011-2012 there were 43,231 patient-days due to cystic fibrosis with the males and females being
fairly evenly represented. The number of patient-days spent in hospital decreased with age.
Table 2.11: Number and rate of hospital patient-days for cystic fibrosis, Australia, 2011-12, by sex
Age group (years) Males Females Persons Male Female Persons
Number of patient days Rate (per 100,000 population)
0-14 3,495 4,150 7,645 160.9 201.3 180.6
15-34 11,525 13,294 24,819 362.4 431.8 396.5
35-64 5,710 4,995 10,705 131.4 113.2 122.2
65+ 2 60 62 0.1 3.6 2.0
ALL PEOPLE 20,732 22,499 43,231 186.5 200.5 193.5 Note: Cystic fibrosis classified according to ICD-10-AM code E84.
Source: AIHW hospitals principal diagnosis data cubes.
Burden (DALYs) attributed to cystic fibrosis
In the GBD study CF is grouped under ‘other endocrine, nutritional, blood and immune disorders’.
There are no separate data on the burden of cystic fibrosis in the GBD study.
Deaths due to cystic fibrosis
In 2012, there were 32 (0.14 per 100,000 population) deaths due to cystic fibrosis in Australia, with
females accounting for 20 (62.5%) of the deaths.
2.6 Non-CF Bronchiectasis Bronchiectasis is characterised by abnormal and irreversible dilation of the airways. Patients often
have a chronic cough with the production of sputum. This disease is also associated with increased
respiratory infections.
27
Bronchiectasis most commonly occurs together with other respiratory conditions so that it is often
not the primary condition but a consequence of other respiratory conditions. There are no
nationally representative datasets to estimate the prevalence of bronchiectasis. However, in a study
of indigenous children the incidence rate of bronchiectasis confirmed by high resolution
computerised tomography (HRCT) was estimated to be 14.7 per 1,000 indigenous children (15).
Health care utilisation due to bronchiectasis
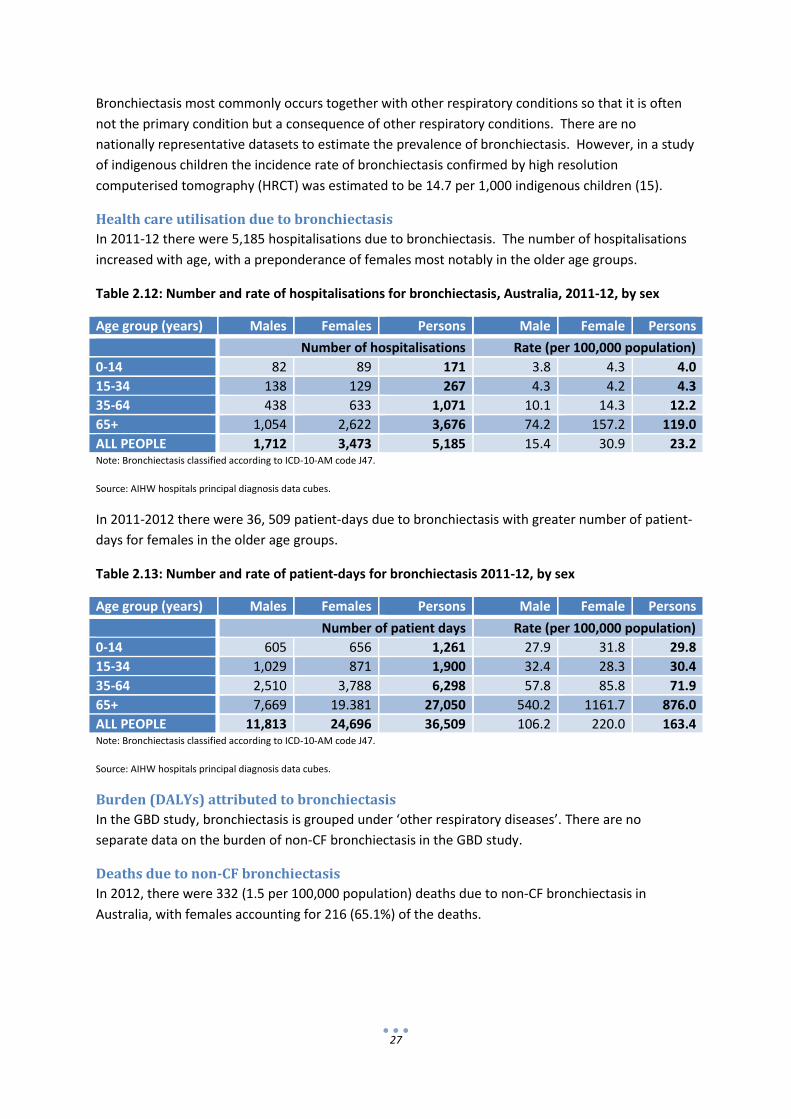
In 2011-12 there were 5,185 hospitalisations due to bronchiectasis. The number of hospitalisations
increased with age, with a preponderance of females most notably in the older age groups.
Table 2.12: Number and rate of hospitalisations for bronchiectasis, Australia, 2011-12, by sex
Age group (years) Males Females Persons Male Female Persons
Number of hospitalisations Rate (per 100,000 population)
0-14 82 89 171 3.8 4.3 4.0
15-34 138 129 267 4.3 4.2 4.3
35-64 438 633 1,071 10.1 14.3 12.2
65+ 1,054 2,622 3,676 74.2 157.2 119.0
ALL PEOPLE 1,712 3,473 5,185 15.4 30.9 23.2 Note: Bronchiectasis classified according to ICD-10-AM code J47.
Source: AIHW hospitals principal diagnosis data cubes.
In 2011-2012 there were 36, 509 patient-days due to bronchiectasis with greater number of patient-
days for females in the older age groups.
Table 2.13: Number and rate of patient-days for bronchiectasis 2011-12, by sex
Age group (years) Males Females Persons Male Female Persons
Number of patient days Rate (per 100,000 population)
0-14 605 656 1,261 27.9 31.8 29.8
15-34 1,029 871 1,900 32.4 28.3 30.4
35-64 2,510 3,788 6,298 57.8 85.8 71.9
65+ 7,669 19.381 27,050 540.2 1161.7 876.0
ALL PEOPLE 11,813 24,696 36,509 106.2 220.0 163.4 Note: Bronchiectasis classified according to ICD-10-AM code J47.
Source: AIHW hospitals principal diagnosis data cubes.
Burden (DALYs) attributed to bronchiectasis
In the GBD study, bronchiectasis is grouped under ‘other respiratory diseases’. There are no
separate data on the burden of non-CF bronchiectasis in the GBD study.
Deaths due to non-CF bronchiectasis
In 2012, there were 332 (1.5 per 100,000 population) deaths due to non-CF bronchiectasis in
Australia, with females accounting for 216 (65.1%) of the deaths.

28
CHAPTER 3. LUNG CANCER AND MESOTHELIOMA This chapter reviews information on two major malignant neoplasms affecting the respiratory
system: lung cancer and mesothelioma. Mesothelioma is a malignant neoplasm that affects the
pleura (lining of the lungs), the peritoneum (lining of the gut) and pericardium (lining of the heart).
Pleural mesothelioma is the most.
Included is information on the incidence, risk factors and approaches to risk reduction. Where
available, we present the available data on burden of disease in Australia for lung cancer from the
Global Burden of Disease Study, and information on mortality in Australia due to these malignant
neoplasms. Finally we present data hospitalisation rates in Australia.
Risk factors
Lung Cancer
The major risk factor for lung cancer is smoking. While active smoking is, by far, the strongest risk
factor for lung cancer, there is evidence that passive smoking, that is, exposure to environmental
tobacco smoke or second-hand tobacco smoke, certain chronic infections, occupational exposure to
carcinogenic dust particles, in particular, asbestos, environmental air pollution, other pre-existing
lung disease including COPD and pulmonary fibrosis, exposure to ionizing radiation and certain drugs
are also associated with an increased risk of developing lung cancer (16).
Mesothelioma
The major risk factor for mesothelioma is exposure to asbestos. Exposure has mainly occurred
through past occupational settings preceding the cessation of production using asbestos fibre
products. Other environmental exposures, including domestic exposure, have also been
documented.

29
Incidence
Lung Cancer
In 2010, there were 10,296 newly diagnosed cases of lung cancer reported (Table 3.1). Lung cancer
does not generally affect children (data not shown), and is rare among young people. The incidence
of lung cancer rises steeply with increasing age.
Table 3.1: Number and rate of new lung cancer diagnoses, people aged 35 & over, Australia, 2010, by age & sex
Age group (years)
Males Females Persons Cases per 100,000 population
35-64 1,262 1,743 3,006 34.31
65-84 2,346 3,901 6,247 232.73
85 and over 424 591 1,015 251.55
Total cases 4,045 6,251 10,296 46.09
Notes: ICD-10-AM Principal diagnosis codes C33 and C34
Total includes cases reported among persons aged less than 35 years.
Source: Australian cancer incidence and mortality book (16)
Australian Bureau Estimated Resident Population of Australia, 2011, by age.
The incidence of lung cancer is higher in men than women. However, over the period 1982 to 2010,
the incidence of lung cancer declined among males and increased among females (Figure 3.1). This is
likely to reflect patterns in smoking over the preceding decades.
Figure 3.1: Age-standardised incidence rate of lung cancer in Australia, 1982-2010, by sex
Sources: Australian cancer incidence and mortality book (16)
0
10
20
30
40
50
60
70
80
90
1980 1985 1990 1995 2000 2005 2010
Age
-sta
nd
ard
ise
d in
cid
en
ce r
ate
Year of diagnosis
Males Females

30
Mesothelioma
In 2010, there were 667 newly diagnosed cases of mesothelioma reported (Table 3.2).
Mesothelioma is extremely rare among children and young people.
Table 3.2 Number and rate of new mesothelioma diagnoses (all sites), people aged 35 & over, Australia, 2010, by age & sex
Age group (years)
Males Females Persons Cases per 100,000 population
35-64 111 38 149 1.70
65-84 369 70 439 16.36
85 and over 63 15 78 19.30
Total cases 543 124 667 2.99
Notes: ICD-10-AM Principal diagnosis codes C45
Total includes cases reported among persons aged less than 35 years.
Source: Australian cancer incidence and mortality book (AIHW 17)
Australian Bureau Estimated Resident Population of Australia, 2011, by age.
The incidence of mesothelioma is higher in men than women. Over the period 1982 to 2010, the
incidence of mesothelioma increased among males and females (Figure.3.2).
Figure.3.2: Age-standardised incidence rate of mesothelioma in Australia, 1982-2010, by sex
Source: Australian cancer incidence and mortality book (17)
0
1
2
3
4
5
6
7
1980 1985 1990 1995 2000 2005 2010
Age
-sta
nd
ard
ise
d in
cid
en
ce r
ate
Year of diagnosis
Males Females

31
Burden of disease The Global Burden of Disease (GBD) study (1), included the estimation of disability adjusted life years
(DALYs) for lung cancer. Separate estimates for mesothelioma were not produced in the study,
therefore burden of disease for mesothelioma were not able to be included in this report.
DALYs are calculated by summing estimated years of life lost due to premature death (YLL) and years
lived with disability due to the disease (YLD). Estimates of DALYs in the GBD (1) for lung cancer differ
from those estimates of lung cancer burden that have been reported from the Australian Burden of
Disease Database (18). This is due to differences in the methods used to calculate YLLs. As the
Australian Burden of Disease Database is limited in the range of conditions addressed, we have
presented data from the GBD estimates to be consistent with other parts of this report.
In 2010 there were over 143,000 DALYs in Australia attributed to lung cancer (Table 3.3). Lung
cancer was the leading cause of burden of disease due to cancer in 2010, contributing 17.5% of
DALYs attributed to cancer in Australia. Overall, lung cancer contributed almost 3% of 5 million
DALYs for disease and injury in Australia in 2010.
Table 3.3: Burden (DALYs) due to lung cancer, people aged 15 years and over, Australia, 2010, by age
Age group (years) Disability adjusted life years (DALYs)
Proportion of burden of disease due to cancers
15-34 458 1.9%
35-64 65,130 18.0%
65 and over 77,962 18.1%
Total DALYs 143,551 17.5% DALYs: Disability adjusted life years
Source: Global Burden of Disease Study (1)
By far the major component of burden of disease due to lung cancer is due to years of life lost due to
premature death (Table 3.4).
Table 3.4: Burden (DALYs) due to lung cancer, people aged 15 years and over, Australia, 2010, by sex
YLD: Years lived with disability
YLL: Years of life lost
DALYs: Disability adjusted life years
Source: Global Burden of Disease Study (1)
The burden of disease due to lung cancer was greatest among people aged 65 years and over and
higher among men than women (Figure 3.3).
Measure Males Females Persons Proportion of all burden of disease in Australia (%)
YLD 1,300 716 2,016 0.1%
YLL 92,455 49,080 141,535 6.2%
DALYs 93,755 49,796 143,551 2.9%

32
Figure 3.3: Burden (DALYs per 100,000) due to lung cancer, people aged 15 years and over, Australia, 2010, by age and sex
DALYs: Disability adjusted life years. Source: Global Burden of Disease Study (1)
Deaths
Lung cancer
In 2012 there were 8,137 deaths attributed to lung cancer as the underlying cause (4,482 males and
3,255 females). This represents 5.5% (1 in 20) of all deaths in Australia in 2012. Since around 1980,
mortality due to lung cancer has decreased among males, but has steadily increased among females
(although overall, mortality remains lower in females than males) (Figure 3.4). This is consistent with
incidence data, and reflects smoking patterns in the Australian population in earlier decades.
Figure 3.4: Age-standardised mortality rate due to lung cancer, Australia, 1968-2010
Source: Australian cancer incidence and mortality book (16).
0
500
1000
1500
2000
2500
3000
3500
4000
15-34 35-64 65+
DA
LYs
pe
r 1
00
,00
0 p
op
ula
tio
n
Age group (years)
Males
Females
0
10
20
30
40
50
60
70
80
90
1960 1970 1980 1990 2000 2010
Age
-sta
nd
ard
ise
d m
ort
alit
y ra
te
Year of death
Males Females

33
Mesothelioma
In 2012 there were 638 deaths attributed to mesothelioma as the underlying cause. There has been
little change in the rate of deaths due to mesothelioma since 1996 (Figure 3.5). Mesothelioma has
one of the lowest survival rates of all neoplasms, with a five year survival rate of only 6% in people
diagnosed with this condition (18).
Figure 3.5: Age-standardised mortality rate due to mesothelioma, Australia, 1997-2011
Source: Australian cancer incidence and mortality book (17)
Health Care Utilisation
Lung cancer
In 2011-12 there were over 18,000 hospitalisations where lung cancer was the principal diagnosis,
comprising 0.2% of hospitalisations in that year (Table 3.5). This relatively low rate of hospitalisation
reflects that fact that the majority of people with lung cancer do not have surgery and do not require
hospital admission for management of their condition.
Table 3.5: Hospitalisations for lung cancer, persons aged 35 and over, Australia, 2011-12, by age and sex
Age group (years)
Male Female Persons Hospitalisations per 100,000 population
Proportion of all cause hospitalisations
35-64 3,065 2,702 5,767 65.8 0.2%
65-84 6,906 4,306 11,212 417.7 0.4%
85 and over 825 520 1,345 333.2 0.2%
Total 10,834 7,568 18,402 82.4 0.2% Notes ICD-10-AM Principal diagnosis codes C33 and C34
Total includes separations among persons aged less than 35 years.
Sources: AIHW Principal diagnosis data cubes.
Australian Bureau Estimated Resident Population of Australia, 2011, by age.
0
1
2
3
4
5
6
1996 2001 2006 2011
Age
-sta
nd
ard
ise
d m
ort
alit
y ra
te
Year of death
Males

34
The majority of hospitalisations for lung cancer were in people aged 65 years and over, and they
were higher among males than females (Figure 3.6).
Figure 3.6: Hospitalisation rate for lung cancer, persons aged 35 and over, Australia, 2011-12, by age and sex
Notes ICD-10-AM Principal diagnosis codes C33 and C34
Sources: AIHW Principal diagnosis data cubes.
Australian Bureau Estimated Resident Population of Australia, 2011, by age.
Overall, patients with a principal diagnosis of lung cancer occupied hospital for over 140,000 days in
2011-12, which was 0.5% of all hospital patient-days in that year. Each hospitalisation lasted for an
average of just over one week (7.6 days). This is more than twice the average length of stay for all
cause hospitalisations (3.0 days) (Table 3.6).
Table 3.6: Patient-days and total average length of stay for lung cancer, Australia, 2011-12
Age group (years)
Patient-days in hospital Average length of stay (days)
Male Female Persons
Proportion of all cause patient-days
Males Females Persons All causes
35-64 20,825 18,676 39,501 0.4% 6.8 6.9 6.9 2.5
65-84 51,283 35,937 87,220 0.9% 7.4 8.4 7.8 3.3
85 and over
7,062 5,797 12,859 0.4% 8.6 11.2 9.6 5.9
Total 79,370 60,642 140,012 0.5% 7.3 8 7.6 3.0 Notes ICD-10-AM Principal diagnosis codes C33 and C34
Sources: AIHW Principal diagnosis data cubes.
0
100
200
300
400
500
600
700
35-64 65-84 85+
Ho
spit
alis
atio
ns
pe
r 1
00
,00
0 p
op
ula
tio
n
Age group (years)
Males
Females
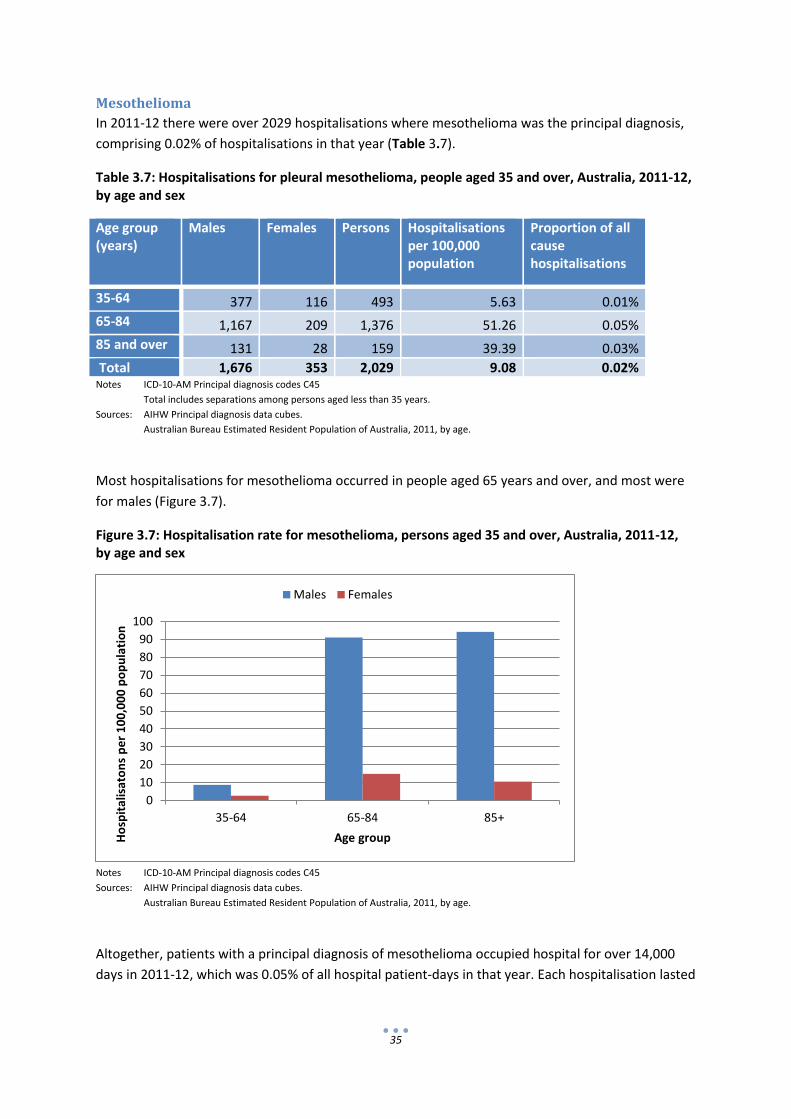
35
Mesothelioma
In 2011-12 there were over 2029 hospitalisations where mesothelioma was the principal diagnosis,
comprising 0.02% of hospitalisations in that year (Table 3.7).
Table 3.7: Hospitalisations for pleural mesothelioma, people aged 35 and over, Australia, 2011-12, by age and sex
Age group (years)
Males Females Persons Hospitalisations per 100,000 population
Proportion of all cause hospitalisations
35-64 377 116 493 5.63 0.01%
65-84 1,167 209 1,376 51.26 0.05%
85 and over 131 28 159 39.39 0.03%
Total 1,676 353 2,029 9.08 0.02% Notes ICD-10-AM Principal diagnosis codes C45
Total includes separations among persons aged less than 35 years.
Sources: AIHW Principal diagnosis data cubes.
Australian Bureau Estimated Resident Population of Australia, 2011, by age.
Most hospitalisations for mesothelioma occurred in people aged 65 years and over, and most were
for males (Figure 3.7).
Figure 3.7: Hospitalisation rate for mesothelioma, persons aged 35 and over, Australia, 2011-12, by age and sex
Notes ICD-10-AM Principal diagnosis codes C45
Sources: AIHW Principal diagnosis data cubes.
Australian Bureau Estimated Resident Population of Australia, 2011, by age.
Altogether, patients with a principal diagnosis of mesothelioma occupied hospital for over 14,000
days in 2011-12, which was 0.05% of all hospital patient-days in that year. Each hospitalisation lasted
0
10
20
30
40
50
60
70
80
90
100
35-64 65-84 85+
Ho
spit
alis
ato
ns
pe
r 1
00
,00
0 p
op
ula
tio
n
Age group
Males Females

36
for an average of one week (7.09 days). This is similar to lung cancer and more than twice the
average length of stay for all cause hospitalisations (3.0 days) (Table 3.8).
Table 3.8: Patient-days and total average length of stay for mesothelioma, Australia, 2011-12
Age group (years)
Patient-days in hospital Average length of stay (days)
Males Females Persons Proportion of all cause patient-days
Males Females Persons All causes
35-64 2,494 513 3,007 0.03% 6.62 4.42 6.10 2.5
65-84 8,179 1,690 9,869 0.10% 7.01 8.09 7.17 3.3
85 and over
1,085 298 1,383 0.04% 8.28 10.64 8.70 5.9
Total 11,877 2,501 14,378 0.05% 7.09 7.08 7.09 3.0 Notes ICD-10-AM Principal diagnosis codes C45
Sources: AIHW Principal diagnosis data cubes.

37
CHAPTER 4. INFECTIOUS DISEASE
Introduction This section reports information on selected respiratory infections that may have serious health
impacts including notifiable infections such as invasive pneumococcal disease, influenza, pertussis,
tuberculosis, and lower respiratory infections including pneumonia, bronchitis and bronchiolitis.
Each of the conditions is described in detail including major characteristics, risk factors and risk
reduction approaches. Where possible, we have provided estimates of the incidence of the various
respiratory infections. After this, we present the available data on burden of disease in Australia for
lower respiratory tract infections and tuberculosis from the Global Burden of Disease Study, and
some information on mortality in Australia due to acute respiratory infection. Finally we present
data for hospitalisation rates in Australia.
Notifiable diseases that cause respiratory infection These are diseases that Australian state and territory governments have decided are of sufficient
importance to public health to require doctors, nurses or other health care workers to inform public
health authorities (“notify” them) when they diagnose a new case of the disease. Invasive
pneumococcal disease, laboratory confirmed influenza, pertussis and tuberculosis are conditions
that cause respiratory infections and are notifiable in all Australian health jurisdictions (19).
Invasive pneumococcal disease
Invasive pneumococcal disease (IPD) is caused by the bacterial organism Streptococcus pneumoniae
(also known as “pneumococcus”). This organism colonises the nose and throat, usually without
causing any problems. It commonly causes bronchitis (cough with purulent sputum), particularly in
people with pre-existing lung disease. Bronchitis due to pneumococcus is usually self-limited (that is,
resolves without treatment) or else can be relatively simply treated with antibiotics. However,
occasionally the organism causes pneumonia, meningitis, septicaemia or other severe infections.
This is referred to as IPD.
The burden of IPD is greatest among children, particularly those aged around 1 year, and elderly
people aged 85 years and over. In 2011, the incidence rate of IPD among Indigenous people (53 per
100,000) was 8 times that of non-Indigenous people (6.7 per 100,000). The condition occurs slightly
more often among males than females (male to female ratio 1.2:1 in 2011) and rates are generally
highest during winter months (19).
Risk factors for pneumococcal disease are sought in notification data and include: premature birth,
congenital or chromosomal abnormality, compromised immunity, chronic illness (including asthma),
childcare attendance and past IPD.
IPD is a vaccine-preventable disease. Pneumococcal vaccination was introduced to the National
Immunisation Program in 2001 for Aboriginal and Torres Strait Islander infants, and in 2005 for all
infants. It has also been funded for all adults aged 65 years and over, or aged 50 years and over if
Aboriginal or Torres Strait Islander (20).

38
Influenza
Influenza is an infectious viral disease of birds and mammals (including humans and some
domesticated animals such as pigs). Common symptoms are chills, fever, runny nose, sore throat,
muscle pains, headache (often severe), cough, weakness/fatigue and general discomfort. Laboratory
confirmed diagnosis of influenza is notifiable in all Australian jurisdictions; however, as many
influenza infections are never laboratory confirmed, these notifications under-enumerate the true
incidence of influenza in Australia (19).
Influenza is a vaccine preventable disease, however vaccination is usually required annually because
the influenza virus evolves rapidly, and new strains quickly replace the older ones. Influenza spreads
in yearly seasonal epidemics, and worldwide, has a mortality rate up to 10%. Pandemic influenza
years are those in which transmission is very widespread. The most recent pandemic year was 2009
with a strain known as ‘swine flu’.
In Australia, vaccination is targeted towards the elderly, because they are at greater risk of adverse
outcomes due to influenza; and health workers, who have greater risk of exposure and spread.
Annual free vaccination is offered in many occupational settings, particularly in health care services,
to reduce staff absenteeism and also to reduce the spread of this infection in the workplace.
The World Health Organization position paper on influenza vaccines recommends the following
population groups be targeted for annual influenza vaccination (21):
1. Residents of institutions for elderly people and the disabled. 2. Elderly, non-institutionalized individuals with chronic heart or lung diseases, metabolic or
renal disease, or immunodeficiencies. 3. All individuals >6 months of age with any of the conditions listed above. 4. Elderly individuals above a nationally defined age limit, irrespective of other risk factors. 5. Other groups defined on the basis of national data and capacities, such as contacts of high-
risk people, pregnant women, health-care workers and others with key functions in society, as well as children 6–23 months of age.
Pertussis
Pertussis, commonly called whooping cough, is a highly contagious, vaccine preventable, bacterial
disease. Symptoms are initially mild, and then develop into characteristic severe paroxysmal
coughing fits, which last approximately six weeks before subsiding.
The condition is life-threatening in young children and vaccination is offered in Australia at age 2, 4
and 6 months, followed by a booster at 4 years and a 2nd booster of adolescent formulation
between 12 and 17 years of age (22). To further reduce the risk that infants will acquire this
disease, vaccination of selected adults can be used to reduce the incidence among those likely to
have contact with very young children. This is achieved by giving booster vaccinations to parents and
selected health care workers. Infectiousness can also be shortened through the use of antibiotics in
confirmed cases.
Tuberculosis
Tuberculosis (TB) is a widespread, occasionally fatal, infectious disease caused by Mycobacterium
tuberculosis. The most common site of disease is the lungs (pulmonary TB) but nearly 40% of cases in
Australia affect only sites outside the lungs (extra-pulmonary TB) (23). The symptoms of pulmonary

39
TB include long-term cough, coughing up blood, fever, night sweats and weight loss. The symptoms
of extra-pulmonary TB depend on the site of disease.
TB is usually spread through the air when people who have an active (infectious) pulmonary TB
cough, sneeze, talk or otherwise transmit respiratory droplets.
Many more people have latent TB infection (that is, evidence of TB infection without any evidence of
disease) than have TB disease. Around 10% of people with latent TB infection develop active TB
disease at some time in their life. However, latent TB infection itself is not associated with any
symptoms or disability.
Drug treatment for TB has been available since the early 1950s. Data from before that time suggest
that untreated TB is fatal in about 50% of cases.
The most frequently reported risk factor among people with TB in Australia was past travel to,
or birth or residence in, a high-risk country (23). Globally, major risk factors for tuberculosis
include HIV infection, overcrowding, malnutrition, incarceration, homelessness and other factors
associated with poverty and disadvantage. In developed countries, like Australia, TB is most common
among migrants from countries with a high burden of TB (24). In Australia in 90% of all cases of
tuberculosis that were diagnosed in 2010 were in people who were born overseas (23). People with
other chronic lung disease and diabetes are also at greater risk, as well as people with lifestyle risk
factors including smoking and alcoholism. Some medications, such as corticosteroids and genetic
factors may also increase susceptibility to TB.
BCG (Bacille de Calmette et Guérin) is the only approved vaccine against tuberculosis, however its
effectiveness is limited and variable (0%-80%) (25). It is not recommended for routine use in
Australia.
TB is treated with a combination of specialised antibiotics for a period of at least six months. Drug
resistant TB is becoming an increasing problem in developing countries and requires treatment with
more expensive and toxic antibiotic combinations for a longer duration (26).
Acute lower respiratory infections
Pneumonia
Pneumonia is an inflammatory condition of the lungs, primarily affecting the alveoli (air sacs). It is
usually caused by infection with viruses or bacteria. Typical symptoms include cough, chest pain,
pyrexia, and dyspnea. Diagnosis can be made with clinical evaluation together with a chest x-ray.
People with severe pneumonia and those with other underlying lung diseases often require a period
of hospital treatment but many other people with mild or moderate forms of pneumonia can be
managed outside hospital.
Bronchitis
Acute bronchitis refers to inflammation of the bronchi. Over ninety percent of cases of acute
bronchitis are due to viral infections and the majority are self-limiting. Symptoms include cough with
phlegm and, sometimes, wheeze and breathlessness.

40
Bronchiolitis
Bronchiolitis refers to inflammation of the bronchioles (small airways). It is most common among
children less than two years of age with the majority of cases being before age 12 months and up to
one third of children being affected in their first year of life. It is most commonly attributable to a
viral infection (most commonly respiratory syncytial virus (RSV)). Symptoms include coughing,
wheezing and rapid breathing. Bronchiolitis is most common during winter.
Risk reduction for lower respiratory infections
Vaccines are available to prevent certain types of pneumonia and other forms of acute lower
respiratory infections including Streptococcus pneumoniae and seasonal influenza virus. Although a
vaccine is available against Haemophilus influenzae Type B, this is not effective against the non-
typable Haemophilus influenzae that commonly causes bronchitis in adults and older children.
The risk of these conditions may also be reduced by avoidance of, or cessation of, smoking (27).
Incidence of respiratory infection Incidence refers to the number of new cases of a disease within a defined population. Incidence can
be difficult to accurately measure as conditions may be undiagnosed or there may not be a system
whereby conditions are universally recorded and enumerated.
IPD, influenza, pertussis and tuberculosis are notifiable conditions. Notification data can provide an
indication of disease incidence, though they are likely to underestimate incidence for some
conditions, particularly influenza, which is only notified when laboratory confirmed (Table 4.1).
Table 4.1: Notifications of selected diseases that cause respiratory infections, 2013
Condition Number Rate per 100,000 population
Influenza 28,333 122.5
Pertussis 12,357 53.4
Tuberculosis 1,263 5.5
Invasive Pneumococcal Disease
1,549 6.7
Total 43,502 188.1 Source: National Notifiable Diseases Surveillance System website (Accessed 17 October 2014)

41
Figure 4.1 shows notifications for these conditions between 2006 and 2013. Australia has one of the
lowest rates of tuberculosis in the world (23). Tuberculosis notifications remained stable in Australia
over the period. IPD notification rates are also low and were stable over the period.
Influenza is the most commonly notified respiratory infectious disease in most years although, as
previously noted, the true incidence of this infection is likely to be substantially underestimated
because it is only notifiable when laboratory confirmed. There was a sharp peak in influenza in 2009
associated with the aforementioned pandemic in that year. Pertussis infections have decreased after
a peak of notified cases in 2011.

42
Figure 4.1: Notification rates of selected diseases that cause respiratory infections, Australia, 2006-2013
Source: National Notifiable Diseases Surveillance System 2014
Notes: Rate per 100,000 shown as a log scale
There are no reliable and complete measures of the incidence of pneumonia, acute bronchitis and
bronchiolitis. However health care utilisation data provide a measure of incidence of severe cases
requiring hospitalisation (see Hospitalisations page 44).
Burden of disease due to respiratory infection In 2010 there were over 42,000 DALYs in Australia due to LRI. This represents approximately 1% of
almost 5 million DALYs calculated for disease and injury in Australia (Table 4.2). Just over 2,000
DALYs in Australia in 2010 were attributed to tuberculosis with 60% of this burden being in males.
Respiratory infections contributed 0.9% of DALYs in Australia in 2010.
Table 4.2: Burden (DALYs) due to respiratory infections, Australia, 2010, by age
Condition Lower respiratory infections Tuberculosis Total burden Age group
(years) Males Females Persons Males Females Persons
0-14 2,149 1,619 3768 32 22 53 3,821
15-34 715 540 1,255 200 117 317 1,572
35-64 4,524 2,919 7,442 705 448 1,154 8,596
65 and over 14,597 15,445 30,041 447 310 757 30,798
All ages 21,985 20,552 42,507 1,384 896 2,281 44,788
Proportion of all DALYs
0.82% 0.87% 0.85% 0.05% 0.04% 0.05% 0.90%
Source: Global Burden of Disease Study (1)
DALYs: Disability adjusted life years
1
10
100
1000
2006 2007 2008 2009 2010 2011 2012 2013
Rat
e p
er
10
0,0
00
po
pu
lati
on
Year
IPD Influenza Pertussis Tuberculosis

43
The burden of disease due to respiratory infections is greatest in children and the elderly. Overall
respiratory infections contributed an estimated 0.24% of years lived with disability in Australia in
2010 (Table 4.3) and 1.7% of years of life lost (Table 4.4).
Table 4.3: Years lived with disability (YLD) due to respiratory infections, Australia, 2010, by age
Condition Lower respiratory infections Tuberculosis Total burden Age group
(years) Males Females Persons Males Females Persons
0-14 801 607 1,408 12 7 20 1,427
15-34 136 112 248 161 101 262 510
35-64 538 440 978 485 320 805 1,783
65 and over 1,254 1,307 2,561 98 74 172 2,733
All ages 2,729 2,464 5,193 756 503 1,259 6,452
Proportion of all YLD
0.21% 0.18% 0.19% 0.06% 0.04% 0.05% 0.24%
YLD: Years lived with disability
Source: Global Burden of Disease Study (1)
Table 4.4: Years of life lost (YLL) due to respiratory infections, Australia, 2010, by age
Condition Lower respiratory infections Tuberculosis
Total burden Age group (years)
Males Females Persons Males Females Persons
0-14 1,348 1,012 2,361 19 14 34 2,394
15-34 579 428 1,007 39 15 55 1,062
35-64 3,986 2,481 6,466 220 128 348 6,815
65 and over 13,342 14,137 27,480 349 235 585 28,064
All ages 19,256 18,058 37,314 628 393 1,021 38,335
Proportion of all YLD
1.43% 1.96% 1.64% 0.05% 0.04% 0.05% 1.69%
YLL: Years of life lost
Source: Global Burden of Disease Study (1)

44
The burden of disease as a rate of the Australian population due to LRI was greatest among people
aged 65 years and over among both men and women (Figure 4.2).
Figure 4.2: Burden (DALYs per 100,000) due to lower respiratory infections, Australia, 2010, by age and sex
Source: Global Burden of Disease Study (1)
The burden of disease due to tuberculosis in the Australian population was highest among males
aged 65 years and over (Figure 4.3).
Figure 4.3: Burden (DALYs per 100,000), due to tuberculosis, Australia, 2010, by age and sex
DALYs: Disability adjusted life years
Source: Global Burden of Disease Study (1)
0
200
400
600
800
1000
1200
0-14 15-34 35-64 65+
DA
LYs
pe
r 1
00
,00
0 p
op
ula
tio
n
Age group
Males
Females
0
5
10
15
20
25
30
35
0-14 15-34 35-64 65+
DA
LYs
pe
r 1
00
,00
0 p
op
ula
tio
n
Age group
Males
Females

45
Mortality due to acute respiratory infection Death due to respiratory infection is relatively uncommon in Australia. In 2012 there were 3,023
deaths due to influenza, pertussis, tuberculosis, pneumonia, bronchitis and other lower respiratory
infections combined. This represents 2.1% of all deaths in Australia in 2012. Of these, 1,280 were in
males and 1,743 were in females.
Healthcare utilisation for respiratory infections
General practice encounters
General practice (GP) encounters for acute bronchitis and bronchiolitis were stable over the 10 year
period between 2003-04 and 2012-13 (2.3% of encounters in 2012-13) (5).
Hospitalisations
In the year July 2011 to June 2012 there were 129,393 hospitalisations in Australia in which the
patient had a principal final diagnosis of one of the respiratory infections discussed in this report.
This represents 1.4% of all hospitalisations in that year. Hospitalisations for respiratory infections
were slightly more common among males (53%) than females; the difference was greatest among
people hospitalised for tuberculosis where males represented 80% of those hospitalised for this
condition (Table 4.5). The largest number of hospitalisations were for pneumonia, followed by other
acute lower respiratory infections including bronchitis.
Table 4.5: Hospitalisations for respiratory infections and proportion of all hospitalisations, Australia, 2011-12, by sex
Condition Males Females Persons Proportion of all cause
hospitalisations
Pneumonia 41,265 36,537 77,802 0.84%
Influenza 2,084 2181 4,265 0.05%
Pulmonary Tuberculosis 1,026 248 1,274 0.01%
Other lower respiratory infections (LRI)1
13,041 13,699 26,740 0.29%
Bronchiolitis 11,107 7,240 18,347 0.20%
Pertussis 453 511 964 0.01%
All respiratory infections 68,976 60,416 129,392 1.40% 1. Includes one case where sex was not reported LRI: Lower respiratory infections comprising acute bronchitis and unspecified acute lower respiratory tract infections
Notes ICD-10-AM Principal diagnosis codes: pneumonia - J12-J18; influenza – J09-J11; pulmonary tuberculosis – A15-A16; acute LRTI –
J20, J22; bronchiolitis – J21; pertussis – A37.
Sources: AIHW Principal diagnosis data cubes.
Australian Bureau Estimated Resident Population of Australia, 2011, by age.

46
There were over 500 hospitalisations for respiratory infections per 100,000 people in 2011-12. The
rate was highest among people aged 85 years and over, among whom hospitalisation rates were
over 5,000 per 100,000 people (Table 4.6). However the proportion of all hospitalisations that were
for respiratory infections was highest among children aged up to 14 years (5.6%).
Table 4.6: Hospitalisations for respiratory infections, Australia, 2011-12, by age
Condition 0-14
years 15-34 years
35-64 years
65-84 years
85 years and over
Pneumonia 10,317 5,365 18,861 28,542 14,717
Influenza 1,531 812 1,145 628 149
Pulmonary Tuberculosis
25 911 196 108 34
Other lower respiratory infections1
3,912 1,971 6,562 9,216 5,080
Bronchiolitis 18,165 18 86 60 18
Pertussis 686 24 116 109 29
All respiratory infections
34,636 9,101 26,966 38,663 20,027
Total per 100,000 818.1 145.4 307.9 1,440.3 4962.0
Proportion of all cause hospitalisations
5.64% 0.62% 0.75% 1.29% 3.38%
1. LRI: Lower respiratory infections comprising acute bronchitis and unspecified acute lower respiratory tract infections Notes ICD-10-AM Principal diagnosis codes: pneumonia - J12-J18; influenza – J09-J11; pulmonary tuberculosis – A15-A16; acute LRTI –
J20, J22; bronchiolitis – J21; pertussis – A37.
Sources: AIHW Principal diagnosis data cubes.
Australian Bureau Estimated Resident Population of Australia, 2011, by age.

47
Hospitalisations for influenza, tuberculosis and pertussis in the year 2011-12 are shown in Figure 4.4.
Hospitalisation rates for influenza were highest among children (36.2 per 100,000) and the elderly
(36.9 per 100,000). Hospitalisation for tuberculosis was more common among young adults (73.9 per
100,000) and the elderly (162.3 per 100,000). The highest rate of hospitalisation for pertussis
occurred among children (16.2 per 100,000).
Figure 4.4: Hospitalisation rates for influenza, tuberculosis and pertussis, Australia 2011-12, by age
Sources: AIHW Principal diagnosis data cubes.
Australian Bureau Estimated Resident Population of Australia, 2011, by age.
0
5
10
15
20
25
30
35
40
0-14 15-34 35-64 65-84 85+ Total
Ho
spit
alis
atio
ns
pe
r 1
00
,00
0 p
op
ula
tio
n
Age group (years)
Influenza
Tuberculosis
Pertussis

48
Hospitalisation rates for pneumonia and other lower respiratory infections were highest among
elderly people aged 85 years and over (3,646 per 100,000 and 1,259 per 100,000 population
respectively) (Figure 4.5).
Figure 4.5: Hospitalisation rates for pneumonia and other lower respiratory infections, Australia, 2011-12, by age
Notes: ICD-10-AM Principal diagnosis codes: pneumonia - J12-J18; LRI – J20, J22;.
Acute LRI: Acute Lower respiratory infections comprising acute bronchitis and unspecified acute lower respiratory tract
infections
Sources: AIHW Principal diagnosis data cubes.
Australian Bureau Estimated Resident Population of Australia, 2011, by age.
On the other hand, hospitalisation for bronchiolitis occurred almost exclusively among children aged
less than five years (Figure 4.6), and within this group the highest rates were among babies aged less
than 12 months, particularly boys (5,952 per 100,000 baby boys).
Figure 4.6: Hospitalisation rates for bronchiolitis among children aged 0-4 years, Australia, 2011-12, by sex
Notes: ICD-10-AM Principal diagnosis codes: bronchiolitis – J21.
Sources: AIHW Principal diagnosis data cubes.
Australian Bureau Estimated Resident Population of Australia, 2011, by age.
0
500
1000
1500
2000
2500
3000
3500
4000
0-14 15-34 35-64 65-84 85+
Ho
spit
alis
atio
ns
pe
r 1
00
,00
0 p
op
ula
tio
n
Age group (years)
Pneumonia
LRI (Acutebronchitisand other)
0
1,000
2,000
3,000
4,000
5,000
6,000
7,000
<1 1−4 All 0-4
Ho
spit
alis
atio
ns
pe
r 1
00
,00
0
po
pu
lati
on
Age group (years)
Males
Females

49
Altogether, the respiratory infections addressed in this report contributed over 600,000 hospital
patient- days (the total number of days all patients spent in hospital) in Australia in 2011-12, which
comprised 2.3% of all patient-days in that year (Table 4.7)
Table 4.7: Patient-days in hospital for respiratory infections and all hospitalisations, Australia, 2011-12, by sex
Condition Males Females Persons Proportion of all causes
Pneumonia 234,670 213,650 448,320 1.62%
Influenza 7,255 8,009 15,264 0.06%
Pulmonary tuberculosis 7,108 3,834 10,942 0.04%
Other lower respiratory infections1
51251 57665 108,917 0.39%
Bronchiolitis 28,339 20,162 48,501 0.17%
Pertussis 1,797 2,401 4,186 0.02%
All respiratory infections
330,420 305,721 636,141 2.29%
1. LRI: Lower respiratory infections comprising acute bronchitis and unspecified acute lower respiratory tract infections Notes ICD-10-AM Principal diagnosis codes: pneumonia - J12-J18; influenza – J09-J11; pulmonary tuberculosis – A15-A16; acute LRTI –
J20, J22; bronchiolitis – J21; pertussis – A37.
Sources: AIHW Principal diagnosis data cubes.
Hospital patient-days were highest among people aged 65 to 84 years, (Table 4.8). However the
proportion of all hospital patient-days that were for respiratory infections was highest among
children aged up to 14 years (5.5%).
Table 4.8: Patient-days in hospital for respiratory infections and all hospitalisations, Australia, 2011-12, by age
Condition 0-14
years 15-34 years
35-64 years
65-84 years
85 years and over
Pneumonia 29,303 20,042 95,043 192,383 111,549
Influenza 4,026 2,132 4,428 3,526 1,152
Pulmonary tuberculosis
162 5,519 2,718 1,825 718
Other lower respiratory infections1
9,123 4,669 21,016 43,463 30,645
Bronchiolitis 47,717 56 315 274 139
Pertussis 2,864 62 454 572 234
All respiratory infections
93,195 32,480 123,975 242,043 144,437
Proportion of all patient-days
5.58% 0.85% 1.38% 2.47% 4.13%
1. LRI: Lower respiratory infections comprising acute bronchitis and unspecified acute lower respiratory tract infections Notes ICD-10-AM Principal diagnosis codes: pneumonia - J12-J18; influenza – J09-J11; pulmonary tuberculosis – A15-A16; acute LRTI –
J20, J22; bronchiolitis – J21; pertussis – A37.
Sources: AIHW Principal diagnosis data cubes.

50
On average, patients spent nearly 5 days in hospital at a time for respiratory infections, which was
longer than the overall average length of stay for all hospitalisations (3 days). This was highest for
pulmonary tuberculosis (8.6 days) and lowest for bronchiolitis (2.6 days) (Table 4.9).
Table 4.9: Average length of stay for respiratory infections and all hospitalisations, Australia, 2011-12, by age
Condition 0-14
years 15-34 years
35-64 years
65-84 years
85 years and over
All ages
Pneumonia 2.8 3.7 5 6.7 7.6 5.8
Influenza 2.6 2.6 3.9 5.6 7.7 3.6
Pulmonary tuberculosis 6.5 6.1 13.9 16.9 21.1 8.6
Lower respiratory infections1 2.3 2.4 3.2 4.7 6 4.1
Bronchiolitis 2.6 3.1 3.7 4.6 7.7 2.6
Pertussis 4.2 2.6 3.9 5.2 8.1 4.3
All respiratory infections 2.7 3.6 4.6 6.3 7.2 4.9
All hospitalisations 2.7 2.6 2.5 3.3 5.9 3.0
1. Acute LRTI: Acute Lower respiratory tract infections comprising acute bronchitis and unspecified acute lower respiratory tract infections
Notes ICD-10-AM Principal diagnosis codes: pneumonia - J12-J18; influenza – J09-J11; pulmonary tuberculosis – A15-A16; acute LRTI –
J20, J22; bronchiolitis – J21; pertussis – A37.
Sources: AIHW Principal diagnosis data cubes.

51
APPENDIX: ICD CODES USED TO CLASSIFY DISEASES
Table A1.1: Disease codes included for Global Burden of disease data, hospitalisations data and deaths data
Disease/Codes included GBD Hospitalisations Deaths
Tuberculosis (TB) A15 Respiratory TB, bacteriologically and histologically confirmed A16 Respiratory TB, not confirmed bacteriologically or histologically A17 TB of nervous system A18 TB of other organs A19 Military TB B90 Sequelae of TB P37.0 Congenital TB
Lower respiratory infections J10 Influenza due to identified influenza virus J11 Influenza, virus not identified J12 viral pneumonia, not elsewhere classified J13 Pneumonia due to S. pneumonia J14 Pneumonia due to H. influenza J15 bacterial pneumonia, not elsewhere classified J16 pneumonia due to other infectious organisms, not elsewhere classified
J17 Pneumonia in diseases classified elsewhere J18 Pneumonia, organism unspecified J20 Acute bronchitis J21 Acute bronchiolitis J22 Unspecified acute LRI J85 Abscess of lung and mediastinum P23 Congenital pneumonia
Lung cancer and mesothelioma C33 Malignant neoplasm of trachea C34 Malignant neoplasm of bronchus and lung C45 Mesothelioma
Chronic Obstructive Pulmonary Disease (COPD) J40 Bronchitis, not specified as acute or chronic J41 Simple and mucopurulent chronic bronchitis J42 Unspecified chronic bronchitis J43 Emphysema J44 Other COPD
Pneumoconiosis J60 Coalworker’s pneumoconiosis J61 Pneumoconiosis due to asbestos and other mineral fibres J62 Pneumoconiosis due to dust containing silica J63 Pneumoconiosis due to inorganic dusts J64 Unspecified pneumoconiosis J65 Pneumoconiosis associated with TB
Asthma J45 Asthma J46 Status asthmaticus
…(continued overleaf)

52
Table A1.1 (continued): Disease codes included for Global Burden of disease data, hospitalisations
data and deaths data
Disease/Codes included GBD Hospitalisations Deaths
Interstitial lung disease D86.0 Sarcoidosis of lung D86.2 Sarcoidosis of lung with sarcoidosis of lymph nodes D86.9 Sarcoidosis, unspecified J84 Other interstitial pulmonary diseases
Other respiratory diseases J30 Vasomotor and allergic rhinitis J31 Chronic rhinitis, nasopharyngitis and pharyngitis J32 Chronic sinusitis J33 Nasal polyp J34 Other disorders of nose and nasal sinuses J35 Chronic diseases of tonsils and adenoids J36 Peritonsillar abscess J37 Chronic laryngitis and laryngotracheitis J38 Diseases of vocal cords and larynx, not elsewhere classified J39 Other diseases of upper respiratory tract J47 Bronchiectasis # # J66 Airway disease due to specific organic dust J67 Hypersensitivity pneumonitis due to organic dust J68 Respiratory conditions due to inhalation of chemicals, gases, fumes & vapours
J70 Respiratory conditions due to other external agents J82 Pulmonary eosinophilia, not elsewhere classified J92 Pleural plaque J93.0 Spontaneous tension pneumothorax J93.1 Other spontaneous pneumothorax J95 Postprocedural respiratory disorders, not elsewhere classified J98 Other respiratory disorders (excluding J98.1 Pulmonary collapse, J98.2 Interstitial emphysema, J98.3 Compensatory emphysema, J98.9 Respiratory disorder, unspecified)
Pertussis A37*
Cystic fibrosis E84^
Notes:
*Only for infectious disease chapter and health care utilisation and deaths sections of lung disease chapter
^ only included in health care utilisation and deaths data because Global Burden of Disease estimates grouped
cystic fibrosis with many other conditions that were not relevant to this report.
# J47 (bronchiectasis) included under ‘chronic respiratory disease’ for the hospitalisations and deaths data

53
References 1. Global Burden of Disease 2010 [Internet]. University of Washington. 2014 [cited 5 September
2014]. Available from: http://www.healthdata.org/data-visualization/gbd-cause-patterns. 2. AIHW (Australian Institute of Health and Welfare). Australia's Health 2014. Australia's Health
Series no. 14. Cat. no. AUS 178. Canberra: AIHW, 2014. 3. ABS (Australian Bureau of Statistics). Causes of death, Australia, 2012. ABS cat. no. 3303.0.
Canberra: ABS, 2014. 4. ABS (Australian Bureau of Statistics). Australian Health Survey: First results 2011-12. Canberra:
ABS, 2012. 5. Britt H, Miller GC, Henderson J, Charles J, Valenti L, Harrison C, et al. A decade of Australian
general practice activity 2003-04 to 2012-13. General practice series no. 34. Sydney: Sydney University Press, 2013.
6. Maclay JD, McAllister DA, Mills NL, Paterson FP, Ludlam CA, Drost EM, et al. Vascular dysfunction in Chronic Obstructive Pulmonary Disease. American Journal of Respiratory and Critical Care Medicine. 2009;180(6):513-20.
7. Watz H, Waschki B, Boehme C, Claussen M, Meyer T, Magnussen H. Extrapulmonary effects of Chronic Obstructive Pulmonary Disease on physical activity. American Journal of Respiratory and Critical Care Medicine. 2008;177(7):743-51.
8. Toelle BG, Xuan W, Bird TE, Abramson MJ, Atkinson DN, Burton DL, et al. Respiratory symptoms and illness in older Australians: the Burden of Obstructive Lung Diseases (BOLD) study. Medical Journal of Australia. 2013;198(3):144-8.
9. Australian Institute of Health and Welfare, Poulos LM, Cooper SJ, Poulos LMC, S J, Ampon R, Reddel HK, et al. Mortality from asthma and COPD in Australia. Cat. no. ACM 30. Canberra: AIHW. 2014.
10. Fletcher C, Peto R. The natural history of chronic airflow obstruction. British Medical Journal. 1977;1:1645-8.
11. Salvi SS, Barnes PJ. Chronic obstructive pulmonary disease in non-smokers. Lancet. 2009;374:733-43.
12. Smith DR, Leggat PA. 24 years of pneumoconiosis mortality surveillance in Australia. Journal of occupational health. 2006;48(5):309-13.
13. Welfare) AAIoHa. Asthma, chronic obstructive pulmonary disease and other respiratory diseases in Australia. Canberra: AIHW, 2010 Contract No.: Cat. no. ACM 20.
14. Ward J, McDonald C. Interstitial lung disease - An approach to diagnosis and management. Australian family physician. 2010;39(3):106-10.
15. Chang AB, Grimwood K, Mulholland EK, Torzillo PJ, Working Group on Indigenous Paediatric Respiratory H. Bronchiectasis in indigenous children in remote Australian communities. The Medical journal of Australia. 2002;177(4):200-4.
16. AIHW (Australian Institute of Health and Welfare). Australian Cancer Incidence and Mortality Books (Lung Cancer). Canberra: AIHW; 2014. Available from: <http://www.aihw.gov.au/acim-books>.
17. AIHW (Australian Institute of Health and Welfare). Australian Cancer Incidence and Mortality Books (Mesothelioma). Canberra: AIHW; 2014.
18. AIHW (Australian Institute of Health and Welfare), AACR (Australasian Association of Cancer Registries). Cancer in Australia: an overview. 2012.
19. NNDSS Annual Report Writing Group. Australia's Notifiable Disease Status, 2011: Annual Report of the National Notifiable Diseases Surveillance System. Communicable Diseases Intelligence. 2013;37(4):E313-E93.
20. Barry C, Krause VL, Cook HM, Menzies RI. Invasive Pneumococcal Disease in Australia 2007 and 2008: Annual Report. Communicable Diseases Intelligence. 2012;36(2):E151-E65.
21. World Health Organisation. WHO position paper: influenza vaccines. WHO weekly Epidemiological Record. 2005;80(33):277-88.

54
22. National Health and Medical Research Council. The Australian Immunisation Handbook. Australian Government Department of Healht and Ageing; 2008.
23. Bareja C, Waring J, Stapledon R, National Tuberculosis Advisory Committee. Tuberculosis Notifications in Australia, 2010. Communicable Diseases Intelligence. 2014;38(1):E36-E48.
24. Lawn S, Zumla A. Tuberculosis. Lancet. 2011;378(9785):57-72. 25. Fine P. Variation in protection by BCG: implications of and for heterologous immunity. Lancet.
1995;346(8986):1339-45. 26. Centers for Disease Control and Prevention. Emergence of Mycobacterium tuberculosis with
extensive resistance to second-line drugs - worldwide, 2000-2004. Morbidity and Mortality Weekly Report. 2006;55(11):301-5.
27. Lim W, Baudouin S, George R, Hill A, Jamieson C, Le Jeune I, et al. BTS guidelines for the management of community acquired pneumonia in adults: update 2009. Thorax. 2009;64(Suppl 3):iii1-55.
Recommended