Lumax Industries LimitedANNUAL REPORT 2015-16

DISCLAIMERIn this Annual Report, we have disclosed forward-looking information to enable investors to comprehend our prospects and take investment decisions. This report and other statements - written and oral – that we periodically make, contain forward-looking statements that set out anticipated results based on the management’s plans and assumptions. We have tried wherever possible to identify such statements by using words such as ‘anticipate’, ‘estimate’, ‘expects’, ‘projects’, ‘intends’, ‘plans’, ‘believes’, and words of similar substance in connection with any discussion of future performance. We cannot guarantee that these forward-looking statements will be realized, although we believe we have been prudent in assumptions. The achievements of results are subject to risks, uncertainties, and even inaccurate assumptions. Should known or unknown risks or uncertainties materialize, or should underlying assumptions prove inaccurate, actual results could vary materially from those anticipated, estimated, or projected. Readers should keep this in mind. We undertake no obligation to publicly update any forward-looking statements, whether as a result of new information, future events or otherwise.
CONTENTS
About D.K. Jain Group
02
About Lumax Industries
04
Corporate Information
21
Milestones08
Directors’ Report
22
Management’s Letter to Shareholders
10
Key Financial Figures
12
Annexure to Directors’ Report
27
Our Competitive Advantages
14
Standalone Financial Statements
80
Corporate Social Responsibility
16
Awards & Accolades
17
Consolidated Financial Statements
123
Board of Directors
18
Beyond Boundaries
20

irst levels of success comes easy. It’s when you strive to reach the next-level and peak
of success and refuse to be the second best, then the journey becomes an uphill one. But in the decades that we have spent in the industry, we have realised that though leadership comes at a price, there can never be a substitute for it. Hence, we have innovated, done excellent work, set up a robust value system and built all the right partnerships that have helped us in our journey to the top. And now that we are reigning the ‘leaders’ zone, we can tell you for sure that all the efforts put in reaching and sustaining leadership is truly worth it!
F
LEADING THROUGHEXCELLENCE
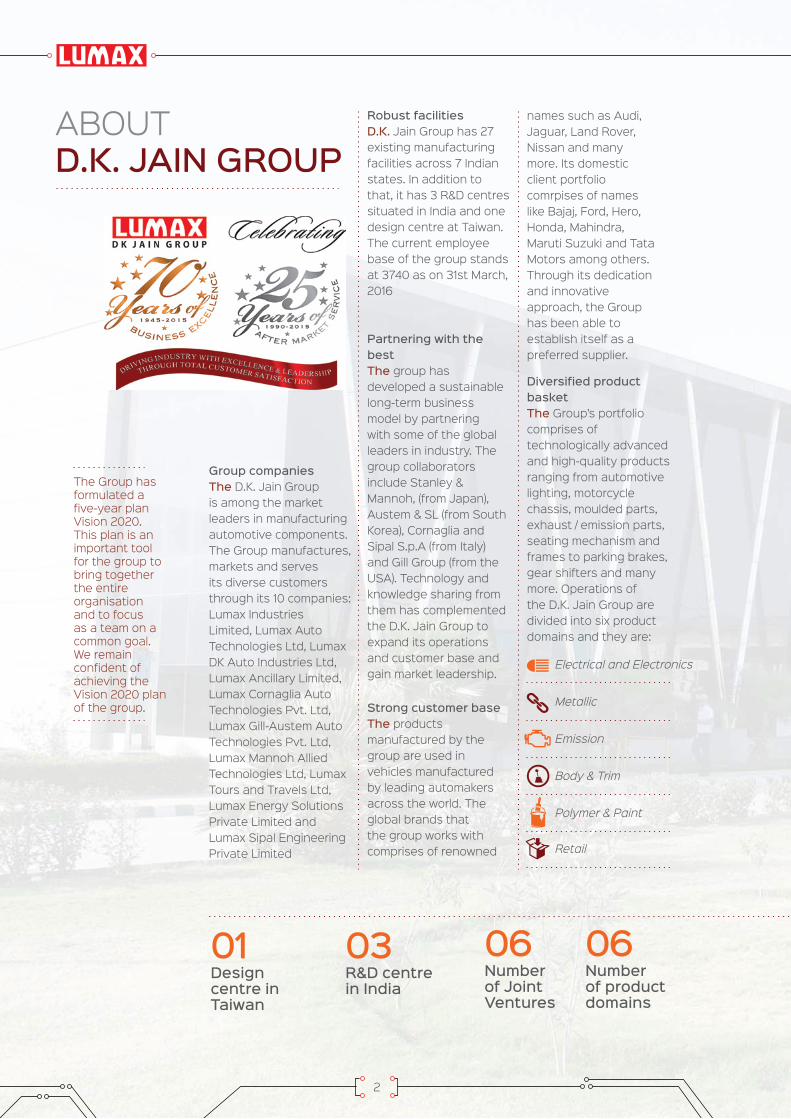
Group companiesThe D.K. Jain Group is among the market leaders in manufacturing automotive components. The Group manufactures, markets and serves its diverse customers through its 10 companies: Lumax Industries Limited, Lumax Auto Technologies Ltd, Lumax DK Auto Industries Ltd, Lumax Ancillary Limited, Lumax Cornaglia Auto Technologies Pvt. Ltd, Lumax Gill-Austem Auto Technologies Pvt. Ltd, Lumax Mannoh Allied Technologies Ltd, Lumax Tours and Travels Ltd, Lumax Energy Solutions Private Limited and Lumax Sipal Engineering Private Limited
Strong customer baseThe products manufactured by the group are used in vehicles manufactured by leading automakers across the world. The global brands that the group works with comprises of renowned
Partnering with the bestThe group has developed a sustainable long-term business model by partnering with some of the global leaders in industry. The group collaborators include Stanley & Mannoh, (from Japan), Austem & SL (from South Korea), Cornaglia and Sipal S.p.A (from Italy) and Gill Group (from the USA). Technology and knowledge sharing from them has complemented the D.K. Jain Group to expand its operations and customer base and gain market leadership.
Robust facilitiesD.K. Jain Group has 27 existing manufacturing facilities across 7 Indian states. In addition to that, it has 3 R&D centres situated in India and one design centre at Taiwan. The current employee base of the group stands at 3740 as on 31st March, 2016
Diversified product basketThe Group’s portfolio comprises of technologically advanced and high-quality products ranging from automotive lighting, motorcycle chassis, moulded parts, exhaust / emission parts, seating mechanism and frames to parking brakes, gear shifters and many more. Operations of the D.K. Jain Group are divided into six product domains and they are:
ABOUT D.K. JAIN GROUP
The Group has formulated a five-year plan Vision 2020. This plan is an important tool for the group to bring together the entire organisation and to focus as a team on a common goal. We remain confident of achieving the Vision 2020 plan of the group.
Electrical and Electronics
Metallic
Emission
Body & Trim
Polymer & Paint
Retail
01Design centre in Taiwan
03R&D centre in India
06Number of Joint Ventures
06Number of product domains
names such as Audi, Jaguar, Land Rover, Nissan and many more. Its domestic client portfolio comrpises of names like Bajaj, Ford, Hero, Honda, Mahindra, Maruti Suzuki and Tata Motors among others. Through its dedication and innovative approach, the Group has been able to establish itself as a preferred supplier.
2

07Number of states present across India
10Number of companies in the Group
27Number of existing manufacturing facilities
70+Years of business operations
Lumax Industries Ltd 09
Lumax Auto Technologies Ltd. 09
Lumax Ancillary Ltd. 03
Lumax DK Auto Industries Ltd. 02
Lumax Mannoh Allied Technologies Ltd 01
Lumax Cornaglia Auto Technologies Pvt. Ltd. 02
Lumax Gill-Austem Auto Technologies Pvt. Ltd 01
OURPRESENCE
25yearsOf after-market service
3
Lumax Industries Limited | Annual Report 2015-16

ABOUT LUMAXINDUSTRIESLIMITED
Lumax Industries Limited today is present in India for more than 70 years since its inception. Having started as a trading concern in 1945, the Company has today evolved into a leading automotive component giant. Headquartered in Gurgaon, Haryana, the Company is engaged in the production and delivery of high class automotive lighting solutions, with business operations present across four, two-wheeler and farm equipment segments. In terms of market share, Lumax continues to be a leader and the most preferred brand of the OEMs in India.
Luminosity MaximaOur product portfolio comprises of wide array of complete Automobile lighting systems and solutions. The portfolio includes stellar quality tail lamps and head lamps, sundry and auxiliary lamps, and all other products related to lighting accessories.
Strong collaborationThe Company’s collaboration with the Japanese Auto Lighting manufacturer Stanley Electric Co. Ltd. for more than three decades is a testimony to the corporate ethos that the Company possesses. This partnership has helped Lumax not only develop pioneering products in India, but has also helped enhance brand visibility among the global OEMs in India.
09Ultra-modern manufacturing facilities
32 yearsOf collaboration with Stanley
06Number of states present across India
4

Excellent manufacturing facilitiesLumax Industries has 9 ultra-modern manufacturing facilities across India. These manufacturing facilities are located at Dharuhera, Gurgaon and Bawal, Haryana, two plants at Pune, Maharashtra, two plants at Pantnagar and Haridwar, Uttarakhand, one in Sanand, Gujarat and the one at Bidadi in Karnataka.
Certifies as the bestThe DNV, NORWAY has certified the plants in Gurgaon and Dharuhera with ISO/TS 16949:2009 gradation. In 2015, the company’s Pantnagar plant was awarded with JIPM-TPM Award for excellence in Category ‘A’. As a whole, Lumax Industries Limited has been granted ISO/TS-16949 and ISO-14001 certification.
35Average age of employees
18Number of countries our products are exported
In 2015, the company’s Pantnagar plant was awarded with JIPM-TPM Award for excellence in Category ‘A’
03Strong in-house design capability
2241TOTAL NUMBER OF EMPLOYEES AS ON 31ST MARCH, 2016
5
Lumax Industries Limited | Annual Report 2015-16

Value System
VELOCITYAt D.K. Jain Group, we are bound strongly by our values. In fact, we operate following our own system of values and in one word, our value system is termed as ‘VELOCITY’.
Values
VExcellence
delivered by passion
ELeadership
Development & continuous training
of our people
LOpenness &
transparency to nurture everlasting
partnerships
O
VisionTo be a sustainable, respected & profitable brand with a global presence, that continues to enhance stakeholder value and exceed customer expectations as the preferred supplier
Core PurposeTo create a happy, safe, participative, proud & admirable place to work that inspires individuals to consistently deliver total customer satisfaction
MissionTo be a Lean, Profitable, Diversified and Learning Organisation that is highly responsive, energetic and innovative by involving people as partners and attaining highest levels of quality, excellence and technology across our domains
6
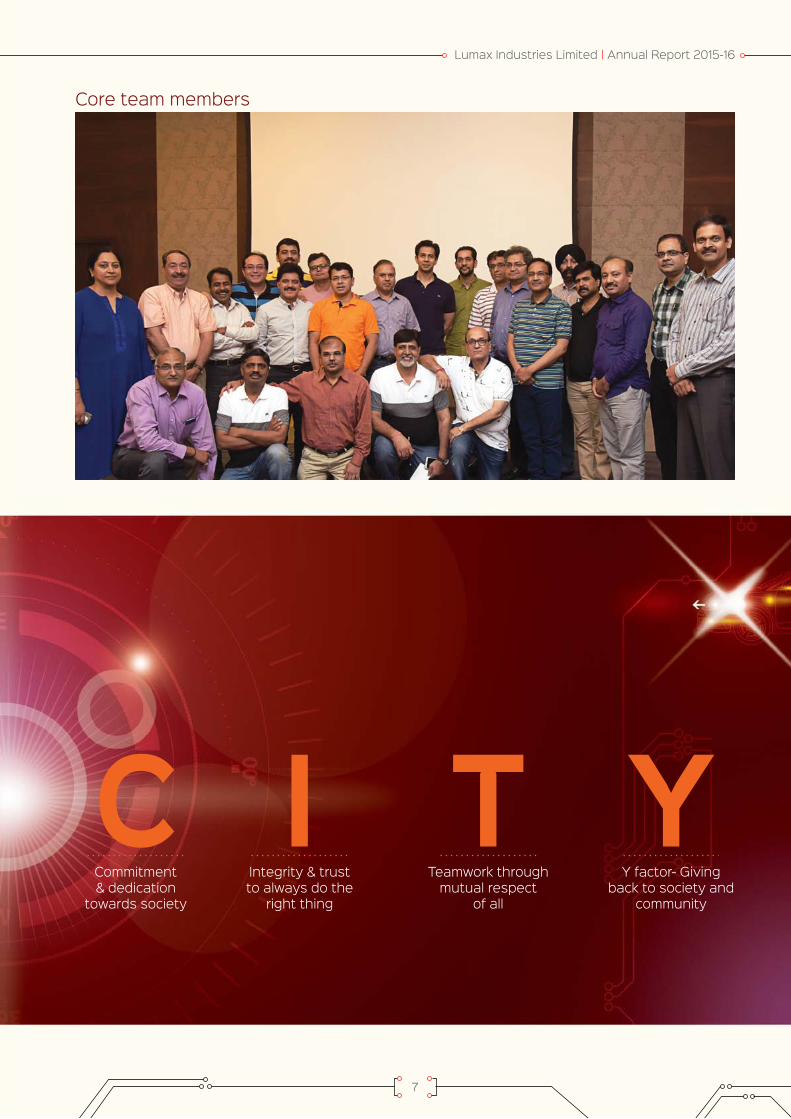
Commitment & dedication
towards society
CIntegrity & trust to always do the
right thing
ITeamwork through
mutual respect of all
TY factor- Giving
back to society and community
Y
Core team members
7
Lumax Industries Limited | Annual Report 2015-16

1945A trading concern was established by Late Mr. S.C. Jain
1998DNV Netherlands certified QS-9000 certification to the unit at Gurgaon
Lumax’s unit at Dharuhera sees first production
1995TUV Germany certified the Gurgaon Unit of the company as an ISO-9002 facility
1956-66A dedicated unit for automotive light equipment manufacturing was set up
1999Dharuhera unit is provided with QS-9000 certification by the DNV Netherlands
1975Set up a manufacturing unit for automotive filters
2003DNV, USA certifies the Gurgaon and Dharuhera plants with ISO/TS 16949:2002 accreditation
2004ISO 14001 Certification for Gurgaon, Dharuhera and Chennai Plants by DNV. De-merger-Core Lighting Technology
1977-79Commercial production begins at unit in Faridabad, Haryana and Pune, Maharashtra
2005Manufacturing unit near Pune (Chakan) started functioning
8
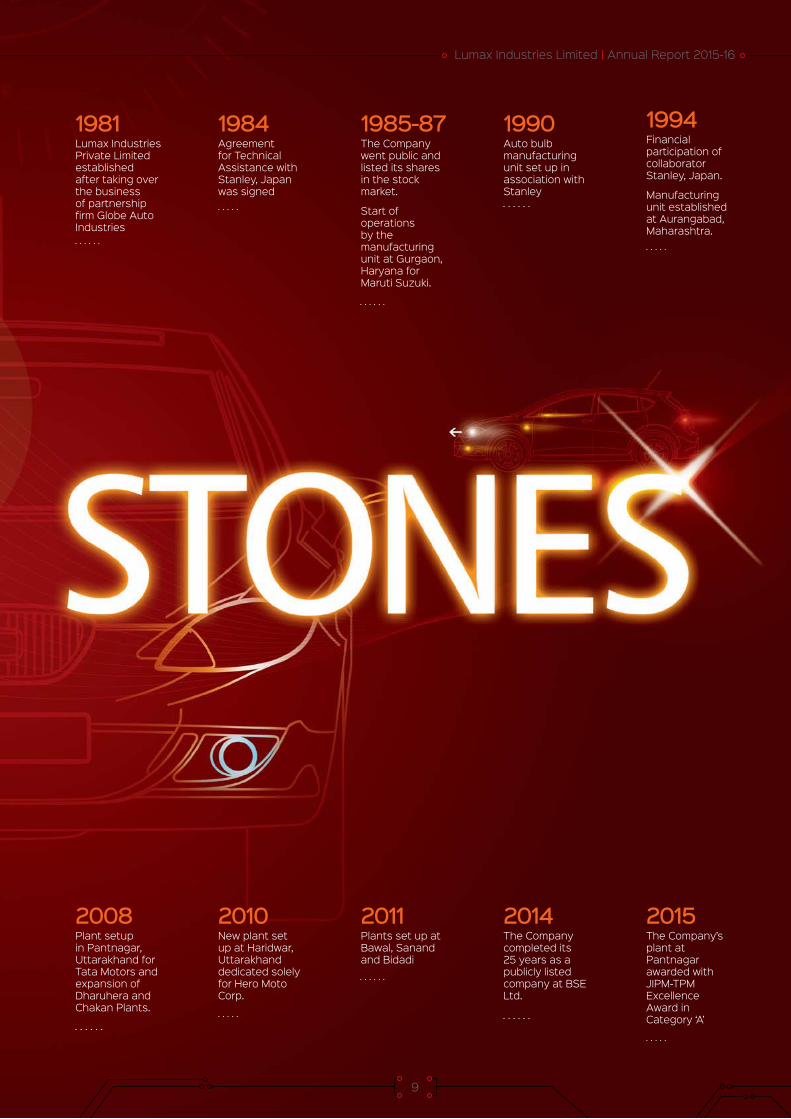
1981Lumax Industries Private Limited established after taking over the business of partnership firm Globe Auto Industries
1984Agreement for Technical Assistance with Stanley, Japan was signed
2010New plant set up at Haridwar, Uttarakhand dedicated solely for Hero Moto Corp.
1985-87The Company went public and listed its shares in the stock market.
Start of operations by the manufacturing unit at Gurgaon, Haryana for Maruti Suzuki.
2011Plants set up at Bawal, Sanand and Bidadi
1990Auto bulb manufacturing unit set up in association with Stanley
2014The Company completed its 25 years as a publicly listed company at BSE Ltd.
2008Plant setup in Pantnagar, Uttarakhand for Tata Motors and expansion of Dharuhera and Chakan Plants.
1994Financial participation of collaborator Stanley, Japan.
Manufacturing unit established at Aurangabad, Maharashtra.
2015The Company’s plant at Pantnagar awarded with JIPM-TPM Excellence Award in Category ‘A’
9
Lumax Industries Limited | Annual Report 2015-16
MANAGEMENT’SLETTER TO THESHAREHOLDERS
The world economy has witnessed mixed reaction among the emerging and advanced nations during the FY2015-16. Because of volatility in the crude price, major oil exporters have faced some challenge to strengthen their economic growth. However, being a significant importer of oil, conditions have been extremely favourable for India. Our country has been witnessing steady economic growth since FY2014-15 and favourable conditions continued to prevail in FY2015-16 as well. With the government’s active focus on its ‘Make in India’ initiative, it seems that the true potential for industrialising the Indian economy will be realised.
The Indian automotive sector wtinessed a volatility during the past fiscal, with conditions likely to improve in the near future. The government is paying attention for strengthening the nation’s infrastructure by building new roads and
Dear Shareholders,
enhancing connectivity for the remote areas with the mainstream regions. On the backdrop of such developing scenarios, the need for automobiles would be witnessed more than ever before for strengthening inter-area connectivity, eventually leading to the growth in demand for auto components. The rural market is showing signs of growth opportunities for the auto industry. In India, the per capita usage of car stands at a meager 18 people per 1000, which is way less than the advanced economies. So, there is room for opportunities for market penetration.
The government is focusing to transform the nation into a global design and manufacturing hub by 2020. With initiatives like Automotive Mission Plan (2016-2026) and set up of National Automotive Testing and R&D Infrastructure Project (NATRIP), India is poised to be emerge as a preferred destination,
globally. Also with international auto players shifting from China to India for taking advantage of cheaper production costs with high quality levels has led to increase in global OEMs shifting their bases to India. These are definitely strong growth prospects for the industry and your Company.
On the operations front, the financial year under review was successful for the Company for several reasons. Despite the topline remaining same as that of last year, we managed to double our profitability levels to H 37.37 Crore, as compared to previous year’s H 16.57 Crore. This was due to our increased focus towards cost control programs and enhanced operational efficiencies. Our focus on promoting ‘Make in India’ was validated with increased sourcing from domestic vendors as a substitute for imports. This has also lowered our production costs without any impact on quality. We have initiated certain policies and practices for bringing down our RMC
10
(Raw Material Cost). Our fuel and transportation costs have also been reduced during this financial year.
We are pleased to report the growing trust and faith of our investors in Lumax Industries Limited (LIL) as we crossed H 500 Crore of market capitalisation during the FY2015-16. During FY2015-16, our ROCE (Returns on Capital Employed) stood at 23%, up from 12% in the previous year. On the other hand, the Company’s Debt to Equity ratio for the current financial year came down to 0.17. Our capital investments in past (in capacity and R&D) have led to surge in increased product offerings and sustained market leadership.
We continue to stay committed in ensuring highest level of quality in our offerings . In order to strengthen our quality monitoring process, we adapted a centralised SQA (Supplier Quality Assurance) program. Under this program, we are able to monitor and ensure that the vendors
supply quality materials. This is supported by conducting internal and quality audit checks at their factories. It is our unwavering focus on quality that has led to the trust and confidence of our clients over all these years.
Our relation with Stanley Electric Co. Ltd., Japan today goes beyond three decades and it has only grown stronger with time. Apart from financial collaborations, Stanley has shared their technical knowledge and expertise with us and that has helped our Company reach new scales of success. With their guidance, we have been able to successfully stay ahead, with pioneering launches in products that are innovative. The industry shift towards LED lighting is giving growth opportunities to the Company. The Company is committed to TPM culture and the same is being continued to be followed by all the plants. Going ahead, our outlook for the coming year is to improve our overall performance further. Improving the quality of
our products would be our priority, as we continue to invest more in our plants.
While moving forward, we thank all our employees, partners, vendors and shareholders for their continued support towards strengthening brand Lumax. We look forward for another successful year and recording stellar financial and operational performance. We shall also continue to remain sustainable with increasing contributions towards the betterment of society and environment.
Regards,
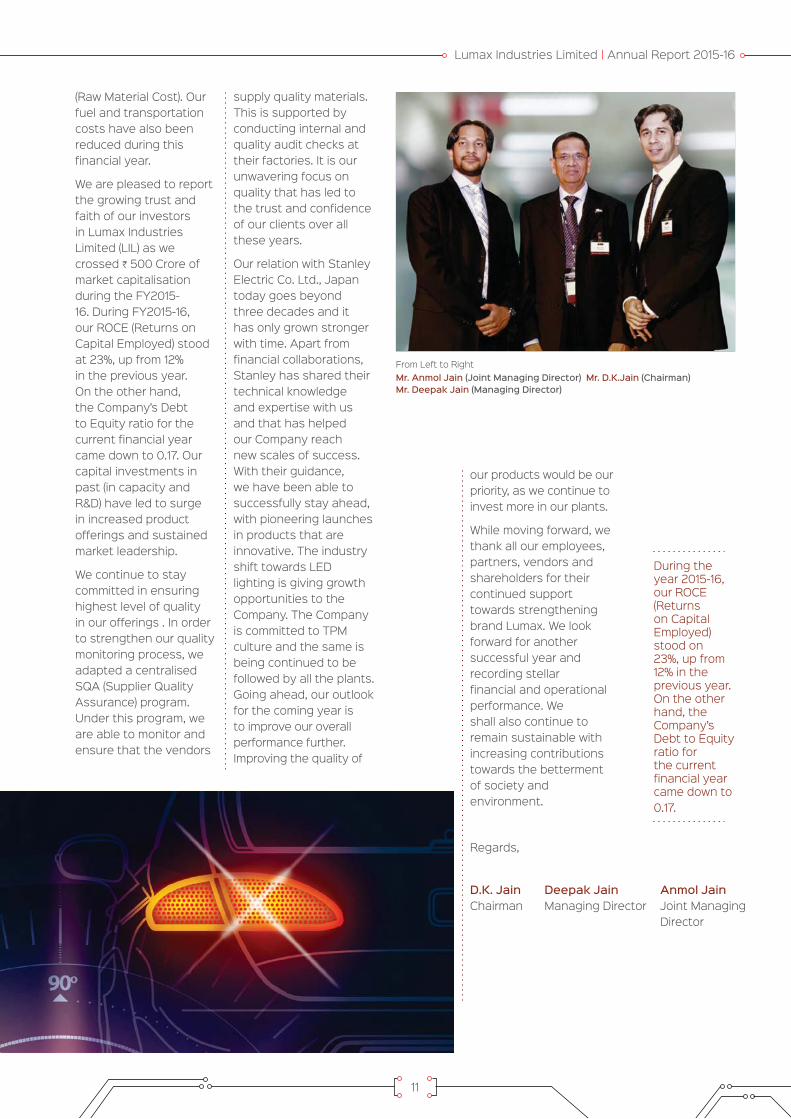
Mr. Anmol Jain (Joint Managing Director) Mr. D.K.Jain (Chairman) Mr. Deepak Jain (Managing Director)
During the year 2015-16, our ROCE (Returns on Capital Employed) stood on 23%, up from 12% in the previous year. On the other hand, the Company’s Debt to Equity ratio for the current financial year came down to 0.17.
From Left to Right
D.K. Jain Deepak Jain Anmol JainChairman Managing Director Joint Managing Director
11
Lumax Industries Limited | Annual Report 2015-16

KEY FINANCIAL FIGURES
15-1
6
REVENUES (H in Lacs)
11-1
2
12-1
3
13-1
4
14-1
5
9851
6 1070
21 1116
70
1142
56
1255
17
15-1
6EBIDTA (H in Lacs)
11-1
2
12-1
3
13-1
4
14-1
5
4943
6576
5782
6486
9293
15-1
6
PROFIT AFTER TAX (H in Lacs)
11-1
2
12-1
3
13-1
4
14-1
5
1281 13
58
770
1657
3737
12

7.5%The historical EBIDTA Margin in FY2015-16 - highest since inception
15-1
6ROCE (%)
11-1
2
12-1
3
13-1
4
14-1
5
7.5
11.1
7.7
12.0
23.0
15-1
6
NET WORTH (H in Lacs)
11-1
2
12-1
3
13-1
4
14-1
5
1608
1
1694
4
1732
8 1803
1
2041
8
15-1
6
D/E RATIO
11-1
2
12-1
3
13-1
4
14-1
5
0.81
0.60
0.37
0.17
1.13
13
Lumax Industries Limited | Annual Report 2015-16

OURCOMPETITIVEADVANTAGESTHAT DEFINE OUR LEADERSHIP
Market leadersIn domestic automotive lightning space, we are continue to be leaders across the various sub-segments of the automotive sector
Product portfolioWe are among the few players with a varied range of lightning solutions for the automotive manufacturers in India. Right from the headlight to tail lamps to indicators, our product range gives us a significant competitive edge over others.
In-house design Our in-house design team ensures we stay on course with the emerging design trends to provide contemporary products to our customers
Proximity to customers Our nine manufacturing facilities are located in key automotive hubs in the country, giving our customers cost competencies to source their requirements from us
Experience With more than of seven decades of existence, our experience over the years has resulted in enduring relationships with leading automotive manufacturers in India
14
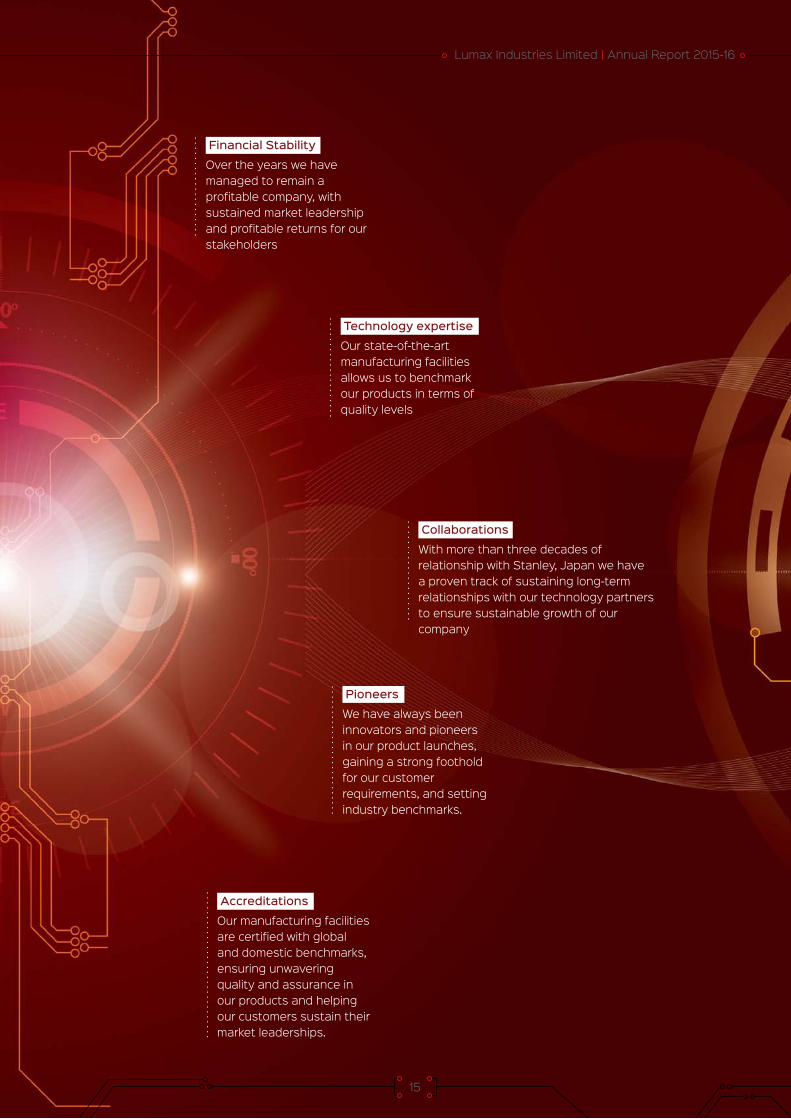
Accreditations Our manufacturing facilities are certified with global and domestic benchmarks, ensuring unwavering quality and assurance in our products and helping our customers sustain their market leaderships.
Financial Stability Over the years we have managed to remain a profitable company, with sustained market leadership and profitable returns for our stakeholders
Technology expertise Our state-of-the-art manufacturing facilities allows us to benchmark our products in terms of quality levels
Pioneers We have always been innovators and pioneers in our product launches, gaining a strong foothold for our customer requirements, and setting industry benchmarks.
Collaborations With more than three decades of relationship with Stanley, Japan we have a proven track of sustaining long-term relationships with our technology partners to ensure sustainable growth of our company
15
Lumax Industries Limited | Annual Report 2015-16
CORPORATE SOCIALRESPONSIBILITY
With leadership at core of our long-term strategy, sustainability remains a key value of Lumax Industries.
Our journey towards sustainability is embedded across the business operations, marked by significant improvement across various well-defined parameters.
To drive the necessary integration, at Lumax we have improved and clarified sustainability governance, architecture and development areas to make a positive contribution.
Our corporate social responsibility activities are spread across two major areas - Health and Education, with focus on girl education and empowerment.
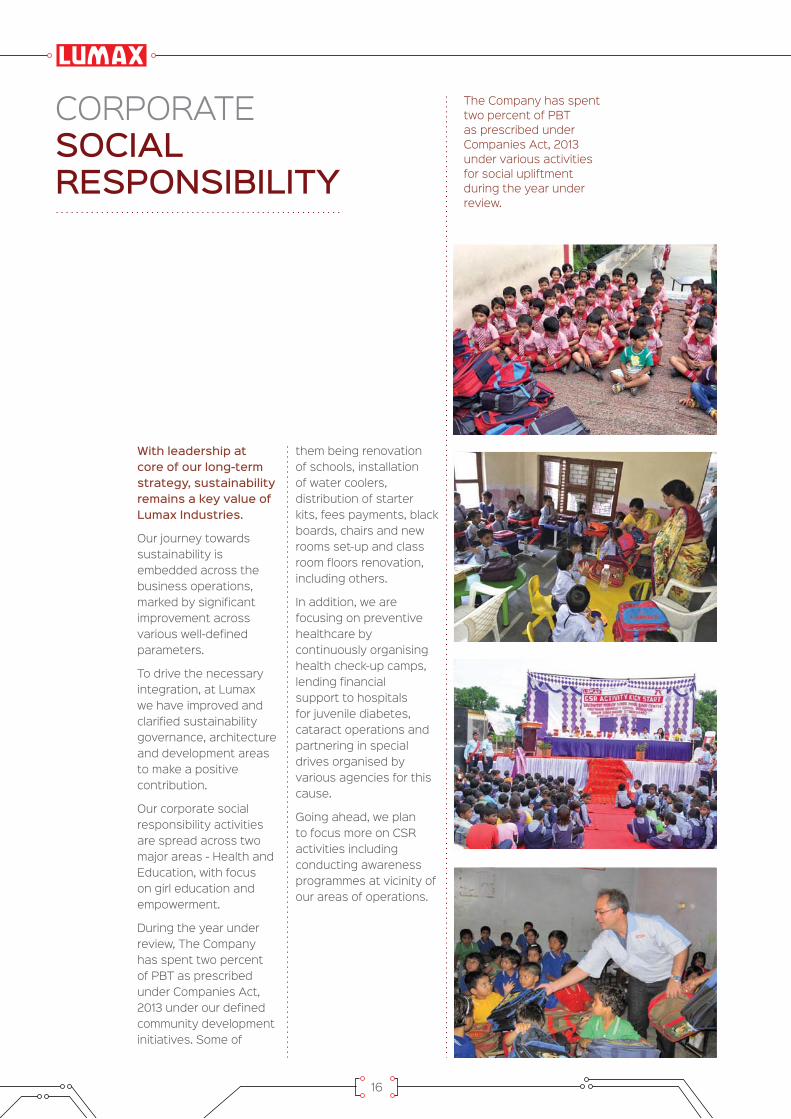
During the year under review, The Company has spent two percent of PBT as prescribed under Companies Act, 2013 under our defined community development initiatives. Some of
them being renovation of schools, installation of water coolers, distribution of starter kits, fees payments, black boards, chairs and new rooms set-up and class room floors renovation, including others.
In addition, we are focusing on preventive healthcare by continuously organising health check-up camps, lending financial support to hospitals for juvenile diabetes, cataract operations and partnering in special drives organised by various agencies for this cause.
Going ahead, we plan to focus more on CSR activities including conducting awareness programmes at vicinity of our areas of operations.
The Company has spent two percent of PBT as prescribed under Companies Act, 2013 under various activities for social upliftment during the year under review.
16
AWARDS & ACCOLADES
Won Manufacturing Excellence award from Maruti Suzuki India Limited
Won VA-VE award from Maruti Suzuki India Limited
Won the “Energy Champion Award” conducted by Tata Motors Ltd.
Awarded for Achieving level “B” under Mahindra Supplier Evaluation Standard and achieving Mentoring Zone in Supplier Business Capability Building.
Won Gold Award in ‘5th Chapter Convention on Quality Concepts’ organized by Quality Circle Forum of India.
Got award for “Best Innovation in lighting technology“ in the International Symposium on Lighting
Won Gold & Silver awards in Chapter Convention on Quality Concept organized by Quality Circle Forum of India - Delhi Chapter
Achieved “Best Cluster Company for low cost automation” from ACMA (Automotive Component Manufacturers Association of India).
We believe in developing industry-leading products on one hand and being recognised for our achievements on the other.
Our accolades are testimony of our efforts across various operations of our business. During the year under review, we received several awards that enhanced our credibility and our corporate brand.
17
Lumax Industries Limited | Annual Report 2015-16

BOARD OF DIRECTORS
From left to right
Mr. D D Gupta, Mr. M C Gupta, Ms. Pallavi Dinodia, Mr. A P Gandhi, Mr. Eiichi Hirooka, Mr. Anmol Jain
18

Mr. D K Jain, Mr. Deepak Jain, Mr. Rattan Kapur, Mr. Norihisa Sato, Mr. Toru Tanabe, Mr. Gursaran Singh
Lumax Industries Limited | Annual Report 2015-16
19

BEYOND BOUNDARIES
As a strategic move to expand its presence across the globe, and strengthen the synergies of cost and technology, the Company recently set up its first international design centre at Taiwan in May’16.
The move is a testimony to the strengthening relationship of company’s business partnerships with Taiwan, which Span for more than three decades. With this office, the Company expects to further expand its presence in South Asia in countries like Japan, South Korea and Mainland China.
Taiwan offers many advantages viz. an excellent geographic location, comprehensive supply chain, industrial clusters, strong manufacturing technology, a hardworking quality workforce, innovative R&D and management capabilities. The company annually purchases roughly NT$350 million from Taiwan’s
tooling, machinery and equipment suppliers.
The Design Centre-Taiwan will fulfill ever-evolving market needs for innovative lighting solutions and reduce the development time for technologically advanced products. It will also be an interface with key markets of automotive lighting tool makers including China and Korea and Program Management Team of Lumax.
20

Lumax Industries Limited | Annual Report 2015-16
21
CORPORATE INFORMATIONBoard of DirectorsMr. D.K. Jain (Non-Executive Chairman)Mr. Deepak Jain (Managing Director)Mr. Anmol Jain (Joint Managing Director)Mr. Eiichi Hirooka (Senior Executive Director) - Stanley NomineeMr. Norihisa Sato (Executive Director) - Stanley NomineeMr. Toru Tanabe (Non- Executive Director) - Stanley NomineeMr. A.P. Gandhi (Independent Director)Mr. Rattan Kapur (Independent Director)Mr. Gursaran Singh (Independent Director)Mr. M.C. Gupta (Independent Director)Mr. Dhiraj Dhar Gupta (Independent Director)Ms. Pallavi Dinodia (Independent Director)
Board Committees:Audit CommitteeMr. A.P. Gandhi – ChairmanMr. M.C. Gupta – MemberMr. D.D. Gupta – MemberMr. Rattan Kapur – MemberMs. Pallavi Dinodia – MemberMr. Deepak Jain – MemberMr. Eiichi Hirooka – Member
Nomination and Remuneration CommitteeMr. Rattan Kapur – ChairmanMr. A.P. Gandhi – MemberMr. D.D. Gupta – MemberMr. Gursaran Singh – Member
Share Transfer/ Stakeholder Relationship CommitteeMr. D.D. Gupta – ChairmanMr. D.K. Jain – MemberMr. Deepak Jain – MemberMr. Eiichi Hirooka – Member
Corporate Social Responsibility CommitteeMr. M.C. Gupta – ChairmanMr. A.P. Gandhi – MemberMr. D.K. Jain – MemberMr. Deepak Jain – MemberMr. Anmol Jain – Member
Registrar & Share Transfer AgentM/s Karvy Computershare Private Limited Karvy Selenium Tower BPlot 31-32, GachibowliFinancial District, Nanakramguda Hyderabad – 500 032E-mail : [email protected]
Registered OfficeB-85-86, Mayapuri Industrial Area,Phase – I, New Delhi – 110064E-mail : [email protected]
Corporate Identity NumberL74899DL1981PLC012804
BankersHDFC Bank Ltd.HSBC BankICICI Bank Ltd.IDBI Bank Ltd.Societe GeneraleStandard Chartered BankState Bank of IndiaSyndicate BankYes Bank LimitedCiti BankAxis Bank Ltd.
Chief Financial OfficerMr. Shruti Kant Rustagi
Company SecretaryMr. Shwetank Tiwari
AuditorsM/s S.R. Batliboi & Co. LLP, Chartered Accountants, Gurgaon.
WorksPlot No.16, Sector-18, Maruti Complex, Gurgaon, Haryana.Plot No.6, Industrial Area, Dharuhera, District Rewari, Haryana.Plot No.195-195A, Sector 4, Phase-II, Bawal, District Rewari, Haryana.Plot No. 51, Sector 11, IIE, Pant Nagar, District Udham Singh Nagar, Uttarakhand.Plot No. 5, Industrial Park – II, Village Salempur, Mehdood, Haridwar, Uttarakhand.608-609, Chakan Talegaon Road, Mahalunge Ingle, Chakan, Pune, Maharashtra.D2-43/2, M.I.D.C. Industrial Area, Chinchwad, Pune, Maharashtra.Plot No. D-1, Vendors Park, Sanand, District Ahmedabad, Gujarat.Plot No. 69, Phase-II, Bidadi Industrial Area, Sector 2, Bangalore, Karnataka.
35TH ANNUAL GENERAL MEETING ON MONDAY, AUGUST 8, 2016

22
DIRECTORS’ REPORT
TO THE MEMBERS,
Your Directors are pleased to present the 35th Annual Report on the business and operations together with Audited Balance Sheet and Profit & Loss Account of your Company for the year ended March 31, 2016.
Financial ResultsYour Company’s performance during the year as compared with the previous year is summarized below:
DividendThe Company continues to deliver progressive returns to the Shareholders. The Board of Directors recommend that Interim Dividend of 120% (H12/- per Equity Share) declared on March 12, 2016 for the Financial Year 2015-16, be considered as Final Dividend. No further dividends are proposed/ recommended by the Board. The total amount of Dividend distributed aggregates to H 135.00 Million (Including Dividend Tax). The Dividend payout ratio comes to 36.12%.
A sum of H37.50 Million has been transferred to the General Reserve of the Company. This reaffirms the inherent financial strength of your Company.
Business PerformanceAfter a subdued growth of about 2.8% during FY16, Indian auto-component industry is likely to gain momentum and register a growth of 10% in the current fiscal FY17, with some traction in the passenger vehicle (PV) and motorcycle segments. Over the medium to long term, growth in the auto component industry is expected to be higher than the underlying automotive industry growth, given the increasing localisation by OEMs, higher component content per vehicle and rising exports from India. Over the medium term, operating margins are expected to stabilise at around 13.5%-14% level, given bottoming out of commodity prices in the current year. The implementation of the 7th Pay
(H in Million)
Particulars 2015-16 2014-15
Net Sales 12551.75 11425.59
EBITDA 929.27 648.62
Financial Expenses 134.38 144.30
Depreciation/Amortisation/Impairment Loss 378.99 361.58
Profit Before Tax (PBT) 415.90 142.74
Provision for Tax 42.16 (22.99)
Profit After Tax (PAT) 373.74 165.73
Balance of Profit brought forward 353.20 299.26
Less: Adjustment related to transitional provision (Schedule II of Companies Act, 2013)
- 33.31
Balance Available for Appropriation 726.94 431.68
Appropriations
Dividend 112.17 51.41
Corporate Dividend Tax 22.84 10.47
Transfer to General Reserve 37.50 16.60
Balance Carried to Balance Sheet 554.43 353.20
726.94 431.68
Dividend (%) 120 55
Basic and Diluted Earning Per Share (EPS) (H) 39.98 17.73

Lumax Industries Limited | Annual Report 2015-16
23
Commission is expected to support urban/ semi-urban segments like PV and scooter, whereas rural demand will be driven by expected above-average monsoon. In exports, robust demand for PV in North America as well as Europe is likely to offset expected decline in the M&HCV segment in those markets. Relatively better OE and exports demand, coupled with stable aftermarket demand, is likely to drive overall auto component industry growth in FY17. (ICRA reports)
During the year under review, the Indian Automobile Industry recorded a production growth of 2.58% as compared to 8.68% of the corresponding period last year. The industry produced around 23.96 Million vehicles of which share of two wheelers were 79%, passenger vehicles- 14%, three wheelers- 4% and commercial vehicles- 3%.
In this backdrop, during the year under review, your Company recorded a sales turnover of H 12551.75 Million as against H 11425.59 Million in the corresponding year registering a growth of 9.86%. The profit for the year after tax recorded at H 373.74 Million as compared to H 165.73 Million during the previous year registering an excellent growth of 125.51%.
Capacity Expansion / Modernisation of FacilitiesDuring the year under review, the Company has made investment to the tune of H 518 million towards up-gradation of its Research and Development facilities, modernization of its existing manufacturing facilities including its Bawal, Dharuhera and Chakan plants.
A detailed discussion on the business performance and future outlook is provided in the Chapter on Management Discussion & Analysis Report (MDA).
Vendor DevelopmentThe auto industry is heavily dependent on the auto component manufacturers and thus, the quality of final automobile is replica of the quality of the product supplied by auto component manufacturers. In order to ensure the quality, it becomes essential for the auto component manufacturers that their suppliers should be technologically as well as technically sound, must have capable manufacturing facility and must be using quality management techniques at par with global standard. The Company in its continuous efforts to upgrade its Vendors has started Sadbhav initiative, wherein a supplier council was formed to work closely with them and to support them to work more efficiently.
This initiative is focused towards achieving long-term cooperative effort between the company and its Vendors and to upgrade their technical, quality, delivery and cost capabilities and to foster ongoing improvements. In the auto component industry quality, cost and on-time delivery are considered as most important factors and focus on Vendor development will not only reduce cost but also ensure timely deliveries.
Directors & Key Managerial PersonnelIn accordance with the Articles of Association of the Company and the Companies Act, 2013, Mr. Norihisa Sato and Mr. Toru Tanabe, Directors are retiring by rotation at the ensuing Annual General Meeting and being eligible, offer themselves for re-appointment.
The tenure of Mr. Deepak Jain, Managing Director expired on January 31, 2016. The Board reappointed Mr. Deepak Jain as Managing Director for a further period of 5 years w.e.f. February 1, 2016, subject to the approval of the members in the ensuing Annual General Meeting.
Further, the tenure of Mr. Anmol Jain, Joint Managing Director is expiring on July 31, 2016. The Board recommends to reappoint Mr. Anmol Jain as Joint Managing Director for a further period of 5 years w.e.f. August 1, 2016, subject to the approval of the members in the ensuing Annual General Meeting.
Your Directors recommend the re-appointment of the above Directors at the ensuing Annual General Meeting.
The Independent Directors have given declarations that they meet the criteria of independence as laid down under Section 149(6) of the Companies Act, 2013.
Mr. B.S. Bhadauriya, Company Secretary of the Company since January 1, 2007 ceased to be the Company Secretary w.e.f. July 31, 2015 for taking up higher responsibilities at group level after restructuring. The Board has appointed Mr. Shwetank Tiwari as Company Secretary of the Company w.e.f. August 1, 2015. Mr. Shwetank Tiwari is a Law Graduate and an Associate Member of The Institute of Company Secretaries of India (ICSI), having about 10 years of experience and knowledge in secretarial functions.
Extract of Annual ReturnIn accordance with the requirement of Section 92 of the Companies Act, 2013 read with Rule 12 of the Companies (Management and Administration) Rules, 2014, the extract of the annual return in Form MGT 9 is annexed as Annexure - A.

24
Number of Board MeetingsThe Board of Directors met 5 (Five) times in the Financial year 2015-16. The details of the board meetings and the attendance of the Directors are provided in the Corporate Governance Report.
Directors Responsibility StatementAs required under Section 134(5) of the Companies Act, 2013 the Directors state:
(i) that in the preparation of the Annual Accounts for the Financial Year ended 31st March, 2016, the applicable Accounting Standards have been followed along with proper explanation relating to material departures in the Auditor Report and Notes to Accounts;
(ii) that the Directors have selected such accounting policies and applied them consistently and made judgments and estimates that are reasonable and prudent so as to give a true and fair view of the state of affairs of the company at the end of the financial year and of the profit and loss of the company for that period;
(iii) that the Directors have taken proper and sufficient care for the maintenance of adequate accounting records in accordance with the provisions of the Companies Act, 2013 for safeguarding the assets of the company and for preventing and detecting fraud and other irregularities;
(iv) that the Directors have prepared the Annual Accounts on a “going concern” basis.
(v) that the Directors had laid down internal financial controls to be followed by the company and that such internal financial controls are adequate and were operating effectively.
(vi) that the Directors had devised proper systems to ensure compliance with the provisions of all applicable laws and that such systems were adequate and operating effectively.
Remuneration PolicyThe Company follows a policy on remuneration of Directors and Senior Management Employees. The Policy is approved by the Nomination & Remuneration Committee and the Board. The Remuneration Policy is stated in the Corporate Governance Report.
Fixed DepositsDuring the year under review, the Company has not accepted any Deposit under Section 73 of the Companies Act, 2013 read with the Companies (Acceptance of Deposits) Rules, 2014.
AuditorsStatutory AuditorsThe members in their meeting held on August 22, 2014 had appointed M/s S.R. Batliboi & Co. LLP, Chartered Accountants, as Statutory Auditors of the Company for a period of 3 consecutive years in terms of the provisions of Section 139 of the Companies Act, 2013 read with the Companies (Audit and Auditors) Rules, 2014, to hold the office of auditors till the conclusion of the fourth consecutive Annual General Meeting of the Company to be held in the year 2017, subject to ratification by the Members at every Annual General Meeting. Your Directors recommend for ratification of their appointment in the ensuing Annual General Meeting.
During the year, all the recommendations of the Audit Committee were accepted by the Board. Hence, there is no need for disclosure of the same in this Report.
Cost AuditorsThe Board has re-appointed M/s Jitender, Navneet & Co. as the Cost Auditors of the Company in accordance with Section 148 and other applicable provisions, if any, of the Companies Act, 2013, for the audit of the cost accounts of the Company for the Financial Year 2015-16.
Secretarial AuditorPursuant to the provisions of Section 204 of the Companies Act, 2013 read with the Companies (Appointment and Remuneration of Managerial Personnel) Rules, 2014, the Company has appointed Mr. Maneesh Gupta, Practising Company Secretary as the Secretarial Auditor of the Company to undertake the Secretarial Audit for the financial year 2015-16. The Report of the Secretarial Audit is annexed herewith as Annexure - B.
Particulars of Loans, Guarantees and InvestmentsThe particulars of loans, guarantees and investments covered under the provisions of Section 186 of Companies Act, 2013 are given in the Notes to financial statements.
Consolidated Financial StatementsThe company has Consolidated the Financials Statements of its Associate Company SL Lumax Limited with its financials first time in accordance with the provisions of Companies Act, 2013. The Consolidated Financial Statements of the Company are prepared in accordance with the Accounting Standards, Companies Act, 2013, SEBI (Listing Obligations and Disclosure Requirements) Regulations 2015 and all other applicable laws for the time being in force and the same forms part of this Annual Report.

Lumax Industries Limited | Annual Report 2015-16
25
The Audited Financial Statements, including the Consolidated Financial Statements and related information are available on the website of the Company i.e. www.lumaxindustries.com. These documents shall also be available for inspection by any shareholder at the registered office of the Company.
Related Party Transaction and Policy In accordance with the provisions of the Companies Act, 2013 and SEBI (Listing Obligations And Disclosure Requirements) Regulations, 2015 the company has formulated a policy on Related Party Transactions, which is available on the Company’s website at http://www.lumaxindustries.com/pdf/related-party-transaction-policy. pdf. All Related Party Transactions, which are foreseen and repetitive in nature, are placed before the Audit Committee on a yearly basis for obtaining prior omnibus approval of the committee. The transactions entered into pursuant to the omnibus approval are placed before the Audit Committee for review and approval. All Related Party Transactions are subjected to independent review by a reputed accounting firm to establish compliance with the provisions of Companies Act, 2013 and Listing Regulations.
All related party transactions entered during the financial year were in the ordinary course of business and on arm’s length basis. There have been no material related party transactions undertaken by the Company during the year. Accordingly, no transactions are being reported in Form No. AOC-2 in terms of Section 134 of the Companies Act, 2013.
Vigil MechanismThe Company has established a vigil mechanism named Whistle Blower Policy, for directors, employees and business associates to report to the management, concerns about unethical behaviour, actual or suspected fraud or violation of the Company’s code of conduct or ethics policy, in accordance with the provisions of Companies Act, 2013 and SEBI (Listing Obligations And Disclosure Requirements) Regulations, 2015. The mechanism provides for adequate safeguards against unfair treatment of whistle blower who wishes to raise a concern and also provides for direct access to the Chairman of the Audit committee in appropriate/ exceptional cases. The Whistle Blower Policy is uploaded on the website of the Company.
Material Changes and CommitmentsNo other material changes and commitments affecting the Financial position of the Company have occurred between April 1, 2016 and the date on which this Report has been signed.
Information on Conservation of energy, Technology absorption, Foreign exchange earnings and OutgoDisclosure of information regarding Conservation of Energy, Research & Development, Technology Absorption and Foreign Exchange Earning and Outgo etc. under Section 134(3)(m) of the Companies Act, 2013 read with the Companies (Accounts) Rules, 2014, is annexed separately as Annexure – C.
Risk Management PolicyThe Company has adopted an enterprise risk management policy and established a risk management framework with an objective of timely identification, mitigation and control of the risks, which may threaten the existence of the Company, in accordance with the provisions of Companies Act, 2013 and SEBI (Listing Obligations And Disclosure Requirements) Regulations, 2015. The Company has also constituted a Risk Management Committee to review the risk trend, exposure, potential impact and their mitigation plans and periodically the key risks are also discussed at the Audit Committee.
Corporate Social Responsibility (CSR) Policy and InitiativesYour Company believes that corporate social responsibility programs reflect the human side of corporates, and the management’s personal commitments to contribute to the community and society of which they are a part. A well-managed CSR program creates social and environmental value, while supporting a company’s key stakeholders.
Your Company’s Corporate Social Responsibility (CSR) programs has been planned with focused approach of community participation. The key focus areas of your Company are education, promotion of girl chid and the healthcare of disadvantaged section of the society.
The company’s focus areas are largely covered under Schedule VII of the Companies Act, 2013. During the year, the Company has added one more school under its education initiative, besides continuing its support to the existing schools by way of providing financial support in terms of fees of girl children, E-learning centre, contributing towards infrastructure and other facilities for students in the school. Under its healthcare initiatives, the Company is focussing on preventive healthcare by continuously organising health check-up camps, lending financial support to hospitals for juvenile diabetes, cataract operations and partnering in special drives organised by various agencies for this cause.
The Company has constituted a CSR Committee of the Board and also developed & implemented a CSR Policy
26
in accordance with the provisions of Companies Act, 2013. The Committee monitors and oversees various CSR initiatives and activities of the Company. A detailed Report on Corporate Social Responsibility is annexed herewith as Annexure-D.
Performance Evaluation of Board, Committee and DirectorsThe Board is committed to transparency in determining its performance, committees and in assessing the performance of members. During the year, the Board with the assistance of Nomination and Remuneration Committee has completed the evaluation exercise, which includes the evaluation of the Board as a whole, committees and Directors, as per the internally designed evaluation process approved by the Board.
The evaluation tested key areas of the board’s work including strategy, business performance, risk and governance processes. The need to balance its monitoring activities with discussion on strategic matters was recognized and ought to be continually borne in mind. The evaluation considers the balance of skills, experience, independence and knowledge of the Company and the Board, its overall diversity, and analysis of the Board and its Directors’ functioning.
The feedback of the evaluation exercise was collated and discussed with the Board and an action plan to further improve the effectiveness of Board and committees is put in place.
Management Discussion & Analysis ReportPursuant to the provisions of Regulation 34 of the SEBI (Listing Obligations And Disclosure Requirements) Regulations, 2015, Management Discussion & Analysis Report is annexed as part of this report separately as Annexure – E.
Significant and Material Orders Passed by the Regulators or Courts There are no significant and material orders passed by the Regulators / Courts / Tribunals, which would impact the going concern status of the Company and its future operations.
Internal Financial ControlThe Company has a comprehensive internal control system in place for ensuring reliability of financial reporting, orderly and efficient conduct of business, compliance with policies, procedures, safeguarding of assets and economical and efficient use of resources. Appropriate review and control mechanisms are built in place to ensure that such control systems are adequate and are operating effectively.
The monitoring and reporting of finance systems is supported by a web-based system SAP, which helps in obtaining accurate and complete accounting records and timely preparation of reliable financial disclosures.
Corporate GovernanceThe report on Corporate Governance together with the Auditor’s Certificate regarding the Compliance of conditions of Corporate Governance as stipulated in SEBI (Listing Obligations And Disclosure Requirements) Regulations, 2015 is annexed and forms part of this Annual Report as Annexure – F.
Particulars of EmployeesInformation on Particulars of Employees as required under Section 197 of the Companies Act, 2013 read with Rule 5(1) of the Companies (Appointment and Remuneration of Managerial Personnel) Rules, 2014 forms an integral part of this report as Annexure-G. The information required pursuant to Section 197 of the Companies Act, 2013 read with Rules 5(2) and 5(3) of the Companies (Appointment and Remuneration of Managerial Personnel) Rules, 2014 in respect of employees of your Company is available for inspection by the members at the registered office of the Company during business hours on working days up to the date of ensuing Annual General Meeting. If any member is interested in obtaining a copy thereof, such member may write to the Company Secretary, whereupon a copy would be sent.
Acknowledgement We are confident that our actions will develop a robust business model, which will help the company deliver solid results in the years to come. Your Directors wish to place on record their sincere thanks to all its highly valued customers, its Technical and Financial Collaborator- M/s Stanley Electric Co. Ltd., Japan, all other business partners, all the shareholders, financial institutions, banks, vendors and various Government agencies for their continued support and patronage.
The Board would also like to acknowledge the tireless efforts of its associates and employees across all levels for their wholehearted dedication and contribution for the growth of the Company.
For and on behalf of the Board of Directors
Place : New Delhi D.K. JainDated : May 12, 2016 Chairman
DIN: 00085848

Lumax Industries Limited | Annual Report 2015-16
27
Annexure - A
Form No. MGT -9Extract of Annual Return
as on the financial year ended on 31st March, 2016[(Pursuant to section 92(3) of the Companies Act, 2013 and rule 12(1) of the Companies
(Management and Administration) Rules, 2014)]
I. Registration and Other Details:
i) CIN:- L74899DL1981PLC012804
ii) Registration Date 10-12-1981
iii) Name of the Company Lumax Industries Limited
iv) Category/sub-category of the Company Public listed Company having Share Capital
v) Address of the Registered office and contact details
B-85-86, Mayapuri Industrial Area, Phase-1, New Delhi - 110064Ph. +91 11 28111777
vi) Whether listed company Yes
vii) Name, Address and Contact details of Registrar and Transfer Agent, if any
M/s Karvy Computershare Pvt. Ltd.Karvy Selenium Tower B, Plot 31-32, Gachibowli, Financial District, Nanakramguda, Hyderabad – 500 032.E-mail id : [email protected]
II. Principal Business Activities of the CompanyAll the business activities contributing 10% or more of the total turnover of the company shall be stated:-
Sl. No
Name and Description of main Products/Services
NIC Code of the Product/service
% total turnover of the Company
1 Automotive Lamp 2740 92.46 %
III. Particulars of Holding, Subsidiary and Associate CompaniesSl. No
Name and Address of the Company
CIN/GLN Holding/Subsidiary/Associate
% of shares held
Applicable Section
1 SL Lumax LimitedG-15, Sipcot Industrial Park, Irungattukottai, Sriperumbudur-602 105
U34300TN1997PLC048136 Associate 21.28% 2(6)

28
IV. Share Holding Pattern (Equity Share Capital Breakup as percentage of Total Equity) i) Category-wise Share Holding
Category of Shareholders
No. of Shares held at the beginning of the year (As on 31-03-2015)
No. of Shares held at the end of the year (As on 31-03-2016)
% Change
during the year
Demat Physical Total % of Total
Shares
Demat Physical Total % of Total
Shares
A. Promoters
(1) Indian
a) Individual/ HUF 2427555 - 2427555 25.97 2427555 - 2427555 25.97 -
b) Central Govt - - - - - - - - -
c) State Govt (s) - - - - - - - - -
d) Bodies Corp. 951133 - 951133 10.17 944233 - 944233 10.10 (0.07)
e) Banks / FI - - - - - - - - -
f) Any Other…. - - - - - - - - -
Sub-total (A) (1) 3378688 - 3378688 36.14 3371788 - 3371788 36.07 (0.07)
(2) Foreign
a) NRIs - Individuals
- - - - - - - - -
b) Other – Individuals
- - - - - - - - -
c) Bodies Corp. 3505399 - 3505399 37.50 3505399 - 3505399 37.50 -
d) Banks / FI - - - - - - - - -
e) Any Other…. - - - - - - - - -
Sub-total (A) (2):- 3505399 - 3505399 37.50 3505399 - 3505399 37.50 -
Total shareholding of Promoter (A) = (A)(1)+(A)(2)
6884087 - 6884087 73.64 6877187 - 6877187 73.57 (0.07)
B. Public Shareholding
1. Institutions
a) Mutual Funds - 1740 1740 0.02 - 1740 1740 0.02 -
b) Banks / FI 5010 270 5280 0.05 5840 270 6110 0.06 0.01
c) Central Govt - - - - - - - - -
d) State Govt(s) - - - - - - - - -
e) Venture Capital Funds
- - - - - - - - -
f) Insurance Companies
- - - - - - - - -
g) Foreign Institutional Investors
31400 200 31600 0.34 155003
200 155203 1.66 1.32
h) Foreign Venture Capital Funds
- - - - - - - - -
i) Others (specify) - - - - - - - - -
Sub-total (B)(1):- 36410 2210 38620 0.41 160843 2210 163053 1.74 1.33
Lumax Industries Limited | Annual Report 2015-16
29
Category of Shareholders
No. of Shares held at the beginning of the year (As on 31-03-2015)
No. of Shares held at the end of the year (As on 31-03-2016)
% Change
during the year
Demat Physical Total % of Total
Shares
Demat Physical Total % of Total
Shares
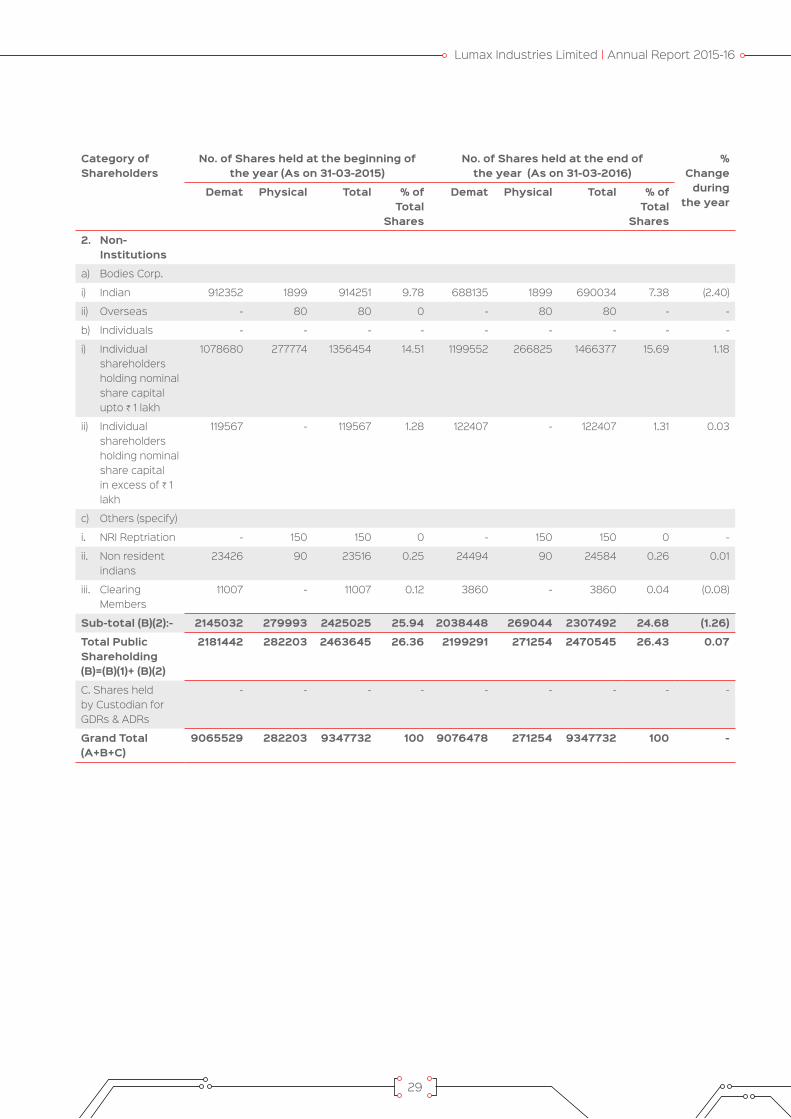
2. Non-Institutions
a) Bodies Corp.
i) Indian 912352 1899 914251 9.78 688135 1899 690034 7.38 (2.40)
ii) Overseas - 80 80 0 - 80 80 - -
b) Individuals - - - - - - - - -
i) Individual shareholders holding nominal share capital upto H 1 lakh
1078680 277774 1356454 14.51 1199552 266825 1466377 15.69 1.18
ii) Individual shareholders holding nominal share capital in excess of H 1 lakh
119567 - 119567 1.28 122407 - 122407 1.31 0.03
c) Others (specify)
i. NRI Reptriation - 150 150 0 - 150 150 0 -
ii. Non resident indians
23426 90 23516 0.25 24494 90 24584 0.26 0.01
iii. Clearing Members
11007 - 11007 0.12 3860 - 3860 0.04 (0.08)
Sub-total (B)(2):- 2145032 279993 2425025 25.94 2038448 269044 2307492 24.68 (1.26)
Total Public Shareholding (B)=(B)(1)+ (B)(2)
2181442 282203 2463645 26.36 2199291 271254 2470545 26.43 0.07
C. Shares held by Custodian for GDRs & ADRs
- - - - - - - - -
Grand Total (A+B+C)
9065529 282203 9347732 100 9076478 271254 9347732 100 -

30
ii) Shareholding of Promoters
Sl No.
Shareholder’s Name
Shareholding at the beginning of the year (As on 31-03-2015)
Share holding at the end of the year (As on 31-03-2016)
% change
in share holding during
the year
No. of Shares
% of total
Shares of the
company
%of Shares Pledged /
encumbered to total shares
No. of Shares
% of total
Shares of the
company
%of Shares Pledged /
encumbered to total shares
1 Stanley Electric Co. Ltd
3343381 35.77 - 3343381 35.77 - -
2 Mr. Dhanesh Kumar Jain
1938025 20.73 - 1938025 20.73 - -
3 Lumax Auto Technologies Limited
525000 5.62 - 525000 5.62 - -
4 Lumax Finance Pvt. Ltd
417253 4.46 - 417253 4.46 - -
5 Thai Stanley Electric Public Co. Ltd
162018 1.73 - 162018 1.73 - -
6 Ms. Usha Jain 144483 1.55 - 144483 1.55 - -
7 Mr. Deepak Jain 136711 1.46 - 136711 1.46 - -
8 Mr. Dhanesh Kumar Jain (HUF)
124970 1.34 - 124970 1.34 - -
9 Mr. Anmol Jain 53778 0.58 - 53778 0.58 - -
10 Mr. Dhanesh Kumar Jain jointly with Ms. Usha Jain
14230 0.15 - 14230 0.15 - -
11 Vardhman Agencies Pvt. Ltd
7800 0.08 - 900 0.01 - (0.07)
12 Ms. Usha Jain jointly with Mr. D.K. Jain
6200 0.07 - 6200 0.07 - -
13 Mr. Deepak Jain Jointly with Ms. Usha Jain
6000 0.06 - 6000 0.06 - -
14 Mr. Anmol Jain Jointly with Ms. Usha Jain
1600 0.02 - 1600 0.02 - -
15 Mr. Umesh Kumar Jain
1558 0.02 - 1558 0.02 - -
16 Lumax Automotive Systems Ltd
1080 0.01 - 1080 0.01 - -
Total 6884087 73.64 0.00 6877187 73.57 (0.07)

Lumax Industries Limited | Annual Report 2015-16
31
iii) Change in Promoters’ Shareholding ( please specify, if there is no change)
Sl No.
Name of the Shareholder Shareholding at the beginning of the year
(31-03-2015)
Cumulative Shareholding during the Year 2015-16
No. of Shares
% of total share capital
of the Company
No. of Shares
% of total share capital
of the Company
1 Vardhman Agencies Pvt. Ltd
At the beginning of the year 7800 0.08
Increase/Decrease in Shareholding during the year
10/04/2015 (500) 0.01 7300 0.07
01/05/2015 (266) 0.00 7034 0.07
05/06/2015 (200) 0.00 6834 0.07
03/07/2015 (300) 0.00 6534 0.07
24/07/2015 (100) 0.00 6434 0.07
31/07/2015 (200) 0.00 6234 0.07
07/08/2015 (234) 0.00 6000 0.07
14/08/2015 (77) 0.00 5923 0.07
11/09/2015 (200) 0.00 5723 0.07
30/09/2015 (100) 0.00 5623 0.07
02/10/2015 (1000) 0.01 4623 0.06
09/10/2015 (623) 0.01 4000 0.05
31/10/2015 (300) 0.00 3700 0.05
13/11/2015 (150) 0.00 3550 0.05
20/11/2015 (100) 0.00 3450 0.05
11/12/2015 (450) 0.01 3000 0.04
15/01/2016 (600) 0.01 2400 0.03
05/02/2016 (100) 0.00 2300 0.03
19/02/2016 (400) 0.01 1900 0.02
04/03/2016 (150) 0.00 1750 0.02
25/03/2016 (600) 0.01 1150 0.01
31/03/2016 (250) 0.00 900 0.01
At the end of the year 900 0.01
32
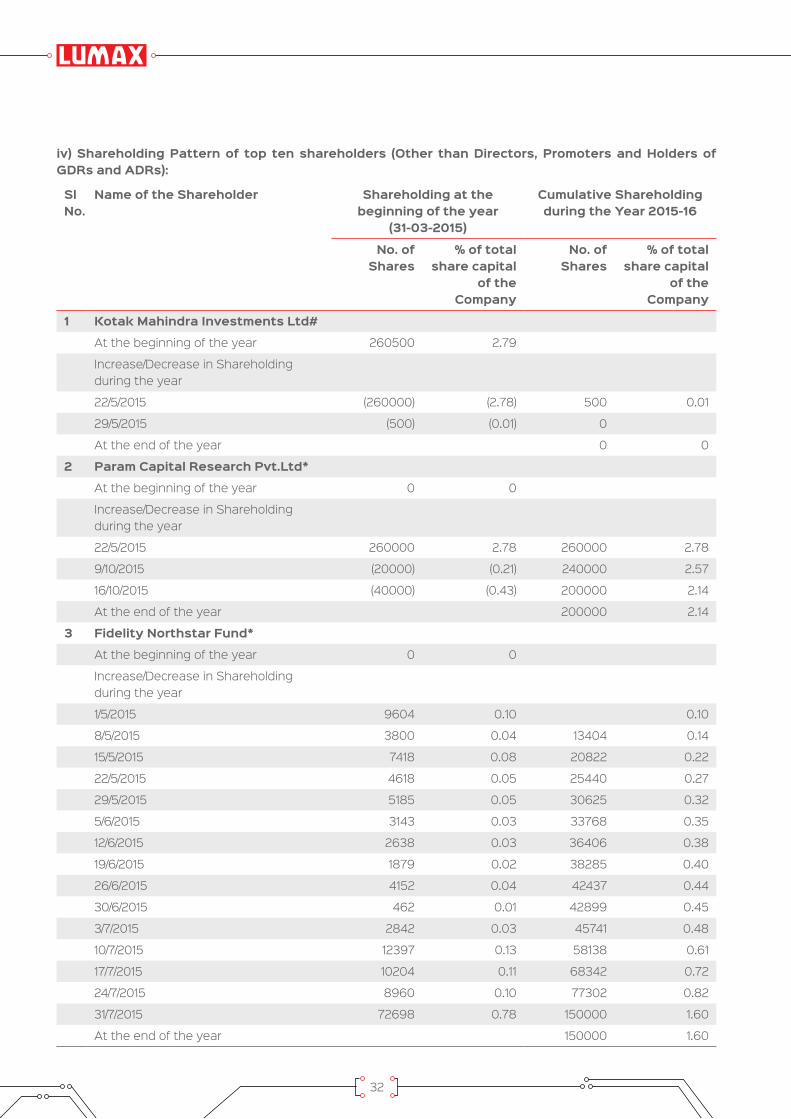
iv) Shareholding Pattern of top ten shareholders (Other than Directors, Promoters and Holders of GDRs and ADRs):
Sl No.
Name of the Shareholder Shareholding at the beginning of the year
(31-03-2015)
Cumulative Shareholding during the Year 2015-16
No. of Shares
% of total share capital
of the Company
No. of Shares
% of total share capital
of the Company
1 Kotak Mahindra Investments Ltd#At the beginning of the year 260500 2.79
Increase/Decrease in Shareholding during the year
22/5/2015 (260000) (2.78) 500 0.01
29/5/2015 (500) (0.01) 0
At the end of the year 0 0
2 Param Capital Research Pvt.Ltd*At the beginning of the year 0 0
Increase/Decrease in Shareholding during the year
22/5/2015 260000 2.78 260000 2.78
9/10/2015 (20000) (0.21) 240000 2.57
16/10/2015 (40000) (0.43) 200000 2.14
At the end of the year 200000 2.14
3 Fidelity Northstar Fund*At the beginning of the year 0 0
Increase/Decrease in Shareholding during the year
1/5/2015 9604 0.10 0.10
8/5/2015 3800 0.04 13404 0.14
15/5/2015 7418 0.08 20822 0.22
22/5/2015 4618 0.05 25440 0.27
29/5/2015 5185 0.05 30625 0.32
5/6/2015 3143 0.03 33768 0.35
12/6/2015 2638 0.03 36406 0.38
19/6/2015 1879 0.02 38285 0.40
26/6/2015 4152 0.04 42437 0.44
30/6/2015 462 0.01 42899 0.45
3/7/2015 2842 0.03 45741 0.48
10/7/2015 12397 0.13 58138 0.61
17/7/2015 10204 0.11 68342 0.72
24/7/2015 8960 0.10 77302 0.82
31/7/2015 72698 0.78 150000 1.60
At the end of the year 150000 1.60
Lumax Industries Limited | Annual Report 2015-16
33
Sl No.
Name of the Shareholder Shareholding at the beginning of the year
(31-03-2015)
Cumulative Shareholding during the Year 2015-16
No. of Shares
% of total share capital
of the Company
No. of Shares
% of total share capital
of the Company
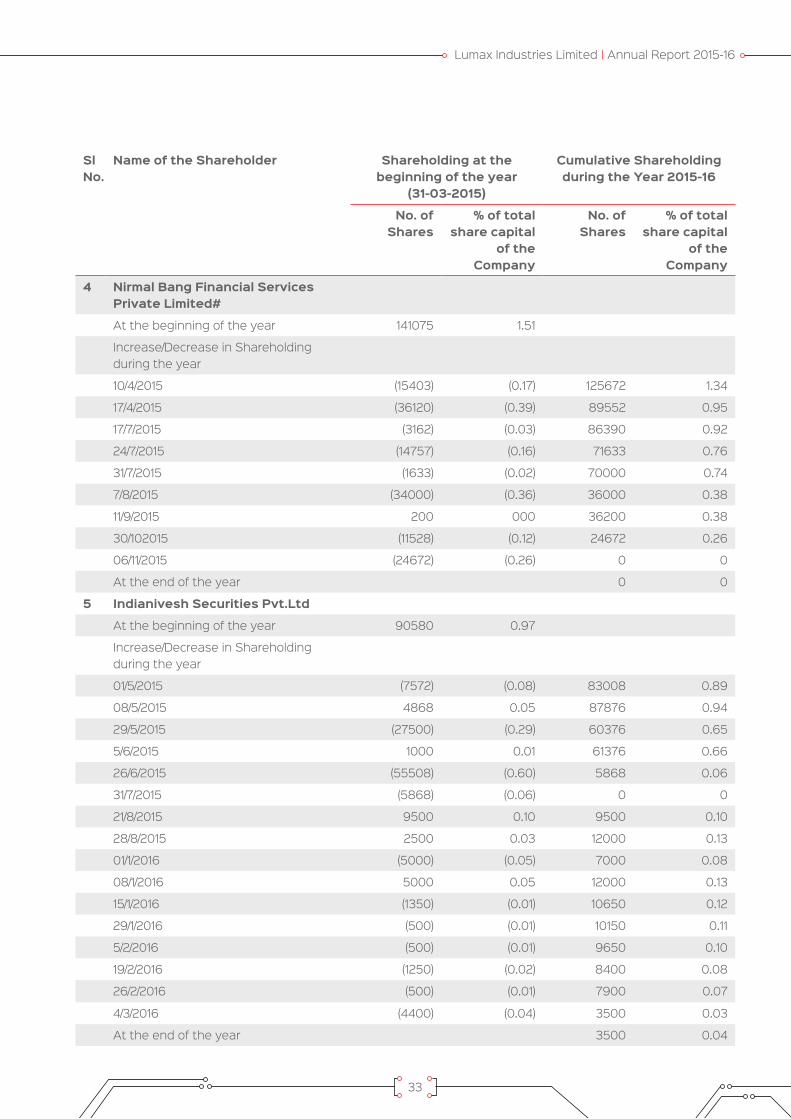
4 Nirmal Bang Financial Services Private Limited#
At the beginning of the year 141075 1.51
Increase/Decrease in Shareholding during the year
10/4/2015 (15403) (0.17) 125672 1.34
17/4/2015 (36120) (0.39) 89552 0.95
17/7/2015 (3162) (0.03) 86390 0.92
24/7/2015 (14757) (0.16) 71633 0.76
31/7/2015 (1633) (0.02) 70000 0.74
7/8/2015 (34000) (0.36) 36000 0.38
11/9/2015 200 000 36200 0.38
30/102015 (11528) (0.12) 24672 0.26
06/11/2015 (24672) (0.26) 0 0
At the end of the year 0 0
5 Indianivesh Securities Pvt.Ltd
At the beginning of the year 90580 0.97
Increase/Decrease in Shareholding during the year
01/5/2015 (7572) (0.08) 83008 0.89
08/5/2015 4868 0.05 87876 0.94
29/5/2015 (27500) (0.29) 60376 0.65
5/6/2015 1000 0.01 61376 0.66
26/6/2015 (55508) (0.60) 5868 0.06
31/7/2015 (5868) (0.06) 0 0
21/8/2015 9500 0.10 9500 0.10
28/8/2015 2500 0.03 12000 0.13
01/1/2016 (5000) (0.05) 7000 0.08
08/1/2016 5000 0.05 12000 0.13
15/1/2016 (1350) (0.01) 10650 0.12
29/1/2016 (500) (0.01) 10150 0.11
5/2/2016 (500) (0.01) 9650 0.10
19/2/2016 (1250) (0.02) 8400 0.08
26/2/2016 (500) (0.01) 7900 0.07
4/3/2016 (4400) (0.04) 3500 0.03
At the end of the year 3500 0.04

34
Sl No.
Name of the Shareholder Shareholding at the beginning of the year
(31-03-2015)
Cumulative Shareholding during the Year 2015-16
No. of Shares
% of total share capital
of the Company
No. of Shares
% of total share capital
of the Company
6 Kriner Services Pvt.Ltd
At the beginning of the year 69748 0.75
Increase/Decrease in the shareholding during the year
7/8/2015 (5000) (0.05) 64748 0.70
23/10/2015 (1978) (0.02) 62770 0.67
6/11/2015 (2300) (0.03) 60470 0.65
27/11/2015 (2200) (0.02) 58270 0.62
At the end of the year 58270 0.62
7 Rajasthan Global Securities Private Limited*
At the beginning of the year 0 0
Increase/Decrease in the shareholding during the year
7/8/2015 15022 0.16
21/8/2015 (15022) (0.16) 0 0
30/9/2015 1959 0.02
27/11/2015 4116 0.04 6075 0.06
1/12/2015 (1000) 0.01 5075 0.05
18/12/2015 7697 0.08 12772 0.13
25/12/2015 5839 0.06 18611 0.19
31/12/2015 16486 0.18 35097 0.37
8/1/2016 13854 0.15 48951 0.52
12/2/2016 (457) 0.00 48494 0.52
26/2/2016 8766 0.09 57260 0.61
At the end of the year 57260 0.61
8 Camel Foods Pvt.Ltd*
At the beginning of the year 0 0
Increase/Decrease in the shareholding during the year
7/8/2015 7012 0.08 7012 0.08
14/8/2015 (2510) (0.03) 4502 0.05
4/9/2015 820 0.01 5322 0.06
11/9/2015 532 0.01 5854 0.07

Lumax Industries Limited | Annual Report 2015-16
35
Sl No.
Name of the Shareholder Shareholding at the beginning of the year
(31-03-2015)
Cumulative Shareholding during the Year 2015-16
No. of Shares
% of total share capital
of the Company
No. of Shares
% of total share capital
of the Company
18/9/2015 553 0.01 6407 0.08
9/10/2015 (499) (0.01) 5908 0.07
23/10/2015 8509 0.09 14417 0.16
30/10/2015 852 0.01 15269 0.17
6/11/2015 5880 0.06 21149 0.23
13/11/2015 (1600) (0.02) 19549 0.21
20/11/2015 11731 0.13 31280 0.34
4/12/2015 (9978) (0.11) 21302 0.23
11/12/2015 4653 0.05 25955 0.28
18/12/2015 8931 0.06 34886 0.37
31/12/2015 (4063) (0.04) 30823 0.33
8/1/2016 7417 0.08 38240 0.41
29/1/2016 451 0.00 38691 0.41
5/2/2016 (2019) (0.02) 36672 0.39
26/2/2016 500 0.01 37172 0.40
18/3/2016 (306) 0.00 36866 0.40
At the end of the year 36866 0.40
9 CSP Infrastructure Private Limited*
At the beginning of the year 0 0
Increase/Decrease in the shareholding during the year
19/2/2016 30444 0.33
At the end of the year 30444 0.33
10 Pulkit N. Sekhsaria
At the beginning of the year 49209 0.52
Increase/Decrease in the shareholding during the year
18/12/2015 (13583) (0.15) 35626 0.38
25/12/2015 (7641) (0.08) 27985 0.30
31/12/2015 (6203) (0.07) 21782 0.23
8/1/2016 (6456) (0.07) 15326 0.16
At the end of the year 15326 0.16

36
Sl No.
Name of the Shareholder Shareholding at the beginning of the year
(31-03-2015)
Cumulative Shareholding during the Year 2015-16
No. of Shares
% of total share capital
of the Company
No. of Shares
% of total share capital
of the Company
11 LTS Investments Fund Ltd
At the beginning of the year 25500 0.27
Increase/Decrease in the shareholding during the year
7/08/2015 (25500) (0.27) 0 0.00
At the end of the year 0 0.00
12 Lok Prakashan Ltd
At the beginning of the year 20000 0.21
Increase/Decrease in the shareholding during the year
0 0.00 0 0.00
At the end of the year 20000 0.21
13 LKP Finance Limited
At the beginning of the year 17230 0.18
Increase/Decrease in the shareholding during the year
10/4/2015 100 0.00 17330 0.18
26/6/2015 (500) (0.01) 16830 0.17
30/6/2015 (1707) (0.02) 15123 0.15
3/7/2015 (3239) (0.03) 11884 0.12
10/7/2015 (11484) (0.12) 400 0.00
31/7/2015 (250) (0.00) 150 0.00
7/8/2015 (105) (0.00) 45 0.00
14/8/2015 20 0.00 65 0.00
21/8/2015 (40) (0.00) 25 0.00
4/9/2015 (25) (0.00) 0 0.00
18/9/2015 7 0.00 7 0.00
25/9/2015 (7) (0.00) 0 0
At the end of the year 0 0
14 Prabhas Dhanuka
At the beginning of the year 20000 0.21
Increase/Decrease in the shareholding during the year
0 0
At the end of the year 20000 0.21

Lumax Industries Limited | Annual Report 2015-16
37
Sl No.
Name of the Shareholder Shareholding at the beginning of the year
(31-03-2015)
Cumulative Shareholding during the Year 2015-16
No. of Shares
% of total share capital
of the Company
No. of Shares
% of total share capital
of the Company
15 Girish Kumar Sharda*
At the beginning of the year 2319 0.02
Increase/Decrease in the shareholding during the year
17/4/2015 5181 0.06 7500 0.08
1/5/2015 1500 0.02 9000 0.10
8/5/2015 1000 0.01 10000 0.11
22/5/2015 3887 0.03 13887 0.14
29/5/2015 620 0.01 14507 0.15
5/6/2015 750 0.01 15257 0.16
25/9/2015 (135) (0.00) 15122 0.16
19/2/2016 1246 0.02 16368 0.18
At the end of the year 16368 0.18
16 Beri Mercurio Private Ltd
At the beginning of the year 15880 0.17
Increase/Decrease in the shareholding during the year
0 0 0 0
At the end of the year 15880 0.17
* Not in the list of top 10 shareholders as on 31-03-2015. The same has been reflected above since the shareholder was one of the Top shareholders as on 31-03-2016.
#Ceased to be in the list of top 10 shareholders as on 31-03-2016. The same is reflected above since the shareholder was one of the top 10 shareholder as on 31-03-2015.

38
v) Shareholding of Directors and Key Managerial Personnel:
Sl No.
Shareholding at the beginning of the year
(31-03-2015)
Cumulative shareholding during the year
No. of Shares
% of total shares of
the company
No. of Shares
% of total shares of
the company
A Name of the Directors and KMP
1. Mr. D.K. Jain
At the beginning of the year 1952255 20.88 - -
Increase/Decrease in the shareholding during the year
- - - -
At the end of the Year - - 1952255 20.88
2. Mr. Deepak Jain
At the beginning of the year 142711 1.53 - -
Increase/Decrease in the shareholding during the year
- - - -
At the end of the Year - - 142711 1.53
3. Mr. Anmol Jain
At the beginning of the year 55378 0.59 - -
Increase/Decrease in the shareholding during the year
- - - -
At the end of the Year - - 55378 0.59
B Name of the Key Managerial Personnel
4. Mr. Shruti Kant Rustagi
At the beginning of the year 02 0
Increase/Decrease in the shareholding during the year
400 0.00 - -
At the end of the Year - - 402 0.00
Note: Mr. Eiichi Hirooka, Mr. Norihisa Sato, Mr. Toru Tanabe, Mr. A.P. Gandhi, Mr. Rattan Kapur, Mr. Gursaran Singh, Mr. M.C. Gupta, Mr. Dhiraj Dhar Gupta, Ms. Pallavi Dinodia, Directors and Mr. Shwetank Tiwari, Company Secretary did not hold any shares of the Company during the Financial Year 2015-16.

Lumax Industries Limited | Annual Report 2015-16
39
V. Indebtedness Indebtedness of the Company including interest outstanding/accrued but not due for payment
( H In lacs)
Secured Loans
excluding deposits
UnsecuredLoans
Deposits TotalIndebtedness
Indebtedness at the beginning of the financial year:
i) Principal Amount 15947.11 - - 15947.11
ii) Interest due but not paid - - - -
iii) Interest accrued but not due - - - -
Total ( i + ii +iii ) 15947.11 - - 15947.11
Change in Indebtedness during the financial year:
4351.30 - - 4351.30
7567.78 - - 7567.78
Net Change (3216.48) - (3216.48)
Indebtedness at the end of the financial year:
i) Principal Amount 12730.63 - - 12730.63
ii) Interest due but not paid - - - -
iii) Interest accrued but not due - - - -
Total ( i + ii + iii) 12730.63 - - 12730.63
40
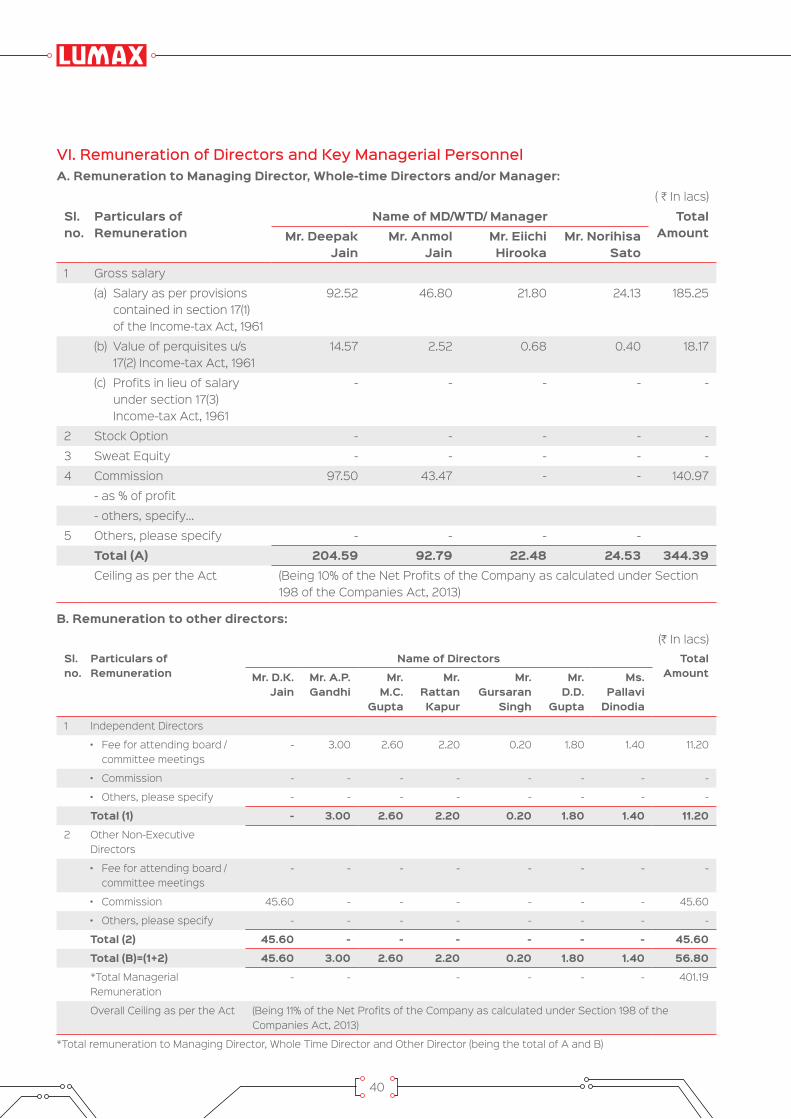
B. Remuneration to other directors: (H In lacs)
Sl. no.
Particulars of Remuneration
Name of Directors Total Amount Mr. D.K.
JainMr. A.P. Gandhi
Mr. M.C.
Gupta
Mr. Rattan Kapur
Mr. Gursaran
Singh
Mr. D.D.
Gupta
Ms. Pallavi
Dinodia
1 Independent Directors
committee meetings- 3.00 2.60 2.20 0.20 1.80 1.40 11.20
- - - - - - - -
- - - - - - - -
Total (1) - 3.00 2.60 2.20 0.20 1.80 1.40 11.20
2 Other Non-Executive Directors
committee meetings- - - - - - - -
45.60 - - - - - - 45.60
- - - - - - - -
Total (2) 45.60 - - - - - - 45.60
Total (B)=(1+2) 45.60 3.00 2.60 2.20 0.20 1.80 1.40 56.80
*Total Managerial Remuneration
- - - - - - 401.19
Overall Ceiling as per the Act (Being 11% of the Net Profits of the Company as calculated under Section 198 of the Companies Act, 2013)
*Total remuneration to Managing Director, Whole Time Director and Other Director (being the total of A and B)
VI. Remuneration of Directors and Key Managerial Personnel A. Remuneration to Managing Director, Whole-time Directors and/or Manager:
( H In lacs)
Sl. no.
Particulars of Remuneration
Name of MD/WTD/ Manager Total Amount Mr. Deepak
JainMr. Anmol
JainMr. Eiichi Hirooka
Mr. Norihisa Sato
1 Gross salary
(a) Salary as per provisions contained in section 17(1) of the Income-tax Act, 1961
92.52 46.80 21.80 24.13 185.25
(b) Value of perquisites u/s 17(2) Income-tax Act, 1961
14.57 2.52 0.68 0.40 18.17
(c) Profits in lieu of salary under section 17(3) Income-tax Act, 1961
- - - - -
2 Stock Option - - - - -
3 Sweat Equity - - - - -
4 Commission 97.50 43.47 - - 140.97
- as % of profit
- others, specify…
5 Others, please specify - - - -
Total (A) 204.59 92.79 22.48 24.53 344.39Ceiling as per the Act (Being 10% of the Net Profits of the Company as calculated under Section
198 of the Companies Act, 2013)

Lumax Industries Limited | Annual Report 2015-16
41
C. Remuneration to Key Managerial Personnel other than MD/Manager/WTD
(H In lacs)
Sl. no.
Particulars of Remuneration Name of MD/WTD/ Manager Total Amount Company
Secretary(Mr. Shwetank
Tiwari)
Chief Financial Officer
(Mr. Shruti Kant Rustagi)
1 Gross salary
(a) Salary as per provisions contained in section 17(1) of the Income-tax Act, 1961
11.42 43.20 54.62
(b) Value of perquisites u/s 17(2) Income-tax Act, 1961 0.33 1.01 1.34
(c) Profits in lieu of salary under section 17(3) Income-tax Act, 1961
2 Stock Option - - -
3 Sweat Equity - - -
4 Commission - - -
- as % of profit
- others, specify…
5 Others, please specify - - -
Total (A) 11.75 44.21 55.96
VII. Penalties / Punishment/ Compounding of Offences:Against the Company, Directors and other Officers in Default under the Companies Act, 2013: NONE

42
Annexure - B
Secretarial Audit ReportFor the financial year ended March 31, 2016
[Pursuant to section 204(1) of the Companies Act, 2013 and rule 9 of the Companies (Appointment and Remuneration of Managerial Personnel) Rules, 2014]
To,The Members,Lumax Industries LimitedB-85-86, Mayapuri Industrial Area, Phase-INew Delhi-110 064
We were appointed by the Board of Directors of Lumax Industries Limited (hereinafter called the Company) to conduct Secretarial Audit for the financial year of the Company ended March 31, 2016.
We have conducted the Secretarial Audit of the compliance of applicable statutory provisions and the adherence to good corporate practices by the Company. Secretarial Audit was conducted in a manner that provided us with a reasonable basis for evaluating the corporate conducts/ statutory compliances and expressing our opinion thereon.
Management’s Responsibility for Secretarial CompliancesThe Company’s management is responsible for preparation and maintenance of secretarial records and for devising proper systems to ensure compliance with the provisions of applicable laws and regulations
Auditors ResponsibilityOur responsibility is to express an opinion on these secretarial records, standards and procedures followed by the Company with respect to secretarial compliances
We believe that audit evidence and information obtained from the Company’s management is adequate and appropriate for us to provide a basis for our opinion.
We have followed the audit practices and processes as were appropriate to obtain reasonable assurance about the correctness of the contents of the secretarial records. The verification was done on test basis to ensure that correct facts are reflected in secretarial records. We believe that the processes and practices, we followed provide a reasonable basis for our opinion.
The secretarial audit report is neither an assurance to the future viability of the company nor of the efficacy or effectiveness with which the management has conducted the affairs of the Company.
OpinionWe have examined the books, papers, minute books, forms and returns filed and other records maintained by the Company for the financial year ended on March 31, 2016 according to the provisions of:
(i) The Companies Act, 2013 (the Act) and the rules made thereunder;
(ii) The Securities Contracts (Regulation) Act, 1956 (‘SCRA’) and the rules made thereunder;
(iii) The Depositories Act, 1996 and the Regulations and Bye-laws framed thereunder;
(iv) Foreign Exchange Management Act, 1999 and the rules and regulations made thereunder to the extent of Foreign Direct Investment and External Commercial Borrowings;
(v) The following Regulations and Guidelines prescribed under the Securities and Exchange Board of India Act, 1992 (‘SEBI Act’):-
(a) The Securities and Exchange Board of India (Substantial Acquisition of Shares and Takeovers) Regulations, 2011,
(b) The Securities and Exchange Board of India (Prohibition of Insider Trading) Regulations, 2015;
(c) The Securities and Exchange Board of India (Issue of Capital and Disclosure Requirements) Regulations, 2009 – (Not applicable as the Company has not issued any fresh equity during the year under review;).
(d) The Securities and Exchange Board of India (Employee Stock Option Scheme and Employee Stock Purchase Scheme) Guidelines, 1999 – (Not applicable as the Company has not granted any employee stock option;).
(e) The Securities and Exchange Board of India (Issue and Listing of Debt Securities) Regulations,

Lumax Industries Limited | Annual Report 2015-16
43
2008 – (Not applicable as the Company has not issued any debt securities during the year under review;).
(f) The Securities and Exchange Board of India (Registrars to an Issue and Share Transfer Agents) Regulations, 1993 regarding the Companies Act and dealing with client – (Not applicable;).
(g) The Securities and Exchange Board of India (Delisting of Equity Shares) Regulations, 2009 – (Not applicable as the Company has not delisted its shares from any stock exchange during the year under review; and).
(h) The Securities and Exchange Board of India (Buyback of Securities) Regulations, 1998 – (Not applicable as the Company has not brought back its securities during the year under review;).
We have also examined compliance with the applicable clauses of the following:
(i) Secretarial Standards issued by The Institute of Company Secretaries of India.
(ii) SEBI (Listing Obligations and Disclosure Requirements) Regulations, 2015.
Based on our verification of the Company’s books, papers, minutes books, forms and returns filed and other records maintained by the Company and also the information provided by the Company, its officers, agents and authorized representatives during the conduct of Secretarial Audit, we hereby report that in our opinion, the Company has, during the financial year ended March 31, 2016, complied with the aforesaid laws, material compliances as listed in the Annexure attached to this report.
Based on information received and records maintained, we further report that:
1. The Board of Directors of the Company is duly constituted with proper balance of Executive Directors, Non-Executive Directors and Independent Directors. The changes in the composition of
the Board of Directors that took place during the financial year under review were carried out in compliance with the provisions of the Act.
2. Adequate notice is given to all directors to schedule the Board Meetings. Agenda and detailed notes on agenda were sent at least seven days in advance, and a system exists for seeking and obtaining further information and clarifications on the agenda items before the meeting and for meaningful participation at the meeting.
3. The Company has proper Board processes.
Based on the compliances mechanism established by the Company and on the basis of the Compliance Certificate(s) issued by the Company Secretary and taken on records by the Board of Directors at their meeting(s), we are of the opinion that the management has:
a) adequate systems and processes in the company commensurate with the size and operations of the company to monitor and ensure compliance with applicable laws, rules, regulations and guidelines.
b) Complied with the following laws applicable to the Company:
(i) Factories Act, 1948
(ii) Standing Order Act, 1946
(iii) The Industries (Development and Regulation) Act, 1951
(iv) The Contract Labour (Regulation and Abolition) Act, 1970,
(v) The Child Labour (Prohibition and Regulation) Act, 1986,
(vi) The Workmen’s Compensation Act, 1923,
(vii) The Environment (Protection) Act, 1986,
Maneesh GuptaPlace : New Delhi FCS No. 4982Date : May 12 , 2016 C P No. 2945

44
ANNEXURE TO SECRETARIAL AUDIT REPORT
In our opinion and to the best of our information and according to the examinations carried out by us and explanations furnished and representations made to us by the Company, its officers and agents, we report that the Company has during the financial year under review, complied with the provisions of the Acts, Rules made thereunder and the Memorandum and Articles of Association of the Company with regard to:
1. Maintenance of various statutory registers and documents and making necessary entries therein:
2. Contracts, Common Seal and Registered Office and publication of name of the Company;
3. Forms, returns, documents and resolutions required to be filed with the Registrar of Companies, Regional Director, Central Government, Company Law Board or such other authorities;
4. Service of documents by the Company on its Members, Directors, Stock Exchanges, Auditors and Registrar of Companies;
5. Constitution of the Board of Directors, Audit Committee, Nomination and Remuneration Committee, Share Transfer/ Stakeholder Relationship Committee and Corporate Social Responsibility Committee;
6. Appointment, re-appointment and Retirement of Directors including Managing Director and Executive Directors and payment of remuneration to them;
7. Disclosure of interest and concerns in contracts and arrangements, shareholdings and directorships in other companies and interest in other entities by Directors;
8. Disclosure requirements in respect to their eligibility for appointment, declaration of their independence, compliance with code of conduct for Directors and Senior Management Personnel;
9. Established a policy on related party transactions. All transactions with related parties were in the ordinary course of business and arms length and were placed before the Audit Committee periodically;
10. Established a vigil mechanism and providing to complainants, if any, unhindered access to the Chairman of the Audit Committee.
11. Constituted the Corporate Social Responsibility Committee formulating and adopting Corporate Social Responsibility Policy indicating the activities to be undertaken by the Company;
12. Appointment of persons as Key Managerial Personnel;
13. Appointment and remuneration of Statutory Auditor and Cost Auditor;
14. Appointment of Internal Auditor;
15. Notice of meetings of the Board and Committee thereof;
16. Minutes of meetings of the Board and Committees thereof including passing of resolutions by circulations;
17. Notice convening annual general meeting held on August 19, 2015 and holding of the meeting on that date;
18. Minutes of General meeting;
19. Approval of members, Board of Directors, Committee of Directors and government authorities, wherever required;
20. Form of balance sheet as at March 31, 2015 as prescribed under Companies Act, 2013;
21. Report of the Board of Directors for the financial year ended March 31, 2015;
22. Borrowings and registration of charges;
Maneesh GuptaPlace : New Delhi FCS No. 4982Date : May 12 , 2016 C P No. 2945

Lumax Industries Limited | Annual Report 2015-16
45
Annexure - C
Information as per Section 134(3)(m) of the Companies Act, 2013 read with Companies (Accounts) Rules, 2014 and forming part of Directors’ Report for the year ended March 31, 2016.
A. Conservation of Energy:Though the Company does not come under the category of power intensive unit, adequate measures have been taken for energy conservation and thereby reducing energy cost.
(i) Steps taken for conservation of energy : (a) Introduction of Moulding Machine with
Servo Motor: The Company has further converted Moulding
Machine with Servo Motor in its Bawal and Dharuhera Plants, thereby expecting to save electricity consumption approximately by 25% to 30% and reduced breakdown in the machines.
(b) Introduction of energy saving LED lighting systems:
The company has started converting all its plant utility lightings into energy saving LED lighting, thereby expecting to save electricity consumption approximately by 35~40%. The company has already converted 70% of conventional lights into LED lighting in its Dharuhera, Pantnagar and Chakan plants.
(c) Reduction in operating motors in Surface Treatment area:
The Company through various Kaizens reduced the use of operating motors in Surface Treatment area ovens in its Pantnagar Plant, thereby reduced use of power consumption by 30 KW per day.
(ii) Steps taken by the Company for utilizing alternate sources of energy :
The Company has initiated activity of installation of Solar Power system with a capacity of 350-500 KW in its different plants located in Haryana, which will help in energy conservation and reduction of overall cost of energy.
It is difficult to quantify the impact of individual energy reduction measures on the Cost of Production. The above measures of Energy conservation and reduction will reduce the overall cost of energy.
(iii) The capital investment on energy conservation equipments :
Your Company encourages capital investment in energy saving equipments, plants or machinery,
and this year the Company has spent approximately H 42 Lacs towards energy saving LED lighting system and Moulding Machine with Servo Motor.
(B) Technology absorption :(i) The efforts made towards technology
absorption : a. For the first time in Indian market LED DRL
developed with very small size.
b. In house design and development of LED DRL in a remarkable time period.
c. In house design team successfully implemented new design of Inner Lens and Housing.
d. New design of PCB fitted on Housing with Noise plate.
e. Design in challenging size to meet the optical requirement in 4W LED daytime running light (DRL).
f. Achievement in meeting the regulation requirements with minimum number of LEDs in 4W DRL function.
g. For the first time in house design of sleek CHMSL with LED light source and length of 1000 mm with combination of Fresnel and micro optics.
h. First time in house Design for 2W Tail Lamp with Light guide for Tail function with 6 LEDs for stop function.
i. First time BI-LED Head Lamp Design (Under Development)
j. First time LED Head Lamp for 2W (Under Development)
k. Introduction of Head lamp with LED DRL position for Mahindra & Mahindra.
(ii) the benefits derived like product improvement, cost reduction, product development or import substitution :
a. In line with company’s strategy to become self-reliant in design and development, engineering team continued to focus on strengthening in house manpower to bring the required skills for supporting design and development activities and as a result various products in 2W and 4W segments designed in house.

46
b. Stanley Electric Co. Ltd, Japan continues with providing extensive support in in-house design and development activities and under the leadership of Stanley’s senior designer stationed at Lumax, company is now able to provide prompt technical solution to customer’s immediate needs.
c. Following the various activities of product and process maturation and potential failure analysis the company is enhancing its design and process capabilities to establish “Zero defect launch”.
d. Strengthening project management function through implementation of global development standards with the support from Stanley Electric Co, Ltd, Japan has been initiated to strengthen in house product development system in line with increasing customer expectations for first time first right products. To achieve the above objective, the Company is sending 3 designers to Stanley every year for training.
(iv) Research and development (R & D) Technology in the Auto industry is rapidly changing
with ever evolving regulations on emission and safety, increasing industry responsibility towards society and the need for moving towards alternate energy resources. To maintain and enhance its competitiveness, the Company is making significant investment in Research and Development (R&D), Technology Development and Innovation for achieving growth, business profitability and sustainability. The Company continues to enhance its R&D capability by creating Design and Development Cell with the support of its Technical Collaborator Stanley Electric. Co. Ltd, Japan to support new product development.
1. Specific areas in which R & D carried out by the company.
wheeler.
wheeler.
generation sleek 4 wheeler Headlamp.
Lamp & Tail lamp for 2 Wheeler
Front position for 2 Wheeler
generation Headlamp and Tail lamp for new styled 2 Wheeler.
2. Benefits derived as a result of the above R&D
which reduces company’s dependency on Stanley.
is in line with Company’s strategy to become self-reliant.
validation stages.
3. Future plan of action Further enhancing the technology gained
(iii) in case of imported technology (imported during the last three years reckoned from the beginning of the financial year) :
a. Technology Imported Anti-Mist Coating (Anti Fog Coating)
Direct Metalizing
b. Year of Import 2014-2015 2014-2015
c. Whether the technology been fully absorbed
Absorbed in 4 wheeler head lamp
Absorbed in 4 wheeler head lamps and tail lamps.
d. If not fully absorbed, areas where absorption has not taken place, and the reasons thereof
For future models, this technology will be introduced in front turn indicators and side mirror LED lamps.
Will be introduced in future models across 4 wheeler head lamps and tail lamps.

Lumax Industries Limited | Annual Report 2015-16
47
after working on HID and LED based Lamps. Understanding the technology, especially for 4 wheelers using different HID sources for Low beam and High beam.
LED functions
4. The expenditure incurred on research and Development:
H in million
(i) Capital 24.62
(ii) Recurring 242.95
Total 267.57
(iii) Total R&D Expenditure as a percentage of Total Turnover (%)
2.13
(C) The Foreign Exchange earned in terms of actual inflows during the year H 436.09 millions and the Foreign Exchange outgo during the year in terms of actual outflows is H 1941.70 millions.
Activities relating to exports; initiatives taken to increase exports; development of new export markets for products and services; and export plans ;
Your Company is continuously striving for growth in business in the export market. During the year under review, the following export development and promotion measures were taken:
- Successful introduction of LED High Mounted Stop Lamp to Audi, Germany.
- Securing new business with Audi AG for development of Q2 LED High Mounted Stop Lamp as a global single source.
- Discussions with Truck-Lite Europe for introduction of LED products as the replacement or upgrade version of their existing products.
- Discussions with Audi to increase the share of business in small lamps with LED applications.
- Sustaining the current business in small lamps with Nissan Europe.
- Sustaining the current business in Head Lamps and Tail Lamps with John Deere USA.
- Discussions with John Deere USA for introduction of LED tail lamps as the replacement of their existing running products.
- Continuous conversation with major OEMs in Central Europe and USA to introduce Lumax brand with the target of increasing our OEM Export in 2016.

48
Annexure - D
CSR Report of Lumax Industries Limited
1. A brief outline of the Company’s CSR policy, including overview of projects or programs proposed to be undertaken and a reference to the web-link to the CSR policy and projects or programs.
The Company through its CSR initiatives is committed to enhance the social and economic development of communities and geographical areas, particularly in the vicinity of the plants location This will include education, skill building for livelihood of people, health, and social welfare etc., particularly targeting at disadvantaged sections of society. CSR activities at Lumax are carried out through Lumax Charitable Foundation.
The Company has framed a CSR Policy in compliance with the provisions of the Companies Act, 2013 and the same is placed on the Company’s website and the web link for the same is http://www.lumaxindustries.com/pdf/CSR-policy.pdf
2. The Composition of the CSR Committee.
Sl. No. Name Category1 Mr. M.C Gupta Chairman
2 Mr. A.P Gandhi Member
3 Mr. D K Jain Member
4 Mr. Deepak Jain Member
5 Mr. Anmol Jain Member
3. Average net profit of the Company for last three financial years : H 1008 Lacs
4. Prescribed CSR Expenditure (two per cent of the amount as in item 3 above) : H 20.17 Lacs
5. Details of CSR spent during the financial year.
(a) Total amount spent for the financial year: H 32.59 Lacs
(b) Amount unspent, if any: Nil
6. The CSR Committee confirms that the implementation and monitoring of the CSR Policy is in Compliance with the CSR objectives and Policy of the Company.
Deepak Jain M.C. Gupta Managing Director Chairman-CSR Committee
(c) Manner in which the amount spent during the financial year is detailed below. J in lacsSl. No.
CSR Project or activity identified
Sector in which the project is covered
Projects or Programs1. Local area or Other2. Specify the State and district where projects or programs was undertaken
Amount outlay (budget) project or programs wise
Amount spent on the projects or programsSub heads:1. Direct expenditure on projects or programs.2. Overheads
Cumulative expenditure upto to the reporting period.
Amount spent: Direct or through implementing agency
(1) (2) (3) (4) (5) (6) (7) (8)1.
2.
Education Sponsorship /Infrastructure support to School.Healthcare support to hospitals for under privileged.
a) Education b) Healthc) Overheads
Manufacturing site of the Company 1. Gurgaon, Haryana 2. Dharuhera, Haryana3. Pantnagar, Uttarakhand4. Pune, Maharashtra
a) 21.09b) 5.28c) 5.15
a) 21.09b) 5.28c) 5.15
31.52 1. Spent through the CSR arm of the Company namely Lumax Charitable Foundation-H
27.00 lacs2. Spent directly by the Company H4.52 Lacs.
Total - - 31.52 31.52 31.52 -
*The Company has also spent H1.07 Lacs on education of employees’ children / onetime expenses, which as per the Company is CSR. However, these expenses are not classifiable as CSR expenditure in terms of Companies Act, 2013 and Rules made thereunder and therefore the same are not included in the above details of CSR expenditure.

Lumax Industries Limited | Annual Report 2015-16
49
Global EconomyGrowth analysisThe global economic growth rate for 2015 is estimated to be 2.4%, i.e. 20 basis points lower than last year’s GDP. The economic world has been through ups and downs throughout the ongoing financial year. Such a downshift was accelerated because of underperformance of the emerging markets, and slow growth of the advanced economies together with weakened commodity prices and less capital flow.
Volatility in oil priceSome of the emerging countries have witnessed their economy strengthen during the year, while many developed economies showed slow growth. Oil has been the talk of the globe for the entire FY15-16. Turbulent oil prices have largely affected the oil producing nations. The over-production of crude oil along with lessened demand of the same in the global market led to a record decline in the international oil prices. In addition to that, several geopolitical tensions are resulting in disruption of trade and financial growth in the Middle-East countries for oil. Crude price dropped almost 75% from USD 106/Barrel in June 2014 to USD 26/Barrel in February 2016. As per the latest reports price of international crude stands at USD 41.40/Barrel as on March 2016. (Source: NASDAQ)
Advanced economiesEconomic growth in the USA has been moderate. America’s economy grew by 2.4% in 2015 , which is the same rate as the previous financial year. China, on the other hand, reported their GDP growth as the lowest figure in last 25 years. The Chinese GDP was projected to be 6.9%, which is 40 basis points down from 2014. The Chinese economy is mainly known for its manufacturing and supplying capacities. Recently, the economy has been shifting from a manufacturing hub to a service and consumption market. Such a changing trend in the market might be responsible for the nation’s low GDP.
Indian EconomyGDP and currency volatilityIndia has been witnessing some steady growth since the new government took over the centre. During FY15-16, India’s GDP growth is projected to be 7.6%, i.e. 30 basis points above the previous financial year. The government is looking forward to promote the nation’s GDP growth onto a double digit growth trajectory within 2020. The Indian Rupee has witnessed further fall against dollar, which appreciated by 6.60% during FY 2015-16.
Monetary policiesReduction in interest rates had been a debate for last few months. After a series of rate cuts, the current base rate for lending money from RBI stands at 6.50%. Another aspect that the new central government has been paying continuous notice is the inflation rate. Currently, the inflation rate in India stands at 5.39% as on April 2016, which is marginally higher than the Government of India’s objective of 5% by 2017. (Source: Trading Economics, World Bank)
OilIndia is the third largest consumer of oil in the world, with usage of4.1 million barrels per day (Forbes). Our country is also amongst the largest importers of crude, ranking third after USA and China (Oil Price). A steady decline in the international crude price had a direct bearing on growth prospect of Indian economy. Domestic oil prices also witnessed periodical decline, that in turn has boosted vehicle sales across the nation.
MANAGEMENT DISCUSSION AND ANALYSIS REPORTAnnexure - E
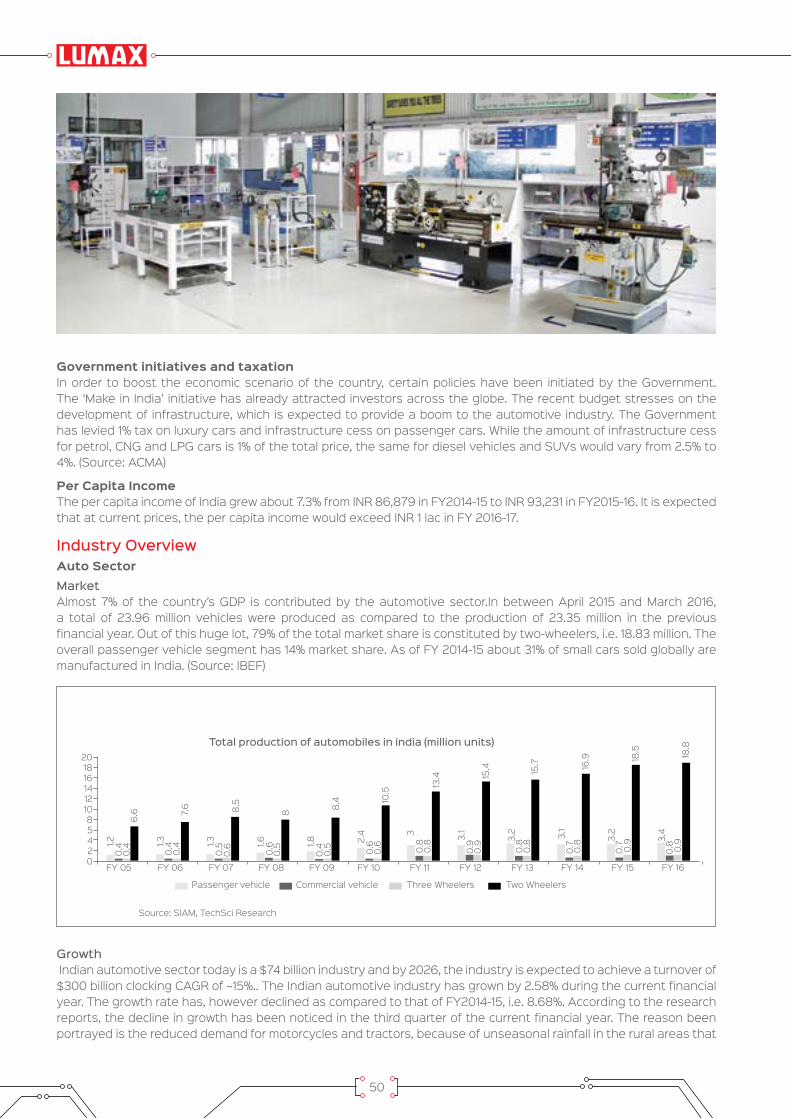
50
Government initiatives and taxationIn order to boost the economic scenario of the country, certain policies have been initiated by the Government. The ‘Make in India’ initiative has already attracted investors across the globe. The recent budget stresses on the development of infrastructure, which is expected to provide a boom to the automotive industry. The Government has levied 1% tax on luxury cars and infrastructure cess on passenger cars. While the amount of infrastructure cess for petrol, CNG and LPG cars is 1% of the total price, the same for diesel vehicles and SUVs would vary from 2.5% to 4%. (Source: ACMA)
Per Capita IncomeThe per capita income of India grew about 7.3% from INR 86,879 in FY2014-15 to INR 93,231 in FY2015-16. It is expected that at current prices, the per capita income would exceed INR 1 lac in FY 2016-17.
Industry OverviewAuto SectorMarketAlmost 7% of the country’s GDP is contributed by the automotive sector.In between April 2015 and March 2016, a total of 23.96 million vehicles were produced as compared to the production of 23.35 million in the previous financial year. Out of this huge lot, 79% of the total market share is constituted by two-wheelers, i.e. 18.83 million. The overall passenger vehicle segment has 14% market share. As of FY 2014-15 about 31% of small cars sold globally are manufactured in India. (Source: IBEF)
Source: SIAM, TechSci Research
2018161412108542
FY 05
1.20.
40.
46.
6
0
1.30.
40.
47.
6
FY 06
1.30.
50.
68.
5
FY 07
1.60.
60.
58
FY 08
1.80.
40.
58.
4
FY 09
2.4
0.6
0.6
10.5
FY 10
30.
80.
813
.4
FY 11
3.1
0.9
0.9
15.4
FY 12
3.2
0.8
0.8
15.7
FY 13
3.1
0.7
0.8
16.9
FY 14
3.2
0.7
0.9
18.5
FY 15
3.4
0.8 0.9
18.8
FY 16
Total production of automobiles in india (million units)
Passenger vehicle Commercial vehicle Three Wheelers Two Wheelers
Growth Indian automotive sector today is a $74 billion industry and by 2026, the industry is expected to achieve a turnover of $300 billion clocking CAGR of ~15%.. The Indian automotive industry has grown by 2.58% during the current financial year. The growth rate has, however declined as compared to that of FY2014-15, i.e. 8.68%. According to the research reports, the decline in growth has been noticed in the third quarter of the current financial year. The reason been portrayed is the reduced demand for motorcycles and tractors, because of unseasonal rainfall in the rural areas that
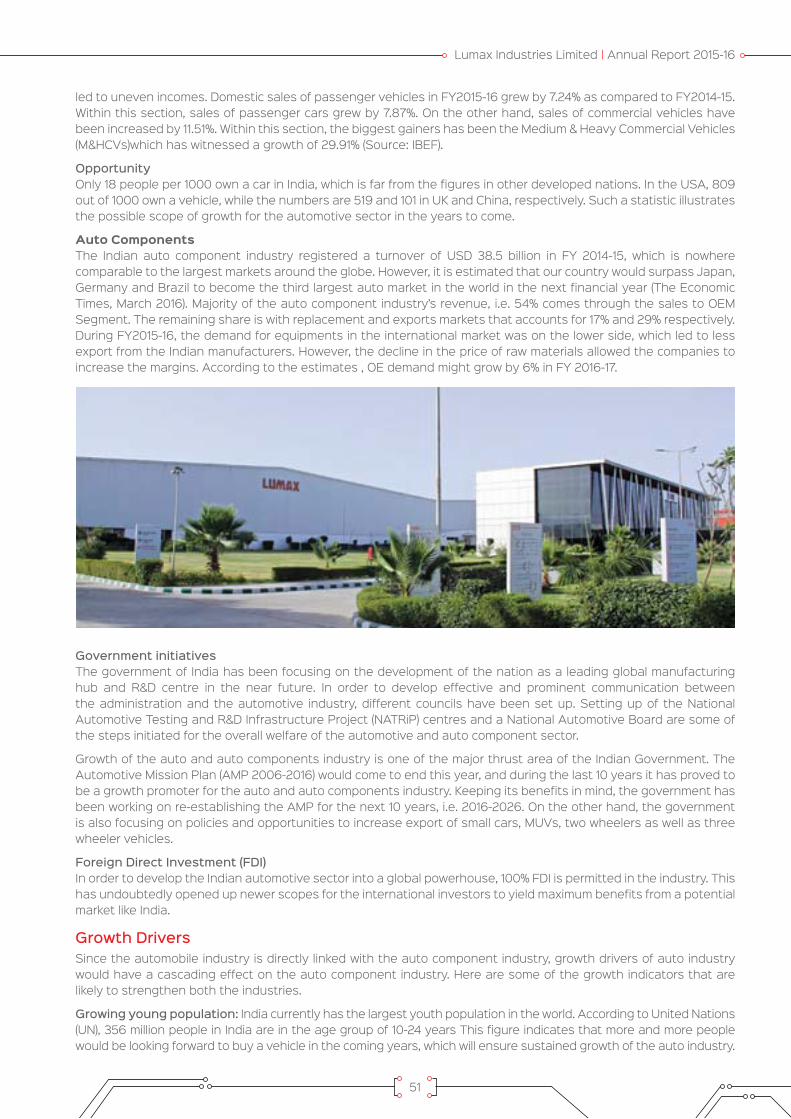
Lumax Industries Limited | Annual Report 2015-16
51
led to uneven incomes. Domestic sales of passenger vehicles in FY2015-16 grew by 7.24% as compared to FY2014-15. Within this section, sales of passenger cars grew by 7.87%. On the other hand, sales of commercial vehicles have been increased by 11.51%. Within this section, the biggest gainers has been the Medium & Heavy Commercial Vehicles (M&HCVs)which has witnessed a growth of 29.91% (Source: IBEF).
OpportunityOnly 18 people per 1000 own a car in India, which is far from the figures in other developed nations. In the USA, 809 out of 1000 own a vehicle, while the numbers are 519 and 101 in UK and China, respectively. Such a statistic illustrates the possible scope of growth for the automotive sector in the years to come.
Auto ComponentsThe Indian auto component industry registered a turnover of USD 38.5 billion in FY 2014-15, which is nowhere comparable to the largest markets around the globe. However, it is estimated that our country would surpass Japan, Germany and Brazil to become the third largest auto market in the world in the next financial year (The Economic Times, March 2016). Majority of the auto component industry’s revenue, i.e. 54% comes through the sales to OEM Segment. The remaining share is with replacement and exports markets that accounts for 17% and 29% respectively. During FY2015-16, the demand for equipments in the international market was on the lower side, which led to less export from the Indian manufacturers. However, the decline in the price of raw materials allowed the companies to increase the margins. According to the estimates , OE demand might grow by 6% in FY 2016-17.
Government initiativesThe government of India has been focusing on the development of the nation as a leading global manufacturing hub and R&D centre in the near future. In order to develop effective and prominent communication between the administration and the automotive industry, different councils have been set up. Setting up of the National Automotive Testing and R&D Infrastructure Project (NATRiP) centres and a National Automotive Board are some of the steps initiated for the overall welfare of the automotive and auto component sector.
Growth of the auto and auto components industry is one of the major thrust area of the Indian Government. The Automotive Mission Plan (AMP 2006-2016) would come to end this year, and during the last 10 years it has proved to be a growth promoter for the auto and auto components industry. Keeping its benefits in mind, the government has been working on re-establishing the AMP for the next 10 years, i.e. 2016-2026. On the other hand, the government is also focusing on policies and opportunities to increase export of small cars, MUVs, two wheelers as well as three wheeler vehicles.
Foreign Direct Investment (FDI)In order to develop the Indian automotive sector into a global powerhouse, 100% FDI is permitted in the industry. This has undoubtedly opened up newer scopes for the international investors to yield maximum benefits from a potential market like India.
Growth Drivers Since the automobile industry is directly linked with the auto component industry, growth drivers of auto industry would have a cascading effect on the auto component industry. Here are some of the growth indicators that are likely to strengthen both the industries.
Growing young population: India currently has the largest youth population in the world. According to United Nations (UN), 356 million people in India are in the age group of 10-24 years This figure indicates that more and more people would be looking forward to buy a vehicle in the coming years, which will ensure sustained growth of the auto industry.
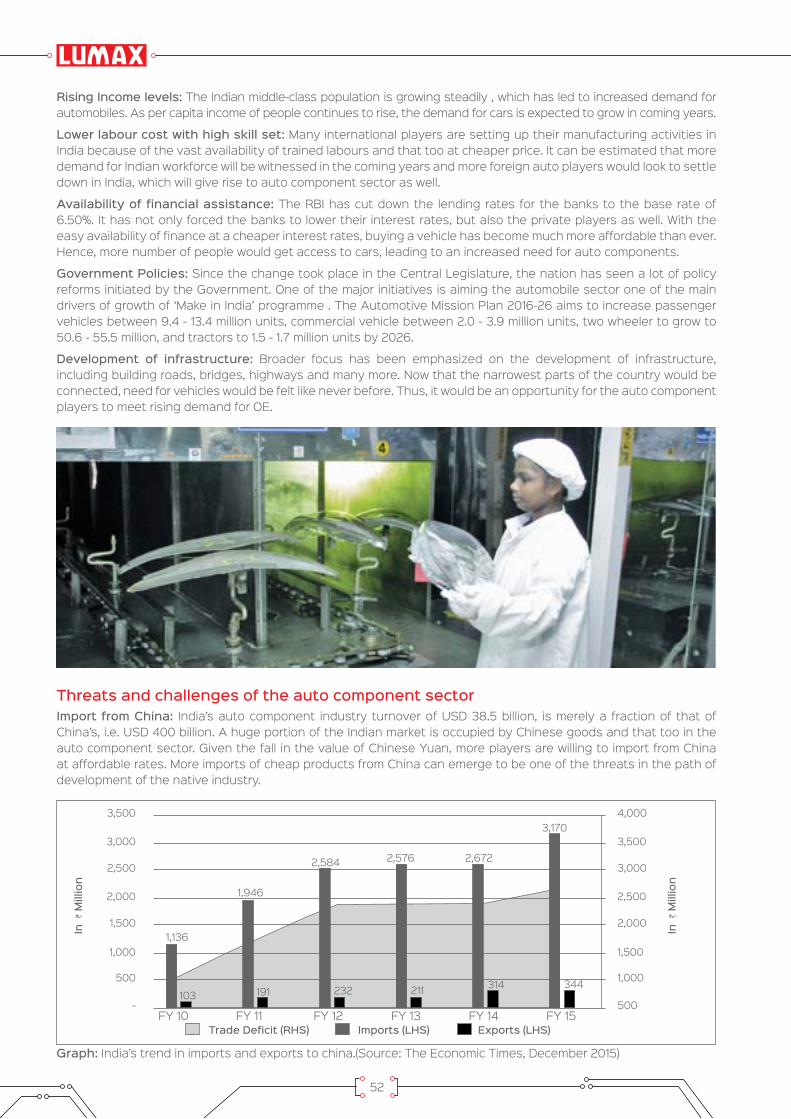
52
Rising Income levels: The Indian middle-class population is growing steadily , which has led to increased demand for automobiles. As per capita income of people continues to rise, the demand for cars is expected to grow in coming years.
Lower labour cost with high skill set: Many international players are setting up their manufacturing activities in India because of the vast availability of trained labours and that too at cheaper price. It can be estimated that more demand for Indian workforce will be witnessed in the coming years and more foreign auto players would look to settle down in India, which will give rise to auto component sector as well.
Availability of financial assistance: The RBI has cut down the lending rates for the banks to the base rate of 6.50%. It has not only forced the banks to lower their interest rates, but also the private players as well. With the easy availability of finance at a cheaper interest rates, buying a vehicle has become much more affordable than ever. Hence, more number of people would get access to cars, leading to an increased need for auto components.
Government Policies: Since the change took place in the Central Legislature, the nation has seen a lot of policy reforms initiated by the Government. One of the major initiatives is aiming the automobile sector one of the main drivers of growth of ‘Make in India’ programme . The Automotive Mission Plan 2016-26 aims to increase passenger vehicles between 9.4 - 13.4 million units, commercial vehicle between 2.0 - 3.9 million units, two wheeler to grow to 50.6 - 55.5 million, and tractors to 1.5 - 1.7 million units by 2026.
Development of infrastructure: Broader focus has been emphasized on the development of infrastructure, including building roads, bridges, highways and many more. Now that the narrowest parts of the country would be connected, need for vehicles would be felt like never before. Thus, it would be an opportunity for the auto component players to meet rising demand for OE.
Threats and challenges of the auto component sectorImport from China: India’s auto component industry turnover of USD 38.5 billion, is merely a fraction of that of China’s, i.e. USD 400 billion. A huge portion of the Indian market is occupied by Chinese goods and that too in the auto component sector. Given the fall in the value of Chinese Yuan, more players are willing to import from China at affordable rates. More imports of cheap products from China can emerge to be one of the threats in the path of development of the native industry.
3,500 4,000
3,000 3,500
2,500 3,000
2,000 2,500
1,500 2,000
1,000 1,500
500 1,000
-
In H
Mill
ion
In H
Mill
ion
Trade Deficit (RHS) Imports (LHS) Exports (LHS)
500
1,136
103
1,946
2,584 2,576 2,672
3,170
191 232 211 314 344
Graph: India’s trend in imports and exports to china.(Source: The Economic Times, December 2015)
FY 11FY 10 FY 12 FY 13 FY 14 FY 15
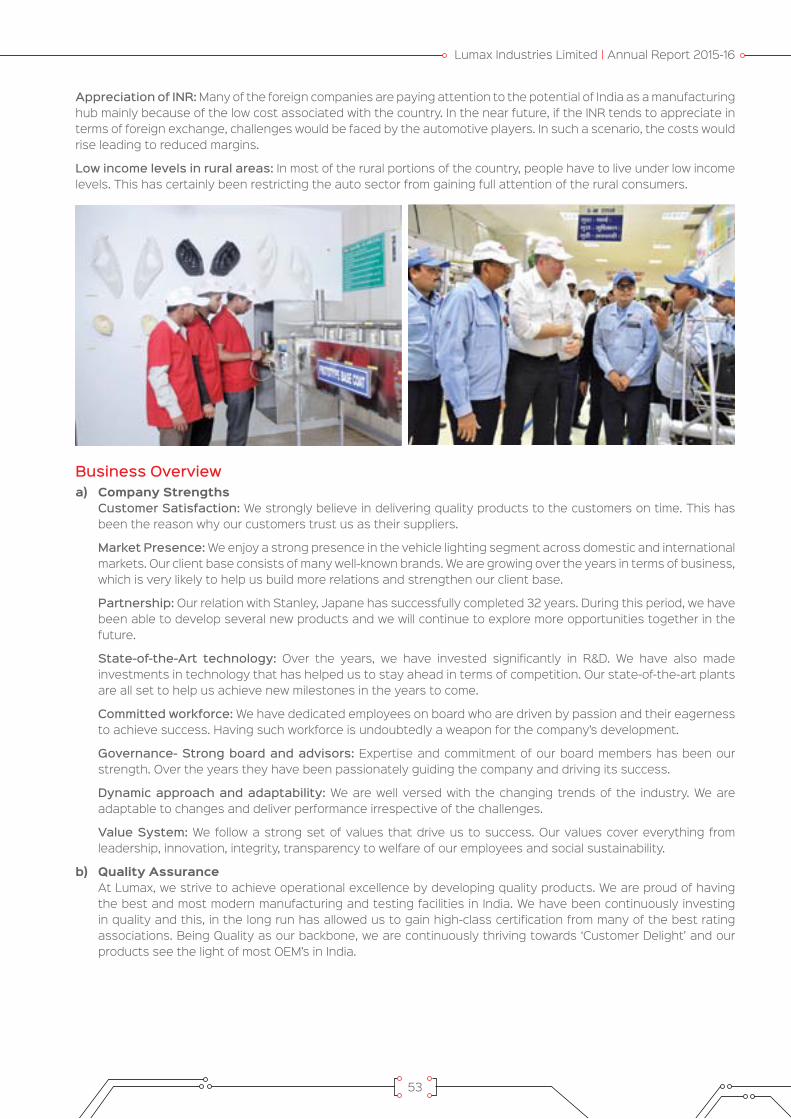
Lumax Industries Limited | Annual Report 2015-16
53
Appreciation of INR: Many of the foreign companies are paying attention to the potential of India as a manufacturing hub mainly because of the low cost associated with the country. In the near future, if the INR tends to appreciate in terms of foreign exchange, challenges would be faced by the automotive players. In such a scenario, the costs would rise leading to reduced margins.
Low income levels in rural areas: In most of the rural portions of the country, people have to live under low income levels. This has certainly been restricting the auto sector from gaining full attention of the rural consumers.
Business Overviewa) Company Strengths Customer Satisfaction: We strongly believe in delivering quality products to the customers on time. This has
been the reason why our customers trust us as their suppliers.
Market Presence: We enjoy a strong presence in the vehicle lighting segment across domestic and international markets. Our client base consists of many well-known brands. We are growing over the years in terms of business, which is very likely to help us build more relations and strengthen our client base.
Partnership: Our relation with Stanley, Japane has successfully completed 32 years. During this period, we have been able to develop several new products and we will continue to explore more opportunities together in the future.
State-of-the-Art technology: Over the years, we have invested significantly in R&D. We have also made investments in technology that has helped us to stay ahead in terms of competition. Our state-of-the-art plants are all set to help us achieve new milestones in the years to come.
Committed workforce: We have dedicated employees on board who are driven by passion and their eagerness to achieve success. Having such workforce is undoubtedly a weapon for the company’s development.
Governance- Strong board and advisors: Expertise and commitment of our board members has been our strength. Over the years they have been passionately guiding the company and driving its success.
Dynamic approach and adaptability: We are well versed with the changing trends of the industry. We are adaptable to changes and deliver performance irrespective of the challenges.
Value System: We follow a strong set of values that drive us to success. Our values cover everything from leadership, innovation, integrity, transparency to welfare of our employees and social sustainability.
b) Quality Assurance At Lumax, we strive to achieve operational excellence by developing quality products. We are proud of having
the best and most modern manufacturing and testing facilities in India. We have been continuously investing in quality and this, in the long run has allowed us to gain high-class certification from many of the best rating associations. Being Quality as our backbone, we are continuously thriving towards ‘Customer Delight’ and our products see the light of most OEM’s in India.

54
c) Product wise Performance The Company is engaged only in one segment of products viz. manufacture of Auto Components, mainly
Automotive Lighting Systems. The Product wise performance during the year is as follows:
Products Turnover (J in Million)Automotive Lamps 11580.18Tools 872.63Miscellaneous Items 98.94Total 12551.75
d) Internal Control Systems and their Adequacy The Company has a comprehensive system of Internal Controls to safeguard the Company’s Assets against
loss from unauthorized use and ensure proper authorisation of Financial Transactions. The Company maintains a system of internal controls designed to provide a high degree of assurance regarding effectiveness and efficiency of operations, the adequacy of safeguards for assets, the reliability of financial controls and compliance with applicable laws and regulations. The Company has an exhaustive budgetary control system to monitor all expenditures against approved budgets on an ongoing basis.
The Legal & Secretarial Department headed by the Senior Vice- President (Legal) and the Group Company Secretary plays a key role in ensuring the compliances with applicable statutory and regulatory requirements across the plants and also monitors the Internal Control System and their adequacy.
Recognizing the important role of Internal Controls, the Company has appointed a separate Independent firm of Internal Auditor for looking over the Operations of the Company. The Internal Auditor is separately responsible to examine the Internal Control Systems and Procedures of the Company. Continuous Internal Audit of the systems enables various business groups to plug any shortcomings sooner rather than later. In addition, the top management and the Audit Committee of the Board review the findings and recommendations of the Internal Auditors on regular basis.

Lumax Industries Limited | Annual Report 2015-16
55
e) Risk and Concern The Company is exposed to external and internal risks associated with the business. The operations of the
Company are directly dependent on the Automobile manufacturer’s (OEMs) growth and business plans. General economic conditions impact the automotive industry, and in turn, the operations as well. To counter these risks, your company continues to broaden the product portfolio, increase customer base and geographic reach. The Company is exposed to strong competitive pressures from both domestic and overseas. Your company’s established reputation, close customer relationships, ability to provide higher level of engineering, design support and relentless drive for improvement gives it a competitive edge. The Company is also exposed to financial risk from changes in interest rates, foreign exchange rates and commodity prices. In order to address these risks the company has implemented adequate risk management approach.
f) Discussion on Financial Performance with Reference to Operational Performance The auto industry In India has been experiencing one of the most challenging times ever. The production of
Automobiles in the financial year 2015-16 has grown by 2.58% as compared to the last financial year ended on March 31, 2015. Your Company clocked a growth of 9.86% year on year.
REVENUE Your company’s business is directly dependent on the Original Equipment Manufacturer(s) of Automobiles (OEM’s).
Your company has achieved Net Sales of H 12551.75 Million for the year ended March 31, 2016 as compared to H 11425.59 Million in the previous year.
PROFITS Your Company has recorded a Profit Before Tax (PBT) of H 415.90 Million for the year ended March 31, 2016 as
compared to Profit Before Tax (PBT) of H 142.74 Million in the previous year.
DIVIDEND The Company has been declaring dividend for the last 31 years continuously. During the F.Y.2015-16, the company
has declared and paid an Interim Dividend @120% (H 12 per Equity Share) [H 5.50/- per Equity share in the previous year].
The total amount of Dividend distributed is H 112.17 Million (excluding Dividend Tax).
g) Human Resources At Lumax, our people are essential and fundamental to our existence and business objectives can only
be achieved through their dedication and professionalism. The rapidly changing economic environment, characterized by the globalization and deregulation of markets, changing customer and investor demands, and ever-increasing product-market competition has an important bearing on our performance. To compete this, we continuously improve our performance by reducing costs, innovating products and processes and improving quality, productivity and speed to market. With special focus on Human Resource Management and organizational performance, we hope to contribute to a better understanding of the role of human resource decisions in creating and sustaining organizational performance and competitive advantage.
Further the improvement activities through Kaizen, Quality Circles, Total Productive Maintainence, Total Quality Management, 6 sigma, 5-S, 7-W processes are being done throughout the Company to enhance the productivity and efficiency of the employees.

56
The Company believe that the success path of organization is driven by none other than the skilled and competent human resources. As skilled manpower will always give the incremental push to the sustained growth of the organisation.
Keeping in view of the above belief, LUMAX Training School (LTS), which is named as GURUKUL, has been inaugurated on 4th June 2015. GURUKUL established with the objective to “Be a premier Centre for Excellence in Skill Development of Human Resources in Automotive Industries to enable the Company to generate results with sensitivity towards Safety, Quality, Cost, Delivery & Environment and meeting the challenges globally”.
LTS is situated at Bawal Plant as Regional Training Centre for all our plants located in northern India. It is well equipped with all required modern training facilities for developing competent and skilled individual.
The key focus of LTS would be on-
I. Exposure to Safety Culture Building
II. Technical Skill Development
III. Behavior & Soft Skills Training
GURUKUL team is in process of designing specified training modules for people from front line operator to senior management of the Company with emphasis at integration of industry relevant skill set and curriculum for efficient exposure to work place.
The Directors acknowledge and appreciate the contribution of all employees towards the performance of the Company.
At the end of the year the Company employed 2241 numbers of employees.
Lumax Industries Limited | Annual Report 2015-16
57
Annexure - F
Corporate Governance Report
The Securities and Exchange Board of India (SEBI) regulates Corporate Governance Practices of Companies Listed on the Indian Stock Exchanges. The Corporate Governance framework has been referred to in Regulation 15(2) of SEBI (Listing Obligations and Disclosure Requirements) Regulations, 2015. These Regulations specifies the standards that Indian Companies have to Comply and the disclosures that they have to make with regards to Corporate Governance. Your Company has established systems and procedures to comply with the amended provisions of the Corporate Governance and is complying with the same in its letter and spirit.
The Securities and Exchange Board of India (SEBI) has notified SEBI (Listing Obligations and Disclosure Requirements) Regulations, 2015 (hereinafter referred as Listing Regulations) on September 2, 2015 replacing the earlier Listing Agreement and is aimed to consolidate and streamline the provisions of earlier listing agreements for different segments of Capital Market.
1. Company’s Philosophy The Company remains committed to high standards of Corporate Governance. The Company believes that Corporate Governance is based on the principle of integrity, fairness, equity, transparency, accountability and commitment to values. Good Governance Practices stem from the culture and mindset of the organization.
We believe that sound Corporate Governance is critical to enhance and retain investors trust. Accordingly, we always seek to ensure that, we attain our performance rules with integrity. Our Board exercises its fiduciary responsibilities in the widest sense of the term. We also endeavor to enhance long term shareholder value and respect minority rights in all our business decisions.
Our Corporate Governance philosophy is based on the following principles:
the law.
the law.
disclosure levels.
driven solely by business needs.
capital and not the owner.
2. Board of Directors, Meetings of the Board, Process and Procedures at the MeetingThe Board of Directors is the apex body constituted by the shareholders for overseeing the overall functioning of the Company. The Board provides and evaluates the strategic direction of the Company, management policies and their effectiveness and ensures that the long-term interests of the shareholders are being served.
The Company’s Board of Directors consists of twelve (12) Directors. Out of these twelve (12) Directors, Four (4) Directors are Executive Director(s), Two (2) including the Chairman are Non Executive Directors and Six (6) are Non Executive Independent Director(s) including one women Director. The Managing Director is assisted by Joint Managing Director, Senior Executive Director, Executive Director and Senior Managerial Personnel in overseeing the functional matters of the Company. The Board of Directors have met five times during the year. The Company follows the following process and procedures for the Board Meetings.
A. Scheduling and Selection of Agenda Items for Board Meetings:
(i) Minimum four pre-scheduled Board meetings are held every year. Apart from the above, additional Board meetings are convened by giving appropriate notice to address the specific needs of the Company. In case of business exigencies or urgency of matters, resolutions are passed by circulation.
(ii) The meetings are usually held at the Company’s office at Plot No. 16, Sector-18, Maruti Complex, Gurgaon, Haryana-122015.
(iii) All divisions/departments of the Company are advised to schedule their work plans well in advance, particularly with regard to matters requiring discussion/ approval/decision at the Board meetings. All such matters are communicated to the Company Secretary in advance so that the same could be included in the Agenda for the Board meetings.
(iv) The Board is given presentations by the Statutory Auditors, Internal Auditors and Head Finance covering Finance, Sales, major business segments and operations of the Company, all business areas of the Company including business opportunities, business strategy and the risk management practices and
58
Internal Audit issues before taking on record the quarterly / annual financial results of the Company.
(v) The information required to be placed before the Board includes :
budgets and any updates.
operating divisions or business segments.
and other committees of the board, as also resolutions passed by circulation.
remuneration of senior officers just below the board level, including appointment or removal of Chief Financial Officer and the Company Secretary.
and penalty notices which are materially important.
occurrences, any material effluent or pollution problems.
to and by the company, or substantial nonpayment for goods sold by the company.
product liability claims of substantial nature, including any judgement or order which, may have passed strictures on the conduct of the company or taken an adverse view regarding another enterprise that can have negative implications on the company.
Reports (through the Audit Committee).
Companies or collaboration agreement; if any
towards goodwill, brand equity, or intellectual property.
solutions. Any significant development in Human Resources/ Industrial Relations front like signing of wage agreement, implementation of Voluntary Retirement Scheme etc.
subsidiaries, assets, which is not in normal course of business.
exposures and the steps taken by management to limit the risks of adverse exchange rate movement, if material.
or listing requirements and shareholders service such as non-payment of dividend, delay in share transfer (if any) etc.
Government policies etc. with impact thereof, Directors’ responsibilities arising out of any such developments.
(vi) The Chairman of the Board and the Company Secretary in consultation with other concerned members of the Senior Management and Nominees of Technical and Financial Collaborator, finalise the agenda papers for the Board meetings.
B. Board Agenda Detailed agenda and notes on agenda are
provided to the Directors in the defined agenda format. All material information is incorporated in the agenda papers for facilitating meaningful and focused discussions at the meeting. Where it is not practicable to attach any document to the agenda, the same is tabled before the meeting with specific reference to this effect in the agenda. In special and exceptional circumstances, additional or supplementary item(s) on the agenda are permitted.
C. Recording Minutes of proceedings at Board Meetings
The Company Secretary records the Minutes of the proceedings of each Board and Committee meeting. Draft minutes are circulated to all the members of the Board / Committee for their comments. The final minutes are entered in the Minutes Book within 30 days from conclusion of the meeting.
D. Post Meeting Follow-up Mechanism The Guidelines for Board meetings facilitate an
effective post meeting follow-up, review and reporting process for the decisions taken by the Board. The important decisions taken at the Board meetings are communicated to the departments / divisions concerned promptly. Action taken report on the decisions/minutes of the previous meeting(s) is placed at the immediately succeeding meeting of the Board for noting by the Board.

Lumax Industries Limited | Annual Report 2015-16
59
E. Role of the Company Secretary in Overall Governance Process The Company Secretary plays a key role in ensuring that the Board procedures are followed and regularly
reviewed. He ensures that all relevant information, details and documents are made available to the Board and Senior Management for effective decision making. The Company Secretary while preparing the agenda, Notes on agenda, Minutes etc. of the meeting(s), is responsible for and is required to ensure adherence to all the applicable laws and regulations including the Companies Act, 2013 read with the Rules framed there under and the Secretarial Standards recommended by The Institute of Company Secretaries of India.
F. Composition, Category and Attendance of Directors at Board Meetings, Last Annual General Meeting (AGM) and number of other Directorships and Chairmanships/Memberships of Committees of each Director in various Companies as on March 31, 2016.
Sl. No.
Name of The Directors
Category of Directorship
No. of Board
Meetings Attended
No. of Director-Ships In
Other Public Companies 1
No. Of Committee Positions Held In Other Public
Companies 2
Last AGM Attended
Relationship Interse
Chairman Member1 Mr. D.K.
JainNon Executive Chairman
5 6 - 1 Yes Related as Father to Mr. Deepak Jain and Mr. Anmol Jain
2 Mr. Deepak Jain
Managing Director
5 8 1 - Yes Related as Son to Mr. D.K. Jain and as Brother to Mr. Anmol Jain
3 Mr. Anmol Jain
Joint Managing Director
5 6 - 2 No Related as Son to Mr. D.K. Jain and as Brother to Mr. Deepak Jain
4 Mr. Eiichi Hirooka
Sr. Executive Director (StanleyNominee)
4 - - - Yes Related as Nominee Directors of Stanley.
5 Mr. Norihisa Sato
Executive Director (Stanley Nominee)
3 - - - Yes Related as Nominee Directors of Stanley.
6 Mr. Toru Tanabe
Non-Executive Director (Stanley Nominee)
1 - - - No Related as Nominee Directors of Stanley.
7 Mr. A.P. Gandhi
Non-Executive Independent Director
5 8 2 6 No Not related to any Director.
8 Mr. Gursaran Singh
Non-Executive Independent Director
1 3 - - No Not related to any Director.
9 Mr. M.C. Gupta
Non-Executive Independent Director
5 2 2 1 No Not related to any Director.
10 Mr. Dhiraj Dhar Gupta
Non-Executive Independent Director
4 5 - 3 Yes Not related to any Director.
11 Mr. Rattan Kapur
Non-Executive Independent Director
5 2 - - Yes Not related to any Director.
12 Ms. Pallavi Dinodia
Non-Executive Independent Director
3 - - - No Not related to any Director
1. Excludes Directorship in Foreign Companies and Companies Registered under Section 8 of the Companies Act, 2013.
2. As per Listing Regulations, Committee here means “Audit Committee” and “Share Transfer/Stakeholders’ Relationship Committee “ and excludes the Committee positions held in Lumax Industries Limited.

60
H. Meeting of Independent Director During the year, a separate meeting of the Independent Directors of the Company was held on January 12, 2016
to discuss the following matters as prescribed under Schedule IV of Companies Act, 2013 and Regulation 25 of the Listing Regulations:
1. To review the performance of Non-Independent Directors and the Board as whole.
2. To review the performance of the Chairperson of the company, taking into account the views of executive directors and non-executive directors.
3. To assess the quality, quantity and timeliness of flow of information between the company management and the Board that is necessary for the Board to effectively and reasonably perform their duties.
I. Familiarisation Programme for Independent Directors In accordance with Regulation 25 of the Listing Regulations, the Board has adopted a Familiarization Programme
for Independent Directors to familiarize the Independent Directors of the company with the organization.
The Company through its Managing Director/Chief Executive Officer/Senior Managerial Personnel conducts programs/presentations periodically to familiarize the Independent Directors with the strategy, operations and functions of the Company and above all the Industry perspective & issues.
The Independent Directors are provided with all the documents/reports/policies sought by them for enabling a good understanding of the Company, its various operations and the industry of which it is a part. The Independent Directors are also provided with regular updates on relevant statutory changes to ensure that they remain upto date on the Compliance framework.
The details of such Familiarisation Programme for Independent Director are uploaded on the website of the company and the web link of the same is provided here under: http://www.lumaxindustries.com/pdf/familarisation-program.pdf.
G. Number of Board Meetings held and the dates on which held The Board of Directors met five times during the Financial Year ended March 31, 2016. The intervening period
between two Board Meetings was well within the maximum time gap of 120 days, as prescribed under Listing Regulations. The details of Board Meetings held during the year are as under:-
Sl. No. Date of board meeting Board’s strength No. of Directors present
1. 23-05-2015 12 10
2. 24-07-2015 12 8
3. 07-11-2015 12 11
4. 13-02-2016 12 8
5. 12-03-2016 12 9
Directors who relinquished office during the year ended March 31, 2016 - NIL

Lumax Industries Limited | Annual Report 2015-16
61
3. Committees of the BoardCurrently, the Board has Four Committees: the Audit Committee, the Nomination and Remuneration Committee, the Share Transfer/ Stakeholder Relationship Committee and Corporate Social Responsibility Committee. The Company’s process and procedure related to the Board Meetings are also applicable and followed in the Committee Meetings. The brief details of the various committees of the Board and their constitution and functions are as under:
A. Audit Committee a) Composition and Attendance The Audit Committee comprises of five non-executive Independent Directors, Managing Director and
Executive Director. The Composition of the Audit Committee during the Financial Year April 2015 to March 2016 was as follows:
Sl. No. Name Status Category of membership
1. Mr. A.P. Gandhi Chairman Non-Executive Independent Director
2. Mr. M.C. Gupta Member Non-Executive Independent Director
3. Mr. D.D. Gupta Member Non-Executive Independent Director
4. Mr. Rattan Kapur Member Non-Executive Independent Director
5. Ms. Pallavi Dinodia Member Non-Executive Independent Director
6. Mr. Deepak Jain Member Managing Director
7. Mr. Eiichi Hirooka Member Senior Executive Director
The Audit Committee had met five times during the Financial Year April 1, 2015 to March 31, 2016. The attendance of the meetings are as under:
Sl. No. Directors No. of Meetings Attended
1. Mr. A.P. Gandhi 5
2. Mr. M. C. Gupta 5
3. Mr. D.D. Gupta 3
4. Mr. Rattan Kapur 4
5. Ms. Pallavi Dinodia 3
6. Mr. Deepak Jain 4
7. Mr. Eiichi Hirooka 3
Statutory Auditors, Internal Auditors and Finance Head are permanent invitees to the Audit Committee Meetings. The Company Secretary acts as the Secretary to the Audit Committee.
The Audit Committee has been constituted as per Section 177 of the Companies Act, 2013 and the guidelines set out in the Listing Regulations. The Audit Committee of the Company, inter-alia, provides assurance to the Board on the existence and adequacy of an effective Internal Control systems that ensures:-
The Committee has powers as envisaged under Regulation 18 of the Listing Regulations and as specified by the Board of Directors of the Company.
62
b) Powers of Audit Committee Audit Committee shall have following Powers:-
1) To investigate any activity within its terms of reference;
2) To seek any information from any employee.
3) To obtain outside legal or other professional advice.
4) To secure attendance of outsiders with relevant expertise, if considered necessary.
c) Role of Audit Committee 1) Oversight of the company’s financial reporting process and the disclosure of its financial information to
ensure that the financial statement is correct, sufficient and credible;
2) Recommendation for appointment, remuneration and terms of appointment of auditors of the company;
3) Approval of payment to statutory auditors for any other services rendered by the statutory auditors;
4) Reviewing, with the management, the annual financial statements and auditor’s report thereon before submission to the board for approval, with particular reference to:
a. Matters required to be included in the Director’s Responsibility Statement to be included in the Board’s report in terms of clause (c) of sub-section 3 of section 134 of the Companies Act, 2013.
b. Changes, if any, in accounting policies and practices and reasons for the same.
c. Major accounting entries involving estimates based on the exercise of judgment by management.
d. Significant adjustments made in the financial statements arising out of audit findings
e. Compliance with listing and other legal requirements relating to financial statements
f. Disclosure of any related party transactions
g. modified opinion(s) in the draft audit report;
5) Reviewing, with the management, the quarterly financial statements before submission to the board for approval;
6) Reviewing, with the management, the statement of uses / application of funds raised through an issue (public issue, rights issue, preferential issue, etc.), the statement of funds utilized for purposes other than those stated in the offer document / prospectus / notice and the report submitted by the monitoring agency monitoring the utilization of proceeds of a public or rights issue, and making appropriate recommendations to the Board to take up steps in this matter;
7) Review and monitor the auditor’s independence and performance, and effectiveness of audit process;
8) Approval or any subsequent modification of transactions of the company with related parties;
9) Scrutiny of inter-corporate loans and investments;
10) Valuation of undertakings or assets of the company, wherever it is necessary;
11) Evaluation of internal financial controls and risk management systems;
12) Reviewing with the management, performance of the Statutory and Internal Auditors, adequacy of Internal Control systems.
13) Reviewing the adequacy of Internal Audit function, if any, including the structure of the internal audit department, staffing and seniority of the official heading the department, reporting structure coverage and frequency of internal audit.
14) Discussion with Internal Auditors on any significant findings and follow-up thereon.
15) Reviewing the findings of any internal investigations by the Internal Auditors into matters where there is suspected fraud or irregularity or a failure of internal control systems of a material nature and reporting the matter to the Board.

Lumax Industries Limited | Annual Report 2015-16
63
16) Discussion with Statutory Auditors before the audit commences, about the nature and scope of audit as well as post-audit discussion to ascertain any area of concern.
17) To look into the reasons for substantial defaults in the payment to the depositors, debenture holders, shareholders (in case of non payment of declared dividends) and creditors.
18) To Review the functioning of Whistle Blower mechanism, in case the same is existing.
19) Approval of appointment of CFO (i.e., the whole-time Finance Director or any other person heading the finance function or discharging that function) after assessing the qualifications, experience & background, etc. of the candidate.
20) Carrying out any other function as is mentioned in the terms of reference of the Audit Committee.
d) Review of information by Audit Committee The Audit Committee shall mandatorily review the following information:-
1) Management discussion and analysis of financial conditions and results of operations;
2) Statement of significant related party transactions (as defined by the audit committee), submitted by management;
3) Management letters/ letters of internal control weakness issued by the Statutory Auditors;
4) Internal Audit Reports relating to internal control weakness; and
5) The appointment, removal and terms of remuneration of the Chief Internal Auditors shall be subject to review by the Audit Committee.
6) statement of deviations; if any.
B. Nomination and Remuneration Committee The Nomination and Remuneration Committee consists of Independent and Non-Executive Directors to review
and recommend payment of annual salaries, commission, service agreements and other employment conditions of the Executive Directors of the Company. The committee fixes the remuneration after taking into consideration remuneration practices followed by Companies of similar size and standing in the Industry.
The Committee’s Constitution and terms of reference are in compliance with the provisions of the Companies Act, 2013 and Regulation 19 of the Listing Regulations.
The Nomination and Remuneration Committee comprises of four Directors as its members. All the members of the Committee are Non-Executive Independent Director and have sound knowledge of management practices. The Chairman of the Committee is a Non-Executive Independent Director nominated by the Board. The power and role of the Nomination & Remuneration Committee is as per guidelines set out in Listing Regulations. The constitution of the Nomination and Remuneration Committee Meeting is as under:
Sl. No. Name of Directors Status Category of membership
1. Mr. Rattan Kapur Chairman Non-Executive Independent Director
2. Mr. A.P. Gandhi Member Non-Executive Independent Director
3. Mr. D.D. Gupta Member Non-Executive Independent Director
4. Mr. Gursaran Singh Member Non-Executive Independent Director
The Nomination & Remuneration Committee had met twice during the financial year April 1, 2015 to March 31, 2016 to consider and recommend to the Board:-
1. The Remuneration and Evaluation of the performance of the Board of Directors policy.
2. Re-appointment of Mr. Deepak Jain as Managing Director of the Company for a period of 5 (Five) years.
The attendance of the Nomination & Remuneration Committee Meeting is as under:

64
Sl. No. Name of Directors No. of Meetings Attended
1. Mr. Rattan Kapur 2
2. Mr. A.P. Gandhi 2
3. Mr. D.D. Gupta 2
4. Mr. Gursaran Singh -
Role of Nomination and Remuneration Committee 1. formulation of the criteria for determining qualifications, positive attributes and independence of a director
and recommend to the board of directors a policy relating to, the remuneration of the directors, key managerial personnel and other employees;
2. formulation of criteria for evaluation of performance of independent directors and the board of directors;
3. devising a policy on diversity of board of directors;
4. identifying persons who are qualified to become directors and who may be appointed in senior management in accordance with the criteria laid down, and recommend to the board of directors their appointment and removal.
5. whether to extend or continue the term of appointment of the independent director, on the basis of the report of performance evaluation of independent directors.
a) Remuneration Policy: The Nomination and Remuneration Committee fixes the remuneration of the Executive Directors
after considering various factors such as qualification, experience, expertise, prevailing remuneration in the competitive industries, financial position of the Company, etc. The remuneration structure comprises Basic Salary, Commission, Perquisites and Allowances, contribution to Provident Fund etc. The remuneration policy for Executive Directors is directed towards rewarding performance, based on review of achievements of Executive Directors. The Extract of the Remuneration and Evaluation of the Performance of the Board of Directors Policy is given below:
1.1 Purpose The Board of Directors believes that an equitable remuneration to the Executive Management helps
ensure that the company can attract and retain key employees. Efforts are made to ensure that the remuneration of the Board of Directors, Key Managerial Personnel and other employees matches the level in comparable companies, whilst also taking into consideration board members’ required competencies, effort and the scope of the board work, including the number of meetings.
The policy shall ensure that level and composition of remuneration is reasonable and sufficient to attract, retain and motivate directors of the quality required to run the company successfully.
Section 178 of the Companies Act, 2013 and Regulation 19 of the Listing Regulations provides that the Nomination and Remuneration Committee shall formulate the criteria for determining qualifications, positive attributes and independence of a director and recommend to the Board a policy, relating to the remuneration for the directors, key managerial personnel and other employees.
This policy on remuneration of Directors and Key Managerial Personnel has been formulated by the Nomination and Remuneration Committee and approved by the Board of Directors of the Company.
1.2 Objective The objective of this policy is to lay down a framework in relation to remuneration of Directors, KMP
and other employees.
1.3 Definition “Board” means Board of Directors of the Company.
“Key Managerial Personnel” means
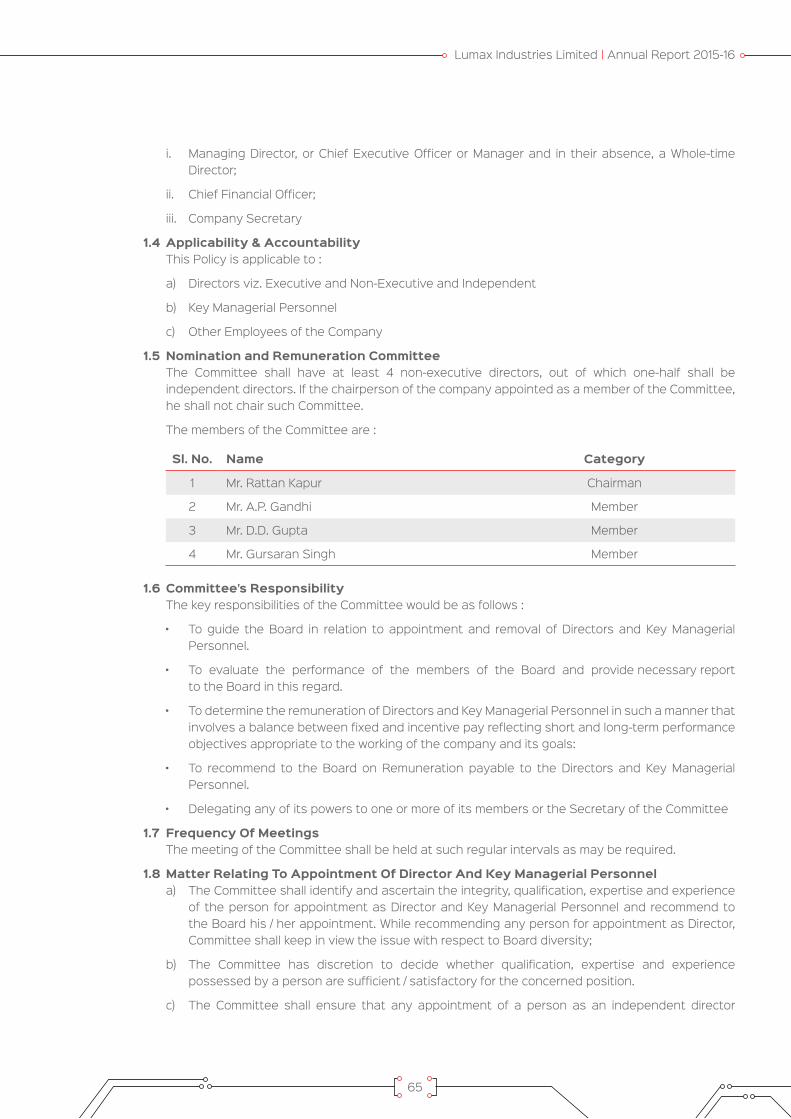
Lumax Industries Limited | Annual Report 2015-16
65
i. Managing Director, or Chief Executive Officer or Manager and in their absence, a Whole-time Director;
ii. Chief Financial Officer;
iii. Company Secretary
1.4 Applicability & Accountability This Policy is applicable to :
a) Directors viz. Executive and Non-Executive and Independent
b) Key Managerial Personnel
c) Other Employees of the Company
1.5 Nomination and Remuneration Committee The Committee shall have at least 4 non-executive directors, out of which one-half shall be
independent directors. If the chairperson of the company appointed as a member of the Committee, he shall not chair such Committee.
The members of the Committee are :
Sl. No. Name Category
1 Mr. Rattan Kapur Chairman
2 Mr. A.P. Gandhi Member
3 Mr. D.D. Gupta Member
4 Mr. Gursaran Singh Member
1.6 Committee’s Responsibility The key responsibilities of the Committee would be as follows :
Personnel.
to the Board in this regard.
involves a balance between fixed and incentive pay reflecting short and long-term performance objectives appropriate to the working of the company and its goals:
Personnel.
1.7 Frequency Of Meetings The meeting of the Committee shall be held at such regular intervals as may be required.
1.8 Matter Relating To Appointment Of Director And Key Managerial Personnel a) The Committee shall identify and ascertain the integrity, qualification, expertise and experience
of the person for appointment as Director and Key Managerial Personnel and recommend to the Board his / her appointment. While recommending any person for appointment as Director, Committee shall keep in view the issue with respect to Board diversity;
b) The Committee has discretion to decide whether qualification, expertise and experience possessed by a person are sufficient / satisfactory for the concerned position.
c) The Committee shall ensure that any appointment of a person as an independent director

66
of the Company shall be made in accordance with the provisions of Section 149, 150 and 152 read with Schedule IV and other applicable provisions of the Companies Act, 2013 and the Companies (Appointment and Qualification of Directors) Rules, 2014 and Regulation 17 of the Listing Regulations.
1.9 Matter Relating to the Remuneration for the Directors and Key Managerial Personnel a) The Committee shall determine remuneration structure for Directors and Key Managerial
Personnel taking into account factors it deems relevant, including but not limited to market scenario, business performance and practices in comparable companies, having due regard to financial and commercial health of the Company as well as prevailing laws and Government/other guidelines.
b) The remuneration / commission etc. to the Managing Director, Whole-time Director and Key Managerial Personnel will be determined by the Committee and recommended to the Board for approval. The remuneration / commission etc. shall be subject to the prior/post approval of the shareholders of the Company and Central Government, wherever required.
c) If, in any financial year, the Company has no profits or its profits are inadequate, the Company shall pay remuneration to its Managing Director/ Executive/ Whole-time Director(s) in accordance with the provisions of Schedule V of the Companies Act, 2013 and if the remuneration paid is not in compliance with such provisions, the same shall be subject to the previous approval of the Central Government.
d) Increments to the existing remuneration structure may be recommended by the Committee to the Board, which shall be within the overall limits of remuneration as prescribed under Companies Act, 2013.
e) Where any insurance is taken by the Company on behalf of its Managing Director/ Executive/Whole-time Director, Key Managerial Personnel and any other employees for indemnifying them against any liability, the premium paid on such insurance shall not be treated as part of the remuneration payable to any such personnel. However, if such person is proved to be guilty, the premium paid on such insurance shall be treated as part of the remuneration.
Remuneration to Independent Director: The Independent Director shall be paid sitting fees for attending meetings of Board or Committees
thereof as may be decided by the Board from time to time. Provided that the amount of such fees shall not exceed H One Lac per meeting of the Board or Committee.
Remuneration to Other Employees of the Company Employees are assigned grades according to their qualifications and work experience, competencies
as well as their roles and responsibilities in the Company. Individual remuneration is determined within the appropriate grade and is based on an individual’s experience, skill, competencies and knowledge relevant to the job and an individual’s performance and potential contribution to the Company.
Term / Tenure a) Managing Director/Whole-time Director: The Company shall appoint or re-appoint any person as its Executive Chairman, Managing
Director or Executive/ Whole Time Director for a term not exceeding five years at a time. No reappointment shall be made earlier than one year before the expiry of term.
b) Independent Director: An Independent Director shall hold office for a term up to five consecutive years on the Board
of the Company and will be eligible for re-appointment on passing of a special resolution by the shareholders of the Company.
No Independent Director shall hold office for more than two consecutive terms, but such Independent Director shall be eligible for appointment after expiry of three years of ceasing to become an Independent Director. Provided that an Independent Director shall not, during the said period of
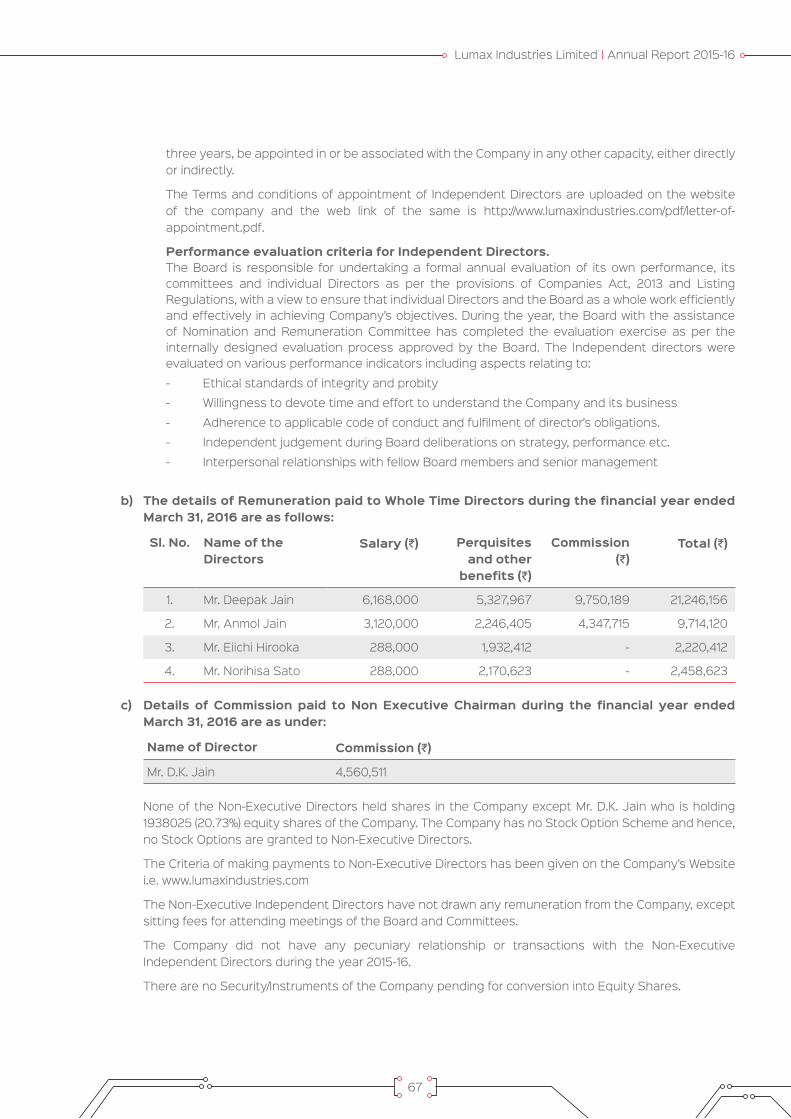
Lumax Industries Limited | Annual Report 2015-16
67
three years, be appointed in or be associated with the Company in any other capacity, either directly or indirectly.
The Terms and conditions of appointment of Independent Directors are uploaded on the website of the company and the web link of the same is http://www.lumaxindustries.com/pdf/letter-of-appointment.pdf.
Performance evaluation criteria for Independent Directors. The Board is responsible for undertaking a formal annual evaluation of its own performance, its
committees and individual Directors as per the provisions of Companies Act, 2013 and Listing Regulations, with a view to ensure that individual Directors and the Board as a whole work efficiently and effectively in achieving Company’s objectives. During the year, the Board with the assistance of Nomination and Remuneration Committee has completed the evaluation exercise as per the internally designed evaluation process approved by the Board. The Independent directors were evaluated on various performance indicators including aspects relating to:
- Ethical standards of integrity and probity
- Willingness to devote time and effort to understand the Company and its business
- Adherence to applicable code of conduct and fulfilment of director’s obligations.
- Independent judgement during Board deliberations on strategy, performance etc.
- Interpersonal relationships with fellow Board members and senior management
b) The details of Remuneration paid to Whole Time Directors during the financial year ended March 31, 2016 are as follows:
Sl. No. Name of the Directors
Salary (J) Perquisites and other
benefits (J)
Commission (J)
Total (J)
1. Mr. Deepak Jain 6,168,000 5,327,967 9,750,189 21,246,156
2. Mr. Anmol Jain 3,120,000 2,246,405 4,347,715 9,714,120
3. Mr. Eiichi Hirooka 288,000 1,932,412 - 2,220,412
4. Mr. Norihisa Sato 288,000 2,170,623 - 2,458,623
c) Details of Commission paid to Non Executive Chairman during the financial year ended March 31, 2016 are as under:
Name of Director Commission (J)
Mr. D.K. Jain 4,560,511
None of the Non-Executive Directors held shares in the Company except Mr. D.K. Jain who is holding 1938025 (20.73%) equity shares of the Company. The Company has no Stock Option Scheme and hence, no Stock Options are granted to Non-Executive Directors.
The Criteria of making payments to Non-Executive Directors has been given on the Company’s Website i.e. www.lumaxindustries.com
The Non-Executive Independent Directors have not drawn any remuneration from the Company, except sitting fees for attending meetings of the Board and Committees.
The Company did not have any pecuniary relationship or transactions with the Non-Executive Independent Directors during the year 2015-16.
There are no Security/Instruments of the Company pending for conversion into Equity Shares.

68
C. Share Transfer/Stakeholder Relationship Committee The Company has a Share Transfer/Stakeholder Relationship Committee to oversee Investors grievances
and redressal mechanism and recommends measures to improve the level of Investors’ services and to look into and decide matters pertaining to share transfers, duplicate share certificates and related matters. The Committee comprises of Managing Director, Senior Executive Director, Non-Executive Director and Non-Executive Independent Director. The composition of this Committee during the year April 2015 to March 2016 is as under:
Sl. No. Name of Directors Status Category of membership
1. Mr. D.D. Gupta Chairman Non-Executive Independent Director
2. Mr. D.K. Jain Member Non- Executive Chairman
3. Mr. Deepak Jain Member Managing Director
4. Mr. Eiichi Hirooka Member Senior Executive Director
The functioning and terms of reference of the Committee are, as prescribed under the Listing Regulations with particular reference to transfer, dematerialization and complaints of Shareholders etc.
The Quorum for the functioning of the Committee is any two Members present. The board has delegated the authority for approving transfers, transmission etc once in a fortnight to the Chairman /or Company Secretary of the Company. A summary of transfer, transmission of shares of the Company so approved by the Chairman/or Company Secretary is placed at every Share Transfer /Stakeholders Relationship Committee meeting. The Company obtains from a Company Secretary in practice half-yearly certificate of Compliance with the share transfer formalities as required under regulation 40(9) of the Listing Regulations and files a copy of the certificate with the Stock Exchanges within the prescribed time.
The total complaints received and replied to the shareholders during the year ended March 31, 2016 were 39. There were no complaints which were not solved to the satisfaction of the shareholders and pending during the year.
During the year 4 meetings of Committee were held. The following is the attendance record at the Committee during the year:
Sl. No. Name of Director No. of Meetings Attended
1 Mr. D.D. Gupta 4
2. Mr. D.K. Jain 4
3. Mr. Deepak Jain 4
4 Mr. Eiichi Hirooka 3
D. Corporate Social Responsibility Committee The Corporate Social Responsibility Committee has been formed pursuant to Section 135 of the Companies Act,
2013 read with the Companies (Corporate Social Responsibility Policy) Rules, 2014, to formulate and recommend to the Board, a Corporate Social Responsibility Policy indicating the activities to be undertaken by the Company as specified in Schedule VII to the Act, to recommend the amount of expenditure to be incurred on such activities and to monitor the Corporate Social Responsibility Policy of the company from time to time.

Lumax Industries Limited | Annual Report 2015-16
69
The Corporate Social Responsibility Committee comprises of Managing Director, Joint Managing Director, Non-Executive Chairman and Non-Executive Independent Directors. The Chairman of the Committee is Mr. M.C. Gupta, Non-Executive Independent Director. The Composition of Corporate Social Responsibility Committee during the year April 2015 to March 2016 is as under:
Sl. No. Name of Directors Status Category of Membership No. of meeting attended
1. Mr. M.C. Gupta Chairman Non-Executive Independent Director 2
2. Mr. A.P Gandhi Member Non-Executive Independent Director 2
3. Mr. D.K. Jain Member Non Executive Chairman 1
4. Mr. Deepak Jain Member Managing Director -
5. Mr. Anmol Jain Member Joint Managing Director -
E. Policy on Sexual Harassment In accordance with the provisions of Sexual Harassment of Women at Workplace (Prevention, Prohibition and
Redressal) Act, 2013, the Company has adopted the “Prevention of Sexual Harassment at Workplace Policy” and constituted an Internal Complaints Committee for Prohibition, Prevention and Redressal of Sexual Harassment of Women at Workplace and matters connected therewith or incidental thereto covering all the related aspects. During the year, no such complaints were received by the Company.
4. Compliance Officer of the CompanyMr. Shwetank Tiwari, Company Secretary is the Compliance Officer of the Company. He is primarily responsible to ensure compliance with applicable statutory requirements and is the interface between the management and regulatory authorities for governance matters.
5. General Body MeetingThe details of Annual General Meeting (AGMs) held in the last three years are as follows:
Financial year Date Time Location
2012-13 06-08-2013 10.30 A.M Air Force Auditorium, Subroto Park, New Delhi
2013-14 22-08-2014 10.30 A.M Air Force Auditorium, Subroto Park, New Delhi
2014-15 19-08-2015 10.30 A.M Air Force Auditorium, Subroto Park, New Delhi
Special Resolutions passed in previous three Annual General Meetings (AGM).
(i) AGM held on 06-08-2013: a) Re-structure of the salary of Mr. Eiichi Hirooka, Senior Executive Director to comply with employment visa
norms in India.
b) Re-structure of the salary of Mr. Toshio Masuda, Executive Director to comply with employment visa norms in India.
(ii) AGM held on 22-08-2014: a) Appointment of Mr. Norihisa Sato as Director as well as Executive Director of the Company.
b) Special Resolution under section 180(1)(c) and 180(1)(a) of the Companies Act, 2013 for the Borrowing powers of the Board of Directors and creation of security on assets of the Company.
(iii) AGM held on 19-08-2015: a) Re-appointment of Mr. Eiichi Hirooka as Senior Executive Director for a period of 3 years.
b) Increase in Remuneration of Mr. Deepak Jain, Managing Director of the Company.
c) Change in designation of Mr. Anmol Jain to Joint Managing Director of the Company.
There were no ordinary or special resolution that needed to be passed through Postal Ballot process during the year 2015-16.

70
6. Code of ConductThe Company has adopted a Code of Conduct for all Board Members and Senior Employees of the Company. All Board Members and Senior Management Personnel have affirmed compliance with the Code of Conduct on annual basis. The Annual Report contains a declaration to this effect signed by the Managing Director of the Company. The Code of Conduct has already been posted on the website of Company for general viewing.
7. Other Disclosures a. During 2015-16, other than the transactions entered in the normal course of business and reported as the related
party transactions in the annual accounts, the Company had not entered any materially significant related party transactions i.e. transaction of material nature with its Promoters/ Director/Senior Employees or relatives etc., which could have a potential conflict with the interest of Company at large.
b. The Audit Committee is briefed with all related party transactions undertaken by the Company.
c. The Senior Employees have made disclosures to the Board that they did not have personal interest in any material financial and commercial transactions that could result in a conflict with the interest of the Company at large.
d. The Company has a Code of Conduct for its Board and Senior Employees as per Listing Regulations and the same is available at the Company’s website. The Company has obtained a compliance certificate from all concerned.
e. There has been no Non-Compliance penalties/strictures imposed on the Company by Stock Exchange(s) or SEBI or any other statutory authority, on any matter related to capital markets, during the last three years.
f. The Company follows the Accounting Standards laid down by the Institute of Chartered Accountants of India, and there has been no deviation in the accounting treatment during the year.
g. The Company has a Whistle Blower Policy to enable its Directors and Employees to report to the Management their concerns about unethical behavior, actual or suspected fraud or violation of the Company’s code of conduct or ethics policy. The Company promotes a favorable environment for employees to have an open access to the respective functional Heads, Executive Directors, Chairman and Managing Director, so as to ensure ethical and fair conduct of the business of the Company.
h. The Company has complied with all the mandatory requirements of the SEBI (Listing Obligations and Disclosure Requirements) Regulations, 2015.
i) The Company has formulated a Code of Conduct for prevention of Insider Trading in the Shares of the Company in accordance with the SEBI (Prohibition of Insider Trading) Regulations, 2015.
8. Means Of CommunicationThe quarterly/yearly results of the Company are published in leading and widely circulated English dailies viz. (1) The Financial Express – All Editions (English) (2) Jansatta, New Delhi (Hindi Edition)
NSE Electronic Application System (NEAPS)The NEAPS is a web based application designed by NSE for corporates. All periodical compliance filings like shareholding pattern, corporate governance report, media releases, among others are filed electronically on NEAPS.
BSE Corporate Compliance & Listing Centre (the Listing Centre)BSE’s Listing centre is a web-based application designed for corporates. All periodical compliance filings like shareholding pattern, corporate governance report, media releases, among others are also filed electronically on the Listing Centre.
The Company’s financial results are displayed on the Company’s website at www.lumaxindustries.com.
9. Management Discussion and Analysis report forms part of the Directors Report

Lumax Industries Limited | Annual Report 2015-16
71
10. General Shareholders Informationa) Annual General Meeting : The 35th Annual General Meeting is scheduled as under:
Date : August 08, 2016
Time : 10.30 AM
Venue : Air Force Auditorium, Subroto Park, New Delhi-110010
b) Date of Book Closure : August 1, 2016 to August 8, 2016 (Both days inclusive)
c) Registered Office : Lumax Industries Limited B-85-86, Mayapuri Industrial Area, Phase – I, New Delhi - 110064
d) Financial Year : 1st April to 31st March
e) For the Financial Year 2015-16 results were announced on:
Adoption of Quarterly Results Ended Dates
June 30, 2015 July 24, 2015
September 30, 2015 November 07, 2015
December 31, 2015 February 13, 2016
March 31, 2016 (Audited Annual Accounts) May 12, 2016
f) Financial Calendar for 2016-17 (Provisional).
Adoption of Quarterly Results Ended Tentative Calendar #
June 30, 2016 2nd week of August 2016
September 30, 2016 2nd week of November 2016
December 31, 2016 2nd week of February 2017
March 31, 2017 (Audited Annual Accounts) 4th week of May 2017
# Within 45 days of the end of the Quarter, as per Listing Regulations.
g) Dividend & Dividend Payment Date: An Interim dividend of H 12/- per share (120%) has been declared by the Board of Directors on March 12, 2016 and
distributed to the shareholders for the Financial Year 2015-16. For Demat shareholders and physical shareholders who have opted for NECS/ECS Dividend amount of H 12/- per share was credited directly to their respective bank accounts through NECS/ECS on March 29, 2016. For others, dividend warrant was dispatched on April 06, 2016.
h) Unclaimed Dividends: Unclaimed Dividend for the Financial year 2008-2009 shall become transferable to the Investor Education &
Protection Fund by last week of October, 2016. The Company has been writing periodical reminders to all the shareholders as a part of sending Notice of the Annual General Meeting, whose Dividends are lying unpaid in the Unpaid Dividend Account. Members who have not encashed their Dividend for the Financial year 2008-09 and onwards are therefore, requested to make their claims to the Company immediately.
i) Share Transfer System: All work related to Share Registry, both in physical form and electronic form, is handled by the Company’s Registrar
and Share Transfer Agent. The Company has appointed M/s Karvy Computershare Pvt. Ltd. as the Registrar & Share Transfer Agent. The Share transfers in physical form are approved by the Chairman and Company Secretary on fortnightly basis and the same were approved and ratified by the Share Transfer/ Stakeholder Relationship Committee.

72
The total number of shares transferred/transmitted during the Financial Year 2015-16 was 6433, which were registered and returned to the respective transferees within a period ranging from one to two weeks, provided the documents lodged with the Registrars/Company are clear in all respects.
j) Registrar and Share Transfer Agent (For Physical as well as for Demat Segment) Address : M/s Karvy Computershare Pvt. Ltd. Unit: Lumax Industries Limited Karvy Selenium Tower-B, Plot No.31-32, Gachibowli, Financial District, Nanakramguda, Hyderabad-500008
Tel : 040 -67162222
Fax : 040 -23001153
Toll Free No : 1800-3454-001
E-mail : [email protected]
k) Investors Correspondence: All queries of investors regarding the Company’s shares in Physical / Demat form may be sent either to the
Registrar & Share Transfer Agent or to the Secretarial & Corporate Affairs Department of the Company at the following address:
Address : Lumax Industries Limited Plot No.16, Sector-18, Maruti Complex, Gurgaon, Haryana
Tel : 0124-2341090, 2341324
Fax : 0124-2342149
E-mail : [email protected]
Website : www.lumaxindustries.com
l) Listing on Stock Exchanges:
Stock Exchange Scrip Code
BSE Limited 517206
National Stock Exchange of India Limited LUMAXIND
m) ISIN No. : INE162B01018 Listing Fee for the Financial Year 2016-17 has been paid to the BSE Limited and National Stock Exchange of India
Limited.
n) Outstanding GDR’s/ADR’s/Warrants or any convertible Instrument, Conversion Date and Likely impact on Equity
There are no convertible instruments which could result in increasing the equity capital of the Company and the Company has not issued any GDR/ADR/FCCB etc.

Lumax Industries Limited | Annual Report 2015-16
73
o) Shareholding Pattern of the Company as on March 31, 2016
Sl No.
Category No. of Shares held
% age of Shareholding
A. Promoters’ Holding
1. Promoters
Indian Promoters 3,371,788 36.07
Foreign Promoters 3,505,399 37.50
2. Persons acting in concert - -
Sub – Total (A) 6,877,187 73.57
B. Non-Promoters Holding
3. Institutional Investors
a Mutual Funds and UTI 1,740 0.02
b Banks, Financial Institutions, Insurance Companies, Central/State Govt. Institutions/Non-Government Institutions.
6,110 0.06
c. Foreign Institutional Investors. 155,203 1.66
Sub – Total (B3) 163,053 1.74
4. Others:-
a Bodies Corporate & Clearing Member 693,894 7.42
b Indian Public 1,588,784 17.00
c NRIs (Including Foreign Company) 24,814 0.27
Sub – Total (B4) 2,307,492 24.69
Sub –Total ( B ) (B3+B4) 2,470,545 26.43
Grand Total ( A + B ) 9,347,732 100.00
p) Distribution of Shareholding as on March 31, 2016
Range of Shares No. of Shareholders
% of Share-holders
Amount(J)
% of Equity Capital
1 5,000 20169 97.54 9506550 10.17
5,001 10,000 269 1.30 2044010 2.19
10,001 20,000 106 0.51 1569810 1.68
20,001 30,000 46 0.22 1142010 1.22
30,001 40,000 21 0.10 755050 0.81
40,001 50,000 12 0.06 562980 0.60
50,001 1,00,000 27 0.13 1925750 2.06
1,00,001 & above 29 0.14 75971160 81.27
Total 20679 100.00 93477320 100.00

74
q) Dematerialization of Shares: As per notifications issued by the Securities and Exchange Board of India (SEBI), the trading in Company’s shares
is permitted only in dematerialised form. In order to enable the shareholders to hold their shares in electronic form and to facilitate scripless trading, the Company has enlisted its shares with National Securities Depository Limited (NSDL) and Central Depository Services (India) Limited (CDSL).
r) Status of Dematerialization & Liquidity as on March 31, 2016: Dematerialisation:
No. of Shares Dematerialised 9,076,478 (97.10% of the total share capital)
No. of Shareholders in Demat form 11649 (56.33% of the total No. of Shareholders)
Liquidity: The Numbers of Shares of the Company traded in the Stock Exchange for the financial year 2015-2016 is given
below:
Particulars BSE NSE Total
No of shares Traded 1,359,254 4,098,785 5,458,039
% of total Equity 14.54% 43.85% 58.39%
s) Stock Market Data during the Financial Year 2015-16 The monthly High and Low Prices of the Shares of the Company Listed on BSE Limited (BSE) and National Stock
Exchange of India Limited (NSE) along with the BSE “Sensex” and NSE “Nifty” are as follows:
MONTH BSE NSE
Share Price Sensex Share Price S&P CNX Nifty
High (H) Low (H) High Low High (H) Low (H) High Low
April 2015 351.80 290.00 29094.61 26897.54 351.00 298.00 8844.80 8144.75
May 2015 350.00 312.00 28071.16 26423.99 341.50 310.50 8489.55 7997.15
June 2015 322.90 282.50 27968.75 26307.07 359.00 280.00 8467.15 7940.30
July 2015 512.20 282.50 28578.33 27416.39 511.05 284.25 8654.75 8315.40
August 2015 554.70 395.10 28417.59 25298.42 554.00 392.00 8621.55 7667.25
September 2015 442.00 385.00 26471.82 24833.54 440.00 380.00 8055.00 7539.50
October 2015 482.00 412.60 27618.14 26168.71 480.00 412.00 8336.30 7930.65
November 2015 539.10 421.10 26824.30 25451.42 539.80 415.40 8116.10 7714.50
December 2015 526.80 427.80 26256.42 24867.73 525.05 423.05 7979.30 7551.05
January 2016 476.10 384.10 26197.27 23839.76 477.00 380.00 7972.55 7241.50
February 2016 456.00 356.50 25002.32 22494.61 458.00 352.60 7600.45 6825.80
March 2016 444.90 376.00 25479.62 23133.18 448.00 372.00 7777.60 7035.10

Lumax Industries Limited | Annual Report 2015-16
75
(t) The details of the Stock Performance vis – a – vis S&P CNX Nifty in graphical manner and Monthly Closing Share Price on NSE and BSE from April 2015 to March 2016 is given below:
Monthly Closing Share Price on BSE & NSE along with Sensex and Nifty Points
MONTH BSE (H) SENSEX NSE (H) NIFTY
April 2015 318.80 27011.31 315.80 8181.50
May 2015 319.70 27828.44 318.75 8433.65
June 2015 295.50 27780.83 295.05 8368.50
July 2015 492.60 28114.56 490.20 8532.85
August 2015 428.20 26283.09 425.20 7971.30
September 2015 430.70 26154.83 429.75 7948.90
October 2015 415.10 26656.83 415.00 8065.80
November 2015 497.20 26145.67 497.85 7935.25
December 2015 466.70 26117.54 467.35 7946.35
January 2016 444.20 24870.69 443.90 7563.55
February 2016 374.00 23002.00 375.80 7029.75
March 2016 419.70 25341.86 414.60 7738.40
The performance of the Company’s Share related to Nifty (April 2015 to March 2016) is given in the chart below:
18016014012010080604020
0Apr-15 May-15 Jun-15 Jul-15 Aug-15 Sep-15
---- Months ---
S&P CNX NiftyLIL Share Price NSE
Pric
es (I
ndex
ed t
o 10
0)
LIL Share price vis-a-vis NSE Nifty
Oct-15 Nov-15 Dec-15 Jan-16 Feb-16 Mar-16

76
u) Plant Locations of the Company as on March 31, 2016 The Company has following manufacturing units:
Sl. No. Plant Locations
1. Plot No.16, Sector-18, Maruti Complex, Gurgaon, Haryana.
2. Plot No.6, Industrial Area, Dharuhera, District Rewari, Haryana.
3. Plot No.195-195A, Sector 4, Phase-II, Bawal, Distt. Rewari, Haryana.
4. Plot No. 51, Sector11,IIE, Pant Nagar, Distt. Udham Singh Nagar, Uttarakhand.
5. Plot No. 5, Industrial Park-II, Village Salempur Mehdood, Haridwar, Uttarakhand
6. 608-609, Chakan Talegaon Road, Mahalunge Ingle, Chakan, Pune, Maharashtra.
7. D2-43/2, M.I.D.C. Industrial Area, Chinchwad, Pune, Maharashtra.
8. Plot No. D-1, Vendors Park, Sanand, Distt. Ahmedabad, Gujarat.
9. Plot No.69, Phase-II, Bidadi Industrial Area, Sector 2, Bangalore, Karnataka
11. Unclaimed Suspense AccountPursuant to Regulation 34(3) read with Schedule V of the Listing Regulations, the Company reports the following details in respect of the equity shares lying in the suspense account:
Particulars No. of Shareholders
No. of Shares
Aggregate number of shareholders and outstanding shares at the beginning of the year i.e. as on April 1, 2015
669 20886
Number of shareholders who approached for issue/transfer of Shares during the year 2015-16
8 349
Number of shareholders to whom shares were issued/transferred 8 349
Aggregate number of shareholders and the Outstanding shares lying at the end of the year i.e. March 31, 2016
661 20537
The members who have not claimed the shares from the above returned undelivered cases are requested to contact the Registrar-M/s Karvy Computershare Pvt Ltd at the address given above. The voting rights on the 20,537 shares shall remain frozen till the rightful owner of such shares claims the shares.
12. Non-Mandatory Requirements The Company is complying with mandatory requirements and partly complying with the non-mandatory requirements such as:
Company’s expenses.
13. CEO/CFO CertificateThe Managing Director, Mr. Deepak Jain and the Chief Financial Officer, Mr. Shruti Kant Rustagi have furnished the requisite certificate to the Board of Directors pursuant to Regulation 17 (8) of the Listing Regulations.
Nomination FacilityShareholders holding shares in physical form and desirous of making a nomination in respect of their shareholding in the Company, as permitted under Section 72 of the Companies Act, 2013, read with the Companies (Share Capital and Debentures) Rules, 2015 are requested to submit to the Company nomination in the prescribed Form SH-13 for this purpose.

Lumax Industries Limited | Annual Report 2015-16
77
A. Information pursuant to Section 197 of the Companies Act, 2013 read with Rule 5(1) of Companies (Appointment and Remuneration of Managerial Personnel) Rules, 2014
Annexure - G
Name of Directors & Key Managerial Personnel
Designation Ratio of Remuneration to Median remuneration of all employees
Mr. Deepak Jain Managing Director 86:1
Mr. Anmol Jain Joint Managing Director 39:1
Mr. Eiichi Hirooka Senior Executive Director 10:1
Mr. Norihisa Sato Executive Director 11:1
Mr. Shruti Kant Rustagi Chief Financial Officer 19:1
Mr. Shwetank Tiwari Company Secretary 5:1
Notes:
1. The number of permanent employees as on 31st March, 2016 was 2241.
2. Compared to the previous year 2014-15, the figures for the current year 2015-16 reflects that:
i) Gross Turnover, PBT and EPS has grown by 11.09 %, 191.37 % & 125.49 % respectively.
ii) Median remuneration and average remuneration of all employees has increased by 13.47% and 6.45% respectively.
iii) Average remuneration of employees excluding Key Managerial Personnel has increased by 6.39%.
iv) Remuneration of Key Managerial Personnel has increased by 38.24%.
3. The Percentage increase in remuneration of each director, chief financial officer, company secretary ranges between 2% to 99%. The remuneration components in case of directors includes commission which is linked with the profitability of the Company.
4. The ratio of remuneration of the highest paid Director to that of the employee’s, who are not Directors but receive remuneration in excess of the highest paid Director during the year - Not Applicable. There is no such employee who received remuneration is excess of the highest paid director during the year.
5. The remuneration of the Directors, Key Managerial Personnel and other employees is in accordance with the Remuneration Policy of the Company provided under the section ‘Report on Corporate Governance’ which forms part of the Report and Accounts.
6. The market capitalisation of the Company as on 31st March, 2016 increased by 24.84% when compared to that of 31st March, 2015. The Company has not made any public offer in the recent past and accordingly, comparison of Public Offer Price and the current market price of the Company’s shares will not be relevant.
7. The PE ratio as on 31st March, 2016 stood at 10.37 (31st March, 2015: 18.73).

78
CEO and CFO Certificate under Regulation 17(8) of the SEBI (Listing Obligations and Disclosure Requirements) Regulations, 2015.
Certificate of Compliance of Code of Conduct by Board of Directors andSenior Management Personnel
a. We certify to the Board that we have reviewed Financial Statements and Cash Flow Statement for the year ended March 31, 2016 and that to the best of our knowledge and belief;
(i) these statements do not contain any materially untrue statement or omit any material fact or contain statements that might be misleading;
(ii) these statements together present a true and fair view of the Company’s affairs and are in compliance with existing accounting standards, applicable laws and regulations.
b. There are, to the best of our knowledge and belief, no transactions entered into by the Company during the year which are fraudulent, illegal or violative of the Company’s Code of Conduct.
c. We accept responsibility for establishing and maintaining internal controls for financial reporting and that we have evaluated the effectiveness of the internal control systems of the Company pertaining to financial reporting and we have disclosed to the Auditors and the Audit Committee deficiencies in the design or operation of such internal controls, if any, of which we are aware and the steps we have taken or propose to take to rectify these deficiencies, if any.
d. We have indicated to the Auditors and the Audit Committee
(i) significant changes in internal control over financial reporting during the year, if any;
(ii) significant changes in accounting policies during the year and that the same have been disclosed in the notes to the financial statements, if any; and
(iii) There were no instances of fraud of which we have become aware and the involvement therein, if any, of the management or an employee having a significant role in the Company’s internal control system over financial reporting.
Place: New Delhi (Shruti Kant Rustagi) (Deepak Jain) Date: May 12, 2016 Chief Financial Officer Managing Director
I, Deepak Jain, Managing Director of the Company hereby certify that the Board of Directors and the Senior Management Personnel have affirmed compliance of the Code of Conduct of the Company for the Financial Year 2015 - 2016.
Place: New Delhi (Deepak Jain) Date: May 12, 2016 Managing Director

Lumax Industries Limited | Annual Report 2015-16
79
Auditors’ Certificate
To The Members of Lumax Industries Limited
We have examined the compliance of conditions of corporate governance by Lumax Industries Limited for the year ended on March 31, 2016 as stipulated in Chapter IV of Securities and Exchange Board of India (Listing Obligations and Disclosure Requirements) Regulations, 2015 of the said Company with Stock Exchange(s).
The compliance of conditions of corporate governance is the responsibility of the management. Our examination was limited to procedures and implementation thereof, adopted by the Company for ensuring the compliance of the conditions of the Corporate Governance. It is neither an audit nor an expression of opinion on the financial statements of the Company.
In our opinion and to the best of our information and according to the explanations given to us, we certify that the Company has complied with the conditions of Corporate Governance as stipulated in the provisions as specified in Chapter IV of Securities and Exchange Board of India (Listing Obligations and Disclosure Requirements) Regulations, 2015 pursuant to Listing Agreement of the said Company with stock exchange(s).
We further state that such compliance is neither an assurance as to the future viability of the Company nor the efficiency or effectiveness with which the management has conducted the affairs of the Company.
For S.R. BATLIBOI & CO., LLPChartered AccountantsICAI Firm registration number: 301003E/E300005
Per Vikas MehraPartner Place: New DelhiMembership No.: 94421 Date: May 12, 2016
80
Report on the Financial StatementsWe have audited the accompanying standalone financial statements of Lumax Industries Limited (“the Company”), which comprises the Balance Sheet as at March 31, 2016, the Statement of Profit and Loss and Cash Flow Statement for the year then ended, and a summary of significant accounting policies and other explanatory information.
Management’s Responsibility for the Financial StatementsThe Company’s Board of Directors is responsible for the matters stated in Section 134(5) of the Companies Act, 2013 (“the Act”) with respect to the preparation of these standalone financial statements that give a true and fair view of the financial position, financial performance and cash flows of the Company in accordance with accounting principles generally accepted in India, including the Accounting Standards specified under section 133 of the Act, read with Rule 7 of the Companies (Accounts) Rules, 2014. This responsibility also includes maintenance of adequate accounting records in accordance with the provisions of the Act for safeguarding of the assets of the Company and for preventing and detecting frauds and other irregularities; selection and application of appropriate accounting policies; making judgments and estimates that are reasonable and prudent; and the design, implementation and maintenance of adequate internal financial control that were operating effectively for ensuring the accuracy and completeness of the accounting records, relevant to the preparation and presentation of the financial statements that give a true and fair view and are free from material misstatement, whether due to fraud or error.
Auditor’s ResponsibilityOur responsibility is to express an opinion on these standalone financial statements based on our audit. We have taken into account the provisions of the Act, the accounting and auditing standards and matters which are required to be included in the audit report under the provisions of the Act and the Rules made thereunder. We conducted our audit in accordance with the Standards on Auditing, issued by the Institute of Chartered Accountants of India, as specified under Section 143(10) of the Act. Those Standards require that we comply with ethical requirements and plan and perform the audit to obtain reasonable assurance about whether the financial statements are free from material misstatement.
An audit involves performing procedures to obtain audit evidence about the amounts and disclosures in the financial statements. The procedures selected depend on the auditor’s judgment, including the assessment of the risks of material misstatement of the financial statements, whether due to fraud or error. In making those risk assessments, the auditor considers internal financial control relevant to the Company’s preparation of the financial statements that give a true and fair view in order to design audit procedures that are appropriate in the circumstances. An audit also includes evaluating the appropriateness of accounting policies used and the reasonableness of the accounting estimates made by the Company’s Directors, as well as evaluating the overall presentation of the financial statements. We believe that the audit evidence we have obtained is sufficient and appropriate to provide a basis for our audit opinion on the standalone financial statements.
OpinionIn our opinion and to the best of our information and according to the explanations given to us, the standalone financial statements give the information required by the Act in the manner so required and give a true and fair view in conformity with the accounting principles generally accepted in India of the state of affairs of the Company as at March 31, 2016, its profit/loss, and its cash flows for the year ended on that date.
Report on Other Legal and Regulatory Requirements1. As required by the Companies (Auditor’s report)
Order, 2016 (“the Order”) issued by the Central Government of India in terms of sub-section (11) of section 143 of the Act, we give in the Annexure 1, a statement on the matters specified in paragraphs 3 and 4 of the Order.
2. As required by section 143 (3) of the Act, we report that:
(a) We have sought and obtained all the information and explanations which to the best of our knowledge and belief were necessary for the purpose of our audit;
(b) In our opinion proper books of account as required by law have been kept by the Company so far as it appears from our examination of those books;
To the Members of Lumax Industries Limited
INDEPENDENT AUDITOR’S REPORT

Lumax Industries Limited | Annual Report 2015-16
81
(c) The Balance Sheet, Statement of Profit and Loss, and Cash Flow Statement dealt with by this Report are in agreement with the books of account;
(d) In our opinion, the aforesaid standalone financial statements comply with the Accounting Standards specified under section 133 of the Act, read with Rule 7 of the Companies (Accounts) Rules, 2014;
(e) On the basis of written representations received from the directors as on March 31, 2016, and taken on record by the Board of Directors, none of the directors is disqualified as on March 31, 2016, from being appointed as a director in terms of section 164 (2) of the Act;
(f) With respect to the adequacy of the internal financial controls over financial reporting of the Company and the operating effectiveness of such controls, refer to our separate Report in “Annexure 2” to this report;
(g) With respect to the other matters to be included in the Auditor’s Report in accordance with Rule 11 of the Companies (Audit and Auditors) Rules, 2014, in our opinion and to the best of our information and according to the explanations given to us:
i. The Company has disclosed the impact of pending litigations on its financial position in its financial statements – Refer Note 35 to the financial statements;
ii. The Company has made provision, as required under the applicable law or accounting standards, for material foreseeable losses, if any, on long-term contracts including derivative contracts;
iii. There has been no delay in transferring amounts, required to be transferred, to the Investor Education and Protection Fund by the Company
For S.R. Batliboi & CO. LLP Chartered Accountants
ICAI Firm Registration Number: 301003E/E300005
per Vikas MehraPartner
Membership Number: 94421
Place of Signature: New DelhiDate: May 12, 2016

82
Annexure referred to in paragraph 1 under the heading “Report on other legal and regulatory requirements” of our report.(Annexure 1)Re: Lumax Industries Limited (‘the Company’)(i) (a) The company has maintained proper records
showing full particulars, including quantitative details and situation of fixed assets.
(b) All fixed assets have not been physically verified by the management during the year but there is a regular programme of verification which, in our opinion, is reasonable having regard to the size of the Company and the nature of its assets. No material discrepancies were noticed on such verification.
(c) According to the information and explanations given by the management the title deeds of immovable properties included in property, plant and equipment/ fixed assets are held in the name of the company except One immovable property having Gross Block value of H16,050,000 and Net Block of H 14,652,901 as at March 31, 2016 for which title deed were not available with the Company and hence we are unable to comment on the same.
(ii) The inventory has been physically verified by the management during the year. In our opinion, the frequency of verification is reasonable. No material discrepancies were noticed on such physical verification .Inventories lying with third parties have been confirmed by them as at year end and no material discrepancies were noticed in respect of such confirmations.
(iii) According to the information and explanations given to us, the Company has not granted any loans, secured or unsecured to companies, firms, Limited Liability Partnerships or other parties covered in the register maintained under section 189 of the Companies Act, 2013. Accordingly, the provisions of clause 3(iii)(a), (b) and (c) of the Order are not applicable to the Company and hence not commented upon.
(iv) In our opinion and according to the information and explanations given to us, there are no loans, investments, guarantees, and securities granted in respect of which provisions of section 185 and 186 of the Companies Act 2013 are applicable and hence not commented upon.
(v) The Company has not accepted any deposits from the public.
(vi) We have broadly reviewed the books of account maintained by the Company pursuant to the rules made by the Central Government for the maintenance of cost records under section 148(1) of the Companies Act, 2013, related to the manufacture of auto components (electricals or electronic machinery), and are of the opinion that prima facie, the specified accounts and records have been made and maintained. We have not, however, made a detailed examination of the same.
(vii) (a) The Company is regular in depositing with appropriate authorities undisputed statutory dues including provident fund, employees’ state insurance, income-tax, sales-tax, service tax, customs duty, excise duty, value added tax, cess and other material statutory dues applicable to it.
(b) According to the information and explanations given to us, no undisputed amounts payable in respect of provident fund, employees’ state insurance, income-tax, service tax, sales-tax, duty of custom, duty of excise, value added tax, cess and other material statutory dues were outstanding, at the year end, for a period of more than six months from the date they became payable.
(c) According to the records of the Company, the dues outstanding of income-tax, sales-tax, service tax, duty of custom, duty of excise, value added tax and cess on account of any dispute, are as follows:
Name of the statute
Nature of dues Amount (H)
Period to which the amount relates
Forum where dispute is pending
The Central Excise Act, 1944
Excise duty demand against rejected goods sent on 57(f)(4) challans
72,55,448 July 1994 to February 1999
High Court, Chandigarh
The Central Excise Act, 1944
Excise duty demand against excess credit taken against the material procured from 100% EOU
2,026,701 1999-2000 to 2001-02
Joint Commissioner of Central Excise, Gurgaon
The Central Excise Act, 1944
Excise duty demand against excess credit taken against the material procured from 100% EOU
461,370 1999-2000 to 2001-02
Supreme Court
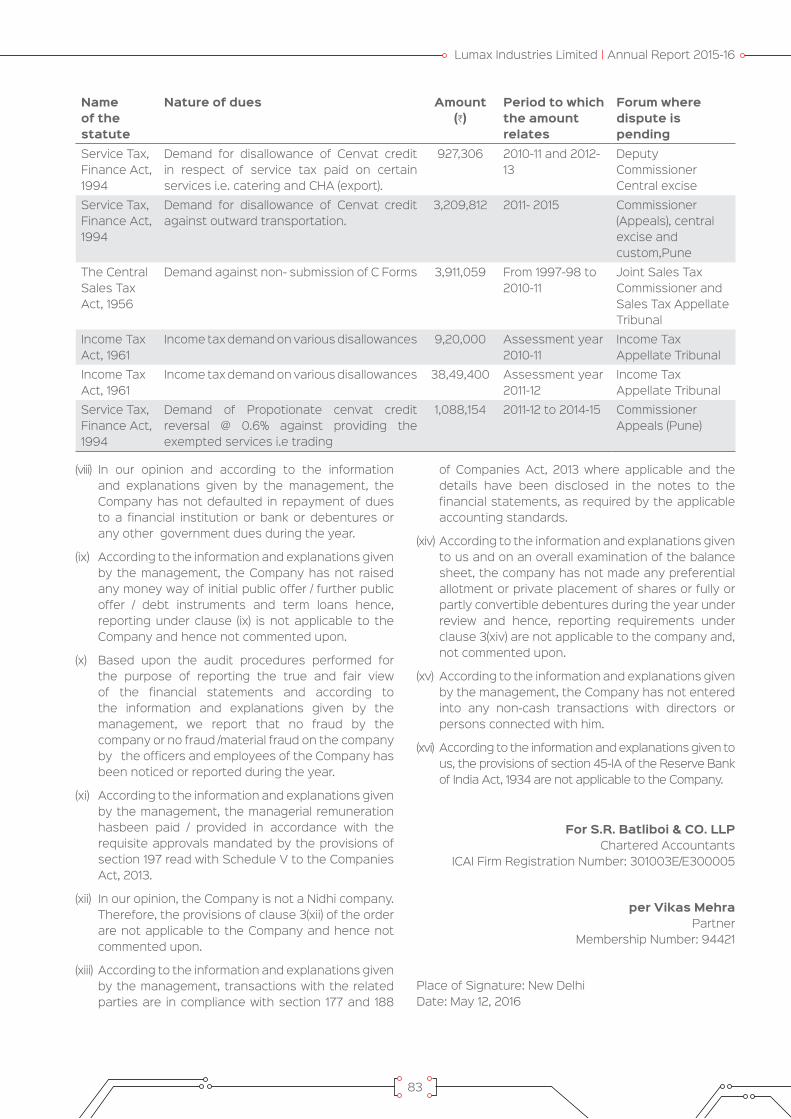
Lumax Industries Limited | Annual Report 2015-16
83
Name of the statute
Nature of dues Amount (H)
Period to which the amount relates
Forum where dispute is pending
Service Tax, Finance Act, 1994
Demand for disallowance of Cenvat credit in respect of service tax paid on certain services i.e. catering and CHA (export).
927,306 2010-11 and 2012-13
Deputy Commissioner Central excise
Service Tax, Finance Act, 1994
Demand for disallowance of Cenvat credit against outward transportation.
3,209,812 2011- 2015 Commissioner (Appeals), central excise and custom,Pune
The Central Sales Tax Act, 1956
Demand against non- submission of C Forms 3,911,059 From 1997-98 to 2010-11
Joint Sales Tax Commissioner and Sales Tax Appellate Tribunal
Income Tax Act, 1961
Income tax demand on various disallowances 9,20,000 Assessment year 2010-11
Income Tax Appellate Tribunal
Income Tax Act, 1961
Income tax demand on various disallowances 38,49,400 Assessment year 2011-12
Income Tax Appellate Tribunal
Service Tax, Finance Act, 1994
Demand of Propotionate cenvat credit reversal @ 0.6% against providing the exempted services i.e trading
1,088,154 2011-12 to 2014-15 Commissioner Appeals (Pune)
(viii) In our opinion and according to the information and explanations given by the management, the Company has not defaulted in repayment of dues to a financial institution or bank or debentures or any other government dues during the year.
(ix) According to the information and explanations given by the management, the Company has not raised any money way of initial public offer / further public offer / debt instruments and term loans hence, reporting under clause (ix) is not applicable to the Company and hence not commented upon.
(x) Based upon the audit procedures performed for the purpose of reporting the true and fair view of the financial statements and according to the information and explanations given by the management, we report that no fraud by the company or no fraud /material fraud on the company by the officers and employees of the Company has been noticed or reported during the year.
(xi) According to the information and explanations given by the management, the managerial remuneration hasbeen paid / provided in accordance with the requisite approvals mandated by the provisions of section 197 read with Schedule V to the Companies Act, 2013.
(xii) In our opinion, the Company is not a Nidhi company. Therefore, the provisions of clause 3(xii) of the order are not applicable to the Company and hence not commented upon.
(xiii) According to the information and explanations given by the management, transactions with the related parties are in compliance with section 177 and 188
of Companies Act, 2013 where applicable and the details have been disclosed in the notes to the financial statements, as required by the applicable accounting standards.
(xiv) According to the information and explanations given to us and on an overall examination of the balance sheet, the company has not made any preferential allotment or private placement of shares or fully or partly convertible debentures during the year under review and hence, reporting requirements under clause 3(xiv) are not applicable to the company and, not commented upon.
(xv) According to the information and explanations given by the management, the Company has not entered into any non-cash transactions with directors or persons connected with him.
(xvi) According to the information and explanations given to us, the provisions of section 45-IA of the Reserve Bank of India Act, 1934 are not applicable to the Company.
For S.R. Batliboi & CO. LLP Chartered Accountants
ICAI Firm Registration Number: 301003E/E300005
per Vikas MehraPartner
Membership Number: 94421
Place of Signature: New DelhiDate: May 12, 2016

84
To the Members of Lumax Industries Limited
We have audited the internal financial controls over financial reporting of Lumax Industries Limited (“the Company”) as of March 31, 2016 in conjunction with our audit of the standalone financial statements of the Company for the year ended on that date.
Management’s Responsibility for Internal Financial ControlsThe Company’s Management is responsible for establishing and maintaining internal financial controls based on the internal control over financial reporting criteria established by the Company considering the essential components of internal control stated in the Guidance Note on Audit of Internal Financial Controls over Financial Reporting issued by the Institute of Chartered Accountants of India. These responsibilities include the design, implementation and maintenance of adequate internal financial controls that were operating effectively for ensuring the orderly and efficient conduct of its business, including adherence to the Company’s policies, the safeguarding of its assets, the prevention and detection of frauds and errors, the accuracy and completeness of the accounting records, and the timely preparation of reliable financial information, as required under the Companies Act, 2013.
Auditor’s ResponsibilityOur responsibility is to express an opinion on the Company’s internal financial controls over financial reporting based on our audit. We conducted our audit in accordance with the Guidance Note on Audit of Internal Financial Controls Over Financial Reporting (the “Guidance Note”) and the Standards on Auditing as specified under section 143(10) of the Companies Act, 2013, to the extent applicable to an audit of internal financial controls, both applicable to an audit of Internal Financial Controls and, both issued by the Institute of Chartered Accountants of India. Those Standards and the Guidance Note require that we comply with ethical requirements and plan and perform the audit to obtain reasonable assurance about whether adequate internal financial controls over financial reporting was established and maintained and if such controls operated effectively in all material respects.
Our audit involves performing procedures to obtain audit evidence about the adequacy of the internal financial controls system over financial reporting and their operating effectiveness. Our audit of internal financial controls over financial reporting included obtaining an understanding of internal financial controls over financial reporting, assessing the risk that a material weakness exists, and testing and evaluating the design and operating effectiveness of internal control based on the assessed risk. The procedures selected depend on the auditor’s judgement, including the assessment of the risks of material misstatement of the financial statements, whether due to fraud or error.
We believe that the audit evidence we have obtained is sufficient and appropriate to provide a basis for our audit opinion on the internal financial controls system over financial reporting.
Meaning of Internal Financial Controls over Financial Reporting A company’s internal financial control over financial reporting is a process designed to provide reasonable assurance regarding the reliability of financial reporting and the preparation of financial statements for external purposes in accordance with generally accepted accounting principles. A company’s internal financial control over financial reporting includes those policies and procedures that (1) pertain to the maintenance of records that, in reasonable detail, accurately and fairly reflect the transactions and dispositions of the assets of the company; (2) provide reasonable assurance that transactions are recorded as necessary to permit preparation of financial statements in accordance with generally accepted accounting principles, and that receipts and expenditures of the company are being made only in accordance with authorisations of management and directors of the company; and (3) provide reasonable assurance regarding prevention or timely detection of unauthorised acquisition, use, or disposition of the company’s assets that could have a material effect on the financial statements.
Inherent Limitations of Internal Financial Controls over Financial ReportingBecause of the inherent limitations of internal financial controls over financial reporting, including the possibility
ANNEXURE -2 TO THE INDEPENDENT AUDITOR’S REPORT OF EVEN DATE ON THE STANDALONE FINANCIAL STATEMENTS OF LUMAX INDUSTRIES LIMITEDReport on the Internal Financial Controls under Clause (i) of Sub-section 3 of Section 143 of the Companies Act, 2013 (“the Act”)

Lumax Industries Limited | Annual Report 2015-16
85
of collusion or improper management override of controls, material misstatements due to error or fraud may occur and not be detected. Also, projections of any evaluation of the internal financial controls over financial reporting to future periods are subject to the risk that the internal financial control over financial reporting may become inadequate because of changes in conditions, or that the degree of compliance with the policies or procedures may deteriorate.
OpinionIn our opinion, the Company has, in all material respects, an adequate internal financial controls system over financial reporting and such internal financial controls over financial reporting were operating effectively as at March 31, 2016, based on the internal control over financial reporting criteria established by the Company
considering the essential components of internal control stated in the Guidance Note on Audit of Internal Financial Controls Over Financial Reporting issued by the Institute of Chartered Accountants of India.
For S.R. Batliboi & CO. LLP Chartered Accountants
ICAI Firm Registration Number: 301003E/E300005
per Vikas MehraPartner
Membership Number: 94421
Place of Signature: New DelhiDate: May 12, 2016
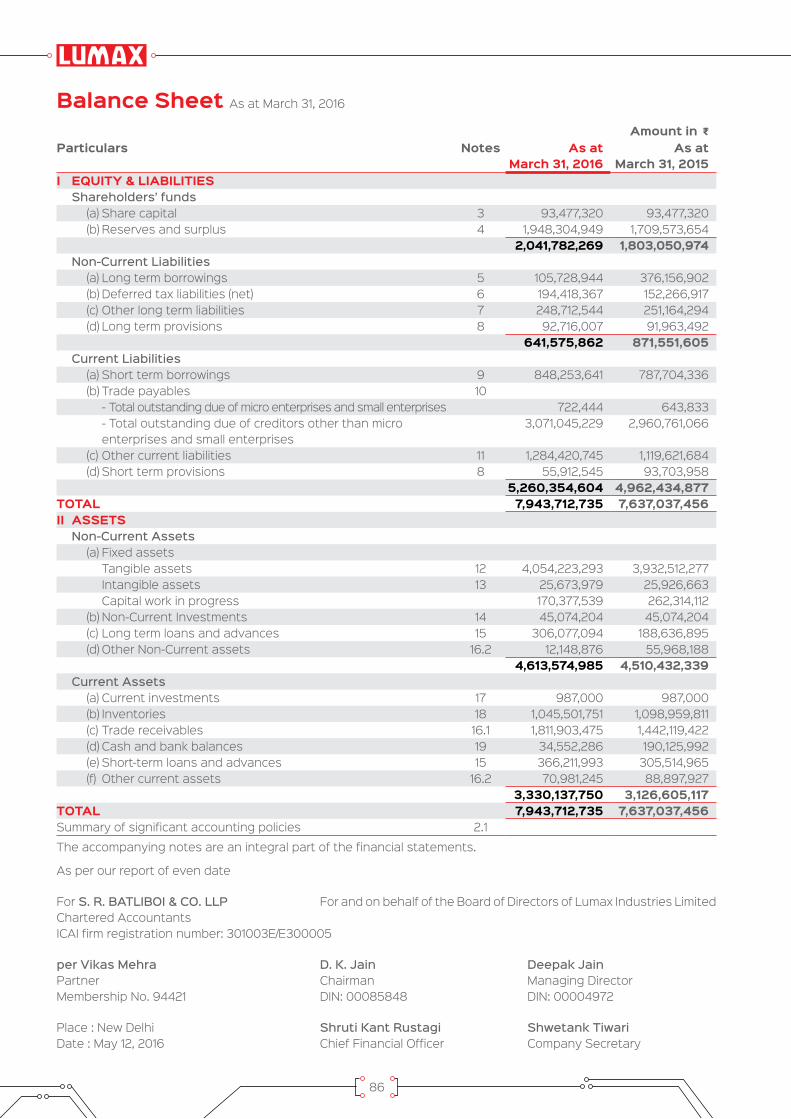
86
Amount in GParticulars Notes As at
March 31, 2016As at
March 31, 2015I EQUITY & LIABILITIES Shareholders’ funds (a) Share capital 3 93,477,320 93,477,320 (b) Reserves and surplus 4 1,948,304,949 1,709,573,654
2,041,782,269 1,803,050,974 Non-Current Liabilities (a) Long term borrowings 5 105,728,944 376,156,902 (b) Deferred tax liabilities (net) 6 194,418,367 152,266,917 (c) Other long term liabilities 7 248,712,544 251,164,294 (d) Long term provisions 8 92,716,007 91,963,492
641,575,862 871,551,605 Current Liabilities (a) Short term borrowings 9 848,253,641 787,704,336 (b) Trade payables 10 - Total outstanding due of micro enterprises and small enterprises 722,444 643,833 - Total outstanding due of creditors other than micro
enterprises and small enterprises 3,071,045,229 2,960,761,066
(c) Other current liabilities 11 1,284,420,745 1,119,621,684 (d) Short term provisions 8 55,912,545 93,703,958
5,260,354,604 4,962,434,877 TOTAL 7,943,712,735 7,637,037,456 II ASSETS Non-Current Assets (a) Fixed assets Tangible assets 12 4,054,223,293 3,932,512,277 Intangible assets 13 25,673,979 25,926,663 Capital work in progress 170,377,539 262,314,112 (b) Non-Current Investments 14 45,074,204 45,074,204 (c) Long term loans and advances 15 306,077,094 188,636,895 (d) Other Non-Current assets 16.2 12,148,876 55,968,188 4,613,574,985 4,510,432,339 Current Assets (a) Current investments 17 987,000 987,000 (b) Inventories 18 1,045,501,751 1,098,959,811 (c) Trade receivables 16.1 1,811,903,475 1,442,119,422 (d) Cash and bank balances 19 34,552,286 190,125,992 (e) Short-term loans and advances 15 366,211,993 305,514,965 (f) Other current assets 16.2 70,981,245 88,897,927
3,330,137,750 3,126,605,117 TOTAL 7,943,712,735 7,637,037,456 Summary of significant accounting policies 2.1
Balance Sheet As at March 31, 2016
The accompanying notes are an integral part of the financial statements.
As per our report of even date
For S. R. BATLIBOI & CO. LLP For and on behalf of the Board of Directors of Lumax Industries LimitedChartered AccountantsICAI firm registration number: 301003E/E300005
per Vikas Mehra D. K. Jain Deepak JainPartner Chairman Managing DirectorMembership No. 94421 DIN: 00085848 DIN: 00004972
Place : New Delhi Shruti Kant Rustagi Shwetank Tiwari Date : May 12, 2016 Chief Financial Officer Company Secretary
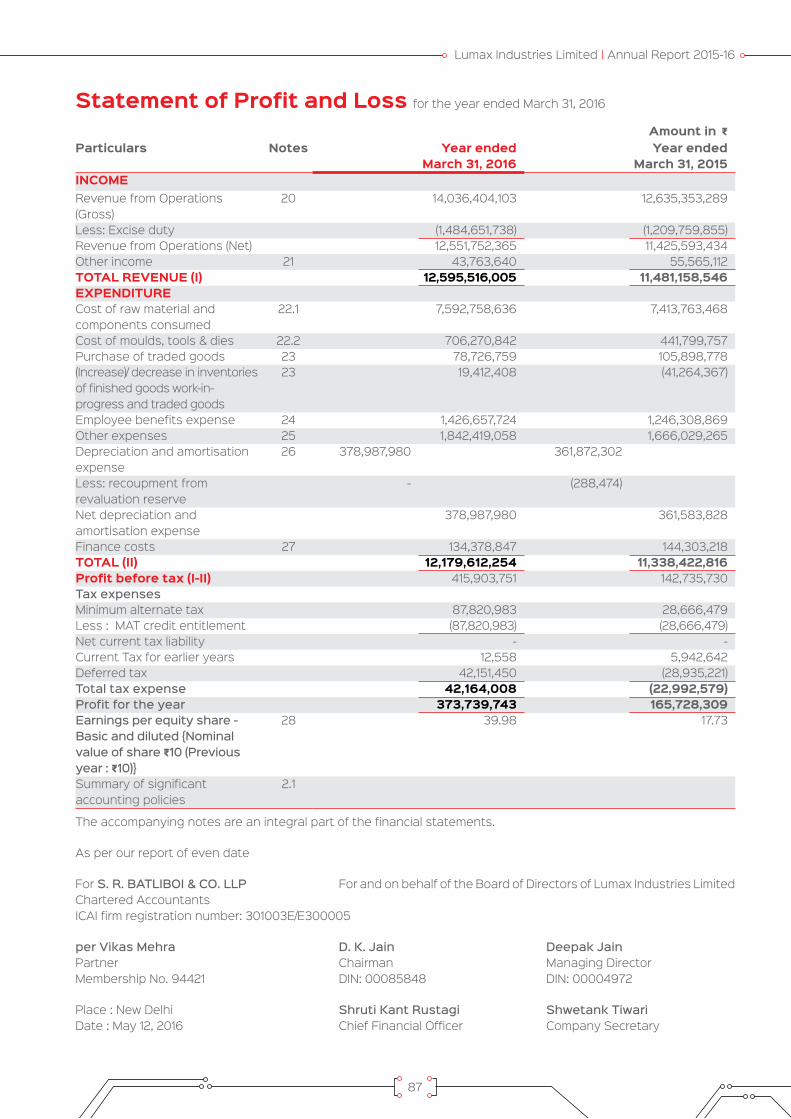
Lumax Industries Limited | Annual Report 2015-16
87
Amount in GParticulars Notes Year ended
March 31, 2016Year ended
March 31, 2015INCOMERevenue from Operations (Gross)
20 14,036,404,103 12,635,353,289
Less: Excise duty (1,484,651,738) (1,209,759,855)Revenue from Operations (Net) 12,551,752,365 11,425,593,434 Other income 21 43,763,640 55,565,112 TOTAL REVENUE (I) 12,595,516,005 11,481,158,546 EXPENDITURECost of raw material and components consumed
22.1 7,592,758,636 7,413,763,468
Cost of moulds, tools & dies 22.2 706,270,842 441,799,757 Purchase of traded goods 23 78,726,759 105,898,778 (Increase)/ decrease in inventories of finished goods work-in-progress and traded goods
23 19,412,408 (41,264,367)
Employee benefits expense 24 1,426,657,724 1,246,308,869 Other expenses 25 1,842,419,058 1,666,029,265 Depreciation and amortisation expense
26 378,987,980 361,872,302
Less: recoupment from revaluation reserve
- (288,474)
Net depreciation and amortisation expense
378,987,980 361,583,828
Finance costs 27 134,378,847 144,303,218 TOTAL (II) 12,179,612,254 11,338,422,816 Profit before tax (I-II) 415,903,751 142,735,730 Tax expensesMinimum alternate tax 87,820,983 28,666,479 Less : MAT credit entitlement (87,820,983) (28,666,479)Net current tax liability - - Current Tax for earlier years 12,558 5,942,642 Deferred tax 42,151,450 (28,935,221)Total tax expense 42,164,008 (22,992,579)Profit for the year 373,739,743 165,728,309 Earnings per equity share - Basic and diluted {Nominal value of share G10 (Previous year : G10)}
28 39.98 17.73
Summary of significant accounting policies
2.1
Statement of Profit and Loss for the year ended March 31, 2016
The accompanying notes are an integral part of the financial statements.
As per our report of even date
For S. R. BATLIBOI & CO. LLP For and on behalf of the Board of Directors of Lumax Industries LimitedChartered AccountantsICAI firm registration number: 301003E/E300005
per Vikas Mehra D. K. Jain Deepak JainPartner Chairman Managing DirectorMembership No. 94421 DIN: 00085848 DIN: 00004972
Place : New Delhi Shruti Kant Rustagi Shwetank Tiwari Date : May 12, 2016 Chief Financial Officer Company Secretary

88
Amount in GParticulars Year ended
March 31, 2016Year ended
March 31, 2015A. Cash flow from operating activities
Profit before tax 415,903,751 142,735,730
Non-cash adjustment to reconcile profit before tax to net cash flows
Depreciation/ amortisation 378,987,980 361,583,828
Provision for doubtful debts / advances 109,901 1,485,348
Loss on sale of fixed assets - 63,456
Profit on sale of fixed assets (1,284,459) -
Provision against diminution in the value of current investments - (422,765)
Unrealised foreign exchange (gain)/ loss 1,877,281 (5,973,504)
Finance cost 134,378,847 144,303,218
Interest income (2,113,612) (11,459,510)
Dividend income (5,206,188) (5,209,820)
Operating profit before working capital changes 922,653,501 627,105,981
Movements in working capital:
Decrease/ (increase) in inventories 53,458,060 (326,824,565)
Decrease/ (increase) in trade receivables (371,891,787) (135,059,381)
Decrease/ (increase) in loans and advances (65,507,093) 61,449,223
Decrease/ (increase) in other current assets - 77,554,555
Increase/ (decrease) in liabilities and provisions 413,963,328 290,900,997
Cash generated from operations 952,676,009 595,126,810
Direct taxes paid 81,152,115 4,670,211
Net cash flow from operating activities (A) 871,523,894 590,456,599
B. Cash flow from investing activities
Purchase of fixed assets (457,464,163) (455,492,105)
Proceeds from sales of fixed assets 18,748,306 784,071
Interest received 1,783,419 20,286,959
Dividends received 5,206,188 5,209,820
Redemption/ maturity of bank deposits (having original maturity of more than three months)
7,258,876 132,812,959
Net cash flow used in investing activities (B) (424,467,374) (296,398,296)
Cash Flow for the year ended March 31, 2016
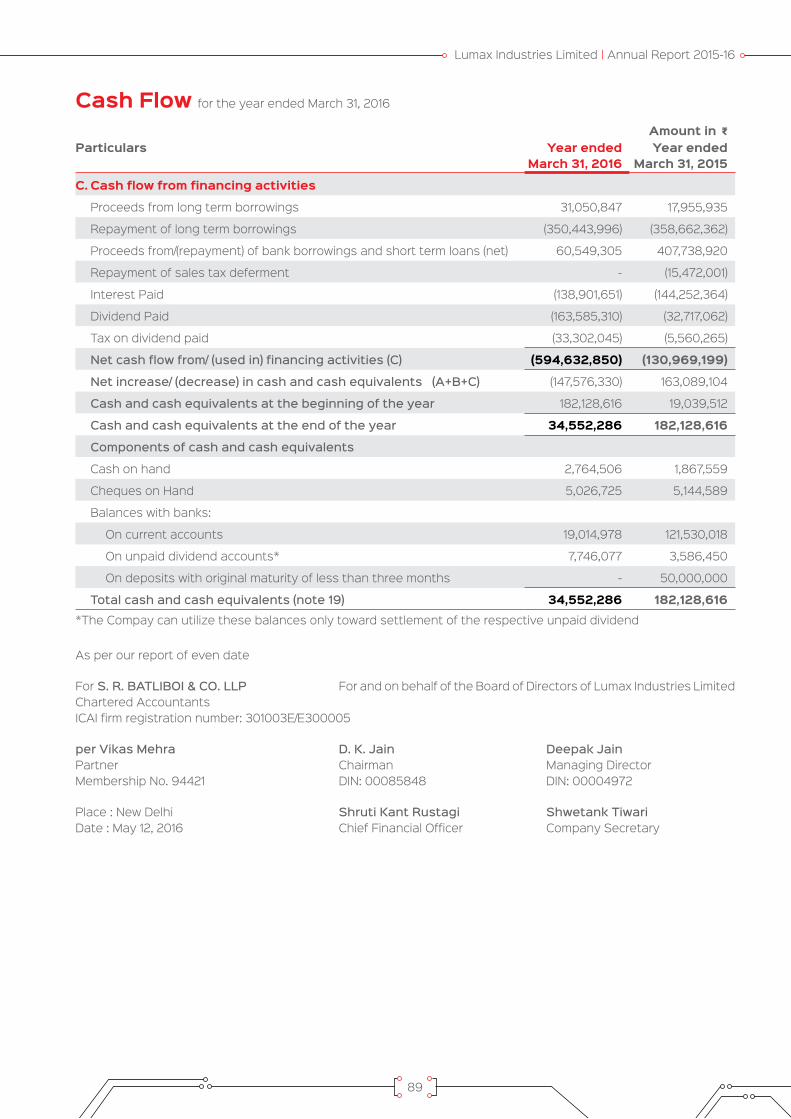
Lumax Industries Limited | Annual Report 2015-16
89
Cash Flow for the year ended March 31, 2016
As per our report of even date
For S. R. BATLIBOI & CO. LLP For and on behalf of the Board of Directors of Lumax Industries LimitedChartered AccountantsICAI firm registration number: 301003E/E300005
per Vikas Mehra D. K. Jain Deepak JainPartner Chairman Managing DirectorMembership No. 94421 DIN: 00085848 DIN: 00004972
Place : New Delhi Shruti Kant Rustagi Shwetank Tiwari Date : May 12, 2016 Chief Financial Officer Company Secretary
Amount in GParticulars Year ended
March 31, 2016Year ended
March 31, 2015
C. Cash flow from financing activities
Proceeds from long term borrowings 31,050,847 17,955,935
Repayment of long term borrowings (350,443,996) (358,662,362)
Proceeds from/(repayment) of bank borrowings and short term loans (net) 60,549,305 407,738,920
Repayment of sales tax deferment - (15,472,001)
Interest Paid (138,901,651) (144,252,364)
Dividend Paid (163,585,310) (32,717,062)
Tax on dividend paid (33,302,045) (5,560,265)
Net cash flow from/ (used in) financing activities (C) (594,632,850) (130,969,199)
Net increase/ (decrease) in cash and cash equivalents (A+B+C) (147,576,330) 163,089,104
Cash and cash equivalents at the beginning of the year 182,128,616 19,039,512
Cash and cash equivalents at the end of the year 34,552,286 182,128,616
Components of cash and cash equivalents
Cash on hand 2,764,506 1,867,559
Cheques on Hand 5,026,725 5,144,589
Balances with banks:
On current accounts 19,014,978 121,530,018
On unpaid dividend accounts* 7,746,077 3,586,450
On deposits with original maturity of less than three months - 50,000,000
Total cash and cash equivalents (note 19) 34,552,286 182,128,616 *The Compay can utilize these balances only toward settlement of the respective unpaid dividend

90
1. Corporate Information Lumax Industries Limited (‘the Company’) is a leading
manufacturer and supplier of auto components, mainly automotive lighting systems for four wheeler and two wheeler applications. The Company has technical as well as financial collaboration with Stanley Electric Co. Ltd., Japan. Its shares are listed on two exchanges in India.
2. Basis of preparation The financial statements of the Company have
been prepared and presented in accordance with generally accepted accounting principles in India (Indian GAAP). The Company has prepared these financial statements to comply with all material respects with the accounting standards specified under section 133 of the Companies Act, 2013, read together with paragraph 7 of the Companies (Accounts) Rules, 2014. The financial statements have been prepared on an accrual basis and under the historical cost convention. The accounting policies adopted in the preparation of financial statements are consistent with those of previous year.
2.1 Summary of significant accounting policies a. Use of estimates The preparation of financial statements are
in conformity with Indian GAAP requires the management to make judgments, estimates and assumptions that affect the reported amounts of assets, liabilities, revenue and expenses during the reported period. Although these estimates are based on the management’s best knowledge of current events and actions, uncertainty about these assumptions and estimates could result in the outcomes requiring a material adjustment to the carrying amounts of assets, liabilities, revenue and expenses in future periods. Changes in estimates are reflected in the financial statements in the period in which changes are made and if material, their effects are disclosed in notes to accounts.
b. Tangible Fixed Assets Fixed assets, are stated at cost (or re-
valued amounts, as the case may be), net of accumulated depreciation and accumulated impairment losses, if any. The cost comprises purchase price, borrowing costs if capitalization criteria are met and directly attributable cost of bringing the asset to its working condition for the intended use. Any trade discounts and rebates are deducted in arriving at the purchase price.
The Company has revalued some of the Land, Building and Plant & Machinery existing on
different dates. These Land, Building and Plant & Machinery are measured at fair value less accumulated depreciation and impairment losses, if any, recognised after the date of the revaluation. In case of revaluation of fixed assets, any revaluation surplus is credited to the revaluation reserve, except to the extent that it reverses a revaluation decrease of the same asset previously recognized in the statement of profit and loss, in which case the increase is recognized in the statement of profit and loss. A revaluation deficit is recognized in the statement of profit and loss, except to the extent that it offsets an existing surplus on the same asset recognized in the asset revaluation reserve.
Subsequent expenditure related to an item of fixed asset is added to its book value only if it increases the future benefits from the existing asset beyond its previously assessed standard of performance. All other expenses on existing fixed assets, including day-to-day repair and maintenance expenditure and cost of replacing parts, are charged to the statement of profit and loss for the period during which such expenses are incurred.
Gains or losses arising from the de-recognition of fixed assets are measured as the difference between the net disposal proceeds and the carrying amount of the asset and are recognized in the statement of profit and loss when the asset is derecognized.
c. Depreciation on Tangible fixed assets Leasehold land is amortized over the period of
lease ranging from 90 years to 99 years.
Depreciation on other fixed assets is calculated on a straight line basis using rates arrived at based on the useful lives estimated by the management. The Company has used following estimated useful life to provide depreciation on its fixed assets:
Particulars Estimated useful life (Years)
-Factory building 30-Other building 60-Plant and Machinery (i, ii) 3-21-Furniture and fixtures 10-Vehicles (ii) 5-Office equipment 5
i) The management has estimated supported by independent assessment, the useful life of certain plant and machinery as 21 years, which is higher than those indicated in schedule II of the Companies Act 2013.
Notes to financial Statements for the year ended March 31, 2016
Lumax Industries Limited | Annual Report 2015-16
91
Notes to financial Statements for the year ended March 31, 2016
ii) The management has estimated, based on past experience, the useful life of these blocks of assets as lower than the life indicated for respective block of assets in schedule II of the Companies Act 2013.
d. Intangible Assets Intangible assets acquired separately are
measured on initial recognition at cost. Following initial recognition, intangible assets are carried at cost less accumulated amortization and accumulated impairment losses, if any. Internally generated intangible assets, excluding capitalized development costs, are not capitalized and expenditure is reflected in the statement of profit and loss in the year in which the expenditure is incurred.
Intangibles assets are amortized using straight-line method over their estimated useful lives as follows:Intangible Assets
Estimated Useful Life (Years)
Computer Software
Over the estimated economic useful lives ranging from 3.5 to 4 years
Technical Know-how
Over the period of Technical Assistance Agreement i.e. 8 years
Gains or losses arising from de-recognition of an intangible asset are measured as the difference between the net disposal proceeds and the carrying amount of the asset and are recognized in the statement of profit and loss when the asset is derecognized.
e. Research costs Research costs are expensed as incurred.
f. Leases Where the Company is the lessee
Finance leases, which effectively transfer to the Company substantially all the risks and benefits incidental to ownership of the leased item, are capitalized at the lower of the fair value of leased property and present value of the minimum lease payments at the inception of the lease term and disclosed as leased assets.
Lease payments are apportioned between the finance charges and reduction of the lease liability so as to achieve a constant rate of interest on the remaining balance of the liability. Finance charges are recognized as finance costs in the statement of profit and loss. Lease management fees, legal charges and other initial direct costs are capitalised.
A leased asset is depreciated on a straight-
line basis over the useful life of the asset. However, if there is no reasonable certainty that the Company will obtain the ownership by the end of the lease term, the capitalized asset is depreciated on a straight-line basis over the shorter of the estimated useful life of the asset or the lease term.
Leases, where the lessor effectively retains substantially all the risks and benefits of ownership of the leased item are classified as operating leases. Operating lease payments are recognized as an expense in the statement of profit and loss on a straight-line basis over the lease term.
Where the Company is the lessor
Leases in which the Company transfers substantially all the risks and benefits of ownership of the asset are classified as finance leases. Assets given under finance lease are recognized as a receivable at an amount equal to the net investment in the lease. After initial recognition, the Company apportions lease rentals between the principal repayment and interest income so as to achieve a constant periodic rate of return on the net investment outstanding in respect of the finance lease. The interest income is recognized in the statement of profit and loss. Initial direct costs such as legal costs, brokerage costs, etc. are recognized immediately in the statement of profit and loss.
Leases in which the Company does not transfer substantially all the risks and benefits of ownership of the asset are classified as operating leases. Assets subject to operating leases are included in fixed assets. Lease income on an operating lease is recognized in the statement of profit and loss on a straight-line basis over the lease term. Costs, including depreciation, are recognized as an expense in the statement of profit and loss. Initial direct costs such as legal costs, brokerage costs, etc. are recognized immediately in the statement of profit and loss.
g. Borrowing costs Borrowing cost includes interest, amortization
of ancillary costs incurred in connection with the arrangement of borrowings and exchange differences arising from foreign currency borrowings to the extent they are regarded as an adjustment to the interest cost.
Borrowing costs directly attributable to the acquisition, construction or production of an asset that necessarily takes a substantial period of time to get ready for its intended use or sale are capitalized as part of the cost of the
92
Notes to financial Statements for the year ended March 31, 2016
respective asset. All other borrowing costs are expensed in the period they occur.
h. Government Grant and subsidies Grants and subsidies from the government are
recognized when there is reasonable assurance that (i) the Company will comply with the conditions attached to them, and (ii) the grant/subsidy will be received.
When the grant or subsidy relates to revenue, it is recognized as income on a systematic basis in the statement of profit and loss over the periods necessary to match them with the related costs, which they are intended to compensate. Where the grant relates to an asset, the grant is shown as a deduction from the gross value of the asset concerned in arriving at its book value. The grant is thus recognised in the statement of profit and loss over the useful life of a depreciable asset by way of a reduced depreciation charge.
i. Impairment of tangible and intangible assets The Company assesses at each reporting date
whether there is an indication that an asset may be impaired. If any indication exists, or when annual impairment testing for an asset is required, the Company estimates the asset’s recoverable amount. An asset’s recoverable amount is the higher of an asset’s or cash-generating unit’s (CGU) net selling price and its value in use. The recoverable amount is determined for an individual asset, unless the asset does not generate cash inflows that are largely independent of those from other assets or groups of assets. Where the carrying amount of an asset or CGU exceeds its recoverable amount, the asset is considered impaired and is written down to its recoverable amount.
Impairment losses of continuing operations, including impairment on inventories, are recognized in the statement of profit and loss, except for previously revalued tangible fixed assets, where the revaluation was taken to revaluation reserve. In this case, the impairment is also recognized in the revaluation reserve up to the amount of any previous revaluation.
After impairment, depreciation is provided on the revised carrying amount of the asset over its remaining useful life.
An assessment is made at each reporting date as to whether there is any indication that previously recognized impairment losses may no longer exist or may have decreased. If such indication exists, the company estimates the asset’s or cash-generating unit’s recoverable amount. A previously recognized impairment loss is reversed only if there has been a change in the assumptions used to determine the asset’s recoverable amount since the last impairment loss was recognized. The reversal is limited so that the carrying amount of the asset does not exceed its recoverable amount, nor exceed the carrying amount that would have been determined, net of depreciation, had no impairment loss been recognized for the asset in prior years. Such reversal is recognized in the statement of profit and loss unless the asset is carried at a revalued amount, in which case the reversal is treated as a revaluation increase.
j. Investments Investments, which are readily realizable and
intended to be held for not more than one year from the date on which such investments are made, are classified as current investments. All other investments are classified as long-term investments.
On initial recognition, all investments are measured at cost. The cost comprises purchase price and directly attributable acquisition charges such as brokerage, fees and duties. If an investment is acquired, or partly acquired, by the issue of shares or other securities, the acquisition cost is the fair value of the securities issued.
Current investments are carried in the financial statements at lower of cost and fair value determined on an individual investment basis. Long-term investments are carried at cost. However, provision for diminution in value is made to recognize a decline other than temporary in the value of the investments.
On disposal of an investment, the difference between its carrying amount and net disposal proceeds is charged or credited to the statement of profit and loss.
Lumax Industries Limited | Annual Report 2015-16
93
Notes to financial Statements for the year ended March 31, 2016
k. Inventories Inventories are valued as follows:
Raw materials and components, Stores and spares (including packing materials)
At Cost and Net Realizable Value, whichever is lower. However, materials and other items held for use in the production of inventories are not written down below cost if the finished products in which they will be incorporated are expected to be sold at or above cost.
Cost is determined on moving weighted average basis. Cost of raw materials and components lying in bonded warehouse includes custom duty accounted for on accrual basis.
Finished goods &Traded goods, Work-in-progress and Moulds, tools and dies in process
At Cost and Net Realizable Value, whichever is lower. Cost of Finished goods and Work-in-progress (including moulds, tools and dies in process) includes direct materials, labour and a proportion of manufacturing overheads based on normal operating capacity. Cost of traded goods includes cost of purchase and other costs incurred in bringing the inventories to their present location and condition. Cost is determined on moving weighted average basis. Cost of finished goods includes excise duty.
Scrap At net realizable value.
Net realizable value is the estimated selling price in the ordinary course of business, less estimated costs of completion and to make the sale.
l. Revenue Recognition Revenue is recognized to the extent that it
is probable that the economic benefits will flow to the Company and the revenue can be reliably measured. The following specific recognition criteria must be met before revenue is recognised.
Sale of goods Revenue from sale of Goods is recognised when
the significant risks and rewards of ownership of the goods have passed to the buyer usually on delivery of Goods to the customer. The Company collects sales taxes and value added taxes (VAT) on behalf of the government and, therefore, these are not economic benefits flowing to the Company. Hence, they are excluded from revenue. Excise duty deducted from revenue (gross) is the amount that is included in the revenue (gross) and not the entire amount of liability arising during the year.
Sale of services Revenues from service contracts are recognized
as and when services are rendered. The Company collects service tax on behalf of the government and, therefore, it is not an economic benefit flowing to the Company. Hence, it is excluded from revenue.
Interest Interest income is recognized on a time
proportion basis taking into account the amount outstanding and the applicable interest rate.
Interest income is included under the head “other income” in the statement of profit and loss.
Dividends Dividend income is recognized when the
Company’s right to receive dividend is established by the reporting date.
m. Foreign Currency Translation Foreign currency transactions
i. Initial Recognition Foreign currency transactions are recorded
in the reporting currency, by applying to the foreign currency amount the exchange rate between the reporting currency and the foreign currency at the date of the transaction.
ii. Conversion Foreign currency monetary items are
reported using the closing rate. Non-monetary items which are carried in terms of historical cost denominated in a foreign currency are reported using the exchange rate at the date of the transaction.
iii. Exchange Differences Exchange differences arising on the
settlement of monetary items or on reinstatement of monetary items at rates different from those at which they were initially recorded during the year, or reported in previous financial statements, are recognised as income or as expenses.
94
Notes to financial Statements for the year ended March 31, 2016
iv. Forward exchange contracts entered into to hedge foreign currency risk of an existing asset/ liability
The premium or discount arising at the inception of forward exchange contracts is amortised as expense or income over the life of the contract. Exchange differences on such contracts are recognized in the statement of profit and loss in the year in which the exchange rates change. Any profit or loss arising on cancellation or renewal of forward exchange contract is recognized as income or as expense for the period.
n. Retirement and other Employee Benefits i. Retirement benefit in the form of provident
fund is a defined contribution scheme. The company has no obligation, other than the contribution payable to the provident fund. The company recognizes contribution payable to the provident fund scheme as expenditure, when an employee renders the related service.
ii. Gratuity Liability is a defined benefit plan and is provided for on the basis of an actuarial valuation on projected unit credit method made at the end of each financial year.
Actuarial gain and loss for defined benefit plan is recognized in full in the period in which it occur in the statement of profit and loss.
iii. Accumulated leave, which is expected to be utilized within the next 12 months, is treated as short-term employee benefit. The Company measures the expected cost of such absences as the additional amount that it expects to pay as a result of the unused entitlement that has accumulated at the reporting date.
iv. The Company treats accumulated leave expected to be carried forward beyond twelve months, as long-term employee benefit for measurement purposes. Such long-term compensated absences are provided for based on the actuarial valuation using the projected unit credit method at the year-end. Actuarial gains/losses are immediately taken to the statement of profit and loss and are not deferred.
v. Retirement benefit in the form of “Lumax Industries Limited Employees Superannuation Scheme” administered by the trustees is a defined contribution scheme. The contribution for the scheme is
charged to the statement of profit and loss for the year when the contributions are due. The Company has no obligation, other than the contribution payable to the scheme.
o. Income Taxes Tax expense comprises current and deferred tax.
Current income-tax is measured at the amount expected to be paid to the tax authorities in accordance with the Income-tax Act, 1961 enacted in India and tax laws prevailing in the respective tax jurisdictions where the Company operates. The tax rates and tax laws used to compute the amount are those that are enacted or substantively enacted, at the reporting date. Current income tax relating to items recognized directly in equity is recognized in equity and not in the statement of profit and loss.
Deferred income taxes reflect the impact of timing differences between taxable income and accounting income originating during the current year and reversal of timing differences for the earlier years. Deferred tax is measured using the tax rates and the tax laws enacted or substantively enacted at the reporting date. Deferred income tax relating to items recognized directly in equity is recognized in equity and not in the statement of profit and loss.
Deferred tax liabilities are recognized for all taxable timing differences. Deferred tax assets are recognized for deductible timing differences only to the extent that there is reasonable certainty that sufficient future taxable income will be available against which such deferred tax assets can be realized. In situations where the Company has unabsorbed depreciation or carry forward tax losses, all deferred tax assets are recognized only if there is virtual certainty supported by convincing evidence that they can be realized against future taxable profits.
In the situations where the Company is entitled to a tax holiday under the Income-tax Act, 1961 enacted in India or tax laws prevailing in the respective tax jurisdictions where it operates, no deferred tax (asset or liability) is recognized in respect of timing differences which reverse during the tax holiday period, to the extent the Company’s gross total income is subject to the deduction during the tax holiday period. Deferred tax in respect of timing differences which reverse after the tax holiday period is recognized in the year in which the timing differences originate. However, the Company restricts recognition of deferred tax assets to the extent that it has become reasonably certain or virtually certain, as the case may be, that

Lumax Industries Limited | Annual Report 2015-16
95
Notes to financial Statements for the year ended March 31, 2016
sufficient future taxable income will be available against which such deferred tax assets can be realized. For recognition of deferred taxes, the timing differences which originate first are considered to reverse first.
At each reporting date, the Company re-assesses unrecognized deferred tax assets. It recognizes unrecognized deferred tax asset to the extent that it has become reasonably certain or virtually certain, as the case may be, that sufficient future taxable income will be available against which such deferred tax assets can be realized.
The carrying amount of deferred tax assets are reviewed at each reporting date. The Company writes-down the carrying amount of deferred tax asset to the extent that it is no longer reasonably certain or virtually certain, as the case may be, that sufficient future taxable income will be available against which deferred tax assets can be realized. Any such write-down is reversed to the extent that it becomes reasonably certain or virtually certain, as the case may be, that sufficient future taxable income will be available
Deferred tax assets and deferred tax liabilities are offset, if a legally enforceable right exists to set-off current tax assets against current tax liabilities and the deferred tax assets and deferred taxes relate to the same taxable entity and the same taxation authority.
Minimum alternate tax (MAT) paid in a year is charged to the statement of profit and loss as current tax. The Company recognizes MAT credit available as an asset only to the extent that there is convincing evidence that the Company will pay normal income tax during the specified period, i.e., the period for which MAT credit is allowed to be carried forward. In the year in which the Company recognizes MAT credit as an asset in accordance with the Guidance Note on Accounting for Credit Available in respect of Minimum Alternative Tax under the Income-tax Act, 1961, the said asset is created by way of credit to the statement of profit and loss and shown as “MAT Credit Entitlement.” The Company reviews the “MAT credit entitlement” asset at each reporting date and writes down the asset to the extent the Company does not have convincing evidence that it will pay normal tax during the specified period.
p. Segment Reporting Policies Business Segment The Company is engaged in the business of
manufacture of various types of Automotive Lighting Equipment. The entire operations are
governed by the same set of risks and return hence the entire operations represent a single primary segment.
Geographical Segment The analysis of geographical segments is
based on the geographical location of the customers i.e. customers located within India and customers located outside India.
q. Earnings per share Basic earnings per share are calculated by
dividing the net profit or loss for the period attributable to equity shareholders by the weighted average number of equity shares outstanding during the period.
For the purpose of calculating diluted earnings per equity share, the net profit or loss for the period attributable to equity shareholders and the weighted average number of shares outstanding during the period are adjusted for the effects of all dilutive potential equity shares.
r. Provisions A provision is recognised when an enterprise
has a present obligation as a result of past event and it is probable that an outflow of resources will be required to settle the obligation, in respect of which a reliable estimate can be made. Provisions are not discounted to its present value and are determined based on best management estimate required to settle the obligation at the balance sheet date. These are reviewed at each balance sheet date and adjusted to reflect the current best management estimates.
Warranty provisions Provisions for warranty-related costs are
recognized when the product is sold or service provided. Provision is based on historical experience. The estimate of such warranty-related costs is revised annually.
s. Contingent liabilities A contingent liability is a possible obligation that
arises from past events whose existence will be confirmed by the occurrence or non-occurrence of one or more uncertain future events beyond the control of the Company or a present obligation that is not recognized because it is not probable that an outflow of resources will be required to settle the obligation. A contingent liability also arises in extremely rare cases where there is a liability that cannot be recognized because it cannot be measured reliably. The Company does not recognize a contingent liability but discloses its existence in the financial statements.

96
Notes to financial Statements for the year ended March 31, 2016
t. Cash and Cash equivalents Cash and cash equivalents in the cash flow
statement comprise cash at bank and in hand and short- term investments with an original maturity of three months or less.
u. Derivative instruments In accordance with the ICAI announcement,
derivative contracts, other than foreign currency
forward contracts covered under AS 11, are marked to market on a portfolio basis, and the net loss, if any, after considering the offsetting effect of gain on the underlying hedged item, is charged to the statement of profit and loss. Net gain, if any, after considering the offsetting effect of loss on the underlying hedged item, is ignored.
Amount in GParticulars As at
March 31, 2016As at
March 31, 2015Authorized shares12,000,000 (Previous year 12,000,000) equity shares of H10/- each 120,000,000 120,000,000 Issued, subscribed and fully paid up shares9,347,732 (Previous year 9,347,732) equity shares of H10/- each 93,477,320 93,477,320
Particulars As at March 31, 2016 As at March 31, 2015Nos. Amount in G Nos. Amount in G
At the beginning of the year 9,347,732 93,477,320 9,347,732 93,477,320 Issued during the year - - - - Outstanding at the end of the year 9,347,732 93,477,320 9,347,732 93,477,320
Amount in GParticulars As at March 31, 2016 As at March 31, 2015
Nos. % holding in the class
Nos. % holding in the class
Equity shares of H10 each fully paidStanley Electric Co. Limited 3,343,381 35.77% 3,343,381 35.77%Dhanesh Kumar Jain 1,938,025 20.73% 1,938,025 20.73%Lumax Auto Technologies Limited 525,000 5.62% 525,000 5.62%
3. Share Capital
a. Reconciliation of shares outstanding at the beginning and at the end of the reporting year
c Details of shareholders holding more than 5% shares in the Company
b Terms/rights attached to equity shares The Company has only one class of equity shares having a par value of H10 per share. Each holder of equity
shares is entitled to one vote per share. The Company declares and pays dividends in Indian rupees.
During the year ended March 31, 2016, the Company declared and paid an interim dividend of H12 per share which is considered to be final (Previous year dividend: H5.50).
In the event of liquidation of the Company, the holders of equity shares will be entitled to receive remaining assets of the Company, after distribution of all preferential amounts. The distribution will be in proportion to the number of equity shares held by the shareholders.
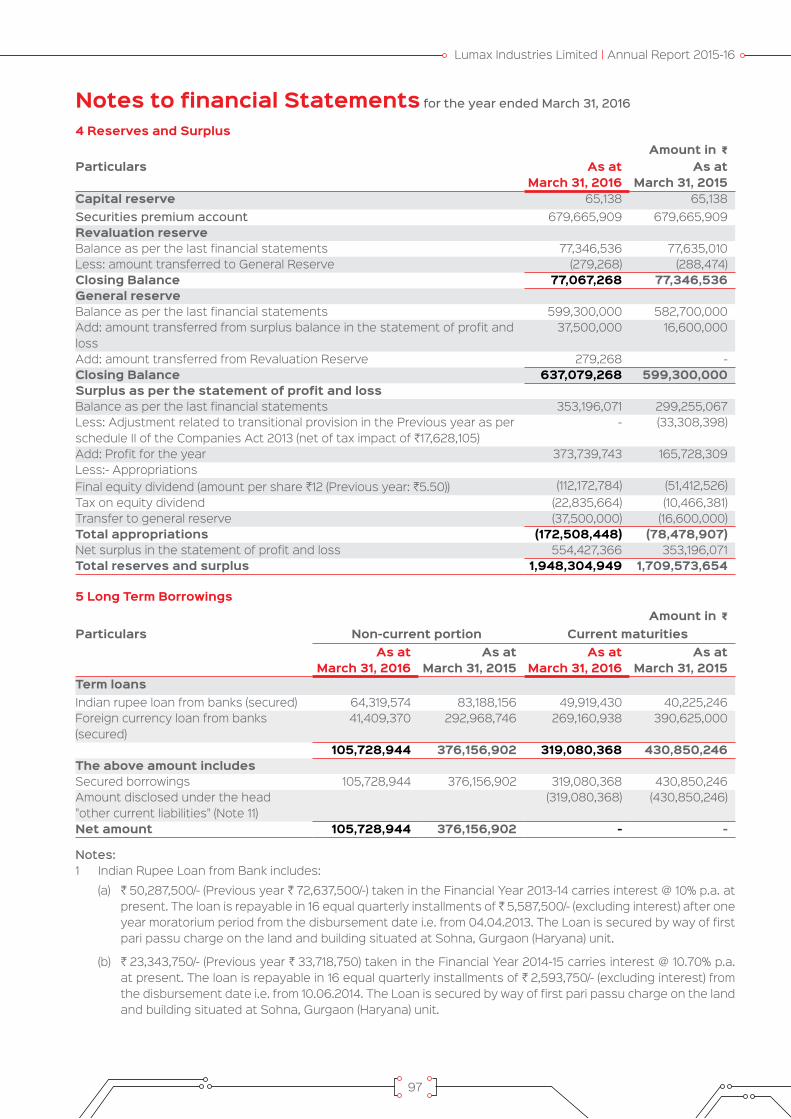
Lumax Industries Limited | Annual Report 2015-16
97
Notes to financial Statements for the year ended March 31, 2016
Amount in GParticulars As at
March 31, 2016As at
March 31, 2015Capital reserve 65,138 65,138 Securities premium account 679,665,909 679,665,909Revaluation reserveBalance as per the last financial statements 77,346,536 77,635,010 Less: amount transferred to General Reserve (279,268) (288,474)Closing Balance 77,067,268 77,346,536 General reserveBalance as per the last financial statements 599,300,000 582,700,000 Add: amount transferred from surplus balance in the statement of profit and loss
37,500,000 16,600,000
Add: amount transferred from Revaluation Reserve 279,268 - Closing Balance 637,079,268 599,300,000 Surplus as per the statement of profit and lossBalance as per the last financial statements 353,196,071 299,255,067 Less: Adjustment related to transitional provision in the Previous year as per schedule II of the Companies Act 2013 (net of tax impact of H17,628,105)
- (33,308,398)
Add: Profit for the year 373,739,743 165,728,309 Less:- AppropriationsFinal equity dividend (amount per share H12 (Previous year: H5.50)) (112,172,784) (51,412,526)Tax on equity dividend (22,835,664) (10,466,381)Transfer to general reserve (37,500,000) (16,600,000)Total appropriations (172,508,448) (78,478,907)Net surplus in the statement of profit and loss 554,427,366 353,196,071 Total reserves and surplus 1,948,304,949 1,709,573,654
Amount in GParticulars Non-current portion Current maturities
As at March 31, 2016
As at March 31, 2015
As at March 31, 2016
As at March 31, 2015
Term loansIndian rupee loan from banks (secured) 64,319,574 83,188,156 49,919,430 40,225,246 Foreign currency loan from banks (secured)
41,409,370 292,968,746 269,160,938 390,625,000
105,728,944 376,156,902 319,080,368 430,850,246The above amount includesSecured borrowings 105,728,944 376,156,902 319,080,368 430,850,246 Amount disclosed under the head "other current liabilities" (Note 11)
(319,080,368) (430,850,246)
Net amount 105,728,944 376,156,902 - -
4 Reserves and Surplus
5 Long Term Borrowings
Notes:1 Indian Rupee Loan from Bank includes:
(a) H 50,287,500/- (Previous year H 72,637,500/-) taken in the Financial Year 2013-14 carries interest @ 10% p.a. at present. The loan is repayable in 16 equal quarterly installments of H 5,587,500/- (excluding interest) after one year moratorium period from the disbursement date i.e. from 04.04.2013. The Loan is secured by way of first pari passu charge on the land and building situated at Sohna, Gurgaon (Haryana) unit.
(b) H 23,343,750/- (Previous year H 33,718,750) taken in the Financial Year 2014-15 carries interest @ 10.70% p.a. at present. The loan is repayable in 16 equal quarterly installments of H 2,593,750/- (excluding interest) from the disbursement date i.e. from 10.06.2014. The Loan is secured by way of first pari passu charge on the land and building situated at Sohna, Gurgaon (Haryana) unit.
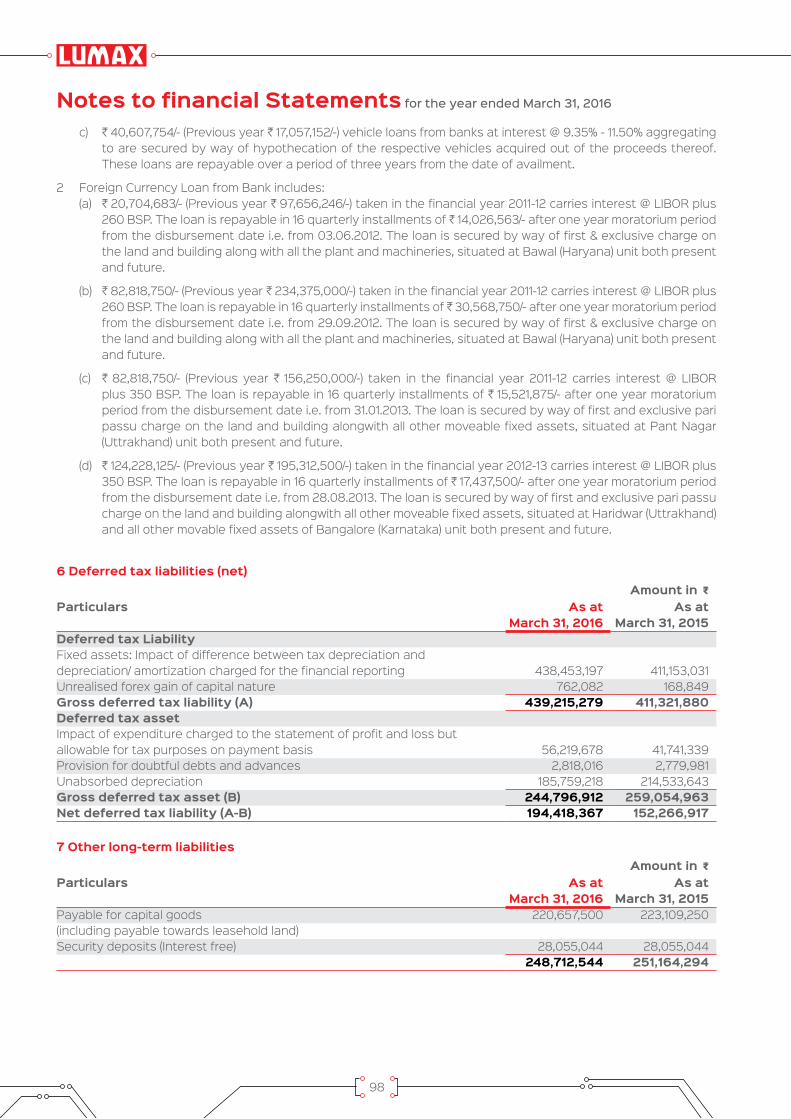
98
Notes to financial Statements for the year ended March 31, 2016
c) H 40,607,754/- (Previous year H 17,057,152/-) vehicle loans from banks at interest @ 9.35% - 11.50% aggregating to are secured by way of hypothecation of the respective vehicles acquired out of the proceeds thereof. These loans are repayable over a period of three years from the date of availment.
2 Foreign Currency Loan from Bank includes: (a) H 20,704,683/- (Previous year H 97,656,246/-) taken in the financial year 2011-12 carries interest @ LIBOR plus
260 BSP. The loan is repayable in 16 quarterly installments of H 14,026,563/- after one year moratorium period from the disbursement date i.e. from 03.06.2012. The loan is secured by way of first & exclusive charge on the land and building along with all the plant and machineries, situated at Bawal (Haryana) unit both present and future.
(b) H 82,818,750/- (Previous year H 234,375,000/-) taken in the financial year 2011-12 carries interest @ LIBOR plus 260 BSP. The loan is repayable in 16 quarterly installments of H 30,568,750/- after one year moratorium period from the disbursement date i.e. from 29.09.2012. The loan is secured by way of first & exclusive charge on the land and building along with all the plant and machineries, situated at Bawal (Haryana) unit both present and future.
(c) H 82,818,750/- (Previous year H 156,250,000/-) taken in the financial year 2011-12 carries interest @ LIBOR plus 350 BSP. The loan is repayable in 16 quarterly installments of H 15,521,875/- after one year moratorium period from the disbursement date i.e. from 31.01.2013. The loan is secured by way of first and exclusive pari passu charge on the land and building alongwith all other moveable fixed assets, situated at Pant Nagar (Uttrakhand) unit both present and future.
(d) H 124,228,125/- (Previous year H 195,312,500/-) taken in the financial year 2012-13 carries interest @ LIBOR plus 350 BSP. The loan is repayable in 16 quarterly installments of H 17,437,500/- after one year moratorium period from the disbursement date i.e. from 28.08.2013. The loan is secured by way of first and exclusive pari passu charge on the land and building alongwith all other moveable fixed assets, situated at Haridwar (Uttrakhand) and all other movable fixed assets of Bangalore (Karnataka) unit both present and future.
Amount in GParticulars As at
March 31, 2016As at
March 31, 2015Deferred tax LiabilityFixed assets: Impact of difference between tax depreciation and depreciation/ amortization charged for the financial reporting 438,453,197 411,153,031 Unrealised forex gain of capital nature 762,082 168,849 Gross deferred tax liability (A) 439,215,279 411,321,880 Deferred tax assetImpact of expenditure charged to the statement of profit and loss but allowable for tax purposes on payment basis 56,219,678 41,741,339 Provision for doubtful debts and advances 2,818,016 2,779,981 Unabsorbed depreciation 185,759,218 214,533,643 Gross deferred tax asset (B) 244,796,912 259,054,963 Net deferred tax liability (A-B) 194,418,367 152,266,917
Amount in GParticulars As at
March 31, 2016As at
March 31, 2015Payable for capital goods 220,657,500 223,109,250 (including payable towards leasehold land)Security deposits (Interest free) 28,055,044 28,055,044
248,712,544 251,164,294
6 Deferred tax liabilities (net)
7 Other long-term liabilities
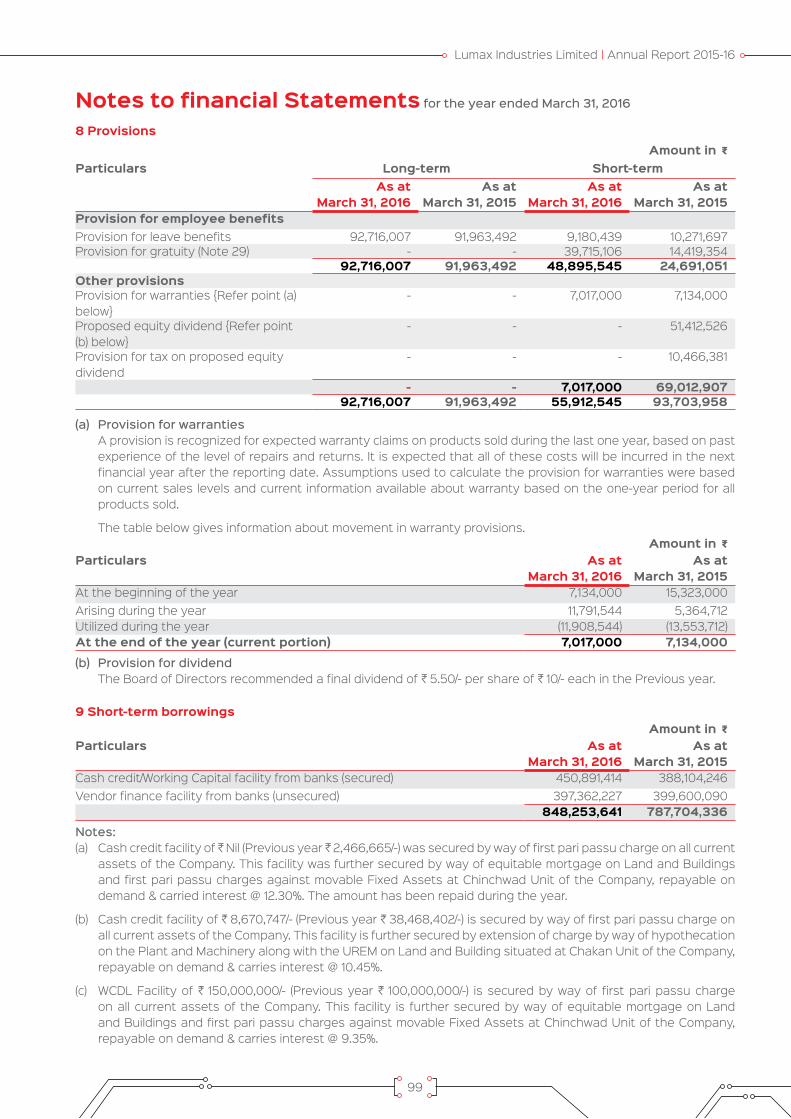
Lumax Industries Limited | Annual Report 2015-16
99
Notes to financial Statements for the year ended March 31, 2016
Amount in GParticulars As at
March 31, 2016As at
March 31, 2015At the beginning of the year 7,134,000 15,323,000 Arising during the year 11,791,544 5,364,712 Utilized during the year (11,908,544) (13,553,712)At the end of the year (current portion) 7,017,000 7,134,000
Amount in GParticulars As at
March 31, 2016As at
March 31, 2015Cash credit/Working Capital facility from banks (secured) 450,891,414 388,104,246 Vendor finance facility from banks (unsecured) 397,362,227 399,600,090
848,253,641 787,704,336
Amount in GParticulars Long-term Short-term
As at March 31, 2016
As at March 31, 2015
As at March 31, 2016
As at March 31, 2015
Provision for employee benefitsProvision for leave benefits 92,716,007 91,963,492 9,180,439 10,271,697 Provision for gratuity (Note 29) - - 39,715,106 14,419,354
92,716,007 91,963,492 48,895,545 24,691,051 Other provisionsProvision for warranties {Refer point (a) below}
- - 7,017,000 7,134,000
Proposed equity dividend {Refer point (b) below}
- - - 51,412,526
Provision for tax on proposed equity dividend
- - - 10,466,381
- - 7,017,000 69,012,907 92,716,007 91,963,492 55,912,545 93,703,958
8 Provisions
9 Short-term borrowings
(a) Provision for warranties A provision is recognized for expected warranty claims on products sold during the last one year, based on past
experience of the level of repairs and returns. It is expected that all of these costs will be incurred in the next financial year after the reporting date. Assumptions used to calculate the provision for warranties were based on current sales levels and current information available about warranty based on the one-year period for all products sold.
The table below gives information about movement in warranty provisions.
(b) Provision for dividend The Board of Directors recommended a final dividend of H 5.50/- per share of H 10/- each in the Previous year.
Notes:(a) Cash credit facility of H Nil (Previous year H 2,466,665/-) was secured by way of first pari passu charge on all current
assets of the Company. This facility was further secured by way of equitable mortgage on Land and Buildings and first pari passu charges against movable Fixed Assets at Chinchwad Unit of the Company, repayable on demand & carried interest @ 12.30%. The amount has been repaid during the year.
(b) Cash credit facility of H 8,670,747/- (Previous year H 38,468,402/-) is secured by way of first pari passu charge on all current assets of the Company. This facility is further secured by extension of charge by way of hypothecation on the Plant and Machinery along with the UREM on Land and Building situated at Chakan Unit of the Company, repayable on demand & carries interest @ 10.45%.
(c) WCDL Facility of H 150,000,000/- (Previous year H 100,000,000/-) is secured by way of first pari passu charge on all current assets of the Company. This facility is further secured by way of equitable mortgage on Land and Buildings and first pari passu charges against movable Fixed Assets at Chinchwad Unit of the Company, repayable on demand & carries interest @ 9.35%.

100
Notes to financial Statements for the year ended March 31, 2016
(d) Cash Credit Facility of H Nil (Previous year H 97,169,179/-) was secured by way of first pari passu charge on all current assets of the Company. This facility was further secured by way of equitable mortgage on Land and Buildings and first pari passu charges against movable Fixed Assets at Chinchwad Unit of the Company, repayable on demand & carried interest @ 11.75%. The amount has been repaid during the year.
(e) Cash Credit facility of H 92,220,667/- (Previous year H Nil) & WCDL Facility of H Nil (Previous year H 150,000,000/-) is secured by way of first pari passu charge on all current assets of the Company. This facility is further secured by way of equitable mortgage on Land and Buildings and first pari passu charges against movable Fixed Assets at Chinchwad Unit of the Company, repayable on demand & carries interest @ 9.65% for the current year & 10.60% respectively for the previous year.
(f) WCDL Facility of H 200,000,000/- (Previous year H Nil) is secured by way of first pari passu charge on all current assets of the Company. This facility is further secured by way of equitable mortgage on Land and Buildings and first pari passu charges against movable Fixed Assets at Chinchwad Unit of the Company, repayable on demand & carries interest @ 9.50%
(g) Vendor Finance Facility from MSIL of H 397,362,227/- (Previous year H 399,600,090/-) is repayable on 60 days from respective drawdown & carries interest @ 9.90%.
Amount in GParticulars As at
March 31, 2016As at
March 31, 2015Trade payables*- Total outstanding due of micro enterprises and small enterprises (refer
note 37 for details of dues to micro and small enterprises) 722,444 643,833 - Total outstanding due of creditors other than micro enterprises and small
enterprises # 3,071,045,229 2,960,761,066 3,071,767,673 2,961,404,899
10 Trade payables
* Refer note 33 for related party transactions # Trade payables include acceptances of H 188,015,774 /- (Previous year H 345,318,700 /-)
Amount in GParticulars As at
March 31, 2016As at
March 31, 2015Current maturities of long term borrowings (Note 5) 319,080,368 430,850,246 Interest accrued but not due on borrowings 5,603,606 9,361,816 Interest accrued and due on borrowings - 764,594 Investor Education and Protection Fund will be credited by following amounts (as and when due) {Refer point (a)}Unpaid dividend 7,746,077 3,586,450 Other Payables Payable for capital goods 93,843,383 33,177,329 Interest free deposits from customers # 233,390 483,390 Advances from customers * 582,535,250 461,573,980 Statutory dues payable 77,289,962 76,665,643 Other liabilities {Refer point (b)} 198,088,709 103,158,236
1,284,420,745 1,119,621,684
11 Other Current liabilities
* Refer note 33 for related party transactions# Customer deposits are repayable on demand.
(a) Investor Education and Protection Fund is being credited by the amount of unclaimed dividend after seven years from the due date. Accordingly, the Company has transferred H 426,572/- during the current year (Previous year H 447,526/-) to the Investor Education and Protection Fund.
(b) Other liabilities (net) represents amount towards rate provision payable to the customers net off amounts receivable from customers in respect of price increase not yet debited.
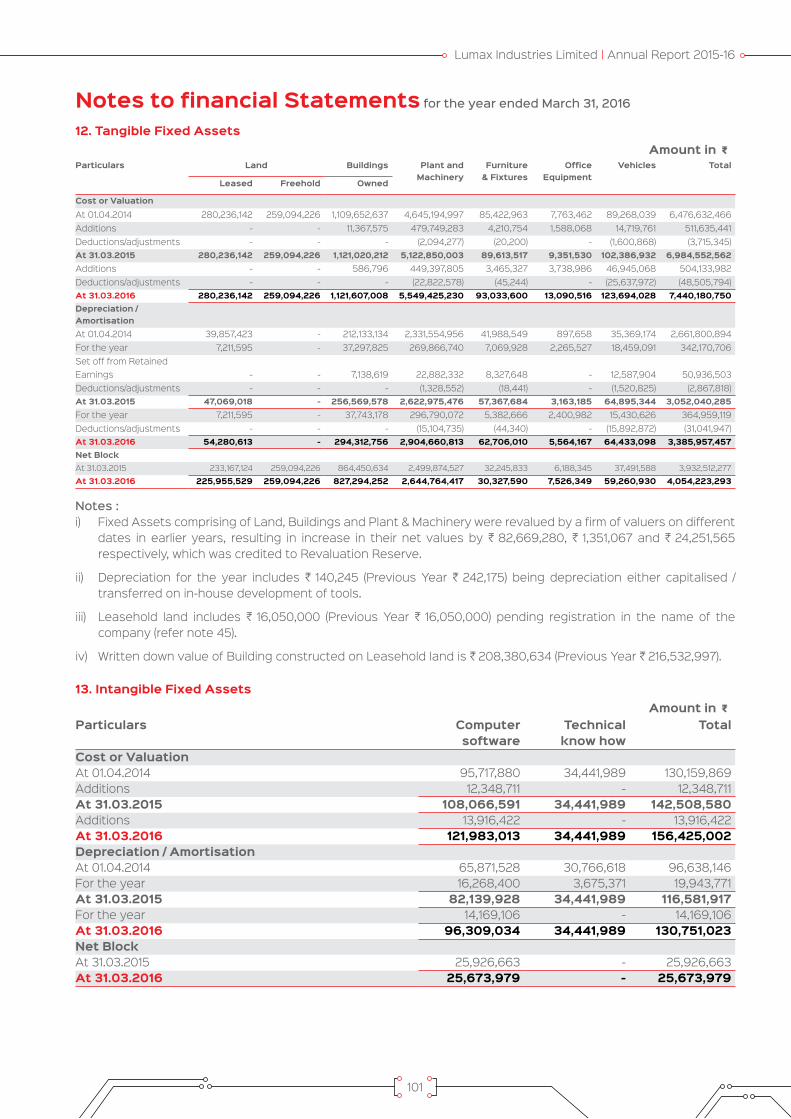
Lumax Industries Limited | Annual Report 2015-16
101
Notes to financial Statements for the year ended March 31, 2016
Amount in GParticulars Land Buildings Plant and
MachineryFurniture
& Fixtures Office
EquipmentVehicles Total
Leased Freehold Owned
Cost or ValuationAt 01.04.2014 280,236,142 259,094,226 1,109,652,637 4,645,194,997 85,422,963 7,763,462 89,268,039 6,476,632,466 Additions - - 11,367,575 479,749,283 4,210,754 1,588,068 14,719,761 511,635,441 Deductions/adjustments - - - (2,094,277) (20,200) - (1,600,868) (3,715,345)At 31.03.2015 280,236,142 259,094,226 1,121,020,212 5,122,850,003 89,613,517 9,351,530 102,386,932 6,984,552,562 Additions - - 586,796 449,397,805 3,465,327 3,738,986 46,945,068 504,133,982 Deductions/adjustments - - - (22,822,578) (45,244) - (25,637,972) (48,505,794)At 31.03.2016 280,236,142 259,094,226 1,121,607,008 5,549,425,230 93,033,600 13,090,516 123,694,028 7,440,180,750 Depreciation / AmortisationAt 01.04.2014 39,857,423 - 212,133,134 2,331,554,956 41,988,549 897,658 35,369,174 2,661,800,894 For the year 7,211,595 - 37,297,825 269,866,740 7,069,928 2,265,527 18,459,091 342,170,706 Set off from Retained Earnings - - 7,138,619 22,882,332 8,327,648 - 12,587,904 50,936,503 Deductions/adjustments - - - (1,328,552) (18,441) - (1,520,825) (2,867,818)At 31.03.2015 47,069,018 - 256,569,578 2,622,975,476 57,367,684 3,163,185 64,895,344 3,052,040,285 For the year 7,211,595 - 37,743,178 296,790,072 5,382,666 2,400,982 15,430,626 364,959,119 Deductions/adjustments - - - (15,104,735) (44,340) - (15,892,872) (31,041,947)At 31.03.2016 54,280,613 - 294,312,756 2,904,660,813 62,706,010 5,564,167 64,433,098 3,385,957,457 Net BlockAt 31.03.2015 233,167,124 259,094,226 864,450,634 2,499,874,527 32,245,833 6,188,345 37,491,588 3,932,512,277 At 31.03.2016 225,955,529 259,094,226 827,294,252 2,644,764,417 30,327,590 7,526,349 59,260,930 4,054,223,293
Amount in GParticulars Computer
softwareTechnical
know howTotal
Cost or ValuationAt 01.04.2014 95,717,880 34,441,989 130,159,869 Additions 12,348,711 - 12,348,711 At 31.03.2015 108,066,591 34,441,989 142,508,580 Additions 13,916,422 - 13,916,422 At 31.03.2016 121,983,013 34,441,989 156,425,002 Depreciation / AmortisationAt 01.04.2014 65,871,528 30,766,618 96,638,146 For the year 16,268,400 3,675,371 19,943,771 At 31.03.2015 82,139,928 34,441,989 116,581,917 For the year 14,169,106 - 14,169,106 At 31.03.2016 96,309,034 34,441,989 130,751,023 Net BlockAt 31.03.2015 25,926,663 - 25,926,663 At 31.03.2016 25,673,979 - 25,673,979
12. Tangible Fixed Assets
13. Intangible Fixed Assets
Notes : i) Fixed Assets comprising of Land, Buildings and Plant & Machinery were revalued by a firm of valuers on different
dates in earlier years, resulting in increase in their net values by H 82,669,280, H 1,351,067 and H 24,251,565 respectively, which was credited to Revaluation Reserve.
ii) Depreciation for the year includes H 140,245 (Previous Year H 242,175) being depreciation either capitalised / transferred on in-house development of tools.
iii) Leasehold land includes H 16,050,000 (Previous Year H 16,050,000) pending registration in the name of the company (refer note 45).
iv) Written down value of Building constructed on Leasehold land is H 208,380,634 (Previous Year H 216,532,997).

102
Notes to financial Statements for the year ended March 31, 2016
Amount in GParticulars As at
March 31, 2016As at
March 31, 2015Trade investments (valued at cost unless stated otherwise) i) Unquoted equity instruments Investment in associates 3,298,986 (Previous year 3,298,986) equity shares of H 10 each fully
paid-up in SL Lumax Limited 35,474,204 35,474,204
Other 15,832 (Previous year 15,832) equity shares of H 10 each fully paid-up in
Caparo Power Limited 158,320 158,320
ii) Preference shares (unquoted) 944,168, (Previous year 944,168) 2% Redeemable Preference shares of
H 10 each fully paid-up in Caparo Power Limited 9,441,680 9,441,680
Aggregate amount of unquoted investment 45,074,204 45,074,204
Amount in GNon-current Current
Particulars As at March 31, 2016
As at March 31, 2015
As at March 31, 2016
As at March 31, 2015
(A) Capital advances* Unsecured, considered good (A) 42,168,002 10,677,425 - - (B) Security deposit* Unsecured, considered good (B) 21,777,829 17,470,926 - - (C) Advances recoverable in cash or
kind* Unsecured, considered good - - 253,963,483 191,553,140 Unsecured, considered doubtful 2,516,938 2,516,938 - -
2,516,938 2,516,938 253,963,483 191,553,140 Provision for doubtful advances (2,516,938) (2,516,938) - - (C) - - 253,963,483 191,553,140 (D) Other loans and advances
(unsecured, considered good) Advance income-tax (net of provision
for taxation) 1,270,553 7,974,892 - - MAT credit entitlement 239,219,298 151,375,402 - - Prepaid expenses - - 34,680,245 16,823,096 Loans to employees 1,641,412 1,138,250 9,770,322 7,957,438 Balances with statutory/ government
authorities - - 67,797,943 89,181,291 (D) 242,131,263 160,488,544 112,248,510 113,961,825 TOTAL (A+B+C+D) 306,077,094 188,636,895 366,211,993 305,514,965
14. Non-Current investments
15 Loans and Advances
* Refer note 33 for related party transactions
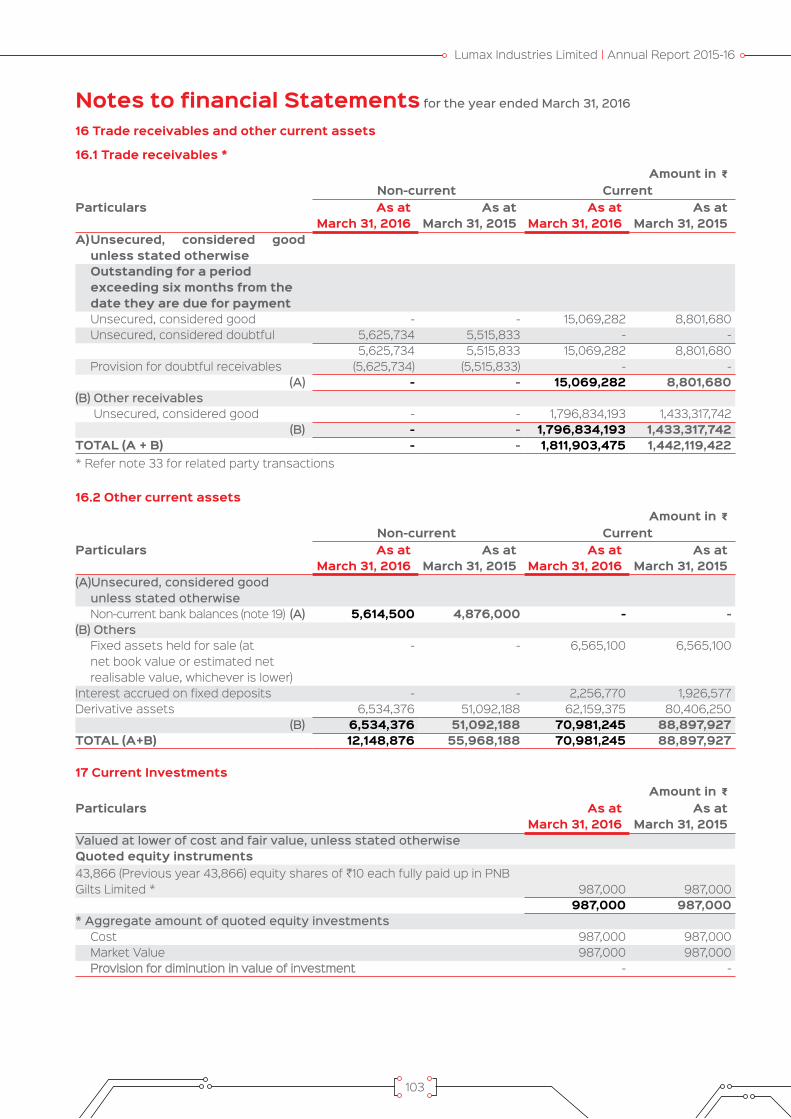
Lumax Industries Limited | Annual Report 2015-16
103
Notes to financial Statements for the year ended March 31, 2016
Amount in GNon-current Current
Particulars As at March 31, 2016
As at March 31, 2015
As at March 31, 2016
As at March 31, 2015
A) Unsecured, considered good unless stated otherwise
Outstanding for a period exceeding six months from the date they are due for payment
Unsecured, considered good - - 15,069,282 8,801,680 Unsecured, considered doubtful 5,625,734 5,515,833 - -
5,625,734 5,515,833 15,069,282 8,801,680 Provision for doubtful receivables (5,625,734) (5,515,833) - - (A) - - 15,069,282 8,801,680 (B) Other receivables Unsecured, considered good - - 1,796,834,193 1,433,317,742 (B) - - 1,796,834,193 1,433,317,742 TOTAL (A + B) - - 1,811,903,475 1,442,119,422
Amount in GNon-current Current
Particulars As at March 31, 2016
As at March 31, 2015
As at March 31, 2016
As at March 31, 2015
(A)Unsecured, considered good unless stated otherwise
Non-current bank balances (note 19) (A) 5,614,500 4,876,000 - -(B) Others Fixed assets held for sale (at
net book value or estimated net realisable value, whichever is lower)
- - 6,565,100 6,565,100
Interest accrued on fixed deposits - - 2,256,770 1,926,577 Derivative assets 6,534,376 51,092,188 62,159,375 80,406,250 (B) 6,534,376 51,092,188 70,981,245 88,897,927 TOTAL (A+B) 12,148,876 55,968,188 70,981,245 88,897,927
Amount in GParticulars As at
March 31, 2016As at
March 31, 2015Valued at lower of cost and fair value, unless stated otherwiseQuoted equity instruments43,866 (Previous year 43,866) equity shares of H10 each fully paid up in PNB Gilts Limited * 987,000 987,000
987,000 987,000 * Aggregate amount of quoted equity investments Cost 987,000 987,000 Market Value 987,000 987,000 Provision for diminution in value of investment - -
16.1 Trade receivables *
16.2 Other current assets
17 Current Investments
16 Trade receivables and other current assets
* Refer note 33 for related party transactions
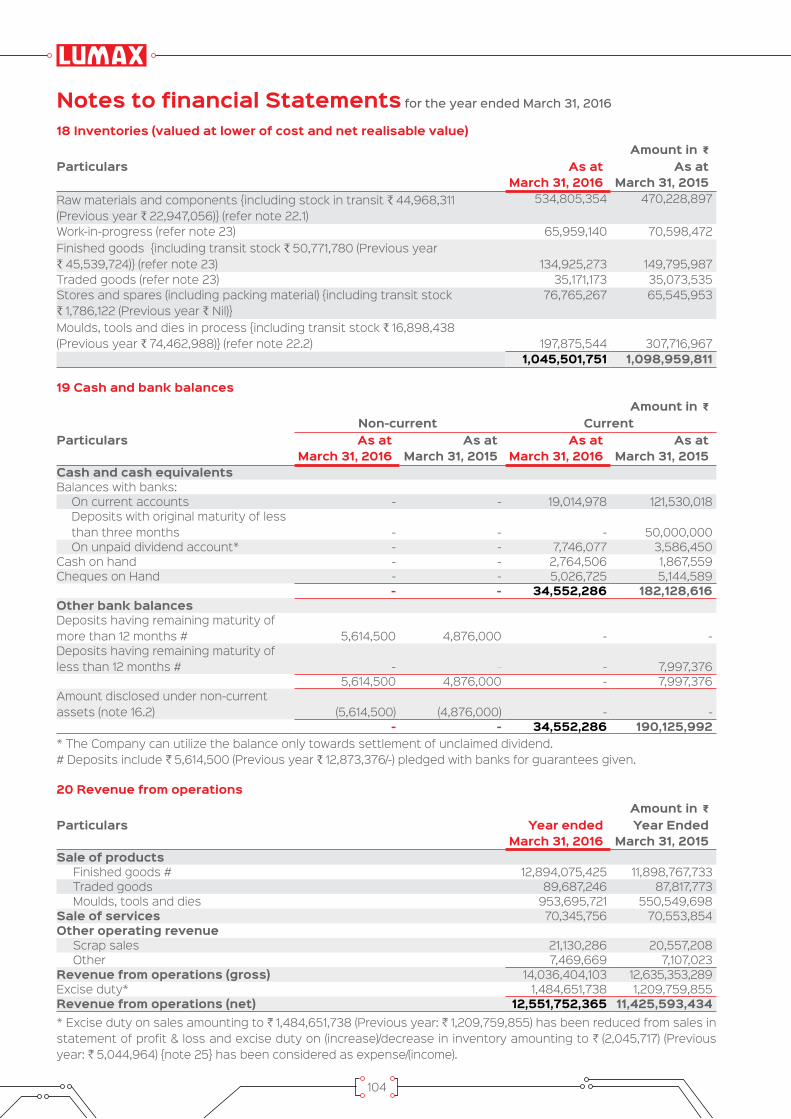
104
Notes to financial Statements for the year ended March 31, 2016
Amount in GParticulars As at
March 31, 2016As at
March 31, 2015Raw materials and components {including stock in transit R 44,968,311 (Previous year R 22,947,056)} (refer note 22.1)
534,805,354 470,228,897
Work-in-progress (refer note 23) 65,959,140 70,598,472 Finished goods {including transit stock R 50,771,780 (Previous year R 45,539,724)} (refer note 23) 134,925,273 149,795,987 Traded goods (refer note 23) 35,171,173 35,073,535 Stores and spares (including packing material) {including transit stock R 1,786,122 (Previous year R Nil)}
76,765,267 65,545,953
Moulds, tools and dies in process {including transit stock R 16,898,438 (Previous year R 74,462,988)} (refer note 22.2) 197,875,544 307,716,967
1,045,501,751 1,098,959,811
18 Inventories (valued at lower of cost and net realisable value)
Amount in GNon-current Current
Particulars As at March 31, 2016
As at March 31, 2015
As at March 31, 2016
As at March 31, 2015
Cash and cash equivalentsBalances with banks: On current accounts - - 19,014,978 121,530,018 Deposits with original maturity of less
than three months - - - 50,000,000 On unpaid dividend account* - - 7,746,077 3,586,450 Cash on hand - - 2,764,506 1,867,559 Cheques on Hand - - 5,026,725 5,144,589
- - 34,552,286 182,128,616 Other bank balancesDeposits having remaining maturity of more than 12 months # 5,614,500 4,876,000 - - Deposits having remaining maturity of less than 12 months # - - 7,997,376
5,614,500 4,876,000 - 7,997,376 Amount disclosed under non-current assets (note 16.2) (5,614,500) (4,876,000) - -
- - 34,552,286 190,125,992
Amount in GParticulars Year ended
March 31, 2016Year Ended
March 31, 2015Sale of products Finished goods # 12,894,075,425 11,898,767,733 Traded goods 89,687,246 87,817,773 Moulds, tools and dies 953,695,721 550,549,698 Sale of services 70,345,756 70,553,854 Other operating revenue Scrap sales 21,130,286 20,557,208 Other 7,469,669 7,107,023 Revenue from operations (gross) 14,036,404,103 12,635,353,289 Excise duty* 1,484,651,738 1,209,759,855 Revenue from operations (net) 12,551,752,365 11,425,593,434
19 Cash and bank balances
20 Revenue from operations
* The Company can utilize the balance only towards settlement of unclaimed dividend.# Deposits include H 5,614,500 (Previous year R 12,873,376/-) pledged with banks for guarantees given.
* Excise duty on sales amounting to H 1,484,651,738 (Previous year: H 1,209,759,855) has been reduced from sales in statement of profit & loss and excise duty on (increase)/decrease in inventory amounting to H (2,045,717) (Previous year: H 5,044,964) {note 25} has been considered as expense/(income).
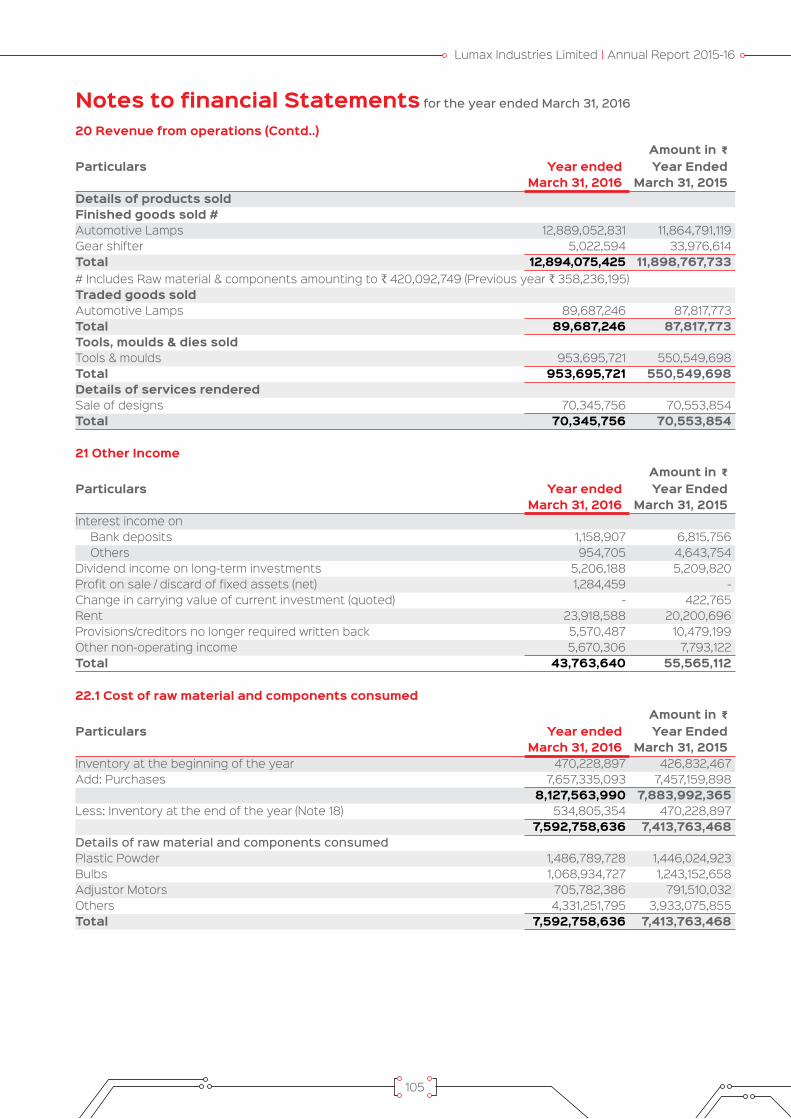
Lumax Industries Limited | Annual Report 2015-16
105
Notes to financial Statements for the year ended March 31, 2016
Amount in GParticulars Year ended
March 31, 2016Year Ended
March 31, 2015Details of products soldFinished goods sold #Automotive Lamps 12,889,052,831 11,864,791,119 Gear shifter 5,022,594 33,976,614 Total 12,894,075,425 11,898,767,733 # Includes Raw material & components amounting to R 420,092,749 (Previous year R 358,236,195)Traded goods soldAutomotive Lamps 89,687,246 87,817,773 Total 89,687,246 87,817,773 Tools, moulds & dies soldTools & moulds 953,695,721 550,549,698 Total 953,695,721 550,549,698 Details of services renderedSale of designs 70,345,756 70,553,854 Total 70,345,756 70,553,854
Amount in GParticulars Year ended
March 31, 2016Year Ended
March 31, 2015Interest income on Bank deposits 1,158,907 6,815,756 Others 954,705 4,643,754 Dividend income on long-term investments 5,206,188 5,209,820 Profit on sale / discard of fixed assets (net) 1,284,459 - Change in carrying value of current investment (quoted) - 422,765 Rent 23,918,588 20,200,696 Provisions/creditors no longer required written back 5,570,487 10,479,199 Other non-operating income 5,670,306 7,793,122 Total 43,763,640 55,565,112
Amount in GParticulars Year ended
March 31, 2016Year Ended
March 31, 2015Inventory at the beginning of the year 470,228,897 426,832,467 Add: Purchases 7,657,335,093 7,457,159,898
8,127,563,990 7,883,992,365 Less: Inventory at the end of the year (Note 18) 534,805,354 470,228,897
7,592,758,636 7,413,763,468 Details of raw material and components consumedPlastic Powder 1,486,789,728 1,446,024,923 Bulbs 1,068,934,727 1,243,152,658 Adjustor Motors 705,782,386 791,510,032 Others 4,331,251,795 3,933,075,855 Total 7,592,758,636 7,413,763,468
20 Revenue from operations (Contd..)
21 Other Income
22.1 Cost of raw material and components consumed

106
Notes to financial Statements for the year ended March 31, 2016
Amount in GParticulars Year ended
March 31, 2016Year Ended
March 31, 2015Inventory at the beginning of the year 307,716,967 64,039,286 Add: Purchases 596,429,419 685,477,438
904,146,386 749,516,724 Less: Inventory at the end of the year (Note 18) 197,875,544 307,716,967
706,270,842 441,799,757
Amount in GParticulars As at
March 31, 2016As at
March 31, 2015(Increase)/ Decrease
Inventories at the end of the year Work-in-progress (Note 18) 65,959,140 70,598,472 4,639,332 Finished goods (Note 18) 134,925,273 149,795,987 14,870,714 Traded goods (Note 18) 35,171,173 35,073,535 (97,638)
236,055,586 255,467,994 19,412,408 Inventories at the beginning of the yearWork-in-progress 70,598,472 66,419,985 (4,178,487)Finished goods 149,795,987 141,195,517 (8,600,470)Traded goods 35,073,535 6,588,125 (28,485,410)
255,467,994 214,203,627 (41,264,367) 19,412,408 (41,264,367)
22.2 Cost of moulds, tools & dies
23 (Increase)/ decrease in Inventories
Amount in GParticulars As at
March 31, 2016As at
March 31, 2015Details of inventoryRaw material and componentsPlastic Powder 122,528,343 109,441,802 Bulbs 85,367,099 70,602,467 Adjustor Motors 28,132,854 38,398,442 Others 298,777,058 251,786,186 Total 534,805,354 470,228,897
Details of Inventory Amount in G As at
March 31, 2016 As at
March 31, 2015 Work-in-progressAutomotive Lamps 58,491,290 63,175,684 Gear shifter 7,467,850 7,422,788 Total 65,959,140 70,598,472 Finished goodsAutomotive Lamps 127,179,668 139,288,911 Gear shifter 7,745,605 10,507,076 Total 134,925,273 149,795,987 Traded GoodsAutomotive Lamps 35,171,173 35,073,535 Total 35,171,173 35,073,535
Details of purchase of traded goods Amount in G year ended
March 31, 2016 year ended
March 31, 2015 Automotive Lamps 78,726,759 105,898,778 Total 78,726,759 105,898,778
22.1 Cost of raw material and components consumed (Contd.)
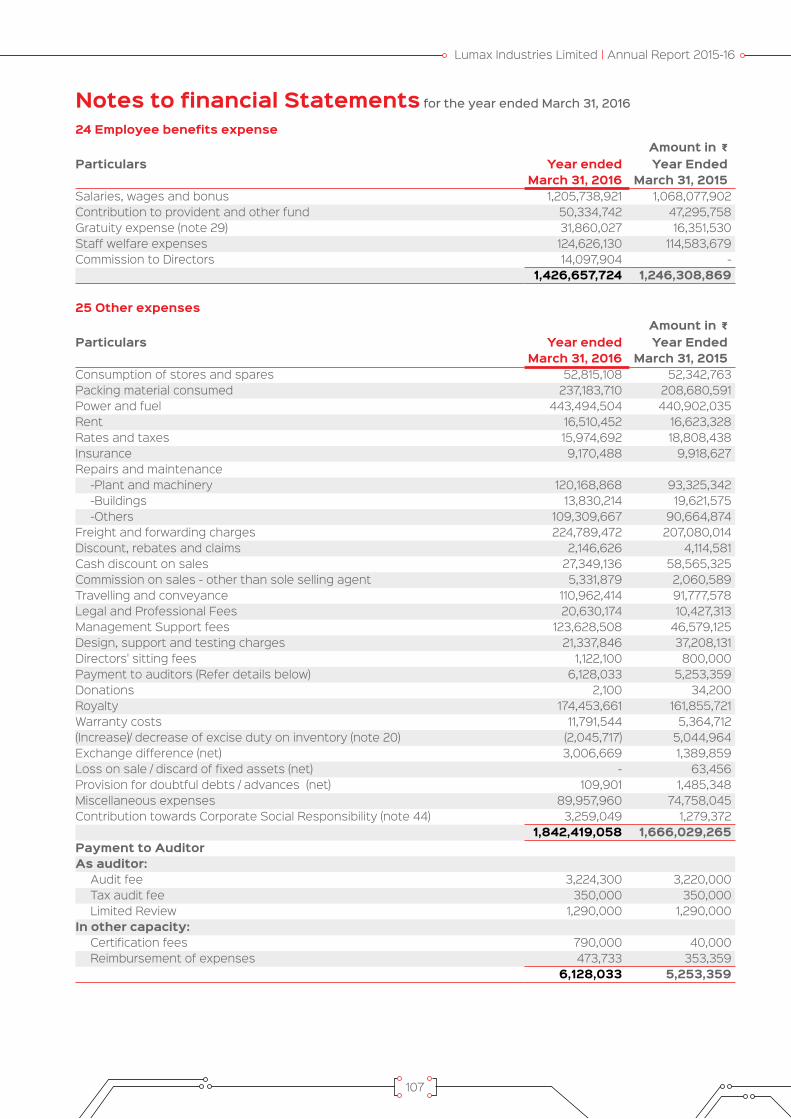
Lumax Industries Limited | Annual Report 2015-16
107
Notes to financial Statements for the year ended March 31, 2016
Amount in GParticulars Year ended
March 31, 2016Year Ended
March 31, 2015Salaries, wages and bonus 1,205,738,921 1,068,077,902 Contribution to provident and other fund 50,334,742 47,295,758 Gratuity expense (note 29) 31,860,027 16,351,530 Staff welfare expenses 124,626,130 114,583,679 Commission to Directors 14,097,904 -
1,426,657,724 1,246,308,869
Amount in GParticulars Year ended
March 31, 2016Year Ended
March 31, 2015Consumption of stores and spares 52,815,108 52,342,763 Packing material consumed 237,183,710 208,680,591 Power and fuel 443,494,504 440,902,035 Rent 16,510,452 16,623,328 Rates and taxes 15,974,692 18,808,438 Insurance 9,170,488 9,918,627 Repairs and maintenance -Plant and machinery 120,168,868 93,325,342 -Buildings 13,830,214 19,621,575 -Others 109,309,667 90,664,874 Freight and forwarding charges 224,789,472 207,080,014 Discount, rebates and claims 2,146,626 4,114,581 Cash discount on sales 27,349,136 58,565,325 Commission on sales - other than sole selling agent 5,331,879 2,060,589 Travelling and conveyance 110,962,414 91,777,578 Legal and Professional Fees 20,630,174 10,427,313 Management Support fees 123,628,508 46,579,125 Design, support and testing charges 21,337,846 37,208,131 Directors' sitting fees 1,122,100 800,000 Payment to auditors (Refer details below) 6,128,033 5,253,359 Donations 2,100 34,200 Royalty 174,453,661 161,855,721 Warranty costs 11,791,544 5,364,712 (Increase)/ decrease of excise duty on inventory (note 20) (2,045,717) 5,044,964 Exchange difference (net) 3,006,669 1,389,859 Loss on sale / discard of fixed assets (net) - 63,456 Provision for doubtful debts / advances (net) 109,901 1,485,348 Miscellaneous expenses 89,957,960 74,758,045 Contribution towards Corporate Social Responsibility (note 44) 3,259,049 1,279,372
1,842,419,058 1,666,029,265 Payment to AuditorAs auditor: Audit fee 3,224,300 3,220,000 Tax audit fee 350,000 350,000 Limited Review 1,290,000 1,290,000 In other capacity: Certification fees 790,000 40,000 Reimbursement of expenses 473,733 353,359
6,128,033 5,253,359
24 Employee benefits expense
25 Other expenses

108
Amount in GParticulars Year ended
March 31, 2016Year Ended
March 31, 2015Depreciation of tangible assets 364,818,874 341,928,531 Amortization of intangible assets 14,169,106 19,943,771
378,987,980 361,872,302 Less: recoupment from revaluation reserve - (288,474)
378,987,980 361,583,828
Amount in GParticulars Year ended
March 31, 2016Year Ended
March 31, 2015Interest to banks - on term loans 52,585,682 84,374,690 - on cash credit 69,705,542 44,632,350 Interest others 1,673,315 4,064,814 Bank charges 10,414,308 11,231,364
134,378,847 144,303,218
Amount in GParticulars March 31, 2016 March 31, 2015The following reflects the profit and share data used in the basic and diluted EPS computations:Net profit for calculation of basic and diluted EPS 373,739,743 165,728,309 Weighted average number of equity shares in calculating basic and diluted EPS
9,347,732 9,347,732
Basic and Diluted Earnings per share({Nominal value of shares of G 10 (Previous year : G 10)}
39.98 17.73
Amount in GGratuity
Particulars March 31, 2016 March 31, 2015Current service cost 11,779,340 10,627,337Interest cost on benefit obligation 9,355,669 8,734,422Expected return on plan assets (9,107,168) (9,525,607)Net actuarial (gain) / loss recognized in the year 19,832,186 6,515,378Net (benefit) / expense (Refer Note 24) 31,860,027 16,351,530Actual return on plan assets 9,296,805 9,937,985
26 Depreciation and amortization expense
27 Finance costs
28 Earnings per share (EPS)
Notes to financial Statements for the year ended March 31, 2016
29. Gratuity benefit plan
The Company operates defined benefit plan for gratuity for its employees. Under the gratuity plan, every employee who has completed atleast five years of service gets a gratuity on departure @ 15 days of last drawn basic salary including DA for each completed year of service, subject to a maximum amount of H 1,000,000. The scheme is funded with an insurance Company in the form of qualifying insurance policy.
The following tables summarize the components of net (benefit) / expense recognized in the statement of profit and loss and the funded status and amounts recognized in the balance sheet for the gratuity plan.
Statement of profit and loss
Net employee (benefit) / expense recognized in the employee cost

Lumax Industries Limited | Annual Report 2015-16
109
Amount in GGratuity
Particulars March 31, 2016 March 31, 2015Present value of defined benefit obligation 147,962,874 133,082,909Fair value of plan assets 108,247,768 118,663,555Plan asset / (liability) (39,715,106) (14,419,354)
Amount in GGratuity
Particulars March 31, 2016 March 31, 2015Opening fair value of plan assets 118,663,555 102,954,582Expected return 9,107,168 9,525,607Contributions by employer 6,179,474 11,918,446Benefits paid (25,892,066) (6,147,458)Actuarial gains / (losses) 189,637 412,378Closing fair value of plan assets 108,247,768 118,663,555
Amount in GGratuity
Particulars March 31, 2016 March 31, 2015Opening defined benefit obligation 133,082,909 112,940,497Current service cost 11,779,340 10,627,337Interest cost 9,355,669 8,734,422Benefits paid (26,276,867) (6,147,103)Actuarial (gains) / losses on obligation 20,021,823 6,927,756Closing defined benefit obligation 147,962,874 133,082,909
Amount in GGratuity
Particulars March 31, 2016 March 31, 2015Investments with insurer 100% 100%
Amount in GGratuity
Particulars March 31, 2016 March 31, 2015Discount rate 7.80% 7.95%Expected rate of return on assets 8.37% 9.00%Attrition rate / Employee turnover 5.00% 5.00%
Notes to financial Statements for the year ended March 31, 2016
Balance sheet
Benefit asset / (liability)
Changes in the fair value of plan assets are as follows:
The major categories of plan assets as a percentage of the fair value of total plan assets are as follows:
The principal assumptions used in determining gratuity obligation for the Company’s plans are shown below:
The Company expects to contribute H 14,789,453 to gratuity in the next year (Previous year: H 6,175,334)
The estimates of future salary increases, considered in actuarial valuation, take account of inflation, seniority, promotion and other relevant factors, such as supply and demand in the employment market.
The overall expected rate of return on assets is determined based on the market prices prevailing on that date, applicable to the period over which the obligation is to be settled.

110
Notes to financial Statements for the year ended March 31, 2016
Amounts for the current and previous four periods are as follows:Amount in G
Particulars March 31, 2016
March 31, 2015
March 31, 2014
March 31, 2013
March 31, 2012
GratuityDefined benefit obligation 147,962,874 133,082,909 112,940,497 103,391,956 85,058,345Plan assets 108,247,768 118,663,555 102,954,582 87,213,530 71,075,716Surplus / (deficit) (39,715,106) (14,419,354) (9,985,915) (16,178,426) (13,982,629)Experience adjustments on plan liabilities 20,021,823 6,927,756 2,769,944 2,796,180 6,913,810Experience adjustments on plan assets 189,637 412,378
490,903 449,071 (5,794)
30. LeasesOperating lease: Company as lessee The Company had entered into commercial leases on Plant & machinery (DG Set). There were no contingent rents in the lease agreements. The lease terms was for 1-5 years and were renewable at the mutual agreements of both the parties. There were no restrictions imposed by lease arrangements. There was no sublease and all the leases were non-cancellable in nature. The lease tenure has been completed in the current Financial Year.
31. The following expenses have been reduced from the respective heads and have been included in the cost of sale of moulds, tools and dies or cost of moulds, tools and dies capitalized, as the case may be.
Amount in GParticulars March 31, 2016 March 31, 2015Within one year - 1,550,000After one year but not more than five years - -More than five years - -Total - 1,550,000
Amount in GParticulars March 31, 2016 March 31, 2015Salaries, wages and bonus 429,901 733,501Repair and Maintenance – Plant & Machinery 67,524 9,593Repair and Maintenance – Others 5,032,367 2,667,749Deprecation 140,245 242,175Miscellaneous Expenses 23,768,269 14,829,730Total 29,438,306 18,482,748
Amount in GS.No.
Particulars Year ended March 31, 2016
Year Ended March 31, 2015
1 Domestic Market 12,252,216,443 11,135,052,1972 Overseas Market 299,535,922 290,541,237
Total 12,551,752,365 11,425,593,434
32. Segment information
Business Segments: The Company produces various types of automotive lighting systems. Since the Company’s business activity
falls within a single business segment, there are no additional disclosures to be provided under Accounting Standard-17 ‘Segment Reporting’ other than those already provided in the Financial Statements.
Geographical Segments The geographical segment comprises of domestic and overseas market. The following table shows the distribution
of the Company’s consolidated sales by geographical market, regardless of where the goods were produced:
Revenue from operations by Geographical Market (Net of Excise Duties)

Lumax Industries Limited | Annual Report 2015-16
111
Notes to financial Statements for the year ended March 31, 2016
Amount in GS.No.
Particulars Year ended March 31, 2016
Year Ended March 31, 2015
1 Domestic 1,724,817,408 1,350,877,3702 Overseas 87,086,067 91,242,052
Total 1,811,903,475 1,442,119,422
S.No.
Particulars Name of Related Parties
1. Enterprise having significant influence Stanley Electric Co. Ltd., Japan 2. Associate SL Lumax Limited3. Key Management Personnel Mr. D. K. Jain (Chairman)
Mr. Deepak Jain (Managing Director)Mr. Anmol Jain (Joint Managing Director)Mr. E. Hirooka (Sr. Executive Director) Mr. N. Sato (Executive Director)
4. Relatives of Key Management Personnel Mr. U. K. Jain (Brother of Chairman)Mr. M. K. Jain (Brother of Chairman)Mrs. Usha Jain (Spouse of Chairman)
5. Enterprise owned or significantly influenced by Key Management Personnel or their Relatives
Lumax Auto Technologies Limited Lumax DK Auto Industries LimitedLumax Tours & Travels LimitedLumax Finance Private LimitedLumax Ancillary LimitedMahavir Udyog D.K. Jain & Sons (HUF)Lumax Automotive Systems LimitedBharat EnterprisesLumax Cornaglia Auto Technologies Private LimitedLumax Mannoh Allied Technologies LimitedLumax Management Services Private LimitedLumax Energy Solutions Private Limited
Trade Receivables: The following table shows the distribution of the Company’s trade receivables by geographical market:
The Company has common fixed assets and other assets situated in India only for producing goods for Domestic and Overseas markets.
33. Related party disclosuresNames of related parties and related party relationshipRelated parties with whom transactions have taken place during the year

112
Not
es t
o fi
nanc
ial S
tate
men
ts fo
r the
yea
r end
ed M
arch
31,
2016
Det
ail o
f Rel
ated
Par
ty T
rans
acti
ons
for t
he F
inan
cial
Yea
r 20
15-1
6A
mou
nt in
GS
. N
oA
ccou
nt H
ead
Ent
erpr
ise
havi
ng
sign
ific
ant
infl
uenc
eK
ey M
anag
emen
t P
erso
nnel
Rel
ativ
es o
f Key
M
anag
emen
t P
erso
nnel
Ent
erpr
ises
ow
ned
or
sign
ifica
ntly
influ
ence
d by
ke
y m
anag
emen
t pe
rson
nel
or t
heir
rela
tive
s
Ass
ocia
teTo
tal
2015
-16
2014
-15
2015
-16
2014
-15
2015
-16
2014
-15
2015
-16
2014
-15
2015
-16
2014
-15
2015
-16
2014
-15
A)
TRA
NS
AC
TIO
NS
i)S
ale
of R
aw M
ater
ials
an
d C
ompo
nent
sLu
max
Aut
o Te
chno
logi
es
Ltd.
--
--
--
7
2,10
4,20
8
54,
010,
126
--
7
2,10
4,20
854
,010
,126
Lum
ax D
K A
uto
Indu
strie
s Lt
d.
--
--
--
15,3
89,3
6313
,071
,573
-
-15
,389
,363
13,0
71,5
73
Lum
ax A
ncilla
ry L
td.
--
--
--
2
7,98
2,77
226
,625
,569
-
-
27,
982,
772
26,6
25,5
69
Bha
rat
Ente
rpris
es-
--
--
-
320
,443
10
2,65
9-
-
320
,443
102,
659
Lum
ax M
anno
h A
llied
Tech
nolo
gies
Ltd
.-
--
--
-2,
419,
516
1,194
,061
-
-2,
419,
516
1,194
,061
Tota
l (i)
-
-
-
-
-
-
11
8,2
16,3
02
95,
00
3,9
88
-
-11
8,2
16,3
02
95,
00
3,9
88
ii)
Sal
e of
fini
shed
goo
dsLu
max
Aut
o Te
chno
logi
es
Ltd.
--
--
--
539,
229,
421
537,
819,
389
--
539,
229,
421
537,
819,
389
Lum
ax D
K A
uto
Indu
strie
s Lt
d.
--
--
--
7
,180,
918
2
,570
,410
-
-
7,18
0,91
82,
570,
410
Lum
ax M
anno
h A
llied
Tech
nolo
gies
Ltd
.-
--
--
-5,
219,
005
41,5
63,0
05-
-5,
219,
005
41,5
63,0
05
Sta
nley
Ele
ctric
Co.
Ltd
-67
,846
--
--
--
--
-67
,846
Tota
l (ii)
-
6
7,8
46
-
-
-
-
5
51,6
29,3
44 5
81,9
52,8
04
--
551
,629
,344
582,
020
,650
iii)
Sal
e of
Fix
ed A
sset
sLu
max
DK
Aut
o In
dust
ries
Ltd.
-
--
--
- 9
,214
20,
874
--
9,2
1420
,874
Lum
ax A
uto
Tech
nolo
gies
Lt
d.-
--
--
-4,
204,
578
- -
-4,
204,
578
-
Lum
ax M
anno
h A
llied
Tech
nolo
gies
Ltd
.-
--
--
--
632,
973
--
-63
2,97
3
Lum
ax M
anag
emen
t S
ervi
ces
P.Lt
d.-
--
--
-9,
268,
726
--
-9,
268,
726
-
Mah
avir
Udy
og-
--
--
-14
2,68
2-
-14
2,68
2-
Tota
l (iii
)-
-
-
-
-
-
13,6
25,2
00
653
,847
--
13,6
25,2
00
653
,847
iv)
Sal
e of
ser
vice
sLu
max
Aut
o Te
chno
logi
es
Ltd.
--
--
--
88
4,88
0
622,
693
--
88
4,88
062
2,69
3
Lum
ax D
K A
uto
Indu
strie
s Lt
d.
--
--
--
15
3,53
0
387
,216
-
-
153,
530
387,
216
Lum
ax A
ncilla
ry L
td.
--
--
--
12
5,20
7
901
,545
-
-
125,
207
901,5
45St
anle
y El
ectr
ic C
o. L
td.
8,10
9,01
685
3,29
8-
--
--
--
-8,
109,
016
853,
298
Mah
avir
Udy
og -
--
--
-21
,671
899
--
21,6
7189
9B
hara
t En
terp
rises
--
--
--
28
,437
--
-
28,4
37-
Tota
l (iv
)8
,109
,016
853
,29
8
-
-
-
-
1
,213
,725
1,9
12,3
53
--
9,3
22,7
412,
765,
651

Lumax Industries Limited | Annual Report 2015-16
113
Det
ail o
f Rel
ated
Par
ty T
rans
acti
ons
for t
he F
inan
cial
Yea
r 20
15-1
6A
mou
nt in
GS
. N
oA
ccou
nt H
ead
Ent
erpr
ise
havi
ng
sign
ific
ant
infl
uenc
eK
ey M
anag
emen
t P
erso
nnel
Rel
ativ
es o
f Key
M
anag
emen
t P
erso
nnel
Ent
erpr
ises
ow
ned
or
sign
ifica
ntly
influ
ence
d by
ke
y m
anag
emen
t pe
rson
nel
or t
heir
rela
tive
s
Ass
ocia
teTo
tal
2015
-16
2014
-15
2015
-16
2014
-15
2015
-16
2014
-15
2015
-16
2014
-15
2015
-16
2014
-15
2015
-16
2014
-15
v)P
urch
ase
of R
aw
Mat
eria
ls, C
ompo
nent
s an
d M
ould
sLu
max
Aut
o Te
chno
logi
es
Ltd.
--
--
--
321,6
65,3
90
241,0
22,14
4 -
-32
1,665
,390
241,0
22,14
4
Lum
ax D
K A
uto
Indu
strie
s Lt
d.
--
--
--
994,
031,4
37
882,
213,
415
--
994,
031,4
37
882,
213,
415
Lum
ax A
ncilla
ry L
td.
--
--
--
453,
026,
614
37
2,02
1,653
-
-45
3,02
6,61
4
372,
021,6
53
Bha
rat
Ente
rpris
es-
--
--
-16
2,30
1,096
18
3,31
7,81
4 -
-16
2,30
1,096
18
3,31
7,81
4 M
ahav
ir U
dyog
--
--
--
16,7
14,2
27
16,
788,
558
--
16,7
14,2
27
16,
788,
558
Stan
ley
Elec
tric
Co.
Ltd
.79
,696
,539
92,6
60,6
19-
--
--
--
-79
,696
,539
92,6
60,6
19Lu
max
Man
noh
Allie
d Te
chno
logi
es L
td.
-
- -
--
--
183,
568
118,
212
--
183,
568
118,
212
SL
Lum
ax L
td.
--
--
--
--
-53
,948
-53
,948
Tota
l (v)
79,6
96
,539
92,
66
0,6
19
-
-
-
- 1,9
47,9
22,3
321,6
95,4
81,7
96-
53,9
482,
027
,618
,871
1,788
,196,
363
vi)
Pur
chas
e of
Pac
king
M
ater
ial
Mah
avir
Udy
og-
--
--
-13
4,94
2,33
4
122,
285,
872
--
134,
942,
334
12
2,28
5,87
2To
tal (
vi)
-
-
-
-
-
- 13
4,9
42,3
3412
2,28
5,8
72-
-13
4,9
42,3
3412
2,28
5,8
72vi
i)P
urch
ase
of S
pare
s &
S
ampl
esSt
anle
y El
ectr
ic C
o. L
td.
756,
282
222,
069
--
--
--
--
756,
282
222,
069
Lum
ax D
K A
uto
Indu
strie
s Lt
d.-
--
--
1,323
,688
19
9,63
7 -
-1,3
23,6
88
199,
637
Tota
l (vi
i)75
6,2
82
222,
06
9
-
-
-
- 1,3
23,6
88
19
9,6
37
--
2,0
79,9
70
421
,70
6
viii)
Pur
chas
e of
Fix
ed
Ass
ets
Lum
ax D
K A
uto
Indu
strie
s Lt
d.
--
--
--
-
123,
431
--
-
123,
431
Stan
ley
Elec
tric
Co.
Ltd
.-
2,8
80,7
55
--
--
--
--
-2,
880,
755
Tota
l (vi
ii)-
2,8
80
,755
-
-
-
- -
123,
431
--
-
3,
00
4,18
6
ix)
Pur
chas
e of
Fin
ishe
d G
oods
Stan
ley
Elec
tric
Co.
Ltd
.
46,
570
122,
943
--
--
--
--
46,5
70
122,
943
Tota
l (ix
)
46
,570
1
22,9
43
-
-
-
-
-
-
--
4
6,5
70
122,
943
x)
Pur
chas
e O
f Ser
vice
sLu
max
Tou
rs &
Tra
vels
Ltd.
- -
--
--
3
9,31
9,31
6
33,
817,
503
--
3
9,31
9,31
6
33,
817,
503
Tota
l (x)
-
-
-
-
-
-
39,3
19,3
16
33,
817
,50
3-
-39
,319
,316
3
3,8
17,5
03
xi)
Tech
nica
l Cha
rges
D
esig
n, D
raw
ing
&
Test
ing
Cha
rges
Not
es t
o fi
nanc
ial S
tate
men
ts fo
r the
yea
r end
ed M
arch
31,
2016

114
Det
ail o
f Rel
ated
Par
ty T
rans
acti
ons
for t
he F
inan
cial
Yea
r 20
15-1
6A
mou
nt in
GS
. N
oA
ccou
nt H
ead
Ent
erpr
ise
havi
ng
sign
ific
ant
infl
uenc
eK
ey M
anag
emen
t P
erso
nnel
Rel
ativ
es o
f Key
M
anag
emen
t P
erso
nnel
Ent
erpr
ises
ow
ned
or
sign
ifica
ntly
influ
ence
d by
ke
y m
anag
emen
t pe
rson
nel
or t
heir
rela
tive
s
Ass
ocia
teTo
tal
2015
-16
2014
-15
2015
-16
2014
-15
2015
-16
2014
-15
2015
-16
2014
-15
2015
-16
2014
-15
2015
-16
2014
-15
Stan
ley
Elec
tric
Co.
Ltd
. 1
30,0
61,6
32 1
50,8
94,18
0-
--
--
--
- 1
30,0
61,6
32 1
50,8
94,18
0Lu
max
Man
noh
Allie
d Te
chno
logi
es L
td.
--
--
-37
,791
--
-37
,791
-
Man
agem
ent
Sup
port
Fe
eSt
anle
y El
ectr
ic C
o. L
td.
61,10
4,27
546
,579
,125
--
--
--
--
61,10
4,27
546
,579
,125
Lum
ax M
anag
emen
t S
ervi
ces
P.Lt
d.-
--
--
-71
,283
,579
--
71,2
83,5
79-
Tota
l (xi
)19
1,16
5,9
07
19
7,47
3,30
5
-
-
-
- 71
,321
,370
-
--
262,
487,
277
19
7,47
3,30
5 xi
i)R
ent
Rec
eive
dLu
max
Aut
o Te
chno
logi
es
Ltd.
--
--
--
9,20
6,99
3
8
,262
,474
--
9,20
6,99
3
8
,262
,474
Lum
ax T
ours
& T
rave
ls Lt
d.-
--
--
-
225
,063
2
01,8
52-
-
225
,063
2
01,8
52Lu
max
Cor
nagl
ia A
uto
Tech
nolo
gies
Pvt
. Ltd
.-
--
--
-4,
441,8
404,
382,
040
--
4,44
1,840
4,38
2,04
0
Lum
ax D
K A
uto
Indu
strie
s Lt
d.-
--
--
-30
0,07
926
9,13
3-
-30
0,07
926
9,13
3
Lum
ax E
nerg
y S
olut
ions
P.
Ltd.
- -
--
--
14,3
13-
--
14,3
13-
Tota
l (xi
i)
-
-
-
-
-
-
1
4,18
8,2
88
1
3,11
5,49
9-
-
14,
188
,28
8
13,
115,
499
xiii)
Div
iden
d R
ecei
ved
SL
Lum
ax L
td.
--
--
--
--
4,94
8,38
94,
948,
389
4,94
8,38
94,
948,
389
Tota
l (xi
ii)-
-
-
-
-
-
-
- 4,
948
,38
94,
948
,38
94,
948
,38
94,
948
,38
9xi
v)R
ent
Pai
dM
r. D
.K. J
ain
--
1,640
,896
1,571
,466
--
--
--
1,640
,896
15,7
1,466
Lum
ax D
K A
uto
Indu
strie
s Lt
d.-
--
--
-13
,734
,595
12,15
2,87
0-
-13
,734
,595
12,15
2,87
0
Tota
l (xi
v)-
-1,6
40,8
96
1,571
,46
6-
-13
,734
,59
512
,152,
870
--
15,3
75,4
91
13,7
24,3
36xv
)M
anag
eria
l Rem
uner
atio
nM
r. D
eepa
k Ja
in-
-
11,4
95,9
66 9
,069
,975
-
--
--
-
11,4
95,9
66
9,0
69,9
75
Mr.
Anm
ol J
ain
--
5
,366
,405
4,6
80,0
00
--
--
--
5
,366
,405
4
,680
,000
M
r. E.
Hiro
oka
--
2,22
0,41
2 2
,162,
809
--
--
--
2,22
0,41
2
2,16
2,80
9M
r. N
.Sat
o
-
-
2,4
58,6
23 2
,329
,063
-
--
--
-
2,4
58,6
23
2,3
29,0
63
Tota
l (xv
)-
- 2
1,541
,40
618
,241
,847
-
-
-
- -
- 2
1,541
,40
6 1
8,2
41,8
47
xvi)
Roy
alty
(gro
ss)
Stan
ley
Elec
tric
Co.
Ltd
. 17
4,45
3,66
1
161,8
55,7
21-
--
--
--
-
174,
453,
661
16
1,855
,721
Tota
l (xv
i)
174,
453,
66
116
1,855
,721
-
-
-
-
-
-
--
174,
453,
66
116
1,855
,721
xvii)
Com
mis
sion
Mr.
D. K
. Jai
n-
-4,
560,
511
1,328
,949
--
--
--
4,56
0,51
11,3
28,9
49M
r. D
eepa
k Ja
in-
-9,
750,
189
--
--
--
-9,
750,
189
-M
r. A
nmol
Jai
n-
-4,
347,
715
--
--
--
-4,
347,
715
-To
tal (
xvii)
--
18,6
58,4
151,3
28,9
49
-
-
-
- -
-18
,658
,415
1,328
,949
Not
es t
o fi
nanc
ial S
tate
men
ts fo
r the
yea
r end
ed M
arch
31,
2016

Lumax Industries Limited | Annual Report 2015-16
115
Not
es t
o fi
nanc
ial S
tate
men
ts fo
r the
yea
r end
ed M
arch
31,
2016
Det
ail o
f Rel
ated
Par
ty T
rans
acti
ons
for t
he F
inan
cial
Yea
r 20
15-1
6A
mou
nt in
GS
. N
oA
ccou
nt H
ead
Ent
erpr
ise
havi
ng
sign
ific
ant
infl
uenc
eK
ey M
anag
emen
t P
erso
nnel
Rel
ativ
es o
f Key
M
anag
emen
t P
erso
nnel
Ent
erpr
ises
ow
ned
or
sign
ifica
ntly
influ
ence
d by
ke
y m
anag
emen
t pe
rson
nel
or t
heir
rela
tive
s
Ass
ocia
teTo
tal
2015
-16
2014
-15
2015
-16
2014
-15
2015
-16
2014
-15
2015
-16
2014
-15
2015
-16
2014
-15
2015
-16
2014
-15
xviii
)Div
iden
d P
aid
Mr.
D. K
. Jai
n-
- 3
3,91
5,43
8 6
,832
,893
--
--
--
33
,915
,438
6
,832
,893
Mr.
Dee
pak
Jain
--
2
,392
,443
4
99,4
89
--
--
--
2
,392
,443
499
,489
M
r. A
nmol
Jai
n-
-
9
41,11
5
193
,823
-
--
--
-
9
41,11
5
19
3,82
3 M
r. M
. K. J
ain
--
--
1
0,50
0
609
,553
-
--
-
10,
500
609,
553
Mr.
U. K
. Jai
n-
--
-
2
7,26
5
5,45
3 -
--
-
2
7,26
5
5,4
53M
rs. U
sha
Jain
--
--
2,5
28,4
53
527
,391
-
--
-
2,52
8,45
352
7,39
1 D
K J
ain
and
Sons
(HU
F)-
--
--
-2,
186,
975
4
37,3
95
--
2,18
6,97
543
7,39
5 Lu
max
Fin
ance
Pvt
. Ltd
.-
--
--
-7,
301,9
28
1,
460,
386
--
7,3
01,9
28
1,
460,
386
Lum
ax A
uto
Tech
nolo
gies
Lt
d.-
--
--
-9,
187,
500
1,83
7,50
0-
-
9
,187,
500
1,83
7,50
0
Lum
ax A
utom
otiv
e S
yste
ms
Ltd.
--
--
--
18,9
00
3
,780
-
-
18
,900
3,7
80
Stan
ley
Elec
tric
Co.
Ltd
.58
,509
,168
11,7
01,8
34-
--
--
--
-58
,509
,168
1
1,701
,834
Oth
ers
--
--
490,
525
--
--
-49
0,52
5-
Tota
l (xv
iii)
58,5
09
,168
11,7
01,8
3437
,248
,99
67,
526
,20
5 3
,056
,743
1,14
2,39
718
,69
5,30
3
3
,739
,06
1 -
-11
7,51
0,2
10
24,
109
,49
7 xi
x)O
ther
s {N
et o
f Inc
ome/
(Exp
endi
ture
)}Lu
max
Aut
o Te
chno
logi
es
Ltd.
--
--
--
(777
,216
)
(
179,
584)
--
(77
7,21
6)
(1
79,5
84)
Lum
ax D
K A
uto
Indu
strie
s Lt
d.
--
--
--
(508
,303
)
(865
,246
)-
-
(508
,303
)
(865
,246
)
Lum
ax A
ncilla
ry L
td.
--
--
--
(292
,802
)
(
411,9
44)
--
(29
2,80
2)
(4
11,9
44)
Lum
ax C
orna
glia
Aut
o Te
chno
logi
es-
--
--
--
114,
574
--
-11
4,57
4
Lum
ax M
anno
h A
llied
Tech
nolo
gies
Ltd
.-
--
--
-(6
1,612
)(9
7,05
6)
--
(61,6
12)
(97,
056)
Lum
ax A
utom
otiv
e S
yste
ms
Ltd.
--
--
--
875,
088
- -
-87
5,08
8
-
Lum
ax M
anag
emen
t S
ervi
ces
P.Lt
d-
--
--
-(2
68,9
04)
- -
-(2
68,9
04)
-
Lum
ax E
nerg
y S
olut
ions
P.
Ltd.
--
--
--
(769
,586
)
-
--
(769
,586
)
-
SL
Lum
ax L
td.
--
--
--
--
-(17
,850
)-
(17,8
50)
Stan
ley
Elec
tric
Co.
Ltd
.1,6
05,6
17 (2
,971
,080
)-
--
--
--
-1,6
05,6
17(2
,971
,080
)To
tal (
xix)
1,60
5,6
17 (2
,971
,08
0)
-
-
-
-
(1,8
03,
335)
(1
,439
,256
)-
(17,
850
)(1
97,
718
)
(4,4
28,18
6)
xx)
Leav
e Li
abili
ty a
nd
Gra
tuit
y Tr
ansf
erLu
max
Man
agem
ent
Ser
vice
s P.
Ltd
--
--
--
(20,
502,
525)
- -
-(2
0,50
2,52
5)
-
Tota
l (xx
)-
--
--
-(2
0,5
02,
525)
- -
-(2
0,5
02,
525)
-

116
Det
ail o
f Rel
ated
Par
ty T
rans
acti
ons
for t
he F
inan
cial
Yea
r 20
15-1
6A
mou
nt in
GS
. N
oA
ccou
nt H
ead
Ent
erpr
ise
havi
ng
sign
ific
ant
infl
uenc
eK
ey M
anag
emen
t P
erso
nnel
Rel
ativ
es o
f Key
M
anag
emen
t P
erso
nnel
Ent
erpr
ises
ow
ned
or
sign
ifica
ntly
influ
ence
d by
ke
y m
anag
emen
t pe
rson
nel
or t
heir
rela
tive
s
Ass
ocia
teTo
tal
2015
-16
2014
-15
2015
-16
2014
-15
2015
-16
2014
-15
2015
-16
2014
-15
2015
-16
2014
-15
2015
-16
2014
-15
B)
BA
LAN
CE
S A
T TH
E
YE
AR
EN
Di)
Rec
eiva
bles
Lu
max
Aut
o Te
chno
logi
es L
td.
--
--
--
178,
079,
135
121,9
84,6
19
--
178,
079,
135
12
1,984
,619
Lu
max
DK
Auto
Indu
strie
s Lt
d.
--
--
--
12,0
70,9
741,5
36,4
03
--
12,0
70,9
74
1,5
36,4
03
Lum
ax C
orna
glia
Aut
o Te
chno
logi
es P
vt. L
td.
--
--
--
679,
250
--
-67
9,25
0-
Lum
ax T
ours
& T
rave
ls Lt
d-
--
--
-34
,256
--
-34
,256
-B
hara
t En
terp
rises
--
--
--
67,6
83-
--
67,6
83-
Lum
ax A
ncilla
ry L
td.
--
--
--
4,30
2,19
85,
208,
376
--
4,30
2,19
8
5,
208,
376
Lum
ax M
anno
h A
llied
Tech
nolo
gies
Ltd
.-
--
--
-99
4,55
615
,314
,057
-
-99
4,55
6
15,
314,
057
Tota
l (i)
-
-
-
-
-
-
196
,228
,042
144,
043
,455
-
-19
6,2
28,0
4214
4,0
43,4
55
ii)P
ayab
les
Lum
ax A
uto
Tech
nolo
gies
Lt
d.-
--
--
-11
3,65
7,02
059
,603
,406
-
-11
3,65
7,02
0
59,
603,
406
Lum
ax D
K A
uto
Indu
strie
s Lt
d.
--
--
--
349,
492,
019
354,
370,
785
--
349,
492,
019
354
,370
,785
Lum
ax M
anno
h A
llied
Tech
nolo
gies
Ltd
.-
--
--
-9,
848
6,16
1 -
-9,
848
6,16
1
Lum
ax T
ours
& T
rave
ls Lt
d.-
--
--
-3,
792,
535
2,85
5,46
6 -
-3,
792,
535
2,8
55,4
66
Lum
ax A
ncilla
ry L
td.
--
--
--
120,
045,
127
117,
743,
896
--
120,
045,
127
11
7,74
3,89
6 B
hara
t En
terp
rises
--
--
--
45,0
88,9
9649
,768
,824
-
-45
,088
,996
49
,768
,824
M
ahav
ir U
dyog
--
--
--
46,2
39,3
2649
,739
,606
-
-46
,239
,326
4
9,73
9,60
6 Lu
max
Man
agem
ent
Ser
vice
s P.
Ltd
--
--
--
15,4
00,8
57-
--
15,4
00,8
57-
Lum
ax E
nerg
y S
olut
ions
P.
Ltd.
--
--
--
769,
586
--
-76
9,58
6-
Lum
ax A
utom
otiv
e S
yste
ms
Ltd.
--
--
--
-
875,
088
--
-
875
,088
Stan
ley
Elec
tric
Co.
Ltd
.15
3,62
0,89
214
7,17
3,62
1 -
--
--
--
-15
3,62
0,89
2 14
7,17
3,62
1 T
otal
(ii)
153,
620
,89
214
7,17
3,6
21
--
-
-
69
4,49
5,31
46
34,9
63,
232
--
848
,116
,20
6 7
82,
136
,853
iii)
Sec
urit
y D
epos
it
Pay
able
Lum
ax A
uto
Tech
nolo
gies
Lt
d.-
--
--
-25
,000
,000
25,0
00,0
00
--
25,0
00,0
0025
,000
,000
Tota
l (iii
)-
--
--
-25
,00
0,0
00
25,0
00
,00
0
--
25,0
00
,00
0 2
5,0
00
,00
0
Not
es t
o fi
nanc
ial S
tate
men
ts fo
r the
yea
r end
ed M
arch
31,
2016
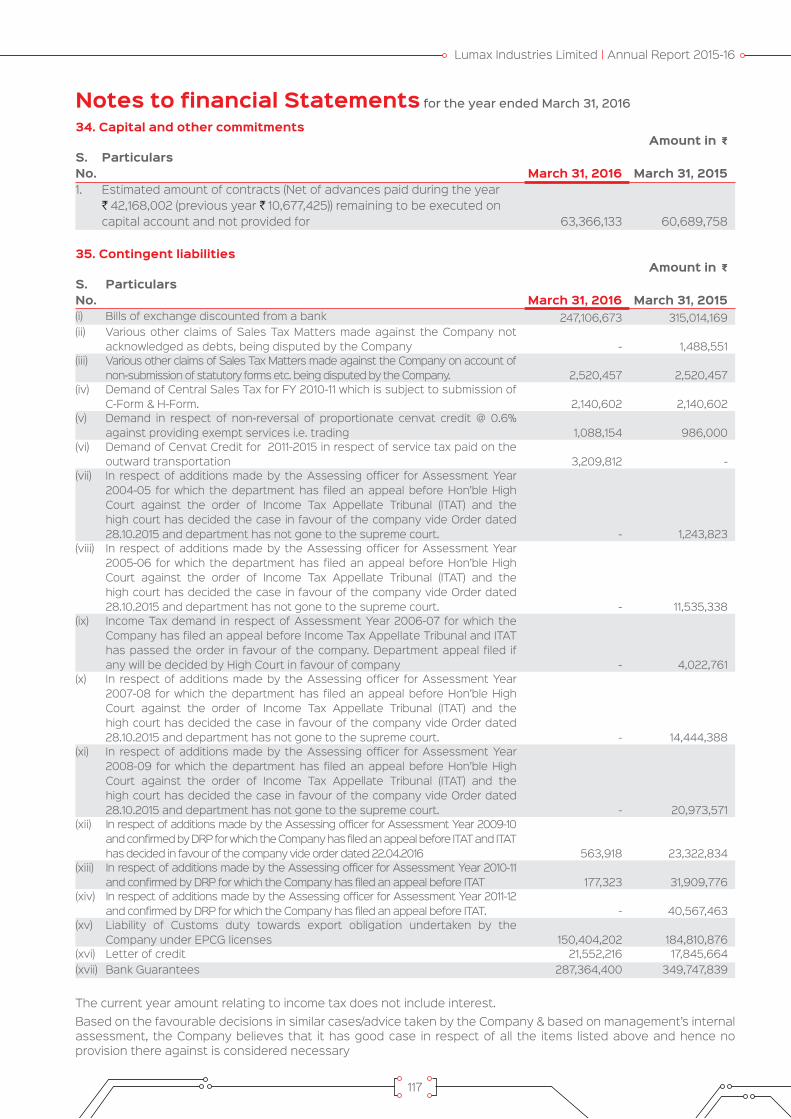
Lumax Industries Limited | Annual Report 2015-16
117
Notes to financial Statements for the year ended March 31, 2016
Amount in GS.No.
ParticularsMarch 31, 2016 March 31, 2015
1. Estimated amount of contracts (Net of advances paid during the year H 42,168,002 (previous year H 10,677,425)) remaining to be executed on capital account and not provided for 63,366,133 60,689,758
Amount in GS.No.
ParticularsMarch 31, 2016 March 31, 2015
(i) Bills of exchange discounted from a bank 247,106,673 315,014,169(ii) Various other claims of Sales Tax Matters made against the Company not
acknowledged as debts, being disputed by the Company - 1,488,551(iii) Various other claims of Sales Tax Matters made against the Company on account of
non-submission of statutory forms etc. being disputed by the Company. 2,520,457 2,520,457(iv) Demand of Central Sales Tax for FY 2010-11 which is subject to submission of
C-Form & H-Form. 2,140,602 2,140,602(v) Demand in respect of non-reversal of proportionate cenvat credit @ 0.6%
against providing exempt services i.e. trading 1,088,154 986,000(vi) Demand of Cenvat Credit for 2011-2015 in respect of service tax paid on the
outward transportation 3,209,812 -(vii) In respect of additions made by the Assessing officer for Assessment Year
2004-05 for which the department has filed an appeal before Hon’ble High Court against the order of Income Tax Appellate Tribunal (ITAT) and the high court has decided the case in favour of the company vide Order dated 28.10.2015 and department has not gone to the supreme court. - 1,243,823
(viii) In respect of additions made by the Assessing officer for Assessment Year 2005-06 for which the department has filed an appeal before Hon’ble High Court against the order of Income Tax Appellate Tribunal (ITAT) and the high court has decided the case in favour of the company vide Order dated 28.10.2015 and department has not gone to the supreme court. - 11,535,338
(ix) Income Tax demand in respect of Assessment Year 2006-07 for which the Company has filed an appeal before Income Tax Appellate Tribunal and ITAT has passed the order in favour of the company. Department appeal filed if any will be decided by High Court in favour of company - 4,022,761
(x) In respect of additions made by the Assessing officer for Assessment Year 2007-08 for which the department has filed an appeal before Hon’ble High Court against the order of Income Tax Appellate Tribunal (ITAT) and the high court has decided the case in favour of the company vide Order dated 28.10.2015 and department has not gone to the supreme court. - 14,444,388
(xi) In respect of additions made by the Assessing officer for Assessment Year 2008-09 for which the department has filed an appeal before Hon’ble High Court against the order of Income Tax Appellate Tribunal (ITAT) and the high court has decided the case in favour of the company vide Order dated 28.10.2015 and department has not gone to the supreme court. - 20,973,571
(xii) In respect of additions made by the Assessing officer for Assessment Year 2009-10 and confirmed by DRP for which the Company has filed an appeal before ITAT and ITAT has decided in favour of the company vide order dated 22.04.2016 563,918 23,322,834
(xiii) In respect of additions made by the Assessing officer for Assessment Year 2010-11 and confirmed by DRP for which the Company has filed an appeal before ITAT 177,323 31,909,776
(xiv) In respect of additions made by the Assessing officer for Assessment Year 2011-12 and confirmed by DRP for which the Company has filed an appeal before ITAT. - 40,567,463
(xv) Liability of Customs duty towards export obligation undertaken by the Company under EPCG licenses 150,404,202 184,810,876
(xvi) Letter of credit 21,552,216 17,845,664(xvii) Bank Guarantees 287,364,400 349,747,839
34. Capital and other commitments
35. Contingent liabilities
The current year amount relating to income tax does not include interest.Based on the favourable decisions in similar cases/advice taken by the Company & based on management’s internal assessment, the Company believes that it has good case in respect of all the items listed above and hence no provision there against is considered necessary

118
Notes to financial Statements for the year ended March 31, 2016
36. Derivative instruments and unhedged foreign currency exposure(a) Derivatives outstanding as at the reporting date
Particulars PurposeCross Currency cum interest rate swap – USD 4,687,500 (March 31, 2015: USD 10,937,500) Notional amount H 310,570,312 (March 31, 2015: H 683,593,749)
Hedge against exposure to outflow for USD loan repayment and its interest payments. Swap to pay fixed interest @ 9.78%, 7.55% and 10.65% p.a. and receive a variable interest @ LIBOR plus Margin.
Amount (in G) Amount ( in Foreign Currency)
Exchange Rate (in G)
Particulars Foreign Currency
March 31, 2016
March 31, 2015
March 31, 2016
March 31, 2015
March 31, 2016
March 31, 2015
Trade Payable
EUR 365,054 18,740,289 4,842 278,915 75.40 67.19GBP - 48,547 - 525 - 92.47JPY 50,141,073 14,934,406 85,006,482 28,651,139 0.5899 0.5213USD 166,495,082 246,764,476 2,512,944 3,948,232 66.26 62.50CHF 505,347 - 7,326 - 68.98 -SGD 123,943 - 2,516 - 49.27 -
Advance Recoverable
EUR 2,354,835 4,461,416 31,233 66,400 75.40 67.19CHF 3,088,235 - 44,770 - 68.98 -JPY - 6,022,301 - 11,553,575 - 0.5213USD 183,301,669 142,908,500 2,766,609 2,286,536 66.26 62.50
Trade ReceivableEUR 7,915,290 4,971,854 104,984 73,997 75.40 67.19GBP 19,064,364 23,597,081 199,684 255,186 95.47 92.47USD 60,106,413 47,799,362 907,198 764,790 66.26 62.50
(b) Particulars of unhedged foreign currency exposure as at the reporting date
Amount in GParticulars March 31, 2016 March 31, 2015The principal amount and the interest due thereon remaining unpaid to any supplier as at the end of each accounting yearPrincipal amount due to micro and small enterprises 722,444 643,833Interest due on above 19,716 5,196
742,160 649,029The amount of interest paid by the buyer in terms of section 16 of the MSMED Act 2006 along with the amounts of the payment made to the supplier beyond the appointed day during each accounting year - -The amount of interest due and payable for the period of delay in making payment (which have been paid but beyond the appointed day during the year) but without adding the interest specified under the MSMED Act 2006. 212,582 70,784The amount of interest accrued and remaining unpaid at the end of each accounting year. 589,595 357,297The amount of further interest remaining due and payable even in the succeeding years, until such date when the interest dues as above are actually paid to the small enterprise for the purpose of disallowance as a deductible expenditure under section 23 of the MSMED Act 2006 - -
37. Details of dues to micro and small enterprises as defined under the MSMED Act, 2006

Lumax Industries Limited | Annual Report 2015-16
119
Notes to financial Statements for the year ended March 31, 2016
Particulars % of total consumption
March 31, 2016Value (G)
March 31, 2016
% of total consumption
March 31, 2015Value (G)
March 31, 2015Raw Materials & Components Imported 7.92 601,067,883 10.25 759,630,016 Indigenously obtained 92.08 6,991,690,753 89.75 6,654,133,452Total 100.00 7,592,758,636 100.00 7,413,763,468Spare parts Imported 1.85 979,072 0.19 99,128 Indigenously obtained 98.15 51,836,036 99.81 52,243,635Total 100.00 52,815,108 100.00 52,342,763
Year of remittance (ending on) March 31, 2016 March 31, 2015
Period to which it relates1 April 2015 to 31 March 2016
1 April 2014 to 31 March 2015
1 April 2013 to 31 March 2014
Number of non-resident shareholders 2 2 2 Number of equity shares held on which dividend was due 3,505,399 3,505,399 3,505,399Amount remitted (in USD) 616,695 284,193 197,439
Amount in GParticulars March 31, 2016 March 31, 2015Exports at F.O.B. Value 268,627,226 270,551,025Recovery of testing charges/Service Income 15,121,522 10,704,736Total 283,748,748 281,255,761
Amount in GParticulars
March 31, 2016 March 31, 2015Raw materials 676,064,647 839,813,389Components and spare parts 46,493,605 36,976,881 Capital goods 493,505,670 639,291,255 Traded Goods 78,172,998 102,272,874 Total 1,294,236,920 1,618,354,399
Amount in GParticulars
March 31, 2016 March 31, 2015Royalty 174,453,661 163,661,896Management Support Fees 61,104,275 46,579,125Travelling Expenses 24,287,607 13,006,580Packing & Forwarding Expenses 1,775,553 3,146,821Salary & Allowances 3,711,282 6,496,004Finance Cost 2,633,370 6,638,719Commission 769,568 731,640Repair & Maintenance 1,058,132 785,499Design & Testing Charges 131,022,960 154,806,299Legal & Professional Expenses 54,059 1,312,802Miscellaneous Expenses 4,040,552 2,691,307Warranty Expense 612,878 -Total 405,523,897 399,856,692
38. Value of imports calculated on CIF basis
39. Expenditure in foreign currency (accrual basis)
40. Imported and indigenous raw materials, components and spare parts consumed
41. Net dividend remitted in foreign exchange
42. Earnings in foreign currency (accrual basis)

120
Notes to financial Statements for the year ended March 31, 2016
Amount in GParticulars March 31, 2016 March 31, 2015a. Capital Expenditure Capital expenditure 17,154,739 14,615,808b. Revenue Expenditure Salaries, Allowances and Bonus 73,028,979 60,285,552 Contribution to Provident Fund 3,586,926 3,183,232 Contribution to Other Funds 206,830 205,111 Staff Welfare 12,120,633 9,124,926 Provision for Retirement Benefit 2,110,993 3,084,066 Insurance 346,346 376,544 Repair & Maintenance 12,277,078 6,968,406 Travelling & Conveyance 29,025,564 23,473,864 Research & Development 1,120 396,661 Electricity 808,238 517,878 Miscellaneous 4,676,826 5,889,926 Design, Support & Testing Charges 1,522,488 222,320 Material/Consumable/Spares 95,830 - Depreciation 15,153,808 16,607,575 Financial Cost 745,982 337,024Total 155,707,641 130,673,085
Amount in GParticulars March 31, 2016 March 31, 2015a. Capital expenditure Capital expenditure 7,463,762 45,329,358b. Revenue Expenditure Salaries, Allowances and Bonus 44,708,512 30,545,058 Contribution to Provident Fund 2,147,793 1,484,628 Contribution to Other Funds 189,125 168,965 Staff Welfare 5,474,640 4,131,218 Provision for Retirement Benefit 1,333,692 1,276,256 Insurance 170,070 179,932 Repair & Maintenance 5,091,501 4,894,030 Travelling & Conveyance 11,521,068 8,157,193 Research & Development 61,383 18,500 Legal & Professional Expenses 3,596,647 33,708 Design, Support & Testing Charges 387,948 31,128 Material / Consumables / Spares 40,538 70,575 Electricity 2,337,783 1,718,459 Miscellaneous 1,821,636 806,496 Depreciation 8,137,997 7,883,475 Financial Cost 218,462 183,623Total 87,238,795 61,583,244
43. Details of Research and Development expenses are as follows:A. The Company has incurred expenses on its in-house research and development center at Gurgaon approved
and recognised by the Ministry of Science & Technology, Government of India.
B. The Company has incurred expenses on its in-house research and development center at Pune approved and recognised by the Ministry of Science & Technology, Government of India.

Lumax Industries Limited | Annual Report 2015-16
121
Notes to financial Statements for the year ended March 31, 2016
44. Corporate Social Responsibility (CSR) As per the provisions of section 135 of the Companies Act, 2013, the Company had to spend atleast 2% of
the average profits of the preceding three financial years towards CSR. Accordingly, a CSR committee has been formed for carrying out the CSR activities as per Schedule VII of the Companies Act, 2013 which amounts to H2,016,882 (Previous year H2,188,228). The Company has spend an amount of H3,259,049 (Previous year H1,279,372) and has accordingly charged the same to the statement of Profit & Loss.
45. The Company has filed the writ petition against Government of West Bengal challenging Singur Land Rehabilitation & Development Act, 2011 for cancellation of allotment of land allotted by West Bengal Industrial Development Corporation. The court has clubbed the vendors’ petitions with Tata Motors Petition and the matter is pending for decision. The management is confident that no losses are expected in this regard.
46. The assets of H239,219,298 (Previous year H151,375,402) recognized by the Company as ‘MAT Credit Entitlement’ under ‘ Loans and Advances’ represents that portion of MAT, which can be recovered and set off in subsequent years based on provisions of Section 115JAA of the Income Tax Act, 1961. The management, based on present trend of profitability and also the future profitability projections, is of the view that there would be sufficient taxable income in foreseeable future, which will enable the Company to utilize MAT credit assets.
47. Previous year’s figures have been regrouped / reclassified, where necessary, to conform to this year’s classification
As per our report of even date
For S. R. BATLIBOI & CO. LLP For and on behalf of the Board of Directors of Lumax Industries LimitedChartered AccountantsICAI firm registration number: 301003E/E300005
per Vikas Mehra D. K. Jain Deepak JainPartner Chairman Managing DirectorMembership No. 94421 DIN: 00085848 DIN: 00004972
Place : New Delhi Shruti Kant Rustagi Shwetank Tiwari Date : May 12, 2016 Chief Financial Officer Company Secretary

122
Statement pursuant to Section 129(3) of the Companies Act, 2013 related to Associate Company
As per our report of even date
For S. R. BATLIBOI & CO. LLP For and on behalf of the Board of Directors of Lumax Industries LimitedChartered AccountantsICAI firm registration number: 301003E/E300005
per Vikas Mehra D. K. Jain Deepak JainPartner Chairman Managing DirectorMembership No. 94421 DIN: 00085848 DIN: 00004972
Place : New Delhi Shruti Kant Rustagi Shwetank Tiwari Date : May 12, 2016 Chief Financial Officer Company Secretary
(Amount in G)Name of the Associate SL Lumax Limited
1. Latest audited balance sheet date 31.03.20162. No. of shares of associate held by the Company in the year end 3,298,986
Amount of Investment in Associate 677,361,061Extent of holding % 21.28
3 Description of how there is significant influence Due to percentage (%) of Share Capital
4Net worth attributable to shareholding as per latest audited balance sheet
671,384,263
5 Profit/ (Loss) for the yeari. Considered in consolidation 151,468,612ii. Not considered in consolidation -
6 Reason why the associate is not consolidated -

Lumax Industries Limited | Annual Report 2015-16
123
CONSOLIDATED FINANCIAL STATEMENTS

124
Report on the Consolidated Financial StatementsWe have audited the accompanying consolidated financial statements of Lumax Industries Limited (“the Holding Company”), its associate (the Holding Company and its associate together referred to as “the Group”), comprising of the consolidated Balance Sheet as at March 31, 2016, the consolidated Statement of Profit and Loss and consolidated Cash Flow Statement for the year then ended, and a summary of significant accounting policies and other explanatory information.
Management’s Responsibility for the Consolidated Financial StatementsThe Holding Company’s Board of Directors is responsible for the preparation of these consolidated financial statements in terms with the requirement of the Companies Act, 2013 (“the Act”) that give a true and fair view of the consolidated financial position, consolidated financial performance and consolidated cash flows of the Group in accordance with accounting principles generally accepted in India, including the Accounting Standards specified under Section 133 of the Act, read with Rule 7 of the Companies (Accounts) Rules, 2014. The respective Board of Directors of the companies included in the Group and of its associates are responsible for maintenance of adequate accounting records in accordance with the provisions of the Act for safeguarding of the assets of the Group and for preventing and detecting frauds and other irregularities; the selection and application of appropriate accounting policies; making judgments and estimates that are reasonable and prudent; and the design, implementation and maintenance of adequate internal financial control that were operating effectively for ensuring the accuracy and completeness of the accounting records, relevant to the preparation and presentation of the financial statements that give a true and fair view and are free from material misstatement, whether due to fraud or error, which have been used for the purpose of preparation of the consolidated financial statements by the Directors of the Holding Company, as aforesaid.
Auditor’s ResponsibilityOur responsibility is to express an opinion on these consolidated financial statements based on our audit. While conducting the audit, we have taken into account the provisions of the Act, the accounting and auditing standards and matters which are required to be included in the audit report under the provisions of the Act and the Rules made thereunder. We conducted our audit in accordance with the Standards on Auditing,
issued by the Institute of Chartered Accountants of India, as specified under Section 143(10) of the Act. Those Standards require that we comply with ethical requirements and plan and perform the audit to obtain reasonable assurance about whether the financial statements are free from material misstatement.
An audit involves performing procedures to obtain audit evidence about the amounts and disclosures in the consolidated financial statements. The procedures selected depend on the auditor’s judgment, including the assessment of the risks of material misstatement of the consolidated financial statements, whether due to fraud or error. In making those risk assessments, the auditor considers internal financial control relevant to the Holding Company’s preparation of the consolidated financial statements that give a true and fair view in order to design audit procedures that are appropriate in the circumstances. An audit also includes evaluating the appropriateness of accounting policies used and the reasonableness of the accounting estimates made by the Holding Company’s Board of Directors, as well as evaluating the overall presentation of the consolidated financial statements. We believe that the audit evidence obtained by us and the audit evidence obtained by the other auditors in terms of their reports referred to in paragraph (a) of the Other Matters below, is sufficient and appropriate to provide a basis for our audit opinion on the consolidated financial statements.
OpinionIn our opinion and to the best of our information and according to the explanations given to us, the consolidated financial statements give the information required by the Act in the manner so required and give a true and fair view in conformity with the accounting principles generally accepted in India of the consolidated state of affairs of the Group, its associates as at March 31, 2016, their consolidated profit/loss, and their consolidated cash flows for the year ended on that date.
Report on Other Legal and Regulatory RequirementsAs required by section 143 (3) of the Act, we report, to the extent applicable, that:
(a) We /the other auditors whose reports we have relied upon have sought and obtained all the information and explanations which to the best of our knowledge and belief were necessary for the purpose of our audit of the aforesaid consolidated financial statements;
To the Members of Lumax Industries Limited
INDEPENDENT AUDITOR’S REPORT
Lumax Industries Limited | Annual Report 2015-16
125
(b) In our opinion proper books of account as required by law relating to preparation of the aforesaid consolidation of the financial statements have been kept so far as it appears from our examination of those books and reports of the other auditors;
(c) The consolidated Balance Sheet, consolidated Statement of Profit and Loss, and consolidated Cash Flow Statement dealt with by this Report are in agreement with the books of account maintained for the purpose of preparation of the consolidated financial statements;
(d) In our opinion, the aforesaid consolidated financial statements comply with the Accounting Standards specified under section 133 of the Act, read with Rule 7 of the Companies (Accounts) Rules, 2014;
(e) On the basis of the written representations received from the directors of the Holding Company as on March 31, 2016 taken on record by the Board of Directors of the Holding Company and the reports of the auditors who are appointed under Section 139 of the Act, of its associate company incorporated in India, none of the directors of the Group’s companies, its associates incorporated in India is disqualified as on 31st March, 2016 from being appointed as a director in terms of Section 164 (2) of the Act.
(f) With respect to the adequacy and the operating effectiveness of the internal financial controls over financial reporting of the Holding Company and its associate company incorporated in India, refer to our separate report in “Annexure 1” to this report;
(g) With respect to the other matters to be included in the Auditor’s Report in accordance with Rule 11 of the Companies (Audit and Auditors) Rules, 2014, in our opinion and to the best of our information and according to the explanations given to us:
i. The consolidated financial statements disclose the impact of pending litigations on its
consolidated financial position of the Group, its associates– Refer Note 34 to the consolidated financial statements;
ii. Provision has been made in the consolidated financial statements, as required under the applicable law or accounting standards, for material foreseeable losses, if any, on long-term contracts including derivative contracts – Refer (a) Note 35 to the consolidated financial statements in respect of such items as it relates to the Group, its associates and (b) the Group’s share of net profit/loss in respect of its associates;
iii. There has been no delay in transferring amounts, required to be transferred, to the Investor Education and Protection Fund by the Holding Company, associates companies incorporated in India.
Other Matter(a) We did not audit the financial information of an
associate, the proportionate share of the group being H 15,14,68,612 for the year ending March 31 ,2016. This financial information has been audited by other auditor whose reports has been furnished to us, and our opinion is based solely on the report of the other auditor. Our opinion is not qualified in respect of this matter.
For S.R. Batliboi& CO. LLP Chartered Accountants
ICAI Firm Registration Number: 301003E/E300005
per Vikas MehraPartner
Membership Number: 94421
Place of Signature: New DelhiDate: May 12, 2016
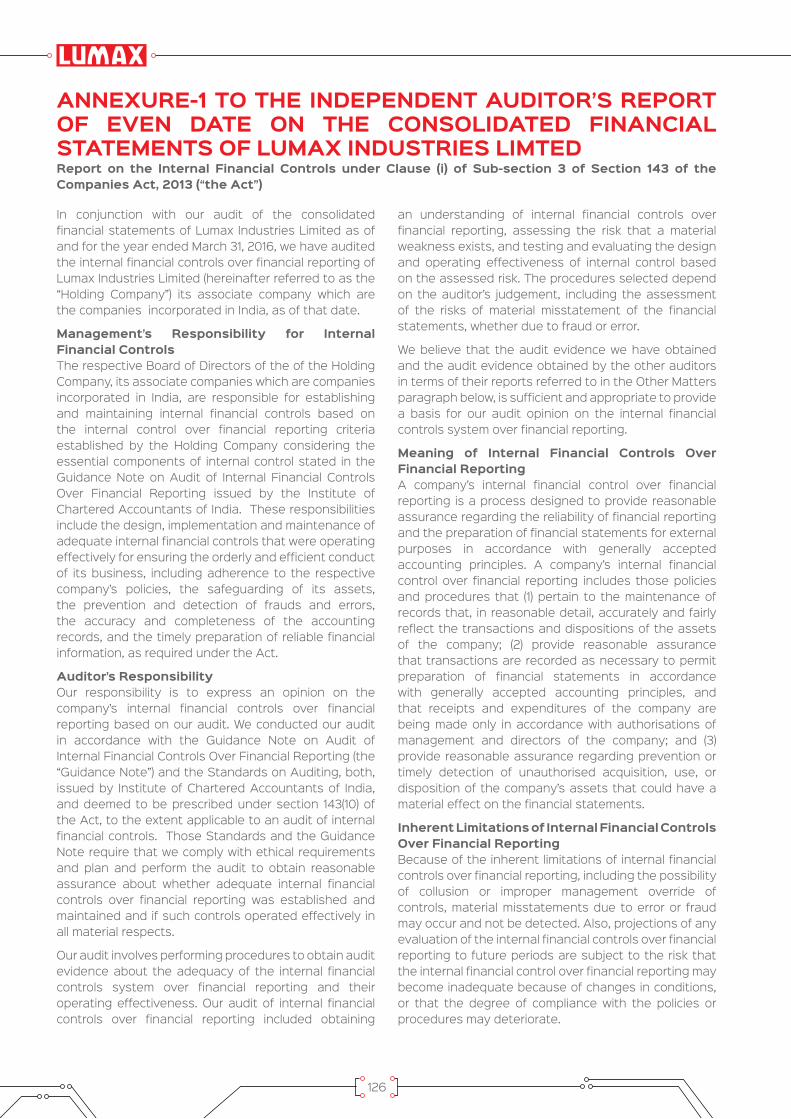
126
In conjunction with our audit of the consolidated financial statements of Lumax Industries Limited as of and for the year ended March 31, 2016, we have audited the internal financial controls over financial reporting of Lumax Industries Limited (hereinafter referred to as the “Holding Company”) its associate company which are the companies incorporated in India, as of that date.
Management’s Responsibility for Internal Financial Controls The respective Board of Directors of the of the Holding Company, its associate companies which are companies incorporated in India, are responsible for establishing and maintaining internal financial controls based on the internal control over financial reporting criteria established by the Holding Company considering the essential components of internal control stated in the Guidance Note on Audit of Internal Financial Controls Over Financial Reporting issued by the Institute of Chartered Accountants of India. These responsibilities include the design, implementation and maintenance of adequate internal financial controls that were operating effectively for ensuring the orderly and efficient conduct of its business, including adherence to the respective company’s policies, the safeguarding of its assets, the prevention and detection of frauds and errors, the accuracy and completeness of the accounting records, and the timely preparation of reliable financial information, as required under the Act.
Auditor’s ResponsibilityOur responsibility is to express an opinion on the company’s internal financial controls over financial reporting based on our audit. We conducted our audit in accordance with the Guidance Note on Audit of Internal Financial Controls Over Financial Reporting (the “Guidance Note”) and the Standards on Auditing, both, issued by Institute of Chartered Accountants of India, and deemed to be prescribed under section 143(10) of the Act, to the extent applicable to an audit of internal financial controls. Those Standards and the Guidance Note require that we comply with ethical requirements and plan and perform the audit to obtain reasonable assurance about whether adequate internal financial controls over financial reporting was established and maintained and if such controls operated effectively in all material respects.
Our audit involves performing procedures to obtain audit evidence about the adequacy of the internal financial controls system over financial reporting and their operating effectiveness. Our audit of internal financial controls over financial reporting included obtaining
an understanding of internal financial controls over financial reporting, assessing the risk that a material weakness exists, and testing and evaluating the design and operating effectiveness of internal control based on the assessed risk. The procedures selected depend on the auditor’s judgement, including the assessment of the risks of material misstatement of the financial statements, whether due to fraud or error.
We believe that the audit evidence we have obtained and the audit evidence obtained by the other auditors in terms of their reports referred to in the Other Matters paragraph below, is sufficient and appropriate to provide a basis for our audit opinion on the internal financial controls system over financial reporting.
Meaning of Internal Financial Controls Over Financial Reporting A company’s internal financial control over financial reporting is a process designed to provide reasonable assurance regarding the reliability of financial reporting and the preparation of financial statements for external purposes in accordance with generally accepted accounting principles. A company’s internal financial control over financial reporting includes those policies and procedures that (1) pertain to the maintenance of records that, in reasonable detail, accurately and fairly reflect the transactions and dispositions of the assets of the company; (2) provide reasonable assurance that transactions are recorded as necessary to permit preparation of financial statements in accordance with generally accepted accounting principles, and that receipts and expenditures of the company are being made only in accordance with authorisations of management and directors of the company; and (3) provide reasonable assurance regarding prevention or timely detection of unauthorised acquisition, use, or disposition of the company’s assets that could have a material effect on the financial statements.
Inherent Limitations of Internal Financial Controls Over Financial ReportingBecause of the inherent limitations of internal financial controls over financial reporting, including the possibility of collusion or improper management override of controls, material misstatements due to error or fraud may occur and not be detected. Also, projections of any evaluation of the internal financial controls over financial reporting to future periods are subject to the risk that the internal financial control over financial reporting may become inadequate because of changes in conditions, or that the degree of compliance with the policies or procedures may deteriorate.
ANNEXURE-1 TO THE INDEPENDENT AUDITOR’S REPORT OF EVEN DATE ON THE CONSOLIDATED FINANCIAL STATEMENTS OF LUMAX INDUSTRIES LIMTEDReport on the Internal Financial Controls under Clause (i) of Sub-section 3 of Section 143 of the Companies Act, 2013 (“the Act”)

Lumax Industries Limited | Annual Report 2015-16
127
OpinionIn our opinion, the Holding Company ,its associate company which are companies incorporated in India, have, maintained in all material respects, an adequate internal financial controls system over financial reporting and such internal financial controls over financial reporting were operating effectively as at March 31, 2016, based on the internal control over financial reporting criteria established by the Holding Company considering the essential components of internal control stated in the Guidance Note on Audit of Internal Financial Controls Over Financial Reporting issued by the Institute of Chartered Accountants of India.
Other MattersOur report under Section 143(3)(i) of the Act on the adequacy and operating effectiveness of the internal
financial controls over financial reporting of the Holding Company,insofar as it relates to the one associate company, which is the company incorporated in India, is based on the corresponding report of the auditors of such, associate company incorporated in India.
For S.R. Batliboi& CO. LLP Chartered Accountants
ICAI Firm Registration Number: 301003E/E300005
per Vikas MehraPartner
Membership Number: 94421
Place of Signature: New DelhiDate: May 12, 2016

128
(Amount in G)Particulars Notes As at
March 31, 2016I EQUITY & LIABILITIES Shareholders’ funds (a) Share capital 3 93,477,320 (b) Reserves and surplus 4 2,590,191,806
2,683,669,126 Non-Current Liabilities (a) Long term borrowings 5 105,728,944 (b) Deferred tax liabilities (net) 6 194,418,367 (c) Other long term liabilities 7 248,712,544 (d) Long term provisions 8 92,716,007
641,575,862 Current Liabilities (a) Short term borrowings 9 848,253,641 (b) Trade payables 10 - Total outstanding due of micro enterprises and small enterprises 722,444 - Total outstanding due of creditors other than micro enterprises and
small enterprises 3,071,045,229 (c) Other current liabilities 11 1,284,420,745 (d) Short term provisions 8 55,912,545
5,260,354,604 TOTAL 8,585,599,592 II ASSETS Non-Current Assets (a) Fixed assets Tangible assets 12 4,054,223,293 Intangible assets 13 25,673,979 Capital work in progress 170,377,539 (b) Non-Current Investments 14 686,961,061 (c) Long term loans and advances 15 306,077,094 (d) Other Non-Current assets 16.2 12,148,876 5,255,461,842 Current Assets (a) Current investments 17 987,000 (b) Inventories 18 1,045,501,751 (c) Trade receivables 16.1 1,811,903,475 (d) Cash and bank balances 19 34,552,286 (e) Short-term loans and advances 15 366,211,993 (f) Other current assets 16.2 70,981,245
3,330,137,750 TOTAL 8,585,599,592 Summary of significant accounting policies 2.1
Consolidated Balance Sheet as at March 31, 2016
The accompanying notes are an integral part of the financial statements.
As per our report of even date
For S. R. BATLIBOI & CO. LLP For and on behalf of the Board of Directors of Lumax Industries LimitedChartered AccountantsICAI firm registration number: 301003E/E300005
per Vikas Mehra D. K. Jain Deepak JainPartner Chairman Managing DirectorMembership No. 94421 DIN: 00085848 DIN: 00004972
Place : New Delhi Shruti Kant Rustagi Shwetank Tiwari Date : May 12, 2016 Chief Financial Officer Company Secretary

Lumax Industries Limited | Annual Report 2015-16
129
(Amount in G)Particulars Notes Year ended
March 31, 2016INCOMERevenue from Operations (Gross) 20 14,036,404,103 Less: Excise duty (1,484,651,738)Revenue from Operations (Net) 12,551,752,365 Other income 21 38,815,251 TOTAL REVENUE (I) 12,590,567,616 EXPENDITURECost of raw material and components consumed 22.1 7,592,758,636 Cost of moulds, tools & dies 22.2 706,270,842 Purchase of traded goods 23 78,726,759 (Increase)/ decrease in inventories of finished goods work-in-progress and traded goods
23 19,412,408
Employee benefits expense 24 1,426,657,724 Other expenses 25 1,842,419,058 Depreciation and amortisation expense 26 378,987,980Finance costs 27 134,378,847 TOTAL (II) 12,179,612,254 Profit before tax (I-II) 410,955,362 Tax expensesMinimum alternate tax 87,820,983 Less : MAT credit entitlement (87,820,983)Net current tax liability - Current Tax for earlier years 12,558 Deferred tax 42,151,450 Total tax expense 42,164,008 Profit for the year befor share of Profit of associate 368,791,354 Add : Investor's share of Profit in associate 151,468,612 Net Profit for the year 520,259,966 Earnings per equity share - Basic and diluted {Nominal value of share H10}
28 55.66
Summary of significant accounting policies 2.1
Consolidated Statement of Profit and Loss for the year ended March 31, 2016
The accompanying notes are an integral part of the financial statements.
As per our report of even date
For S. R. BATLIBOI & CO. LLP For and on behalf of the Board of Directors of Lumax Industries LimitedChartered AccountantsICAI firm registration number: 301003E/E300005
per Vikas Mehra D. K. Jain Deepak JainPartner Chairman Managing DirectorMembership No. 94421 DIN: 00085848 DIN: 00004972
Place : New Delhi Shruti Kant Rustagi Shwetank Tiwari Date : May 12, 2016 Chief Financial Officer Company Secretary
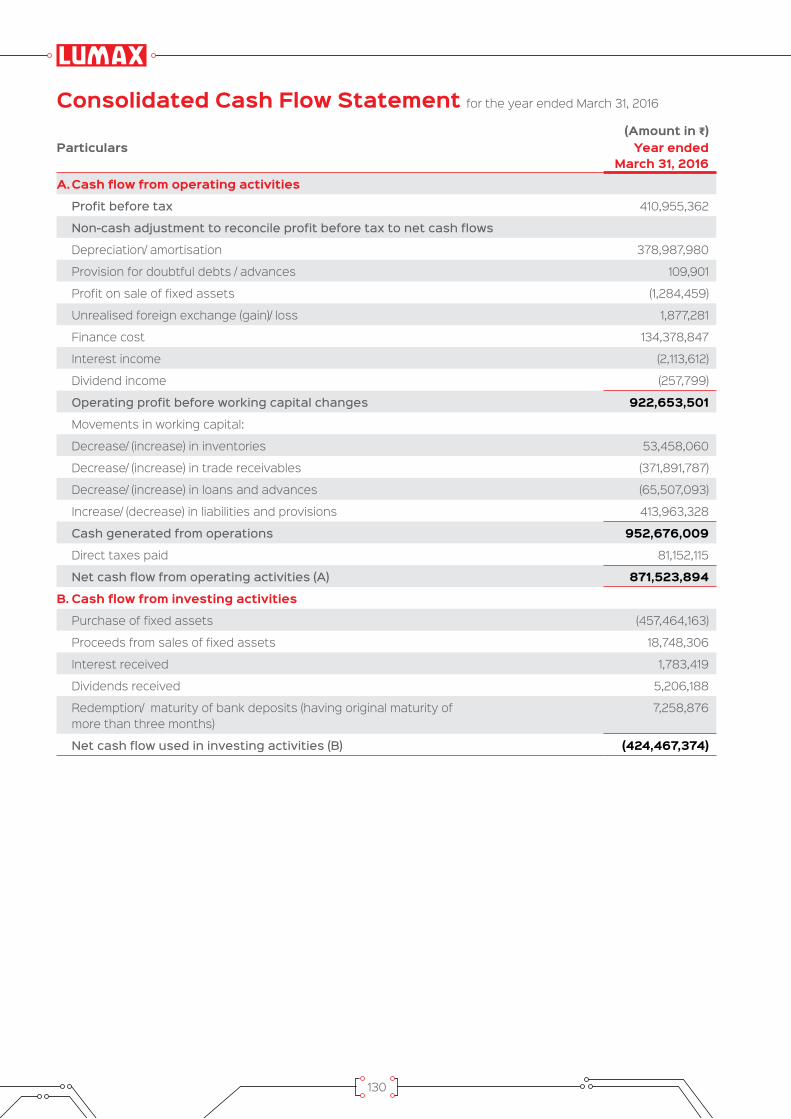
130
(Amount in G)Particulars Year ended
March 31, 2016A. Cash flow from operating activities
Profit before tax 410,955,362
Non-cash adjustment to reconcile profit before tax to net cash flows
Depreciation/ amortisation 378,987,980
Provision for doubtful debts / advances 109,901
Profit on sale of fixed assets (1,284,459)
Unrealised foreign exchange (gain)/ loss 1,877,281
Finance cost 134,378,847
Interest income (2,113,612)
Dividend income (257,799)
Operating profit before working capital changes 922,653,501
Movements in working capital:
Decrease/ (increase) in inventories 53,458,060
Decrease/ (increase) in trade receivables (371,891,787)
Decrease/ (increase) in loans and advances (65,507,093)
Increase/ (decrease) in liabilities and provisions 413,963,328
Cash generated from operations 952,676,009
Direct taxes paid 81,152,115
Net cash flow from operating activities (A) 871,523,894
B. Cash flow from investing activities
Purchase of fixed assets (457,464,163)
Proceeds from sales of fixed assets 18,748,306
Interest received 1,783,419
Dividends received 5,206,188
Redemption/ maturity of bank deposits (having original maturity of more than three months)
7,258,876
Net cash flow used in investing activities (B) (424,467,374)
Consolidated Cash Flow Statement for the year ended March 31, 2016
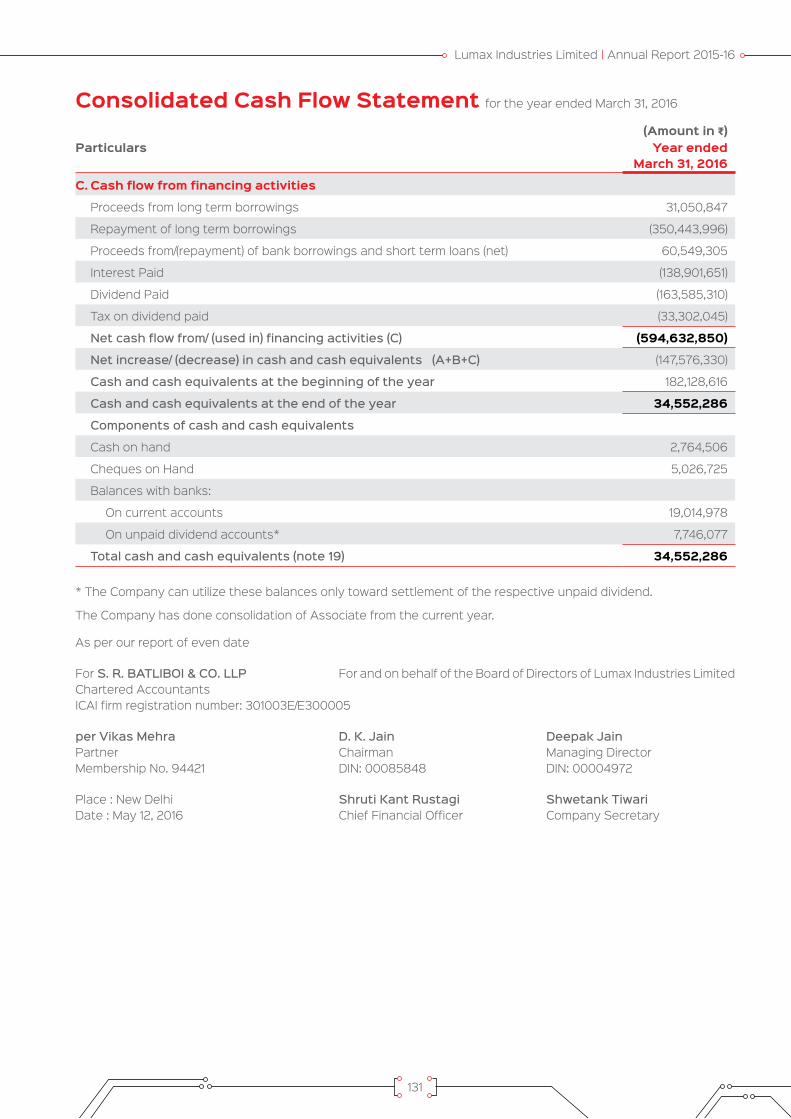
Lumax Industries Limited | Annual Report 2015-16
131
Consolidated Cash Flow Statement for the year ended March 31, 2016
As per our report of even date
For S. R. BATLIBOI & CO. LLP For and on behalf of the Board of Directors of Lumax Industries LimitedChartered AccountantsICAI firm registration number: 301003E/E300005
per Vikas Mehra D. K. Jain Deepak JainPartner Chairman Managing DirectorMembership No. 94421 DIN: 00085848 DIN: 00004972
Place : New Delhi Shruti Kant Rustagi Shwetank Tiwari Date : May 12, 2016 Chief Financial Officer Company Secretary
(Amount in G)Particulars Year ended
March 31, 2016
C. Cash flow from financing activities
Proceeds from long term borrowings 31,050,847
Repayment of long term borrowings (350,443,996)
Proceeds from/(repayment) of bank borrowings and short term loans (net) 60,549,305
Interest Paid (138,901,651)
Dividend Paid (163,585,310)
Tax on dividend paid (33,302,045)
Net cash flow from/ (used in) financing activities (C) (594,632,850)
Net increase/ (decrease) in cash and cash equivalents (A+B+C) (147,576,330)
Cash and cash equivalents at the beginning of the year 182,128,616
Cash and cash equivalents at the end of the year 34,552,286
Components of cash and cash equivalents
Cash on hand 2,764,506
Cheques on Hand 5,026,725
Balances with banks:
On current accounts 19,014,978
On unpaid dividend accounts* 7,746,077
Total cash and cash equivalents (note 19) 34,552,286
* The Company can utilize these balances only toward settlement of the respective unpaid dividend.
The Company has done consolidation of Associate from the current year.

132
1. Corporate information and principles of consolidation
The consolidated financial statements relates to Lumax Industries Limited (‘Parent Company’) and its associate company. The Company is a leading manufacturer and supplier of auto components, mainly automotive lighting systems for four wheeler and two wheeler applications. The Company has technical as well as financial collaboration with Stanley Electric Co. Ltd., Japan. The consolidated financial statements have been prepared on the following basis:
a. The financial statements of the parent company and its associate have been combined as per equity method from the date on which it falls within the definition of an associate as per Accounting Standard – 21, on Consolidated Financial Statements, notified under the Companies (Accounting Standards) Rules, 2014. On acquisition of the investment, any difference between the cost of acquisition and the Company’s share of the equity of the associate has been described as goodwill or capital reserve, as the case may be.
b. The parent Company has prepared the accompanying consolidated financial statements by including the parent Company’s proportionate share in the associate’s net profit (after taxes) as per equity method. Unrealised profits and losses resulting from transactions between the parent Company and the associate have been eliminated to the extent of parent Company’s proportionate share.
c. Details of the associate Company is as follows:
Name Country of Incorporation
Percentage Holding as at March 31, 2016
SL Lumax Limited
India 21.28%
d. The Parent Company and its associate follow a uniform accounting period and as far as possible, the Consolidated Financial Statements have been prepared using accounting policies for like transactions and other events in similar circumstances and are presented to the extent possible, in the same manner as the Parent Company’s separate financial statements.
2. Basis of preparation The financial statements of the Company have
been prepared and presented in accordance with generally accepted accounting principles in India (Indian GAAP). The Company has prepared these
financial statements to comply with all material respects with the accounting standards specified under section 133 of the Companies Act, 2013, read together with paragraph 7 of the Companies (Accounts) Rules, 2014. The financial statements have been prepared on an accrual basis and under the historical cost convention. The accounting policies adopted in the preparation of financial statements are given below.
2.1 Summary of significant accounting policies a. Use of estimates The preparation of financial statements are
in conformity with Indian GAAP requires the management to make judgments, estimates and assumptions that affect the reported amounts of assets, liabilities, revenue and expenses during the reported period. Although these estimates are based on the management’s best knowledge of current events and actions, uncertainty about these assumptions and estimates could result in the outcomes requiring a material adjustment to the carrying amounts of assets, liabilities, revenue and expenses in future periods. Changes in estimates are reflected in the financial statements in the period in which changes are made and if material, their effects are disclosed in notes to accounts.
b. Goodwill/ capital reserve Goodwill/ capital reserve represents the
difference between the parent’s Company share in the net worth of the associate company and the cost of acquisition at the time of making the investment in the associate company. For this purpose, the Parent Company’s share of net worth of the associate company is determined on the basis of the latest financial statements of the associate company prior to acquisition, after making necessary adjustments for material events between the date of such financial statements and the date of respective acquisition.
c. Tangible Fixed Assets Fixed assets, are stated at cost (or re-
valued amounts, as the case may be), net of accumulated depreciation and accumulated impairment losses, if any. The cost comprises purchase price, borrowing costs if capitalization criteria are met and directly attributable cost of bringing the asset to its working condition for the intended use. Any trade discounts and rebates are deducted in arriving at the purchase price.
Notes to Consolidated financial Statements for the year ended March 31, 2016

Lumax Industries Limited | Annual Report 2015-16
133
Notes to Consolidated financial Statements for the year ended March 31, 2016
The Company has revalued some of the Land, Building and Plant & Machinery existing on different dates. These Land, Building and Plant & Machinery are measured at fair value less accumulated depreciation and impairment losses, if any, recognised after the date of the revaluation. In case of revaluation of fixed assets, any revaluation surplus is credited to the revaluation reserve, except to the extent that it reverses a revaluation decrease of the same asset previously recognized in the statement of profit and loss, in which case the increase is recognized in the statement of profit and loss. A revaluation deficit is recognized in the statement of profit and loss, except to the extent that it offsets an existing surplus on the same asset recognized in the asset revaluation reserve.
Subsequent expenditure related to an item of fixed asset is added to its book value only if it increases the future benefits from the existing asset beyond its previously assessed standard of performance. All other expenses on existing fixed assets, including day-to-day repair and maintenance expenditure and cost of replacing parts, are charged to the statement of profit and loss for the period during which such expenses are incurred.
Gains or losses arising from the de-recognition of fixed assets are measured as the difference between the net disposal proceeds and the carrying amount of the asset and are recognized in the statement of profit and loss when the asset is derecognized.
d. Depreciation on Tangible fixed assets Leasehold land is amortized over the period of
lease ranging from 90 years to 99 years.
Depreciation on other fixed assets is calculated on a straight line basis using rates arrived at based on the useful lives estimated by the management. The Company has used following estimated useful life to provide depreciation on its fixed assets:
Particulars Estimated useful life (Years)-Factory building 30-Other building 60-Plant and Machinery (i, ii) 3-21-Furniture and fixtures 10-Vehicles (ii) 5-Office equipment 5
i) The management has estimated supported by independent assessment, the useful life of certain plant and machinery as 21 years,
which is higher than those indicated in schedule II of the Companies Act 2013.
ii) The management has estimated, based on past experience, the useful life of these blocks of assets as lower than the life indicated for respective block ofassets in schedule II of the Companies Act 2013.
e. Intangible Assets Intangible assets acquired separately are
measured on initial recognition at cost. Following initial recognition, intangible assets are carried at cost less accumulated amortization and accumulated impairment losses, if any. Internally generated intangible assets, excluding capitalized development costs, are not capitalized and expenditure is reflected in the statement of profit and loss in the year in which the expenditure is incurred.
Intangibles assets are amortized using straight-line method over their estimated useful lives as follows:Intangible Assets
Estimated Useful Life (Years)
Computer Software
Over the estimated economic useful lives ranging from 3.5 to 4 years
Technical Know-how
Over the period of Technical Assistance Agreement i.e. 8 years
Gains or losses arising from de-recognition of an intangible asset are measured as the difference between the net disposal proceeds and the carrying amount of the asset and are recognized in the statement of profit and loss when the asset is derecognized.
f. Research costs Research costs are expensed as incurred.
g. Leases Where the Company is the lessee
Finance leases, which effectively transfer to the Company substantially all the risks and benefits incidental to ownership of the leased item, are capitalized at the lower of the fair value of leased property and present value of the minimum lease payments at the inception of the lease term and disclosed as leased assets.
Lease payments are apportioned between the finance charges and reduction of the lease liability so as to achieve a constant rate of interest on the remaining balance of the liability. Finance charges are recognized as finance costs in the statement of profit and loss. Lease

134
management fees, legal charges and other initial direct costs are capitalised.
A leased asset is depreciated on a straight-line basis over the useful life of the asset. However, if there is no reasonable certainty that the Company will obtain the ownership by the end of the lease term, the capitalized asset is depreciated on a straight-line basis over the shorter of the estimated useful life of the asset or the lease term.
Leases, where the lessor effectively retains substantially all the risks and benefits of ownership of the leased item are classified as operating leases. Operating lease payments are recognized as an expense in the statement of profit and loss on a straight-line basis over the lease term.
Where the Company is the lessor
Leases in which the Company transfers substantially all the risks and benefits of ownership of the asset are classified as finance leases. Assets given under finance lease are recognized as a receivable at an amount equal to the net investment in the lease. After initial recognition, the Company apportions lease rentals between the principal repayment and interest income so as to achieve a constant periodic rate of return on the net investment outstanding in respect of the finance lease. The interest income is recognized in the statement of profit and loss. Initial direct costs such as legal costs, brokerage costs, etc. are recognized immediately in the statement of profit and loss.
Leases in which the Company does not transfer substantially all the risks and benefits of ownership of the asset are classified as operating leases. Assets subject to operating leases are included in fixed assets. Lease income on an operating lease is recognized in the statement of profit and loss on a straight-line basis over the lease term. Costs, including depreciation, are recognized as an expense in the statement of profit and loss. Initial direct costs such as legal costs, brokerage costs, etc. are recognized immediately in the statement of profit and loss.
h. Borrowing costs Borrowing cost includes interest, amortization
of ancillary costs incurred in connection with the arrangement of borrowings and exchange differences arising from foreign currency borrowings to the extent they are regarded as an adjustment to the interest cost.
Borrowing costs directly attributable to the acquisition, construction or production of an asset that necessarily takes a substantial period of time to get ready for its intended use or sale are capitalized as part of the cost of the respective asset. All other borrowing costs are expensed in the period they occur.
i. Government Grant and subsidies Grants and subsidies from the government are
recognized when there is reasonable assurance that (i) the Company will comply with the conditions attached to them, and (ii) the grant/subsidy will be received.
When the grant or subsidy relates to revenue, it is recognized as income on a systematic basis in the statement of profit and loss over the periods necessary to match them with the related costs, which they are intended to compensate. Where the grant relates to an asset, the grant is shown as a deduction from the gross value of the asset concerned in arriving at its book value. The grant is thus recognised in the statement of profit and loss over the useful life of a depreciable asset by way of a reduced depreciation charge.
j. Impairment of tangible and intangible assets The Company assesses at each reporting date
whether there is an indication that an asset may be impaired. If any indication exists, or when annual impairment testing for an asset is required, the Company estimates the asset’s recoverable amount. An asset’s recoverable amount is the higher of an asset’s or cash-generating unit’s (CGU) net selling price and its value in use. The recoverable amount is determined for an individual asset, unless the asset does not generate cash inflows that are largely independent of those from other assets or groups of assets. Where the carrying amount of an asset or CGU exceeds its recoverable amount, the asset is considered impaired and is written down to its recoverable amount.
Impairment losses of continuing operations, including impairment on inventories, are recognized in the statement of profit and loss, except for previously revalued tangible fixed assets, where the revaluation was taken to revaluation reserve. In this case, the impairment is also recognized in the revaluation reserve up to the amount of any previous revaluation.
After impairment, depreciation is provided on the revised carrying amount of the asset over its remaining useful life.
An assessment is made at each reporting
Notes to Consolidated financial Statements for the year ended March 31, 2016

Lumax Industries Limited | Annual Report 2015-16
135
date as to whether there is any indication that previously recognized impairment losses may no longer exist or may have decreased. If such indication exists, the company estimates the asset’s or cash-generating unit’s recoverable amount. A previously recognized impairment loss is reversed only if there has been a change in the assumptions used to determine the asset’s recoverable amount since the last impairment loss was recognized. The reversal is limited so that the carrying amount of the asset does not exceed its recoverable amount, nor exceed the carrying amount that would have been determined, net of depreciation, had no impairment loss been recognized for the asset in prior years. Such reversal is recognized in the statement of profit and loss unless the asset is carried at a revalued amount, in which case the reversal is treated as a revaluation increase.
k. Investments Investments, which are readily realizable and
intended to be held for not more than one year from the date on which such investments are
made, are classified as current investments. All other investments are classified as long-term investments.
On initial recognition, all investments are measured at cost. The cost comprises purchase price and directly attributable acquisition charges such as brokerage, fees and duties. If an investment is acquired, or partly acquired, by the issue of shares or other securities, the acquisition cost is the fair value of the securities issued.
Current investments are carried in the financial statements at lower of cost and fair value determined on an individual investment basis. Long-term investments are carried at cost. However, provision for diminution in value is made to recognize a decline other than temporary in the value of the investments.
On disposal of an investment, the difference between its carrying amount and net disposal proceeds is charged or credited to the statement of profit and loss.
l. Inventories Inventories are valued as follows:
Raw materials and components, Stores and spares (including packing materials)
At Cost and Net Realizable Value, whichever is lower. However, materials and other items held for use in the production of inventories are not written down below cost if the finished products in which they will be incorporated are expected to be sold at or above cost.
Cost is determined on moving weighted average basis. Cost of raw materials and components lying in bonded warehouse includes custom duty accounted for on accrual basis.
Finished goods & Traded goods, Work-in-progress and Moulds, tools and dies in process
At Cost and Net Realizable Value, whichever is lower. Cost of Finished goods and Work-in-progress (including moulds, tools and dies in process) includes direct materials, labour and a proportion of manufacturing overheads based on normal operating capacity. Cost of traded goods includes cost of purchase and other costs incurred in bringing the inventories to their present location and condition. Cost is determined on moving weighted average basis. Cost of finished goods includes excise duty
Scrap At net realizable value.
Net realizable value is the estimated selling price in the ordinary course of business, less estimated costs of completion and to make the sale.
Notes to Consolidated financial Statements for the year ended March 31, 2016
136
m. Revenue Recognition Revenue is recognized to the extent that it
is probable that the economic benefits will flow to the Company and the revenue can be reliably measured. The following specific recognition criteria must be met before revenue is recognised.
Sale of goods Revenue from sale of Goods is recognised when
the significant risks and rewards of ownership of the goods have passed to the buyer usually on delivery of Goods to the customer. The Company collects sales taxes and value added taxes (VAT) on behalf of the government and, therefore, these are not economic benefits flowing to the Company. Hence, they are excluded from revenue. Excise duty deducted from revenue (gross) is the amount that is included in the revenue (gross) and not the entire amount of liability arising during the year.
Sale of services Revenues from service contracts are recognized
as and when services are rendered. The Company collects service tax on behalf of the government and, therefore, it is not an economic benefit flowing to the Company. Hence, it is excluded from revenue.
Interest Interest income is recognized on a time
proportion basis taking into account the amount outstanding and the applicable interest rate. Interest income is included under the head “other income” in the statement of profit and loss.
Dividends Dividend income is recognized when the
Company’s right to receive dividend is established by the reporting date.
n. Foreign Currency Translation Foreign currency transactions
i. Initial Recognition Foreign currency transactions are recorded
in the reporting currency, by applying to the foreign currency amount the exchange rate between the reporting currency and the foreign currency at the date of the transaction.
ii. Conversion Foreign currency monetary items are
reported using the closing rate. Non-monetary items which are carried in terms of historical cost denominated in a foreign currency are reported using the exchange rate at the date of the transaction.
iii. Exchange Differences Exchange differences arising on the
settlement of monetary items or on reinstatement of monetary items at rates different from those at which they were initially recorded during the year, or reported in previous financial statements, are recognised as income or as expenses.
iv. Forward exchange contracts entered into to hedge foreign currency risk of an existing asset/ liability
The premium or discount arising at the inception of forward exchange contracts is amortised as expense or income over the life of the contract. Exchange differences on such contracts are recognized in the statement of profit and loss in the year in which the exchange rates change. Any profit or loss arising on cancellation or renewal of forward exchange contract is recognized as income or as expense for the period.
o. Retirement and other Employee Benefits i. Retirement benefit in the form of provident
fund is a defined contribution scheme. The company has no obligation, other than the contribution payable to the provident fund. The company recognizes contribution payable to the provident fund scheme as expenditure, when an employee renders the related service.
ii. Gratuity Liability is a defined benefit plan and is provided for on the basis of an actuarial valuation on projected unit credit method made at the end of each financial year.
Actuarial gain and loss for defined benefit plan is recognized in full in the period in which it occur in the statement of profit and loss.
iii. Accumulated leave, which is expected to be utilized within the next 12 months, is treated as short-term employee benefit. The Company measures the expected cost of such absences as the additional amount that it expects to pay as a result of the unused entitlement that has accumulated at the reporting date.
iv. The Company treats accumulated leave expected to be carried forward beyond twelve months, as long-term employee benefit for measurement purposes. Such long-term compensated absences are provided for based on the actuarial valuation
Notes to Consolidated financial Statements for the year ended March 31, 2016

Lumax Industries Limited | Annual Report 2015-16
137
using the projected unit credit method at the year-end. Actuarial gains/losses are immediately taken to the statement of profit and loss and are not deferred.
v. Retirement benefit in the form of “Lumax Industries Limited Employees Superannuation Scheme” administered by the trustees is a defined contribution scheme. The contribution for the scheme is charged to the statement of profit and loss for the year when the contributions are due. The Company has no obligation, other than the contribution payable to the scheme.
p. Income Taxes Tax expense comprises current and deferred tax.
Current income-tax is measured at the amount expected to be paid to the tax authorities in accordance with the Income-tax Act, 1961 enacted in India and tax laws prevailing in the respective tax jurisdictions where the Company operates. The tax rates and tax laws used to compute the amount are those that are enacted or substantively enacted, at the reporting date. Current income tax relating to items recognized directly in equity is recognized in equity and not in the statement of profit and loss.
Deferred income taxes reflect the impact of timing differences between taxable income and accounting income originating during the current year and reversal of timing differences for the earlier years. Deferred tax is measured using the tax rates and the tax laws enacted or substantively enacted at the reporting date. Deferred income tax relating to items recognized directly in equity is recognized in equity and not in the statement of profit and loss.
Deferred tax liabilities are recognized for all taxable timing differences. Deferred tax assets are recognized for deductible timing differences only to the extent that there is reasonable certainty that sufficient future taxable income will be available against which such deferred tax assets can be realized. In situations where the Company has unabsorbed depreciation or carry forward tax losses, all deferred tax assets are recognized only if there is virtual certainty supported by convincing evidence that they can be realized against future taxable profits.
In the situations where the Company is entitled to a tax holiday under the Income-tax Act, 1961 enacted in India or tax laws prevailing in the respective tax jurisdictions where it operates, no deferred tax (asset or liability) is recognized
in respect of timing differences which reverse during the tax holiday period, to the extent the Company’s gross total income is subject to the deduction during the tax holiday period. Deferred tax in respect of timing differences which reverse after the tax holiday period is recognized in the year in which the timing differences originate. However, the Company restricts recognition of deferred tax assets to the extent that it has become reasonably certain or virtually certain, as the case may be, that sufficient future taxable income will be available against which such deferred tax assets can be realized. For recognition of deferred taxes, the timing differences which originate first are considered to reverse first.
At each reporting date, the Company re-assesses unrecognized deferred tax assets. It recognizes unrecognized deferred tax asset to the extent that it has become reasonably certain or virtually certain, as the case may be, that sufficient future taxable income will be available against which such deferred tax assets can be realized.
The carrying amount of deferred tax assets are reviewed at each reporting date. The Company writes-down the carrying amount of deferred tax asset to the extent that it is no longer reasonably certain or virtually certain, as the case may be, that sufficient future taxable income will be available against which deferred tax assets can be realized. Any such write-down is reversed to the extent that it becomes reasonably certain or virtually certain, as the case may be, that sufficient future taxable income will be available.
Deferred tax assets and deferred tax liabilities are offset, if a legally enforceable right exists to set-off current tax assets against current tax liabilities and the deferred tax assets and deferred taxes relate to the same taxable entity and the same taxation authority.
Minimum alternate tax (MAT) paid in a year is charged to the statement of profit and loss as current tax. The Company recognizes MAT credit available as an asset only to the extent that there is convincing evidence that the Company will pay normal income tax during the specified period, i.e., the period for which MAT credit is allowed to be carried forward. In the year in which the Company recognizes MAT credit as an asset in accordance with the Guidance Note on Accounting for Credit Available in respect of Minimum Alternative Tax under the Income-
Notes to Consolidated financial Statements for the year ended March 31, 2016

138
tax Act, 1961, the said asset is created by way of credit to the statement of profit and loss and shown as “MAT Credit Entitlement.” The Company reviews the “MAT credit entitlement” asset at each reporting date and writes down the asset to the extent the Company does not have convincing evidence that it will pay normal tax during the specified period.
q. Segment Reporting Policies Business Segment The Company is engaged in the business of
manufacture of various types of Automotive Lighting Equipment. The entire operations are governed by the same set of risks and return hence the entire operations represent a single primary segment.
Geographical Segment The analysis of geographical segments is
based on the geographical location of the customers i.e. customers located within India and customers located outside India.
r. Earnings per share Basic earnings per share are calculated by
dividing the net profit or loss for the period attributable to equity shareholders by the weighted average number of equity shares outstanding during the period.
For the purpose of calculating diluted earnings per equity share, the net profit or loss for the period attributable to equity shareholders and the weighted average number of shares outstanding during the period are adjusted for the effects of all dilutive potential equity shares.
s. Provisions A provision is recognised when an enterprise
has a present obligation as a result of past event and it is probable that an outflow of resources will be required to settle the obligation, in respect of which a reliable estimate can be made. Provisions are not discounted to its present value and are determined based on best management estimate required to settle
the obligation at the balance sheet date. These are reviewed at each balance sheet date and adjusted to reflect the current best management estimates.
Warranty provisions Provisions for warranty-related costs are
recognized when the product is sold or service provided. Provision is based on historical experience. The estimate of such warranty-related costs is revised annually.
t. Contingent liabilities A contingent liability is a possible obligation that
arises from past events whose existence will be confirmed by the occurrence or non-occurrence of one or more uncertain future events beyond the control of the Company or a present obligation that is not recognized because it is not probable that an outflow of resources will be required to settle the obligation. A contingent liability also arises in extremely rare cases where there is a liability that cannot be recognized because it cannot be measured reliably. The Company does not recognize a contingent liability but discloses its existence in the financial statements.
u. Cash and Cash equivalents Cash and cash equivalents in the cash flow
statement comprise cash at bank and in hand and short- term investments with an original maturity of three months or less.
v. Derivative instruments In accordance with the ICAI announcement,
derivative contracts, other than foreign currency forward contracts covered under AS 11, are marked to market on a portfolio basis, and the net loss, if any, after considering the offsetting effect of gain on the underlying hedged item, is charged to the statement of profit and loss. Net gain, if any, after considering the offsetting effect of loss on the underlying hedged item, is ignored
Notes to Consolidated financial Statements for the year ended March 31, 2016

Lumax Industries Limited | Annual Report 2015-16
139
(Amount in G)Particulars As at
March 31, 2016Authorized shares12,000,000 equity shares of H10/- each 120,000,000 Issued, subscribed and fully paid up shares9,347,732 equity shares of H10/- each 93,477,320
Particulars As at March 31, 2016Nos. (Amount in G)
At the beginning of the year 9,347,732 93,477,320 Issued during the year - - Outstanding at the end of the year 9,347,732 93,477,320
Particulars As at March 31, 2016Nos. % holding in
the class Equity shares of H10 each fully paidStanley Electric Co. Limited 3,343,381 35.77%Dhanesh Kumar Jain 1,938,025 20.73%Lumax Auto Technologies Limited 525,000 5.62%
3. Share Capital
a. Reconciliation of shares outstanding at the beginning and at the end of the reporting year
c Details of shareholders holding more than 5% shares in the Company
b Terms/rights attached to equity shares The Company has only one class of equity shares having a par value of H10 per share. Each holder of equity
shares is entitled to one vote per share. The Company declares and pays dividends in Indian rupees.
During the year ended March 31, 2016, the Company declared and paid an interim dividend of H12 per share which is considered to be final.
In the event of liquidation of the Company, the holders of equity shares will be entitled to receive remaining assets of the Company, after distribution of all preferential amounts. The distribution will be in proportion to the number of equity shares held by the shareholders.
Notes to Consolidated financial Statements for the year ended March 31, 2016

140
(Amount in G)Particulars As at
March 31, 2016Capital reserve 65,138 Captial Reserve in Associates 105,965,591 Securities premium account 679,665,909 Revaluation reserveBalance as per the last financial statements 77,346,536 Less: amount transferred to general reserve (279,268)Closing Balance 77,067,268 General reserveBalance as per the last financial statements 599,300,000 Add: amount transferred from surplus balance in the statement of profit and loss 3,75,00,000 Add: amount transferred from Revaluation Reserve 2,79,268 Closing Balance 637,079,268 Surplus as per the statement of profit and lossOpening share of Profit of Associate 389,401,043 Balance as per the last financial statements 353,196,071 Add: Profit for the year 520,259,966 Less:- Appropriations Final equity dividend (amount per share H12) (112,172,784)Tax on equity dividend (22,835,664)Transfer to general reserve (37,500,000)Total appropriations (172,508,448)Net surplus in the statement of profit and loss 1,090,348,632 Total reserves and surplus 2,590,191,806
(Amount in G)Particulars As at March 31, 2016
Non-current portion
Current maturities
Term loansIndian rupee loan from banks (secured) 64,319,574 49,919,430 Foreign currency loan from banks (secured) 41,409,370 269,160,938
105,728,944 319,080,368 The above amount includesSecured borrowings 105,728,944 319,080,368 Amount disclosed under the head "other current liabilities" (Note 11) - (319,080,368)Net amount 105,728,944 -
4 Reserves and Surplus
5 Long Term Borrowings
Notes:1 Indian Rupee Loan from Bank includes:
(a) H 50,287,500/- taken in the Financial Year 2013-14 carries interest @ 10% p.a. at present. The loan is repayable in 16 equal quarterly installments of H 5,587,500/- (excluding interest) after one year moratorium period from the disbursement date i.e. from 04.04.2013. The Loan is secured by way of first pari passu charge on the land and building situated at Sohna, Gurgaon (Haryana) unit.
(b) H 23,343,750/- taken in the Financial Year 2014-15 carries interest @ 10.70% p.a. at present. The loan is repayable in 16 equal quarterly installments of H 2,593,750/- (excluding interest) from the disbursement date i.e. from 10.06.2014. The Loan is secured by way of first pari passu charge on the land and building situated at Sohna, Gurgaon (Haryana) unit.
Notes to Consolidated financial Statements for the year ended March 31, 2016
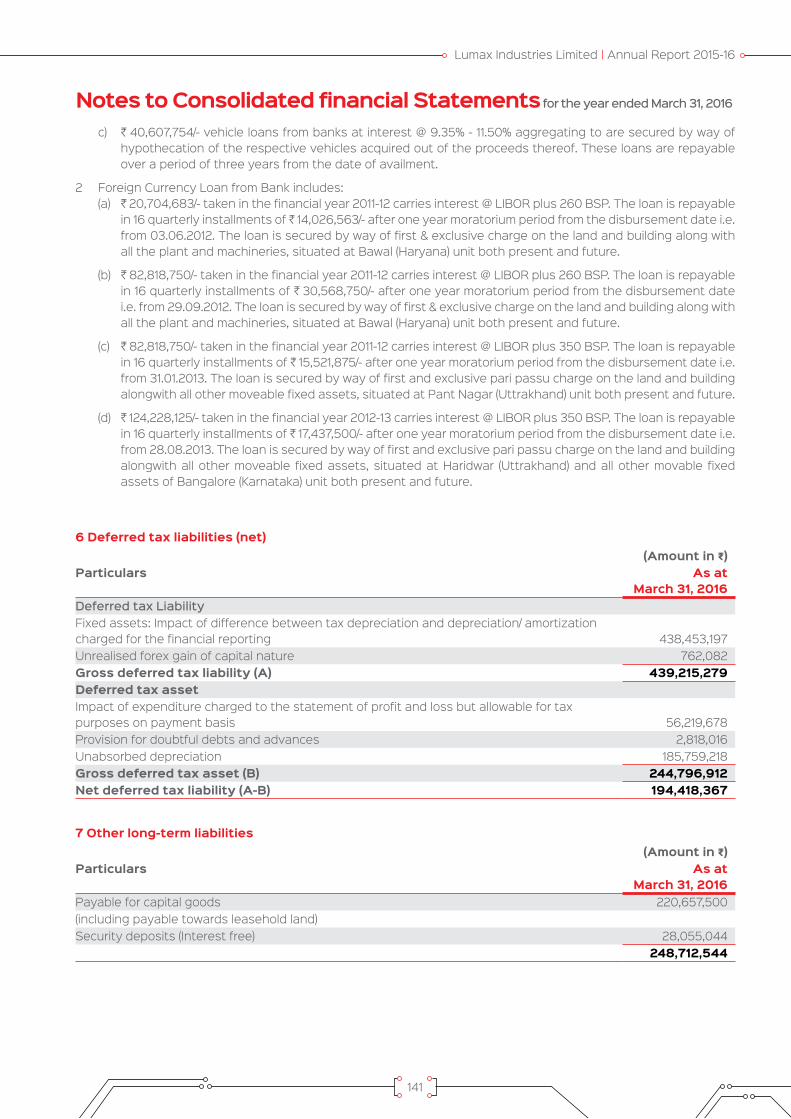
Lumax Industries Limited | Annual Report 2015-16
141
c) H 40,607,754/- vehicle loans from banks at interest @ 9.35% - 11.50% aggregating to are secured by way of hypothecation of the respective vehicles acquired out of the proceeds thereof. These loans are repayable over a period of three years from the date of availment.
2 Foreign Currency Loan from Bank includes: (a) H 20,704,683/- taken in the financial year 2011-12 carries interest @ LIBOR plus 260 BSP. The loan is repayable
in 16 quarterly installments of H 14,026,563/- after one year moratorium period from the disbursement date i.e. from 03.06.2012. The loan is secured by way of first & exclusive charge on the land and building along with all the plant and machineries, situated at Bawal (Haryana) unit both present and future.
(b) H 82,818,750/- taken in the financial year 2011-12 carries interest @ LIBOR plus 260 BSP. The loan is repayable in 16 quarterly installments of H 30,568,750/- after one year moratorium period from the disbursement date i.e. from 29.09.2012. The loan is secured by way of first & exclusive charge on the land and building along with all the plant and machineries, situated at Bawal (Haryana) unit both present and future.
(c) H 82,818,750/- taken in the financial year 2011-12 carries interest @ LIBOR plus 350 BSP. The loan is repayable in 16 quarterly installments of H 15,521,875/- after one year moratorium period from the disbursement date i.e. from 31.01.2013. The loan is secured by way of first and exclusive pari passu charge on the land and building alongwith all other moveable fixed assets, situated at Pant Nagar (Uttrakhand) unit both present and future.
(d) H 124,228,125/- taken in the financial year 2012-13 carries interest @ LIBOR plus 350 BSP. The loan is repayable in 16 quarterly installments of H 17,437,500/- after one year moratorium period from the disbursement date i.e. from 28.08.2013. The loan is secured by way of first and exclusive pari passu charge on the land and building alongwith all other moveable fixed assets, situated at Haridwar (Uttrakhand) and all other movable fixed assets of Bangalore (Karnataka) unit both present and future.
(Amount in G)Particulars As at
March 31, 2016Deferred tax LiabilityFixed assets: Impact of difference between tax depreciation and depreciation/ amortization charged for the financial reporting 438,453,197 Unrealised forex gain of capital nature 762,082 Gross deferred tax liability (A) 439,215,279 Deferred tax assetImpact of expenditure charged to the statement of profit and loss but allowable for tax purposes on payment basis 56,219,678 Provision for doubtful debts and advances 2,818,016 Unabsorbed depreciation 185,759,218 Gross deferred tax asset (B) 244,796,912 Net deferred tax liability (A-B) 194,418,367
(Amount in G)Particulars As at
March 31, 2016Payable for capital goods 220,657,500 (including payable towards leasehold land)Security deposits (Interest free) 28,055,044
248,712,544
6 Deferred tax liabilities (net)
7 Other long-term liabilities
Notes to Consolidated financial Statements for the year ended March 31, 2016

142
(Amount in G)Particulars As at
March 31, 2016At the beginning of the year 7,134,000 Arising during the year 11,791,544 Utilized during the year (11,908,544)At the end of the year (current portion) 7,017,000
(Amount in G)Particulars As at
March 31, 2016Cash credit/Working Capital facility from banks (secured) 450,891,414 Vendor finance facility from banks (unsecured) 397,362,227
848,253,641
(Amount in G)Particulars As at March 31, 2016
Long-term Short-termProvision for employee benefitsProvision for leave benefits 92,716,007 9,180,439 Provision for gratuity (Note 29) - 39,715,106
92,716,007 48,895,545 Other provisionsProvision for warranties {Refer point (a) below} - 7,017,000
- 7,017,000 92,716,007 55,912,545
8 Provisions
9 Short-term borrowings
(a) Provision for warranties A provision is recognized for expected warranty claims on products sold during the last one year, based on past
experience of the level of repairs and returns. It is expected that all of these costs will be incurred in the next financial year after the reporting date. Assumptions used to calculate the provision for warranties were based on current sales levels and current information available about warranty based on the one-year period for all products sold.
The table below gives information about movement in warranty provisions.
Notes:(a) Cash credit facility of H 8,670,747/- is secured by way of first pari passu charge on all current assets of the
Company. This facility is further secured by extension of charge by way of hypothecation on the Plant and Machinery along with the UREM on Land and Building situated at Chakan Unit of the Company, repayable on demand & carries interest @ 10.45%.
(b) WCDL Facility of H 150,000,000/- is secured by way of first pari passu charge on all current assets of the Company. This facility is further secured by way of equitable mortgage on Land and Buildings and first pari passu charges against movable Fixed Assets at Chinchwad Unit of the Company, repayable on demand & carries interest @ 9.35%.
(c) Cash Credit facility of H 92,220,667/- is secured by way of first pari passu charge on all current assets of the Company. This facility is further secured by way of equitable mortgage on Land and Buildings and first pari passu charges against movable Fixed Assets at Chinchwad Unit of the Company, repayable on demand & carries interest @ 9.65%.
Notes to Consolidated financial Statements for the year ended March 31, 2016

Lumax Industries Limited | Annual Report 2015-16
143
(d) WCDL Facility of H 200,000,000/- is secured by way of first pari passu charge on all current assets of the Company. This facility is further secured by way of equitable mortgage on Land and Buildings and first pari passu charges against movable Fixed Assets at Chinchwad Unit of the Company, repayable on demand & carries interest @ 9.50%
(e) Vendor Finance Facility from MSIL of H 397,362,227/- is repayable on 60 days from respective drawdown & carries interest @ 9.90%.
(Amount in G)Particulars As at
March 31, 2016Trade payables*- Total outstanding due of micro enterprises and small enterprises (refer note 36 for details of dues to micro and small enterprises)
7,22,444
- Total outstanding due of creditors other than micro enterprises and small enterprises # 3,07,10,45,229 3,071,767,673
10 Trade payables
* Refer note 32 for related party transactions# Trade payables include acceptances of H 188,015,774 /-
(Amount in G)Particulars As at
March 31, 2016Current maturities of long term borrowings (Note 5) 319,080,368 Interest accrued but not due on borrowings 5,603,606 Investor Education and Protection Fund will be credited by following amounts (as and when due) {Refer point (a)}Unpaid dividend 7,746,077 Other Payables Payable for capital goods 93,843,383 Interest free deposits from customers # 233,390 Advances from customers * 582,535,250 Statutory dues payable 77,289,962 Other liabilities {Refer point (b)} 198,088,709
1,284,420,745
11 Other Current liabilities
* Refer note 32 for related party transactions# Customer deposits are repayable on demand.
(a) Investor Education and Protection Fund is being credited by the amount of unclaimed dividend after seven years from the due date. Accordingly, the Company has transferred H 426,572/- during the current year to the Investor Education and Protection Fund.
(b) Other liabilities (net) represents amount towards rate provision payable to the customers net off amounts receivable from customers in respect of price increase not yet debited.
Notes to Consolidated financial Statements for the year ended March 31, 2016
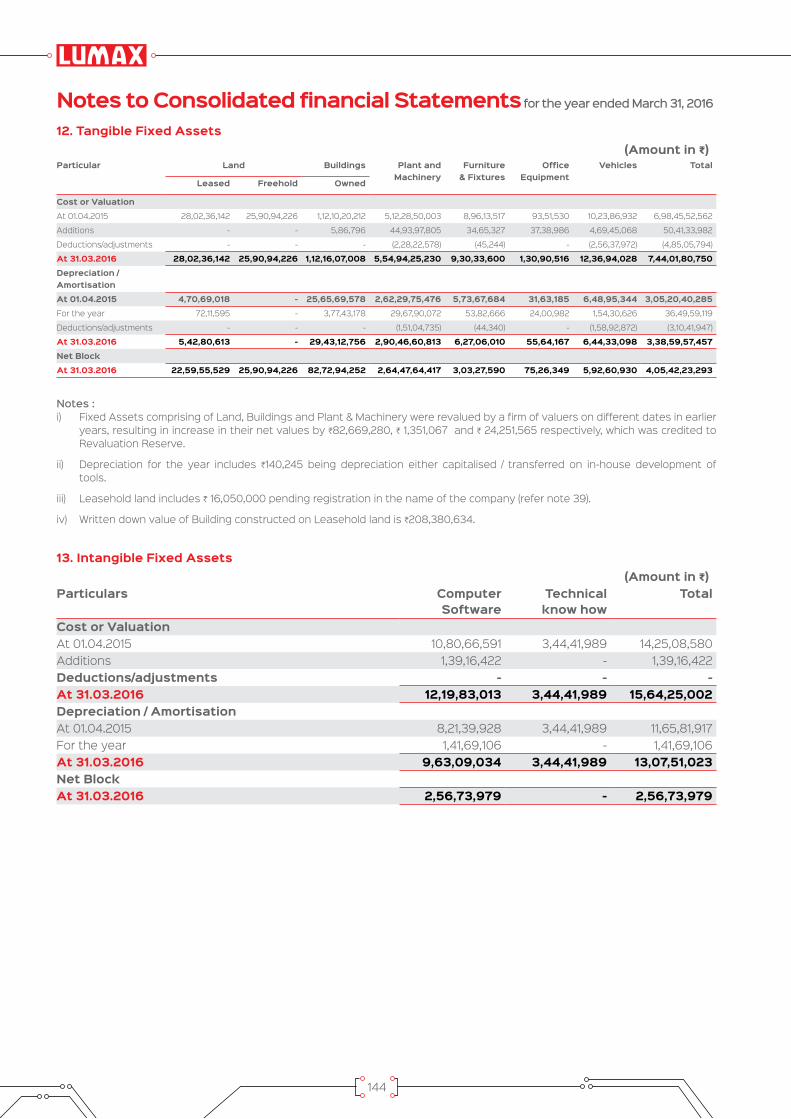
144
(Amount in G)Particular Land Buildings Plant and
MachineryFurniture
& Fixtures Office
EquipmentVehicles Total
Leased Freehold Owned
Cost or ValuationAt 01.04.2015 28,02,36,142 25,90,94,226 1,12,10,20,212 5,12,28,50,003 8,96,13,517 93,51,530 10,23,86,932 6,98,45,52,562
Additions - - 5,86,796 44,93,97,805 34,65,327 37,38,986 4,69,45,068 50,41,33,982
Deductions/adjustments - - - (2,28,22,578) (45,244) - (2,56,37,972) (4,85,05,794)
At 31.03.2016 28,02,36,142 25,90,94,226 1,12,16,07,008 5,54,94,25,230 9,30,33,600 1,30,90,516 12,36,94,028 7,44,01,80,750 Depreciation / AmortisationAt 01.04.2015 4,70,69,018 - 25,65,69,578 2,62,29,75,476 5,73,67,684 31,63,185 6,48,95,344 3,05,20,40,285 For the year 72,11,595 - 3,77,43,178 29,67,90,072 53,82,666 24,00,982 1,54,30,626 36,49,59,119
Deductions/adjustments - - - (1,51,04,735) (44,340) - (1,58,92,872) (3,10,41,947)
At 31.03.2016 5,42,80,613 - 29,43,12,756 2,90,46,60,813 6,27,06,010 55,64,167 6,44,33,098 3,38,59,57,457 Net BlockAt 31.03.2016 22,59,55,529 25,90,94,226 82,72,94,252 2,64,47,64,417 3,03,27,590 75,26,349 5,92,60,930 4,05,42,23,293
(Amount in G)Particulars Computer
SoftwareTechnical
know howTotal
Cost or ValuationAt 01.04.2015 10,80,66,591 3,44,41,989 14,25,08,580 Additions 1,39,16,422 - 1,39,16,422 Deductions/adjustments - - - At 31.03.2016 12,19,83,013 3,44,41,989 15,64,25,002 Depreciation / AmortisationAt 01.04.2015 8,21,39,928 3,44,41,989 11,65,81,917 For the year 1,41,69,106 - 1,41,69,106 At 31.03.2016 9,63,09,034 3,44,41,989 13,07,51,023 Net BlockAt 31.03.2016 2,56,73,979 - 2,56,73,979
12. Tangible Fixed Assets
13. Intangible Fixed Assets
Notes :i) Fixed Assets comprising of Land, Buildings and Plant & Machinery were revalued by a firm of valuers on different dates in earlier
years, resulting in increase in their net values by H82,669,280, H 1,351,067 and H 24,251,565 respectively, which was credited to Revaluation Reserve.
ii) Depreciation for the year includes H140,245 being depreciation either capitalised / transferred on in-house development of tools.
iii) Leasehold land includes H 16,050,000 pending registration in the name of the company (refer note 39).
iv) Written down value of Building constructed on Leasehold land is H208,380,634.
Notes to Consolidated financial Statements for the year ended March 31, 2016
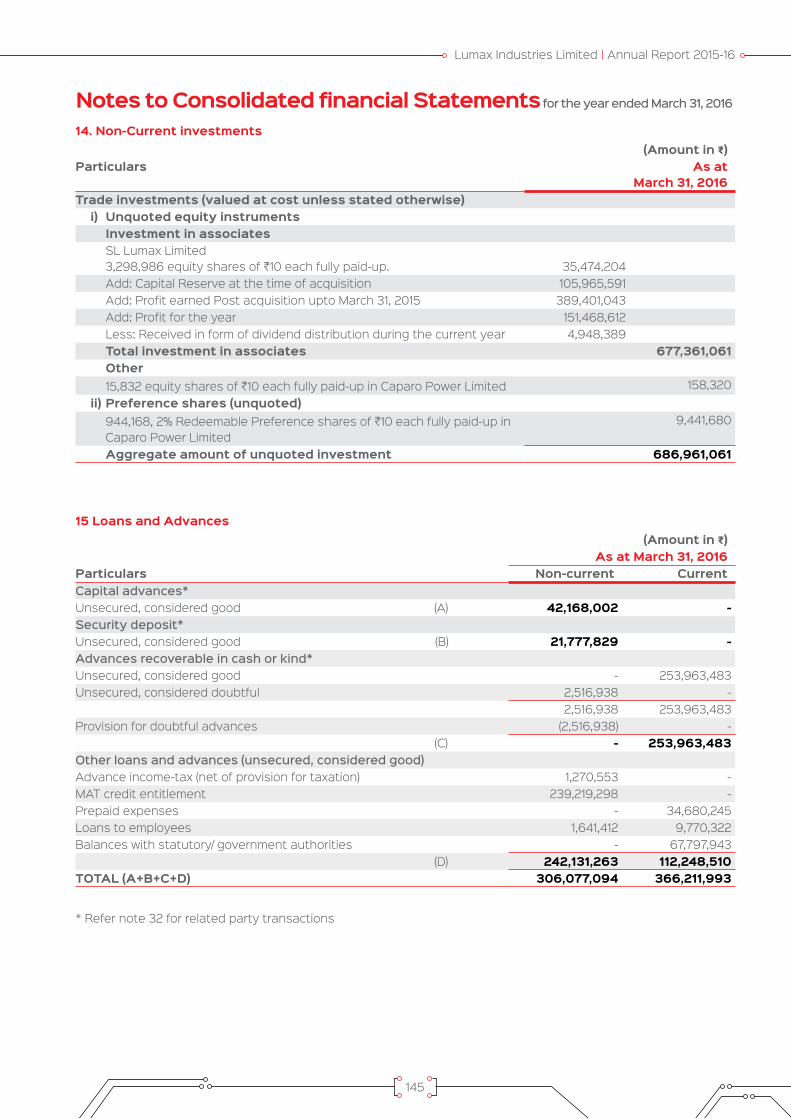
Lumax Industries Limited | Annual Report 2015-16
145
(Amount in G)Particulars As at
March 31, 2016Trade investments (valued at cost unless stated otherwise) i) Unquoted equity instruments Investment in associates SL Lumax Limited
3,298,986 equity shares of H10 each fully paid-up. 35,474,204 Add: Capital Reserve at the time of acquisition 105,965,591 Add: Profit earned Post acquisition upto March 31, 2015 389,401,043 Add: Profit for the year 151,468,612 Less: Received in form of dividend distribution during the current year 4,948,389 Total investment in associates 677,361,061 Other 15,832 equity shares of H10 each fully paid-up in Caparo Power Limited 158,320 ii) Preference shares (unquoted) 944,168, 2% Redeemable Preference shares of H10 each fully paid-up in
Caparo Power Limited 9,441,680
Aggregate amount of unquoted investment 686,961,061
(Amount in G)As at March 31, 2016
Particulars Non-current CurrentCapital advances*Unsecured, considered good (A) 42,168,002 - Security deposit*Unsecured, considered good (B) 21,777,829 - Advances recoverable in cash or kind* Unsecured, considered good - 253,963,483 Unsecured, considered doubtful 2,516,938 -
2,516,938 253,963,483 Provision for doubtful advances (2,516,938) - (C) - 253,963,483 Other loans and advances (unsecured, considered good)Advance income-tax (net of provision for taxation) 1,270,553 - MAT credit entitlement 239,219,298 - Prepaid expenses - 34,680,245 Loans to employees 1,641,412 9,770,322 Balances with statutory/ government authorities - 67,797,943 (D) 242,131,263 112,248,510 TOTAL (A+B+C+D) 306,077,094 366,211,993
14. Non-Current investments
15 Loans and Advances
* Refer note 32 for related party transactions
Notes to Consolidated financial Statements for the year ended March 31, 2016

146
(Amount in G)As at March 31, 2016
Particulars Non-current Current(A) Unsecured, considered good unless stated otherwise Outstanding for a period exceeding six months from the date they
are due for payment Unsecured, considered good - 15,069,282 Unsecured, considered doubtful 5,625,734 -
5,625,734 15,069,282 Provision for doubtful receivables (5,625,734) - (A) - 15,069,282 (B) Other receivables Unsecured, considered good - 1,796,834,193 (B) - 1,796,834,193 TOTAL (A + B) - 1,811,903,475
(Amount in G)As at March 31, 2016
Particulars Non-current CurrentUnsecured, considered good unless stated otherwiseNon-current bank balances (note 19) (A) 5,614,500 -OthersFixed assets held for sale (at net book value or estimated net realisable value, whichever is lower)
- 6,565,100
Interest accrued on fixed deposits - 2,256,770 Derivative assets 6,534,376 62,159,375 (B) 6,534,376 70,981,245 TOTAL (A+B) 12,148,876 70,981,245
(Amount in G)Particulars As at
March 31, 2016Valued at lower of cost and fair value, unless stated otherwiseQuoted equity instruments43,866 equity shares of H10 each fully paid up in PNB Gilts Limited * 987,000
987,000 * Aggregate amount of quoted equity investments Cost 987,000 Market Value 987,000 Provision for diminution in value of investment -
16.1 Trade receivables *
16.2 Other current assets
17 Current Investments
16 Trade receivables and other current assets
* Refer note 32 for related party transactions
Notes to Consolidated financial Statements for the year ended March 31, 2016

Lumax Industries Limited | Annual Report 2015-16
147
(Amount in G)Particulars As at
March 31, 2016Raw materials and components {including stock in transit H 44,968,311} (refer note 22.1) 534,805,354 Work-in-progress (refer note 23) 65,959,140 Finished goods {including transit stock H 50,771,780} (refer note 23) 134,925,273 Traded goods (refer note 23) 35,171,173 Stores and spares (including packing material) {including transit stock H 1,786,122} 76,765,267 Moulds, tools and dies in process {including transit stock H 16,898,438} (refer note 22.2) 197,875,544
1,045,501,751
18 Inventories (valued at lower of cost and net realisable value)
(Amount in G)As at March 31, 2016
Particulars Non-current CurrentCash and cash equivalentsBalances with banks: On current accounts - 19,014,978 On unpaid dividend account* - 7,746,077 Cash on hand - 2,764,506 Cheques on Hand - 5,026,725
- 34,552,286 Other bank balancesDeposits having remaining maturity of more than 12 months # 5,614,500 -
5,614,500 - Amount disclosed under non-current assets (note 16.2) (5,614,500) -
- 34,552,286
(Amount in G)Particulars Year ended
March 31, 2016Sale of products Finished goods # 12,894,075,425 Traded goods 89,687,246 Moulds, tools and dies 953,695,721 Sale of services 70,345,756 Other operating revenue Scrap sales 21,130,286 Other 7,469,669 Revenue from operations (gross) 14,036,404,103 Excise duty* 1,484,651,738 Revenue from operations (net) 12,551,752,365
19 Cash and bank balances
20 Revenue from operations
* The Company can utilize the balance only towards settlement of unclaimed dividend.
# Deposits include H 5,614,500 pledged with banks for guarantees given.
* Excise duty on sales amounting to H 1,484,651,738 has been reduced from sales in statement of profit & loss and excise duty on (increase)/decrease in inventory amounting to H (2,045,717) {note 25} has been considered as expense/(income).
Notes to Consolidated financial Statements for the year ended March 31, 2016
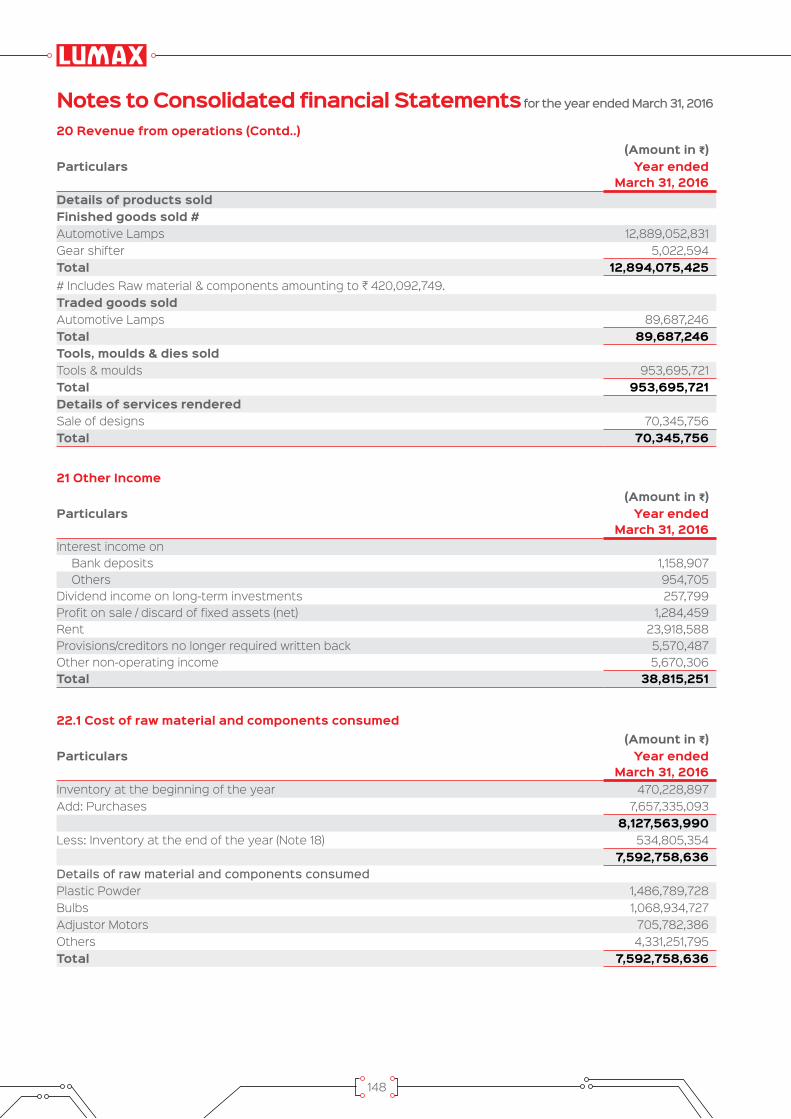
148
(Amount in G)Particulars Year ended
March 31, 2016Details of products soldFinished goods sold #Automotive Lamps 12,889,052,831 Gear shifter 5,022,594 Total 12,894,075,425 # Includes Raw material & components amounting to H 420,092,749.Traded goods soldAutomotive Lamps 89,687,246 Total 89,687,246 Tools, moulds & dies soldTools & moulds 953,695,721 Total 953,695,721 Details of services renderedSale of designs 70,345,756 Total 70,345,756
(Amount in G)Particulars Year ended
March 31, 2016Interest income on Bank deposits 1,158,907 Others 954,705 Dividend income on long-term investments 257,799 Profit on sale / discard of fixed assets (net) 1,284,459 Rent 23,918,588 Provisions/creditors no longer required written back 5,570,487 Other non-operating income 5,670,306 Total 38,815,251
(Amount in G)Particulars Year ended
March 31, 2016Inventory at the beginning of the year 470,228,897 Add: Purchases 7,657,335,093
8,127,563,990 Less: Inventory at the end of the year (Note 18) 534,805,354
7,592,758,636 Details of raw material and components consumedPlastic Powder 1,486,789,728 Bulbs 1,068,934,727 Adjustor Motors 705,782,386 Others 4,331,251,795 Total 7,592,758,636
20 Revenue from operations (Contd..)
21 Other Income
22.1 Cost of raw material and components consumed
Notes to Consolidated financial Statements for the year ended March 31, 2016

Lumax Industries Limited | Annual Report 2015-16
149
(Amount in G)Particulars Year ended
March 31, 2016Inventory at the beginning of the year 307,716,967 Add: Purchases 596,429,419
904,146,386 Less: Inventory at the end of the year (Note 18) 197,875,544
706,270,842
(Amount in G)Particulars As at
March 31, 2016Inventories at the end of the yearWork-in-progress (Note 18) 65,959,140 Finished goods (Note 18) 134,925,273 Traded goods (Note 18) 35,171,173
236,055,586 Inventories at the beginning of the yearWork-in-progress 70,598,472 Finished goods 149,795,987 Traded goods 35,073,535
255,467,994 19,412,408
22.2 Cost of moulds, tools & dies
23 (Increase)/ decrease in Inventories
(Amount in G)Particulars As at
March 31, 2016Details of inventoryRaw material and componentsPlastic Powder 122,528,343 Bulbs 85,367,099 Adjustor Motors 28,132,854 Others 298,777,058 Total 534,805,354
Details of Inventory (Amount in G)Particulars As at
March 31, 2016 Work-in-progressAutomotive Lamps 58,491,290 Gear shifter 7,467,850 Total 65,959,140 Finished goodsAutomotive Lamps 127,179,668 Gear shifter 7,745,605 Total 134,925,273 Traded GoodsAutomotive Lamps 35,171,173 Total 35,171,173
Details of purchase of traded goods (Amount in G)Particulars Year ended
March 31, 2016Automotive Lamps 78,726,759 Total 78,726,759
22.1 Cost of raw material and components consumed (Contd.)
Notes to Consolidated financial Statements for the year ended March 31, 2016

150
(Amount in G)Particulars Year ended
March 31, 2016Salaries, wages and bonus 1,205,738,921 Contribution to provident and other fund 50,334,742 Gratuity expense (note 29) 31,860,027 Staff welfare expenses 124,626,130 Commission to Directors 14,097,904
1,426,657,724
(Amount in G)Particulars Year ended
March 31, 2016Consumption of stores and spares 52,815,108 Packing material consumed 237,183,710 Power and fuel 443,494,504 Rent 16,510,452 Rates and taxes 15,974,692 Insurance 9,170,488 Repairs and maintenance -Plant and machinery 120,168,868 -Buildings 13,830,214 -Others 109,309,667 Freight and forwarding charges 224,789,472 Discount, rebates and claims 2,146,626 Cash discount on sales 27,349,136 Commission on sales - other than sole selling agent 5,331,879 Travelling and conveyance 110,962,414 Legal and Professional Fees 20,630,174 Management Support fees 123,628,508 Design, support and testing charges 21,337,846 Directors' sitting fees 1,122,100 Payment to auditors (Refer details below) 6,128,033 Donations 2,100 Royalty 174,453,661 Warranty costs 11,791,544 (Increase)/ decrease of excise duty on inventory (note 20) (2,045,717)Exchange difference (net)) 3,006,669 Provision for doubtful debts / advances (net) 109,901 Miscellaneous expenses 89,957,960 Contribution towards Corporate Social Responsibility (note 38) 3,259,049
1,842,419,058 Payment to AuditorAs auditor: Audit fee 3,224,300 Tax audit fee 350,000 Limited Review 1,290,000 In other capacity: Certification fees 790,000 Reimbursement of expenses 473,733
6,128,033
24 Employee benefits expense
25 Other expenses
Notes to Consolidated financial Statements for the year ended March 31, 2016
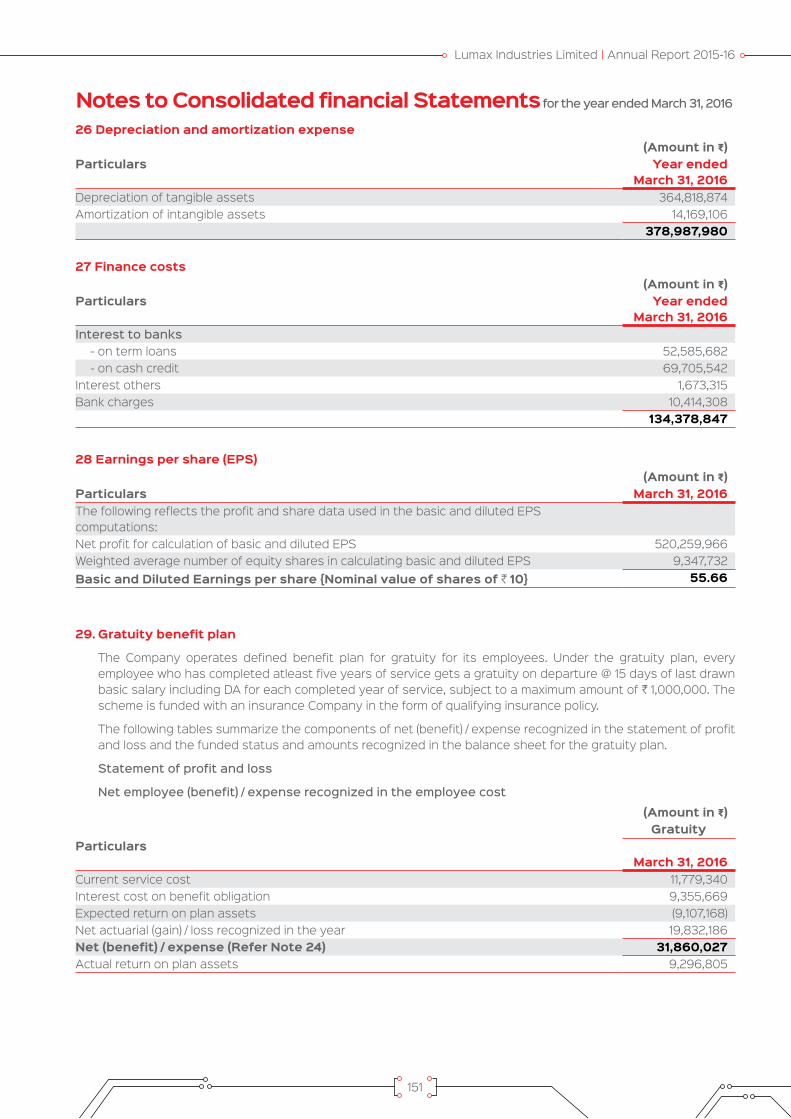
Lumax Industries Limited | Annual Report 2015-16
151
(Amount in G)Particulars Year ended
March 31, 2016Depreciation of tangible assets 364,818,874 Amortization of intangible assets 14,169,106
378,987,980
(Amount in G)Particulars Year ended
March 31, 2016Interest to banks - on term loans 52,585,682 - on cash credit 69,705,542 Interest others 1,673,315 Bank charges 10,414,308
134,378,847
(Amount in G)Particulars March 31, 2016The following reflects the profit and share data used in the basic and diluted EPS computations:Net profit for calculation of basic and diluted EPS 520,259,966 Weighted average number of equity shares in calculating basic and diluted EPS 9,347,732 Basic and Diluted Earnings per share {Nominal value of shares of H 10} 55.66
(Amount in G)Gratuity
ParticularsMarch 31, 2016
Current service cost 11,779,340Interest cost on benefit obligation 9,355,669Expected return on plan assets (9,107,168)Net actuarial (gain) / loss recognized in the year 19,832,186Net (benefit) / expense (Refer Note 24) 31,860,027Actual return on plan assets 9,296,805
26 Depreciation and amortization expense
27 Finance costs
28 Earnings per share (EPS)
29. Gratuity benefit plan
The Company operates defined benefit plan for gratuity for its employees. Under the gratuity plan, every employee who has completed atleast five years of service gets a gratuity on departure @ 15 days of last drawn basic salary including DA for each completed year of service, subject to a maximum amount of H 1,000,000. The scheme is funded with an insurance Company in the form of qualifying insurance policy.
The following tables summarize the components of net (benefit) / expense recognized in the statement of profit and loss and the funded status and amounts recognized in the balance sheet for the gratuity plan.
Statement of profit and loss
Net employee (benefit) / expense recognized in the employee cost
Notes to Consolidated financial Statements for the year ended March 31, 2016

152
(Amount in G)Gratuity
ParticularsMarch 31, 2016
Present value of defined benefit obligation 147,962,874Fair value of plan assets 108,247,768Plan asset / (liability) (39,715,106)
(Amount in G)Gratuity
ParticularsMarch 31, 2016
Opening fair value of plan assets 118,663,555Expected return 9,107,168Contributions by employer 6,179,474Benefits paid (25,892,066)Actuarial gains / (losses) 189,637Closing fair value of plan assets 108,247,768
(Amount in G)Gratuity
ParticularsMarch 31, 2016
Opening defined benefit obligation 133,082,909Current service cost 11,779,340Interest cost 9,355,669Benefits paid (26,276,867)Actuarial (gains) / losses on obligation 20,021,823Closing defined benefit obligation 147,962,874
(Amount in G)Gratuity
ParticularsMarch 31, 2016
Investments with insurer 100%
(Amount in G)Gratuity
ParticularsMarch 31, 2016
Discount rate 7.80%Expected rate of return on assets 8.37%Attrition rate / Employee turnover 5.00%
Balance sheetBenefit asset / (liability)
Changes in the fair value of plan assets are as follows:
The major categories of plan assets as a percentage of the fair value of total plan assets are as follows:
The principal assumptions used in determining gratuity obligation for the Company’s plans are shown below:
The Company expects to contribute H 14,789,453 to gratuity in the next year.
The estimates of future salary increases, considered in actuarial valuation, take account of inflation, seniority, promotion and other relevant factors, such as supply and demand in the employment market.
The overall expected rate of return on assets is determined based on the market prices prevailing on that date, applicable to the period over which the obligation is to be settled.
Notes to Consolidated financial Statements for the year ended March 31, 2016
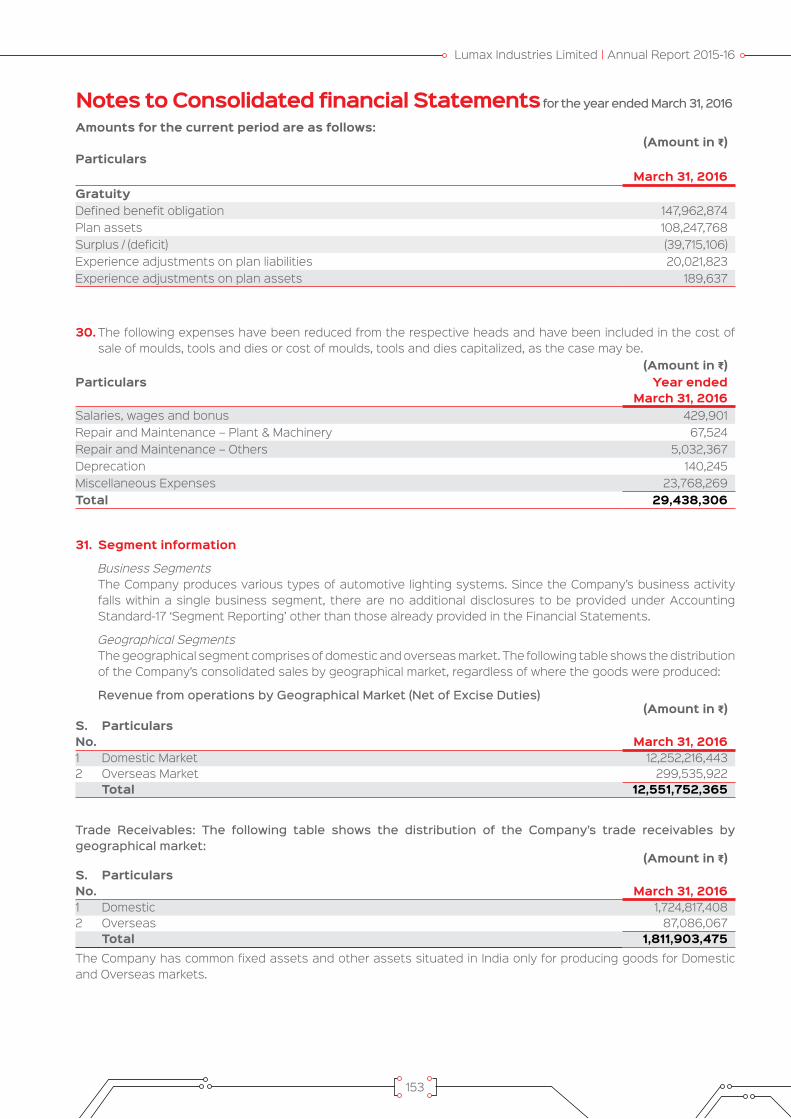
Lumax Industries Limited | Annual Report 2015-16
153
Amounts for the current period are as follows:(Amount in G)
ParticularsMarch 31, 2016
GratuityDefined benefit obligation 147,962,874Plan assets 108,247,768Surplus / (deficit) (39,715,106)Experience adjustments on plan liabilities 20,021,823Experience adjustments on plan assets 189,637
30. The following expenses have been reduced from the respective heads and have been included in the cost of sale of moulds, tools and dies or cost of moulds, tools and dies capitalized, as the case may be.
(Amount in G)Particulars Year ended
March 31, 2016Salaries, wages and bonus 429,901Repair and Maintenance – Plant & Machinery 67,524Repair and Maintenance – Others 5,032,367Deprecation 140,245Miscellaneous Expenses 23,768,269Total 29,438,306
(Amount in G)S.No.
ParticularsMarch 31, 2016
1 Domestic Market 12,252,216,4432 Overseas Market 299,535,922
Total 12,551,752,365
31. Segment information
Business Segments The Company produces various types of automotive lighting systems. Since the Company’s business activity
falls within a single business segment, there are no additional disclosures to be provided under Accounting Standard-17 ‘Segment Reporting’ other than those already provided in the Financial Statements.
Geographical Segments The geographical segment comprises of domestic and overseas market. The following table shows the distribution
of the Company’s consolidated sales by geographical market, regardless of where the goods were produced:
Revenue from operations by Geographical Market (Net of Excise Duties)
(Amount in G)S.No.
ParticularsMarch 31, 2016
1 Domestic 1,724,817,4082 Overseas 87,086,067
Total 1,811,903,475
Trade Receivables: The following table shows the distribution of the Company’s trade receivables by geographical market:
The Company has common fixed assets and other assets situated in India only for producing goods for Domestic and Overseas markets.
Notes to Consolidated financial Statements for the year ended March 31, 2016
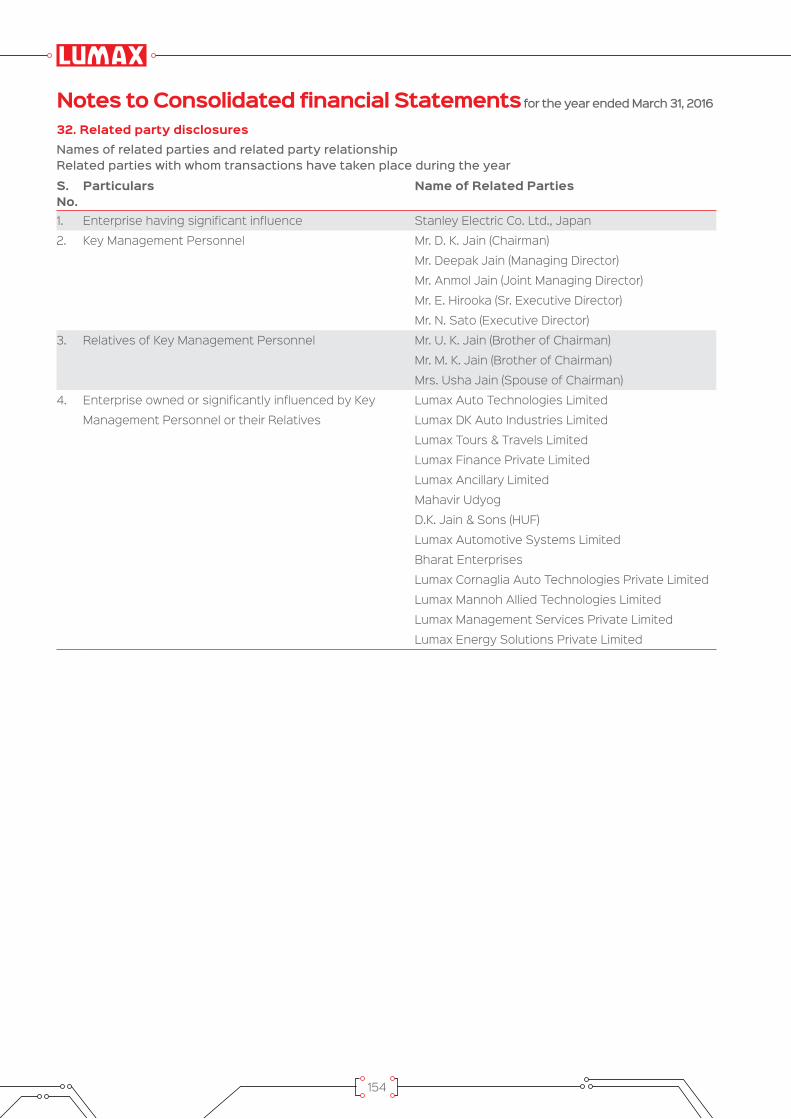
154
S.No.
Particulars Name of Related Parties
1. Enterprise having significant influence Stanley Electric Co. Ltd., Japan
2. Key Management Personnel Mr. D. K. Jain (Chairman)
Mr. Deepak Jain (Managing Director)
Mr. Anmol Jain (Joint Managing Director)
Mr. E. Hirooka (Sr. Executive Director)
Mr. N. Sato (Executive Director)
3. Relatives of Key Management Personnel Mr. U. K. Jain (Brother of Chairman)
Mr. M. K. Jain (Brother of Chairman)
Mrs. Usha Jain (Spouse of Chairman)
4. Enterprise owned or significantly influenced by Key
Management Personnel or their Relatives
Lumax Auto Technologies Limited
Lumax DK Auto Industries Limited
Lumax Tours & Travels Limited
Lumax Finance Private Limited
Lumax Ancillary Limited
Mahavir Udyog
D.K. Jain & Sons (HUF)
Lumax Automotive Systems Limited
Bharat Enterprises
Lumax Cornaglia Auto Technologies Private Limited
Lumax Mannoh Allied Technologies Limited
Lumax Management Services Private Limited
Lumax Energy Solutions Private Limited
32. Related party disclosuresNames of related parties and related party relationshipRelated parties with whom transactions have taken place during the year
Notes to Consolidated financial Statements for the year ended March 31, 2016

Lumax Industries Limited | Annual Report 2015-16
155
Det
ail o
f Rel
ated
Par
ty T
rans
acti
ons
for t
he F
inan
cial
Yea
r 20
15-1
6(A
mou
nt in
G)
S.
No
Acc
ount
Hea
dE
nter
pris
e ha
ving
si
gnif
ican
t in
flue
nce
Key
Man
agem
ent
Per
sonn
elR
elat
ives
of K
ey
Man
agem
ent
Per
sonn
elE
nter
pris
es o
wne
d or
si
gnifi
cant
ly in
fluen
ced
by
key
man
agem
ent
pers
onne
l or
the
ir re
lati
ves
Tota
l
2015
-16
2015
-16
2015
-16
2015
-16
2015
-16
A)
TRA
NS
AC
TIO
NS
i)S
ale
of R
aw M
ater
ials
and
Com
pone
nts
Lum
ax A
uto
Tech
nolo
gies
Ltd
.-
--
7
2,10
4,20
8
72,
104,
208
Lum
ax D
K A
uto
Indu
strie
s Lt
d.-
--
15,3
89,3
6315
,389
,363
Lum
ax A
ncilla
ry L
td.
--
-
27,
982,
772
2
7,98
2,77
2
Bha
rat
Ente
rpris
es-
--
3
20,4
43
320
,443
Lum
ax M
anno
h A
llied
Tech
nolo
gies
Ltd
.-
--
2,41
9,51
62,
419,
516
Tota
l (i)
-
-
-
11
8,2
16,3
02
118
,216
,30
2 ii)
Sal
e of
fini
shed
goo
dsLu
max
Aut
o Te
chno
logi
es L
td.
--
-53
9,22
9,42
1 53
9,22
9,42
1
Lum
ax D
K A
uto
Indu
strie
s Lt
d.
--
-
7,18
0,91
8
7,18
0,91
8
Lum
ax M
anno
h A
llied
Tech
nolo
gies
Ltd
.-
--
5,21
9,00
55,
219,
005
Tota
l (ii)
-
-
-
551
,629
,344
551
,629
,344
iii)
Sal
e of
Fix
ed A
sset
sLu
max
DK
Aut
o In
dust
ries
Ltd.
-
--
9,2
14 9
,214
Lum
ax A
uto
Tech
nolo
gies
Ltd
.-
--
4,20
4,57
84,
204,
578
Lum
ax M
anag
emen
t S
ervi
ces
P.Lt
d.-
--
9,26
8,72
69,
268,
726
Mah
avir
Udy
og-
--
142,
682
142,
682
Tota
l (iii
)-
-
-
13,6
25,2
00
13,6
25,2
00
iv)
Sal
e of
ser
vice
sLu
max
Aut
o Te
chno
logi
es L
td.
--
-
884,
880
88
4,88
0
Lum
ax D
K A
uto
Indu
strie
s Lt
d.
--
-
153,
530
15
3,53
0
Lum
ax A
ncilla
ry L
td.
--
-
125,
207
12
5,20
7
Stan
ley
Elec
tric
Co.
Ltd
.8,
109,
016
--
-8,
109,
016
Mah
avir
Udy
og -
--
21,6
7121
,671
Bha
rat
Ente
rpris
es-
--
28
,437
28
,437
Tota
l (iv
)8
,109
,016
-
-
1,2
13,7
25
9
,322
,741
v)P
urch
ase
of R
aw M
ater
ials
, Com
pone
nts
and
Mou
lds
Lum
ax A
uto
Tech
nolo
gies
Ltd
.-
--
321,6
65,3
9032
1,665
,390
Lum
ax D
K A
uto
Indu
strie
s Lt
d.
--
-99
4,03
1,437
994,
031,4
37Lu
max
Anc
illary
Ltd
.-
--
453,
026,
614
453,
026,
614
Bha
rat
Ente
rpris
es-
--
162,
301,0
9616
2,30
1,096
Mah
avir
Udy
og-
--
16,7
14,2
2716
,714
,227
Stan
ley
Elec
tric
Co.
Ltd
.79
,696
,539
--
-79
,696
,539
Lum
ax M
anno
h A
llied
Tech
nolo
gies
Ltd
.-
--
183,
568
183,
568
Tota
l (v)
79,6
96
,539
-
-
1,947
,922
,332
2,0
27,6
18,8
71vi
)P
urch
ase
of P
acki
ng M
ater
ial
Mah
avir
Udy
og-
--
134,
942,
334
134,
942,
334
Tota
l (vi
)-
-
- 13
4,9
42,3
3413
4,9
42,3
34
Not
es t
o C
onso
lidat
ed fi
nanc
ial S
tate
men
ts fo
r the
yea
r end
ed M
arch
31,
2016
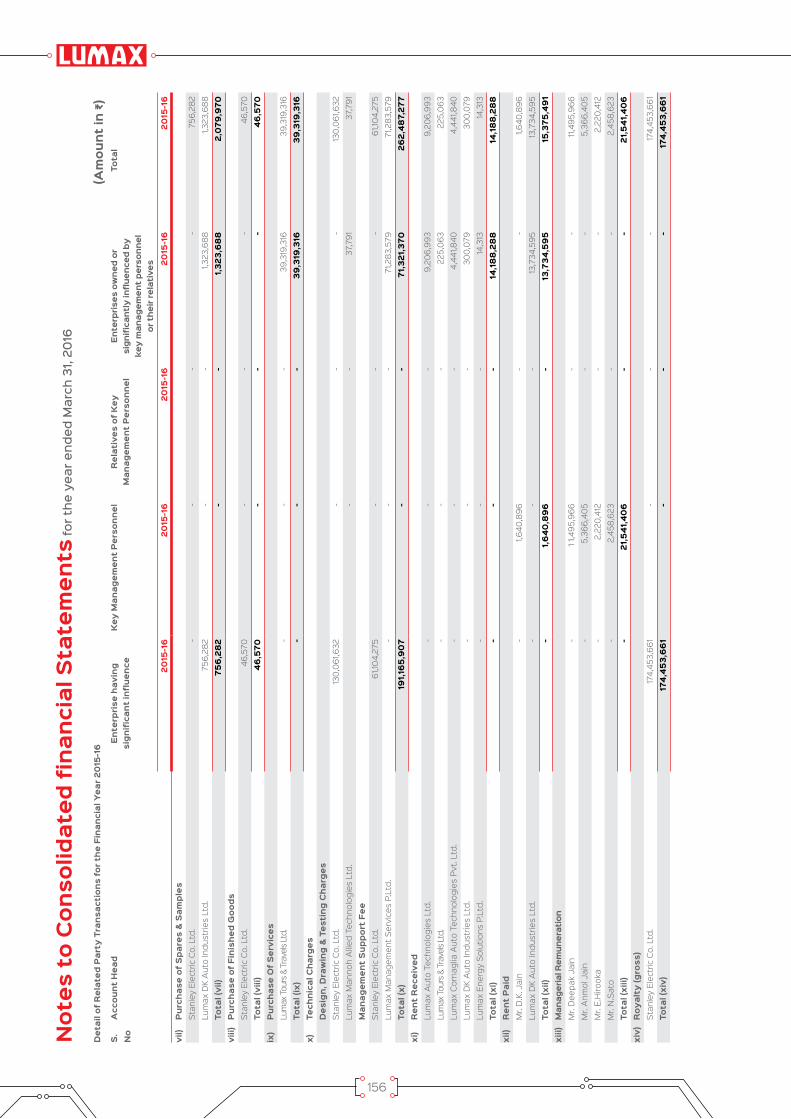
156
Det
ail o
f Rel
ated
Par
ty T
rans
acti
ons
for t
he F
inan
cial
Yea
r 20
15-1
6(A
mou
nt in
G)
S.
No
Acc
ount
Hea
dE
nter
pris
e ha
ving
si
gnif
ican
t in
flue
nce
Key
Man
agem
ent
Per
sonn
elR
elat
ives
of K
ey
Man
agem
ent
Per
sonn
elE
nter
pris
es o
wne
d or
si
gnifi
cant
ly in
fluen
ced
by
key
man
agem
ent
pers
onne
l or
the
ir re
lati
ves
Tota
l
2015
-16
2015
-16
2015
-16
2015
-16
2015
-16
vii)
Pur
chas
e of
Spa
res
& S
ampl
esSt
anle
y El
ectr
ic C
o. L
td.
--
--
756,
282
Lum
ax D
K A
uto
Indu
strie
s Lt
d.75
6,28
2-
-1,3
23,6
881,3
23,6
88To
tal (
vii)
756
,28
2
-
-
1,323
,68
82,
079
,970
viii)
Pur
chas
e of
Fin
ishe
d G
oods
Stan
ley
Elec
tric
Co.
Ltd
.
46,
570
--
-46
,570
Tota
l (vi
ii)
46
,570
-
-
-
46
,570
ix)
Pur
chas
e O
f Ser
vice
sLu
max
Tou
rs &
Tra
vels
Ltd.
- -
-
39,
319,
316
3
9,31
9,31
6To
tal (
ix)
-
-
-
39,3
19,3
1639
,319
,316
x)Te
chni
cal C
harg
esD
esig
n, D
raw
ing
& T
esti
ng C
harg
esSt
anle
y El
ectr
ic C
o. L
td.
130
,061
,632
--
- 1
30,0
61,6
32Lu
max
Man
noh
Allie
d Te
chno
logi
es L
td.
--
37,7
9137
,791
Man
agem
ent
Sup
port
Fee
Stan
ley
Elec
tric
Co.
Ltd
.61
,104,
275
--
-61
,104,
275
Lum
ax M
anag
emen
t S
ervi
ces
P.Lt
d.-
--
71,2
83,5
7971
,283
,579
Tota
l (x)
191,1
65,
90
7
-
-
71,3
21,3
7026
2,48
7,27
7xi
)R
ent
Rec
eive
dLu
max
Aut
o Te
chno
logi
es L
td.
--
-9,
206,
993
9,20
6,99
3Lu
max
Tou
rs &
Tra
vels
Ltd.
--
-
225
,063
2
25,0
63Lu
max
Cor
nagl
ia A
uto
Tech
nolo
gies
Pvt
. Ltd
.-
--
4,44
1,840
4,44
1,840
Lum
ax D
K A
uto
Indu
strie
s Lt
d.-
--
300,
079
300,
079
Lum
ax E
nerg
y S
olut
ions
P.L
td.
- -
-14
,313
14,3
13To
tal (
xi)
-
-
-
14,
188
,28
8
14,
188
,28
8xi
i)R
ent
Pai
dM
r. D
.K. J
ain
-1,6
40,8
96-
-1,6
40,8
96Lu
max
DK
Aut
o In
dust
ries
Ltd.
--
-13
,734
,595
13,7
34,5
95To
tal (
xii)
-1,6
40,8
96
-13
,734
,59
515
,375
,49
1xi
ii)M
anag
eria
l Rem
uner
atio
nM
r. D
eepa
k Ja
in-
1 1,
495,
966
--
11
,495
,966
Mr.
Anm
ol J
ain
-
5,3
66,4
05-
-
5,3
66,4
05M
r. E.
Hiro
oka
-2,
220,
412
--
2,22
0,41
2M
r. N
.Sat
o
-
2
,458
,623
--
2
,458
,623
Tota
l (xi
ii)-
21,5
41,4
06
-
-
21,5
41,4
06
xiv)
Roy
alty
(gro
ss)
Stan
ley
Elec
tric
Co.
Ltd
. 17
4,45
3,66
1-
--
17
4,45
3,66
1To
tal (
xiv)
174,
453,
66
1
-
-
-
174,
453,
66
1
Not
es t
o C
onso
lidat
ed fi
nanc
ial S
tate
men
ts fo
r the
yea
r end
ed M
arch
31,
2016

Lumax Industries Limited | Annual Report 2015-16
157
Not
es t
o C
onso
lidat
ed fi
nanc
ial S
tate
men
ts fo
r the
yea
r end
ed M
arch
31,
2016
Det
ail o
f Rel
ated
Par
ty T
rans
acti
ons
for t
he F
inan
cial
Yea
r 20
15-1
6(A
mou
nt in
G)
S.
No
Acc
ount
Hea
dE
nter
pris
e ha
ving
si
gnif
ican
t in
flue
nce
Key
Man
agem
ent
Per
sonn
elR
elat
ives
of K
ey
Man
agem
ent
Per
sonn
elE
nter
pris
es o
wne
d or
si
gnifi
cant
ly in
fluen
ced
by
key
man
agem
ent
pers
onne
l or
the
ir re
lati
ves
Tota
l
2015
-16
2015
-16
2015
-16
2015
-16
2015
-16
xv)
Com
mis
sion
Mr.
D. K
. Jai
n-
4,56
0,51
1-
-4,
560,
511
Mr.
Dee
pak
Jain
-9,
750,
189
--
9,75
0,18
9M
r. A
nmol
Jai
n-
4,34
7,71
5-
-4,
347,
715
Tota
l (xv
)-
18,6
58,4
15
-
- 18
,658
,415
xvi)
Div
iden
d P
aid
Mr.
D. K
. Jai
n-
33,
915,
438
--
33
,915
,438
Mr.
Dee
pak
Jain
-
2,3
92,4
43-
-
2,3
92,4
43M
r. A
nmol
Jai
n-
941
,115
--
941
,115
Mr.
M. K
. Jai
n-
-
10,
500
-
10,
500
Mr.
U. K
. Jai
n-
-
2
7,26
5-
27,
265
Mrs
. Ush
a Ja
in-
- 2
,528
,453
-
2,52
8,45
3D
K J
ain
and
Sons
(HU
F)-
--
2,18
6,97
5
2
,186,
975
Lum
ax F
inan
ce P
vt. L
td.
--
-
7
,301
,928
7,3
01,9
28Lu
max
Aut
o Te
chno
logi
es L
td.
--
-
9
,187,
500
9,18
7,50
0Lu
max
Aut
omot
ive
Sys
tem
s Lt
d.-
--
18,9
00
18
,900
Stan
ley
Elec
tric
Co.
Ltd
.58
,509
,168
--
-58
,509
,168
Oth
ers
--
490,
525
-49
0,52
5To
tal (
xvi)
58,5
09
,168
37,2
48,9
96
3,0
56,7
43
18
,69
5,30
311
7,51
0,2
10xv
ii)O
ther
s {N
et o
f Inc
ome/
(Exp
endi
ture
)}Lu
max
Aut
o Te
chno
logi
es L
td.
--
-
(
777,
216)
(77
7,21
6)Lu
max
DK
Aut
o In
dust
ries
Ltd.
-
--
(5
08,3
03)
(5
08,3
03)
Lum
ax A
ncilla
ry L
td.
--
-
(
292,
802)
(29
2,80
2)Lu
max
Man
noh
Allie
d Te
chno
logi
es L
td.
--
-(6
1,612
)(6
1,612
)Lu
max
Aut
omot
ive
Sys
tem
s Lt
d.-
--
875,
088
875,
088
Lum
ax M
anag
emen
t S
ervi
ces
P.Lt
d-
--
(268
,904
)(2
68,9
04)
Lum
ax E
nerg
y S
olut
ions
P.L
td.
--
-(7
69,5
86)
(769
,586
)St
anle
y El
ectr
ic C
o. L
td.
1,605
,617
--
-1,6
05,6
17To
tal (
xvii)
1,60
5,6
17
-
-
(1
,80
3,33
5)(1
97,
718
)xv
iii)
Leav
e Li
abili
ty a
nd G
ratu
ity
Tran
sfer
Lum
ax M
anag
emen
t S
ervi
ces
P.Lt
d-
--
(20,
502,
525)
(20,
502,
525)
Tota
l (xv
iii)
--
-(2
0,5
02,
525)
(20
,50
2,52
5)B
)B
ALA
NC
ES
AT
THE
YE
AR
EN
Di)
Rec
eiva
bles
Lu
max
Aut
o Te
chno
logi
es L
td.
--
-17
8,07
9,13
517
8,07
9,13
5Lu
max
DK
Auto
Indu
strie
s Lt
d.-
--
1
2,07
0,97
4
12,
070,
974
Lum
ax C
orna
glia
Aut
o Te
chno
logi
es P
vt. L
td.
--
-
679
,250
6
79,2
50Lu
max
Tou
rs &
Tra
vels
Ltd
--
-
34,
256
3
4,25
6B
hara
t En
terp
rises
--
-
67,
683
6
7,68
3Lu
max
Anc
illary
Ltd
.-
--
4,30
2,19
8
4,
302,
198
Lum
ax M
anno
h A
llied
Tech
nolo
gies
Ltd
.-
--
994,
556
994,
556
Tota
l (i)
-
-
-
196
,228
,042
19
6,2
28,0
42

158
Det
ail o
f Rel
ated
Par
ty T
rans
acti
ons
for t
he F
inan
cial
Yea
r 20
15-1
6(A
mou
nt in
G)
S.
No
Acc
ount
Hea
dE
nter
pris
e ha
ving
si
gnif
ican
t in
flue
nce
Key
Man
agem
ent
Per
sonn
elR
elat
ives
of K
ey
Man
agem
ent
Per
sonn
elE
nter
pris
es o
wne
d or
si
gnifi
cant
ly in
fluen
ced
by
key
man
agem
ent
pers
onne
l or
the
ir re
lati
ves
Tota
l
2015
-16
2015
-16
2015
-16
2015
-16
2015
-16
ii)P
ayab
les
Lum
ax A
uto
Tech
nolo
gies
Ltd
.-
--
113,
657,
020
113,
657,
020
Lum
ax D
K A
uto
Indu
strie
s Lt
d.
--
-
349,
492,
019
34
9,49
2,01
9Lu
max
Man
noh
Allie
d Te
chno
logi
es L
td.
--
-
9,84
8
9,84
8Lu
max
Tou
rs &
Tra
vels
Ltd.
--
-
3
,792
,535
3,7
92,5
35Lu
max
Anc
illary
Ltd
.-
--
12
0,04
5,12
7
120,
045,
127
Bha
rat
Ente
rpris
es-
--
4
5,08
8,99
6
45,
088,
996
Mah
avir
Udy
og-
--
4
6,23
9,32
6
46,
239,
326
Lum
ax M
anag
emen
t S
ervi
ces
P.Lt
d-
--
1
5,40
0,85
7
15,
400,
857
Lum
ax E
nerg
y S
olut
ions
P.L
td.
--
-
769
,586
7
69,5
86
Stan
ley
Elec
tric
Co.
Ltd
.15
3,62
0,89
2-
--
153,
620,
892
Tot
al (i
i) 15
3,6
20,8
92
-
-
6
94,
495,
314
848
,116
,20
6iii
)S
ecur
ity
Dep
osit
Pay
able
Lum
ax A
uto
Tech
nolo
gies
Ltd
.-
--
25,0
00,0
0025
,000
,000
Tota
l (iii
)-
--
25,0
00
,00
025
,00
0,0
00
Not
es t
o C
onso
lidat
ed fi
nanc
ial S
tate
men
ts fo
r the
yea
r end
ed M
arch
31,
2016

Lumax Industries Limited | Annual Report 2015-16
159
(Amount in G)S.No.
ParticularsMarch 31, 2016
1. Estimated amount of contracts (Net of advances paid during the year H 42,168,002) remaining to be executed on capital account and not provided for 63,366,133
The Company’s share in capital commitments of its associate, SL Lumax Limited is H15,662,014.
(Amount in G)S.No.
ParticularsMarch 31, 2016
(i) Bills of exchange discounted from a bank 247,106,673(ii) Various other claims of Sales Tax Matters made against the Company on account of non-
submission of statutory forms etc. being disputed by the Company. 2,520,457(iii) Demand of Central Sales Tax for FY 2010-11 which is subject to submission of C-Form & H-Form. 2,140,602(iv) Demand in respect of non-reversal of proportionate cenvat credit @ 0.6% against providing
exempt services i.e. trading 1,088,154(v) Demand of Cenvat Credit for 2011-2015 in respect of service tax paid on the outward
transportation 3,209,812(vi) In respect of additions made by the Assessing officer for Assessment Year 2009-10 and
confirmed by DRP for which the Company has filed an appeal before ITAT and ITAT has decided in favour of the company vide order dated 22.04.2016 563,918
(vii) In respect of additions made by the Assessing officer for Assessment Year 2010-11 and confirmed by DRP for which the Company has filed an appeal before ITAT 177,323
(viii) Liability of Customs duty towards export obligation undertaken by the Company under EPCG licenses 150,404,202
(ix) Letter of credit 21,552,216(x) Bank Guarantees 287,364,400
33. Capital and other commitments
34. Contingent liabilities
The Company’s share in contingencies of its associate, SL Lumax Limited is H 1,310,111.
The current year amount relating to income tax does not include interest.
Based on the favourable decisions in similar cases/advice taken by the Company & based on management’s internal assessment, the Company believes that it has good case in respect of all the items listed above and hence no provision there against is considered necessary.
Notes to Consolidated financial Statements for the year ended March 31, 2016

160
35. Derivative instruments and unhedged foreign currency exposure(a) Derivatives outstanding as at the reporting date
Particulars PurposeCross Currency cum interest rate swap – USD 4,687,500 Notional amount H 310,570,312
Hedge against exposure to outflow for USD loan repayment and its interest payments. Swap to pay fixed interest @ 9.78%, 7.55% and 10.65% p.a. and receive a variable interest @ LIBOR plus Margin.
(Amount in G) Amount (in Foreign Currency)
Exchange Rate (Amount in G)
Particulars Foreign Currency
March 31, 2016
March 31, 2016
March 31, 2016
Trade Payable
EUR 365,054 4,842 75.40JPY 50,141,073 85,006,482 0.5899USD 166,495,082 2,512,944 66.26CHF 505,347 7,326 68.98SGD 123,943 2,516 49.27
Advance RecoverableEUR 2,354,835 31,233 75.40CHF 3,088,235 44,770 68.98USD 183,301,669 2,766,609 66.26
Trade ReceivableEUR 7,915,290 104,984 75.40GBP 19,064,364 199,684 95.47USD 60,106,413 907,198 66.26
(b) Particulars of unhedged foreign currency exposure as at the reporting date
(Amount in G)Particulars
March 31, 2016The principal amount and the interest due thereon remaining unpaid to any supplier as at the end of each accounting yearPrincipal amount due to micro and small enterprises 722,444Interest due on above 19,716
742,160The amount of interest paid by the buyer in terms of section 16 of the MSMED Act 2006 along with the amounts of the payment made to the supplier beyond the appointed day during each accounting year -The amount of interest due and payable for the period of delay in making payment (which have been paid but beyond the appointed day during the year) but without adding the interest specified under the MSMED Act 2006. 212,582The amount of interest accrued and remaining unpaid at the end of each accounting year. 589,595The amount of further interest remaining due and payable even in the succeeding years, until such date when the interest dues as above are actually paid to the small enterprise for the purpose of disallowance as a deductible expenditure under section 23 of the MSMED Act 2006 -
36. Details of dues to micro and small enterprises as defined under the MSMED Act, 2006
Notes to Consolidated financial Statements for the year ended March 31, 2016

Lumax Industries Limited | Annual Report 2015-16
161
(Amount in G)Particulars March 31, 2016a. Capital Expenditure Capital expenditure 17,154,739b. Revenue Expenditure Salaries, Allowances and Bonus 73,028,979 Contribution to Provident Fund 3,586,926 Contribution to Other Funds 206,830 Staff Welfare 12,120,633 Provision for Retirement Benefit 2,110,993 Insurance 346,346 Repair & Maintenance 12,277,078 Travelling & Conveyance 29,025,564 Research & Development 1,120 Electricity 808,238 Miscellaneous 4,676,826 Design, Support & Testing Charges 1,522,488 Material/Consumable/Spares 95,830 Depreciation 15,153,808 Financial Cost 745,982 Total 155,707,641
(Amount in G)Particulars March 31, 2016a. Capital expenditure Capital expenditure 7,463,762b. Revenue Expenditure Salaries, Allowances and Bonus 44,708,512 Contribution to Provident Fund 2,147,793 Contribution to Other Funds 189,125 Staff Welfare 5,474,640 Provision for Retirement Benefit 1,333,692 Insurance 170,070 Repair & Maintenance 5,091,501 Travelling & Conveyance 11,521,068 Research & Development 61,383 Legal & Professional Expenses 3,596,647 Design, Support & Testing Charges 387,948 Material / Consumables / Spares 40,538 Electricity 2,337,783 Miscellaneous 1,821,636 Depreciation 8,137,997 Financial Cost 218,462 Total 87,238,795
37. Details of Research and Development expenses are as follows:A. The Company has incurred expenses on its in-house research and development center at Gurgaon approved
and recognised by the Ministry of Science & Technology, Government of India.
B. The Company has incurred expenses on its in-house research and development center at Pune approved and recognised by the Ministry of Science & Technology, Government of India.
Notes to Consolidated financial Statements for the year ended March 31, 2016

162
38. Corporate Social Responsibility (CSR) As per the provisions of section 135 of the Companies Act, 2013, the Company had to spend atleast 2% of the
average profits of the preceding three financial years towards CSR. Accordingly, a CSR committee has been formed for carrying out the CSR activities as per Schedule VII of the Companies Act, 2013 which amounts to H 2,016,882. The Company has spend an amount of H 3,259,049 and has accordingly charged the same to the statement of Profit & Loss.
39. The Company has filed the writ petition against Government of West Bengal challenging Singur Land Rehabilitation & Development Act, 2011 for cancellation of allotment of land allotted by West Bengal Industrial Development Corporation. The court has clubbed the vendors’ petitions with Tata Motors Petition and the matter is pending for decision. The management is confident that no losses are expected in this regard.
40. The assets of H 239,219,298 recognized by the Company as ‘MAT Credit Entitlement’ under ‘ Loans and Advances’ represents that portion of MAT, which can be recovered and set off in subsequent years based on provisions of Section 115JAA of the Income Tax Act, 1961. The management, based on present trend of profitability and also the future profitability projections, is of the view that there would be sufficient taxable income in foreseeable future, which will enable the Company to utilize MAT credit assets.
41. Previous year comparatives The Company has not provided the comparative financial information in view of the transitional Provisions of
Accounting standard-21 exempting the Company in case of its first cansolidated financial statements.
As per our report of even date
For S. R. BATLIBOI & CO. LLP For and on behalf of the Board of Directors of Lumax Industries LimitedChartered AccountantsICAI firm registration number: 301003E/E300005
per Vikas Mehra D. K. Jain Deepak JainPartner Chairman Managing DirectorMembership No. 94421 DIN: 00085848 DIN: 00004972
Place : New Delhi Shruti Kant Rustagi Shwetank Tiwari Date : May 12, 2016 Chief Financial Officer Company Secretary
Notes to Consolidated financial Statements for the year ended March 31, 2016

Lumax Industries Limited | Annual Report 2015-16
163
Notes

THE HISTORY OF THE WORLD IS FULL OF MEN WHO ROSE TO LEADERSHIP, BY
SHEER FORCE OF SELF-CONFIDENCE, BRAVERY AND TENACITY.
MAHATMA GANDHI


Lumax Industries Limited www. lumaxindustries.com | www.lumaxworld.in
a K&
A cr
eatio
n |
ww
w.ka
lolw
ala.
co.in
Recommended