LOYOLA UNIVERSITY CHICAGO
IDENTIFICATION OF NEW PATHWAYS FOR CO OXIDATION ON RH(111) &
SPATIAL AND STRUCTURAL CONTROL OF O-INDUCED RECONSTRUCTION OF
AG(111)
A DISSERTATION SUBMITTED TO
THE FACULTY OF THE GRADUATE SCHOOL
IN CANDIDACY FOR THE DEGREE OF
DOCTOR OF PHILOSOPHY
PROGRAM IN CHEMISTRY
BY
MARIE E. TURANO
CHICAGO, IL
MAY 2021

Copyright by Marie E. Turano, 2021
All rights reserved.
iii
ACKNOWLEDGMENTS
I would like to thank everyone who made my research experience unforgettable and this
dissertation possible. Firstly, I would like to thank my advisor, Dr. Dan Killelea, for his
encouragement to attend graduate school and for allowing me to join his research group. His
mentorship, advice, and coaching through the whole PhD process have been invaluable. I would
also like to thank the other members of my dissertation committee for their time, valuable
feedback, and commitment to my professional development: Dr. Jacob Ciszek, Dr. Jan Florian,
Dr. Daniel Graham, and Dr. Nan Jiang.
I would also like to thank the members of the Killelea lab. My predecessors, Dr. Jon
Derouin and Dr. Rachael Farber, taught me about the lab equipment. I would like to especially
thank Rachael for her guidance and friendship during my first years in graduate school. In
addition, I enjoyed mentoring the undergrads, especially George Hildebrandt and Faith Lewis.
To the current graduate students, Maxwell Gillum and Liz Jamka, best of luck when I leave!
Additionally, I would like to thank the Loyola University Chemistry Department for their
support. Thanks to Matt Sara for supplying the lab with nitrogen. Thank you also to Denise Hall,
Carol Grimm, Mary Novak, Dr. Duarte deFrietas, and Dr. Miguel Ballicora for being my
advocates on countless occasions.

iv
I have been most fortunate to collaborate with professors from other universities during
my graduate studies. Dr. Sharani Roy allowed me to visit her lab and experience running
theoretical calculations. Dr. Erin Iski assisted in imaging several projects, providing valuable
guidance from her experience. Dr. Ludo Juurlink’s collaboration on the curved Ag(111) project
provided me with a great learning experience in both scientific research and writing. I would like
to thank Dr. Alex Kandel for allowing the Killelea lab to purchase a LEED, which has been
pivotal for experiments. It was a joy working with and learning from each professor.
Thank you to the Loyola University Graduate School for the funding opportunities while
I was here, specifically the Research Mentoring Fellowship for allowing me to share my research
with an undergrad in a mentoring capacity; The Teaching Scholars Fellowship for enabling me to
be the instructor of record in a class and better understand life as a teacher; and the Arthur J.
Schmitt Fellowship for providing me with funds to finish up my final year of research and
writing.
Finally, my sincerest gratitude goes to my mom, dad, and my sister Clare for their endless
patience and encouragement. I would also like to thank Julie for her guidance over the years. A
special thank you to my high school teachers especially Ms. Currie, Mrs. Deichl, Ms. Heckman
Ms. Keenley, and Mrs. Kestler for encouraging me to study math and science and providing me
with such a strong background in math and science. Thank you also to all my friends who
supported me throughout this journey including Dr. Darlene Douglas, Katherine Formentini,
Sarah Formentini, Dr. Sara Isbill, Kevin Knoll, Adri Lugosan, Dr. Jacki Simon, and Fr. Al
Tremari. Special thanks to Kevin for keeping my chocolate stash well stocked. Lastly, thank you
to the Blessed Virgin Mary for watching over me through everything.

Dedicated to Our Lady
vi
TABLE OF CONTENTS
ACKNOWLEDGMENTS iii
LIST OF TABLES vii
LIST OF FIGURES viii
LIST OF ABBREVIATIONS xi
ABSTRACT xv
CHAPTER ONE: INTRODUCTION 1
CHAPTER TWO: TEMPERATURE DEPENDENCE OF CO OXIDATION ON
RH(111) BY ADSORBED OXYGEN 20
CHAPTER THREE: CHARACTERIZATION OF OXYGENACEOUS SPECIES
FORMED BY EXPOSURE OF AG(111) TO ATOMIC OXYGEN 37
CHAPTER FOUR: STEP GEOMETRY AND WIDTH-DEPENDENT INHIBITION
OF OXYGEN ADSORPTION AND SURFACE RECONSTRUCTION ON
CURVED AG(111) 57
CHAPTER FIVE: SUBSURFACE OXYGEN EMERGENCE ON RH(111) 80
CHAPTER SIX: CONCLUSIONS AND FUTURE DIRECTIONS 100
APPENDIX A: SUPPORTING INFORMATION FOR CHAPTER THREE 103
REFERENCE LIST 107
VITA 123

vii
LIST OF TABLES
Table 1. Position from apex and corresponding crystal plane 64
viii
LIST OF FIGURES
Figure 1. Rhodium crystal structure 5
Figure 2. Pictorial of Wood’s Notation 6
Figure 3. Models of four O/Rh(111) surface structures 8
Figure 4. Model of the RhO2 oxide structure on Rh(111) 9
Figure 5. Proposed models of p(4 × 4)-O/Ag(111) 12
Figure 6. Models of p(4 × 4)-O/Ag(111) surface reconstruction 16
Figure 7. Schematic of curved crystal 18
Figure 8. TPD spectra of CO2 yield and Ores on Rh(111) following 30 L CO exposure
at various T 24
Figure 9. LEED patterns of (2 × 2)-2O+CO on Rh(111) after 30L CO exposure at Ts =
300 K and 350 K 25
Figure 10. Coverage of Ores and CO2 yield plotted against CO exposure temperature 27
Figure 11. CO2 yield and Ores for varying CO exposures at 350 K and 300 K 31
Figure 12. STM images of (2 × 1)-O adlayer at 300 K, (2 × 2)-2O+CO adlayer, and
(2 × 2)-2O+CO adlayer after 325 K anneal on Rh(111) 33
Figure 13. STM images of monatomic step with (2 × 2)-2O+CO adlayer after 325 K
anneal on Rh(111) 35
Figure 14. TPD spectra of various AO exposures on Ag(111) at T ≤ 500 K 41
Figure 15. Total oxygen yield plotted against AO exposure time on Ag(111) 43
Figure 16. LEED patterns of Ag(111) after AO exposures taken at APS and Loyola 45
Figure 17. XPS spectra of clean Ag(111) after various AO exposures at 525 K 47
ix
Figure 18. XPS spectra of Ag(111) after AO exposure at Ts = 475 K 50
Figure 19. Plots of the contribution of each spectral component to the total signal 51
Figure 20. O 1s XPS spectra on Ag(111) after 450 K AO exposure and annealing at 525 K 52
Figure 21. Schematic of curved (111) crystal step edges 61
Figure 22. STM images of clean c-Ag(111) 64
Figure 23. Plot of clean c-Ag(111) step widths versus position on crystal 66
Figure 24. TPD spectra from c-Ag(111) after AO exposures of varying duration 67
Figure 25. STM images of short AO doses at Ts = 525 K 68
Figure 26. STM images of 90 s AO at 525 K at x = +0.5 mm, B-type steps 69
Figure 27. STM images after a 300 s AO exposure and 1200 s AO exposure 71
Figure 28. STM image after 1200 s AO exposure at 525 K at x = +1.5 mm, B-type steps 72
Figure 29. STM images of 1200 s AO at Ts = 525 K depicting the popcorn pattern 73
Figure 30. STM images after 2400 s AO 525 K exposure 74
Figure 31. Fraction of O-induced reconstruction and coverage of chemisorbed O in
un-reconstructed areas after AO exposure as a function of position 75
Figure 32. STM images of c-Ag(111) after 1200 s AO at Ts = 450 K 77
Figure 33. TPD plots and STM images of 60 L O2 at 300 K after 890 K and 1000 K
partial TPD 85
Figure 34. STM image and line profile of Rh(111) after 60 L O2 exposure at 300 K
and partial TPD to 890 K 86
Figure 35. STM images of Rh(111) after AO exposure at 350 K 87
Figure 36. Partial TPD of Rh(111) after AO exposure at 350 K 88
Figure 37. STM images after partial TPDs of Rh(111) after AO exposure at 350 K 89
Figure 38. STM images of Rh(111) after AO exposure at 350 K and TPD to 950 K 92
x
Figure 39. STM image and line profiles of Rh(111) after AO exposure at 350 K and
partial TPD to 950 K 93
Figure 40. Partial TPD of Rh(111) after AO exposure at 700 K 94
Figure 41. STM image of Rh(111) surface after AO exposure at 700 K 96
Figure 42. STM images after partial TPD of Rh(111) after AO exposure at 700 K 98
Figure 43. XPS spectra of clean and oxidized surfaces 104
Figure 44. Correction of TPD data 105
xi
LIST OF ABBREVIATIONS
Å Angstrom
AES Auger electron spectroscopy
Ag Silver
AgB Bulk silver
AgF Silver in furrows
AgOx Bulk-like silver oxide
AgR Silver in surface reconstruction
AgO Silver oxide
Ag2O Bulk-like silver oxide
AO Atomic oxygen
APS Advanced photon source
Ar Argon
CO Carbon monoxide
COad Adsorbed carbon monoxide
CO2 Carbon dioxide
COad Adsorbed carbon monoxide
DFT Density functional theory
eV Electron volts
fcc Face centered cubic
freconstructed Fraction of surface reconstructed
xii
hcp Hexagonally close packed
He Helium
IMFP Inelastic mean free path
Ir Iridium
K Kelvin
L Langmuir
LEED Low energy electron diffraction
LEEM Low energy electron microscopy
ML Monolayer
nterrace Number of atoms on terrace
NIST National institute of standards and technology
NO2 Nitrogen dioxide
O Oxygen
O2 Molecular oxygen
O2,chem Chemisorbed molecular oxygen
Oad Adsorbed oxygen
Oc Chemisorbed oxygen
Ores Residual oxygen
Osub Subsurface oxygen
OH Hydroxide
Pd Palladium
Pt Platinum
QMS Quadrupole mass spectrometer
xiii
RGA Residual gas analysis
Rh Rhodium
RhO2 Rhodium surface oxide
s Second
STM Scanning tunneling microscope
Ta Tantalum
T Temperature
Tdep Deposition temperature
Texp Exposure temperature
Ts Surface temperature
Tsample Sample temperature
TPD Temperature programmed desorption
θCO Carbon monoxide coverage
θO Total amount of oxygen
θO,ad Surface oxygen coverage
θO,c Chemisorbed oxygen coverage
θO,res Residual oxygen coverage
θO,surface Surface oxygen coverage
θO,total Total oxygen coverage/yield
UHV Ultra-high vacuum
UHV-STM Ultra-high vacuum scanning tunneling microscopy
wterrace Width of terrace
XRD X-ray diffraction

xiv
XPS X-ray photoelectron spectroscopy
YCO2 Carbon dioxide yield
xv
ABSTRACT
Understanding the fundamentals of oxygen surface structures under a variety of
conditions is pivotal to determining reactivity of heterogeneous catalysis. Exposure of
catalytically active metal surfaces to high oxygen coverages results in a myriad of surface
structures. A further complication is the formation of subsurface oxygen (Osub) or oxygen present
in the near subsurface region of the metal. It is known to form in transition metals yet the
absorption of oxygen and resultant formation of Osub is not equivalent across all catalytically
relevant metals. As a result, it is difficult to predict the stability and efficacy of the formation of
Osub in metals, as well as how the absorbed oxygen affects the reactivity of the metal. This
dissertation investigates both Rh(111) and Ag(111) oxidized surfaces after exposure to gas-phase
O atoms, utilizing a combination of surface science techniques including Auger electron
spectroscopy (AES), low energy electron diffraction (LEED), temperature programmed
desorption (TPD), and scanning tunneling microscopy (STM).
Carbon monoxide (CO) oxidation over Rh(111) surfaces is a prototypical heterogeneous
catalyzed reaction, especially when it comes to studying the oxygen species present during
reaction. Investigation of the reactivity of adsorbed oxygen with CO shows insight into the
mechanism of CO oxidation on surface oxygen. Through a combination of LEED, TPD, and
STM experiments it was determined that CO oxidation on adsorbed oxygen shows a temperature
dependence, with CO oxidation even occurring at and around room temperature. When Rh(111)
is exposed to atomic oxygen at high temperatures, a myriad of structures form including oxides,
xvi
adsorbed oxygen, and Osub. Studying the evolution of highly oxidized Rh(111) surfaces using
STM and LEED lead to the discovery that upon Osub emergence from the bulk, the surface
changes homogeneously.
On Ag(111), Osub is temperature dependent, forming at temperatures < 500 K. Once 0.1
ML of Osub has formed on Ag(111), the surface uniformly reconstructs to a striped structure that
persists at longer exposures. The maximum uptake of Osub in Ag(111) is at a temperature of 450
K. Using XPS, it was determined that originally the surface is covered in a single adsorbed O
species yet as the oxygen coverage increases, a three-dimensional phase begins to form. These
results indicate the importance of Osub in formation of oxygenaceous structures on Ag(111) and
the conditions at which Osub forms.
While planar surfaces allow for the study of oxygen uptake on catalytically relevant
metals, using a curved crystal with well-defined step geometries and terrace widths allows for
investigation of multiple surface structures simultaneously. An investigation of O-induced
reconstructions of curved Ag(111) showed that A-type (100) steps were more conducive to O
adsorption than B-type (110) steps. Furthermore, O uptake and reconstruction formation were
more favorable on wide terraces since narrow B-type steps reconstruct less when compared to
their A-type counterparts. The results illustrate the complexity of Oad reactivity with CO, the
properties of Osub formation and its emergence, and the influence of step geometry on O
adsorption on transition metal surfaces.
1
CHAPTER ONE
INTRODUCTION
Modern society relies heavily on heterogeneously catalyzed processes. From purification
of exhaust gas in vehicles and power plants to production of pharmaceutical and medicinal
chemicals, catalysts are essential to producing products necessary for daily life.1-3 Nearly 90% of
industrial chemical processes have at least one catalytic step.1 In modern industrial chemical
synthesis, the two most utilized reaction processes are polymerization and oxidation, which rely
on the use of catalysts.5 Catalysts are essential to lower the activation energy barrier of reactions
and enable selectivity to increase the rate of formation of one product while bypassing another
product or unwanted byproducts.6 In heterogeneous catalysis, the catalyst and reactants are in
different phases. While a catalyst changes the rate of the reaction, it is not consumed during the
reaction, allowing for use in many cycles of the reaction, referred to as the catalytic cycle.7-8
Catalysts are specifically designed for millions of turnovers, high reaction rates, high selectivity,
and optimal performance in a specific reaction.9
The conditions used for industrial-scale application of heterogeneously catalyzed reaction
schemes often demand high pressure and temperature conditions, requiring enormous amounts of
energy to be expended. Additionally, the high temperature and pressure conditions results in
dynamic and rapidly changing surfaces hosting a multitude of surface structures, complicating
the elucidation of the actual chemical mechanisms for these reactions.7 Often, only one out of
2
a multitude of surface structures present is the active phase. The other structures may act as
spectators and promote reactivity yet not undergo any reactivity by themselves.10 However, the
tools and techniques to study catalytic surfaces work best under very low pressures or ultra-high
vacuum (UHV, P < 1 × 10⁻⁹ Torr). This leads to a “pressure gap” of about twelve orders of
magnitude between industrial catalytic conditions and the UHV techniques used to study them.6
This pressure gap has been bridged in recent years by adapting surface science techniques to
work at higher pressures.11 This has been done successfully with several methods including
scanning tunneling microscopy (STM),12-18 a variety of x-ray diffraction (XRD) techniques,13, 18-
20 and x-ray photoelectron spectroscopy (XPS).18, 21-22 In addition, in situ, operando, and high-
pressure reaction cell experiments allow for connectivity between industrial conditions and UHV
analysis by providing direct insight into the active site of the catalyst under representative
reaction conditions.20, 23-25 However, UHV is still essential for its atomic-scale insight and
detailed structural and chemical characterization on the molecular level.25-26 UHV allows for
fundamental studies of surfaces including determination of electronic structures, oxidation states,
and calculation of bond distances and bond angles.24
Additionally, there is also a materials gap in catalysis. Industry utilizes small metal
nanoparticles situated on high surface area supports whereas studies of catalysts in UHV often
occur on single crystal surfaces.1, 6, 9, 26 While large, flat terraces make for an ideal surface to
study adsorption, the kinks and defect sites of the metal crystal are thought to show increased
reactivity due to the under coordination of metal atoms.7-8 To address this, over the past two
decades, surface scientists have developed methods to make well characterized model catalyst
samples of metal clusters on ultrathin metal-oxide surfaces. These systems allow for the study of
complex metal-support interactions and particle size effects.9, 26-27 These model systems allow for
3
the introduction of important complex features inherent to realistic catalysts in a highly
controlled way while keeping the system accessible to surface science techniques.27
Although strides have been made to bridge the gaps between industrial catalysts and
UHV studies, heterogeneous catalysts are still very complex materials making it difficult to
determine which factors are important to the function of the real catalytic material.28 One
important factor for understanding oxidative catalysis on catalytic metal surfaces is the
interaction of oxygen with the transition metal surface as oxygen structures form under catalytic
conditions.29-30 When oxygen binds to the metal surface, the oxygen adsorbates minimize
repulsive adsorbate-adsorbate interactions and the site dependent adsorption energy to form the
most thermodynamically favored surface structure.31-32 As O2 approaches the surface, it
physisorbs as molecular oxygen through weak Van der Waals interactions with the surface. As
the oxygen moves closer to the surface, and the adsorbate-surface interaction becomes stronger,
the O2 molecule dissociates into single oxygen atoms or adsorbed oxygen (Oad) which are
chemisorbed to the surface.10, 33 The strong bonds formed between Oad and the metal substrate
results in a disruption of the metal lattice resulting in an array of surface reconstructions.10 These
oxygen-induced surface reconstructions, or “surface oxides”, are monolayer surface structures
that have been extensively studied.34-35 Studies have shown that the presence of these surface
oxide reconstructions enhance reactivity,20, 34, 36-37 serve as an oxygen source during surface
reactions,35, 38-39 and can change the reactivity of the metal.40-41 For example, a metal catalyst that
is inactive under UHV conditions can become active under high oxygen pressures and form
oxygen rich surface phases.42 As the oxygen coverage (θO) continues to increase, more dense or
multilayer bulk oxides form, changing the chemical state of the surface from metallic to oxidic.10,
4
20, 34, 43 These metal oxides may dramatically alter the properties of the transition metal as the
bulk oxide is commonly unreactive.34, 43-44
Since oxides are normally formed and stable at high pressure and temperature reaction
conditions, most UHV studies have focused instead on chemisorbed oxygen overlayers instead
of oxides.35 In the past two decades or so the importance of oxides as a link to industrial catalysis
has been recognized, and extensive work has been done on the oxidation of transition metal
surfaces.34, 38, 45-50 Studying the oxide growth, formation, and reactivity of heterogeneous
catalysts is important as metal oxide formation occurs under industrial reaction conditions. Thus,
studies of a model substrate help bridge the pressure gap between a controlled UHV environment
and realistic reaction conditions.34, 39
An intriguing species, that has proven challenging to study or understand, is subsurface
oxygen (Osub) or oxygen that has permeated below the surface into the near surface region of the
crystal, thus disrupting the metal lattice.7, 48 Subsurface oxygen forms under high temperature
and pressure conditions with surface defects and step edges facilitating oxygen diffusion into the
near surface resulting in the formation of Osub.51-53 As surface oxygen is reacted off, Osub moves
to the surface and takes its place thus acting as a reservoir to replenish the surface oxygen.54-56 In
addition to being a reservoir, Osub increases reactivity and is critical to the formation of oxide
layers on transition metals.48, 57-58
While much research has been carried out on catalytic systems, there is little to no
consensus on the atomic level mechanism under realistic conditions.59 When studying oxidative
heterogeneous catalysis, understanding which phase of oxygen is present on the surface and in
the near surface region is pivotal to determining which phase is reactive. My work focuses on
determination of which oxygen phases exist on or in single metal crystals and which oxygen
5
phase is the primary reactive species under oxidative conditions. Through careful dosing and
preparation of the crystal, the resultant oxygen surfaces on Rh and Ag may be characterized
using UHV techniques including Auger Electron Spectrometer (AES), Temperature Programmed
Desorption (TPD), Low Energy Electron Diffraction (LEED), and Scanning Tunneling
Microscopy (STM).
Rhodium
Rhodium (Rh) is a rare and precious transition metal belonging to the platinum group
metals. While other platinum group metals are used in a wide variety of applications, because of
its scarcity Rh is mainly limited to catalysis.60-61 It is used in reactions such as hydrogenation,62-
63 ethanol steam reforming,64-65 CO oxidation,66-67 and NOx reduction.68-69 One widespread use of
Rh for NOx reduction is in the three-way catalytic converter. Since 2012, nearly 80% of the
annual production of Rh has been used in catalytic convertors. However, its low abundance in
the Earth’s crust and high pricing is encouraging more efficient use of this precious metal.60
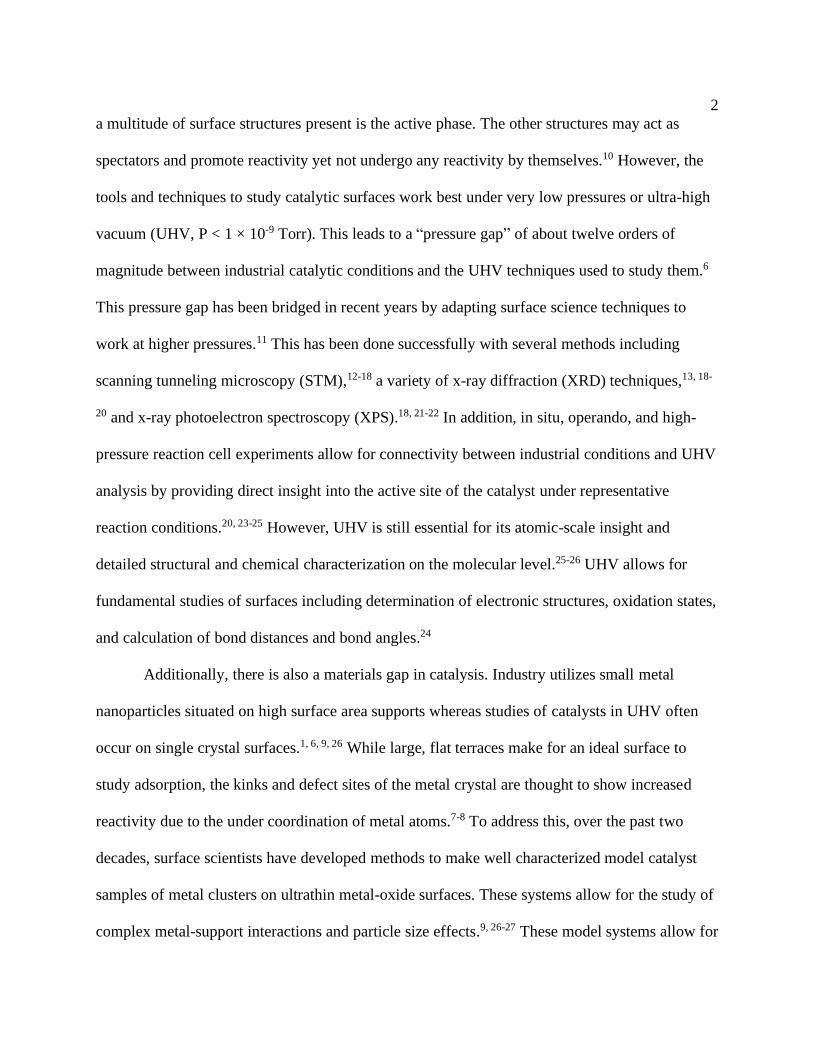
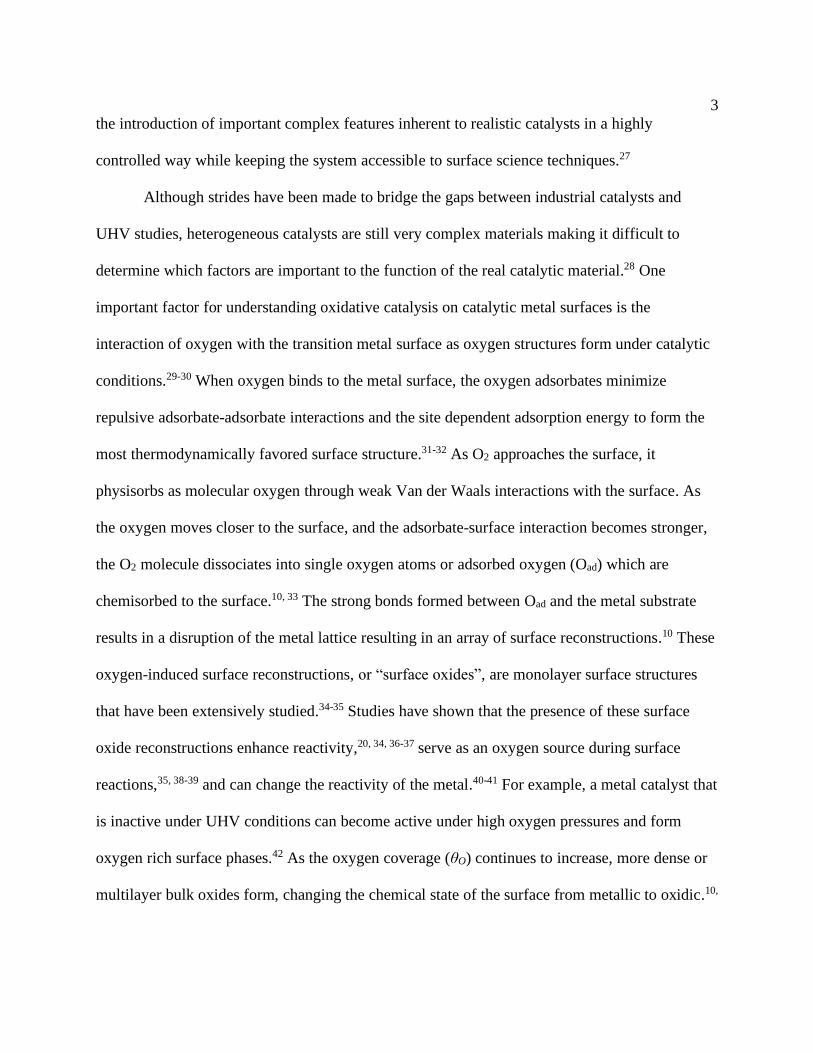
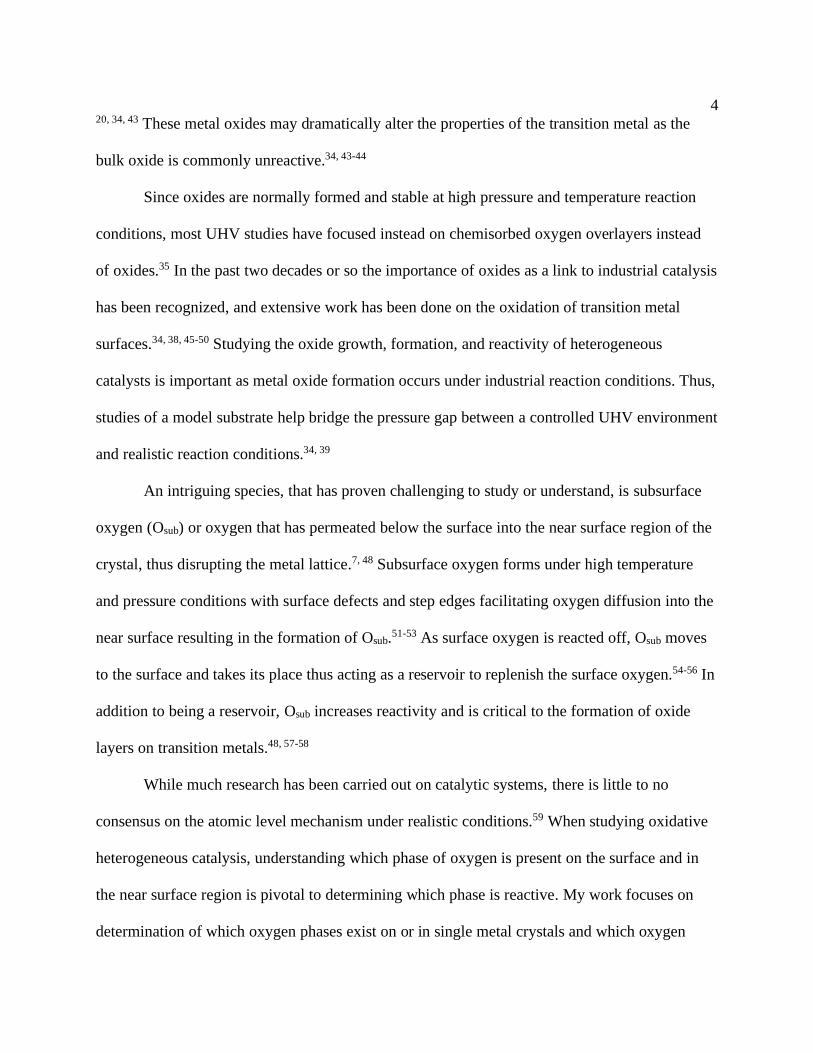
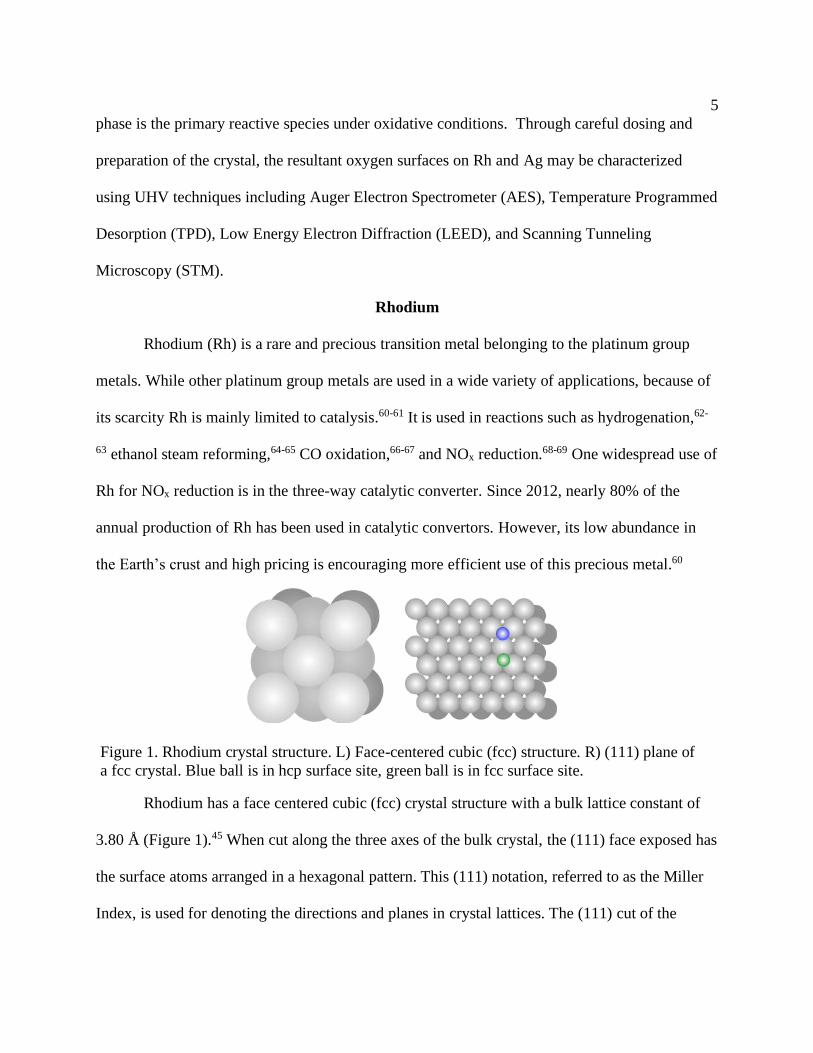
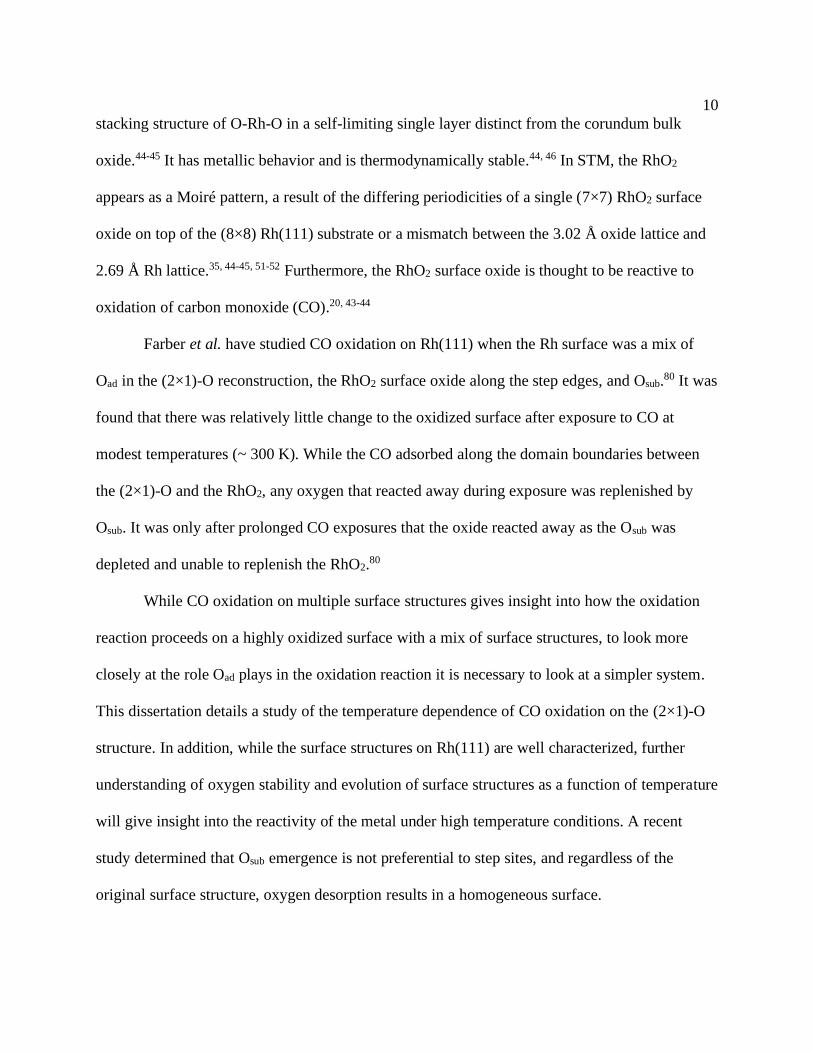
Rhodium has a face centered cubic (fcc) crystal structure with a bulk lattice constant of
3.80 Å (Figure 1).45 When cut along the three axes of the bulk crystal, the (111) face exposed has
the surface atoms arranged in a hexagonal pattern. This (111) notation, referred to as the Miller
Index, is used for denoting the directions and planes in crystal lattices. The (111) cut of the
Figure 1. Rhodium crystal structure. L) Face-centered cubic (fcc) structure. R) (111) plane of
a fcc crystal. Blue ball is in hcp surface site, green ball is in fcc surface site.
6
surface exposes both fcc and hexagonally close packed (hcp) adsorption sites that differ in their
atomic stacking arrangement. Fcc has an ABC stacking sequence whereas hcp has an ABA
stacking sequence. Adsorbates on Rh prefer binding in the fcc adsorption sites due to slightly
lower energy than the hcp sites. However, since the energy difference is only 0.03 eV, at high
surface coverages, either site may be populated.70
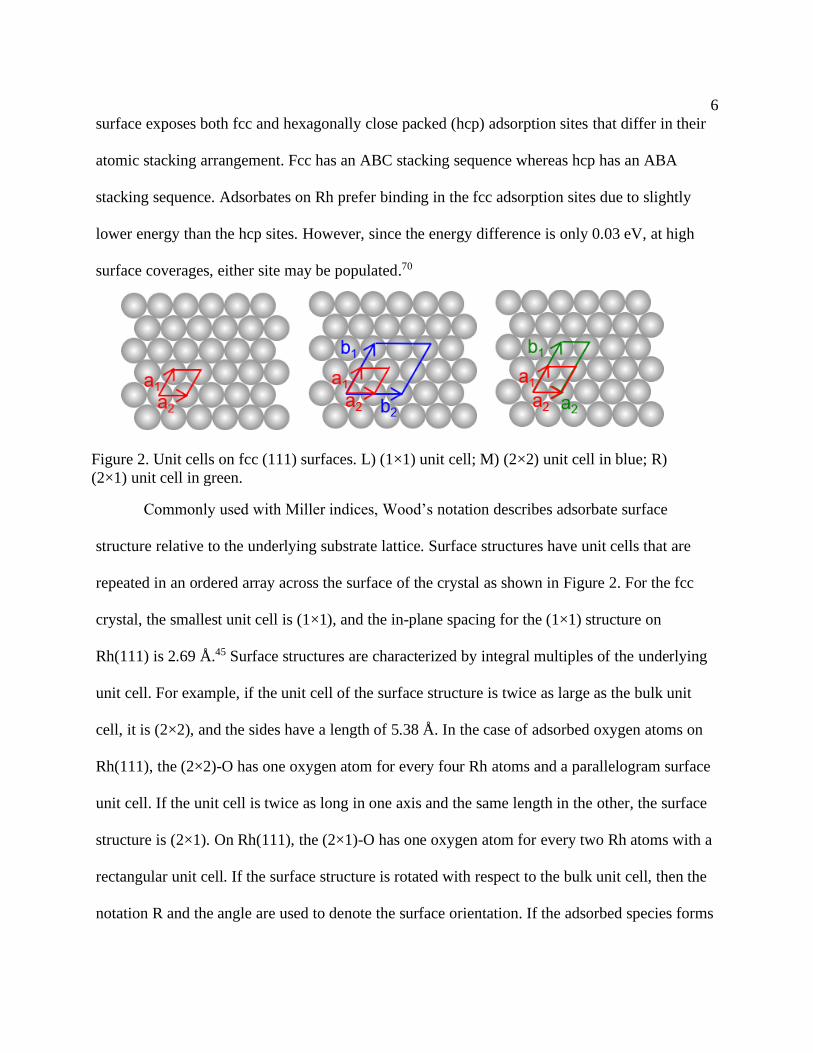
Commonly used with Miller indices, Wood’s notation describes adsorbate surface
structure relative to the underlying substrate lattice. Surface structures have unit cells that are
repeated in an ordered array across the surface of the crystal as shown in Figure 2. For the fcc
crystal, the smallest unit cell is (1×1), and the in-plane spacing for the (1×1) structure on
Rh(111) is 2.69 Å.45 Surface structures are characterized by integral multiples of the underlying
unit cell. For example, if the unit cell of the surface structure is twice as large as the bulk unit
cell, it is (2×2), and the sides have a length of 5.38 Å. In the case of adsorbed oxygen atoms on
Rh(111), the (2×2)-O has one oxygen atom for every four Rh atoms and a parallelogram surface
unit cell. If the unit cell is twice as long in one axis and the same length in the other, the surface
structure is (2×1). On Rh(111), the (2×1)-O has one oxygen atom for every two Rh atoms with a
rectangular unit cell. If the surface structure is rotated with respect to the bulk unit cell, then the
notation R and the angle are used to denote the surface orientation. If the adsorbed species forms
Figure 2. Unit cells on fcc (111) surfaces. L) (1×1) unit cell; M) (2×2) unit cell in blue; R)
(2×1) unit cell in green.
7
a surface structure characterized by a unit cell identical to the primitive unit cell of the substrate,
then the chemical symbol or formula for the adsorbate is included after the ratio.32, 71
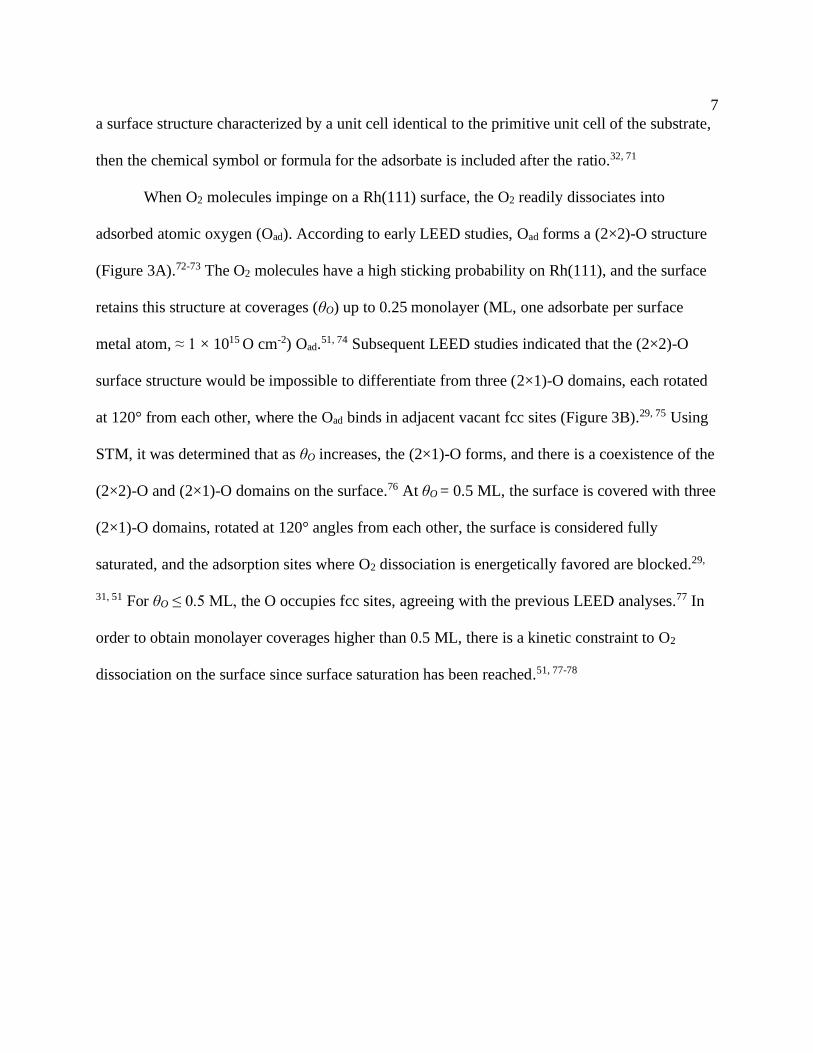
When O2 molecules impinge on a Rh(111) surface, the O2 readily dissociates into
adsorbed atomic oxygen (Oad). According to early LEED studies, Oad forms a (2×2)-O structure
(Figure 3A).72-73 The O2 molecules have a high sticking probability on Rh(111), and the surface
retains this structure at coverages (θO) up to 0.25 monolayer (ML, one adsorbate per surface
metal atom, ≈ 1 × 10¹⁵ O cm-2) Oad.51, 74 Subsequent LEED studies indicated that the (2×2)-O
surface structure would be impossible to differentiate from three (2×1)-O domains, each rotated
at 120° from each other, where the Oad binds in adjacent vacant fcc sites (Figure 3B).29, 75 Using
STM, it was determined that as θO increases, the (2×1)-O forms, and there is a coexistence of the
(2×2)-O and (2×1)-O domains on the surface.76 At θO = 0.5 ML, the surface is covered with three
(2×1)-O domains, rotated at 120° angles from each other, the surface is considered fully
saturated, and the adsorption sites where O2 dissociation is energetically favored are blocked.29,
31, 51 For θO ≤ 0.5 ML, the O occupies fcc sites, agreeing with the previous LEED analyses.77 In
order to obtain monolayer coverages higher than 0.5 ML, there is a kinetic constraint to O2
dissociation on the surface since surface saturation has been reached.51, 77-78
8
Using O2 at elevated temperatures and pressures, Kohler et al. discovered oxygen
structures on Rh(111) where the oxygen atoms adsorb in both the fcc and hcp sites to achieve
θO > 0.5 ML.31 The two structures found were the (2√3×2√3) R30° and the p(2×2)-3O with θO of
0.66 ML and 0.75 ML respectively. The (2√3×2√3) R30° has 8 oxygen atoms per unit cell, 6 in
fcc sites and 2 in hcp sites (Figure 3D). The high O2 pressures cause the surface reconstruction to
relax allowing adsorption in the hcp sites.31, 70
Another way to overcome the kinetic constraint of O2 dissociation is to use a different
oxygen source such as atomic oxygen (AO). Gibson et al. identified a (1×1)-O surface structure
on Rh(111) with θO = 1.0 ML after exposure to AO (Figure 3C).78-79 Furthermore, once the
surface was saturated with 1.0 ML Oad, any additional O was incorporated into the bulk forming
Osub.78-79 Previous density functional theory (DFT) had predicted the (1×1)-O structure was
Figure 3. Models of four O/Rh(111) surface structures. A) (2×2); B) (2×1); C) (1×1); D)
(2√3×2√3) R30°. Overlay is the unit cell. Gray balls are the Rh surface atoms. Red balls are
the O atoms on fcc sites. Gold balls are the O atoms on hcp surface sites.
9
possible, and that once the (1×1)-O was nearly complete, Osub would form.77 More recently,
Farber et al. used modest sample temperatures and AO exposures to obtain the (2√3 × 2√3) R30°
structure in coexistence with p(2×2)-3O domains on the Rh surface previously seen by Kohler.31,
52
Exposing the Rh(111) surface to AO allows not only for θO > 0.5 ML to be achieved
under moderate temperatures and pressures but also formation of Osub. This Osub feature is
detectable in TPD at ~ 800 K as a separate peak from surface oxygen due to the lower binding
energy of Osub; it desorbs from Rh(111) at a lower temperature than surface oxygen.51-52 The
incorporation of oxygen atoms into the subsurface induces a distortion of the Rh metal lattice
which decreases the binding energy of the surface oxygen atoms.42, 54 While Gibson et al. argued
that the (1×1)-O is necessary for the incorporation of oxygen into the selvedge,78-79 other groups
have reported Osub formation without the presence of the (1×1)-O structure.51-52
In addition to forming Osub, AO exposures can also lead to formation of oxides along step
edges and defect sites.42, 45, 52 It is thought that the incorporation of Osub is necessary for the
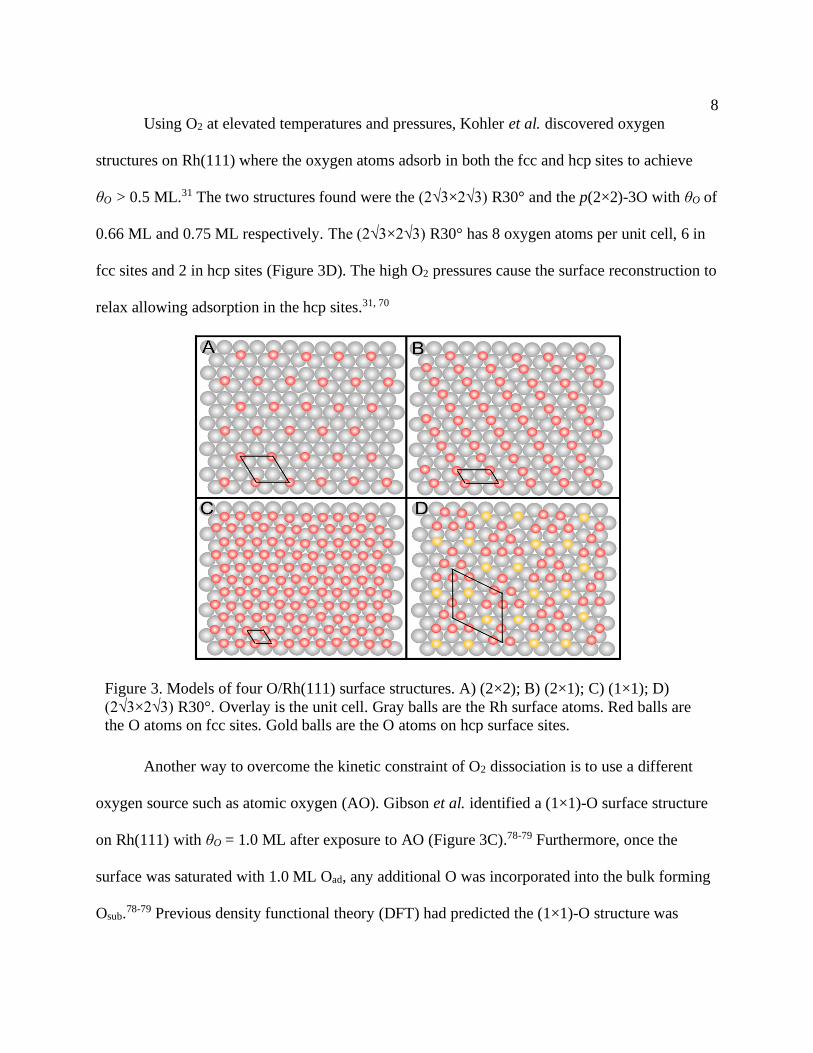
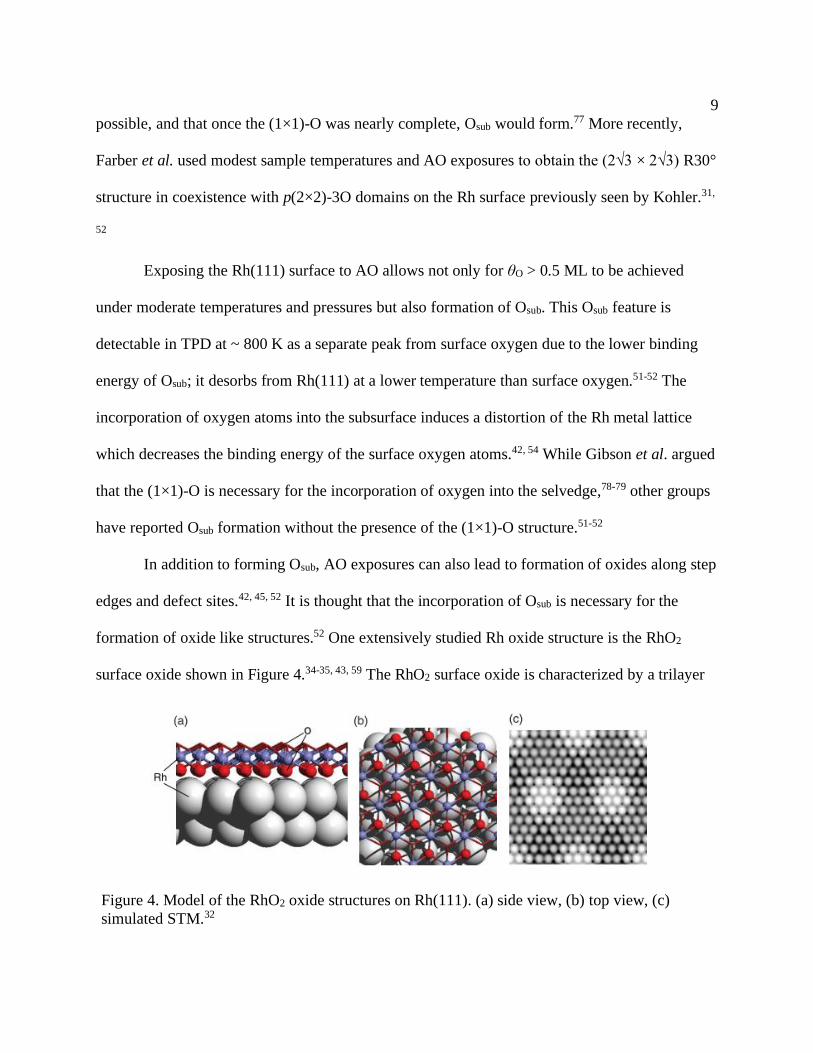
formation of oxide like structures.52 One extensively studied Rh oxide structure is the RhO2
surface oxide shown in Figure 4.34-35, 43, 59 The RhO2 surface oxide is characterized by a trilayer
Figure 4. Model of the RhO2 oxide structures on Rh(111). (a) side view, (b) top view, (c)
simulated STM.32
10
stacking structure of O-Rh-O in a self-limiting single layer distinct from the corundum bulk
oxide.44-45 It has metallic behavior and is thermodynamically stable.44, 46 In STM, the RhO2
appears as a Moiré pattern, a result of the differing periodicities of a single (7×7) RhO2 surface
oxide on top of the (8×8) Rh(111) substrate or a mismatch between the 3.02 Å oxide lattice and
2.69 Å Rh lattice.35, 44-45, 51-52 Furthermore, the RhO2 surface oxide is thought to be reactive to
oxidation of carbon monoxide (CO).20, 43-44
Farber et al. have studied CO oxidation on Rh(111) when the Rh surface was a mix of
Oad in the (2×1)-O reconstruction, the RhO2 surface oxide along the step edges, and Osub.80 It was
found that there was relatively little change to the oxidized surface after exposure to CO at
modest temperatures (~ 300 K). While the CO adsorbed along the domain boundaries between
the (2×1)-O and the RhO2, any oxygen that reacted away during exposure was replenished by
Osub. It was only after prolonged CO exposures that the oxide reacted away as the Osub was
depleted and unable to replenish the RhO2.80
While CO oxidation on multiple surface structures gives insight into how the oxidation
reaction proceeds on a highly oxidized surface with a mix of surface structures, to look more
closely at the role Oad plays in the oxidation reaction it is necessary to look at a simpler system.
This dissertation details a study of the temperature dependence of CO oxidation on the (2×1)-O
structure. In addition, while the surface structures on Rh(111) are well characterized, further
understanding of oxygen stability and evolution of surface structures as a function of temperature
will give insight into the reactivity of the metal under high temperature conditions. A recent
study determined that Osub emergence is not preferential to step sites, and regardless of the
original surface structure, oxygen desorption results in a homogeneous surface.
11
Silver
Whereas Rh is rare and expensive, silver (Ag) is significantly more abundant and is
therefore a relatively low cost material.81 While silver has applications in catalysis, it is also used
in data storage devices, transparent conducting oxides, and compact disk technologies.82 In
industry, silver is commonly used as a partial oxidation catalyst in two important oxidation
reactions: 1) methanol to formaldehyde and 2) ethanol to ethylene oxide.58, 83 Formaldehyde is an
important intermediate in chemical synthesis as a precursor to resins and plastics.84 This process
is carried out at ~ 900 K and atmospheric pressure in a mixture of methanol and air with a
reaction selectivity of about 90%.85 Ethylene oxide is a useful chemical intermediate for
production of plastics, polyesters, and glycols.86 Ethylene oxide formation occurs at 500 - 600 K
and at atmospheric pressures in either air or oxygen environments.87-88 Today about 90% of
ethylene oxide is produced over a silver catalyst.86 Since both of these partial oxidation reactions
depend on an overpressure of oxygen, the interaction of oxygen with the silver surface is of
utmost importance.85
Like Rh, Ag also has a face centered cubic (fcc) crystal structure, and when cut in the
(111) direction, the surface atoms are hexagonally packed together. However, when molecular
oxygen (O2) comes into contact with the Ag(111) surface, it does not dissociate. This only occurs
at high temperatures and pressures, well above what is commonly used with traditional UHV
surface science techniques. Therefore, in order to see any O adsorption and surface structure
formation on Ag(111), the stronger oxidant of atomic oxygen (AO) has to be utilized. When
Ag(111) is exposed to gas phase O atoms, a myriad of surface reconstructions form on the
surface. These have been studied through the years as early as the 1970s when Rovida et al.
observed O2 desorption on Ag(100), Ag(110), and Ag(111) surfaces.89 The O2 formed a p(4×4)-
12
O overlayer on the surface, and a corresponding (4×4) superstructure was observed with low
energy electron diffraction (LEED). While this finding was published in 1972 as a brief
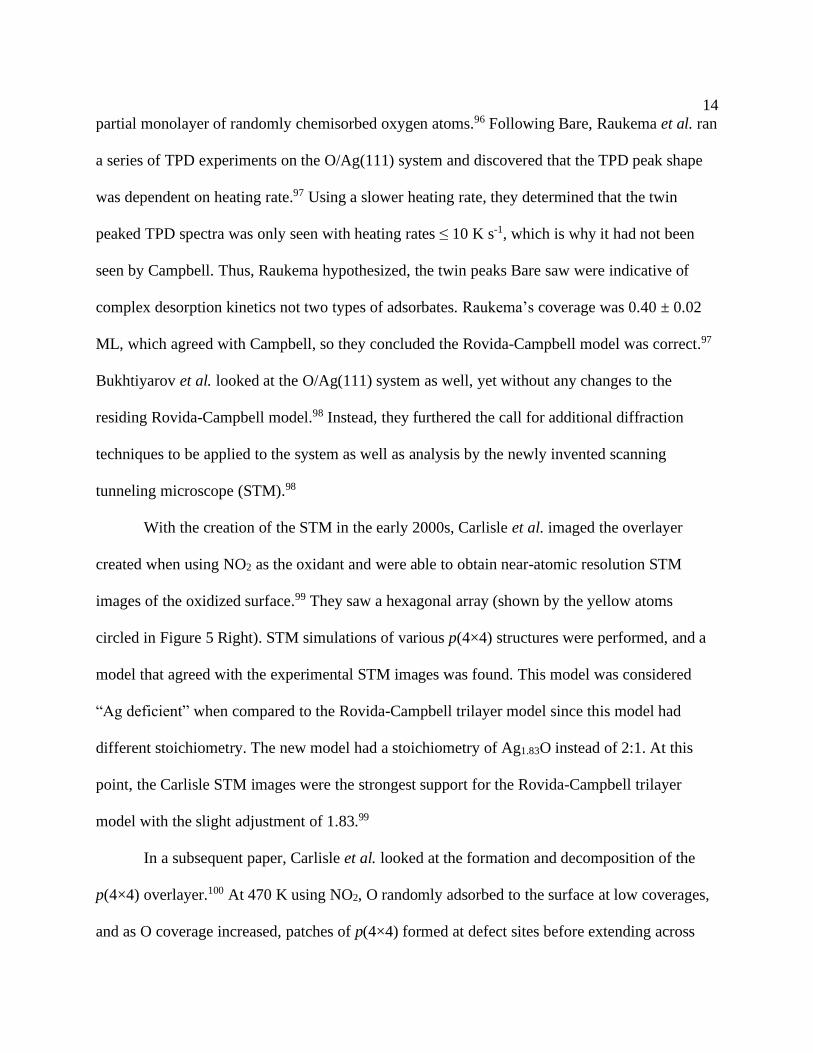
communication,89 the model Rovida et al. proposed and subsequently published in 1974 was
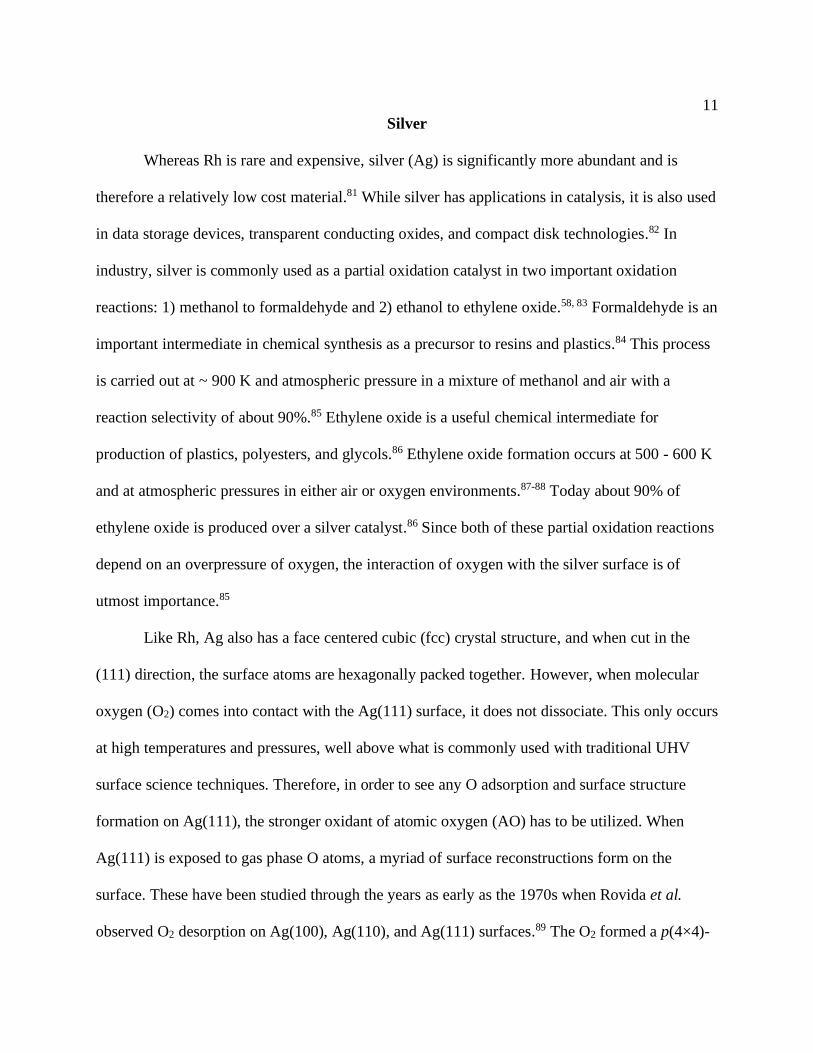
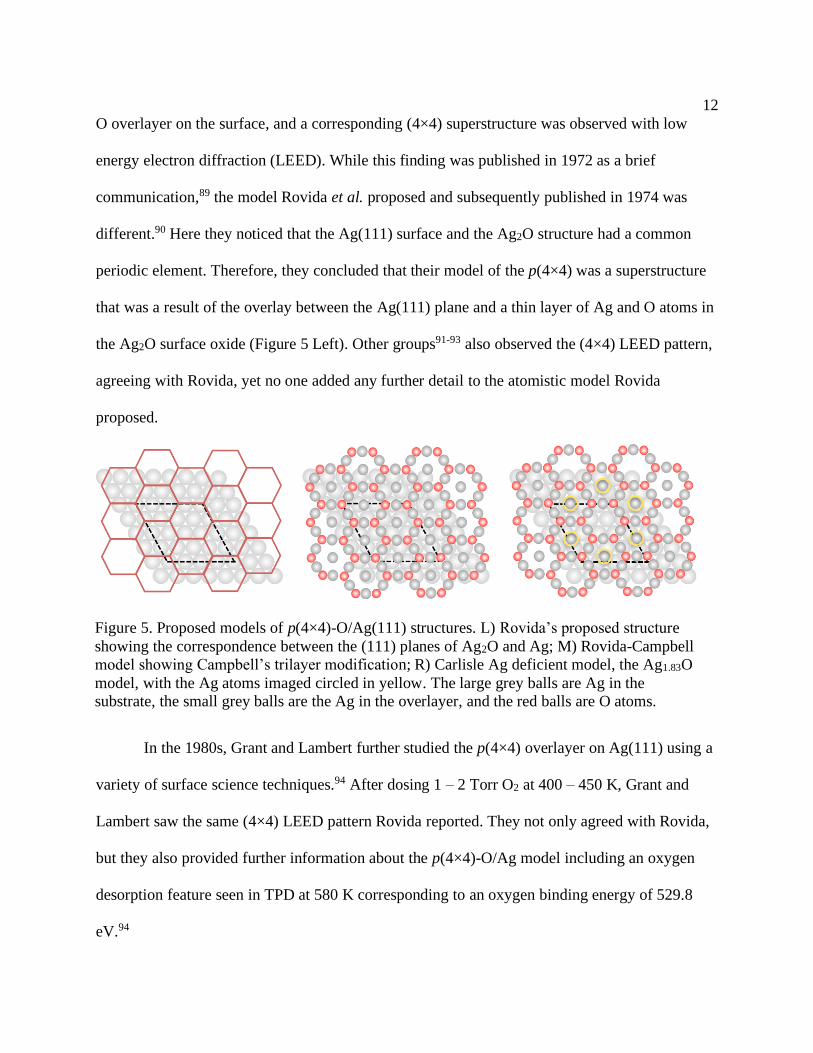
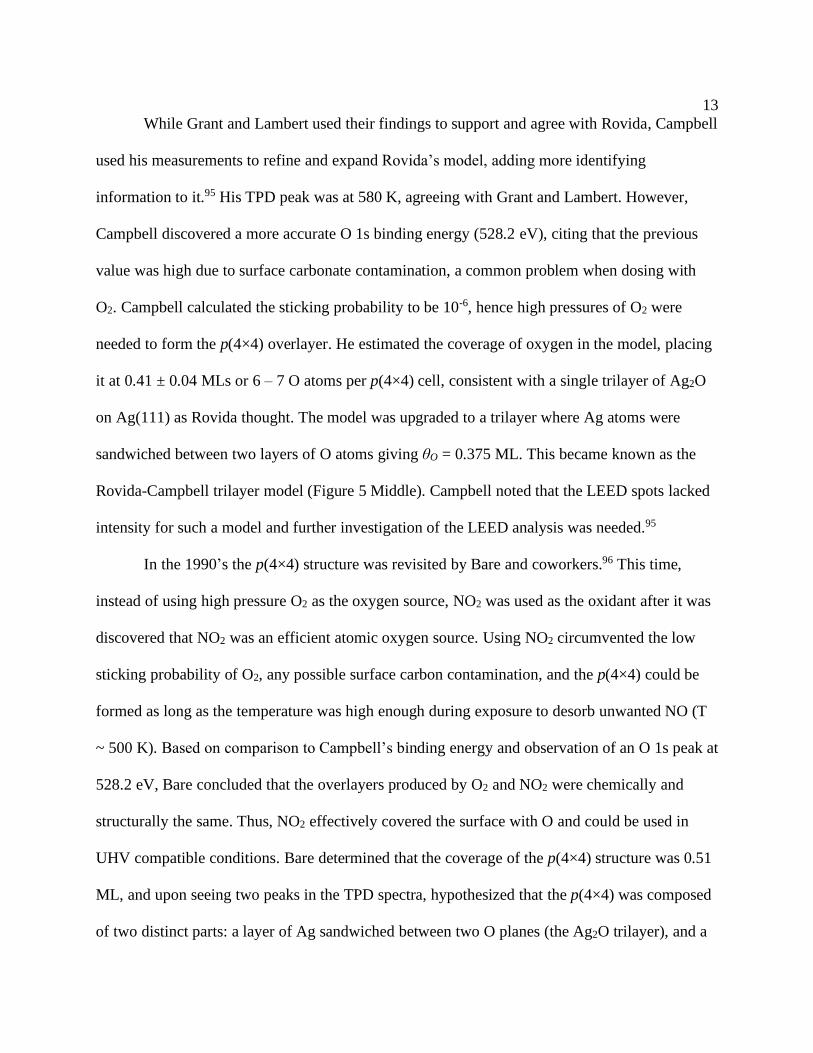
different.90 Here they noticed that the Ag(111) surface and the Ag2O structure had a common
periodic element. Therefore, they concluded that their model of the p(4×4) was a superstructure
that was a result of the overlay between the Ag(111) plane and a thin layer of Ag and O atoms in
the Ag2O surface oxide (Figure 5 Left). Other groups91-93 also observed the (4×4) LEED pattern,
agreeing with Rovida, yet no one added any further detail to the atomistic model Rovida
proposed.
In the 1980s, Grant and Lambert further studied the p(4×4) overlayer on Ag(111) using a
variety of surface science techniques.94 After dosing 1 – 2 Torr O2 at 400 – 450 K, Grant and
Lambert saw the same (4×4) LEED pattern Rovida reported. They not only agreed with Rovida,
but they also provided further information about the p(4×4)-O/Ag model including an oxygen
desorption feature seen in TPD at 580 K corresponding to an oxygen binding energy of 529.8
eV.94
Figure 5. Proposed models of p(4×4)-O/Ag(111) structures. L) Rovida’s proposed structure
showing the correspondence between the (111) planes of Ag2O and Ag; M) Rovida-Campbell
model showing Campbell’s trilayer modification; R) Carlisle Ag deficient model, the Ag1.83O
model, with the Ag atoms imaged circled in yellow. The large grey balls are Ag in the
substrate, the small grey balls are the Ag in the overlayer, and the red balls are O atoms.
13
While Grant and Lambert used their findings to support and agree with Rovida, Campbell
used his measurements to refine and expand Rovida’s model, adding more identifying
information to it.95 His TPD peak was at 580 K, agreeing with Grant and Lambert. However,
Campbell discovered a more accurate O 1s binding energy (528.2 eV), citing that the previous
value was high due to surface carbonate contamination, a common problem when dosing with
O2. Campbell calculated the sticking probability to be 10-6, hence high pressures of O2 were
needed to form the p(4×4) overlayer. He estimated the coverage of oxygen in the model, placing
it at 0.41 ± 0.04 MLs or 6 – 7 O atoms per p(4×4) cell, consistent with a single trilayer of Ag2O
on Ag(111) as Rovida thought. The model was upgraded to a trilayer where Ag atoms were
sandwiched between two layers of O atoms giving θO = 0.375 ML. This became known as the
Rovida-Campbell trilayer model (Figure 5 Middle). Campbell noted that the LEED spots lacked
intensity for such a model and further investigation of the LEED analysis was needed.95
In the 1990’s the p(4×4) structure was revisited by Bare and coworkers.96 This time,
instead of using high pressure O2 as the oxygen source, NO2 was used as the oxidant after it was
discovered that NO2 was an efficient atomic oxygen source. Using NO2 circumvented the low
sticking probability of O2, any possible surface carbon contamination, and the p(4×4) could be
formed as long as the temperature was high enough during exposure to desorb unwanted NO (T
~ 500 K). Based on comparison to Campbell’s binding energy and observation of an O 1s peak at
528.2 eV, Bare concluded that the overlayers produced by O2 and NO2 were chemically and
structurally the same. Thus, NO2 effectively covered the surface with O and could be used in
UHV compatible conditions. Bare determined that the coverage of the p(4×4) structure was 0.51
ML, and upon seeing two peaks in the TPD spectra, hypothesized that the p(4×4) was composed
of two distinct parts: a layer of Ag sandwiched between two O planes (the Ag2O trilayer), and a
14
partial monolayer of randomly chemisorbed oxygen atoms.96 Following Bare, Raukema et al. ran
a series of TPD experiments on the O/Ag(111) system and discovered that the TPD peak shape
was dependent on heating rate.97 Using a slower heating rate, they determined that the twin
peaked TPD spectra was only seen with heating rates ≤ 10 K s-1, which is why it had not been
seen by Campbell. Thus, Raukema hypothesized, the twin peaks Bare saw were indicative of
complex desorption kinetics not two types of adsorbates. Raukema’s coverage was 0.40 ± 0.02
ML, which agreed with Campbell, so they concluded the Rovida-Campbell model was correct.97
Bukhtiyarov et al. looked at the O/Ag(111) system as well, yet without any changes to the
residing Rovida-Campbell model.98 Instead, they furthered the call for additional diffraction
techniques to be applied to the system as well as analysis by the newly invented scanning
tunneling microscope (STM).98
With the creation of the STM in the early 2000s, Carlisle et al. imaged the overlayer
created when using NO2 as the oxidant and were able to obtain near-atomic resolution STM
images of the oxidized surface.99 They saw a hexagonal array (shown by the yellow atoms
circled in Figure 5 Right). STM simulations of various p(4×4) structures were performed, and a
model that agreed with the experimental STM images was found. This model was considered
“Ag deficient” when compared to the Rovida-Campbell trilayer model since this model had
different stoichiometry. The new model had a stoichiometry of Ag1.83O instead of 2:1. At this
point, the Carlisle STM images were the strongest support for the Rovida-Campbell trilayer
model with the slight adjustment of 1.83.99
In a subsequent paper, Carlisle et al. looked at the formation and decomposition of the
p(4×4) overlayer.100 At 470 K using NO2, O randomly adsorbed to the surface at low coverages,
and as O coverage increased, patches of p(4×4) formed at defect sites before extending across
15
terraces. Annealing of the p(4×4) at ~ 490 K showed a new structure they described as a stripe
pattern, now commonly known as the p(4×5√3) (Figure 6C).100-101
Along with the new atomic resolution for the p(4×4), theoretical techniques were used to
test the p(4×4) model. Michaelides et al.102 and Li et al.87 used DFT to further probe the O/Ag
system, examining various models of O/Ag. Both agreed that Ag1.83O was the most
thermodynamically favorable and thought it was most likely the stable phase of O under the
temperatures and pressures of ethylene epoxidation.83, 87, 102
Although the Ag1.83O model had STM images and early DFT results that showed it to be
stable, more recent advances in DFT indicated that the Ag1.83O model was incorrect.83, 101 In
addition, there was also a continued call for diffraction and spectroscopic studies on the
structure.83 In 2006, the groups of Varga and Besenbacher revisited the p(4×4)-O/Ag model
structure.101, 103 Varga’s group determined that the p(4×4) was not related to the bulk Ag2O
oxide, and the p(4×4)-O/Ag(111) model needed to be rethought. Using a combination of STM,
DFT, surface x-ray diffraction, and core level spectroscopy, they showed that previous models of
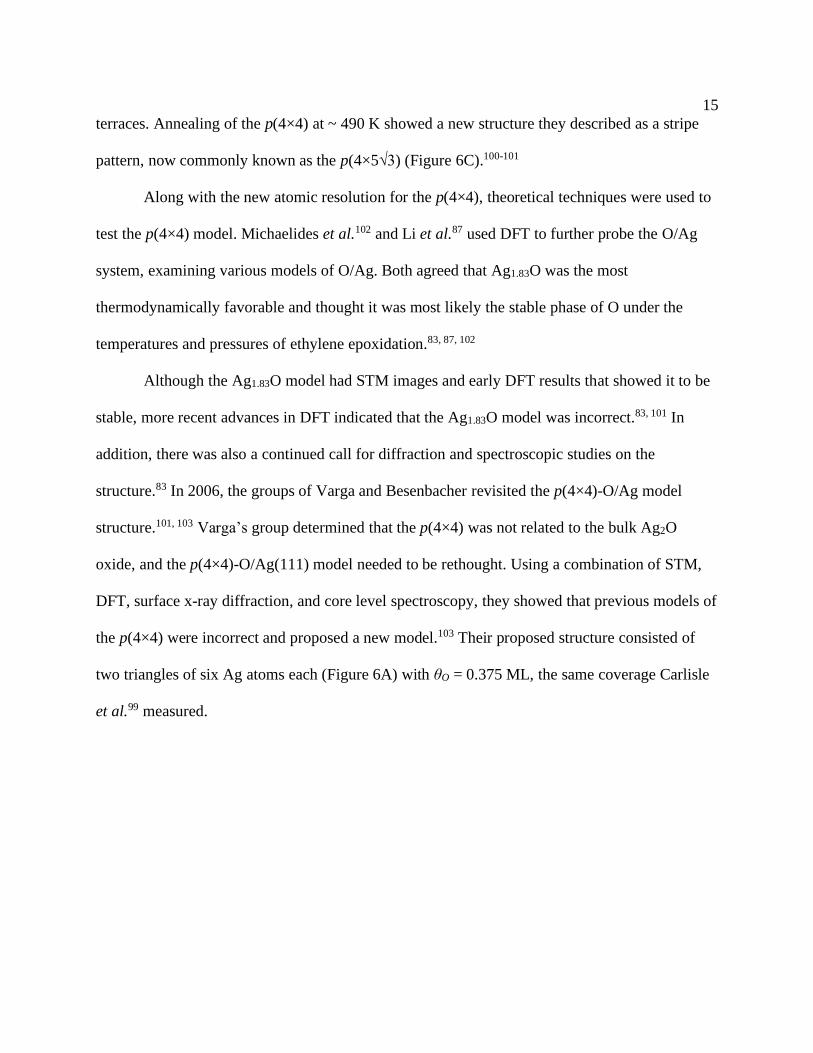
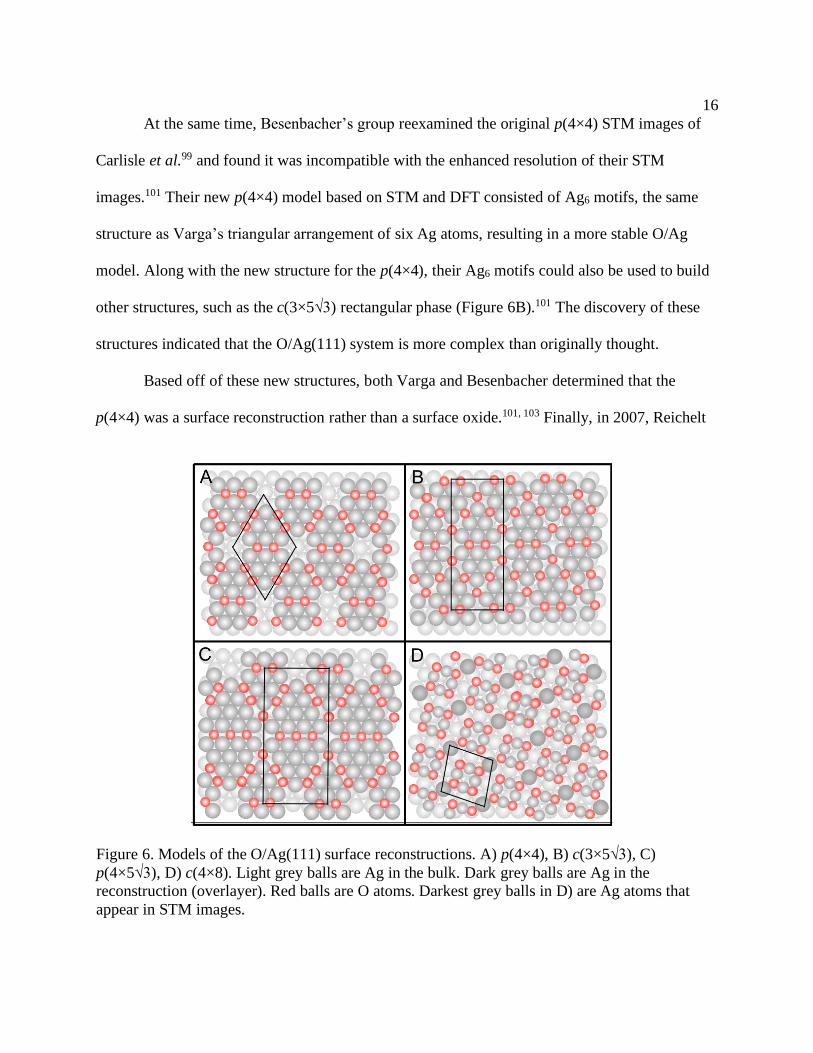
the p(4×4) were incorrect and proposed a new model.103 Their proposed structure consisted of
two triangles of six Ag atoms each (Figure 6A) with θO = 0.375 ML, the same coverage Carlisle
et al.99 measured.
16
At the same time, Besenbacher’s group reexamined the original p(4×4) STM images of
Carlisle et al.99 and found it was incompatible with the enhanced resolution of their STM
images.101 Their new p(4×4) model based on STM and DFT consisted of Ag6 motifs, the same
structure as Varga’s triangular arrangement of six Ag atoms, resulting in a more stable O/Ag
model. Along with the new structure for the p(4×4), their Ag6 motifs could also be used to build
other structures, such as the c(3×5√3) rectangular phase (Figure 6B).101 The discovery of these
structures indicated that the O/Ag(111) system is more complex than originally thought.
Based off of these new structures, both Varga and Besenbacher determined that the
p(4×4) was a surface reconstruction rather than a surface oxide.101, 103 Finally, in 2007, Reichelt
Figure 6. Models of the O/Ag(111) surface reconstructions. A) p(4×4), B) c(3×5√3), C)
p(4×5√3), D) c(4×8). Light grey balls are Ag in the bulk. Dark grey balls are Ag in the
reconstruction (overlayer). Red balls are O atoms. Darkest grey balls in D) are Ag atoms that
appear in STM images.
17
et al.104 did the previously called for LEED study using a combination of LEED and low energy
electron microscopy (LEEM) to study the p(4×4)-O phase on Ag(111) and found a crisp pattern
of the p(4×4)-O phase. Their results provided further support for the idea of a surface
reconstruction and not a surface oxide.104
A year later, Besenbacher and coworkers further studied O adsorption on Ag(111) using
STM, DFT, and XPS concluding that the O/Ag(111) surface is very complicated and depending
on dose conditions a variety of surface reconstructions are formed including the p(4×4),
c(3×5√3), p(4×5√3), and a new structure, the c(4×8) (Figure 6D).105 Then in 2014, Martin et al.82
looked at the c(4×8) surface structure on Ag(111) using XPS, STM, and DFT. They provided
support for the c(4×8) and determined the coverage to be θO = 0.5 ML.82
Since the discovery of various surface structures on Ag(111), many groups have
investigated the properties of the surface reconstructions. Zhou et al. determined that during
reaction of the p(4×4)-O with sulfur dioxide, the Ag(111) surface restructures.106 Klust et al.
determined the reactive site on the p(4×4) was the boundary between the clean Ag(111) and
p(4×4)-O.107 Derouin et al. carefully controlled the dosing conditions and were able to
selectively form a single surface reconstruction on Ag(111).50 They also determined that
changing the filament temperature when dosing AO lead to either surface reconstruction and Osub
at lower filament temperatures or bulk like Ag2O and no Osub at higher filament temperatures.50
In addition to surface reconstructions, Derouin et al. further published about subsurface
oxygen on Ag(111).108 They saw Osub form at low temperatures (T < 500 K), and with just a
small amount of Osub present, ~ 0.1ML, the surface would uniformly reconstruct into a striped
phase.108 Osub formation in Ag(111) had been hinted at in previous studies when Grant and
Lambert determined that while O2 stays on the surface, Oad is able to go within the surface of the
18
crystal.94 In recent years, it has been determined that Osub is a distinct species from other
adsorbed oxygen phases on Ag, forming only after a critical amount of Oad is on the surface.109-
111 As presented in this dissertation, the presence of Osub occurs at a sample temperature (Tsample)
of Tsample < 500 K, reaches a maximum uptake at Tsample = 450 K, and corresponds to a new three
dimensional oxygenaceous species seen by XPS.
While planar surfaces give insight into adsorption and reactivity, industrial heterogeneous
catalyzed reactions occur on more complex surfaces such as nanoparticles.9, 27 These
nanoparticles have highly defected surfaces, consisting of many small terraces, defect sites, and
step edges. One-way UHV studies are attempting to bridge this aforementioned “materials gap”
is to study nanoparticles on metal oxide supports.9, 26-27 Another way to bridge this gap is to
utilize a curved crystal which displays a variety of step geometries and terrace widths within the
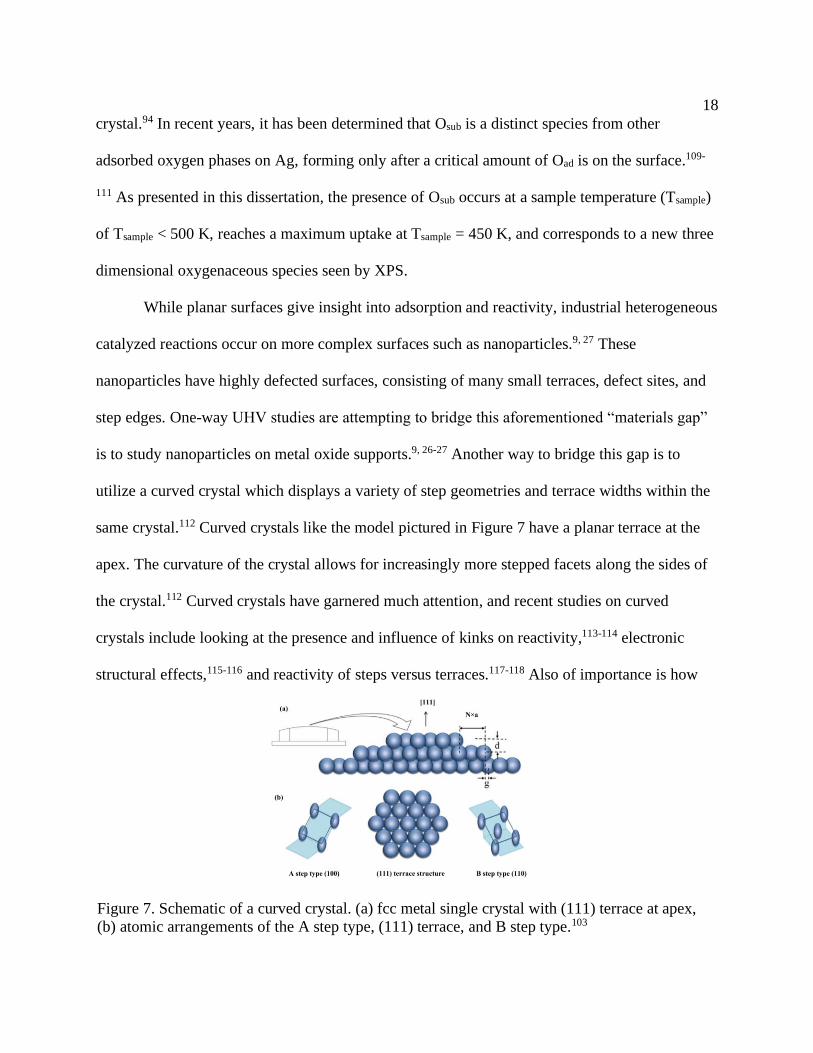
same crystal.112 Curved crystals like the model pictured in Figure 7 have a planar terrace at the
apex. The curvature of the crystal allows for increasingly more stepped facets along the sides of
the crystal.112 Curved crystals have garnered much attention, and recent studies on curved
crystals include looking at the presence and influence of kinks on reactivity,113-114 electronic
structural effects,115-116 and reactivity of steps versus terraces.117-118 Also of importance is how
Figure 7. Schematic of a curved crystal. (a) fcc metal single crystal with (111) terrace at apex,
(b) atomic arrangements of the A step type, (111) terrace, and B step type.103
19
adsorbates stick to curved crystals, how tightly they bind, how steps influence binding, and how
terrace size affects adsorption.112, 119-120 In particular, studying oxygen adsorption on a curved
Ag(111) crystal gives important insight into the oxygen adsorption that may occur under reaction
conditions on a multifaceted surface. Work in this dissertation on a curved Ag(111) crystal
investigated how step geometry influences oxygen adsorption. The curved Ag(111) crystal
studied displayed two different step types, A-type (100) steps and B-type (110) steps (Figure
7B).112 It was determined that step geometry influenced atomic oxygen adsorption on curved
Ag(111) with A-type steps allowing oxidation and B-type steps hindering oxidation.
In conclusion, the dissertation work presented in subsequent chapters details investigation
of the temperature dependence of CO oxidation of the (2×1)-O on Rh(111), Osub formation and
properties on Ag(111), the influence of step geometry on oxygen adsorption on curved Ag(111),
and the emergence of Osub and the stability and evolution of surface structures on Rh(111).
20
CHAPTER TWO
TEMPERATURE DEPENDENCE OF CO OXIDATION ON RH(111) BY ADSORBED
OXYGEN
Reprinted with permission from Temperature Dependence of CO Oxidation on
Rh(111) by Adsorbed Oxygen, Marie E. Turano, Rachael G. Farber, George Hildebrandt, and
Daniel R. Killelea, Surface Science 2020 695, 121573. Copyright 2021 Elsevier.
Rhodium metal surfaces play key roles in important heterogeneously catalyzed reaction
schemes such as the partial oxidation of methane, which is an effective approach to the
generation of syngas.121-124 Reactions on rhodium surfaces have attracted significant attention
over the years because of rhodium’s catalytic utility and its use in model systems to investigate
surface-mediated oxidation reactions. Of particular interest were investigations of CO oxidation
by different oxygen species on Rh surfaces, including adsorbed oxygen atoms (Oad), the bulk
oxide (Rh2O3), and the surface oxide (RhO2).29, 54, 125-128 Recent work from our group has
investigated the structural consequences of extensive oxidation of Rh(111) by gas-phase atomic
oxygen (AO) which resulted in the formation of the (2×1)-O adlayer, subsurface oxygen (Osub),
and surface oxide phases. Additionally, it was shown that exposure of highly oxidized Rh(111)
to CO at modest sample exposure temperatures (Texp) resulted in CO oxidation at defect sites,
such as domain boundaries, that removed nearly all the oxygen from the Rh(111) during the
exposure, leaving little residual oxygen (Ores).51-52, 80, 129 Motivated by these results, we
determined the reactivity of the (21)-O adlayer to better understand the enhanced reactivity
21
when several phases co-exist.
O2 readily dissociates into two Oad on Rh(111). As the O coverage (O) increases, the O
atoms first arrange into a (22)-O adlayer with O = 0.25 monolayers (ML, 1 ML = 1.61015 Oad
cm–2). As more O sticks, O increases to 0.5 ML, and the (22)-O adlayer transforms into a
(21)-O adlayer.29, 74-75, 130-132 Further exposure to O2 does not increase O under low-pressure
conditions because O2 dissociation requires two adjacent vacant surface sites, which becomes
increasingly unlikely as O approaches 0.5 ML.78-79, 108 STM images of Rh(111) with O ≈ 0.5
ML clearly showed the surface was comprised of three different orientations of the (21)-O
adlayer, each rotated by 120° with respect to each other; because of this, LEED analysis showed
a (22) pattern.76, 108 Although O > 0.5 ML is not achievable using low pressures of O2, the use
of more aggressive oxidants (e.g. NO2, ozone, or AO) overcomes the kinetic limitations of O2
dissociation and achieves significantly higher oxygen incorporation.52, 108, 132
CO has a high sticking probability on Rh(111), and forms a (√3√3)-R30° adlayer on
Rh(111)133-134 with CO ≈ 1/3 ML and prolonged CO exposures lead to higher CO coverages.15,
135 On the (21)-O Rh(111) surface, CO molecules insert themselves as adsorbed CO (COad) into
the O adlayer, forming a (22)-2O+CO adlayer.131, 136-137 Between 350 K and 600 K, COad is
effectively oxidized by Oad to form CO2 (g), leaving behind approximately 0.25 ML O, but no
COad.80, 126, 138 CO is also oxidized by the (99)-O surface reconstruction42, the RhO2 surface
oxide38, and other oxygen surface phases.20, 59, 80 Although the overall kinetics of CO oxidation
on rhodium have been investigated,126 it is unclear what the effects of Texp and CO exposure on
CO oxidation may be. This information is needed to better describe the temperature dependent
reactivity of the (21)-O surface. In this paper, we present results from a study of CO oxidation
22
where the extent of CO exposure and surface temperature of Rh(111) with an (21)-O adlayer
were varied. We found that the amount of CO oxidized was largely insensitive to the duration of
the CO exposures and the exposure temperature only had a modest effect. These results show
that CO oxidation may occur via lower-barrier pathways, but co-adsorbed O and CO in the
(22)-2O+CO adlayer remained inert and did not produce CO2 at an appreciable rate up to 350
K. The reactive species or sites that oxidized CO at 350 K or below were not regenerated after
they reacted to form CO2.
Experiments were conducted under UHV conditions. The interconnected UHV-STM
system was previously described51 and consists of two chambers: a preparatory/analysis chamber
(base pressure of 1 10–10 torr) and a STM chamber (base pressure of 4 10–11 torr). The
preparatory chamber was equipped with a PHI 10-155 Auger Electron Spectrometer (AES), a
Fissions RVL900 low energy electron diffractometer (LEED), and a Hiden HAL 3F 301 RC
quadrupole mass spectrometer (QMS) which was equipped with a shroud (also known as a
Feulner cap139) to provide greater signal-to-noise during TPD measurements. The QMS was
mounted on a translation stage, and was moved to within 3-4 mm of the front face of the Rh(111)
crystal for TPD experiments.
The Rh(111) crystal (Surface Preparation Labs, Zaandam, The Netherlands) was mounted
on an exchangeable tantalum (Ta) sample plate by welding to two supporting Ta wires
underneath, and a type K thermocouple was welded directly to the back of the crystal for
accurate temperature reading. The crystal could be cooled with a liquid nitrogen cooling loop to
100 K and heated using electron beam heating to 1400 K. The crystal was cleaned using the
standard preparation cycles of Ar+ sputtering followed by annealing at 1300 K. A 1300 K anneal
23
was sufficient to clean the crystal between experiments. Surface cleanliness was verified with
AES and a crisp (11) LEED pattern.
The (2×1)-O adlayer on Rh(111) was prepared by exposure to O2 via backfilling the
chamber to a pressure of 1×10⁻⁶ Torr for 60 seconds, equating to a 60 Langmuir (L, 1 L = 10–6
Torr s O2) O2 exposure. As demonstrated in previous publications, the coverage was determined
to be 0.5 ML using a combination of LEED, AES, and STM.51-52 For CO exposures, the chamber
was similarly backfilled to a pressure of 1×10⁻⁶ Torr for varying lengths of time while the
Rh(111) crystal was held at Texp. Two sequential TPDs were then performed: one from 100 K to
600 K with a ramp rate of 4 K s–1 for CO and CO2 desorption (CO2 yield), and one from 600 K
to 1400 K with a ramp rate of 3 K s–1 for recombinative desorption of residual O (Ores) as O2.
The STM was a PanScan Freedom STM from RHK Technology, cooled by a closed-cycle He
cryostat, and a temperature of 30 K was used for imaging. A cut and pull 80% Pt, 20% Ir 0.25
mm diameter wire was used as the tip. All images were recorded in constant current mode. No
drift correction was applied to the images, but limited processing (e.g. cropping, mean-plane
subtraction, or removal of streaks or blemishes) was performed using the Gwyddion140 software
package (available at http://gwyddion.net).
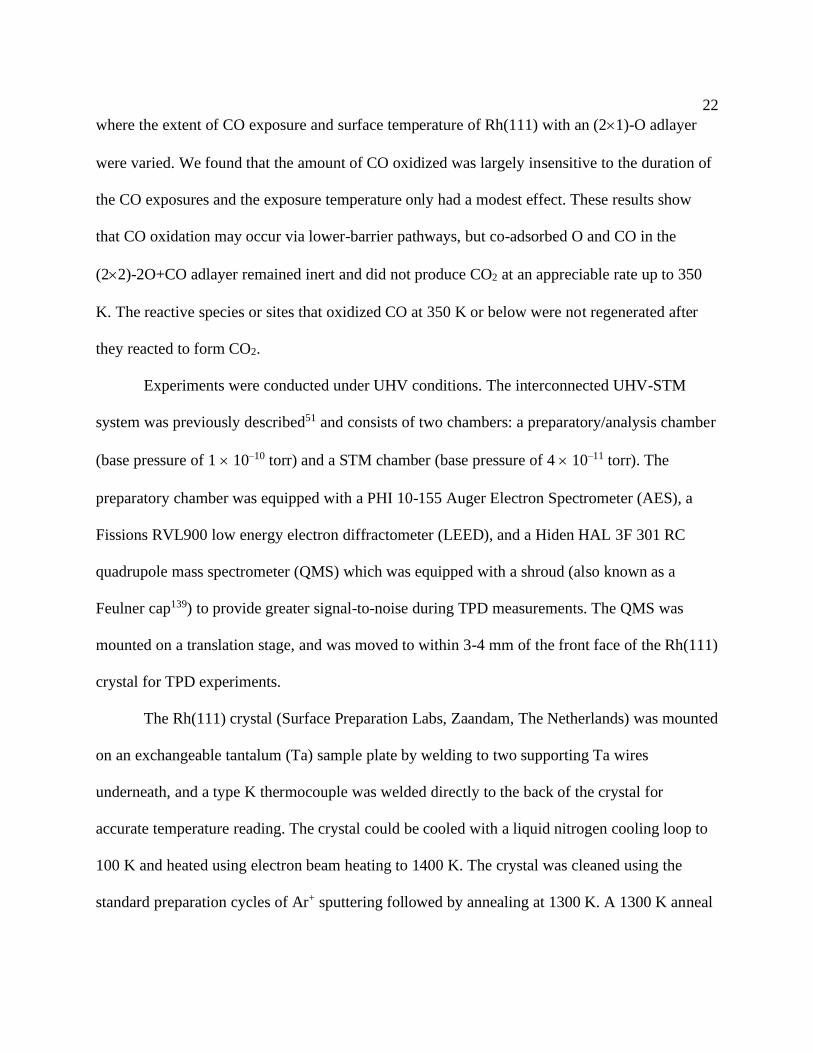
The (21)-O Rh(111) surface was exposed to 30 L carbon monoxide (CO) at various
temperatures (Texp). During a TPD measurement between 100 K and 600 K, COad was oxidized
to form CO2, as shown in Figure 8A. The CO2 yield ( ) showed only slight variations as a
function of Texp between 100 K and 350 K. The CO2 reaction product desorbed in a broad feature
between 350 K and 550 K, and the peak shape changed slightly as Texp was increased from 200
K to 350 K; but for all Texp conditions, neither dramatic changes in the shape of the desorption
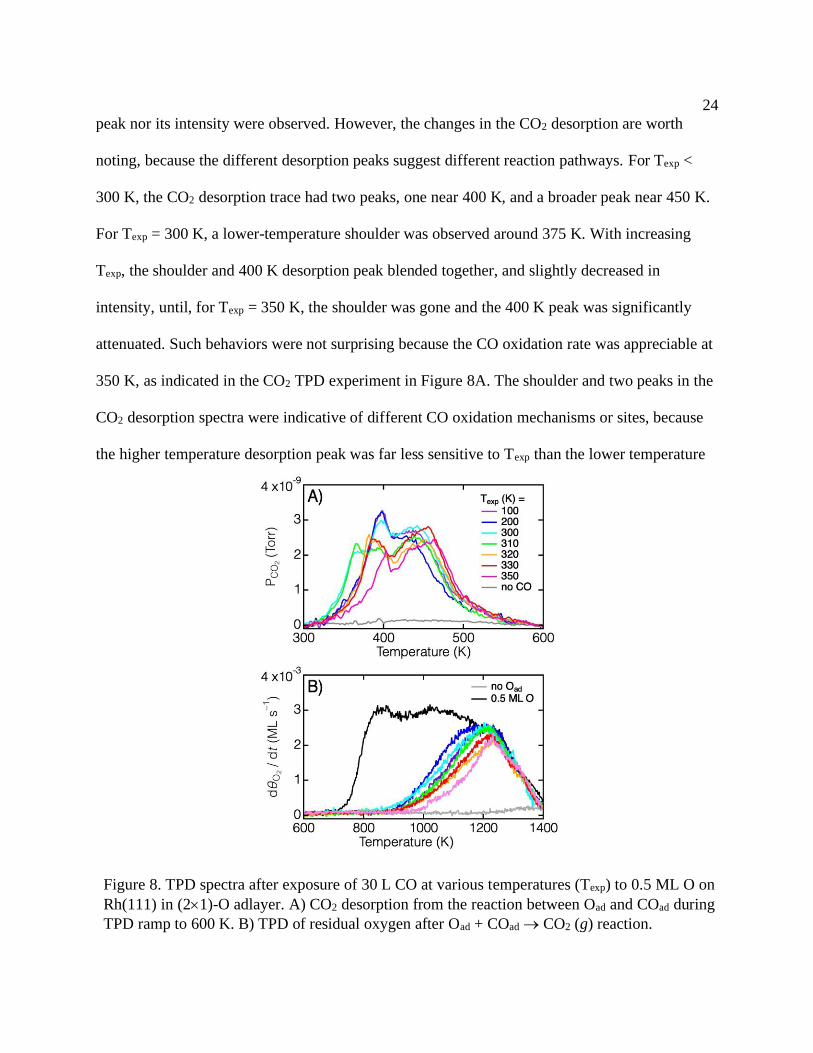
24
peak nor its intensity were observed. However, the changes in the CO2 desorption are worth
noting, because the different desorption peaks suggest different reaction pathways. For Texp <
300 K, the CO2 desorption trace had two peaks, one near 400 K, and a broader peak near 450 K.
For Texp = 300 K, a lower-temperature shoulder was observed around 375 K. With increasing
Texp, the shoulder and 400 K desorption peak blended together, and slightly decreased in
intensity, until, for Texp = 350 K, the shoulder was gone and the 400 K peak was significantly
attenuated. Such behaviors were not surprising because the CO oxidation rate was appreciable at
350 K, as indicated in the CO2 TPD experiment in Figure 8A. The shoulder and two peaks in the
CO2 desorption spectra were indicative of different CO oxidation mechanisms or sites, because
the higher temperature desorption peak was far less sensitive to Texp than the lower temperature
Figure 8. TPD spectra after exposure of 30 L CO at various temperatures (Texp) to 0.5 ML O on
Rh(111) in (21)-O adlayer. A) CO2 desorption from the reaction between Oad and COad during
TPD ramp to 600 K. B) TPD of residual oxygen after Oad + COad → CO2 (g) reaction.
25
desorption features. At the same time, the higher temperature peak broadened further and shifted
to higher temperature, possibly because the reaction was occurring on a more ordered surface
that required additional thermal energy to overcome the reaction (or diffusion) barriers.
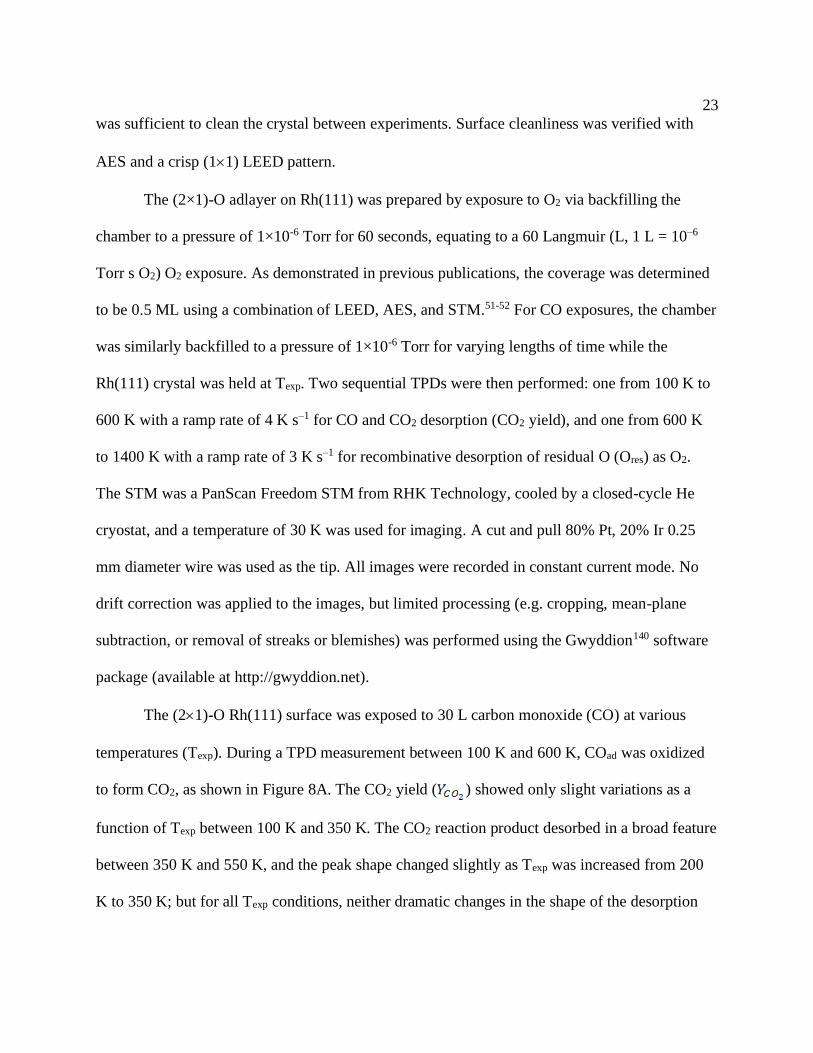
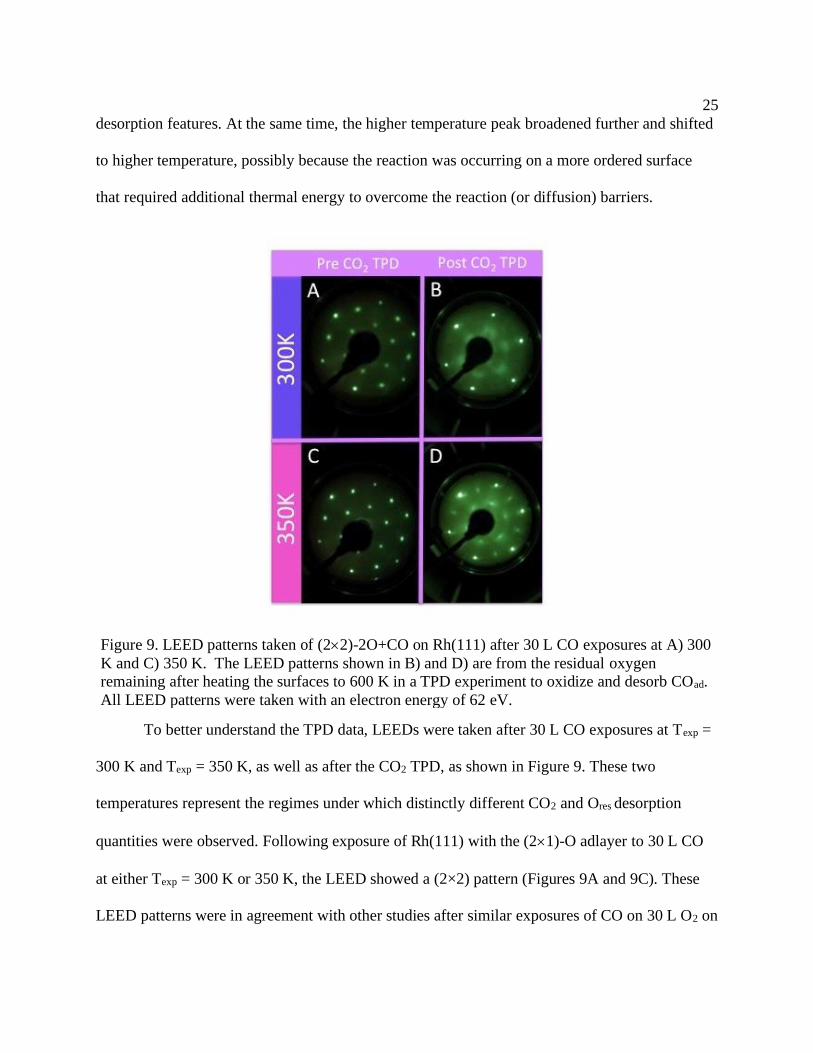
To better understand the TPD data, LEEDs were taken after 30 L CO exposures at Texp =
300 K and Texp = 350 K, as well as after the CO2 TPD, as shown in Figure 9. These two
temperatures represent the regimes under which distinctly different CO2 and Ores desorption
quantities were observed. Following exposure of Rh(111) with the (21)-O adlayer to 30 L CO
at either Texp = 300 K or 350 K, the LEED showed a (2×2) pattern (Figures 9A and 9C). These
LEED patterns were in agreement with other studies after similar exposures of CO on 30 L O2 on
Figure 9. LEED patterns taken of (22)-2O+CO on Rh(111) after 30 L CO exposures at A) 300
K and C) 350 K. The LEED patterns shown in B) and D) are from the residual oxygen
remaining after heating the surfaces to 600 K in a TPD experiment to oxidize and desorb COad.
All LEED patterns were taken with an electron energy of 62 eV.
26
Rh(111)141 and show the extensive formation of the (2×2)-2O+CO adlayer. The surface was
likely more ordered after CO exposure at 350 K than 300 K, as the LEED pattern for Texp = 350
K was a bit sharper than the one from the 300 K CO exposure. However, the same pattern was
observed for both exposure temperatures.
Figure 8B shows the recombinative desorption of residual oxygen (Ores) during a TPD
measurement from 600 K to 1400 K. These spectra quantified the coverage of Ores (O, res)
adsorbed to the Rh(111) surface after COad was oxidized or desorbed. The black trace in Figure
8B corresponds to the O = 0.5 ML (21)-O surface with no CO exposure, and was used as a
benchmark to quantify O, res on Rh(111).51 If there was no Ores, then this indicated that Oad was
the limiting reagent and would have been entirely consumed by some combination of oxidation
of impinging CO during the CO exposure and/or subsequent reaction with COad during the TPD
measurement. Compared to the pristine (21)-O TPD, it was clear that although a 30 L CO
exposure caused a sizable decrease in Ores at all temperatures, O, res > 0 for all conditions. After
an abrupt change at Texp = 300 K, there was only a modest decrease in O, res with increasing Texp.
Each iteration of the experiment began with the same (21)-O O = 0.5 ML surface, so the initial
O was the same for all doses; any observed decrease in residual oxygen would have been the
result of either reaction with CO adsorbed to the O-covered, or oxidation of CO to CO2 during
the CO exposure.
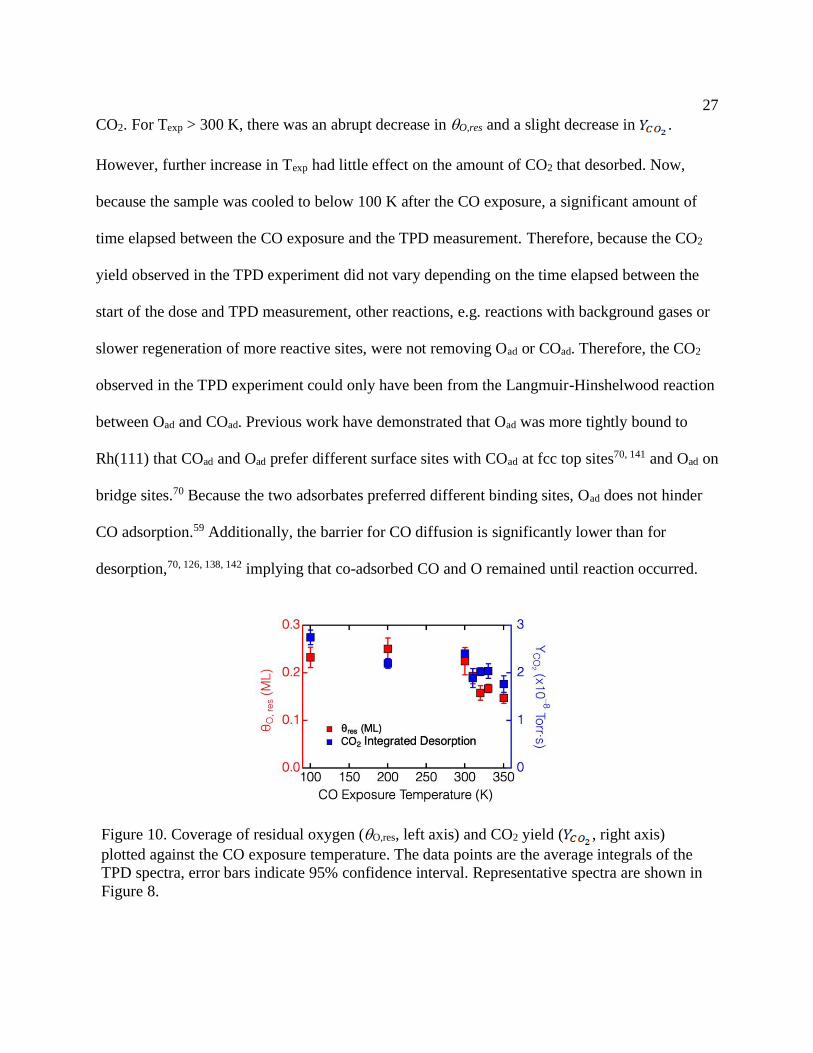
Figure 10 shows the coverage of residual oxygen (O, res, left axis, in red) and the
desorption of CO2 (right axis, in blue) plotted against CO exposure temperature (Texp). For Texp
between 100 K and 300 K, decreased slightly, but O,res was essentially unchanged. This
suggests that a bit more CO may adsorb at lower Texp, slightly enhancing the oxidation of CO to
27
CO2. For Texp > 300 K, there was an abrupt decrease in O,res and a slight decrease in .
However, further increase in Texp had little effect on the amount of CO2 that desorbed. Now,
because the sample was cooled to below 100 K after the CO exposure, a significant amount of
time elapsed between the CO exposure and the TPD measurement. Therefore, because the CO2
yield observed in the TPD experiment did not vary depending on the time elapsed between the
start of the dose and TPD measurement, other reactions, e.g. reactions with background gases or
slower regeneration of more reactive sites, were not removing Oad or COad. Therefore, the CO2
observed in the TPD experiment could only have been from the Langmuir-Hinshelwood reaction
between Oad and COad. Previous work have demonstrated that Oad was more tightly bound to
Rh(111) that COad and Oad prefer different surface sites with COad at fcc top sites70, 141 and Oad on
bridge sites.70 Because the two adsorbates preferred different binding sites, Oad does not hinder
CO adsorption.59 Additionally, the barrier for CO diffusion is significantly lower than for
desorption,70, 126, 138, 142 implying that co-adsorbed CO and O remained until reaction occurred.
Figure 10. Coverage of residual oxygen (O,res, left axis) and CO2 yield ( , right axis)
plotted against the CO exposure temperature. The data points are the average integrals of the
TPD spectra, error bars indicate 95% confidence interval. Representative spectra are shown in
Figure 8.
28
Therefore, when O, res > 0, CO was the limiting reagent and was representative of the
amount of CO adsorbed to the surface. It is apparent from Figures 8 and 10, that the amount of
COad was modestly more for Texp < 300 K, dropped for Texp > 300 K, and then was largely
unaffected when Texp was between 300 K and 350 K. An additional point is that the indicator for
CO oxidation during the CO exposure is not , but would be O,res; the oxygen remaining on
the Rh(111) surface after COad was removed by oxidation or desorption.
O,res is shown by the red data points in Figure 10. It is clear that there was a significant
decrease in O, res going from Texp = 300 K to 310 K. As Texp was further increased to 350 K,
there was a roughly linear decrease of O, res with increasing CO exposure temperature, but the
magnitude of decrease was smaller than the initial step from 300 K to 310 K. In the temperature
regime 300 K < Texp ≤ 350 K, was flat, as discussed above, suggesting the amount of COad
was roughly constant. However, the decrease in O, res meant that some CO was oxidized during
the exposure, decreasing O. Again, this was anticipated based on the TPD data. Because Oad was
not completely removed, the reaction probability must have dropped as the CO exposure
continued.
The changes in the surface structure after the CO2 TPD are shown by the LEED patterns
in Figure 9B and 9D, and it is clear that Texp had a significant effect on the resultant surfaces. For
CO exposure at Texp = 300 K (Figure 9B), the (22) pattern was eliminated and a new pattern
consisting of (1×1) spots, a hazy center pattern reminiscent of a flower, and faint, diffuse spots in
the half-order position between the (11) spots was observed. The presence of these diffuse spots
after oxidation suggests that reaction disrupts the surface order and increased temperatures were
not sufficient to restore the surface. Ores were largely stochastically distributed about the surface
29
and were not in islands of either the (22)-O or (21)-O adlayer. Alternatively, the LEED pattern
for Ores from CO exposure at Texp = 350 K (Figure 9D) retained the (22) pattern, although the
half-order spots were rather distorted. From the data in Figure 10, O,res ≈ 0.25 ML for Texp = 300
K. O,res dropped to ≈ 0.15 ML for Texp = 350 K, indicating a 40 % decrease in O, res. The
remaining Ores were likely arranged in a (22)-O adlayer with sizable areas of randomly
distributed chemisorbed O atoms, as O was less than the 0.25 ML O required to cover the entire
surface in the (22)-O adlayer. There was also a 30 % decrease in comparing Texp 300 K to
350 K. The fact that both O, res and decreased meant that there was less CO adsorbed to the
surface after exposure, and the CO reacted away more Oad at 350 K than at 300 K. However,
there was still ample Ores, meaning that the reaction pathway enhanced at 350 K, when compared
to 300 K, was not accessible everywhere on the surface and that the reactive surface sites or
species were not regenerated during the CO exposure.
The relatively modest impact of variation in the surface temperature of the (21)-O
adlayer on Rh(111) during exposure to CO was likely the result of oxidation at surface sites the
offered lower barrier reaction pathways, but it is unclear if such sites would be restored to further
oxidize CO, for all the experiments discussed above were for CO exposures of the same 30 L
duration. Because the rate of CO2 formation was appreciable at 350 K (as shown by the above-
baseline partial pressure of CO2 in Figure 8A), it is plausible to assume that if the sites were
regenerated at 350 K, prolonged CO exposure times would have continued to remove Oad as the
CO exposure progressed. Conversely, if such sites were not regenerated and CO simply stuck to
the surface forming the (22)-2O+CO adlayer, both O,res and would be invariant with CO
exposure. As we show below, the latter case was observed, indicating that CO oxidation

30
proceeds via different pathways on the (21)-O adlayer on Rh(111). The existence of different
reaction mechanisms at different surface sites has recently been observed for CO oxidation on
the steps and terraces of platinum, where Neugebohren et al. found that the lowest-barrier
reaction pathway was between Oad on steps and rapidly diffusing CO from the terraces.143 It is
possible that Rh behaves similarly.
31
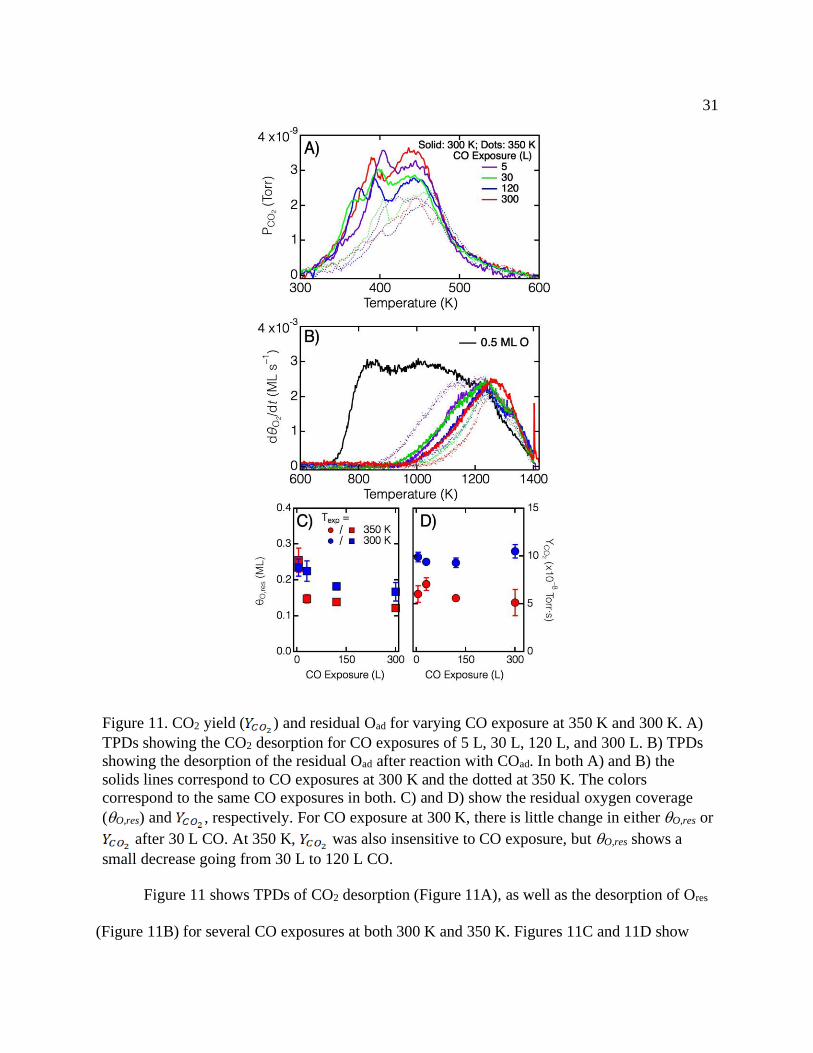
Figure 11 shows TPDs of CO2 desorption (Figure 11A), as well as the desorption of Ores
(Figure 11B) for several CO exposures at both 300 K and 350 K. Figures 11C and 11D show
Figure 11. CO2 yield ( ) and residual Oad for varying CO exposure at 350 K and 300 K. A)
TPDs showing the CO2 desorption for CO exposures of 5 L, 30 L, 120 L, and 300 L. B) TPDs
showing the desorption of the residual Oad after reaction with COad. In both A) and B) the
solids lines correspond to CO exposures at 300 K and the dotted at 350 K. The colors
correspond to the same CO exposures in both. C) and D) show the residual oxygen coverage
(O,res) and , respectively. For CO exposure at 300 K, there is little change in either O,res or
after 30 L CO. At 350 K, was also insensitive to CO exposure, but O,res shows a
small decrease going from 30 L to 120 L CO.
32
plots of O,res and vs. CO exposure, respectively. It is clear from Figure 11 that increased
CO exposures over 5 L had, at most, a modest effect on O,res or for CO exposures at either
300 K (blue data points) or 350 K (red data points). This implies that the 5 L CO exposure was
sufficient to cover the surface in the (2×2)-2O+CO adlayer and that CO2 desorption between 350
K and 550 K was from that phase as well. For CO exposures at 300 K, there was consistently
more CO2 and Ores than for the 350 K exposures, again suggesting that some Oad was reacted
away during the CO exposure at 350 K. However, prolonged CO exposures at either 300 K or
350 K did not further diminish O,res suggesting that whatever species or sites that were
responsible for the oxidation reaction were consumed by CO exposures of 5 L or less and were
not regenerated. This was in marked contrast to our previous observation of a strong dependence
of Ores on CO exposure for the mixed (2×1)-O and RhO2 oxide with Osub, where O was nearly
entirely consumed during the 300 K CO exposure, leaving only a small amount of Oad in the
(2×2)-2O+CO adlayer.80 Although the reaction rate is non-zero for CO2 formation at 350 K (as
shown by the TPDs in Figures 8 and 11), the reaction that manifests itself as the shoulder and
400 K CO2 desorption peak has run its course by the time the Texp = 350 K CO exposure reached
30 L. After the reactions occurred, these lower barrier sites were inert and could only adsorb CO
that was not oxidized later, as the area would be denuded of Oad. Unfortunately, we were unable
to detect desorption of COad reliably and quantitatively during the TPD measurement because of
the significant background of CO and the cracking of CO2 in the QMS ionizer.
33
In order to investigate how the surface changed as the temperature was raised above 300
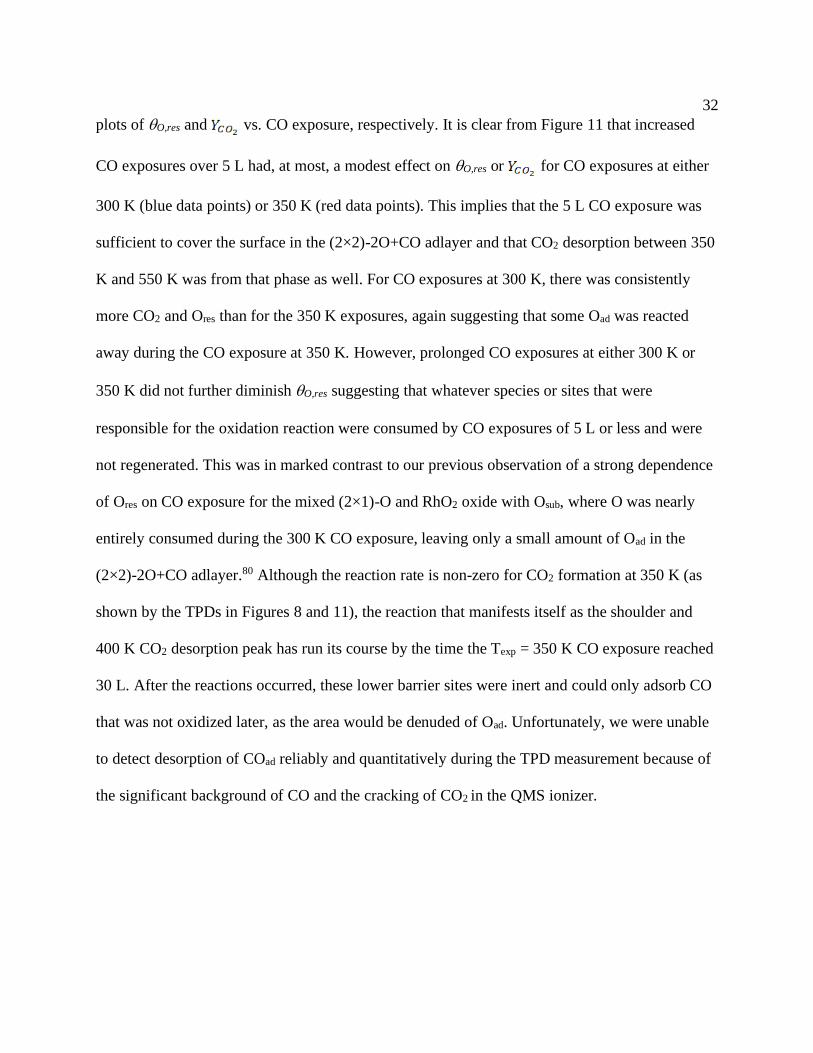
Figure 12. 15 × 15 nm2 STM images of: A) the (2×1)-O adlayer after a 60 L O2 exposure at
300 K; B) the (2×2)-2O+CO after a 2 L CO exposure at 220 K; and C) the (2×2)-2O+CO
adlayer in B) after annealing at 325 K. Imaging conditions were A) -108 mV, -0.61 nA; B) 0.84
V, 180 pA; C) 0.69 V, 256 pA.
34
K, we obtained STM images of the surface before and after annealing at 325 K, a low enough
temperature where we would not expect an appreciable amount of CO oxidation. Figure 12A
shows an STM image of Rh(111) after an exposure of 60 L O2 at 300 K resulting in a complete
(2×1)-O adlayer. The (2×1)-O adlayer has been previously described 51, 74, 76 and the co-existence
of different domains rotated by 120° were evident in the upper right corner of Figure 12A.
Following a 2 L CO exposure at 220 K, the surface was predominantly covered in the (2×2)-
2O+CO adlayer, as shown in Figure 11B. The bright circular features in the (2×2)-2O+CO
structure were adsorbed CO molecules. The bright white blotches were likely spurious adsorbed
species or CO. Upon annealing this surface at 325 K, the surface changed slightly, as shown in
Figure 12C. The occurrence of bright raised areas decreased, and there were more dark regions
between areas of (2×2)-2O+CO. The result was that the (2×2)-2O+CO structure was still
predominant, but its coverage decreased slightly compared to the unannealed (2×2)-2O+CO
surface. It is important to note that the STM images were taken after brief CO exposures where
the surface would not be fully covered in the (22)-2O+CO adlayer; such coverage would not be
expected until an exposure of closer to 30 L CO. Despite not having a full adlayer, the apparent
CO coverage still decreased between Figures 12B and 12C. The CO molecules remained in the
(22) registry and were aligned with the (21)-O adlayer, indicating that CO was not oxidized on
the surface, but more likely desorbed as intact CO. We were unable to determine the surface
structure in the dark regions of the STM images, but assume they are (21)-O because of the
small change in O, res shown in Figure 11.
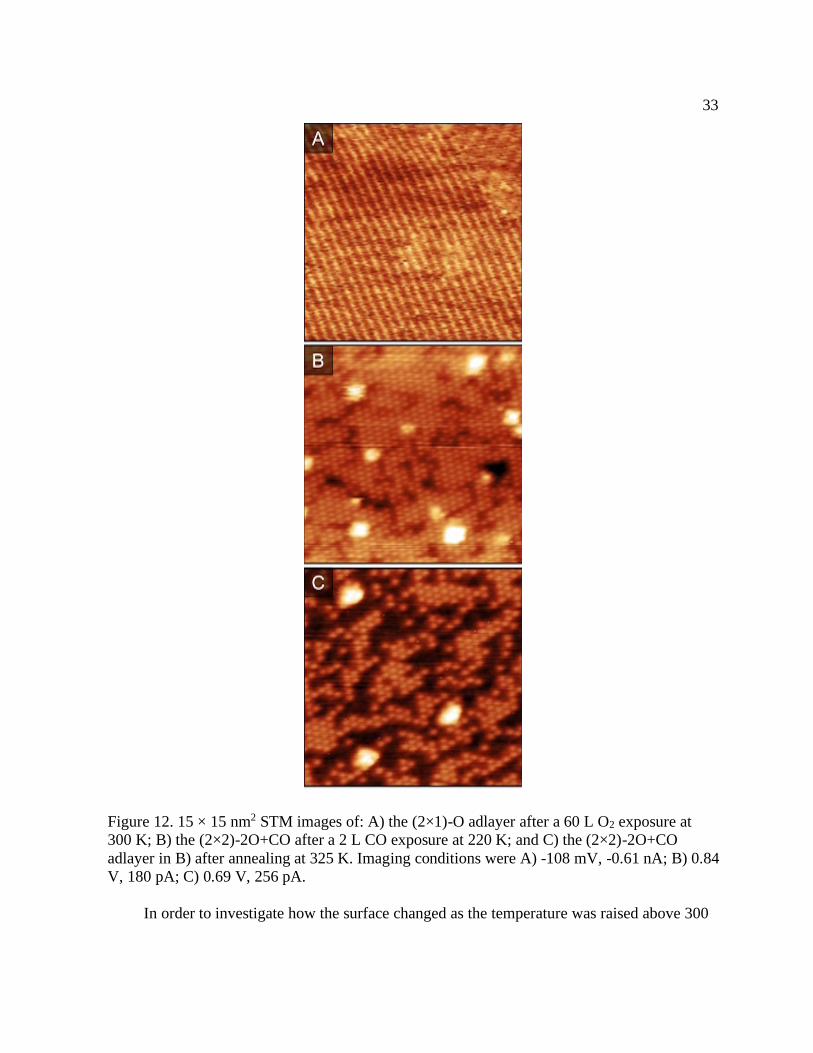
Figure 13A shows STM images of the (21)-O Rh(111) surface after a 2 L CO exposure
at 220 K near a step edge. Looking more closely at the step edges of the surface, the structure of
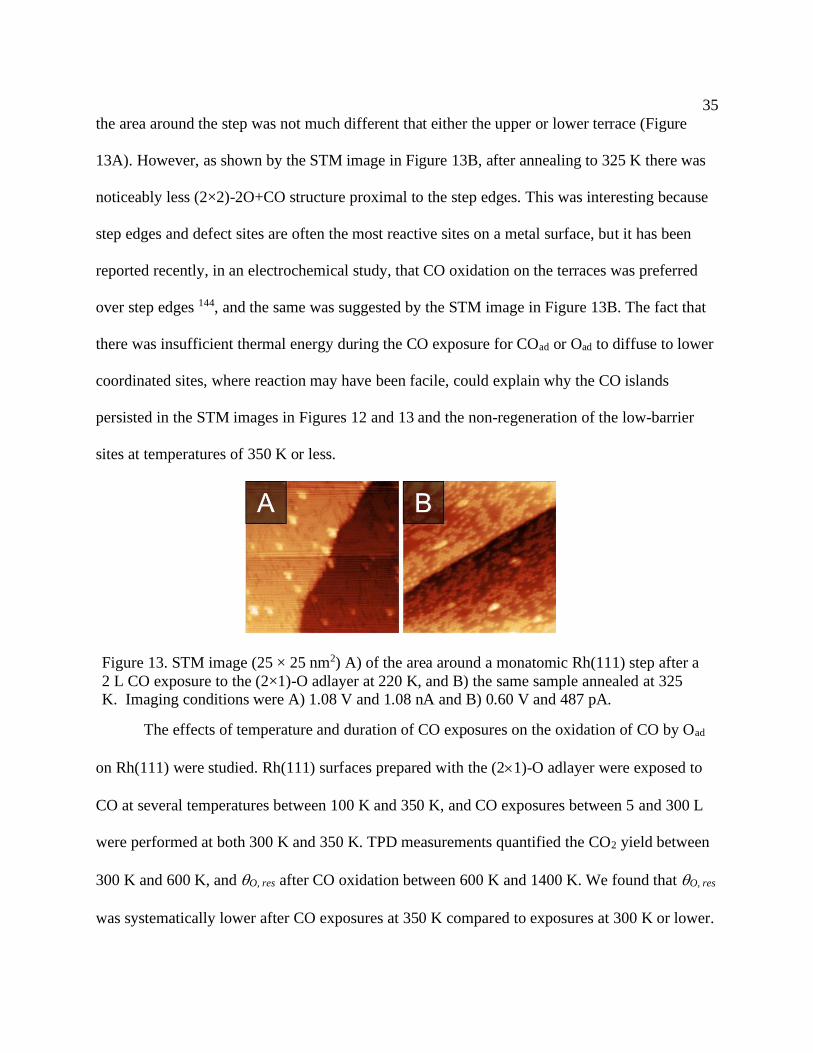
35
the area around the step was not much different that either the upper or lower terrace (Figure
13A). However, as shown by the STM image in Figure 13B, after annealing to 325 K there was
noticeably less (2×2)-2O+CO structure proximal to the step edges. This was interesting because
step edges and defect sites are often the most reactive sites on a metal surface, but it has been
reported recently, in an electrochemical study, that CO oxidation on the terraces was preferred
over step edges 144, and the same was suggested by the STM image in Figure 13B. The fact that
there was insufficient thermal energy during the CO exposure for COad or Oad to diffuse to lower
coordinated sites, where reaction may have been facile, could explain why the CO islands
persisted in the STM images in Figures 12 and 13 and the non-regeneration of the low-barrier
sites at temperatures of 350 K or less.
The effects of temperature and duration of CO exposures on the oxidation of CO by Oad
on Rh(111) were studied. Rh(111) surfaces prepared with the (21)-O adlayer were exposed to
CO at several temperatures between 100 K and 350 K, and CO exposures between 5 and 300 L
were performed at both 300 K and 350 K. TPD measurements quantified the CO2 yield between
300 K and 600 K, and O, res after CO oxidation between 600 K and 1400 K. We found that O, res
was systematically lower after CO exposures at 350 K compared to exposures at 300 K or lower.
Figure 13. STM image (25 × 25 nm2) A) of the area around a monatomic Rh(111) step after a
2 L CO exposure to the (2×1)-O adlayer at 220 K, and B) the same sample annealed at 325
K. Imaging conditions were A) 1.08 V and 1.08 nA and B) 0.60 V and 487 pA.
36
The CO oxidation rate was greater at 350 K than at 300 K, as observed in the TPD experiments,
yet O, res and , did not change as the CO exposure increased. These findings mean that there
are multiple reaction pathways available for CO oxidation on Rh(111), and that the lower-barrier
pathway involves reaction sites that were not regenerated at temperatures of 350 K or below. The
lower-barrier reaction did not occur below 300 K, as indicated by invariant and O, res for
exposures CO at temperatures of 300 K or below. These observations show that even for
homogeneous surfaces, multiple reaction pathways are accessible for CO oxidation and that
complete, accurate models for heterogeneously catalyzed oxidation reactions must include more
channels than only reaction between co-adsorbed species.
37
CHAPTER THREE
CHARACTERIZATION OF OXYGENACEOUS SPECIES FORMED BY EXPOSURE OF
AG(111) TO ATOMIC OXYGEN
Reprinted with permission from Characterization of Oxygenaceous Species Formed
by Exposure of Ag(111) to Atomic Oxygen, Marie E. Turano, Rachael G. Farber, Eleanor C.N.
Oskorep, Richard A. Rosenberg, and Daniel R. Killelea, Journal of Physical Chemistry C 2020
124 (2), 1382. Copyright 2021 American Chemical Society.
The oxidation of silver surfaces has become a benchmark system for both experimental
surface science analysis and theoretical calculations.47, 145-157 There are strong propensities for
surface reconstruction upon adsorption of O on silver surfaces, and under a variety of conditions,
several oxidic surface phases may coexist. Such behavior results from the balance of strong O–
Ag interactions and less robust Ag–Ag interactions than present for many transition metal
surfaces. Due to the complexity of O/Ag interactions, an understanding of the exact nature of the
various oxygenaceous species is still developing.158-170 Our previous work has established the
efficacy of gas-phase atomic oxygen (AO) to highly oxidize Ag(111) under ultra-high vacuum
(UHV) compatible conditions and revealed a strong temperature dependence on the surface
composition. For example, for exposures below surface temperatures (Ts) of 500 K and moderate
O coverages, the co-existence of p(4×4), c(3×5 3), p(4×5 3), and c(4×8) domains were
observed.159, 161 In addition to these previously characterized oxidic phases, a striped phase was
also identified using low-energy electron diffraction (LEED) and scanning tunneling microscopy
38
(STM). The striped phase manifested at that same O coverages where a low-temperature oxygen
desorption feature in temperature programmed desorption (TPD) spectra was observed; this low-
temperature feature was attributed to dissolved oxygen in the near-surface region of Ag(111).159
In this paper, we report the findings of our study of oxidized Ag(111) surfaces prepared
via exposure to AO under vacuum conditions in which we quantified the total ad- and absorption
of oxygen using TPD, complemented by synchrotron radiation X-ray photoelectron spectroscopy
(XPS) to provide chemical analysis. We found that the uptake and capacity for oxygen in Ag was
temperature dependent, and that once the total amount of oxygen exceeded an oxygen coverage
(θO) of 0.4 ML, a new photoelectron peak was observed in the XPS spectrum which
corresponded with the formation of the aforementioned striped pattern observed using LEED and
the low-temperature oxygen desorption feature seen in the TPD spectra. Using angle resolved
XPS, we have determined that the previously reported ‘striped’ phase formed on Ag(111) from
AO at exposure temperatures below 500 K is comprised of both surface oxygen and subsurface
oxygen (Osub) and is most likely a 3-dimensional phase that is distinct from previously reported
silver oxides (e.g. AgO or Ag2O).160, 167, 171-172 These results suggest that silver surfaces undergo
a complex reconstruction under oxidizing environments at comparatively modest temperatures (<
500 K) where oxygen diffuses into the near surface region of the solid (selvedge), resulting in a
homogeneous oxygenaceous phase that covers the surface. Because this oxygenaceous phase
forms at catalytically relevant temperatures (≈ 500 K), the oxides formed should make a
significant contribution to the species present under actual catalysis conditions.
The TPD, LEED, and STM experiments were carried out at Loyola University Chicago
using a previously described apparatus.173 Briefly, the system consists of two interconnected
ultra-high vacuum (UHV) chambers, the first a preparation/analysis chamber and the second, a
39
STM chamber. The STM was an RHK Technology PanScan Freedom STM, which was cooled
by a closed-cycle helium cryostat, and the imaging was typically done at 30 K. The
preparation/analysis chamber was equipped with a Fissions RVL900 LEED, a PHI 10-155 Auger
Electron Spectrometer (AES), and a UTI 100c quadrupole mass spectrometer. The Ag(111)
sample was mounted on a Ta sample plate by welding it to two supporting Ta wires, and a type-
K thermocouple was directly welded to the Ag(111) crystal. The sample could be heated using
electron beam heating to 1000 K and cooled using a flow of liquid nitrogen to 100 K. The
surface was prepared using the standard sequence of Ar+ sputtering followed by annealing at 850
K. Surface cleanliness was verified with AES and a crisp (1×1) LEED pattern. The Ag(111) was
exposed to gas-phase AO via a thermal O2 cracker that consisted of a hot Ir wire held at 1750 K
around 5 mm from the front face of the crystal. O uptake was quantified using TPD, with the
desorption peak near 600 K corresponding to 0.375 ML O as the internal standard. In a previous
publication, we demonstrated that both NO2 and AO exposure at 525 K resulted in the same
surface coverage, albeit AO gave the p(4×5√3) reconstruction159 rather than the p(4×4)
reconstruction resulting from NO2 or high-pressure O2 exposures.150, 156
XPS experiments were conducted at beamline 4-ID-C at the Advanced Photon Source
(APS) at Argonne National Laboratory using a Scienta Omicron Argus electron energy analyzer
operating at a pass energy of 10 eV and using 670 eV X-rays.174 The angle between the X-ray
source and the inlet of the analyzer was fixed at 90°. XPS spectra were acquired at X-ray
incidence angles of 30° (surface sensitive) and 60° (bulk sensitive) with respect to the surface
normal by rotating the crystal. In order to estimate the relative surface–bulk sensitivity, the
inelastic mean free paths (IMFP) were calculated for electrons in the Ag(111) sample. First, the
IMFP for Ag2O (band gap of 1.4 eV, 8 valence electrons, and a density of 1.4 g cm–3) was
40
calculated using the NIST database.175 At 30°, the IMFP for 670 eV X-rays emitted from Ag 3d
and O 1s orbitals were calculated to be 5.0 Å and 3.3 Å, respectively. The IMFPs were 8.7 Å and
5.7 Å for Ag 3d and O 1s electrons at 60° X-ray incidence, indicating that electrons from 60%
deeper in the silver sample would be detected at 60° compared to 30°. The Ag(111) sample was
cleaned and exposed to gas-phase AO in a similar fashion to what was done at Loyola. Although
TPD measurements to quantify O uptake were not possible at the APS, the combination of XPS
and LEED allowed for the connection between the Loyola and APS sample preparations. Again,
using the saturation of the surface at θO = 0.375 ML O for AO exposures at 525 K, and
observation of the same LEED pattern at both Loyola and the APS, it was possible to correlate
the XPS signal for surface adsorbed oxygen (Oad) with the TPD measurements.
Previous results from our lab have shown that the rate of O uptake on Ag(111) from
exposure to gas-phase AO increases with decreasing sample temperature, suggesting competition
between surface diffusion and diffusion into the selvedge (near surface region of the solid) once
an impinging O atom interacts with the Ag(111) surface.159, 161 At Ts greater than 500 K,
sufficient O was adsorbed to form a complete surface adlayer with θO = 0.375 ML O in the
p(4×5√3) reconstruction. Once the surface was covered, O atoms that diffused towards the
surface would find no stable adsorption sites, and therefore would promptly recombinatively
desorb as O2. Alternatively, diffusion of O into the selvedge would free up the initial surface
adsorption sites, allowing for further uptake of O. This model is sensible, as Oad was stable up to
above 575 K, meaning the desorption rate of Oad was insignificant at for Ts < 550 K, and the
amount of oxygen was not observed to exceed θO = 0.375 ML (saturated Oad) for AO exposures
between Ts = 500 K and 525 K. Therefore, at these temperatures, diffusion towards the surface
was favored over diffusion into the solid, leaving only Oad. Alternatively, for AO exposures with
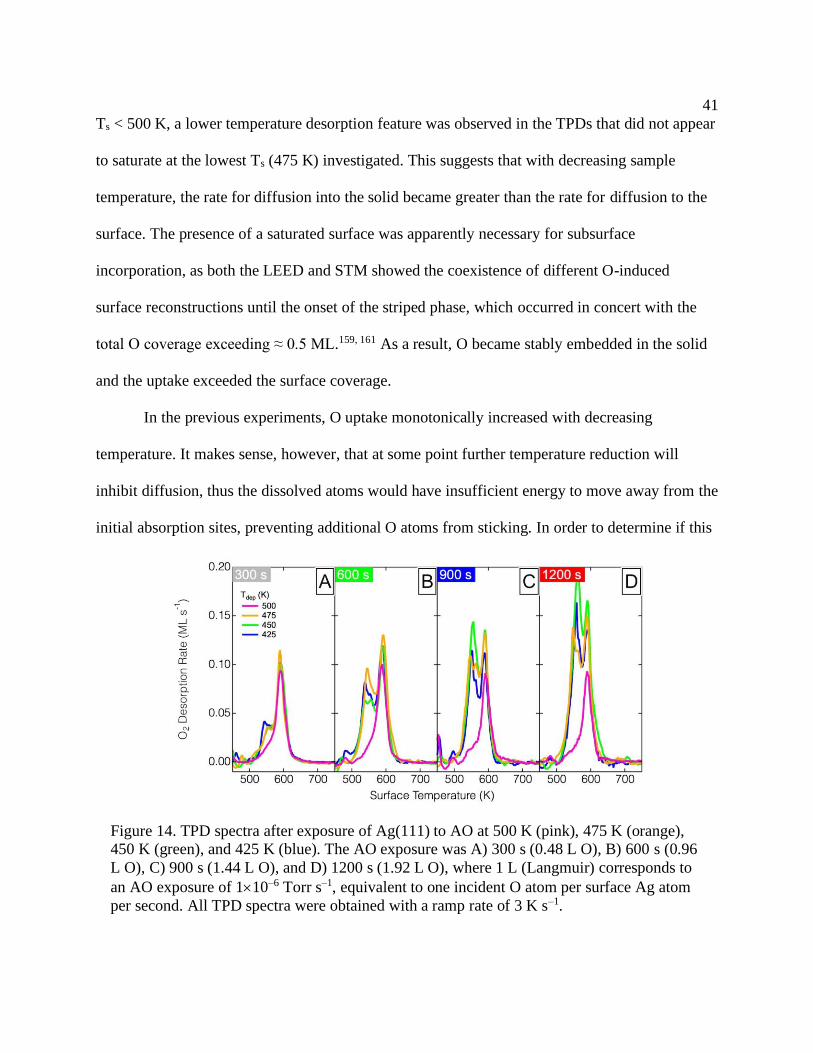
41
Ts < 500 K, a lower temperature desorption feature was observed in the TPDs that did not appear
to saturate at the lowest Ts (475 K) investigated. This suggests that with decreasing sample
temperature, the rate for diffusion into the solid became greater than the rate for diffusion to the
surface. The presence of a saturated surface was apparently necessary for subsurface
incorporation, as both the LEED and STM showed the coexistence of different O-induced
surface reconstructions until the onset of the striped phase, which occurred in concert with the
total O coverage exceeding ≈ 0.5 ML.159, 161 As a result, O became stably embedded in the solid
and the uptake exceeded the surface coverage.
In the previous experiments, O uptake monotonically increased with decreasing
temperature. It makes sense, however, that at some point further temperature reduction will
inhibit diffusion, thus the dissolved atoms would have insufficient energy to move away from the
initial absorption sites, preventing additional O atoms from sticking. In order to determine if this
Figure 14. TPD spectra after exposure of Ag(111) to AO at 500 K (pink), 475 K (orange),
450 K (green), and 425 K (blue). The AO exposure was A) 300 s (0.48 L O), B) 600 s (0.96
L O), C) 900 s (1.44 L O), and D) 1200 s (1.92 L O), where 1 L (Langmuir) corresponds to
an AO exposure of 110–6 Torr s–1, equivalent to one incident O atom per surface Ag atom
per second. All TPD spectra were obtained with a ramp rate of 3 K s–1.
42
was indeed the case, we exposed Ag(111) to AO at a variety of sample temperatures between
500 K and 425 K and quantified the total oxygen uptake using TPD. In order to ensure that we
minimized any kinetic interferences of O diffusion into or out of subsurface sites, the incident
flux of O atoms was reduced to 1.6×10⁻³ ML s–1, compared to ≈ 3 ×10⁻³ ML s–1 in our previous
publications. 159, 173 TPD plots of O2 desorption are shown in Figure 14 for AO exposures of 300,
600, 900, and 1200 s at Tsample = 500 K (pink), 475 K (orange), 450 K (green), and 425 K (blue).
In Figure 14, it is evident that there was a single desorption feature at 590 K (pink trace) that did
not vary with exposure time or Tsample. This desorption peak corresponded to the desorption of
adsorbed oxygen from the θO = 0.375 ML p(4x5√3) surface reconstruction previously observed
for AO exposure temperatures of 500 K or above. When Ts < 500 K, the surface was comprised
of several domains, as seen in previous STM images,159 until a total oxygen coverage of around
θO ≈ 0.5 ML was reached. As the coverage was increased, the surface changed to a striped phase
that was observed using both STM and LEED. At Ts = 500 K, there was no evolution in the
oxygen desorption features with increased AO exposure (Figure 14A to 14D), but for Ts = 475
K, 450 K, and 425 K, a second desorption peak developed at around 560 K. The intensity of this
peak increased with exposure for these three temperatures, but a monotonic relationship between
intensity and decreasing surface temperature was not observed. There were, in fact, two distinct
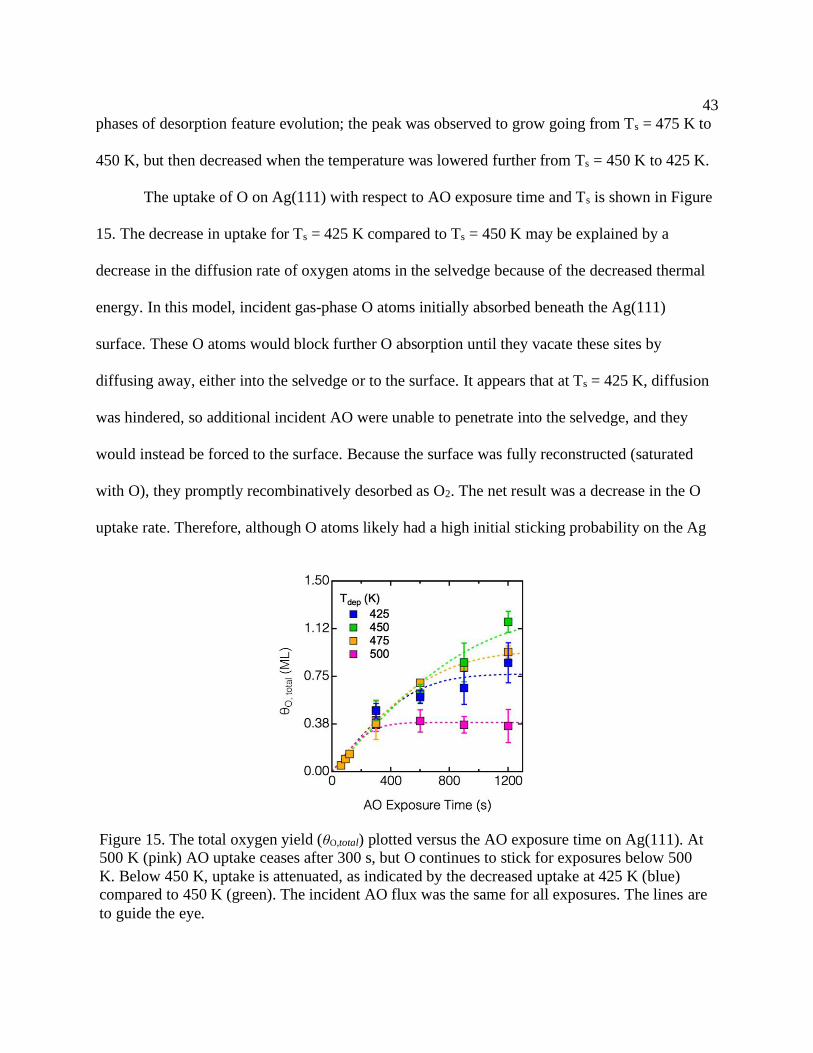
43
phases of desorption feature evolution; the peak was observed to grow going from Ts = 475 K to
450 K, but then decreased when the temperature was lowered further from Ts = 450 K to 425 K.
The uptake of O on Ag(111) with respect to AO exposure time and Ts is shown in Figure
15. The decrease in uptake for Ts = 425 K compared to Ts = 450 K may be explained by a
decrease in the diffusion rate of oxygen atoms in the selvedge because of the decreased thermal
energy. In this model, incident gas-phase O atoms initially absorbed beneath the Ag(111)
surface. These O atoms would block further O absorption until they vacate these sites by
diffusing away, either into the selvedge or to the surface. It appears that at Ts = 425 K, diffusion
was hindered, so additional incident AO were unable to penetrate into the selvedge, and they
would instead be forced to the surface. Because the surface was fully reconstructed (saturated
with O), they promptly recombinatively desorbed as O2. The net result was a decrease in the O
uptake rate. Therefore, although O atoms likely had a high initial sticking probability on the Ag
Figure 15. The total oxygen yield (θO,total) plotted versus the AO exposure time on Ag(111). At
500 K (pink) AO uptake ceases after 300 s, but O continues to stick for exposures below 500
K. Below 450 K, uptake is attenuated, as indicated by the decreased uptake at 425 K (blue)
compared to 450 K (green). The incident AO flux was the same for all exposures. The lines are
to guide the eye.
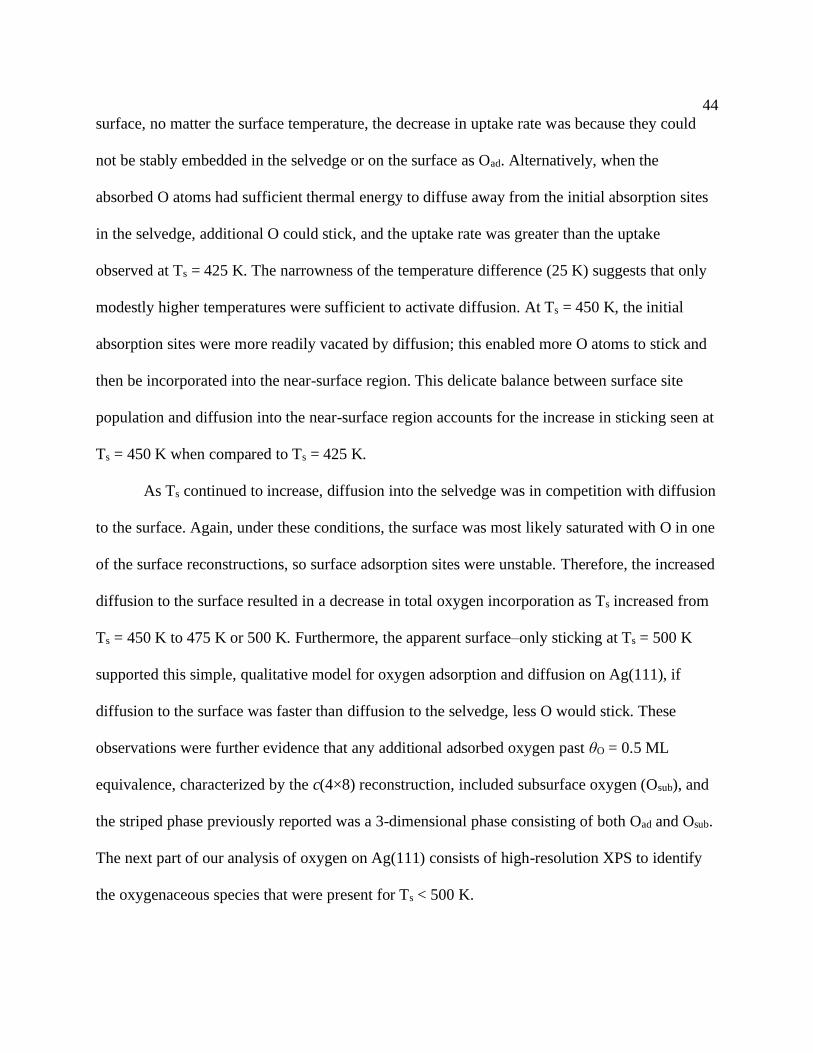
44
surface, no matter the surface temperature, the decrease in uptake rate was because they could
not be stably embedded in the selvedge or on the surface as Oad. Alternatively, when the
absorbed O atoms had sufficient thermal energy to diffuse away from the initial absorption sites
in the selvedge, additional O could stick, and the uptake rate was greater than the uptake
observed at Ts = 425 K. The narrowness of the temperature difference (25 K) suggests that only
modestly higher temperatures were sufficient to activate diffusion. At Ts = 450 K, the initial
absorption sites were more readily vacated by diffusion; this enabled more O atoms to stick and
then be incorporated into the near-surface region. This delicate balance between surface site
population and diffusion into the near-surface region accounts for the increase in sticking seen at
Ts = 450 K when compared to Ts = 425 K.
As Ts continued to increase, diffusion into the selvedge was in competition with diffusion
to the surface. Again, under these conditions, the surface was most likely saturated with O in one
of the surface reconstructions, so surface adsorption sites were unstable. Therefore, the increased
diffusion to the surface resulted in a decrease in total oxygen incorporation as Ts increased from
Ts = 450 K to 475 K or 500 K. Furthermore, the apparent surface–only sticking at Ts = 500 K
supported this simple, qualitative model for oxygen adsorption and diffusion on Ag(111), if
diffusion to the surface was faster than diffusion to the selvedge, less O would stick. These
observations were further evidence that any additional adsorbed oxygen past θO = 0.5 ML
equivalence, characterized by the c(4×8) reconstruction, included subsurface oxygen (Osub), and
the striped phase previously reported was a 3-dimensional phase consisting of both Oad and Osub.
The next part of our analysis of oxygen on Ag(111) consists of high-resolution XPS to identify
the oxygenaceous species that were present for Ts < 500 K.
45
The XPS experiments were conducted at the XPS end station on beamline 4-ID-C at
Argonne National Lab’s Advanced Photon Source (APS). Although we were unable to
characterize the Ag(111) surface with TPD at APS, we were able to compare the LEED patterns
to those previously obtained at Loyola University Chicago (Loyola) and determined that the
same surfaces were prepared at both Loyola and the APS. As shown in Figure 16, the LEED
patterns for AO exposures of Ag(111) at Ts = 525 K and 475 K taken at both locations were in
agreement. However, the apparent flux of O atoms on the Ag(111) surface was roughly a factor
of two to three times lower at the APS, as indicated by an increased AO exposure time necessary
for the LEED patterns to match our previous results159. Although we previously found that
increased AO fluxes could cause oxide formation161, the fluxes used in these studies were
insufficient for oxide growth. Additionally, as discussed above, within the range of fluxes used at
Figure 16. Comparison of LEED patterns taken on Ag(111) after AO exposures at the APS
(left, blue tint) and Loyola (right, orange tint) for exposure temperatures at Ts = 525 K (A and
B) and Ts = 475 K (C and D). The exposure times are indicated at the bottom of each image.
The LEED patterns collected at Loyola were with an energy of 52 eV and at APS, 65 eV.
46
the APS and Loyola, the TPD spectra and O uptakes scaled linearly with flux and no differences
were apparent in the TPD spectra. The key findings from the LEED patterns were that the same
p(4×5√3) surface reconstruction and striped LEED pattern were observed after AO exposures at
Ts = 525 K and 475 K, respectively. We are confident that the surface preparation methods used
at the two facilities were equivalent, so XPS measurements could be used to elucidate the
corresponding oxygenaceous species formed on Ag(111) from AO exposures.
Our TPD experiments showed that O atoms were incorporated into the selvedge of the
Ag(111) crystal for AO exposures with Ts < 500 K, yielding a striped LEED pattern and STM
images of a striped surface. The XPS measurements taken at the APS show the same
characteristics previously assigned to a ‘bulk-like’ Ag2O species reported previously.163, 169
Additionally, as we will show, the combination of previous STM images and the XPS data
herein demonstrate that the c(4×8) and p(7×7) phases reported previously163, 169 are likely
precursors of or the same species as the striped phase which has the characteristics of a 3-
dimensional bulk-like oxide that decomposes in a sharp desorption feature below 590 K in our
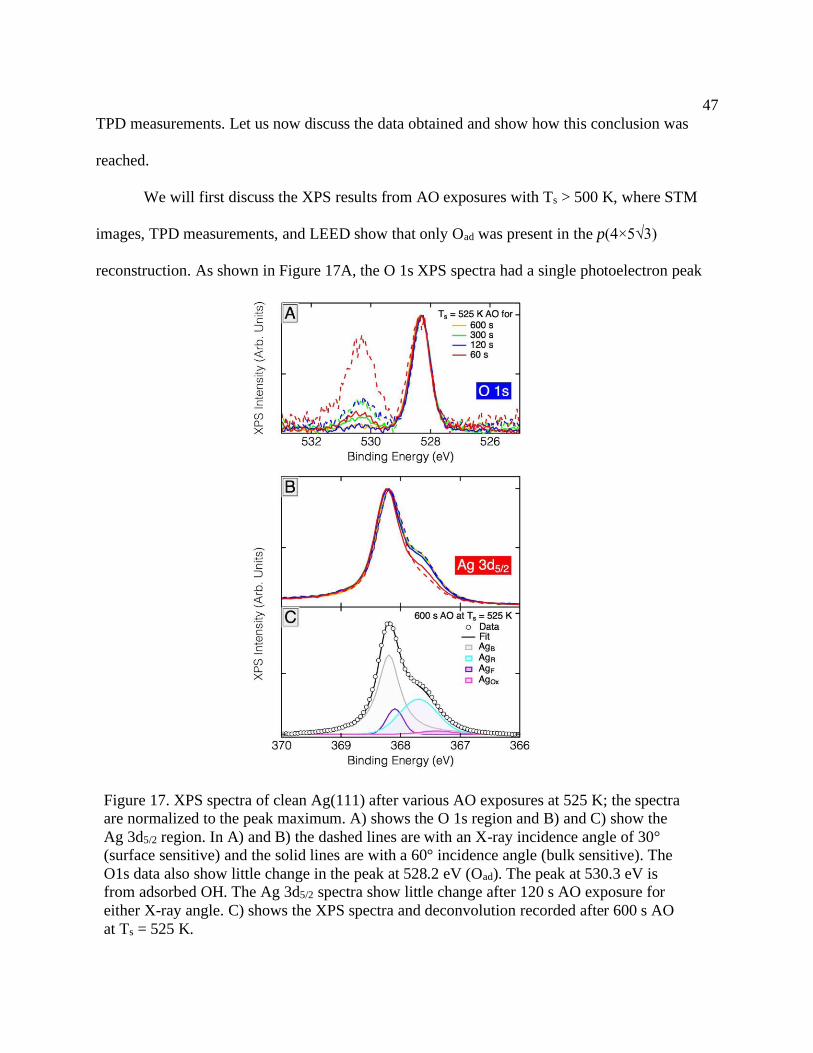
47
TPD measurements. Let us now discuss the data obtained and show how this conclusion was
reached.
We will first discuss the XPS results from AO exposures with Ts > 500 K, where STM
images, TPD measurements, and LEED show that only Oad was present in the p(4×5√3)
reconstruction. As shown in Figure 17A, the O 1s XPS spectra had a single photoelectron peak
Figure 17. XPS spectra of clean Ag(111) after various AO exposures at 525 K; the spectra
are normalized to the peak maximum. A) shows the O 1s region and B) and C) show the
Ag 3d5/2 region. In A) and B) the dashed lines are with an X-ray incidence angle of 30°
(surface sensitive) and the solid lines are with a 60° incidence angle (bulk sensitive). The
O1s data also show little change in the peak at 528.2 eV (Oad). The peak at 530.3 eV is
from adsorbed OH. The Ag 3d5/2 spectra show little change after 120 s AO exposure for
either X-ray angle. C) shows the XPS spectra and deconvolution recorded after 600 s AO
at Ts = 525 K.
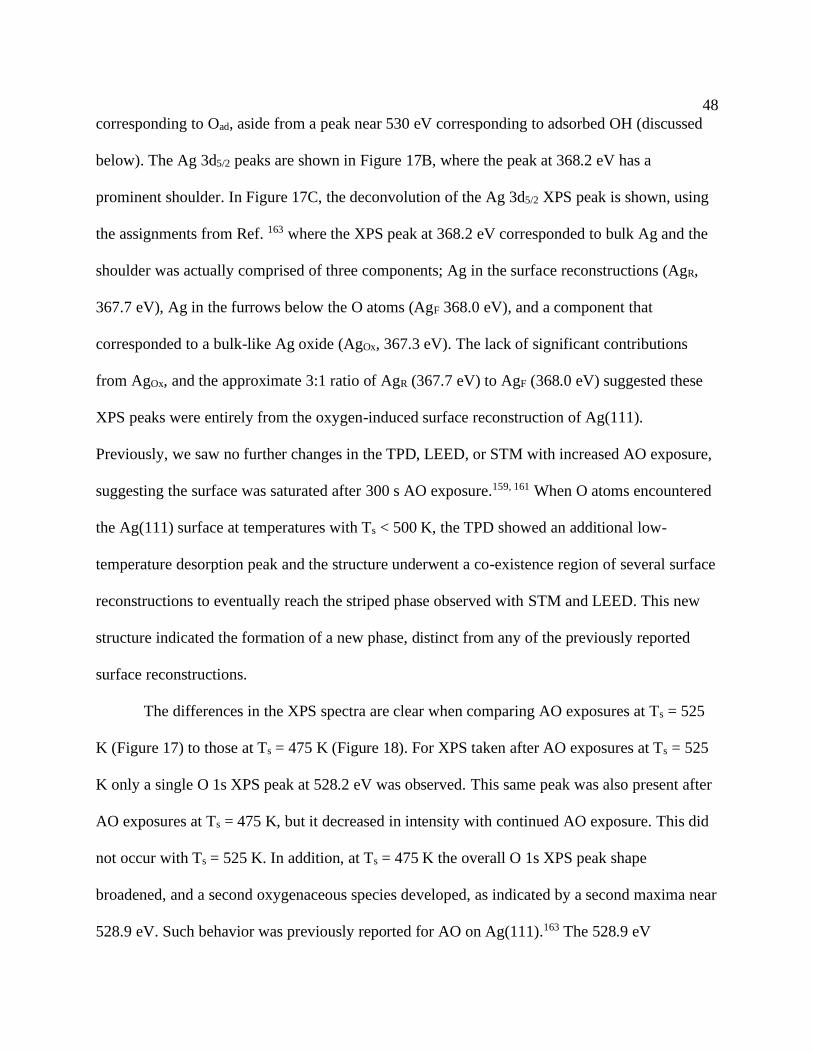
48
corresponding to Oad, aside from a peak near 530 eV corresponding to adsorbed OH (discussed
below). The Ag 3d5/2 peaks are shown in Figure 17B, where the peak at 368.2 eV has a
prominent shoulder. In Figure 17C, the deconvolution of the Ag 3d5/2 XPS peak is shown, using
the assignments from Ref. 163 where the XPS peak at 368.2 eV corresponded to bulk Ag and the
shoulder was actually comprised of three components; Ag in the surface reconstructions (AgR,
367.7 eV), Ag in the furrows below the O atoms (AgF 368.0 eV), and a component that
corresponded to a bulk-like Ag oxide (AgOx, 367.3 eV). The lack of significant contributions
from AgOx, and the approximate 3:1 ratio of AgR (367.7 eV) to AgF (368.0 eV) suggested these
XPS peaks were entirely from the oxygen-induced surface reconstruction of Ag(111).
Previously, we saw no further changes in the TPD, LEED, or STM with increased AO exposure,
suggesting the surface was saturated after 300 s AO exposure.159, 161 When O atoms encountered
the Ag(111) surface at temperatures with Ts < 500 K, the TPD showed an additional low-
temperature desorption peak and the structure underwent a co-existence region of several surface
reconstructions to eventually reach the striped phase observed with STM and LEED. This new
structure indicated the formation of a new phase, distinct from any of the previously reported
surface reconstructions.
The differences in the XPS spectra are clear when comparing AO exposures at Ts = 525
K (Figure 17) to those at Ts = 475 K (Figure 18). For XPS taken after AO exposures at Ts = 525
K only a single O 1s XPS peak at 528.2 eV was observed. This same peak was also present after
AO exposures at Ts = 475 K, but it decreased in intensity with continued AO exposure. This did
not occur with Ts = 525 K. In addition, at Ts = 475 K the overall O 1s XPS peak shape
broadened, and a second oxygenaceous species developed, as indicated by a second maxima near
528.9 eV. Such behavior was previously reported for AO on Ag(111).163 The 528.9 eV

49
component eventually became nearly as intense as the 528.2 eV peak (Figure 18A), which
corresponded to Oad. A third component above 530 eV was also observed in the O 1s XPS data
(Figure 17A, 18A and 18C), and is assigned to adsorbed OH from the chamber background, in
agreement with others,163, 167, 171 because of the following: the intensity was independent of AO
exposure; there was no apparent change in the observed LEED patterns; and the peak intensity
seemed to scale with the time interval since the last Ag(111) cleaning. Finally, this peak was
more intense with the 30° X-ray geometry, further suggesting it was a surface-adsorbed species.
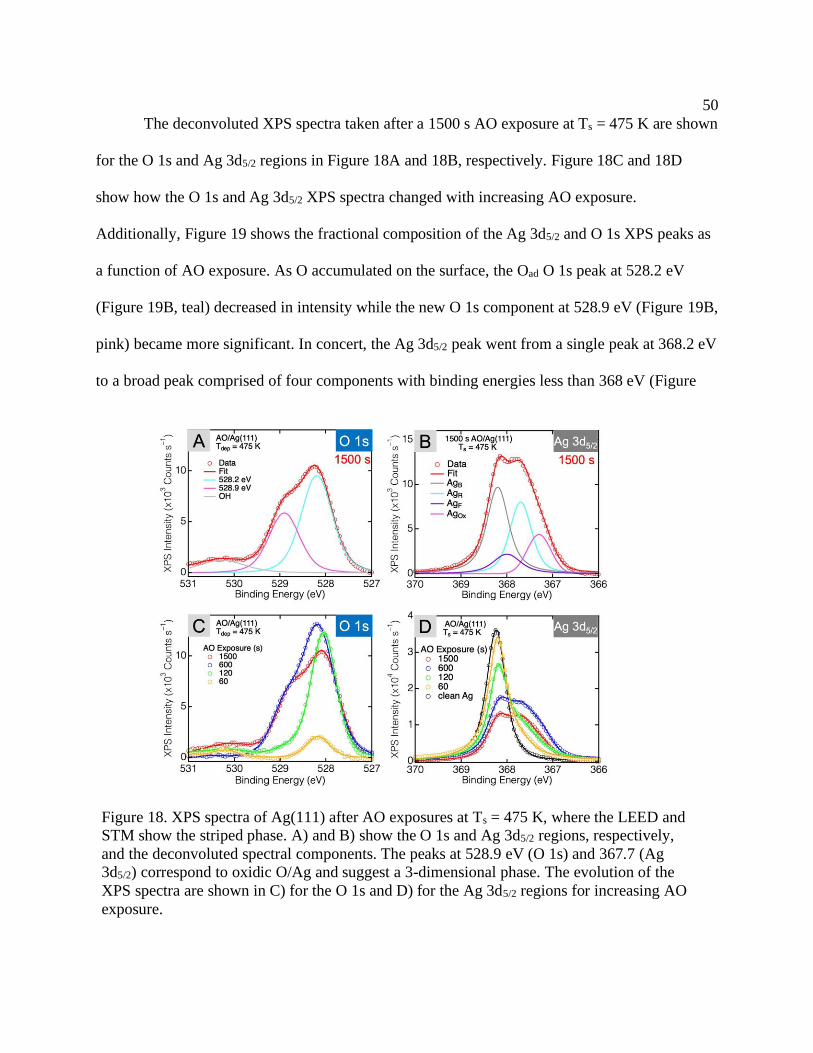
50
The deconvoluted XPS spectra taken after a 1500 s AO exposure at Ts = 475 K are shown
for the O 1s and Ag 3d5/2 regions in Figure 18A and 18B, respectively. Figure 18C and 18D
show how the O 1s and Ag 3d5/2 XPS spectra changed with increasing AO exposure.
Additionally, Figure 19 shows the fractional composition of the Ag 3d5/2 and O 1s XPS peaks as
a function of AO exposure. As O accumulated on the surface, the Oad O 1s peak at 528.2 eV
(Figure 19B, teal) decreased in intensity while the new O 1s component at 528.9 eV (Figure 19B,
pink) became more significant. In concert, the Ag 3d5/2 peak went from a single peak at 368.2 eV
to a broad peak comprised of four components with binding energies less than 368 eV (Figure
Figure 18. XPS spectra of Ag(111) after AO exposures at Ts = 475 K, where the LEED and
STM show the striped phase. A) and B) show the O 1s and Ag 3d5/2 regions, respectively,
and the deconvoluted spectral components. The peaks at 528.9 eV (O 1s) and 367.7 (Ag
3d5/2) correspond to oxidic O/Ag and suggest a 3-dimensional phase. The evolution of the
XPS spectra are shown in C) for the O 1s and D) for the Ag 3d5/2 regions for increasing AO
exposure.
51
19A). The intensity of these new Ag components grew at the expense of the bulk Ag peak at
368.2 eV. At the 60 s exposure, there was only a shoulder on the bulk Ag peak, and the O 1s
peak at 528.9 eV was still small. At this point the surface was almost covered in the p(45√3)
reconstruction, as indicated by LEED and STM. With additional AO exposure, the O 1s
component at 528.9 eV became more intense, while the Ag 3d5/2/ peak became broader because
of the contribution of the AgOx component at 367.3 eV and the decrease in the AgB component at
368.2 eV. Throughout these changes, the contribution of the AgR component, corresponding to
Ag in the surface reconstruction, changed little, suggesting its concentration was likewise
constant. AO exposures longer that 600 s yielded the striped phase, as indicated with LEED,
STM, and TPD, and this was the point at which the composition of the Ag 3d5/2 peak changed
less, but the peak decreased in overall intensity. However, in the O 1s region, the peak
composition continued to evolve; the 528.9 eV component grew linearly with AO exposure
while the 528.2 eV component decreased monotonically.
Figure 19. Plots of the contribution of each spectral component to the total signal for A) Ag
3d5/2 and B) O 1s. In A), the components are bulk Ag (AgB), Ag in the surface reconstruction
(AgR), Ag atoms immediately beneath the adsorbed oxygen (AgF), and Ag incorporated into
the oxidic phase (AgOx). B) The O 1s spectrum can be separated into two components, one at
528.2 eV (teal) and the other at 528.9 eV (pink).
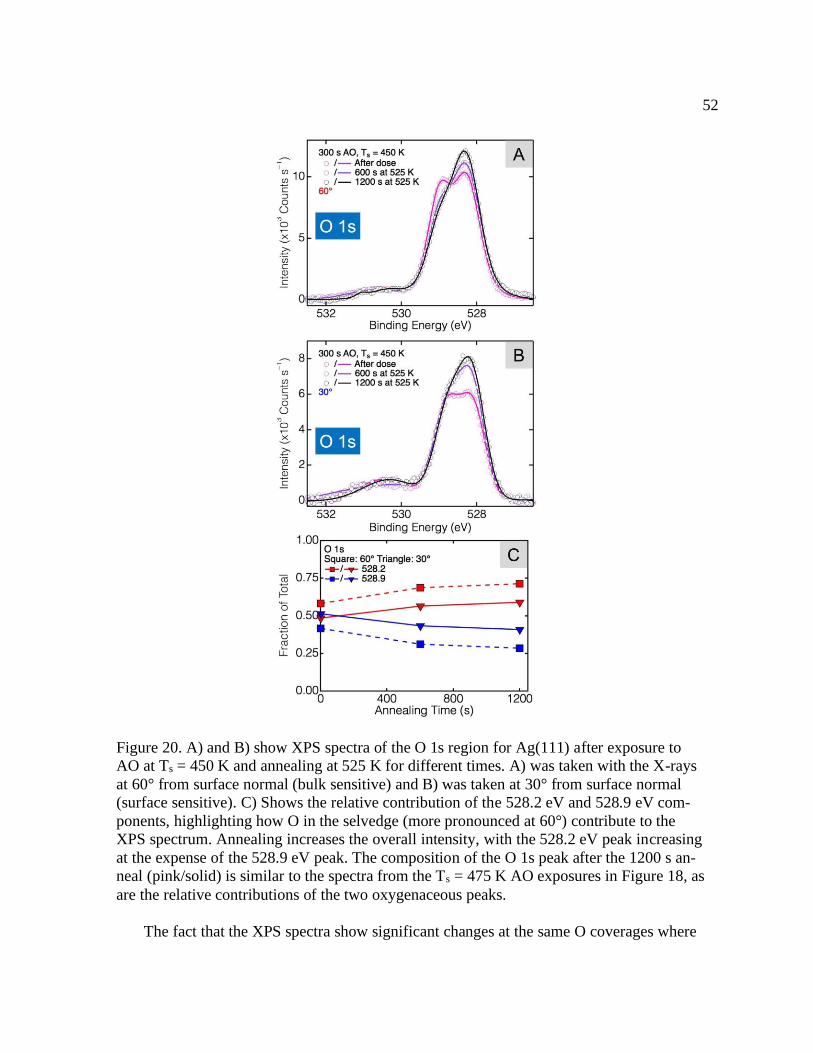
52
The fact that the XPS spectra show significant changes at the same O coverages where
Figure 20. A) and B) show XPS spectra of the O 1s region for Ag(111) after exposure to
AO at Ts = 450 K and annealing at 525 K for different times. A) was taken with the X-rays
at 60° from surface normal (bulk sensitive) and B) was taken at 30° from surface normal
(surface sensitive). C) Shows the relative contribution of the 528.2 eV and 528.9 eV com-
ponents, highlighting how O in the selvedge (more pronounced at 60°) contribute to the
XPS spectrum. Annealing increases the overall intensity, with the 528.2 eV peak increasing
at the expense of the 528.9 eV peak. The composition of the O 1s peak after the 1200 s an-
neal (pink/solid) is similar to the spectra from the Ts = 475 K AO exposures in Figure 18, as
are the relative contributions of the two oxygenaceous peaks.
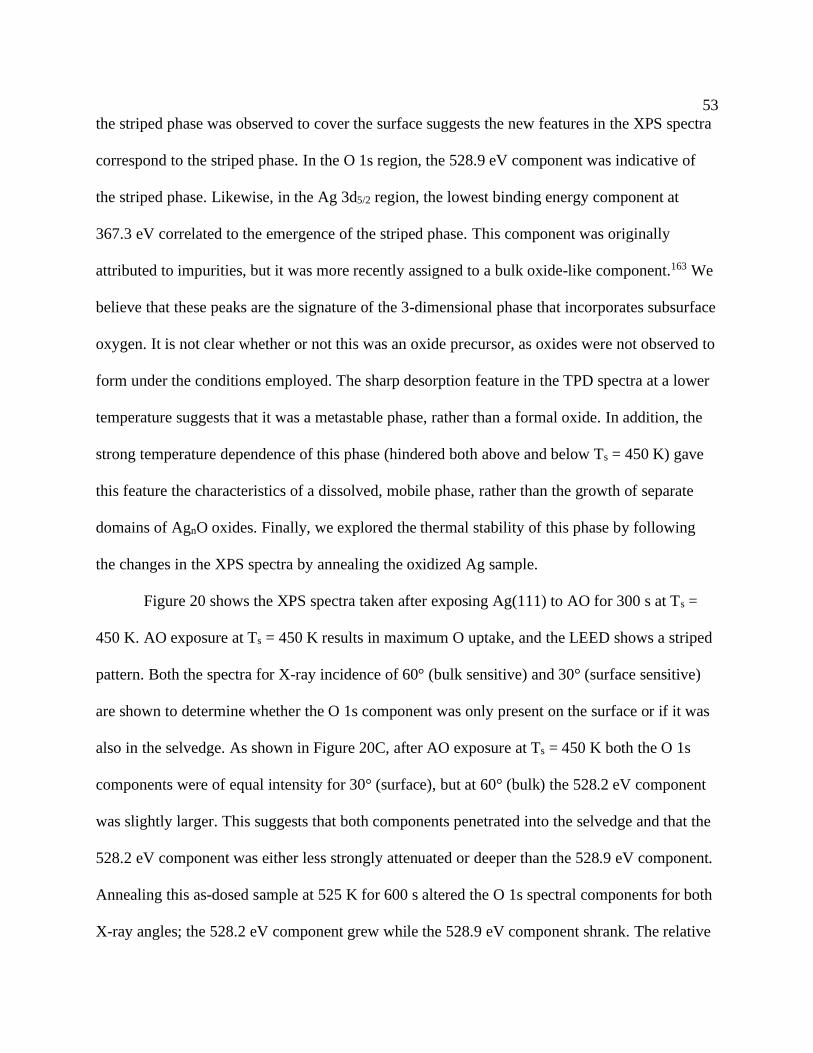
53
the striped phase was observed to cover the surface suggests the new features in the XPS spectra
correspond to the striped phase. In the O 1s region, the 528.9 eV component was indicative of
the striped phase. Likewise, in the Ag 3d5/2 region, the lowest binding energy component at
367.3 eV correlated to the emergence of the striped phase. This component was originally
attributed to impurities, but it was more recently assigned to a bulk oxide-like component.163 We
believe that these peaks are the signature of the 3-dimensional phase that incorporates subsurface
oxygen. It is not clear whether or not this was an oxide precursor, as oxides were not observed to
form under the conditions employed. The sharp desorption feature in the TPD spectra at a lower
temperature suggests that it was a metastable phase, rather than a formal oxide. In addition, the
strong temperature dependence of this phase (hindered both above and below Ts = 450 K) gave
this feature the characteristics of a dissolved, mobile phase, rather than the growth of separate
domains of AgnO oxides. Finally, we explored the thermal stability of this phase by following
the changes in the XPS spectra by annealing the oxidized Ag sample.
Figure 20 shows the XPS spectra taken after exposing Ag(111) to AO for 300 s at Ts =
450 K. AO exposure at Ts = 450 K results in maximum O uptake, and the LEED shows a striped
pattern. Both the spectra for X-ray incidence of 60° (bulk sensitive) and 30° (surface sensitive)
are shown to determine whether the O 1s component was only present on the surface or if it was
also in the selvedge. As shown in Figure 20C, after AO exposure at Ts = 450 K both the O 1s
components were of equal intensity for 30° (surface), but at 60° (bulk) the 528.2 eV component
was slightly larger. This suggests that both components penetrated into the selvedge and that the
528.2 eV component was either less strongly attenuated or deeper than the 528.9 eV component.
Annealing this as-dosed sample at 525 K for 600 s altered the O 1s spectral components for both
X-ray angles; the 528.2 eV component grew while the 528.9 eV component shrank. The relative
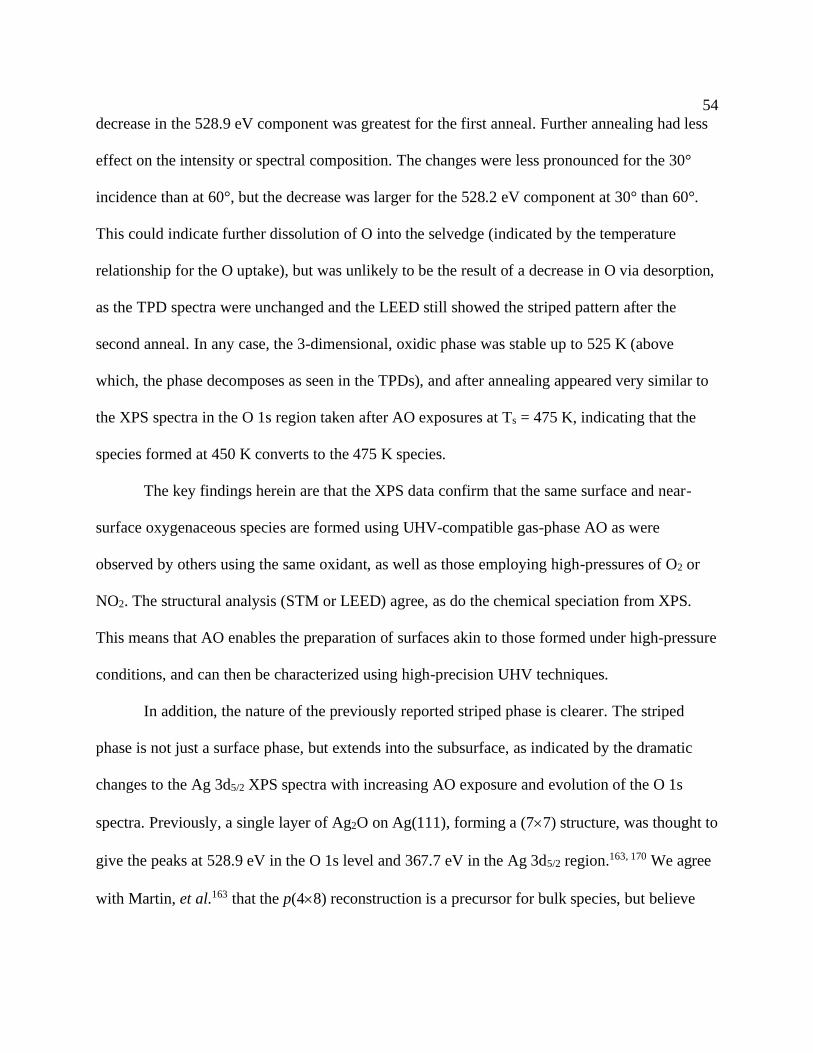
54
decrease in the 528.9 eV component was greatest for the first anneal. Further annealing had less
effect on the intensity or spectral composition. The changes were less pronounced for the 30°
incidence than at 60°, but the decrease was larger for the 528.2 eV component at 30° than 60°.
This could indicate further dissolution of O into the selvedge (indicated by the temperature
relationship for the O uptake), but was unlikely to be the result of a decrease in O via desorption,
as the TPD spectra were unchanged and the LEED still showed the striped pattern after the
second anneal. In any case, the 3-dimensional, oxidic phase was stable up to 525 K (above
which, the phase decomposes as seen in the TPDs), and after annealing appeared very similar to
the XPS spectra in the O 1s region taken after AO exposures at Ts = 475 K, indicating that the
species formed at 450 K converts to the 475 K species.
The key findings herein are that the XPS data confirm that the same surface and near-
surface oxygenaceous species are formed using UHV-compatible gas-phase AO as were
observed by others using the same oxidant, as well as those employing high-pressures of O2 or
NO2. The structural analysis (STM or LEED) agree, as do the chemical speciation from XPS.
This means that AO enables the preparation of surfaces akin to those formed under high-pressure
conditions, and can then be characterized using high-precision UHV techniques.
In addition, the nature of the previously reported striped phase is clearer. The striped
phase is not just a surface phase, but extends into the subsurface, as indicated by the dramatic
changes to the Ag 3d5/2 XPS spectra with increasing AO exposure and evolution of the O 1s
spectra. Previously, a single layer of Ag2O on Ag(111), forming a (77) structure, was thought to
give the peaks at 528.9 eV in the O 1s level and 367.7 eV in the Ag 3d5/2 region.163, 170 We agree
with Martin, et al.163 that the p(48) reconstruction is a precursor for bulk species, but believe
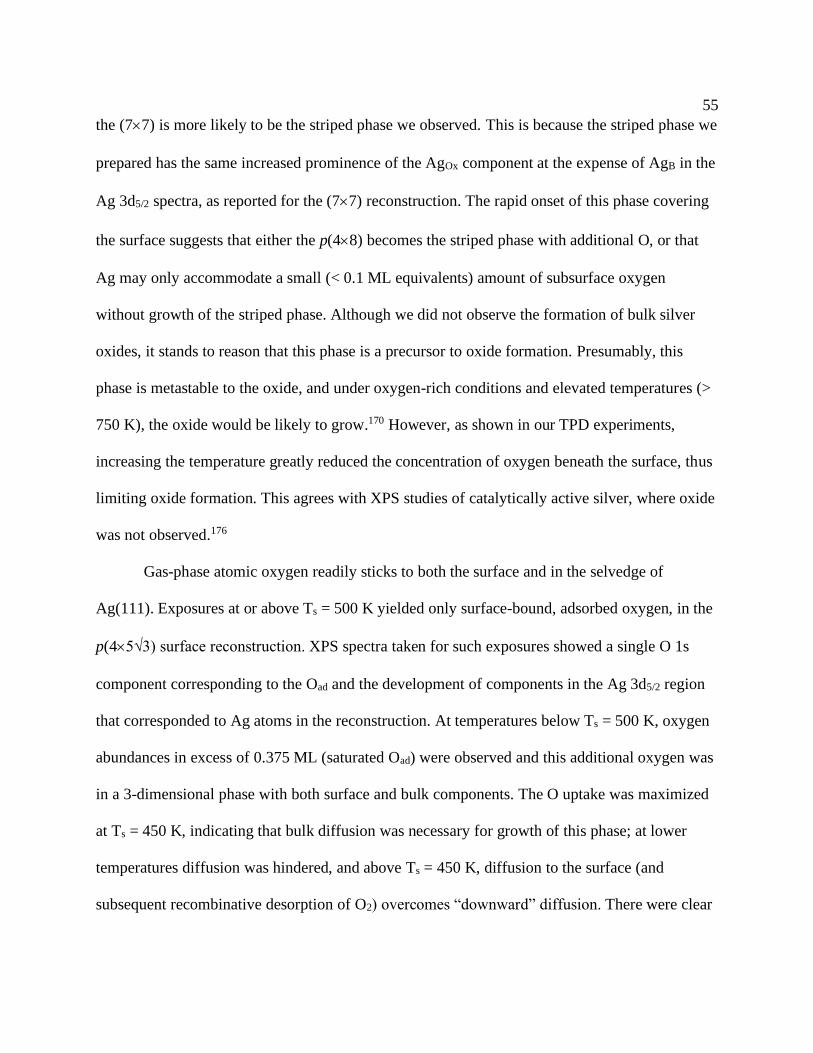
55
the (77) is more likely to be the striped phase we observed. This is because the striped phase we
prepared has the same increased prominence of the AgOx component at the expense of AgB in the
Ag 3d5/2 spectra, as reported for the (77) reconstruction. The rapid onset of this phase covering
the surface suggests that either the p(48) becomes the striped phase with additional O, or that
Ag may only accommodate a small (< 0.1 ML equivalents) amount of subsurface oxygen
without growth of the striped phase. Although we did not observe the formation of bulk silver
oxides, it stands to reason that this phase is a precursor to oxide formation. Presumably, this
phase is metastable to the oxide, and under oxygen-rich conditions and elevated temperatures (>
750 K), the oxide would be likely to grow.170 However, as shown in our TPD experiments,
increasing the temperature greatly reduced the concentration of oxygen beneath the surface, thus
limiting oxide formation. This agrees with XPS studies of catalytically active silver, where oxide
was not observed.176
Gas-phase atomic oxygen readily sticks to both the surface and in the selvedge of
Ag(111). Exposures at or above Ts = 500 K yielded only surface-bound, adsorbed oxygen, in the
p(45√3) surface reconstruction. XPS spectra taken for such exposures showed a single O 1s
component corresponding to the Oad and the development of components in the Ag 3d5/2 region
that corresponded to Ag atoms in the reconstruction. At temperatures below Ts = 500 K, oxygen
abundances in excess of 0.375 ML (saturated Oad) were observed and this additional oxygen was
in a 3-dimensional phase with both surface and bulk components. The O uptake was maximized
at Ts = 450 K, indicating that bulk diffusion was necessary for growth of this phase; at lower
temperatures diffusion was hindered, and above Ts = 450 K, diffusion to the surface (and
subsequent recombinative desorption of O2) overcomes “downward” diffusion. There were clear

56
XPS features corresponding to the 3-dimentionsal phase in both the O 1s and Ag 3d5/2 regions,
and this phase was stable up to 525 K, above which it decomposed as a sharp peak in the TPD
experiment. Because the striped phase is present at catalytically relevant temperatures (≈ 500 K)
and in an oxygen–rich environment, it possibly plays a role in partial oxidation reactions over
silver catalysts.
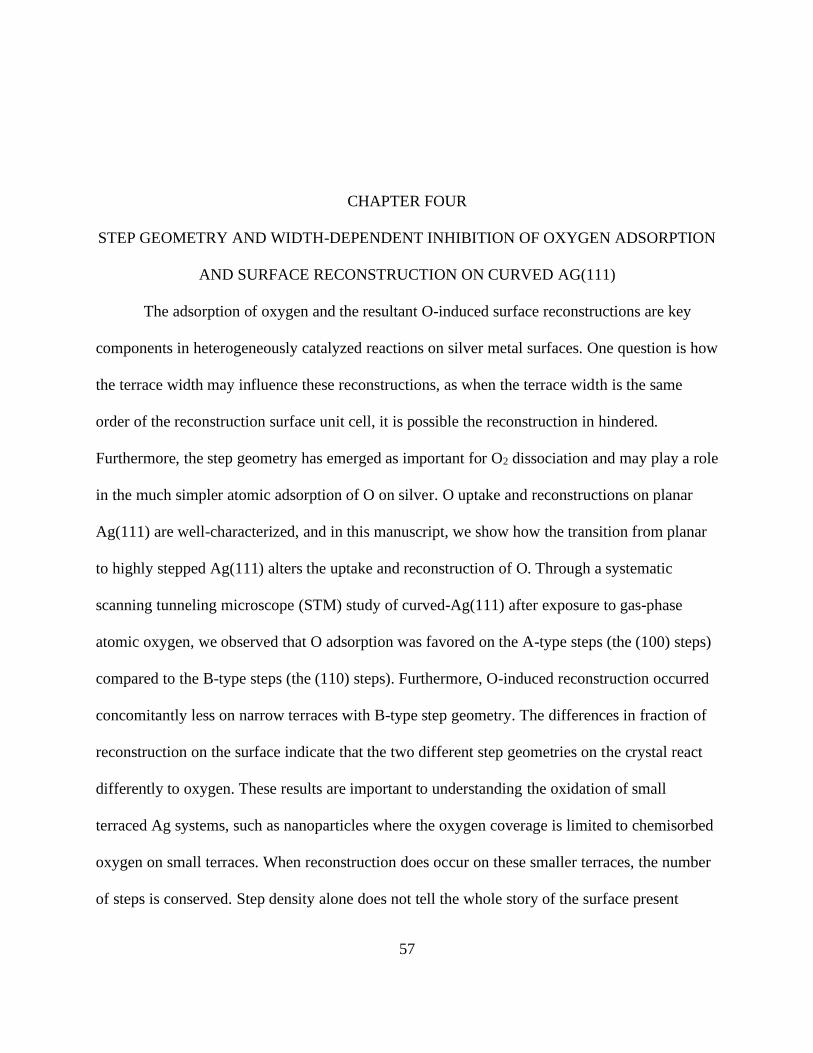
57
CHAPTER FOUR
STEP GEOMETRY AND WIDTH-DEPENDENT INHIBITION OF OXYGEN ADSORPTION
AND SURFACE RECONSTRUCTION ON CURVED AG(111)
The adsorption of oxygen and the resultant O-induced surface reconstructions are key
components in heterogeneously catalyzed reactions on silver metal surfaces. One question is how
the terrace width may influence these reconstructions, as when the terrace width is the same
order of the reconstruction surface unit cell, it is possible the reconstruction in hindered.
Furthermore, the step geometry has emerged as important for O2 dissociation and may play a role
in the much simpler atomic adsorption of O on silver. O uptake and reconstructions on planar
Ag(111) are well-characterized, and in this manuscript, we show how the transition from planar
to highly stepped Ag(111) alters the uptake and reconstruction of O. Through a systematic
scanning tunneling microscope (STM) study of curved-Ag(111) after exposure to gas-phase
atomic oxygen, we observed that O adsorption was favored on the A-type steps (the (100) steps)
compared to the B-type steps (the (110) steps). Furthermore, O-induced reconstruction occurred
concomitantly less on narrow terraces with B-type step geometry. The differences in fraction of
reconstruction on the surface indicate that the two different step geometries on the crystal react
differently to oxygen. These results are important to understanding the oxidation of small
terraced Ag systems, such as nanoparticles where the oxygen coverage is limited to chemisorbed
oxygen on small terraces. When reconstruction does occur on these smaller terraces, the number
of steps is conserved. Step density alone does not tell the whole story of the surface present
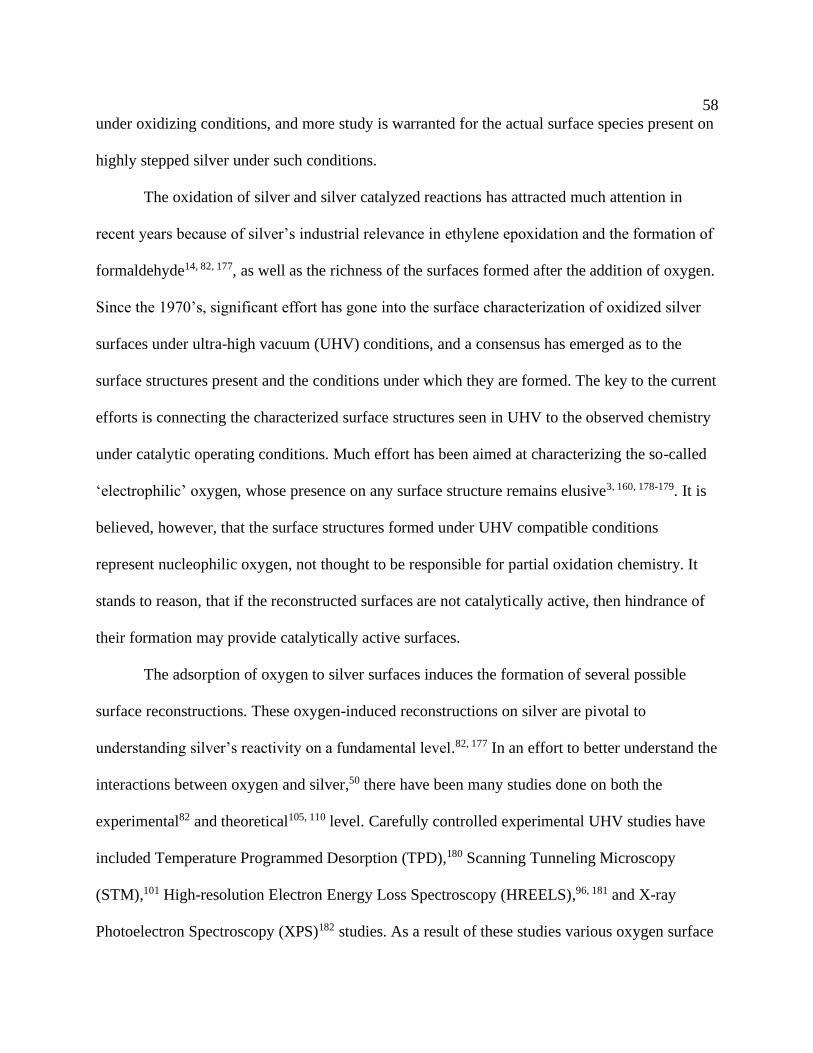
58
under oxidizing conditions, and more study is warranted for the actual surface species present on
highly stepped silver under such conditions.
The oxidation of silver and silver catalyzed reactions has attracted much attention in
recent years because of silver’s industrial relevance in ethylene epoxidation and the formation of
formaldehyde14, 82, 177, as well as the richness of the surfaces formed after the addition of oxygen.
Since the 1970’s, significant effort has gone into the surface characterization of oxidized silver
surfaces under ultra-high vacuum (UHV) conditions, and a consensus has emerged as to the
surface structures present and the conditions under which they are formed. The key to the current
efforts is connecting the characterized surface structures seen in UHV to the observed chemistry
under catalytic operating conditions. Much effort has been aimed at characterizing the so-called
‘electrophilic’ oxygen, whose presence on any surface structure remains elusive3, 160, 178-179. It is
believed, however, that the surface structures formed under UHV compatible conditions
represent nucleophilic oxygen, not thought to be responsible for partial oxidation chemistry. It
stands to reason, that if the reconstructed surfaces are not catalytically active, then hindrance of
their formation may provide catalytically active surfaces.
The adsorption of oxygen to silver surfaces induces the formation of several possible
surface reconstructions. These oxygen-induced reconstructions on silver are pivotal to
understanding silver’s reactivity on a fundamental level.82, 177 In an effort to better understand the
interactions between oxygen and silver,50 there have been many studies done on both the
experimental82 and theoretical105, 110 level. Carefully controlled experimental UHV studies have
included Temperature Programmed Desorption (TPD),180 Scanning Tunneling Microscopy
(STM),101 High-resolution Electron Energy Loss Spectroscopy (HREELS),96, 181 and X-ray
Photoelectron Spectroscopy (XPS)182 studies. As a result of these studies various oxygen surface
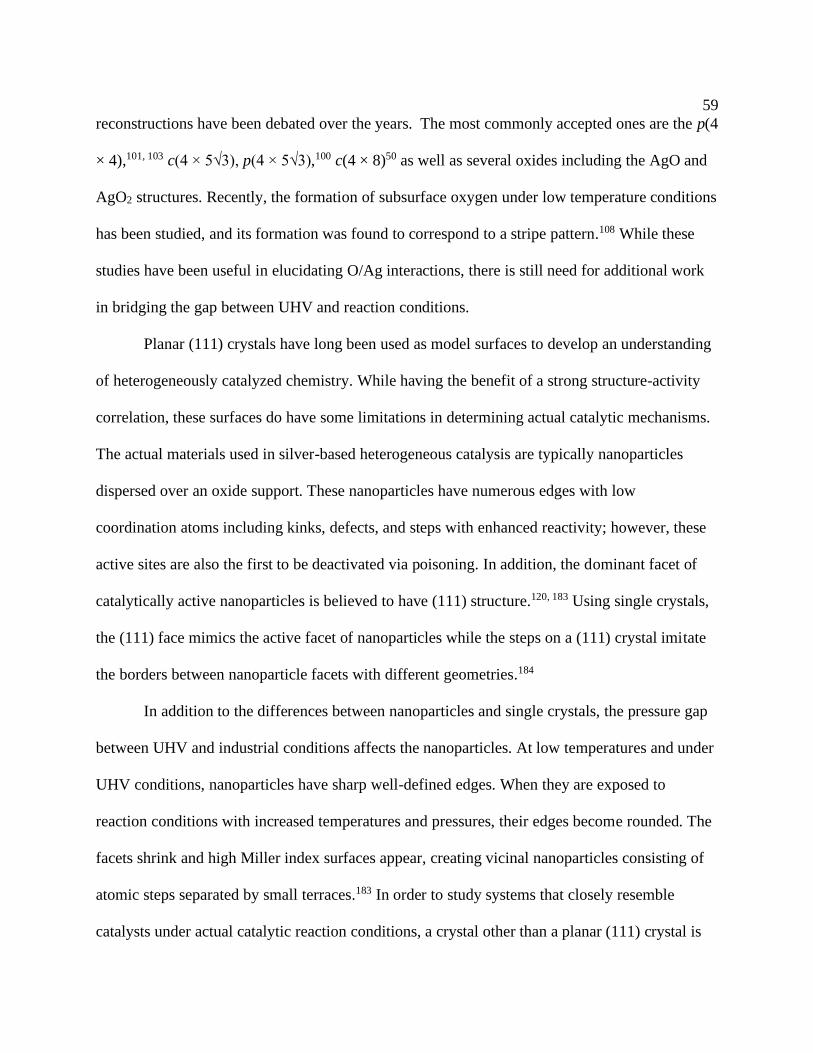
59
reconstructions have been debated over the years. The most commonly accepted ones are the p(4
× 4),101, 103 c(4 × 5√3), p(4 × 5√3),100 c(4 × 8)50 as well as several oxides including the AgO and
AgO2 structures. Recently, the formation of subsurface oxygen under low temperature conditions
has been studied, and its formation was found to correspond to a stripe pattern.108 While these
studies have been useful in elucidating O/Ag interactions, there is still need for additional work
in bridging the gap between UHV and reaction conditions.
Planar (111) crystals have long been used as model surfaces to develop an understanding
of heterogeneously catalyzed chemistry. While having the benefit of a strong structure-activity
correlation, these surfaces do have some limitations in determining actual catalytic mechanisms.
The actual materials used in silver-based heterogeneous catalysis are typically nanoparticles
dispersed over an oxide support. These nanoparticles have numerous edges with low
coordination atoms including kinks, defects, and steps with enhanced reactivity; however, these
active sites are also the first to be deactivated via poisoning. In addition, the dominant facet of
catalytically active nanoparticles is believed to have (111) structure.120, 183 Using single crystals,
the (111) face mimics the active facet of nanoparticles while the steps on a (111) crystal imitate
the borders between nanoparticle facets with different geometries.184
In addition to the differences between nanoparticles and single crystals, the pressure gap
between UHV and industrial conditions affects the nanoparticles. At low temperatures and under
UHV conditions, nanoparticles have sharp well-defined edges. When they are exposed to
reaction conditions with increased temperatures and pressures, their edges become rounded. The
facets shrink and high Miller index surfaces appear, creating vicinal nanoparticles consisting of
atomic steps separated by small terraces.183 In order to study systems that closely resemble
catalysts under actual catalytic reaction conditions, a crystal other than a planar (111) crystal is
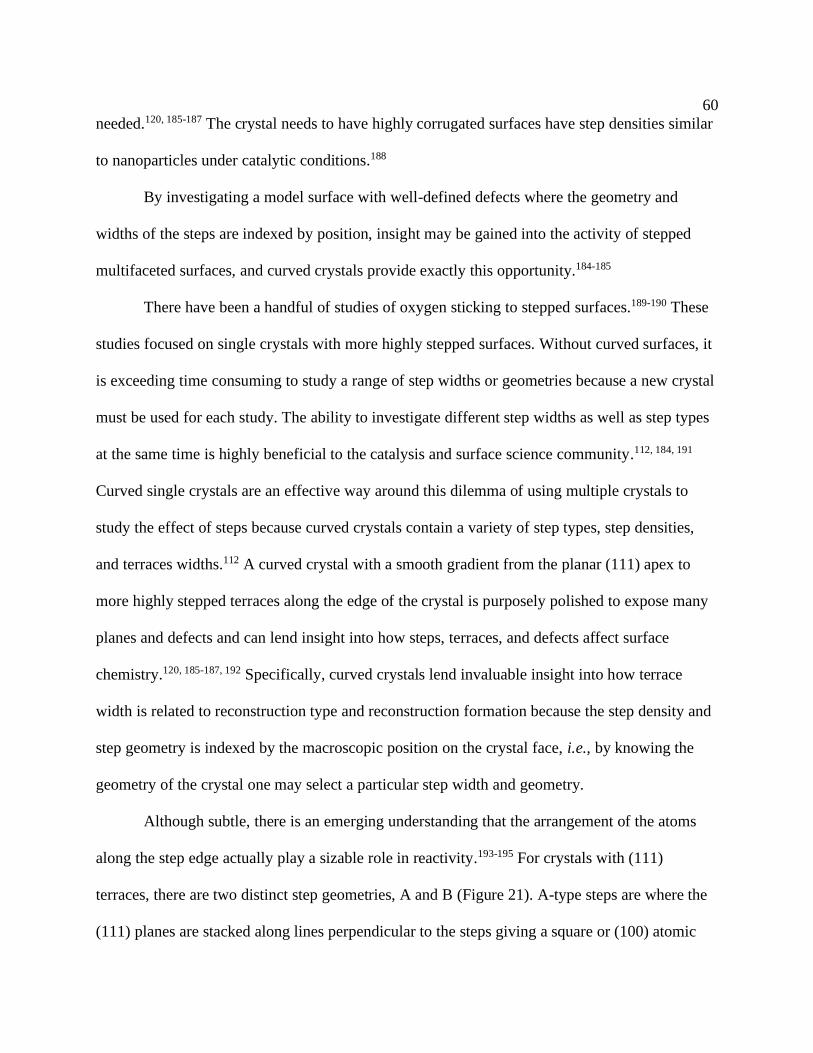
60
needed.120, 185-187 The crystal needs to have highly corrugated surfaces have step densities similar
to nanoparticles under catalytic conditions.188
By investigating a model surface with well-defined defects where the geometry and
widths of the steps are indexed by position, insight may be gained into the activity of stepped
multifaceted surfaces, and curved crystals provide exactly this opportunity.184-185
There have been a handful of studies of oxygen sticking to stepped surfaces.189-190 These
studies focused on single crystals with more highly stepped surfaces. Without curved surfaces, it
is exceeding time consuming to study a range of step widths or geometries because a new crystal
must be used for each study. The ability to investigate different step widths as well as step types
at the same time is highly beneficial to the catalysis and surface science community.112, 184, 191
Curved single crystals are an effective way around this dilemma of using multiple crystals to
study the effect of steps because curved crystals contain a variety of step types, step densities,
and terraces widths.112 A curved crystal with a smooth gradient from the planar (111) apex to
more highly stepped terraces along the edge of the crystal is purposely polished to expose many
planes and defects and can lend insight into how steps, terraces, and defects affect surface
chemistry.120, 185-187, 192 Specifically, curved crystals lend invaluable insight into how terrace
width is related to reconstruction type and reconstruction formation because the step density and
step geometry is indexed by the macroscopic position on the crystal face, i.e., by knowing the
geometry of the crystal one may select a particular step width and geometry.
Although subtle, there is an emerging understanding that the arrangement of the atoms
along the step edge actually play a sizable role in reactivity.193-195 For crystals with (111)
terraces, there are two distinct step geometries, A and B (Figure 21). A-type steps are where the
(111) planes are stacked along lines perpendicular to the steps giving a square or (100) atomic
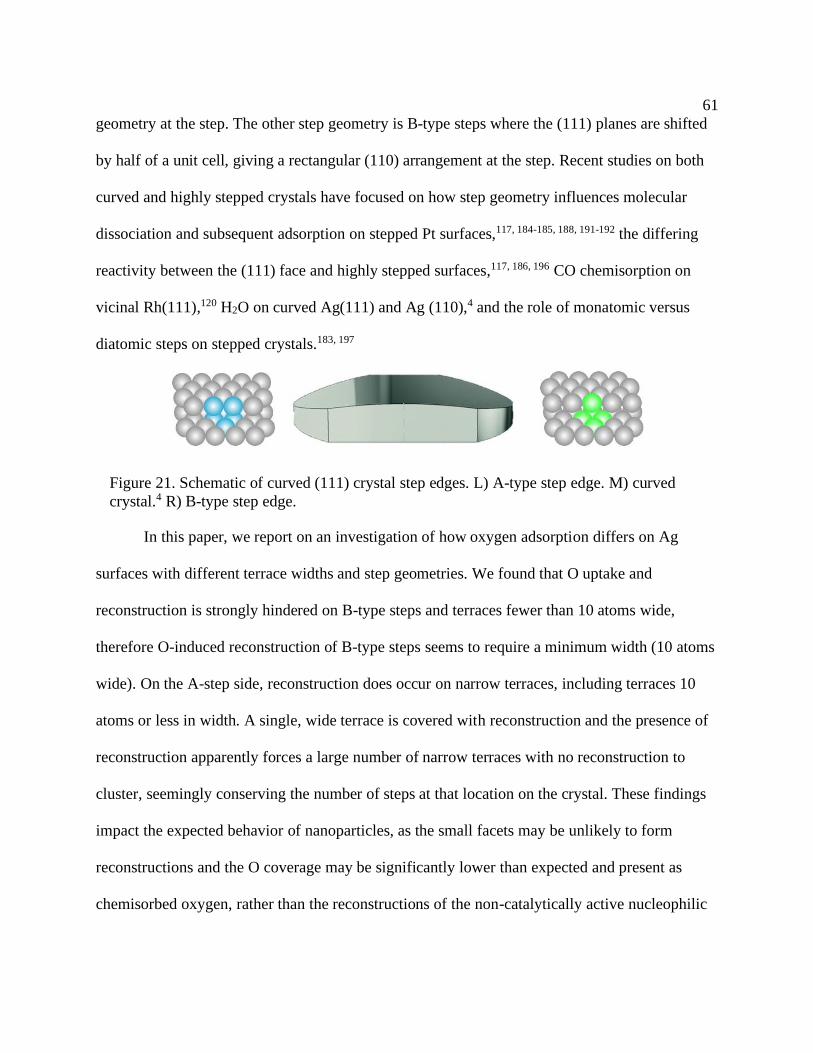
61
geometry at the step. The other step geometry is B-type steps where the (111) planes are shifted
by half of a unit cell, giving a rectangular (110) arrangement at the step. Recent studies on both
curved and highly stepped crystals have focused on how step geometry influences molecular
dissociation and subsequent adsorption on stepped Pt surfaces,117, 184-185, 188, 191-192 the differing
reactivity between the (111) face and highly stepped surfaces,117, 186, 196 CO chemisorption on
vicinal Rh(111),120 H2O on curved Ag(111) and Ag (110),4 and the role of monatomic versus
diatomic steps on stepped crystals.183, 197
In this paper, we report on an investigation of how oxygen adsorption differs on Ag
surfaces with different terrace widths and step geometries. We found that O uptake and
reconstruction is strongly hindered on B-type steps and terraces fewer than 10 atoms wide,
therefore O-induced reconstruction of B-type steps seems to require a minimum width (10 atoms
wide). On the A-step side, reconstruction does occur on narrow terraces, including terraces 10
atoms or less in width. A single, wide terrace is covered with reconstruction and the presence of
reconstruction apparently forces a large number of narrow terraces with no reconstruction to
cluster, seemingly conserving the number of steps at that location on the crystal. These findings
impact the expected behavior of nanoparticles, as the small facets may be unlikely to form
reconstructions and the O coverage may be significantly lower than expected and present as
chemisorbed oxygen, rather than the reconstructions of the non-catalytically active nucleophilic
Figure 21. Schematic of curved (111) crystal step edges. L) A-type step edge. M) curved
crystal.4 R) B-type step edge.
62
oxygen. This insight into the activity of oxidized nanoparticles shows that nanoparticles may
self-limit oxygen coverage on the catalytically active planes.
Experiments were performed in an ultra-high vacuum scanning tunneling microscope
(UHV-STM) system previously described.51 The chamber consists of two interconnected
chambers, a preparation chamber (base pressure of 1 × 10 –10 Torr) and an STM chamber (base
pressure of 4 × 11 –11 Torr). The preparation chamber is equipped with a variety of surface
science techniques including a Specs ErLEED 150 with 3000D controller (LEED), a PHI 10–155
Auger Electron Spectrometer (AES), and a Hiden HAL 3F 301 RC quadrupole mass
spectrometer (QMS) for temperature programmed desorption (TPD) analysis.
The curved Ag(111) crystal (c-Ag(111)) was obtained from Surface Preparation Labs
(Zaandam, NL) and was described in detail in a previous publication.4 The c-Ag(111) was cut at
a 31° angle from a circular cylindrical crystal and polished to expose the (111) surface at the
apex, the (110) steps or B-type steps on one side, and the (100) or A-type steps on the other side.
The crystal length was 6 mm. The step density at a chosen distance from the apex could be
calculated from the crystal geometry, with STM imaging confirming the calculations. The STM
tip had a range of about 4.3 mm at the ≈ 30 K temperatures where images were obtained, which
allowed for imaging from about 3 mm off the apex in the B (denoted +) direction to about 2 mm
off the apex in the A (denoted –) direction.
The curved Ag(111) crystal was mounted on an exchangeable tantalum (Ta) sample plate
by welding to two supporting Ta wires underneath the crystal. A type K thermocouple was
welded directly to the back of the crystal for accurate temperature reading. The crystal was
cooled using a liquid nitrogen-cooling loop to 100 K and heated using electron beam heating to
700 K. The crystal was cleaned with repeated cycles of Ar+ sputtering and subsequent annealing
63
at 670 K. A 670 K anneal was sufficient to clean the crystal between experiments. LEED
confirmed the presence of a crisp 1×1 pattern when the crystal was centered. Spot splitting in the
LEED was evident when the crystal was moved off center in both A and B directions as reported
previously.4
Atomic oxygen (AO) was generated by backfilling the preparation chamber with O2 (P =
5 × 10 -7 Torr) that was thermally cracked over a hot Ir filament positioned about 1- 2 mm from
the face of the crystal. The AO exposure across the crystal face was uniform and normal to the
top (111) facet; the curvature resulted in only modest attenuation of the AO flux towards the
edges of the crystal and was uniform on both sides. In between AO doses, the crystal was
sputtered and annealed to clean. Imaging done of the cleaned crystal between AO doses showed
regular steps and terraces indicating that prolonged AO exposures at high T did not affect the
crystal structure.
The STM chamber houses a Pan Style RHK Scanning Tunneling Microscope with a
closed cycle helium cryostat that can reach a base temperature of 30 K or below. All images
were taken at 35 K. STM tips were fashioned using the cut and pull technique from 0.25 mm
diameter 80% Pt, 20% Ir wire. All images were recorded in constant current mode and were
processed using the Gwyddion software package (available at http://gwyddion.net). The images
used for publication were limitedly processed (e.g., cropping, mean plane subtraction or three-
point plane subtraction, and/or removal of streaks or blemishes). Line profiling was done on
uncorrected STM images, and this STM data was used for determination of terrace widths and
step densities.
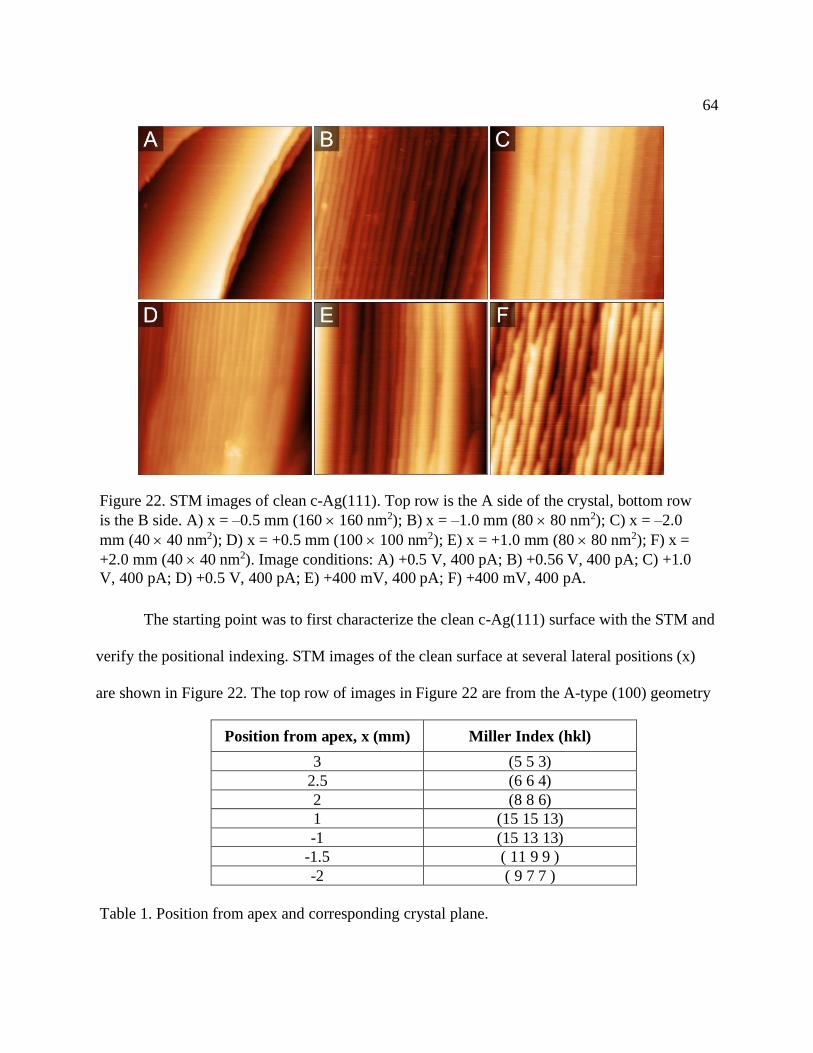
64
The starting point was to first characterize the clean c-Ag(111) surface with the STM and
verify the positional indexing. STM images of the clean surface at several lateral positions (x)
are shown in Figure 22. The top row of images in Figure 22 are from the A-type (100) geometry
Figure 22. STM images of clean c-Ag(111). Top row is the A side of the crystal, bottom row
is the B side. A) x = –0.5 mm (160 160 nm2); B) x = –1.0 mm (80 80 nm2); C) x = –2.0
mm (40 40 nm2); D) x = +0.5 mm (100 100 nm2); E) x = +1.0 mm (80 80 nm2); F) x =
+2.0 mm (40 40 nm2). Image conditions: A) +0.5 V, 400 pA; B) +0.56 V, 400 pA; C) +1.0
V, 400 pA; D) +0.5 V, 400 pA; E) +400 mV, 400 pA; F) +400 mV, 400 pA.
Position from apex, x (mm) Miller Index (hkl)
3 (5 5 3)
2.5 (6 6 4)
2 (8 8 6)
1 (15 15 13)
-1 (15 13 13)
-1.5 ( 11 9 9 )
-2 ( 9 7 7 )
Table 1. Position from apex and corresponding crystal plane.
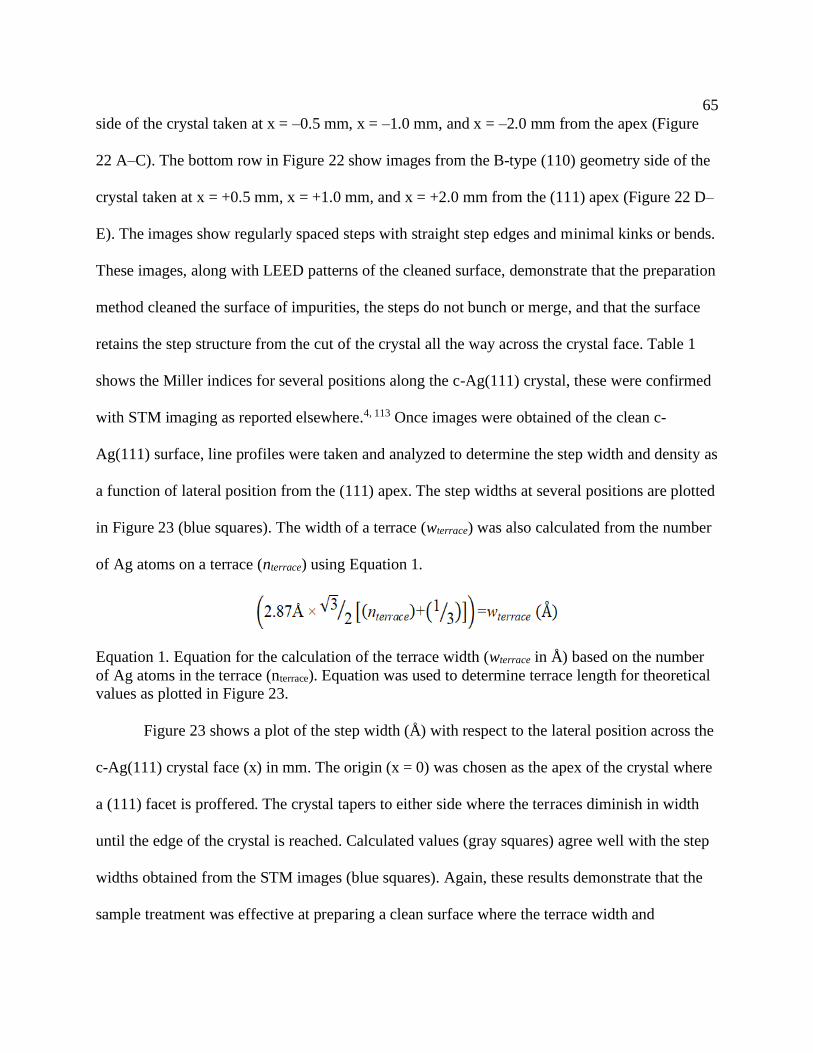
65
side of the crystal taken at x = –0.5 mm, x = –1.0 mm, and x = –2.0 mm from the apex (Figure
22 A–C). The bottom row in Figure 22 show images from the B-type (110) geometry side of the
crystal taken at x = +0.5 mm, x = +1.0 mm, and x = +2.0 mm from the (111) apex (Figure 22 D–
E). The images show regularly spaced steps with straight step edges and minimal kinks or bends.
These images, along with LEED patterns of the cleaned surface, demonstrate that the preparation
method cleaned the surface of impurities, the steps do not bunch or merge, and that the surface
retains the step structure from the cut of the crystal all the way across the crystal face. Table 1
shows the Miller indices for several positions along the c-Ag(111) crystal, these were confirmed
with STM imaging as reported elsewhere.4, 113 Once images were obtained of the clean c-
Ag(111) surface, line profiles were taken and analyzed to determine the step width and density as
a function of lateral position from the (111) apex. The step widths at several positions are plotted
in Figure 23 (blue squares). The width of a terrace (wterrace) was also calculated from the number
of Ag atoms on a terrace (nterrace) using Equation 1.
Equation 1. Equation for the calculation of the terrace width (wterrace in Å) based on the number
of Ag atoms in the terrace (nterrace). Equation was used to determine terrace length for theoretical
values as plotted in Figure 23.
Figure 23 shows a plot of the step width (Å) with respect to the lateral position across the
c-Ag(111) crystal face (x) in mm. The origin (x = 0) was chosen as the apex of the crystal where
a (111) facet is proffered. The crystal tapers to either side where the terraces diminish in width
until the edge of the crystal is reached. Calculated values (gray squares) agree well with the step
widths obtained from the STM images (blue squares). Again, these results demonstrate that the
sample treatment was effective at preparing a clean surface where the terrace width and
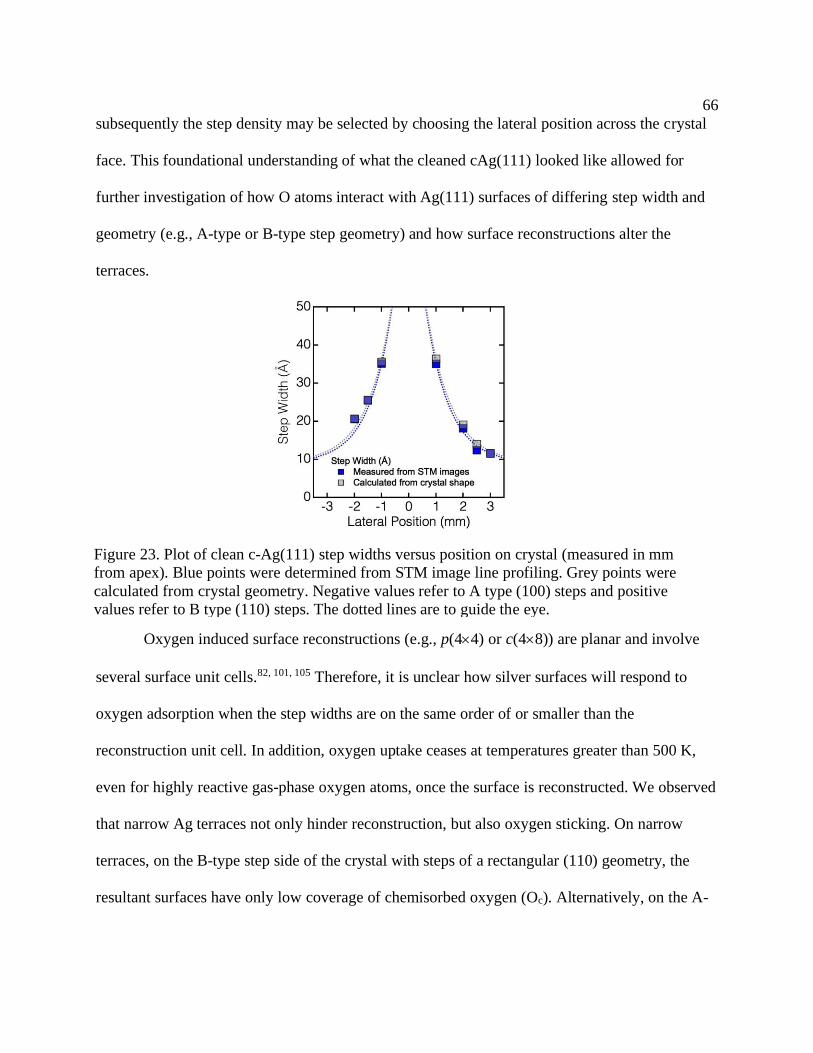
66
subsequently the step density may be selected by choosing the lateral position across the crystal
face. This foundational understanding of what the cleaned cAg(111) looked like allowed for
further investigation of how O atoms interact with Ag(111) surfaces of differing step width and
geometry (e.g., A-type or B-type step geometry) and how surface reconstructions alter the
terraces.
Oxygen induced surface reconstructions (e.g., p(44) or c(48)) are planar and involve
several surface unit cells.82, 101, 105 Therefore, it is unclear how silver surfaces will respond to
oxygen adsorption when the step widths are on the same order of or smaller than the
reconstruction unit cell. In addition, oxygen uptake ceases at temperatures greater than 500 K,
even for highly reactive gas-phase oxygen atoms, once the surface is reconstructed. We observed
that narrow Ag terraces not only hinder reconstruction, but also oxygen sticking. On narrow
terraces, on the B-type step side of the crystal with steps of a rectangular (110) geometry, the
resultant surfaces have only low coverage of chemisorbed oxygen (Oc). Alternatively, on the A-
Figure 23. Plot of clean c-Ag(111) step widths versus position on crystal (measured in mm
from apex). Blue points were determined from STM image line profiling. Grey points were
calculated from crystal geometry. Negative values refer to A type (100) steps and positive
values refer to B type (110) steps. The dotted lines are to guide the eye.
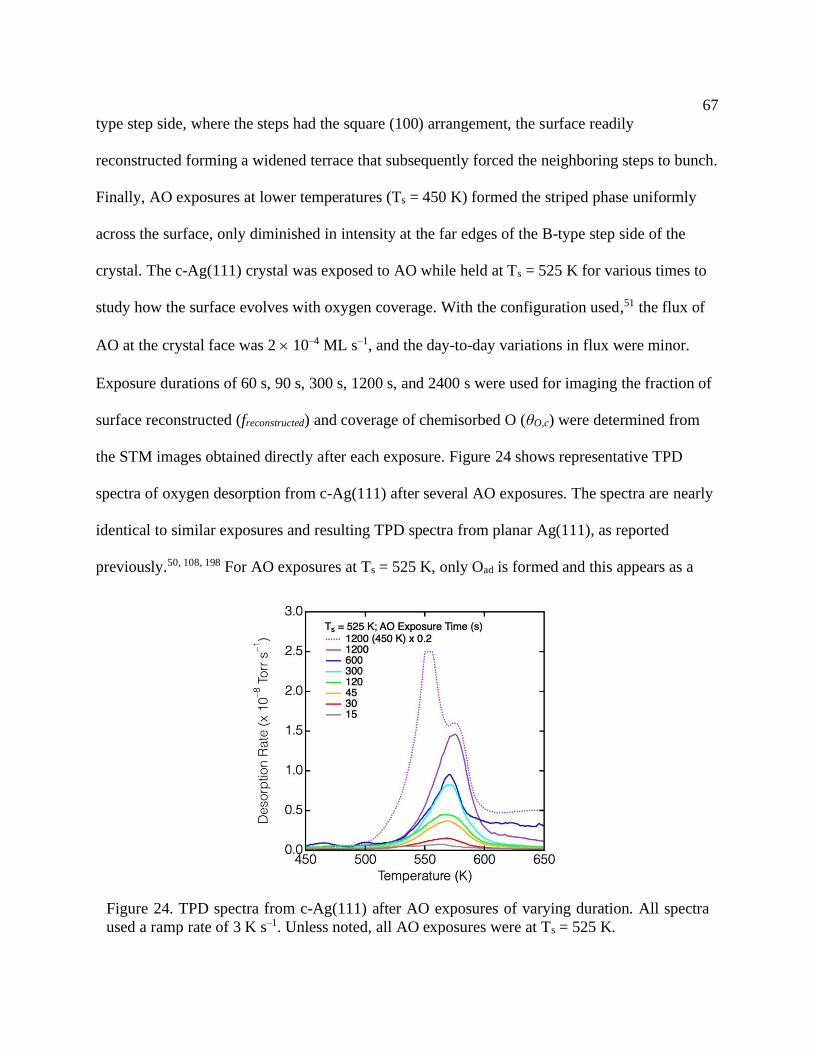
67
type step side, where the steps had the square (100) arrangement, the surface readily
reconstructed forming a widened terrace that subsequently forced the neighboring steps to bunch.
Finally, AO exposures at lower temperatures (Ts = 450 K) formed the striped phase uniformly
across the surface, only diminished in intensity at the far edges of the B-type step side of the
crystal. The c-Ag(111) crystal was exposed to AO while held at Ts = 525 K for various times to
study how the surface evolves with oxygen coverage. With the configuration used,51 the flux of
AO at the crystal face was 2 10–4 ML s–1, and the day-to-day variations in flux were minor.
Exposure durations of 60 s, 90 s, 300 s, 1200 s, and 2400 s were used for imaging the fraction of
surface reconstructed (freconstructed) and coverage of chemisorbed O (θO,c) were determined from
the STM images obtained directly after each exposure. Figure 24 shows representative TPD
spectra of oxygen desorption from c-Ag(111) after several AO exposures. The spectra are nearly
identical to similar exposures and resulting TPD spectra from planar Ag(111), as reported
previously.50, 108, 198 For AO exposures at Ts = 525 K, only Oad is formed and this appears as a
Figure 24. TPD spectra from c-Ag(111) after AO exposures of varying duration. All spectra
used a ramp rate of 3 K s–1. Unless noted, all AO exposures were at Ts = 525 K.
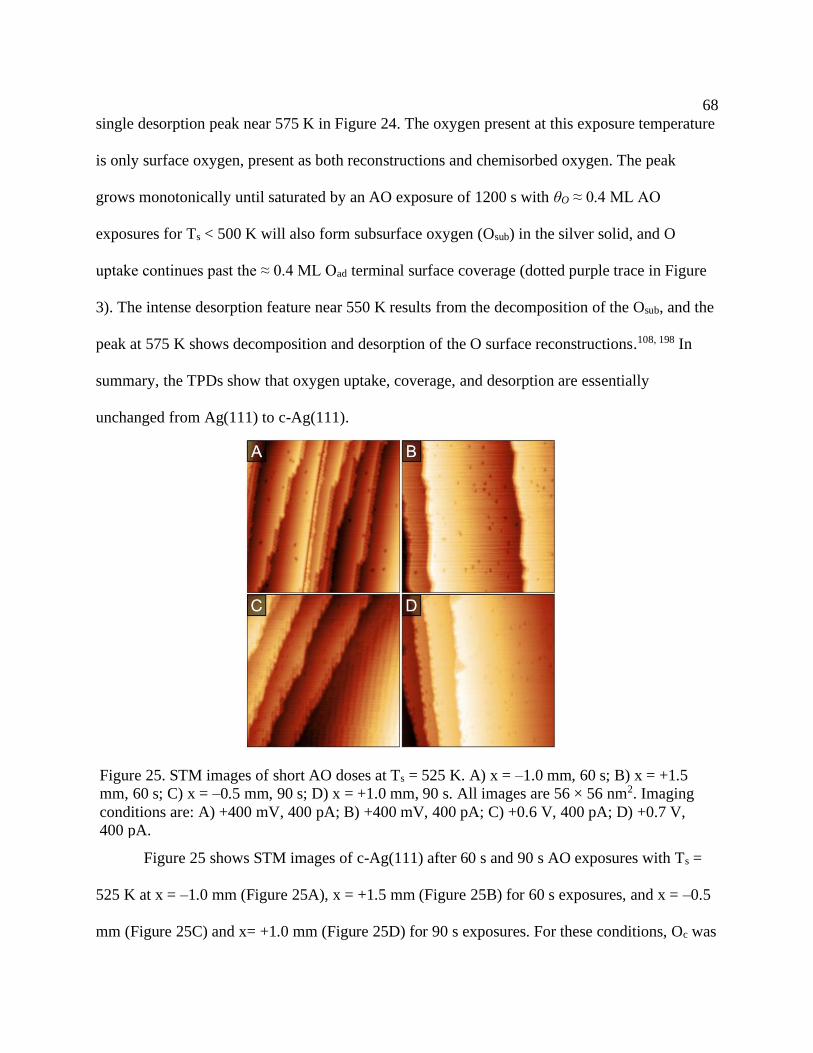
68
single desorption peak near 575 K in Figure 24. The oxygen present at this exposure temperature
is only surface oxygen, present as both reconstructions and chemisorbed oxygen. The peak
grows monotonically until saturated by an AO exposure of 1200 s with θO ≈ 0.4 ML AO
exposures for Ts < 500 K will also form subsurface oxygen (Osub) in the silver solid, and O
uptake continues past the ≈ 0.4 ML Oad terminal surface coverage (dotted purple trace in Figure
3). The intense desorption feature near 550 K results from the decomposition of the Osub, and the
peak at 575 K shows decomposition and desorption of the O surface reconstructions.108, 198 In
summary, the TPDs show that oxygen uptake, coverage, and desorption are essentially
unchanged from Ag(111) to c-Ag(111).
Figure 25 shows STM images of c-Ag(111) after 60 s and 90 s AO exposures with Ts =
525 K at x = –1.0 mm (Figure 25A), x = +1.5 mm (Figure 25B) for 60 s exposures, and x = –0.5
mm (Figure 25C) and x= +1.0 mm (Figure 25D) for 90 s exposures. For these conditions, Oc was
Figure 25. STM images of short AO doses at Ts = 525 K. A) x = –1.0 mm, 60 s; B) x = +1.5
mm, 60 s; C) x = –0.5 mm, 90 s; D) x = +1.0 mm, 90 s. All images are 56 × 56 nm2. Imaging
conditions are: A) +400 mV, 400 pA; B) +400 mV, 400 pA; C) +0.6 V, 400 pA; D) +0.7 V,
400 pA.
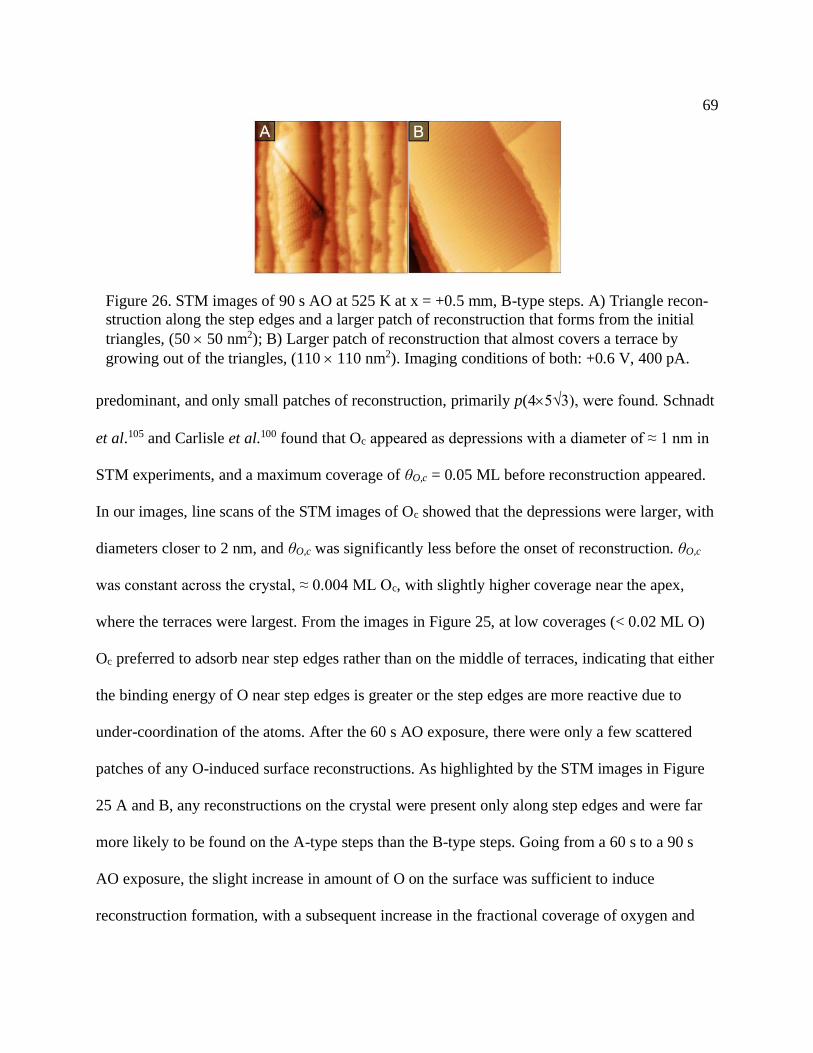
69
predominant, and only small patches of reconstruction, primarily p(45√3), were found. Schnadt
et al.105 and Carlisle et al.100 found that Oc appeared as depressions with a diameter of ≈ 1 nm in
STM experiments, and a maximum coverage of θO,c = 0.05 ML before reconstruction appeared.
In our images, line scans of the STM images of Oc showed that the depressions were larger, with
diameters closer to 2 nm, and θO,c was significantly less before the onset of reconstruction. θO,c
was constant across the crystal, ≈ 0.004 ML Oc, with slightly higher coverage near the apex,
where the terraces were largest. From the images in Figure 25, at low coverages (< 0.02 ML O)
Oc preferred to adsorb near step edges rather than on the middle of terraces, indicating that either
the binding energy of O near step edges is greater or the step edges are more reactive due to
under-coordination of the atoms. After the 60 s AO exposure, there were only a few scattered
patches of any O-induced surface reconstructions. As highlighted by the STM images in Figure
25 A and B, any reconstructions on the crystal were present only along step edges and were far
more likely to be found on the A-type steps than the B-type steps. Going from a 60 s to a 90 s
AO exposure, the slight increase in amount of O on the surface was sufficient to induce
reconstruction formation, with a subsequent increase in the fractional coverage of oxygen and
Figure 26. STM images of 90 s AO at 525 K at x = +0.5 mm, B-type steps. A) Triangle recon-
struction along the step edges and a larger patch of reconstruction that forms from the initial
triangles, (50 50 nm2); B) Larger patch of reconstruction that almost covers a terrace by
growing out of the triangles, (110 110 nm2). Imaging conditions of both: +0.6 V, 400 pA.
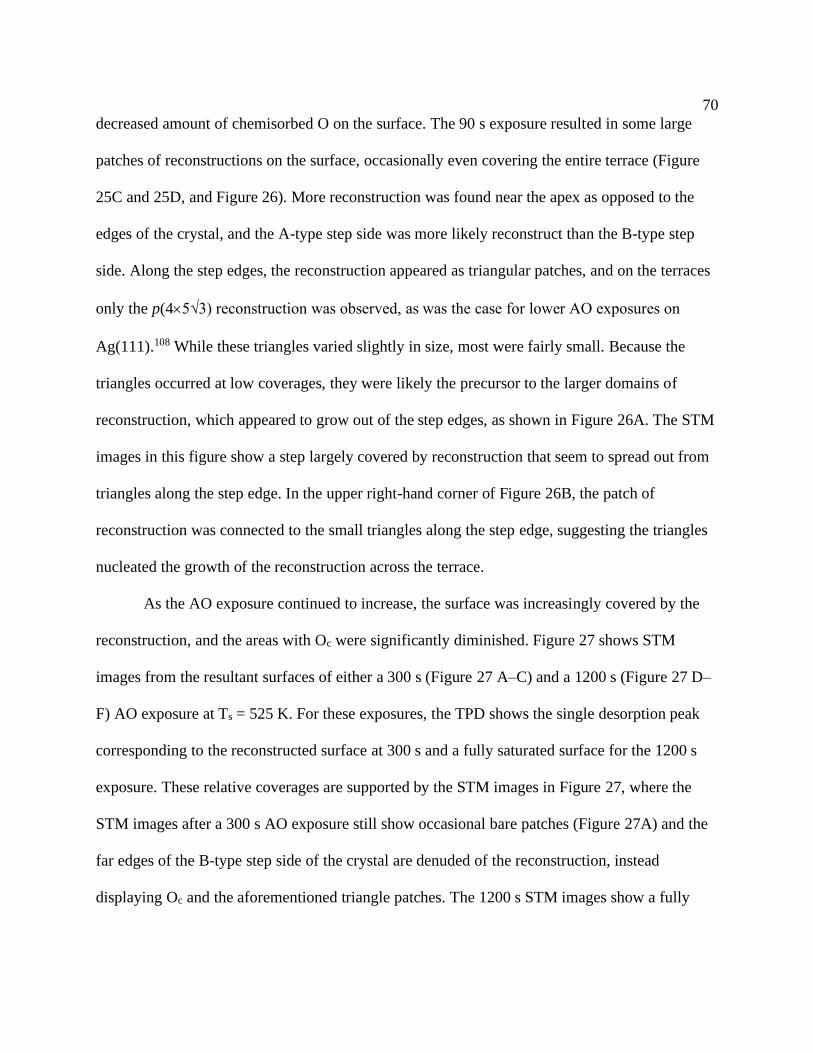
70
decreased amount of chemisorbed O on the surface. The 90 s exposure resulted in some large
patches of reconstructions on the surface, occasionally even covering the entire terrace (Figure
25C and 25D, and Figure 26). More reconstruction was found near the apex as opposed to the
edges of the crystal, and the A-type step side was more likely reconstruct than the B-type step
side. Along the step edges, the reconstruction appeared as triangular patches, and on the terraces
only the p(45√3) reconstruction was observed, as was the case for lower AO exposures on
Ag(111).108 While these triangles varied slightly in size, most were fairly small. Because the
triangles occurred at low coverages, they were likely the precursor to the larger domains of
reconstruction, which appeared to grow out of the step edges, as shown in Figure 26A. The STM
images in this figure show a step largely covered by reconstruction that seem to spread out from
triangles along the step edge. In the upper right-hand corner of Figure 26B, the patch of
reconstruction was connected to the small triangles along the step edge, suggesting the triangles
nucleated the growth of the reconstruction across the terrace.
As the AO exposure continued to increase, the surface was increasingly covered by the
reconstruction, and the areas with Oc were significantly diminished. Figure 27 shows STM
images from the resultant surfaces of either a 300 s (Figure 27 A–C) and a 1200 s (Figure 27 D–
F) AO exposure at Ts = 525 K. For these exposures, the TPD shows the single desorption peak
corresponding to the reconstructed surface at 300 s and a fully saturated surface for the 1200 s
exposure. These relative coverages are supported by the STM images in Figure 27, where the
STM images after a 300 s AO exposure still show occasional bare patches (Figure 27A) and the
far edges of the B-type step side of the crystal are denuded of the reconstruction, instead
displaying Oc and the aforementioned triangle patches. The 1200 s STM images show a fully
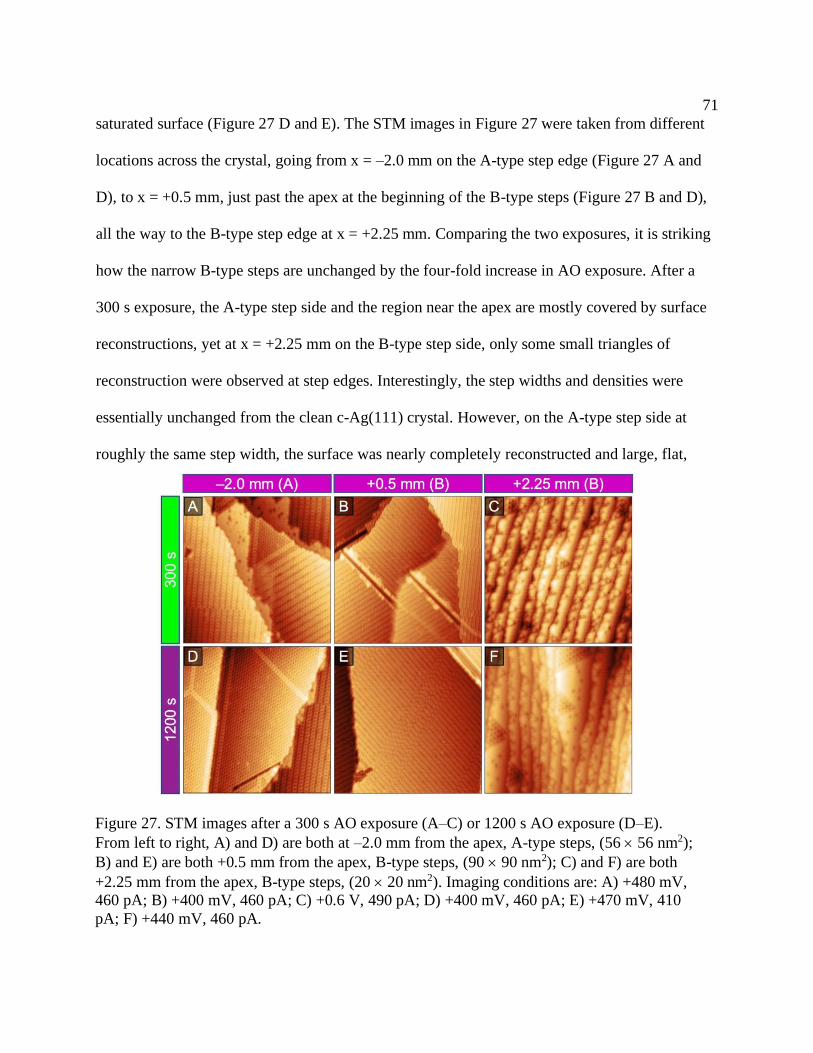
71
saturated surface (Figure 27 D and E). The STM images in Figure 27 were taken from different
locations across the crystal, going from x = –2.0 mm on the A-type step edge (Figure 27 A and
D), to x = +0.5 mm, just past the apex at the beginning of the B-type steps (Figure 27 B and D),
all the way to the B-type step edge at x = +2.25 mm. Comparing the two exposures, it is striking
how the narrow B-type steps are unchanged by the four-fold increase in AO exposure. After a
300 s exposure, the A-type step side and the region near the apex are mostly covered by surface
reconstructions, yet at x = +2.25 mm on the B-type step side, only some small triangles of
reconstruction were observed at step edges. Interestingly, the step widths and densities were
essentially unchanged from the clean c-Ag(111) crystal. However, on the A-type step side at
roughly the same step width, the surface was nearly completely reconstructed and large, flat,
Figure 27. STM images after a 300 s AO exposure (A–C) or 1200 s AO exposure (D–E).
From left to right, A) and D) are both at –2.0 mm from the apex, A-type steps, (56 56 nm2);
B) and E) are both +0.5 mm from the apex, B-type steps, (90 90 nm2); C) and F) are both
+2.25 mm from the apex, B-type steps, (20 20 nm2). Imaging conditions are: A) +480 mV,
460 pA; B) +400 mV, 460 pA; C) +0.6 V, 490 pA; D) +400 mV, 460 pA; E) +470 mV, 410
pA; F) +440 mV, 460 pA.
72
domains of reconstruction abound. The increased exposure to 1200 s show only modest changes,
as the areas largely reconstructed after 300 s AO are now almost completely covered after the
1200 s exposure. However, the images from x = +2.25 mm, the B-type step edge, had only
slightly more triangle shaped reconstructions, and the surface remains still highly stepped with
roughly the same step density as the clean c-Ag(111) at this position. Despite the extensive AO
exposure, the O did not stick to the Ag surface with narrow (< 15 Å) step widths and with the
close-packed B-type (110) step geometry. Steps with similar widths on the A-type side of the
crystal were extensively reconstructed and planar. These images suggest that the reconstruction
was unable to form on the narrow B-type steps with the (110) geometry, thus preventing incident
O from sticking to the surface of these narrow B-type terraces.
Figure 28. 40 40 nm2 STM image at x = +1.5 mm (B-type steps) after 1200 s AO exposure
at Ts = 525 K. The right of the image shows step bunching with limited reconstruction, and
the terrace shows a mix of p(44) and some p(45√3) reconstructions as well as an area of a
striated phase. The inset (22 22 nm2) shows the striated phase in greater detail. Imaging
conditions +450 mV, 410 pA.
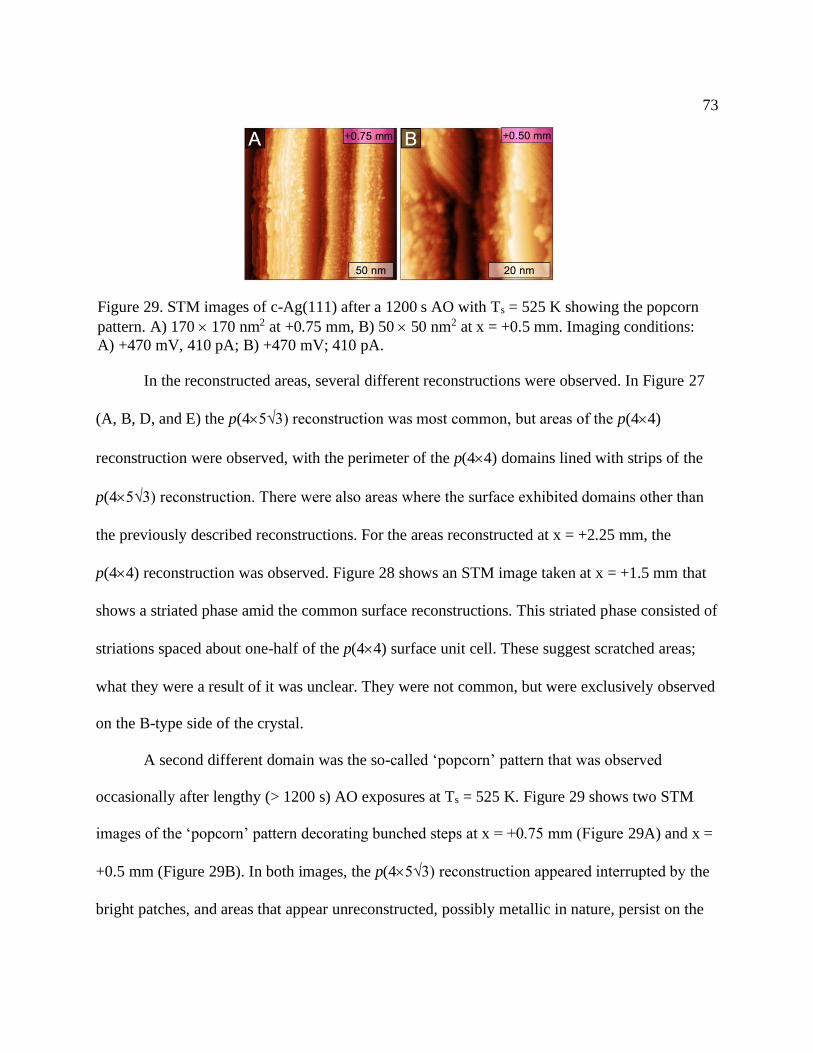
73
In the reconstructed areas, several different reconstructions were observed. In Figure 27
(A, B, D, and E) the p(45√3) reconstruction was most common, but areas of the p(44)
reconstruction were observed, with the perimeter of the p(44) domains lined with strips of the
p(45√3) reconstruction. There were also areas where the surface exhibited domains other than
the previously described reconstructions. For the areas reconstructed at x = +2.25 mm, the
p(44) reconstruction was observed. Figure 28 shows an STM image taken at x = +1.5 mm that
shows a striated phase amid the common surface reconstructions. This striated phase consisted of
striations spaced about one-half of the p(44) surface unit cell. These suggest scratched areas;
what they were a result of it was unclear. They were not common, but were exclusively observed
on the B-type side of the crystal.
A second different domain was the so-called ‘popcorn’ pattern that was observed
occasionally after lengthy (> 1200 s) AO exposures at Ts = 525 K. Figure 29 shows two STM
images of the ‘popcorn’ pattern decorating bunched steps at x = +0.75 mm (Figure 29A) and x =
+0.5 mm (Figure 29B). In both images, the p(45√3) reconstruction appeared interrupted by the
bright patches, and areas that appear unreconstructed, possibly metallic in nature, persist on the
Figure 29. STM images of c-Ag(111) after a 1200 s AO with Ts = 525 K showing the popcorn
pattern. A) 170 170 nm2 at +0.75 mm, B) 50 50 nm2 at x = +0.5 mm. Imaging conditions:
A) +470 mV, 410 pA; B) +470 mV; 410 pA.
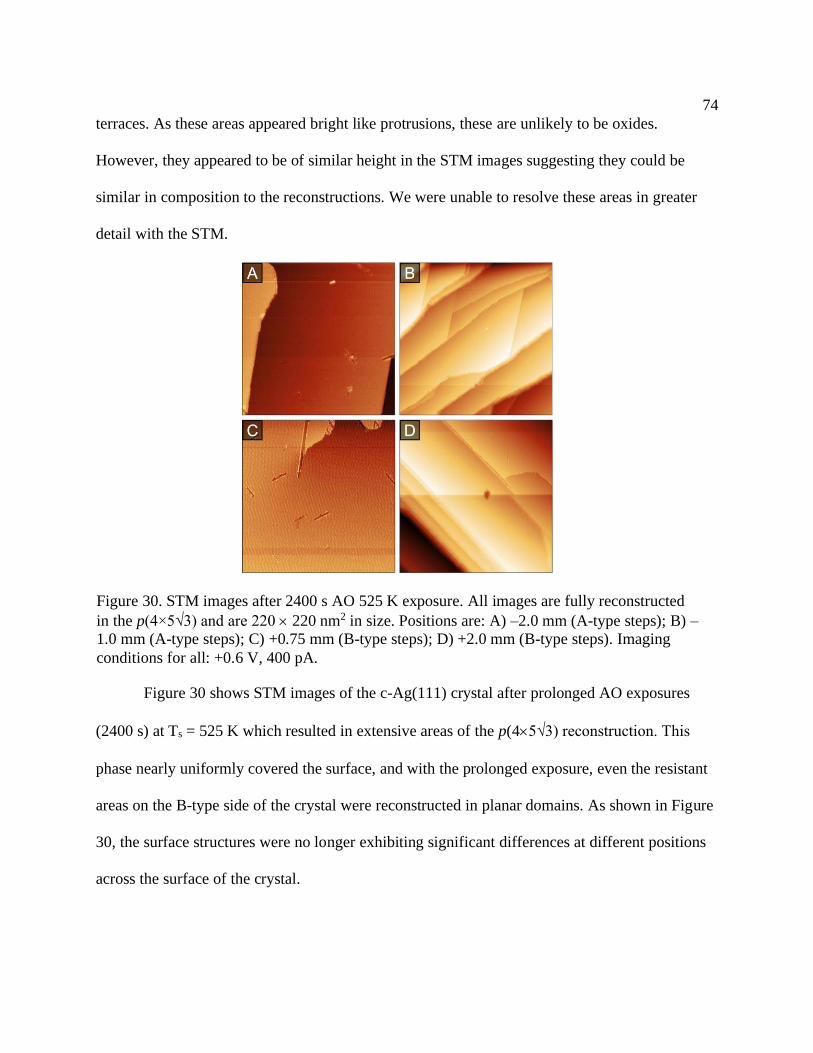
74
terraces. As these areas appeared bright like protrusions, these are unlikely to be oxides.
However, they appeared to be of similar height in the STM images suggesting they could be
similar in composition to the reconstructions. We were unable to resolve these areas in greater
detail with the STM.
Figure 30 shows STM images of the c-Ag(111) crystal after prolonged AO exposures
(2400 s) at Ts = 525 K which resulted in extensive areas of the p(45√3) reconstruction. This
phase nearly uniformly covered the surface, and with the prolonged exposure, even the resistant
areas on the B-type side of the crystal were reconstructed in planar domains. As shown in Figure
30, the surface structures were no longer exhibiting significant differences at different positions
across the surface of the crystal.
Figure 30. STM images after 2400 s AO 525 K exposure. All images are fully reconstructed
in the p(4×5√3) and are 220 220 nm2 in size. Positions are: A) –2.0 mm (A-type steps); B) –
1.0 mm (A-type steps); C) +0.75 mm (B-type steps); D) +2.0 mm (B-type steps). Imaging
conditions for all: +0.6 V, 400 pA.
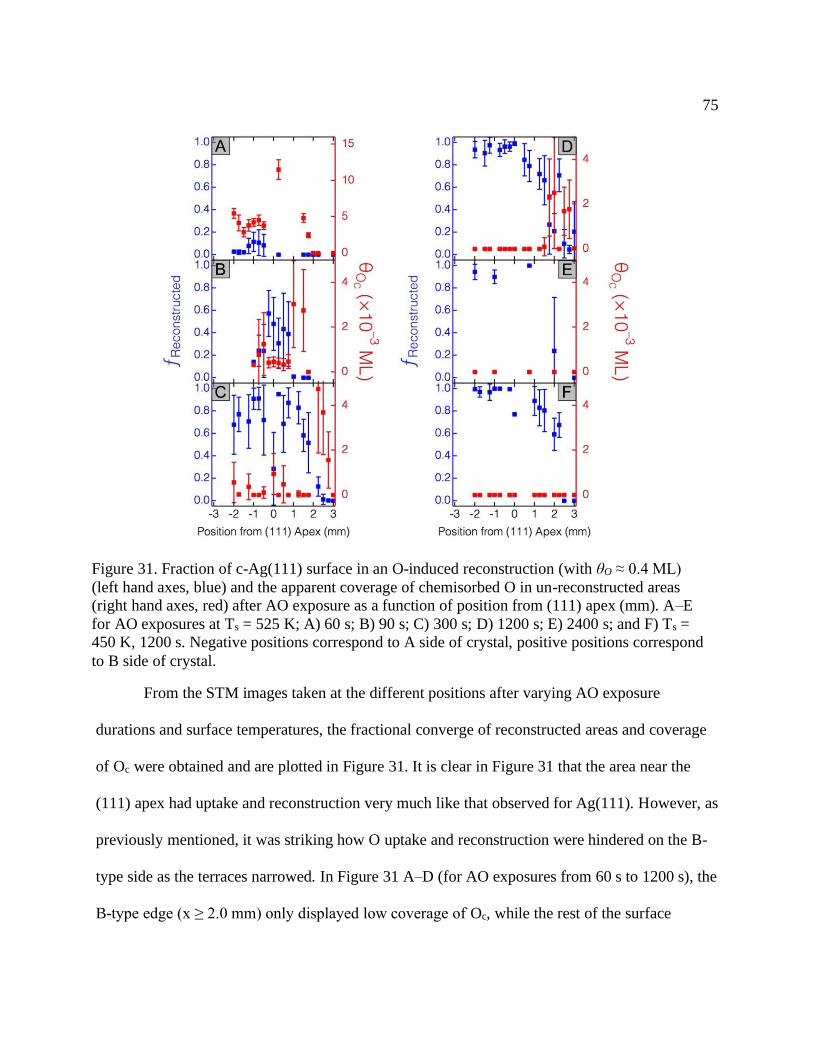
75
From the STM images taken at the different positions after varying AO exposure
durations and surface temperatures, the fractional converge of reconstructed areas and coverage
of Oc were obtained and are plotted in Figure 31. It is clear in Figure 31 that the area near the
(111) apex had uptake and reconstruction very much like that observed for Ag(111). However, as
previously mentioned, it was striking how O uptake and reconstruction were hindered on the B-
type side as the terraces narrowed. In Figure 31 A–D (for AO exposures from 60 s to 1200 s), the
B-type edge (x ≥ 2.0 mm) only displayed low coverage of Oc, while the rest of the surface
Figure 31. Fraction of c-Ag(111) surface in an O-induced reconstruction (with θO ≈ 0.4 ML)
(left hand axes, blue) and the apparent coverage of chemisorbed O in un-reconstructed areas
(right hand axes, red) after AO exposure as a function of position from (111) apex (mm). A–E
for AO exposures at Ts = 525 K; A) 60 s; B) 90 s; C) 300 s; D) 1200 s; E) 2400 s; and F) Ts =
450 K, 1200 s. Negative positions correspond to A side of crystal, positive positions correspond
to B side of crystal.
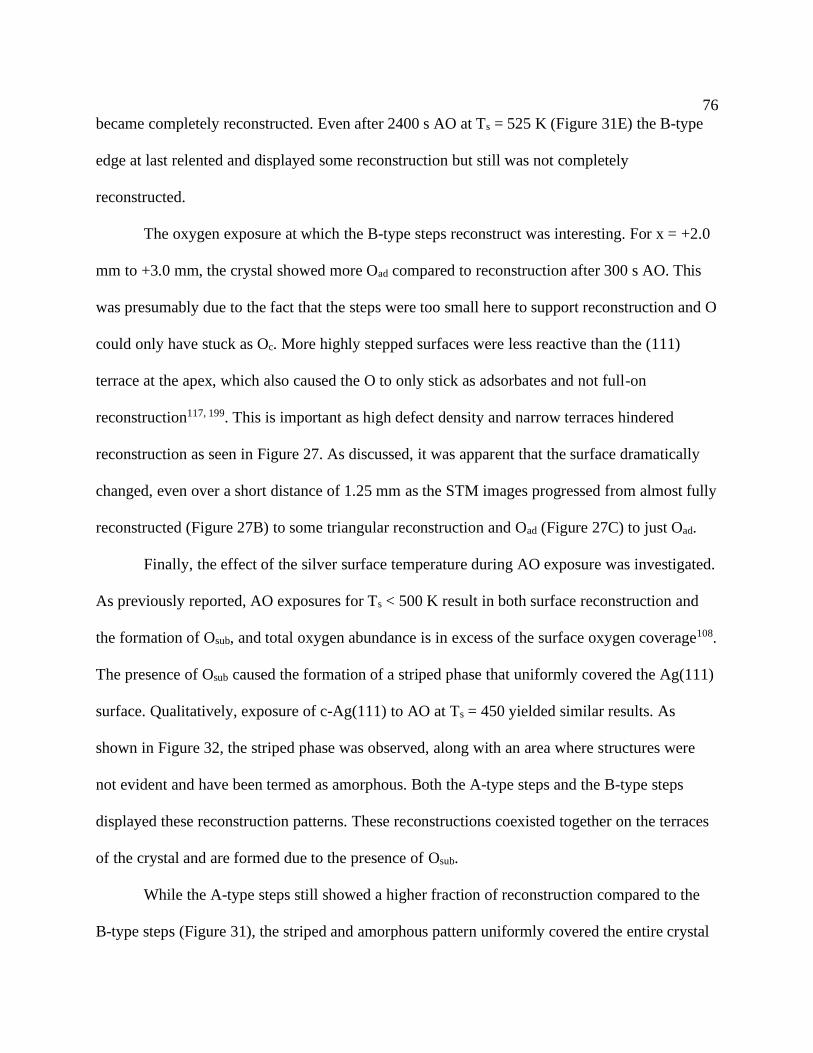
76
became completely reconstructed. Even after 2400 s AO at Ts = 525 K (Figure 31E) the B-type
edge at last relented and displayed some reconstruction but still was not completely
reconstructed.
The oxygen exposure at which the B-type steps reconstruct was interesting. For x = +2.0
mm to +3.0 mm, the crystal showed more Oad compared to reconstruction after 300 s AO. This
was presumably due to the fact that the steps were too small here to support reconstruction and O
could only have stuck as Oc. More highly stepped surfaces were less reactive than the (111)
terrace at the apex, which also caused the O to only stick as adsorbates and not full-on
reconstruction117, 199. This is important as high defect density and narrow terraces hindered
reconstruction as seen in Figure 27. As discussed, it was apparent that the surface dramatically
changed, even over a short distance of 1.25 mm as the STM images progressed from almost fully
reconstructed (Figure 27B) to some triangular reconstruction and Oad (Figure 27C) to just Oad.
Finally, the effect of the silver surface temperature during AO exposure was investigated.
As previously reported, AO exposures for Ts < 500 K result in both surface reconstruction and
the formation of Osub, and total oxygen abundance is in excess of the surface oxygen coverage108.
The presence of Osub caused the formation of a striped phase that uniformly covered the Ag(111)
surface. Qualitatively, exposure of c-Ag(111) to AO at Ts = 450 yielded similar results. As
shown in Figure 32, the striped phase was observed, along with an area where structures were
not evident and have been termed as amorphous. Both the A-type steps and the B-type steps
displayed these reconstruction patterns. These reconstructions coexisted together on the terraces
of the crystal and are formed due to the presence of Osub.
While the A-type steps still showed a higher fraction of reconstruction compared to the
B-type steps (Figure 31), the striped and amorphous pattern uniformly covered the entire crystal
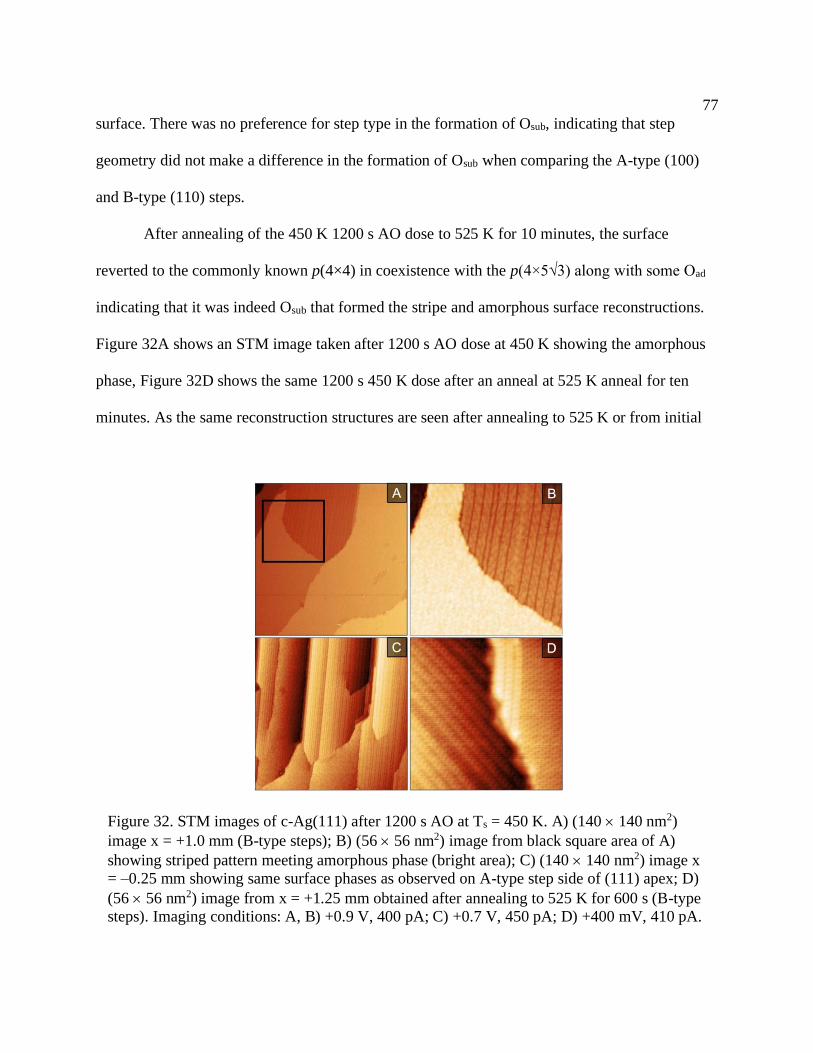
77
surface. There was no preference for step type in the formation of Osub, indicating that step
geometry did not make a difference in the formation of Osub when comparing the A-type (100)
and B-type (110) steps.
After annealing of the 450 K 1200 s AO dose to 525 K for 10 minutes, the surface
reverted to the commonly known p(4×4) in coexistence with the p(4×5√3) along with some Oad
indicating that it was indeed Osub that formed the stripe and amorphous surface reconstructions.
Figure 32A shows an STM image taken after 1200 s AO dose at 450 K showing the amorphous
phase, Figure 32D shows the same 1200 s 450 K dose after an anneal at 525 K anneal for ten
minutes. As the same reconstruction structures are seen after annealing to 525 K or from initial
Figure 32. STM images of c-Ag(111) after 1200 s AO at Ts = 450 K. A) (140 140 nm2)
image x = +1.0 mm (B-type steps); B) (56 56 nm2) image from black square area of A)
showing striped pattern meeting amorphous phase (bright area); C) (140 140 nm2) image x
= –0.25 mm showing same surface phases as observed on A-type step side of (111) apex; D)
(56 56 nm2) image from x = +1.25 mm obtained after annealing to 525 K for 600 s (B-type
steps). Imaging conditions: A, B) +0.9 V, 400 pA; C) +0.7 V, 450 pA; D) +400 mV, 410 pA.
78
AO deposition at Ts = 525 K, this indicates that after annealing the lower temperature dose
reverts back to the commonly seen reconstructions at 525 K.
One important consideration to verify the anisotropy of O uptake and reconstruction is
the possibility that the experimental conditions are causing lower flux of AO on the B-type step
side of the crystal. However, the orientation of the filament during AO dosing was aligned
evenly over the crystal. This was verified using a planar Ag(111) crystal; the amount of O that
stuck to the surface was not changed by translating it lengthwise ± 5 mm from the c-Ag(111)
dosing position. This indicates that the AO flux was uniform for more than 1 cm, longer than the
crystal width. Shadowing from the crystal curvature was also not significant, as O uptake and the
amount of reconstruction was not hindered on the A-type step side.
The observation of increased uptake and reconstruction of oxygen on the A-type step side
of the crystal indicated that the A-type step geometry is more reactive than the B-type step
geometry. The step geometries of the A-type steps reconstructed more when exposed to AO
when compared to the B-type steps under the same oxidizing conditions. Since the crystal was
curved and had both A-type and B-type steps in a single sample, both step type geometries were
exposed to the same oxidizing conditions. Therefore, the step geometry is what indicates the
amount of fractional reconstruction on the crystal with A-type step geometries being more
reactive to AO than B-type step geometries.
This finding that the A-type steps experience different reactivity and are more reactive to
oxygen uptake than B-type steps has been seen before on platinum. Badan et al. determined that
Pt(100) and Pt(110) reacted differently when exposed to oxygen.188 They found that O2
dissociation on the Pt steps depended on the step geometry with the (110) steps lowering the
dissociation barrier for O2 in a way that the (100) steps were unable to accomplish.188 This
79
contradicts what we observed on the oxidized c-Ag(111) crystal. On the c-Ag(111), the A-type
(100) steps were more reactive and thus reconstructed more and at shorter AO exposures than the
B-type (110) steps.
The effects of oxygen adsorption on differing step geometries of a c-Ag(111) crystal
were studied. It was determined that different step geometries react differently to oxygen
adsorption. The A-type steps on the c-Ag(111) saw a higher uptake in oxygen reconstruction
formation due to their (100) geometry whereas the B-type (110) steps saw less reconstruction
during the same AO exposure. The far edge B-type steps were resistant to reconstruct and instead
showed chemisorbed O, until finally at long AO exposures the steps reconstructed. When the B
steps reconstructed, they showed several interesting patterns including a striated and ‘popcorn’
pattern. Even with the reconstruction, the step density appeared to be conserved for all doses and
locations across the crystal.
Lower temperature exposures at 450 K still saw the formation of Osub and the formation
of both the stripe pattern and an amorphous pattern in coexistence with each other. Surprisingly
the formation of the Osub was not dependent on step geometry as the two aforementioned patterns
formed over the entire surface of the crystal. Upon subsequent annealing of the stripe and
amorphous pattern, the surface reverted to the commonly seen p(4×4) in coexistence with the
p(4×5√3) showing the thermodynamic stability of the oxygen. Overall, this study showed insight
into how oxygen interacts with different step geometries and the limitations of temperatures and
exposure durations.
80
CHAPTER FIVE
SUBSURFACE OXYGEN EMERGENCE ON RH(111)
How a metal surface responds to the emergence and desorption of oxygen atoms will
determine the chemistry of the metal. One more recent area of interest is subsurface oxygen
(Osub) and its formation, properties, and influence on reactivity. Recent studies have shown that
the presence of Osub is responsible for the subsequent formation of highly oxidized Rh(111)
surface structures. This study examines the changing surface structures during a TPD ramp
focusing on desorption location and the site of Osub emergence from the bulk and its effect on
surface structures. Investigating the (2×1)-O surface in the O2 0.5 ML surface showed that the
(2×1)-O rapidly desorbed leaving only remnants of Oad behind stochastically adsorbed on the
surface. Oxidized surfaces such as the Ts = 350 K surface with the (2√3×2√3) R30° and (2×2)-
3O structures as well as Osub see the surface first reverting to the (2×1)-O structure and then
evolving into adsorbed oxygen scattered over the surface as Osub homogeneously emerges.
Highly oxidized surfaces at Ts = 700 K consisting of RhO2 oxide, (2×1)-O adlayer, and Osub, see
the oxide degrade first and upon Osub emergence, the entire surface uniformly changes. All
surfaces show homogeneity as Osub emerged with no preference to step edges. LEED patterns
corroborate STM imaging. Overall, as the TPD progressed, the crystal surface becomes
increasingly more metallic as first the highly oxidized structures of the oxide and Osub break
down until finally the (2×1)-O degrades into stochastic Oad. The emergence of Osub occurs
without preference to step edges, and all resulting surface structures as the surface changes
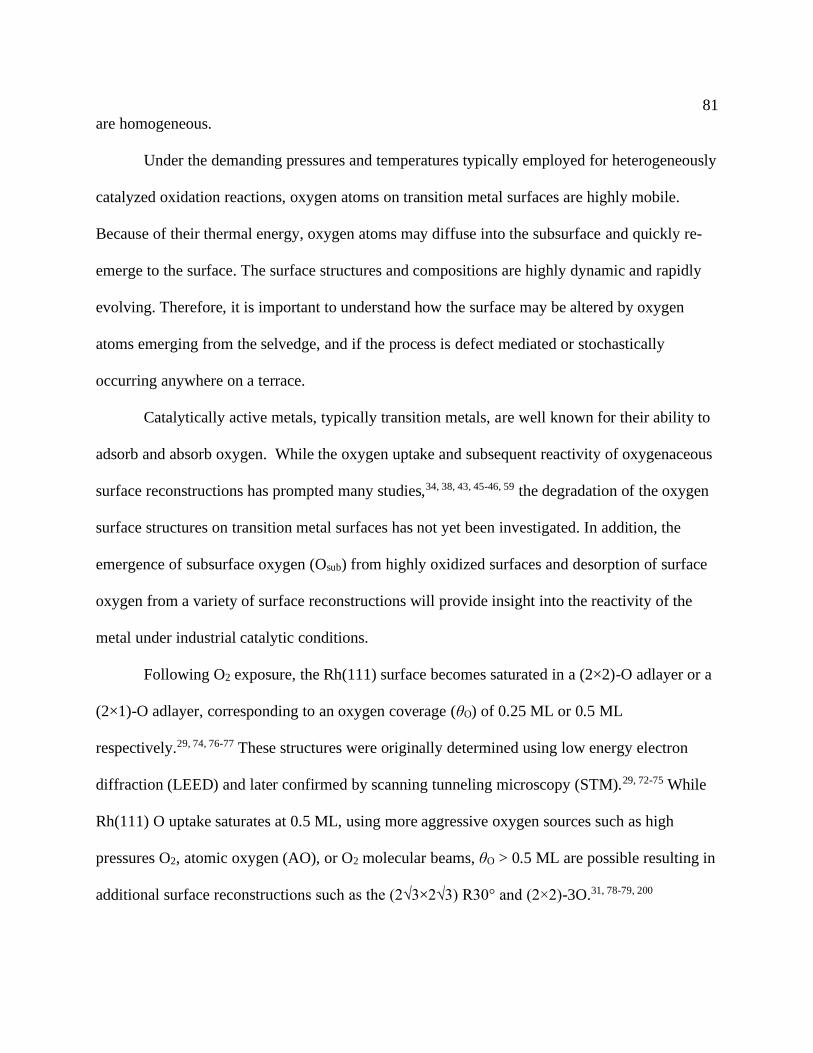
81
are homogeneous.
Under the demanding pressures and temperatures typically employed for heterogeneously
catalyzed oxidation reactions, oxygen atoms on transition metal surfaces are highly mobile.
Because of their thermal energy, oxygen atoms may diffuse into the subsurface and quickly re-
emerge to the surface. The surface structures and compositions are highly dynamic and rapidly
evolving. Therefore, it is important to understand how the surface may be altered by oxygen
atoms emerging from the selvedge, and if the process is defect mediated or stochastically
occurring anywhere on a terrace.
Catalytically active metals, typically transition metals, are well known for their ability to
adsorb and absorb oxygen. While the oxygen uptake and subsequent reactivity of oxygenaceous
surface reconstructions has prompted many studies,34, 38, 43, 45-46, 59 the degradation of the oxygen
surface structures on transition metal surfaces has not yet been investigated. In addition, the
emergence of subsurface oxygen (Osub) from highly oxidized surfaces and desorption of surface
oxygen from a variety of surface reconstructions will provide insight into the reactivity of the
metal under industrial catalytic conditions.
Following O2 exposure, the Rh(111) surface becomes saturated in a (2×2)-O adlayer or a
(2×1)-O adlayer, corresponding to an oxygen coverage (θO) of 0.25 ML or 0.5 ML
respectively.29, 74, 76-77 These structures were originally determined using low energy electron
diffraction (LEED) and later confirmed by scanning tunneling microscopy (STM).29, 72-75 While
Rh(111) O uptake saturates at 0.5 ML, using more aggressive oxygen sources such as high
pressures O2, atomic oxygen (AO), or O2 molecular beams, θO > 0.5 ML are possible resulting in
additional surface reconstructions such as the (2√3×2√3) R30° and (2×2)-3O.31, 78-79, 200
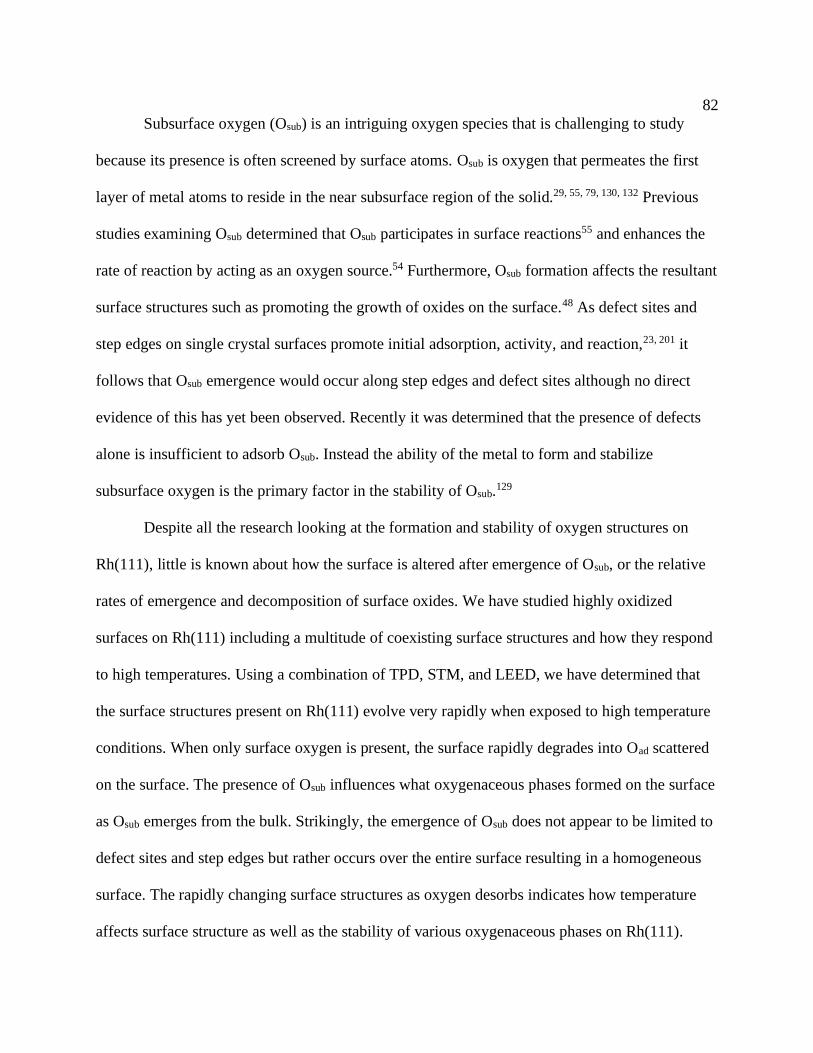
82
Subsurface oxygen (Osub) is an intriguing oxygen species that is challenging to study
because its presence is often screened by surface atoms. Osub is oxygen that permeates the first
layer of metal atoms to reside in the near subsurface region of the solid.29, 55, 79, 130, 132 Previous
studies examining Osub determined that Osub participates in surface reactions55 and enhances the
rate of reaction by acting as an oxygen source.54 Furthermore, Osub formation affects the resultant
surface structures such as promoting the growth of oxides on the surface.48 As defect sites and
step edges on single crystal surfaces promote initial adsorption, activity, and reaction,23, 201 it
follows that Osub emergence would occur along step edges and defect sites although no direct
evidence of this has yet been observed. Recently it was determined that the presence of defects
alone is insufficient to adsorb Osub. Instead the ability of the metal to form and stabilize
subsurface oxygen is the primary factor in the stability of Osub.129
Despite all the research looking at the formation and stability of oxygen structures on
Rh(111), little is known about how the surface is altered after emergence of Osub, or the relative
rates of emergence and decomposition of surface oxides. We have studied highly oxidized
surfaces on Rh(111) including a multitude of coexisting surface structures and how they respond
to high temperatures. Using a combination of TPD, STM, and LEED, we have determined that
the surface structures present on Rh(111) evolve very rapidly when exposed to high temperature
conditions. When only surface oxygen is present, the surface rapidly degrades into Oad scattered
on the surface. The presence of Osub influences what oxygenaceous phases formed on the surface
as Osub emerges from the bulk. Strikingly, the emergence of Osub does not appear to be limited to
defect sites and step edges but rather occurs over the entire surface resulting in a homogeneous
surface. The rapidly changing surface structures as oxygen desorbs indicates how temperature
affects surface structure as well as the stability of various oxygenaceous phases on Rh(111).
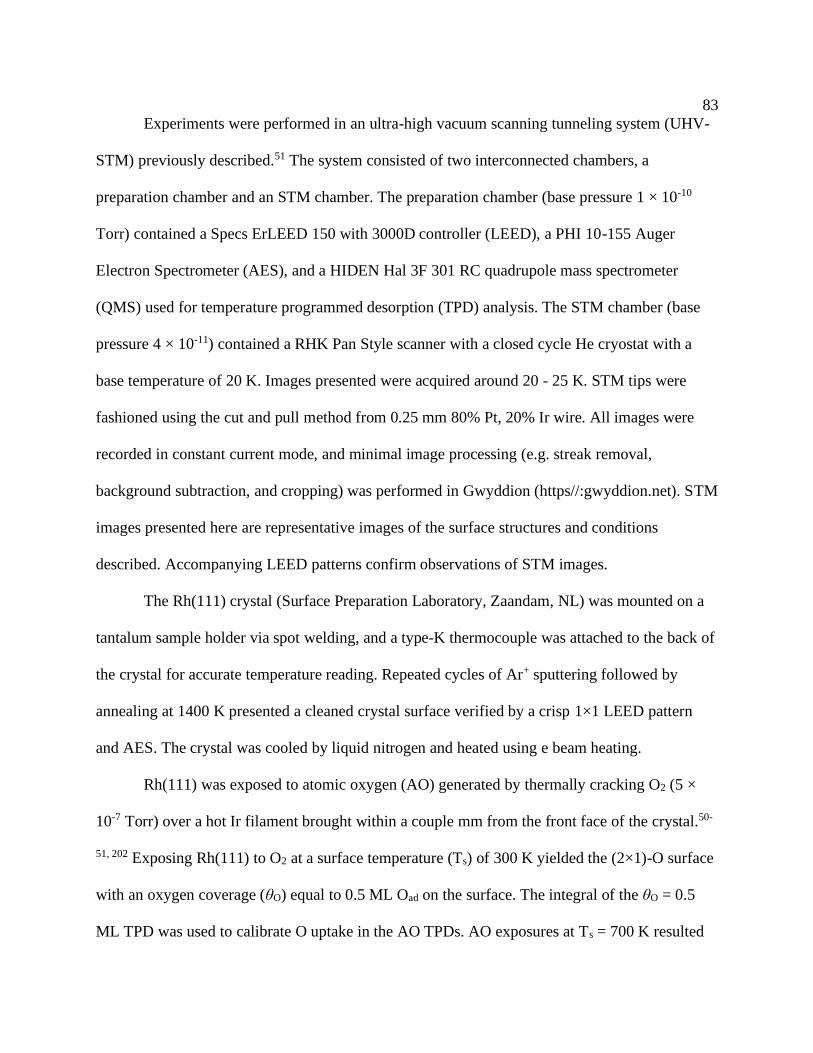
83
Experiments were performed in an ultra-high vacuum scanning tunneling system (UHV-
STM) previously described.51 The system consisted of two interconnected chambers, a
preparation chamber and an STM chamber. The preparation chamber (base pressure 1 × 10⁻¹⁰
Torr) contained a Specs ErLEED 150 with 3000D controller (LEED), a PHI 10-155 Auger
Electron Spectrometer (AES), and a HIDEN Hal 3F 301 RC quadrupole mass spectrometer
(QMS) used for temperature programmed desorption (TPD) analysis. The STM chamber (base
pressure 4 × 10-11) contained a RHK Pan Style scanner with a closed cycle He cryostat with a
base temperature of 20 K. Images presented were acquired around 20 - 25 K. STM tips were
fashioned using the cut and pull method from 0.25 mm 80% Pt, 20% Ir wire. All images were
recorded in constant current mode, and minimal image processing (e.g. streak removal,
background subtraction, and cropping) was performed in Gwyddion (https//:gwyddion.net). STM
images presented here are representative images of the surface structures and conditions
described. Accompanying LEED patterns confirm observations of STM images.
The Rh(111) crystal (Surface Preparation Laboratory, Zaandam, NL) was mounted on a
tantalum sample holder via spot welding, and a type-K thermocouple was attached to the back of
the crystal for accurate temperature reading. Repeated cycles of Ar+ sputtering followed by
annealing at 1400 K presented a cleaned crystal surface verified by a crisp 1×1 LEED pattern
and AES. The crystal was cooled by liquid nitrogen and heated using e beam heating.
Rh(111) was exposed to atomic oxygen (AO) generated by thermally cracking O2 (5 ×
10-7 Torr) over a hot Ir filament brought within a couple mm from the front face of the crystal.50-
51, 202 Exposing Rh(111) to O2 at a surface temperature (Ts) of 300 K yielded the (2×1)-O surface
with an oxygen coverage (θO) equal to 0.5 ML Oad on the surface. The integral of the θO = 0.5
ML TPD was used to calibrate O uptake in the AO TPDs. AO exposures at Ts = 700 K resulted
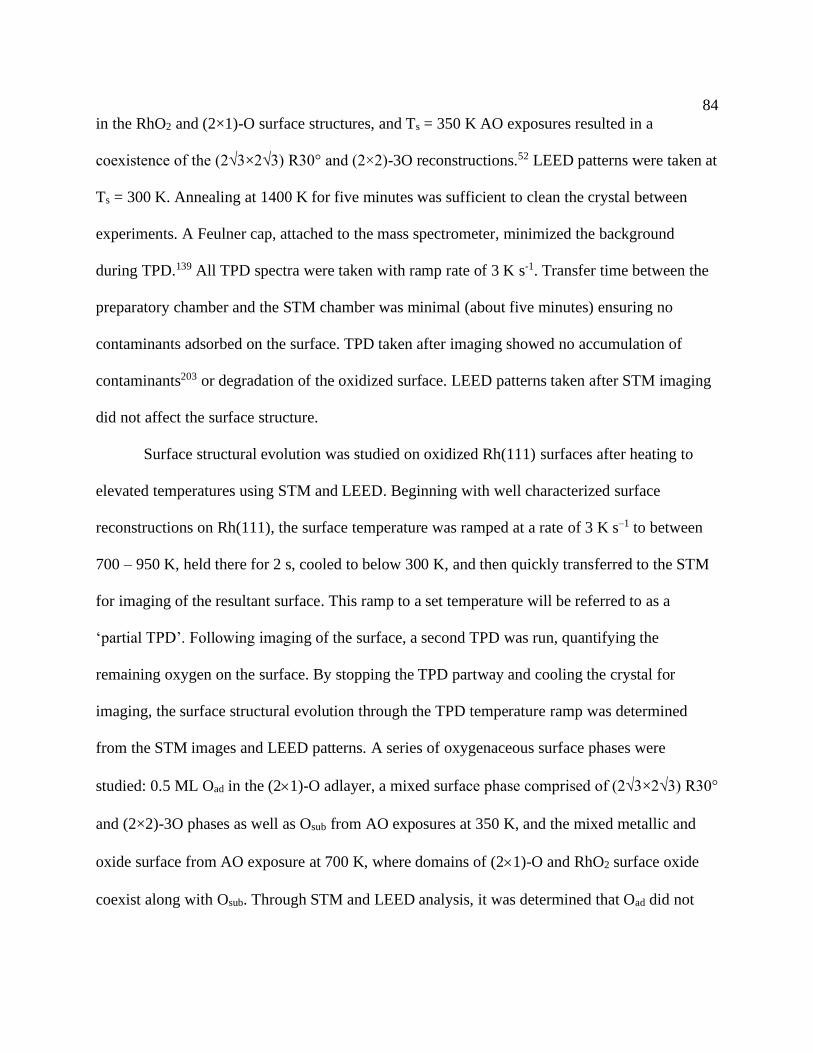
84
in the RhO2 and (2×1)-O surface structures, and Ts = 350 K AO exposures resulted in a
coexistence of the (2√3×2√3) R30° and (2×2)-3O reconstructions.52 LEED patterns were taken at
Ts = 300 K. Annealing at 1400 K for five minutes was sufficient to clean the crystal between
experiments. A Feulner cap, attached to the mass spectrometer, minimized the background
during TPD.139 All TPD spectra were taken with ramp rate of 3 K s-1. Transfer time between the
preparatory chamber and the STM chamber was minimal (about five minutes) ensuring no
contaminants adsorbed on the surface. TPD taken after imaging showed no accumulation of
contaminants203 or degradation of the oxidized surface. LEED patterns taken after STM imaging
did not affect the surface structure.
Surface structural evolution was studied on oxidized Rh(111) surfaces after heating to
elevated temperatures using STM and LEED. Beginning with well characterized surface
reconstructions on Rh(111), the surface temperature was ramped at a rate of 3 K s–1 to between
700 – 950 K, held there for 2 s, cooled to below 300 K, and then quickly transferred to the STM
for imaging of the resultant surface. This ramp to a set temperature will be referred to as a
‘partial TPD’. Following imaging of the surface, a second TPD was run, quantifying the
remaining oxygen on the surface. By stopping the TPD partway and cooling the crystal for
imaging, the surface structural evolution through the TPD temperature ramp was determined
from the STM images and LEED patterns. A series of oxygenaceous surface phases were
studied: 0.5 ML Oad in the (21)-O adlayer, a mixed surface phase comprised of (2√3×2√3) R30°
and (2×2)-3O phases as well as Osub from AO exposures at 350 K, and the mixed metallic and
oxide surface from AO exposure at 700 K, where domains of (21)-O and RhO2 surface oxide
coexist along with Osub. Through STM and LEED analysis, it was determined that Oad did not
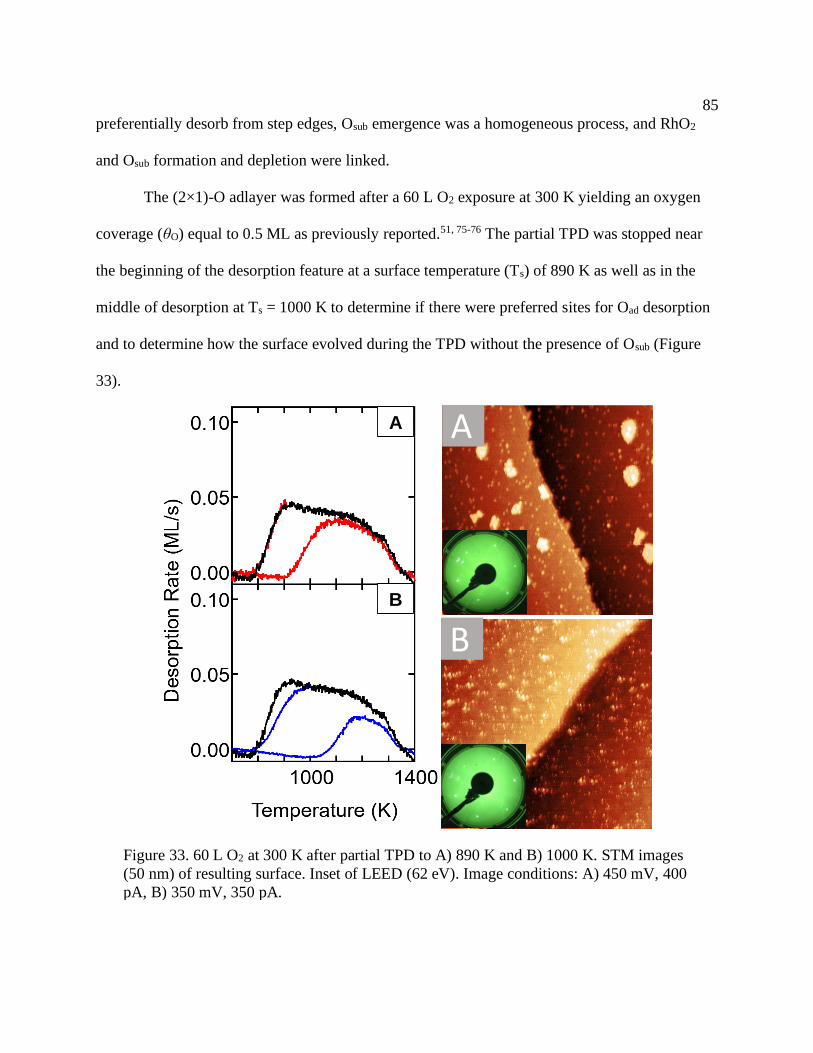
85
preferentially desorb from step edges, Osub emergence was a homogeneous process, and RhO2
and Osub formation and depletion were linked.
The (2×1)-O adlayer was formed after a 60 L O2 exposure at 300 K yielding an oxygen
coverage (θO) equal to 0.5 ML as previously reported.51, 75-76 The partial TPD was stopped near
the beginning of the desorption feature at a surface temperature (Ts) of 890 K as well as in the
middle of desorption at Ts = 1000 K to determine if there were preferred sites for Oad desorption
and to determine how the surface evolved during the TPD without the presence of Osub (Figure
33).
Figure 33. 60 L O2 at 300 K after partial TPD to A) 890 K and B) 1000 K. STM images
(50 nm) of resulting surface. Inset of LEED (62 eV). Image conditions: A) 450 mV, 400
pA, B) 350 mV, 350 pA.
A
B
A
B
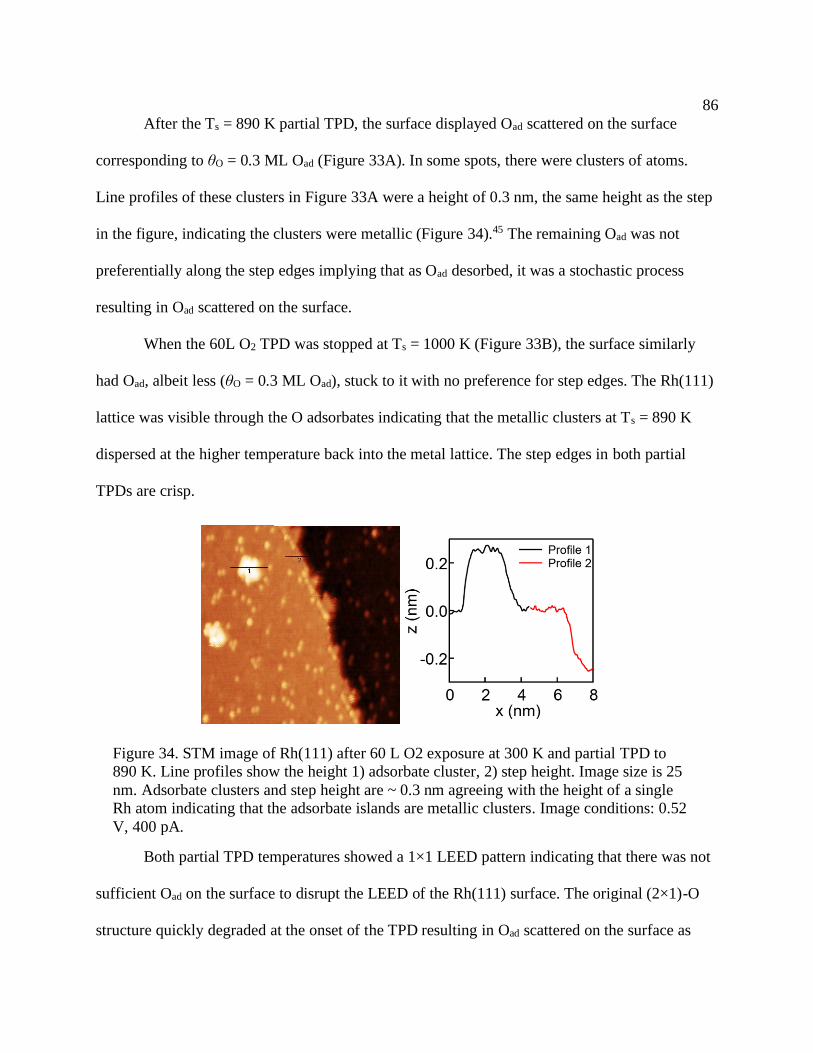
86
After the Ts = 890 K partial TPD, the surface displayed Oad scattered on the surface
corresponding to θO = 0.3 ML Oad (Figure 33A). In some spots, there were clusters of atoms.
Line profiles of these clusters in Figure 33A were a height of 0.3 nm, the same height as the step
in the figure, indicating the clusters were metallic (Figure 34).45 The remaining Oad was not
preferentially along the step edges implying that as Oad desorbed, it was a stochastic process
resulting in Oad scattered on the surface.
When the 60L O2 TPD was stopped at Ts = 1000 K (Figure 33B), the surface similarly
had Oad, albeit less (θO = 0.3 ML Oad), stuck to it with no preference for step edges. The Rh(111)
lattice was visible through the O adsorbates indicating that the metallic clusters at Ts = 890 K
dispersed at the higher temperature back into the metal lattice. The step edges in both partial
TPDs are crisp.
Both partial TPD temperatures showed a 1×1 LEED pattern indicating that there was not
sufficient Oad on the surface to disrupt the LEED of the Rh(111) surface. The original (2×1)-O
structure quickly degraded at the onset of the TPD resulting in Oad scattered on the surface as
Figure 34. STM image of Rh(111) after 60 L O2 exposure at 300 K and partial TPD to
890 K. Line profiles show the height 1) adsorbate cluster, 2) step height. Image size is 25
nm. Adsorbate clusters and step height are ~ 0.3 nm agreeing with the height of a single
Rh atom indicating that the adsorbate islands are metallic clusters. Image conditions: 0.52
V, 400 pA.
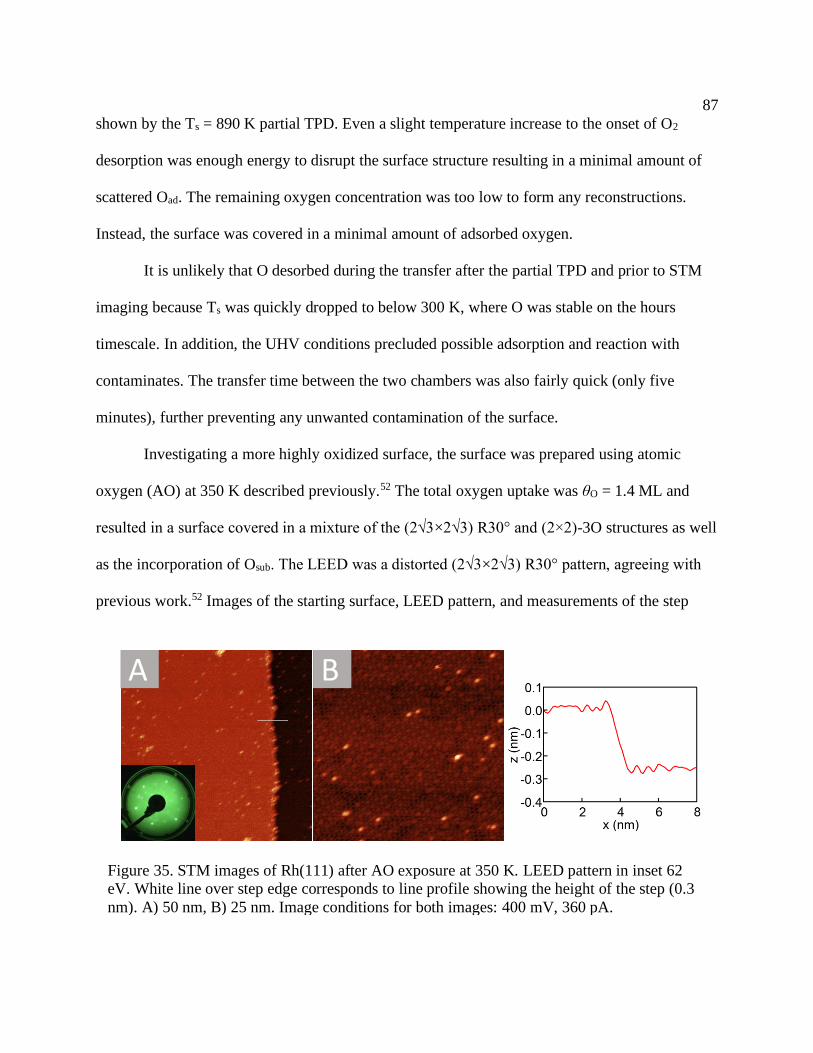
87
shown by the Ts = 890 K partial TPD. Even a slight temperature increase to the onset of O2
desorption was enough energy to disrupt the surface structure resulting in a minimal amount of
scattered Oad. The remaining oxygen concentration was too low to form any reconstructions.
Instead, the surface was covered in a minimal amount of adsorbed oxygen.
It is unlikely that O desorbed during the transfer after the partial TPD and prior to STM
imaging because Ts was quickly dropped to below 300 K, where O was stable on the hours
timescale. In addition, the UHV conditions precluded possible adsorption and reaction with
contaminates. The transfer time between the two chambers was also fairly quick (only five
minutes), further preventing any unwanted contamination of the surface.
Investigating a more highly oxidized surface, the surface was prepared using atomic
oxygen (AO) at 350 K described previously.52 The total oxygen uptake was θO = 1.4 ML and
resulted in a surface covered in a mixture of the (2√3×2√3) R30° and (2×2)-3O structures as well
as the incorporation of Osub. The LEED was a distorted (2√3×2√3) R30° pattern, agreeing with
previous work.52 Images of the starting surface, LEED pattern, and measurements of the step
Figure 35. STM images of Rh(111) after AO exposure at 350 K. LEED pattern in inset 62
eV. White line over step edge corresponds to line profile showing the height of the step (0.3
nm). A) 50 nm, B) 25 nm. Image conditions for both images: 400 mV, 360 pA.
B
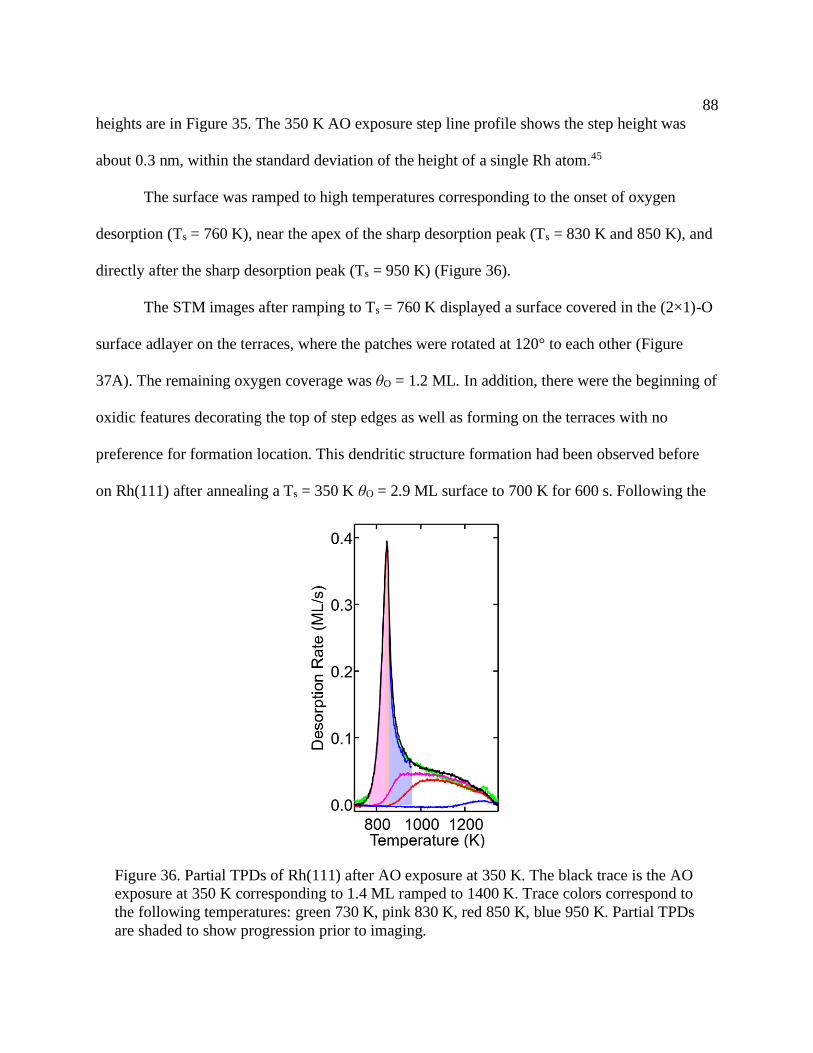
88
heights are in Figure 35. The 350 K AO exposure step line profile shows the step height was
about 0.3 nm, within the standard deviation of the height of a single Rh atom.45
The surface was ramped to high temperatures corresponding to the onset of oxygen
desorption (Ts = 760 K), near the apex of the sharp desorption peak (Ts = 830 K and 850 K), and
directly after the sharp desorption peak (Ts = 950 K) (Figure 36).
The STM images after ramping to Ts = 760 K displayed a surface covered in the (2×1)-O
surface adlayer on the terraces, where the patches were rotated at 120° to each other (Figure
37A). The remaining oxygen coverage was θO = 1.2 ML. In addition, there were the beginning of
oxidic features decorating the top of step edges as well as forming on the terraces with no
preference for formation location. This dendritic structure formation had been observed before
on Rh(111) after annealing a Ts = 350 K θO = 2.9 ML surface to 700 K for 600 s. Following the
Figure 36. Partial TPDs of Rh(111) after AO exposure at 350 K. The black trace is the AO
exposure at 350 K corresponding to 1.4 ML ramped to 1400 K. Trace colors correspond to
the following temperatures: green 730 K, pink 830 K, red 850 K, blue 950 K. Partial TPDs
are shaded to show progression prior to imaging.
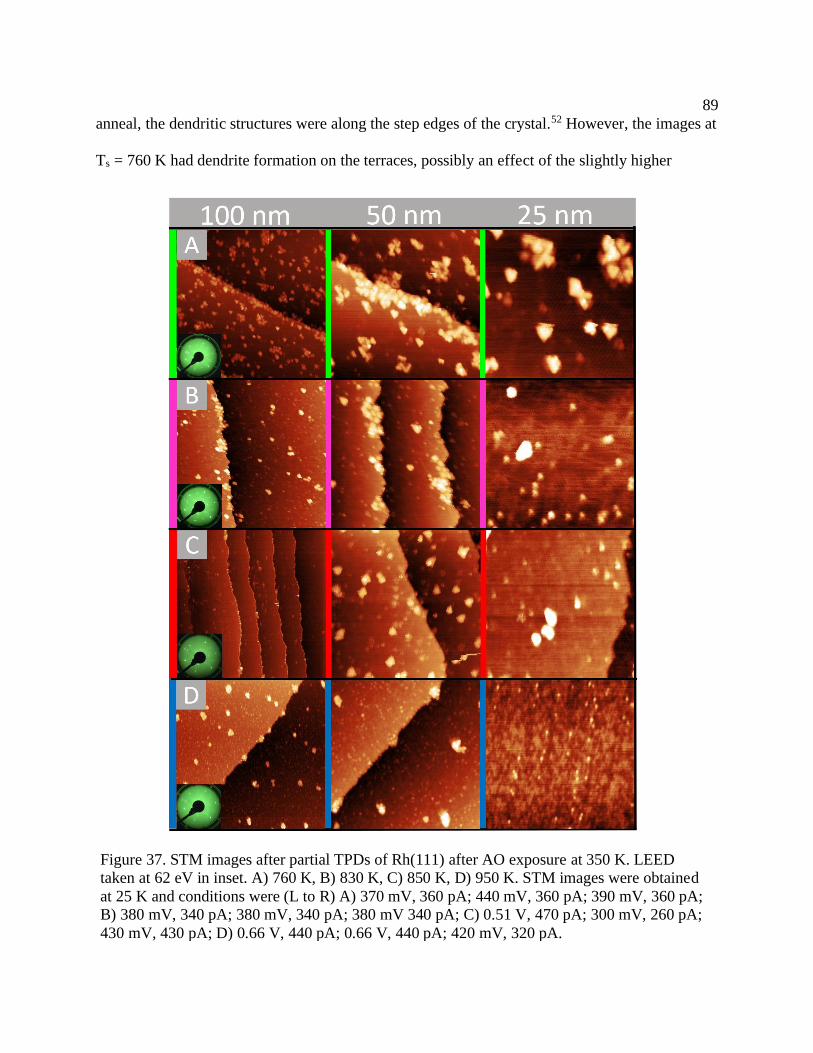
89
anneal, the dendritic structures were along the step edges of the crystal.52 However, the images at
Ts = 760 K had dendrite formation on the terraces, possibly an effect of the slightly higher
Figure 37. STM images after partial TPDs of Rh(111) after AO exposure at 350 K. LEED
taken at 62 eV in inset. A) 760 K, B) 830 K, C) 850 K, D) 950 K. STM images were obtained
at 25 K and conditions were (L to R) A) 370 mV, 360 pA; 440 mV, 360 pA; 390 mV, 360 pA;
B) 380 mV, 340 pA; 380 mV, 340 pA; 380 mV 340 pA; C) 0.51 V, 470 pA; 300 mV, 260 pA;
430 mV, 430 pA; D) 0.66 V, 440 pA; 0.66 V, 440 pA; 420 mV, 320 pA.
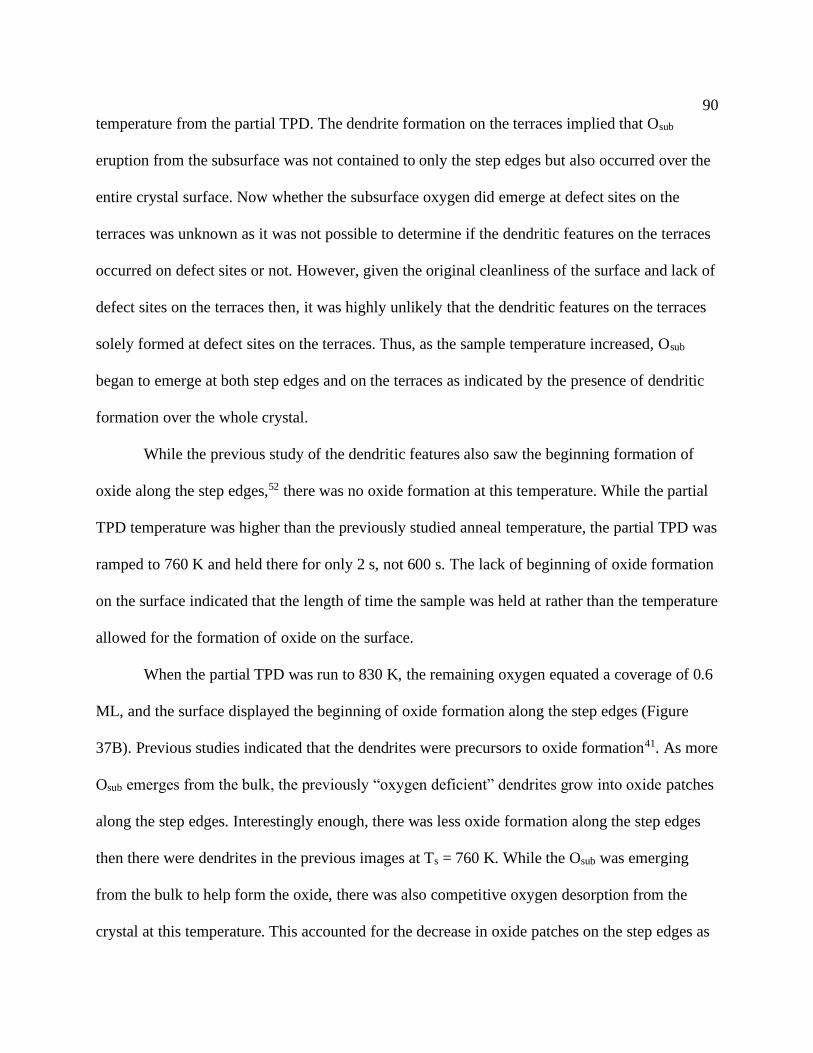
90
temperature from the partial TPD. The dendrite formation on the terraces implied that Osub
eruption from the subsurface was not contained to only the step edges but also occurred over the
entire crystal surface. Now whether the subsurface oxygen did emerge at defect sites on the
terraces was unknown as it was not possible to determine if the dendritic features on the terraces
occurred on defect sites or not. However, given the original cleanliness of the surface and lack of
defect sites on the terraces then, it was highly unlikely that the dendritic features on the terraces
solely formed at defect sites on the terraces. Thus, as the sample temperature increased, Osub
began to emerge at both step edges and on the terraces as indicated by the presence of dendritic
formation over the whole crystal.
While the previous study of the dendritic features also saw the beginning formation of
oxide along the step edges,52 there was no oxide formation at this temperature. While the partial
TPD temperature was higher than the previously studied anneal temperature, the partial TPD was
ramped to 760 K and held there for only 2 s, not 600 s. The lack of beginning of oxide formation
on the surface indicated that the length of time the sample was held at rather than the temperature
allowed for the formation of oxide on the surface.
When the partial TPD was run to 830 K, the remaining oxygen equated a coverage of 0.6
ML, and the surface displayed the beginning of oxide formation along the step edges (Figure
37B). Previous studies indicated that the dendrites were precursors to oxide formation41. As more
Osub emerges from the bulk, the previously “oxygen deficient” dendrites grow into oxide patches
along the step edges. Interestingly enough, there was less oxide formation along the step edges
then there were dendrites in the previous images at Ts = 760 K. While the Osub was emerging
from the bulk to help form the oxide, there was also competitive oxygen desorption from the
crystal at this temperature. This accounted for the decrease in oxide patches on the step edges as
91
well as the lack of oxide patches on the terraces. The bright spots on the terraces were possibly
where the dendrite structures degraded in the temperature ramp. Closer investigation of the
surface showed the persistent (2×1)-O structure on the terraces. In addition, the step edges at Ts =
830 K were jagged when compared to the step edges at 760 K suggesting that as Osub emerges at
the step edges, they become kinked.
The partial TPD to Ts = 850 K showed additional disordering of the surface (Figure 37C).
The amount of oxygen remaining was 0.4 ML, a full ML less than the original surface. The
(2×1)-O was still present, yet the oxide that was beginning to form along the step edges had
disappeared. Overall, the surface was disordered and messy, most likely because the TPD was
stopped in the midst of the process of oxygen erupting from the surface. As Osub emergence from
the bulk was homogeneous, the entire surface appears disordered. There was no preference for
step edges and defect sites but rather a random occurrence that occurred all over the surface. Site
specificity did not matter. Furthermore, as the Ts = 850 K surface was the most disordered, the
step edges were still kinked indicating places where Osub emerged.
92
At the highest temperature of Ts = 950 K, the surface had Oad randomly adsorbed on the
surface with no discernable surface structure and only θO = 0.1 ML remaining (Figure 37D).
Clusters of atoms were on the terraces, appearing as bright features in the STM images. Line
scans show the height was about 0.2 nm while a scan of the step height in the same image was
about 0.25 nm indicating that the bright patches were Rh atoms (Figure 38). While majority of
the surface displayed Oad, there were some patches of surface devoid of oxygen with only bare
metal present. These images were a small percentage of the total images taken (< 20%), and line
profiles of the heights of the patches indicate that the clusters and depressions where most likely
displaced Rh atoms (Figure 39). These depressions and clusters indicate that upon emergence
from the bulk and subsequent desorption, the Osub causes massive displacement of the Rh surface
atoms. The step edges look less kinked, possibly from the high temperature allowing them to
relax into the most favored position and as there was no additional Osub present to emerge from
the bulk.
Figure 38. STM images of Rh(111) after AO exposure at 350 K and partial TPD to 950 K.
Line profiles corresponds to line profile showing the height of the adsorbate islands (profile 1)
and step (profile 2). Both are a height of 0.2 nm. Image size 50 nm. Same image as Figure 37D
50 nm. Image conditions: 0.66 V, 440 pA.
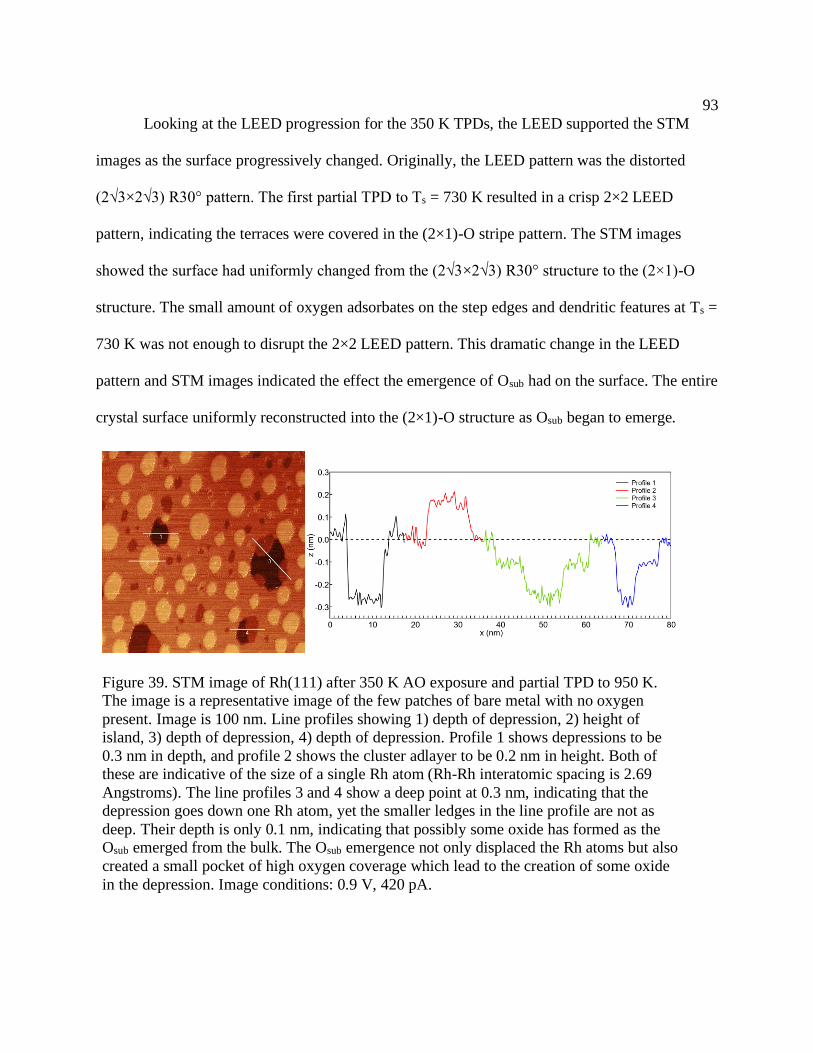
93
Looking at the LEED progression for the 350 K TPDs, the LEED supported the STM
images as the surface progressively changed. Originally, the LEED pattern was the distorted
(2√3×2√3) R30° pattern. The first partial TPD to Ts = 730 K resulted in a crisp 2×2 LEED
pattern, indicating the terraces were covered in the (2×1)-O stripe pattern. The STM images
showed the surface had uniformly changed from the (2√3×2√3) R30° structure to the (2×1)-O
structure. The small amount of oxygen adsorbates on the step edges and dendritic features at Ts =
730 K was not enough to disrupt the 2×2 LEED pattern. This dramatic change in the LEED
pattern and STM images indicated the effect the emergence of Osub had on the surface. The entire
crystal surface uniformly reconstructed into the (2×1)-O structure as Osub began to emerge.
Figure 39. STM image of Rh(111) after 350 K AO exposure and partial TPD to 950 K.
The image is a representative image of the few patches of bare metal with no oxygen
present. Image is 100 nm. Line profiles showing 1) depth of depression, 2) height of
island, 3) depth of depression, 4) depth of depression. Profile 1 shows depressions to be
0.3 nm in depth, and profile 2 shows the cluster adlayer to be 0.2 nm in height. Both of
these are indicative of the size of a single Rh atom (Rh-Rh interatomic spacing is 2.69
Angstroms). The line profiles 3 and 4 show a deep point at 0.3 nm, indicating that the
depression goes down one Rh atom, yet the smaller ledges in the line profile are not as
deep. Their depth is only 0.1 nm, indicating that possibly some oxide has formed as the
Osub emerged from the bulk. The Osub emergence not only displaced the Rh atoms but also
created a small pocket of high oxygen coverage which lead to the creation of some oxide
in the depression. Image conditions: 0.9 V, 420 pA.
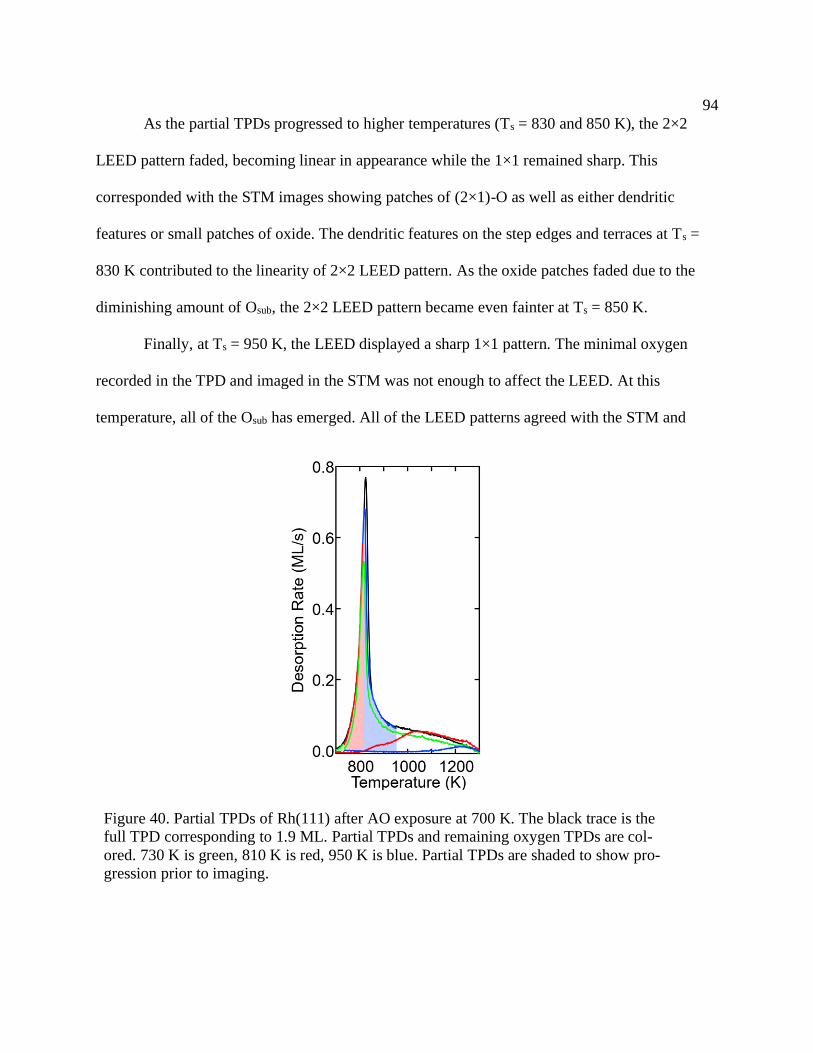
94
As the partial TPDs progressed to higher temperatures (Ts = 830 and 850 K), the 2×2
LEED pattern faded, becoming linear in appearance while the 1×1 remained sharp. This
corresponded with the STM images showing patches of (2×1)-O as well as either dendritic
features or small patches of oxide. The dendritic features on the step edges and terraces at Ts =
830 K contributed to the linearity of 2×2 LEED pattern. As the oxide patches faded due to the
diminishing amount of Osub, the 2×2 LEED pattern became even fainter at Ts = 850 K.
Finally, at Ts = 950 K, the LEED displayed a sharp 1×1 pattern. The minimal oxygen
recorded in the TPD and imaged in the STM was not enough to affect the LEED. At this
temperature, all of the Osub has emerged. All of the LEED patterns agreed with the STM and
Figure 40. Partial TPDs of Rh(111) after AO exposure at 700 K. The black trace is the
full TPD corresponding to 1.9 ML. Partial TPDs and remaining oxygen TPDs are col-
ored. 730 K is green, 810 K is red, 950 K is blue. Partial TPDs are shaded to show pro-
gression prior to imaging.
95
TPD data, with the LEED providing a macroscopic view of the surface and the STM images
providing a microscopic view.
The AO exposure at Ts = 700 K had θO = 1.9 ML corresponding to surface oxide, RhO2,
along the step edges, Oad in the (2×1)-O structure on the terraces, and Osub.52 Line profiles of the
700 K AO exposure through the (2×1)-O and oxide brims at the step edge showed that the height
of the oxide was about 0.15 nm and the step height was about 0.2 nm. The Ts = 700 K (2×1)-O
unit cell was measured and all stripe patterns in STM images at 350 K and 700 K partial TPDs
were within the standard deviation of the original (2×1)-O unit cell indicating that all stripe
patterns were (2×1)-O.
Similar to the other oxygen exposures, partial TPDs were also run on the 700 K AO
surface. The temperatures correspond to the onset of the sharp desorption feature (Ts = 730 K),
near the apex of the sharp desorption feature (Ts = 810 K), and the end of the sharp desorption
feature yet before the broad desorption feature corresponding to the Oad adlayer in the (2×1)-O
(Ts = 950 K). While the temperatures used as the endpoint in the partial TPD ramp varied
between the 350 K and 700 K AO experiments, there was internal consistency with the location
in the TPD. The TPD spectra are depicted in Figure 40.
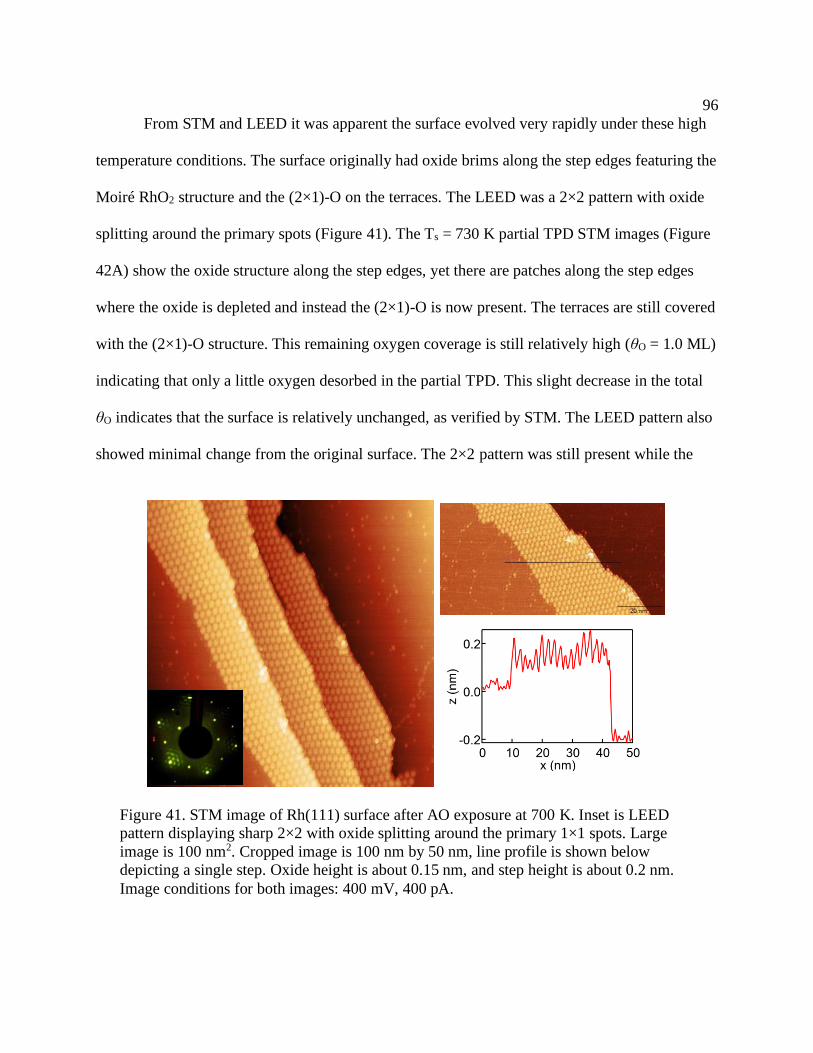
96
From STM and LEED it was apparent the surface evolved very rapidly under these high
temperature conditions. The surface originally had oxide brims along the step edges featuring the
Moiré RhO2 structure and the (2×1)-O on the terraces. The LEED was a 2×2 pattern with oxide
splitting around the primary spots (Figure 41). The Ts = 730 K partial TPD STM images (Figure
42A) show the oxide structure along the step edges, yet there are patches along the step edges
where the oxide is depleted and instead the (2×1)-O is now present. The terraces are still covered
with the (2×1)-O structure. This remaining oxygen coverage is still relatively high (θO = 1.0 ML)
indicating that only a little oxygen desorbed in the partial TPD. This slight decrease in the total
θO indicates that the surface is relatively unchanged, as verified by STM. The LEED pattern also
showed minimal change from the original surface. The 2×2 pattern was still present while the
Figure 41. STM image of Rh(111) surface after AO exposure at 700 K. Inset is LEED
pattern displaying sharp 2×2 with oxide splitting around the primary 1×1 spots. Large
image is 100 nm2. Cropped image is 100 nm by 50 nm, line profile is shown below
depicting a single step. Oxide height is about 0.15 nm, and step height is about 0.2 nm.
Image conditions for both images: 400 mV, 400 pA.
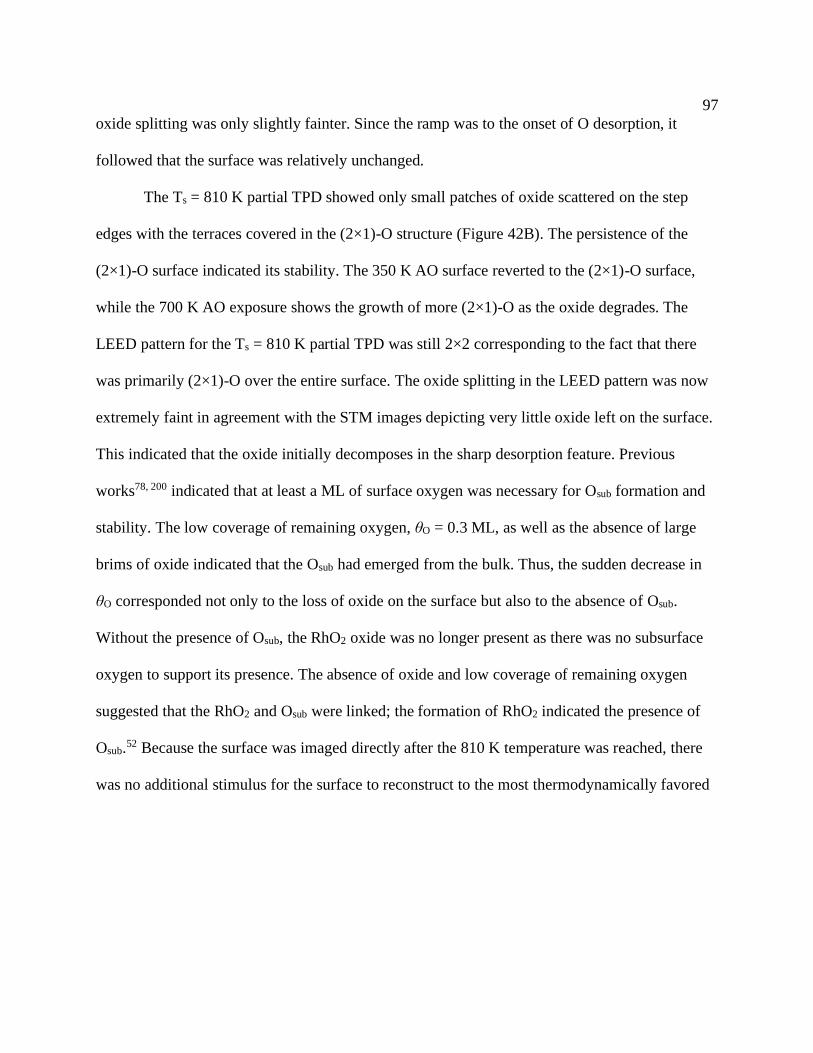
97
oxide splitting was only slightly fainter. Since the ramp was to the onset of O desorption, it
followed that the surface was relatively unchanged.
The Ts = 810 K partial TPD showed only small patches of oxide scattered on the step
edges with the terraces covered in the (2×1)-O structure (Figure 42B). The persistence of the
(2×1)-O surface indicated its stability. The 350 K AO surface reverted to the (2×1)-O surface,
while the 700 K AO exposure shows the growth of more (2×1)-O as the oxide degrades. The
LEED pattern for the Ts = 810 K partial TPD was still 2×2 corresponding to the fact that there
was primarily (2×1)-O over the entire surface. The oxide splitting in the LEED pattern was now
extremely faint in agreement with the STM images depicting very little oxide left on the surface.
This indicated that the oxide initially decomposes in the sharp desorption feature. Previous
works78, 200 indicated that at least a ML of surface oxygen was necessary for Osub formation and
stability. The low coverage of remaining oxygen, θO = 0.3 ML, as well as the absence of large
brims of oxide indicated that the Osub had emerged from the bulk. Thus, the sudden decrease in
θO corresponded not only to the loss of oxide on the surface but also to the absence of Osub.
Without the presence of Osub, the RhO2 oxide was no longer present as there was no subsurface
oxygen to support its presence. The absence of oxide and low coverage of remaining oxygen
suggested that the RhO2 and Osub were linked; the formation of RhO2 indicated the presence of
Osub.52 Because the surface was imaged directly after the 810 K temperature was reached, there
was no additional stimulus for the surface to reconstruct to the most thermodynamically favored
98
structure. Instead, the surface structure is homogeneously (2×1)-O, indicating that the emergence
of Osub is homogeneous.
The Ts = 950 K partial TPD presents a surface lacking oxygen (Figure 42C). The oxide
was completely gone, and the surface was covered in small patches of stochastic adsorbates. The
LEED displayed sharp 1×1 spots with a very faded 2×2. This partial TPD had only θO = 0.1 ML
indicating that most of the O had desorbed. The remaining oxygen was scattered randomly on the
Figure 42. STM images after partial TPD of Rh(111) after AO exposure at 700 K surface with
LEED pattern (62 eV). A) 730 K, B) 810 K, C) 950 K. Image conditions: A) 390 mV, 370 pA,
B) 460 mV, 370 pA, C) 390 mV, 370 pA.
99
surface, visible on top of bare metal patches implying that O desorption was homogeneous,
without preference to step edges or defect sites.
The surface structure evolution with increasing amounts of oxidized Rh(111) was
studied, and indicated that Osub emergence is a homogeneous process and does not appear to be
defect mediated. Based on TPD, STM, and LEED, the surface evolution of oxidized Rh(111)
occurred rapidly. The 60 L O2 surface showed little surface evolution as the surface originally
consisted of only Oad in the (2×1)-O. As the TPD temperature progressed, this surface consisted
of randomly adsorbed Oad; no adlayer structure was present. For the 350 K AO exposure, the
uniform surface changed from a mixture of the (2√3×2√3) R30° and (2×2)-3O structures to the
(2×1)-O structure indicating the homogeneous emergence of Osub from the bulk. Similarly, the
700 K AO exposure showed the interdependence of Osub and RhO2. For both the 700 K and 350
K AO exposures, after the original surface structure and the sharp desorption feature in the TPD
desorbed, the surface had minimal oxygen left. Through this study, it appeared that there was no
site preference for oxygen desorption. Rather the Osub emerged over the entire surface resulting
in uniform surface structures on the crystal surface throughout the TPD evolution. As the oxygen
was depleted on both highly oxidized and adlayer surface, the crystal displayed homogeneity.
There was growth of the metallic phase as the oxide shrinks, and the (2×1)-O disintegrated into a
disordered adlayer. This rapid surface evolution points to the conclusion that Osub was necessary
for the surface structures on the crystal, and once Osub had depleted, the surface consisted of
randomly adsorbed O.
100
CHAPTER SIX
CONCLUSIONS AND FUTURE DIRECTIONS
Work presented in this dissertation focuses on the formation of surface structures and
characterization of reactivity on catalytically active metal surfaces after atomic oxygen exposure,
specifically the study of oxygen coverages on Rh(111), Ag(111), and curved Ag(111).
Investigation into the reactivity and structural and chemical properties of these O induced surface
structures has been carried out including: 1) investigation into the (2×1)-O surface phase during
CO oxidation on Rh(111), 2) the formation and properties of Osub formation on Ag(111), 3) step
geometry effect on oxygen adsorption on curved Ag(111), and 4) the stability and evolution of
surface structures on Rh(111).
CO oxidation on surface adsorbed oxygen in the (2×1)-O structure on Rh(111) was
studied using LEED, STM, and TPD to determine the effects of surface temperature and
exposure duration on reactivity.204 It was shown that CO oxidation occurs at temperatures
between 100 - 350 K resulting in quantifiable CO2 yield and Ores. Varying the CO exposure
between 5 L and 300 L showed little change in CO2 yield and Ores since saturation occurred at
short exposures. While surface temperature does not affect CO2 yield or Ores up to 300 K, at
temperatures higher than room temperature both the CO2 yield and Ores amount decrease. This
decrease at T = 350 K indicates a different reaction pathway for oxidation on the surface.
Overall, this study demonstrated that CO oxidation over the (2×1)-O surface occurs via different
reaction pathways for temperatures above 300 K.204
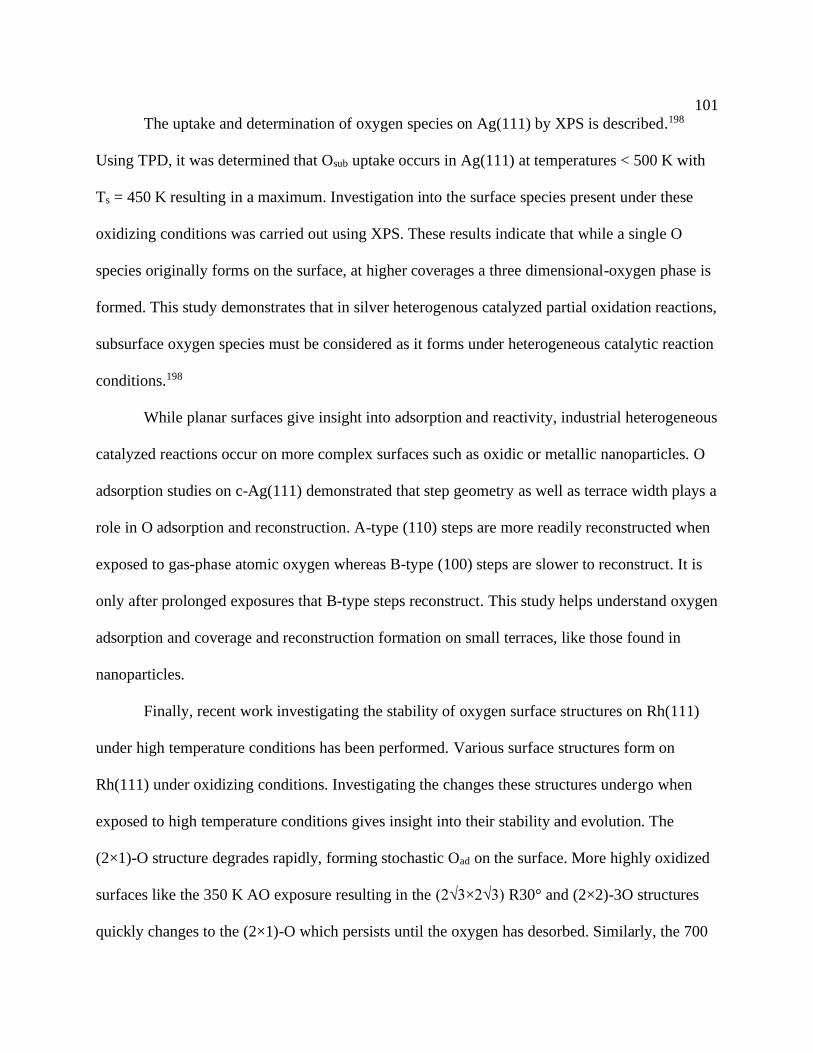
101
The uptake and determination of oxygen species on Ag(111) by XPS is described.198
Using TPD, it was determined that Osub uptake occurs in Ag(111) at temperatures < 500 K with
Ts = 450 K resulting in a maximum. Investigation into the surface species present under these
oxidizing conditions was carried out using XPS. These results indicate that while a single O
species originally forms on the surface, at higher coverages a three dimensional-oxygen phase is
formed. This study demonstrates that in silver heterogenous catalyzed partial oxidation reactions,
subsurface oxygen species must be considered as it forms under heterogeneous catalytic reaction
conditions.198
While planar surfaces give insight into adsorption and reactivity, industrial heterogeneous
catalyzed reactions occur on more complex surfaces such as oxidic or metallic nanoparticles. O
adsorption studies on c-Ag(111) demonstrated that step geometry as well as terrace width plays a
role in O adsorption and reconstruction. A-type (110) steps are more readily reconstructed when
exposed to gas-phase atomic oxygen whereas B-type (100) steps are slower to reconstruct. It is
only after prolonged exposures that B-type steps reconstruct. This study helps understand oxygen
adsorption and coverage and reconstruction formation on small terraces, like those found in
nanoparticles.
Finally, recent work investigating the stability of oxygen surface structures on Rh(111)
under high temperature conditions has been performed. Various surface structures form on
Rh(111) under oxidizing conditions. Investigating the changes these structures undergo when
exposed to high temperature conditions gives insight into their stability and evolution. The
(2×1)-O structure degrades rapidly, forming stochastic Oad on the surface. More highly oxidized
surfaces like the 350 K AO exposure resulting in the (2√3×2√3) R30° and (2×2)-3O structures
quickly changes to the (2×1)-O which persists until the oxygen has desorbed. Similarly, the 700
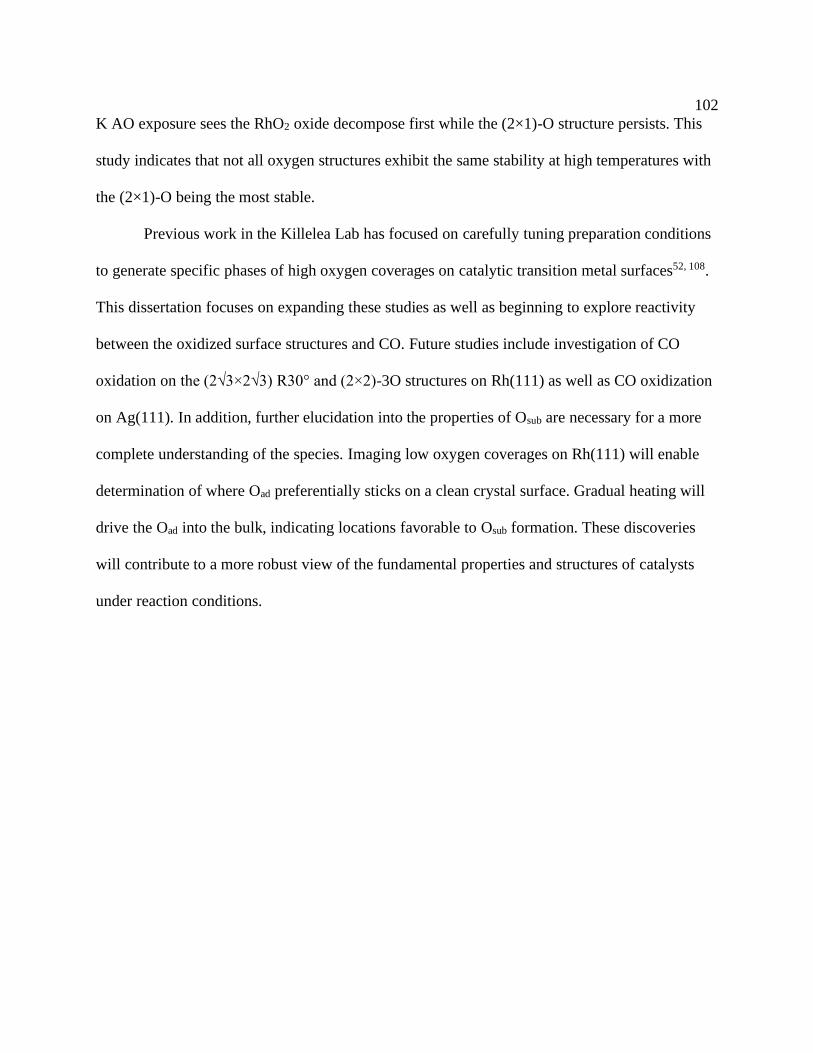
102
K AO exposure sees the RhO2 oxide decompose first while the (2×1)-O structure persists. This
study indicates that not all oxygen structures exhibit the same stability at high temperatures with
the (2×1)-O being the most stable.
Previous work in the Killelea Lab has focused on carefully tuning preparation conditions
to generate specific phases of high oxygen coverages on catalytic transition metal surfaces52, 108.
This dissertation focuses on expanding these studies as well as beginning to explore reactivity
between the oxidized surface structures and CO. Future studies include investigation of CO
oxidation on the (2√3×2√3) R30° and (2×2)-3O structures on Rh(111) as well as CO oxidization
on Ag(111). In addition, further elucidation into the properties of Osub are necessary for a more
complete understanding of the species. Imaging low oxygen coverages on Rh(111) will enable
determination of where Oad preferentially sticks on a clean crystal surface. Gradual heating will
drive the Oad into the bulk, indicating locations favorable to Osub formation. These discoveries
will contribute to a more robust view of the fundamental properties and structures of catalysts
under reaction conditions.

103
APPENDIX A
SUPPORTING INFORMATION FOR CHAPTER THREE
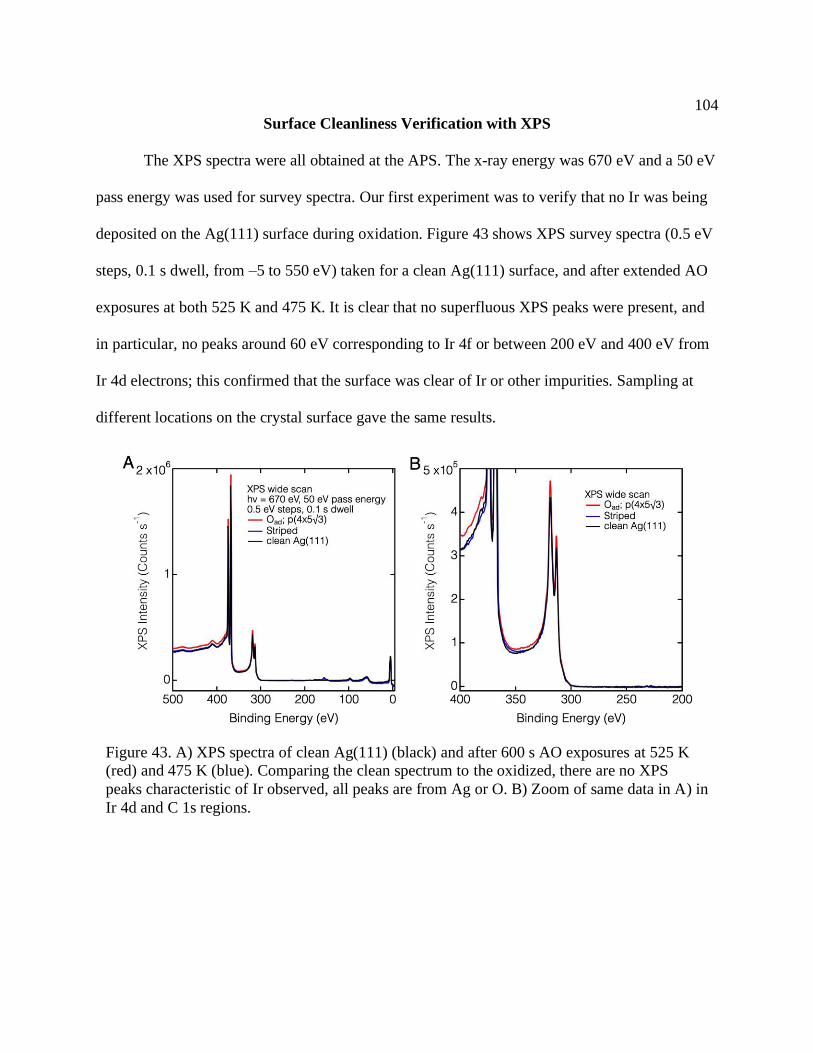
104
Surface Cleanliness Verification with XPS
The XPS spectra were all obtained at the APS. The x-ray energy was 670 eV and a 50 eV
pass energy was used for survey spectra. Our first experiment was to verify that no Ir was being
deposited on the Ag(111) surface during oxidation. Figure 43 shows XPS survey spectra (0.5 eV
steps, 0.1 s dwell, from –5 to 550 eV) taken for a clean Ag(111) surface, and after extended AO
exposures at both 525 K and 475 K. It is clear that no superfluous XPS peaks were present, and
in particular, no peaks around 60 eV corresponding to Ir 4f or between 200 eV and 400 eV from
Ir 4d electrons; this confirmed that the surface was clear of Ir or other impurities. Sampling at
different locations on the crystal surface gave the same results.
Figure 43. A) XPS spectra of clean Ag(111) (black) and after 600 s AO exposures at 525 K
(red) and 475 K (blue). Comparing the clean spectrum to the oxidized, there are no XPS
peaks characteristic of Ir observed, all peaks are from Ag or O. B) Zoom of same data in A) in
Ir 4d and C 1s regions.
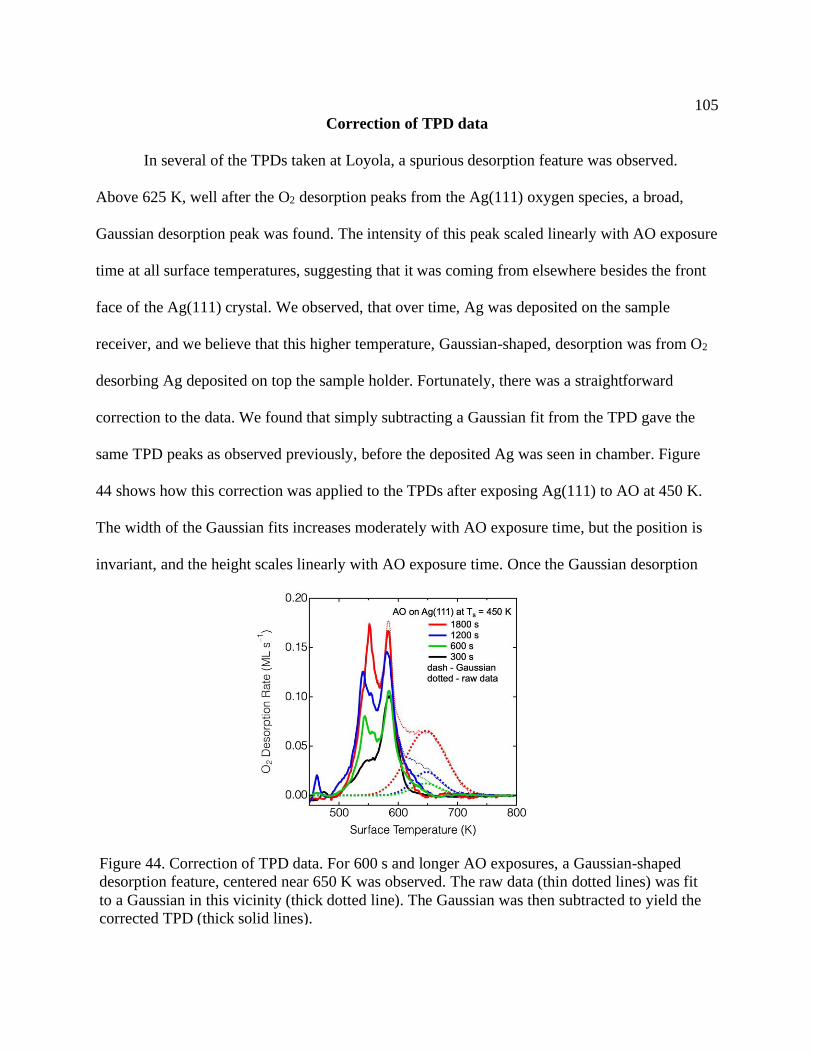
105
Correction of TPD data
In several of the TPDs taken at Loyola, a spurious desorption feature was observed.
Above 625 K, well after the O2 desorption peaks from the Ag(111) oxygen species, a broad,
Gaussian desorption peak was found. The intensity of this peak scaled linearly with AO exposure
time at all surface temperatures, suggesting that it was coming from elsewhere besides the front
face of the Ag(111) crystal. We observed, that over time, Ag was deposited on the sample
receiver, and we believe that this higher temperature, Gaussian-shaped, desorption was from O2
desorbing Ag deposited on top the sample holder. Fortunately, there was a straightforward
correction to the data. We found that simply subtracting a Gaussian fit from the TPD gave the
same TPD peaks as observed previously, before the deposited Ag was seen in chamber. Figure
44 shows how this correction was applied to the TPDs after exposing Ag(111) to AO at 450 K.
The width of the Gaussian fits increases moderately with AO exposure time, but the position is
invariant, and the height scales linearly with AO exposure time. Once the Gaussian desorption
Figure 44. Correction of TPD data. For 600 s and longer AO exposures, a Gaussian-shaped
desorption feature, centered near 650 K was observed. The raw data (thin dotted lines) was fit
to a Gaussian in this vicinity (thick dotted line). The Gaussian was then subtracted to yield the
corrected TPD (thick solid lines).

106
feature was removed, the TPD spectra were integrated and the O surface coverage was
quantified.
107
REFERENCE LIST
1. Védrine, J., Heterogeneous Catalysis on Metal Oxides. Catalysts 2017, 7.
2. Fechete, I.; Wang, Y.; Védrine, J. C., The Past, Present and Future of Heterogeneous
Catalysis. Catalysis Today 2012, 189, 2-27.
3. Schlogl, R., Heterogeneous Catalysis. Angew Chem Int Ed Engl 2015, 54, 3465-520.
4. Auras, S. V.; van Bree, R. A. B.; Bashlakov, D.; van Lent, R.; Juurlink, L. B. F., It’s Not
Just the Defects - a Curved Crystal Study of H2o Desorption from Ag. Physical Chemistry
Chemical Physics 2019.
5. Guo, Z.; Liu, B.; Zhang, Q.; Deng, W.; Wang, Y.; Yang, Y., Recent Advances in
Heterogeneous Selective Oxidation Catalysis for Sustainable Chemistry. Chem Soc Rev 2014,
43, 3480-524.
6. Christensen, C. H.; Norskov, J. K., A Molecular View of Heterogeneous Catalysis. J
Chem Phys 2008, 128, 182503.
7. Brown, T. L.; LeMay, H. E., Jr.; Bursten, B. E.; Murphy, C. J.; Woodward, P. M.,
Chemistry the Central Science, 12 ed.; Pearson Prentice Hall, 2012.
8. Atkins, P.; De Paula, J., Physical Chemistry, Thermodynamics, Structure, and Change,
10 ed.; Oxford University Press, 2014.
9. Schauermann, S.; Nilius, N.; Shaikhutdinov, S.; Freund, H. J., Nanoparticles for
Heterogeneous Catalysis- New Mechanistic Insights. Acc Chem Res 2013, 46, 1673–1681.
10. Norskov, J. K.; Studt, F.; Abild-Pedersen, F.; Bligaard, T., Fundamental Concepts in
Heterogeneous Catalysis; John Wiley & Sons, Inc., Hoboken, NJ, 2014.
11. Goodman, D. W., Model Studies in Catalysis Using Surface Science Probes. Chem Rev
1995, 95, 523-536.
12. Somorjai, G. A.; Aliaga, C., Molecular Studies of Model Surfaces of Metals from Single
Crystals to Nanoparticles under Catalytic Reaction Conditions. Evolution from Prenatal and
Postmortem Studies of Catalysts. Langmuir 2010, 26, 16190-203.
13. Roobler, M.; Geng, P.; Wintterlin, J., A High-Pressure Scanning Tunneling Microscope
for Studing Heterogeneous Catalysis. Rev Sci Instrum 2005, 76, 023705.
108
14. Bocklein, S.; Gunther, S.; Wintterlin, J., High-Pressure Scanning Tunneling Microscopy
of a Silver Surface During Catalytic Formation of Ethylene Oxide. Angew Chem Int Ed Engl
2013, 52, 5518-21.
15. Cernota, P.; Rider, K.; Yoon, H. A.; Salmeron, M.; Somorjai, G. A., Dense Structures
Formed by Co on Rh(111) Studied by Scanning Tunneling Microscopy. Surf Sci 2000, 445, 249-
255.
16. Laegsgaard, E.; O’steriund, L.; Thostrup, P.; Rasmussen, P. B.; Stensgaard, I.;
Besenbacher, F., A High-Pressure Scanning Tunneling Microscope. Rev Sci Instrum 2001, 72,
3537.
17. Mcintyre, B. J.; Salmeron, M.; Somorjai, G. A., A Variable Pressure/Temperature
Scanning Tunneling Microscope for Surface Science and Catalysis Studies. Rev Sci Instrum
1993, 64, 687.
18. Lundgren, E.; Zhang, C.; Merte, L. R.; Shipilin, M.; Blomberg, S.; Hejral, U.; Zhou, J.;
Zetterberg, J.; Gustafson, J., Novel in Situ Techniques for Studies of Model Catalysts. Acc Chem
Res 2017, 50, 2326-2333.
19. Shipilin, M., et al., Quantitative Surface Structure Determination Using in Situ High-
Energy Sxrd: Surface Oxide Formation on Pd(100) During Catalytic Co Oxidation. Surface
Science 2014, 630, 229-235.
20. Gustafson, J.; Westerstrom, R.; Balmes, O.; Resta, A.; van Rijn, R.; Torrelles, X.;
Herbschleb, C. T.; Frenken, J. W. M.; Lundgren, E., Catalytic Activity of the Rh Surface Oxide-
Co Oxidation over Rh(111) under Realistic Conditions. Journal of Physical Chemistry C 2010,
114, 4580-4583.
21. Zhou, J.; Blomberg, S.; Gustafson, J.; Lundgren, E.; Zetterberg, J., Visualization of Gas
Distribution in a Model Ap-Xps Reactor by Plif: Co Oxidation over a Pd(100) Catalyst.
Catalysts 2017, 7.
22. Castillo, R.; Navarro-Jaén, S.; Romero-Sarria, F.; Pérez-Dieste, V.; Escudero, C.;
Centeno, M. Á.; Daturi, M.; Odriozola, J. A., Free-Carbon Surface for Ptcu Nanoparticles: An in
Situ near Ambient Pressure X-Ray Photoelectron Spectroscopy Study. The Journal of Physical
Chemistry C 2020.
23. Somorjai, G. A., Modern Surface Science and Surface Technologies- an Introduction.
Chem Rev 1996, 96, 1223-1235.
24. Somorjai, G. A.; Park, J. Y., Concepts, Instruments, and Model Systems That Enabled the
Rapid Evolution of Surface Science. Surface Science 2009, 603, 1293-1300.
25. Topsøe, H., Developments in Operando Studies and in Situ Characterization of
Heterogeneous Catalysts. Journal of Catalysis 2003, 216, 155-164.
109
26. Gao, F.; Goodman, D. W., Model Catalysts: Simulating the Complexities of
Heterogeneous Catalysts. Annu Rev Phys Chem 2012, 63, 265-86.
27. Schauermann, S.; Freund, H. J., Model Approach in Heterogeneous Catalysis: Kinetics
and Thermodynamics of Surface Reactions. Acc Chem Res 2015, 48, 2775-82.
28. Freund, H. J., The Surface Science of Catalysis and More, Using Ultrathin Oxide Films
as Templates: A Perspective. J Am Chem Soc 2016, 138, 8985-96.
29. Thiel, P. A.; Yates, J. T.; Weinberg, W. H., The Interaction of Oxygen with the Rh(111)
Surface. Surf Sci 1979, 82, 22-44.
30. Montemore, M. M.; van Spronsen, M. A.; Madix, R. J.; Friend, C. M., O2 Activation by
Metal Surfaces: Implications for Bonding and Reactivity on Heterogeneous Catalysts. Chem Rev
2018, 118, 2816-2862.
31. Kohler, L., et al., High-Coverage Oxygen Structures on Rh111: Adsorbate Repulsion and
Site Preference Is Not Enough. Phys Rev Lett 2004, 93, 266103.
32. Somorjai, G. A.; Li, Y. J., Introduction to Surface Chemistry and Catalysis, 2nd Ed.;
John Wiley & Sons, Inc., Hoboken, NJ, 2010.
33. Langmuir, I., The Adsorption of Gases on Plane Surfaces of Glass, Mica and Platinum.
Journal of the American Chemical Society 1918, 40, 1361-1403.
34. Weaver, J. F., Surface Chemistry of Late Transition Metal Oxides. Chem Rev 2013, 113,
4164-215.
35. Lundgren, E.; Mikkelsen, A.; Andersen, J. N.; Kresse, G.; Schmid, M.; Varga, P., Surface
Oxides on Close-Packed Surfaces of Late Transition Metals. J Phys Condens Matter 2006, 18,
R481-R499.
36. Schalow, T.; Laurin, M.; Brandt, B.; Schauermann, S.; Guimond, S.; Kuhlenbeck, H.;
Starr, D. E.; Shaikhutdinov, S. K.; Libuda, J.; Freund, H. J., Oxygen Storage at the Metal/Oxide
Interface of Catalyst Nanoparticles. Angew Chem Int Ed Engl 2005, 44, 7601-5.
37. Zhang, F.; Li, T.; Pan, L.; Asthagiri, A.; Weaver, J. F., Co Oxidation on Single and
Multilayer Pd Oxides on Pd(111): Mechanistic Insights from Rairs. Catal. Sci. Technol. 2014, 4,
3826-3834.
38. Lundgren, E., et al., The Surface Oxide as a Source of Oxygen on Rh(1 1 1). Journal of
Electron Spectroscopy and Related Phenomena 2005, 144-147, 367-372.
39. Lundgren, E.; Kresse, G.; Klein, C.; Borg, M.; Andersen, J. N.; De Santis, M.; Gauthier,
Y.; Konvicka, C.; Schmid, M.; Varga, P., Two-Dimensional Oxide on Pd(111). Phys Rev Lett
2002, 88, 246103.
110
40. Bradley Shumbera, R.; Kan, H. H.; Weaver, J. F., The Transition from Surface to Bulk
Oxide Growth on Pt(100): Precursor-Mediated Kinetics. Surface Science 2007, 601, 4809-4816.
41. Devarajan, S. P.; Hinojosa, J. A.; Weaver, J. F., Stm Study of High-Coverage Structures
of Atomic Oxygen on Pt(111): P(2×1) and Pt Oxide Chain Structures. Surface Science 2008,
602, 3116-3124.
42. Flege, J. I.; Sutter, P., In Situ Structural Imaging of Co Oxidation Catalysis on Oxidized
Rh(111). Phys Rev B 2008, 78, 153402.
43. Gustafson, J., et al., Structure and Catalytic Reactivity of Rh Oxides. Catalysis Today
2009, 145, 227-235.
44. Blomberg, S.; Lundgren, E.; Westerström, R.; Erdogan, E.; Martin, N. M.; Mikkelsen,
A.; Andersen, J. N.; Mittendorfer, F.; Gustafson, J., Structure of the Rh2o3(0001) Surface.
Surface Science 2012, 606, 1416-1421.
45. Gustafson, J., et al., Self-Limited Growth of a Thin Oxide Layer on Rh(111). Phys Rev
Lett 2004, 92, 126102.
46. Mittendorfer, F., Low-Dimensional Surface Oxides in the Oxidation of Rh Particles. J
Phys Condens Matter 2010, 22, 393001.
47. Li, W. X.; Stampfl, C.; Scheffler, M., Subsurface Oxygen and Surface Oxide Formation
at Ag(111): A Density-Functional Theory Investigation. Physical Review B 2003, 67.
48. Todorova, M.; Li, W. X.; Ganduglia-Pirovano, M. V.; Stampfl, C.; Reuter, K.; Scheffler,
M., Role of Subsurface Oxygen in Oxide Formation at Transition Metal Surfaces. Phys Rev Lett
2002, 89, 096103.
49. Li, L.; Yang, J. C., Complex Oxide Structures Formed by Oxidation of Ag(100) and
Ag(111) by Hyperthermal Atomic Oxygen. Materials at High Temperatures 2014, 20, 601-606.
50. Derouin, J.; Farber, R. G.; Heslop, S. L.; Killelea, D. R., Formation of Surface Oxides
and Ag 2 O Thin Films with Atomic Oxygen on Ag(111). Surface Science 2015, 641, L1-L4.
51. Derouin, J.; Farber, R. G.; Killelea, D. R., Combined Stm and Tpd Study of Rh(111)
under Conditions of High Oxygen Coverage. J Phys Chem C 2015, 119, 14748-14755.
52. Farber, R. G.; Turano, M. E.; Oskorep, E. C.; Wands, N. T.; Iski, E. V.; Killelea, D. R.,
The Quest for Stability- Structural Dependence of Rh(111) on Oxygen Coverage at Elevated
Temperature. J Phys Chem C 2017, 121, 10470-10475.
53. Savio, L.; Vattuone, L.; Rocca, M., From Adsorption at the Surface to Incorporation into
Subsurface Sites: The Role of Steps for O/Ag. Applied Physics A 2007, 87, 399-404.
111
54. Gibson, K. D.; Killelea, D. R.; Sibener, S. J., Comparison of the Surface and Subsurface
Oxygen Reactivity and Dynamics with Co Adsorbed on Rh(111). The Journal of Physical
Chemistry C 2014, 118, 14977-14982.
55. Wider, J.; Greber, T.; Wetli, E.; Kreutz, T. J.; Schwaller, P.; Osterwalder, J., Direct
Observation of Subsurface Oxygen on Rh(111). Surf Sci 1998, 417, 301-310.
56. Rehren, C.; Isaac, G.; Schlogl, R.; Ertl, G., Surface and Subsurface Products of the
Interaction of O2 with Ag under Catalytic Conditions. Catalysis Letters 1991, 11, 253-266.
57. Xu, Y.; Greeley, J.; Mavrikakis, M., Effect of Subsurface Oxygen on the Reactivity of
the Ag(111) Surface. J Am Chem Soc 2005, 127, 12823-12827.
58. Nagy, A. J.; Mestl, G., High Temperature Partial Oxidation Reactions over Ag Catalysts.
Applied Catalysis A: General 1999, 188, 337-353.
59. Gustafson, J., et al., The Role of Oxides in Catalytic Co Oxidation over Rhodium and
Palladium. Acs Catalysis 2018, 8, 4438-4445.
60. Xie, S.; Liu, X. Y.; Xia, Y., Shape-Controlled Syntheses of Rhodium Nanocrystals for
the Enhancement of Their Catalytic Properties. Nano Research 2015, 8, 82-96.
61. Bardi, U.; Caporali, S., Precious Metals in Automotive Technology: An Unsolvable
Depletion Problem? Minerals 2014, 4, 388-398.
62. Zhao, Z.-J.; Moskaleva, L. V.; Rösch, N., Ring-Opening Reactions of
Methylcyclopentane over Metal Catalysts, M = Pt, Rh, Ir, and Pd: A Mechanistic Study from
First-Principles Calculations. ACS Catalysis 2013, 3, 196-205.
63. Quek, X.-Y.; Guan, Y.; Hensen, E. J. M., Structure Sensitivity in the Hydrogenation of
Unsaturated Hydrocarbons over Rh Nanoparticles. Catalysis Today 2012, 183, 72-78.
64. Campos-Skrobot, F. C.; Rizzo-Domingues, R. C. P.; Fernandes-Machado, N. R. C.;
Cantão, M. P., Novel Zeolite-Supported Rhodium Catalysts for Ethanol Steam Reforming.
Journal of Power Sources 2008, 183, 713-716.
65. Cavallaro, S., Ethanol Steam Reforming on Rh:Al2o3 Catalysts. Energy & Fuels 2000,
14, 1195-1199.
66. Wang, R.; He, H.; Wang, J.; Liu, L.; Dai, H., Shape-Regulation: An Effective Way to
Control Co Oxidation Activity over Noble Metal Catalysts. Catalysis Today 2013, 201, 68-78.
67. Zhang, Y.; Grass, M. E.; Huang, W.; Somorjai, G. A., Seedless Polyol Synthesis and Co
Oxidation Activity of Monodisperse (111)- and (100)-Oriented Rhodium Nanocrystals in Sub-10
Nm Sizes. Langmuir 2010, 26, 16463-8.
112
68. Holles, J. H.; Switzer, M. A.; Davis, R. J., Influence of Ceria and Lanthana Promoters on
the Kinetics of No and N2o Reduction by Co over Alumina-Supported Palladium and Rhodium.
Journal of Catalysis 2000, 190, 247-260.
69. Renzas, J. R.; Zhang, Y.; Huang, W.; Somorjai, G. A., Rhodium Nanoparticle Shape
Dependence in the Reduction of No by Co. Catalysis Letters 2009, 132, 317-322.
70. Mavrikakis, M.; Rempel, J.; Greeley, J.; Hansen, L. B.; Nørskov, J. K., Atomic and
Molecular Adsorption on Rh(111). The Journal of Chemical Physics 2002, 117, 6737-6744.
71. Oura, K.; Lifshits, V. G.; Saranin, A. A.; Zotov, A. V.; Katayama, M., Surface Science an
Introduction.
72. Grant, J. T.; Haas, T. W., A Study of Ru(0001) and Rh(111) Surfaces Using Leed and
Auger Electron Spectroscopy. Surf Sci 1970, 21, 76-85.
73. Castner, D. G.; Sexton, B. A.; Somorjai, G. A., Leed and Thermal Desorption Studies of
Small Molecules (H2, O2, Co, Co2, No, C2h4, C2h2, and C) Chemisorbed on the Rhodium
(111) and (100) Surfaces. Surf Sci 1978, 71, 519-540.
74. Xu, H.; Ng, K. Y. S., Stm Study of Oxygen on Rh(111). Surf Sci 1997, 375, 161-170.
75. Wong, K. C.; Liu, W.; Mitchell, K. A. R., Leed Crystallographic Analysis for the
Rh(111)-(2 X 1)-O Surface Structure. Surf Sci 1996, 360, 137-143.
76. Marchini, S.; Sachs, C.; Wintterlin, J., Stm Investigation of the (2×2)O and (2×1)O
Structures on Rh(111). Surface Science 2005, 592, 58-64.
77. Ganduglia-Pirovano, M. V.; Scheffler, M., Structural and Electronic Properties of
Chemisorbed Oxygen on Rh(111). Phys Rev B 1999, 59.
78. Gibson, K. D.; Viste, M.; Sanchez, E.; Sibener, S. J., Physical and Chemical Properties of
High Density Atomic Oxygen Overlayers under Ultrahigh Vacuum Conditions: (1×1)-
O/Rh(111). The Journal of Chemical Physics 2000, 112, 2470-2478.
79. Gibson, K. D.; Viste, M.; Sanchez, E. C.; Sibener, S. J., High Density Adsorbed Oxygen
on Rh(111) and Enhanced Routes to Metallic Oxidation Using Atomic Oxygen. The Journal of
Chemical Physics 1999, 110, 2757-2760.
80. Farber, R. G.; Turano, M. E.; Killelea, D. R., Identification of Surface Sites for Low-
Temperature Heterogeneously Catalyzed Co Oxidation on Rh(111). ACS Catalysis 2018, 8,
11483-11490.
81. Lee, S. H.; Jun, B. H., Silver Nanoparticles: Synthesis and Application for
Nanomedicine. Int J Mol Sci 2019, 20.
113
82. Martin, N. M.; Klacer, S.; Gronbeck, H.; Knudsen, J.; Blomberg, S.; Gustafson, J.;
Lundgren, E., High-Coverage Oxygen-Induced Surface Structures on Ag(111). J Phys Chem C
2014, 118, 15324-15331.
83. Michaelides, A.; Reuter, K.; Scheffler, M., When Seeing Is Not Believing: Oxygen on
Ag(111), a Simple Adsorption System? JVSTA 2005, 23, 1487.
84. Aljama, H.; Yoo, J. S.; Nørskov, J. K.; Abild-Pedersen, F.; Studt, F., Methanol Partial
Oxidation on Ag(1 1 1) from First Principles. ChemCatChem 2016, 8, 3621-3625.
85. Andreasen, A.; Lynggaard, H.; Stegelmann, C.; Stoltze, P., A Microkinetic Model of the
Methanol Oxidation over Silver. Surface Science 2003, 544, 5-23.
86. Özbek, M. O.; van Santen, R. A., The Mechanism of Ethylene Epoxidation Catalysis.
Catalysis Letters 2013, 143, 131-141.
87. Li, W.-X.; Stampfl, C.; Scheffler, M., Subsurface Oxygen and Surface Oxide Formation
at Ag(111): A Density-Functional Theory Investigation. Physical Review B 2003, 67.
88. Rebsdat, S.; Mayer, D., Ethylene Oxide. In Ullmann's Encyclopedia of Industrial
Chemistry, 2001.
89. Rovida, G.; Pratesi, F.; Maglietta, M.; Ferroni, E., Effects of Oxygen on Silver Surface
Structure. Journal of Vacuum Science and Technology 1972, 9, 796-799.
90. Rovida, G.; Pratesi, F.; Maglietta, M.; Ferroni, E., Chemisorption of Oxygen on the
Silver(111) Surface. Surf Sci 1974, 43, 230-256.
91. Czanderna, A. W., The Adsorption of Oxygen on Silver. J Phys Chem 1964, 68, 2765.
92. Albers, H.; Van Der Wal, W. J. J.; Bootsma, G. A., Ellipsometric Study of Oxygen
Adsorption and the Carbon Monoxide Oxygen Interaction on Ordered and Damaged Ag(111). 68
1977, 47-56.
93. Tibbetts, G. G.; Burkstrand, J. M., Electronic Properties of Adsorbed Layers of Nitrogen,
Oxygen, and Sulfur on Silver (111). Phys Rev B 1977, 16, 1537-1541.
94. Grant, R. B.; Lambert, R. M., Basic Studies of the Oxygen Surface Chemistry of Silver-
Chemisorbed Atomic and Molecular Species on Pure Ag(111). Surf Sci 1984, 146, 256-268.
95. Campbell, C. T., Atomic and Molecular O Adsorption on Ag111. Surf Sci 1985, 157, 43-
60.
96. Bare, S. R.; Griffiths, K.; Lennard, W. N.; Tang, H. T., Generation of Atomic Oxygen on
Ag(111) and Ag(110) Using No2: A Tpd, Leed, Hreels, Xps and Nra Study. Surface Science
1995, 342, 185-198.
114
97. Raukema, A.; Butler, D. A.; Box, F. M. A.; Kleyn, A. W., Dissociative and Non-
Dissociative Sticking of O2 at the Ag111 Surface. Surf Sci 1996, 347, 151-168.
98. Bukhtiyarov, V. I.; Kaichev, V. V.; Prosvirin, I. P., Oxygen Adsorption on Ag(111): X-
Ray Photoelectron Spectroscopy (Xps), Angular Dependent X-Ray Photoelectron Spectroscopy
(Adxps) and Temperature-Programmed Desorption (Tpd) Studies. The Journal of Chemical
Physics 1999, 111, 2169-2175.
99. Carlisle, C. I.; King, D. A.; Bocquet, M. L.; Cerda, J.; Sautet, P., Imaging the Surface and
the Interface Atoms of an Oxide Film on Ag 111 by Scanning Tunneling Microscopy-
Experiment and Theory. Phys Rev Lett 2000, 84, 3899-3902.
100. Carlisle, C. I.; Fujimoto, T.; Sim, W. S.; King, D. A., Atomic Imaging of the Transition
between Oxygen Chemisorption and Oxide Film Growth on Ag(111). Surf Sci 2000, 470, 15-31.
101. Schnadt, J.; Michaelides, A.; Knudsen, J.; Vang, R. T.; Reuter, K.; Laegsgaard, E.;
Scheffler, M.; Besenbacher, F., Revisiting the Structure of the P(4 X 4) Surface Oxide on
Ag(111). Phys Rev Lett 2006, 96, 146101.
102. Michaelides, A.; Bocquet, M. L.; Sautet, P.; Alavi, A.; King, D. A., Structures and
Thermodynamic Phase Transitions for Oxygen and Silver Oxide Phases on Ag{1 1 1}. Chem
Phys Lett 2003, 367, 344-350.
103. Schmid, M., et al., Structure of Ag(111)-P(4 X 4)-O: No Silver Oxide. Phys Rev Lett
2006, 96, 146102.
104. Reichelt, R.; Gunther, S.; Wintterlin, J.; Moritz, W.; Aballe, L.; Mentes, T. O., Low
Energy Electron Diffraction and Low Energy Electron Microscopy Microspot I/V Analysis of
the (4 X 4)O Structure on Ag(111): Surface Oxide or Reconstruction? J Chem Phys 2007, 127,
134706.
105. Schnadt, J.; Knudsen, J.; Hu, X. L.; Michaelides, A.; Vang, R. T.; Reuter, K.; Li, Z.;
Lægsgaard, E.; Scheffler, M.; Besenbacher, F., Experimental and Theoretical Study of Oxygen
Adsorption Structures on Ag(111). Physical Review B 2009, 80.
106. Zhou, L.; Gao, W.; Klust, A.; Madix, R. J., Stabilization of Surface Reaction
Intermediates by Added Metal Atoms on Metal Surfaces of Low Free Energy. J Chem Phys
2008, 128, 054703.
107. Klust, A.; Madix, R. J., Mesoscopic Restructuring and Mass Transport of Metal Atoms
During Reduction of the Ag(111)-P(4x4)-O Surface with Co. J Chem Phys 2007, 126, 084707.
108. Derouin, J.; Farber, R. G.; Turano, M. E.; Iski, E. V.; Killelea, D. R., Thermally Selective
Formation of Subsurface Oxygen in Ag(111) and Consequent Surface Structure. ACS Catalysis
2016, 6, 4640-4646.
115
109. Kokalj, A.; Bonini, N.; Dal Corso, A.; de Gironcoli, S.; Baroni, S., On-Surface and
Subsurface Adsorption of Oxygen on Stepped Ag(210) and Ag(410) Surfaces. Surface Science
2004, 566-568, 1107-1111.
110. Li, W.-X.; Stampfl, C.; Scheffler, M., Oxygen Adsorption on Ag(111): A Density-
Functional Theory Investigation. Physical Review B 2002, 65.
111. Bao, X.; Muhler, M.; Schedel-Niedrig, T.; Schlogl, R., Interaction of O with Ag at High
Temperature and Atmospheric Pressure a Spectroscopic and Structural Analysis of a Strongly
Bound. Phys Rev B 1996, 54.
112. Janlamool, J.; Bashlakov, D.; Berg, O.; Praserthdam, P.; Jongsomjit, B.; Juurlink, L. B.,
Desorption of Water from Distinct Step Types on a Curved Silver Crystal. Molecules 2014, 19,
10845-62.
113. Ortega, J. E.; Vasseur, G.; Piquero-Zulaica, I.; Matencio, S.; Valbuena, M. A.; Rault, J.
E.; Schiller, F.; Corso, M.; Mugarza, A.; Lobo-Checa, J., Structure and Electronic States of
Vicinal Ag(111) Surfaces with Densely Kinked Steps. New Journal of Physics 2018, 20.
114. Juurlink, L.; Auras, S. V.; van Lent, R.; Bashlakov, D.; Pineiros Bastidas, J. M.; Roorda,
T.; Rick, S., Scaling Pt-Catalyzed Hydrogen Dissociation on Corrugated Surfaces. Angew Chem
Int Ed Engl 2020.
115. Corso, M.; Schiller, F.; Fern´andez, L.; Cord´on, J.; Ortega, J. E., Electronic States in
Faceted Au(111) Studied with Curved Crystal Surfaces. J Phys Condens Matter 2009, 21,
353001.
116. Ortega, J. E.; Corso, M.; Abd-el-Fattah, Z. M.; Goiri, E. A.; Schiller, F., Interplay
between Structure and Electronic States in Step Arrays Explored with Curved Surfaces. Physical
Review B 2011, 83.
117. Blomberg, S., et al., Strain Dependent Light-Off Temperature in Catalysis Revealed by
Planar Laser-Induced Fluorescence. ACS Catalysis 2016, 7, 110-114.
118. Groot, I. M.; Kleyn, A. W.; Juurlink, L. B., The Energy Dependence of the Ratio of Step
and Terrace Reactivity for H2 Dissociation on Stepped Platinum. Angew Chem Int Ed Engl 2011,
50, 5174-7.
119. van der Niet, M. J.; den Dunnen, A.; Juurlink, L. B.; Koper, M. T., The Influence of Step
Geometry on the Desorption Characteristics of O2, D2, and H2o from Stepped Pt Surfaces. J
Chem Phys 2010, 132, 174705.
120. Garcia-Martinez, F.; Schiller, F.; Blomberg, S.; Shipilin, M.; Merte, L. R.; Gustafson, J.;
Lundgren, E.; Ortega, J. E., Co Chemisorption on Vicinal Rh(111) Surfaces Studied with a
Curved Crystal. The Journal of Physical Chemistry C 2020, 124, 9305-9313.
116
121. Boukha, Z.; Gil-Calvo, M.; de Rivas, B.; Gonzalez-Velasco, J. R.; Gutierrez-Ortiz, J. I.;
Lopez-Fonseca, R., Behavior of Rh Supported on Hydroxyapatite Catalysts in Partial Oxidation
and Stream Reforming of Methane- on the Role of the Speciation of the Rh Particles. Applied
Catalysis A: General 2018, 556, 191-203.
122. Michael, B. C.; Donazzi, A.; Schmidt, L. D., Effects of H2o and Co2 Addition in
Catalytic Partial Oxidation of Methane on Rh. Journal of Catalysis 2009, 265, 117-129.
123. York, A. P. E.; Xiao, T.; Green, M. L. H., Brief Overview of the Partial Oxidation of
Methane Ot Synthesis Gas. Topics in Catalysis 2003, 22, 345-358.
124. Wei, W.; Huang, W. X.; White, J. M., Adsorption of Styrene on Ag(111). Surface
Science 2004, 572, 401-408.
125. Zhang, C.; Lundgren, E.; Carlsson, P. A.; Balmes, O.; Hellman, A.; Merte, L. R.;
Shipilin, M.; Onderwaater, W.; Gustafson, J., Faceting of Rhodium(553) in Realistic Reaction
Mixtures of Carbon Monoxide and Oxygen. The Journal of Physical Chemistry C 2015, 119,
11646-11652.
126. Peden, C. H. F.; Goodman, D. W.; Blair, D. S.; Berlowitz, P. J.; Fisher, G. B.; Oh, S. H.,
Kinetics of Carbon Monoxide Oxidation by Oxygen or Nitric Oxide on Rhodium(111) and
Rhodium(100) Single Crystals. J. Phys. Chem. 1988, 92, 1563-1567.
127. Wilson, J. N.; Pedigo, R. A.; Zaera, F., Kinetics and Mechanism of Catalytic Partial
Oxidation Reactions of Alkanes on Rhodium Surfaces. J Am Chem Soc 2008, 130, 15796-15797.
128. Gibson, K. D.; Viste, M.; Sibener, S. J., Applied Reaction Dynamics: Efficient Synthesis
Gas Production Via Single Collision Partial Oxidation of Methane to Co on Rh111. J Chem Phys
2006, 125, 133401.
129. Farber, R. G.; Turano, M. E.; Oskorep, E. C.; Wands, N. T.; Juurlink, L. B.; Killelea, D.
R., Exposure of Pt(5 5 3) and Rh(1 1 1) to Atomic and Molecular Oxygen: Do Defects Enhance
Subsurface Oxygen Formation? J Phys Condens Matter 2017, 29, 164002.
130. Brault, P.; Range, H.; Toennies, J. P., Molecular Beam Studies of Sticking of Oxygen on
the Rh(111) Surface. J Chem Phys 1996, 106, 8876.
131. Schwegmann, S.; Over, H.; De Renzi, V.; Ertl, G., The Atomic Geometry of the O and
Co + O Phases on Rh(Lll). Surface Science 1997, 375, 91-106.
132. Peterlinz, K. A.; Sibener, S. J., Absorption, Adsorption, and Desorption Studies of the
Oxygenrh(Lll) System Using 02, No, and No2. J. Phys. Chem. 1995, 99, 2817-2825.
133. Koestner, R. J.; Van Hove, M. A.; Somorjai, G. A., A Surface Crystallography Study by
Dynamical Leed of the (√3 by √3)R30° Co Structure on the Rh(111) Crystal-Surface. Surf
Sci 1981, 107, 439-458.
117
134. Dubois, L. H.; Somorjai, G. A., The Chemisorption of Co and Co2 on Rh(111) Studied
by High Resolution Electron Energy Loss Spectroscopy. Surf Sci 1980, 91, 512-532.
135. Van Hove, M. A.; Koestner, R. J.; Frost, J. C.; Somorjai, G. A., The Structure of
Rh(111)(2x2)-3co from Leed Intensities - Simultaneous Bridge and near-Top Adsorption in a
Distorted Compact Hexagonal Co Overlayer. Surface Science 1983, 129, 482-506.
136. Hopstaken, M. J. P.; Niemantsverdriet, J. W., Structure Sensitivity in the Co Oxidation
on Rhodium: Effect of Adsorbate Coverages on Oxidation Kinetics on Rh(100) and Rh(111). J
Chem Phys 2000, 113, 5457.
137. Jaworowski, A. J.; Beutler, A.; Strisland, F.; Nyholm, R.; Setlik, B. J.; Heskett, D.;
Andersen, J. N., Adsorption Sites in O and Co Coadsorption Phases on Rh(111) Investigated by
High-Resolution Core-Level Photoemission. Surf Sci 1999, 431, 33-41.
138. Gao, F.; McClure, S. M.; Cai, Y.; Gath, K. K.; Wang, Y.; Chen, M. S.; Guo, Q. L.;
Goodman, D. W., Co Oxidation Trends on Pt-Group Metals from Ultrahigh Vacuum to near
Atmospheric Pressures: A Combined in Situ Pm-Iras and Reaction Kinetics Study. Surface
Science 2009, 603, 65-70.
139. Feulner, P.; Menzel, D., Simple Ways to Improve ’’Flash Desorption’’ Measurements
from Single Crystal Surfaces. Journal of Vacuum Science and Technology 1980, 17, 662-663.
140. Nečas, D.; Klapetek, P., Gwyddion: An Open-Source Software for Spm Data Analysis.
Cent. Eur. J. Phys. 2012, 10, 181-188.
141. Krenn, G.; Bako, I.; Schennach, R., Co Adsorption and Co and O Coadsorption on
Rh(111) Studied by Reflection Absorption Infrared Spectroscopy and Density Functional
Theory. J Chem Phys 2006, 124, 144703.
142. Seebauer, E. G.; Kong, A. C. F.; Schmidt, L. D., Surface Diffusion of Hydrogen and Co
on Rh(111): Laser‐Induced Thermal Desorption Studies. The Journal of Chemical Physics
1988, 88, 6597-6604.
143. Neugebohren, J., et al., Velocity-Resolved Kinetics of Site-Specific Carbon Monoxide
Oxidation on Platinum Surfaces. Nature 2018, 558, 280-283.
144. Lai, S. C. S.; Lebedeva, N. P.; Housmans, T. H. M.; Koper, M. T. M., Mechanisms of
Carbon Monoxide and Methanol Oxidation at Single-Crystal Electrodes. Topics in Catalysis
2007, 46, 320-333.
145. Campbell, C. T., Atomic and Molecular Oxygen Adsorption on Ag(111). Surf. Sci. 1985,
157, 43-60.
146. Xu, Y.; Greeley, J.; Mavrikakis, M., Effect of Subsurface Oxygen on the Reactivity of
the Ag(111) Surface. J. Am. Chem. Soc. 2005, 127, 12823-12827.
118
147. Grant, R. B.; Lambert, R. M., Basic Studies of the Oxygen-Surface Chemistry of Silver -
Chemisorbed Atomic and Molecular-Species on Pure Ag(111). Surf. Sci. 1984, 146, 256-268.
148. Madix, R. J., Molecular-Transformations on Single-Crystal Metal-Surfaces. Science
1986, 233, 1159-1166.
149. Bao, X.; Barth, J. V.; Lehmpfuhl, G.; Schuster, R.; Uchida, Y.; Schlogl, R.; Ertl, G.,
Oxygen-Induced Restructuring of Ag(111). Surf. Sci. 1993, 284, 14-22.
150. Bare, S. R.; Griffiths, K.; Lennard, W. N.; Tang, H. T., Generation of Atomic Oxygen on
Ag(111) and Ag(110) Using No2 - a Tpd, Leed, Hreels, Xps, and Nra Study. Surf. Sci. 1995, 342,
185-198.
151. Demongeot, F. B.; Valbusa, U.; Rocca, M., Oxygen-Adsorption on Ag(111). Surf. Sci.
1995, 339, 291-296.
152. Schnadt, J.; Michaelides, A.; Knudsen, J.; Vang, R. T.; Reuter, K.; Laegsgaard, E.;
Scheffler, M.; Besenbacher, F., Revisiting the Structure of the P(4x4) Surface Oxide on Ag(111).
Phys. Rev. Lett. 2006, 96.
153. Schmid, M., et al., Structure of Ag(111)-P(4x4)-O: No Silver Oxide. Phys. Rev. Lett.
2006, 96.
154. Michaelides, A.; Reuter, K.; Scheffler, M., When Seeing Is Not Believing: Oxygen on
Ag(111), a Simple Adsorption System? J. Vac. Sci. Technol., A 2005, 23, 1487-1497.
155. Li, L.; Yang, J. C., Complex Oxide Structures Formed by Oxidation of Ag(100) and
Ag(111) by Hyperthermal Atomic Oxygen. Materials at High Temperatures 2003, 20, 601-606.
156. Huang, W. X.; White, J. M., Revisiting No2 on Ag(111): A Detailed Tpd and Rairs
Study. Surf. Sci. 2003, 529, 455-470.
157. Raukema, A.; Butler, D. A.; Box, F. M. A.; Kleyn, A. W., Dissociative and Non-
Dissociative Sticking of O-2 at the Ag(111) Surface. Surf. Sci. 1996, 347, 151-168.
158. Andryushechkin, B. V.; Shevlyuga, V. M.; Pavlova, T. V.; Zhidomirov, G. M.; Eltsov, K.
N., Adsorption of O-2 on Ag(111): Evidence of Local Oxide Formation. Phys. Rev. Lett. 2016,
117, 5.
159. Derouin, J.; Farber, R. G.; Turano, M. E.; Iski, E. V.; Killelea, D. R., Thermally Selective
Formation of Subsurface Oxygen in Ag(111) and Consequent Surface Structure. ACS Catal.
2016, 6, 4640-4646.
160. Jones, T. E.; Rocha, T. C. R.; Knop-Gericke, A.; Stampfl, C.; Schlögl, R.; Piccinin, S.,
Thermodynamic and Spectroscopic Properties of Oxygen on Silver under an Oxygen
Atmosphere. Physical Chemistry Chemical Physics 2015, 17, 9288-9312.
119
161. Derouin, J.; Farber, R. G.; Heslop, S. L.; Killelea, D. R., Formation of Surface Oxides
and Ag2o Thin Films with Atomic Oxygen on Ag(111). Surf. Sci. 2015, 641, L1-4.
162. Jones, T. E.; Rocha, T. C. R.; Knop-Gericke, A.; Stampfl, C.; Schlogl, R.; Piccinin, S.,
Thermodynamic and Spectroscopic Properties of Oxygen on Silver under an Oxygen
Atmosphere. Phys. Chem. Chem. Phys. 2015, 17, 9288-9312.
163. Martin, N. M.; Klacar, S.; Gronbeck, H.; Knudsen, J.; Schnadt, J.; Blomberg, S.;
Gustafson, J.; Lundgren, E., High-Coverage Oxygen-Induced Surface Structures on Ag(111). J.
Phys. Chem. C 2014, 118, 15324-15331.
164. Jones, T. E.; Rocha, T. C. R.; Knop-Gericke, A.; Stampfl, C.; Schloegl, R.; Piccinin, S.,
Adsorbate Induced Vacancy Formation on Silver Surfaces. Phys. Chem. Chem. Phys. 2014, 16,
9002-9014.
165. Ishikawa, A.; Nakatsuji, H., Xps of Oxygen Atoms on Ag(111) and Ag(110) Surfaces:
Accurate Study with Sac/Sac-Ci Combined with Dipped Adcluster Model. Journal of
Computational Chemistry 2013, 34, 1828-1834.
166. Guenther, S.; Boecklein, S.; Wintterlin, J.; Nino, M. A.; Mentes, T. O.; Locatelli, A.,
Locating Catalytically Active Oxygen on Ag(111)-a Spectromicroscopy Study. Chemcatchem
2013, 5, 3342-3350.
167. Rocha, T. C. R.; Oestereich, A.; Demidov, D. V.; Havecker, M.; Zafeiratos, S.;
Weinberg, G.; Bukhtiyarov, V. I.; Knop-Gericke, A.; Schlogl, R., The Silver-Oxygen System in
Catalysis: New Insights by near Ambient Pressure X-Ray Photoelectron Spectroscopy. Phys.
Chem. Chem. Phys. 2012, 14, 4554-4564.
168. Reichelt, R.; Gunther, S.; Wintterlin, J., Strongly-Bound Oxygen on Silver Surfaces: A
Molybdenum Oxide Contamination? J. Phys. Chem. C 2011, 115, 17417-17428.
169. Schnadt, J.; Knudsen, J.; Hu, X. L.; Michaelides, A.; Vang, R. T.; Reuter, K.; Li, Z.;
Laegsgaard, E.; Scheffler, M.; Besenbacher, F., Experimental and Theoretical Study of Oxygen
Adsorption Structures on Ag(111). Phys. Rev. B 2009, 80, 075424.
170. Reicho, A.; Stierle, A.; Costina, I.; Dosch, H., Stranski-Krastanov Like Oxide Growth on
Ag(111) at Atmospheric Oxygen Pressures. Surf. Sci. 2007, 601, L19-L23.
171. Bukhtiyarov, V. I.; Havecker, M.; Kaichev, V. V.; Knop-Gericke, A.; Mayer, R. W.;
Schlogl, R., Atomic Oxygen Species on Silver: Photoelectron Spectroscopy and X-Ray
Absorption Studies. Phys. Rev. B 2003, 67, 235422.
172. Bao, X.; Muhler, M.; Schedel-Niedrig, T.; Schlogl, R., Interaction of Oxygen with Silver
at High Temperature and Atmospheric Pressure: A Spectroscopic and Structural Analysis of a
Strongly Bound Surface Species. Phys. Rev. B 1996, 54, 2249-2262.
120
173. Derouin, J.; Farber, R. G.; Killelea, D. R., Combined Stm and Tpd Study of Rh(111)
under Conditions of High Oxygen Coverage. J. Phys. Chem. C 2015, 119, 14748-14755.
174. Rosenberg, R. https://www.aps.anl.gov/Sector-4/4-ID-C/Instrumentation.
175. CJ, P.; A, J., Nist Electron Inelastic-Mean-Free-Path Database. Verson 1.2, Srd 71.
Technology, N. I. o. S. a., Ed. Gaithersberg, MD, 2010.
176. van Hoof, A. J. F.; Filot, I. A. W.; Friedrich, H.; Hensen, E. J. M., Reversible
Restructuring of Silver Particles During Ethylene Epoxidation. ACS Catal. 2018, 8, 11794-
11800.
177. Chen, B. W. J.; Kirvassilis, D.; Bai, Y.; Mavrikakis, M., Atomic and Molecular
Adsorption on Ag(111). The Journal of Physical Chemistry C 2018, 123, 7551-7566.
178. Lamoth, M., et al., Nanocatalysts Unravel the Selective State of Ag. ChemCatChem
2020, 12, 2977-2988.
179. Jones, T. E., et al., The Selective Species in Ethylene Epoxidation on Silver. Acs
Catalysis 2018, 8, 3844-3852.
180. Andryushechkin, B. V.; Shevlyuga, V. M.; Pavlova, T. V.; Zhidomirov, G. M.; Eltsov, K.
N., Adsorption of Molecular Oxygen on the Ag(111) Surface: A Combined Temperature-
Programmed Desorption and Scanning Tunneling Microscopy Study. J Chem Phys 2018, 148,
244702.
181. Bao, X.; Barth, J. V.; Lehmpfuhl, G.; Schuster, R.; Uchida, Y.; Schlogl, R.; Ertl, G.,
Oxygen-Induced Restructuring of Ag(111). Surf Sci 1992, 284, 14-22.
182. Rocha, T. C.; Oestereich, A.; Demidov, D. V.; Havecker, M.; Zafeiratos, S.; Weinberg,
G.; Bukhtiyarov, V. I.; Knop-Gericke, A.; Schlogl, R., The Silver-Oxygen System in Catalysis:
New Insights by near Ambient Pressure X-Ray Photoelectron Spectroscopy. Phys Chem Chem
Phys 2012, 14, 4554-64.
183. Balmes, O.; Prevot, G.; Torrelles, X.; Lundgren, E.; Ferrer, S., Diatomic Steps in Pt(997)
Surfaces Are Better Catalysts Than Monatomic Steps for the Co Oxidation Reaction near
Atmospheric Pressure. ACS Catalysis 2016, 6, 1285-1291.
184. van der Niet, M. J.; den Dunnen, A.; Juurlink, L. B.; Koper, M. T., A Detailed Tpd Study
of H2o and Pre-Adsorbed O on the Stepped Pt(553) Surface. Phys Chem Chem Phys 2011, 13,
1629-38.
185. Walsh, A. J.; Van Lent, R.; Auras, S. V.; Gleeson, M. A.; Berg, O.; Juurlink, L. B., Step-
Type and Step-Density Influences on Co Adsorption Probed by Reflection Absorption Infrared
Spectroscopy Using a Curved Pt(111) Surface. J Vac Sci Technol A 2016, 35, 03E102.
121
186. Walter, A. L., et al., X-Ray Photoemission Analysis of Clean and Carbon Monoxide-
Chemisorbed Platinum(111) Stepped Surfaces Using a Curved Crystal. Nat Commun 2015, 6,
8903.
187. Schoiswohl, J.; Surnev, S.; Netzer, F. P., Vanadium Oxide Overlayers on Vicinal Rh(15
15 13)- the Influence of Surface Steps. J Phys Chem C 2007, 111, 10503-10507.
188. Badan, C.; Farber, R. G.; Heyrich, Y.; Koper, M. T. M.; Killelea, D. R.; Juurlink, L. B.
F., Step-Type Selective Oxidation of Platinum Surfaces. The Journal of Physical Chemistry C
2016, 120, 22927-22935.
189. Cipriani, G.; Loffreda, D.; Dal Corso, A.; de Gironcoli, S.; Baroni, S., Adsorption of
Atomic Oxygen on Ag(001)- a Study Based on Density-Functional Theory. Surf Sci 2002, 501,
182-190.
190. Fang, C. S. A., Surface Structural Transition of Adsorption of Oxygen on Ag(100). Surf
Sci Lett 1990, 235, L291-L294.
191. Cao, K.; van Lent, R.; Kleyn, A. W.; Kurahashi, M.; Juurlink, L. B. F., Steps on Pt
Stereodynamically Filter Sticking of O2. Proc Natl Acad Sci U S A 2019.
192. van Lent, R.; Auras, S. V.; Cao, K.; Walsh, A. J.; Gleeson, M. A.; Juurlink, L. B., Site-
Specific Reactivity of Molecules with Surface Defects—the Case of H2 Dissociation on Pt.
Science (New York, N.Y.) 2019, 363, 155-157.
193. Somorjai, G. A.; York, R. L.; Butcher, D.; Park, J. Y., The Evolution of Model Catalytic
Systems; Studies of Structure, Bonding and Dynamics from Single Crystal Metal Surfaces to
Nanoparticles, and from Low Pressure (< 10-3 Torr) to High Pressure (> 10-3 Torr) to Liquid
Interfaces. Phys. Chem. Chem. Phys. 2007, 9, 3500-3513.
194. Zhu, Q.; Saidi, W. A.; Yang, J. C., Step-Edge Directed Metal Oxidation. The Journal of
Physical Chemistry Letters 2016, 2530-2536.
195. Goodman, D. W., Correlations between Surface Science Models and ''Real-World''
Catalysts. Journal of Physical Chemistry 1996, 100, 13090-13102.
196. Schiller, F., et al., Catalytic Oxidation of Carbon Monoxide on a Curved Pd Crystal:
Spatial Variation of Active and Poisoning Phases in Stationary Conditions. J Am Chem Soc
2018.
197. Ilyn, M.; Magaña, A.; Walter, A. L.; Lobo-Checa, J.; de Oteyza, D. G.; Schiller, F.;
Ortega, J. E., Step-Doubling at Vicinal Ni(111) Surfaces Investigated with a Curved Crystal. The
Journal of Physical Chemistry C 2017, 121, 3880-3886.
122
198. Turano, M. E.; Farber, R. G.; Oskorep, E. C. N.; Rosenberg, R. A.; Killelea, D. R.,
Characterization of Oxygenaceous Species Formed by Exposure of Ag(111) to Atomic Oxygen.
The Journal of Physical Chemistry C 2020, 124, 1382-1389.
199. Savio, L.; Vattuone, L.; Rocca, M., Role of Steps and of Terrace Width in Gas-Surface
Interaction: O2/Ag(410). Phys Rev Lett 2001, 87, 276101.
200. Ganduglia-Pirovano, M. V.; Reuter, K.; Scheffler, M., Stability of Subsurface Oxygen at
Rh(111). Physical Review B 2002, 65.
201. Koper, M. T., Structure Sensitivity and Nanoscale Effects in Electrocatalysis. Nanoscale
2011, 3, 2054-73.
202. Umemoto, H.; Kusanagi, H., Catalytic Decomposition of O2, No, N2o and No2 on a
Heated Ir Filament to Produce Atomic Oxygen. J Phys D: Appl Phys 2008, 41, 225505.
203. Kolb, M. J.; Farber, R. G.; Derouin, J.; Badan, C.; Calle-Vallejo, F.; Juurlink, L. B.;
Killelea, D. R.; Koper, M. T., Double-Stranded Water on Stepped Platinum Surfaces. Phys Rev
Lett 2016, 116, 136101.
204. Turano, M. E.; Farber, R. G.; Hildebrandt, G.; Killelea, D. R., Temperature Dependence
of Co Oxidation on Rh(111) by Adsorbed Oxygen. Surface Science 2020, 695.
123
VITA
Marie Turano attended Loyola University Chicago and received a Bachelor of Science in
chemistry Magna Cum Laude in 2016. She also graduated with Department Honors.
While studying at Loyola as a graduate student, Dr. Turano was awarded the Arthur J.
Schmitt Dissertation Fellowship for the 2020-2021 academic year, the Teaching Scholars Fel-
lowship for the 2019-2020 academic year, and the Research Mentoring Fellowship. She received
honorable mention for the NSF Graduate Research, the best Teaching Assistant Award, and was
a finalist for the Morton M. Traum Surface Science Student Award at the AVS 67th Virtual
Showcase.
Recommended