Western Kentucky UniversityTopSCHOLAR®
Masters Theses & Specialist Projects Graduate School
Summer 2016
Low-Cost Quartz Crystal Microbalance SystemPlatform Designed for Chemical NanoparticleDanming WeiWestern Kentucky University, [email protected]
Follow this and additional works at: http://digitalcommons.wku.edu/theses
Part of the Analytical Chemistry Commons
This Thesis is brought to you for free and open access by TopSCHOLAR®. It has been accepted for inclusion in Masters Theses & Specialist Projects byan authorized administrator of TopSCHOLAR®. For more information, please contact [email protected].
Recommended CitationWei, Danming, "Low-Cost Quartz Crystal Microbalance System Platform Designed for Chemical Nanoparticle" (2016). MastersTheses & Specialist Projects. Paper 1635.http://digitalcommons.wku.edu/theses/1635
LOW-COST QUARTZ CRYSTAL MICROBALANCE SYSTEM PLATFORM
DESIGNED FOR CHEMICAL NANOPARTICLE ANALYSIS BASED ON ARDUINO
MICROCONTROLLER BOARD
A Thesis
Presented to
The Faculty of the Department of Chemistry
Western Kentucky University
Bowling Green, Kentucky
In Partial Fulfillment
Of the Requirements for the Degree
Master of Science
By
Danming Wei
August 2016
iii
I dedicate this thesis to my parents, Chang Wei and Lizhi Guo, who are a great
inspiration to me. Also, I also dedicate this work to my advisor Yan Cao, who helped
greatly in research process and editing this manuscript.
iv
ACKNOWLEDGMENTS
I am taking this opportunity to express my special appreciation to my thesis
advisor Dr. Yan Cao. He has been a great mentor for me. I am really thankful for his
patient guidance, and serious but invaluable criticism during these two years. I would like
to thank for his aspiring and encouraging my research work and leading me to grow to be
a scientist. He gave me invaluably constructive suggestions and friendly advices on both
of my research work, my career, and life, leaving me a priceless benefits and influences
in my future life. I would also like to thank him for sharing his brilliant and illuminating
ideas and views on a numerous questions and issues related to the research works.
I am also sincerely grateful to my committee members, Dr. Yan Cao, Dr. Bangbo
Yan, and Dr. Darwin Dahl. I would like to thank them for those helpful comments and
suggestions on the thesis revision, and giving me an enjoyable defense time.
I would express my gratitude to my work partners who provide me a lot technique
help and constructive suggestions. This appreciation will send to Ying Chen, Jiao Wang,
Jinyi Yue, Kolton Jones and many others.
Finally, a special appreciation is for my family supporting me all the time without
any rewards.
v
PREFACE
I have strong curiosity to explore the unknown’s parts in the world. The
mysterious and colorful world gives me a great motivation and power, I made a decision
to be a scientist, and I would keep learning and searching knowledge and answers of this
world.
Chemistry is a fantastic area, which can present mechanism and features of the
world. I am obsessed by chemistry and choose it as my major. Also I believe there exist
connections across different academic fields, like physical chemistry, biochemistry, and
electrochemistry and so on. The research work gives me a great opportunity to get close
to explore the relationship between electronic instrument and chemical analysis. Through
designing an electronic platform based on QCM sensor properties, to explore and
understand micro-world. I tried my every effort to figure out the questions and problems
that I met. This was a big challenge for me to research a new academic field, but I am
still excited to learn what I have never learnt before.
I have a great deal of enthusiasm about the research work, and I enjoy the learning
and studying process. I really hope my work would be valuable and useful in the future.
vi
CONTENTS
Introduction ..................................................................................................................................... 1
1.1 Background .................................................................................................................. 1
Quartz crystal microbalance (QCM) ............................................................................................... 5
2.1 Piezoelectric effect ....................................................................................................... 5
2.2 AT-Cut quartz crystal................................................................................................... 8
2.3 QCM sensor equivalent circuits ................................................................................. 10
2.4 Theoretical basis of QCM technique ......................................................................... 13
Low-cost QCM system platform design ....................................................................................... 15
3.1 General QCM system .................................................................................................... 15
3.2 Arduino .......................................................................................................................... 17
3.3 Oscillator circuit ............................................................................................................ 19
3.4 Interfaces for QCM system platform ............................................................................. 35
Experimental ................................................................................................................................. 39
4.1 Materials..................................................................................................................... 39
4.2 Instrumentation .......................................................................................................... 39
4.3 Procedures .................................................................................................................. 40
Result and discussion .................................................................................................................... 45
vii
5.1 Comparison of three different oscillator circuits to measure 10MHz and 6MHz
QCM sensors frequencies with or no cell. ................................................................................ 45
5.2 Morphology of TiO2 coating ......................................................................................... 46
5.3 Methyl orange light degradation ................................................................................... 48
5.4 Oscillator circuit unit three applied to electrochemical test .......................................... 50
5.5 Test two oscillator circuit units and difference frequency of each of both
without cell ................................................................................................................................ 50
5.6 Ethanol evaporation on one QCM sensor without liquid cell ....................................... 54
5.7 The study on the photocatalytic degradation processing of Rhodamine B (RB)
at the Surface of nanocrystalline TiO2 by QCM sensor ............................................................ 55
Other equipment designed with Arduino microcontroller board .................................................. 57
Conclusion .................................................................................................................................... 63
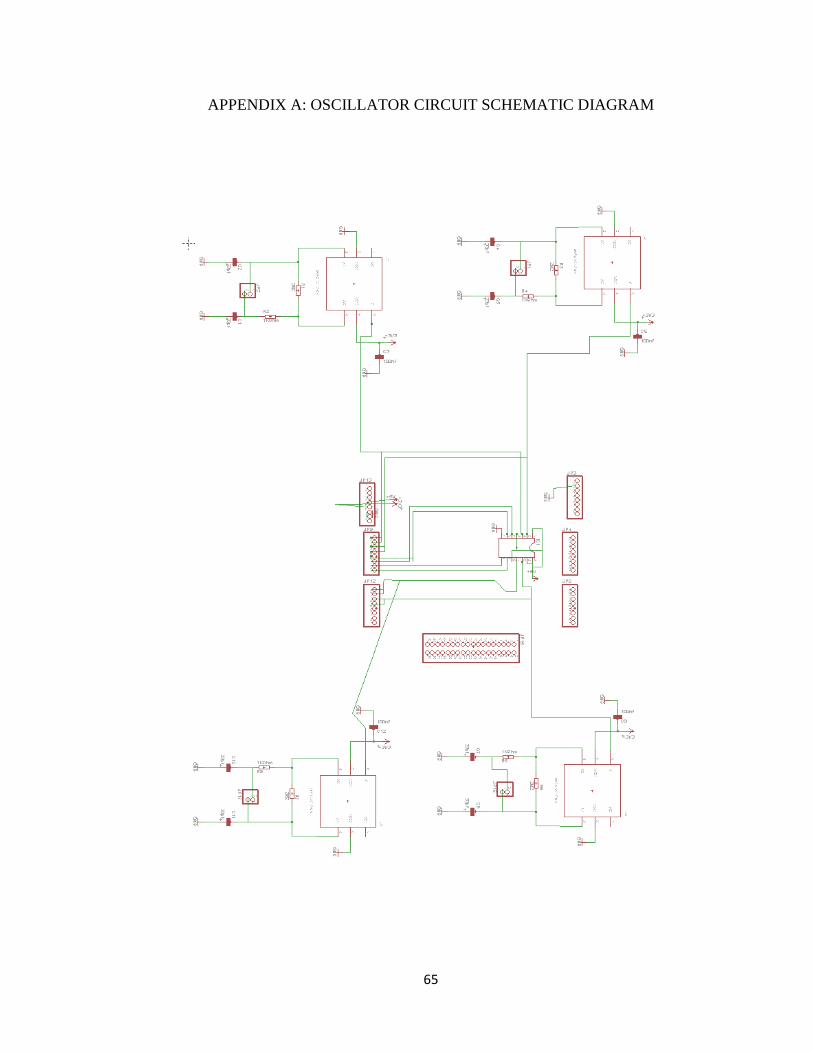
APPENDIX A: OSCILLATOR CIRCUIT SCHEMATIC DIAGRAM ....................................... 65
APPENDIX B: OSCILLATOR CIRCUIT PCB BOARD SCHEMATIC DIAGRAM ............... 66
LITERATURE CITED ................................................................................................................. 68
viii
LIST OF FIGURES
Figure 2.1.1 Piezoelectric effect in quartz crystal……………………...………………….7
Figure 2.1.2 Direct piezoelectric effect and inverse piezoelectric effect…….….……..…8
Figure 2.2.1 Different models of cut in quartz crystal…………………………………….9
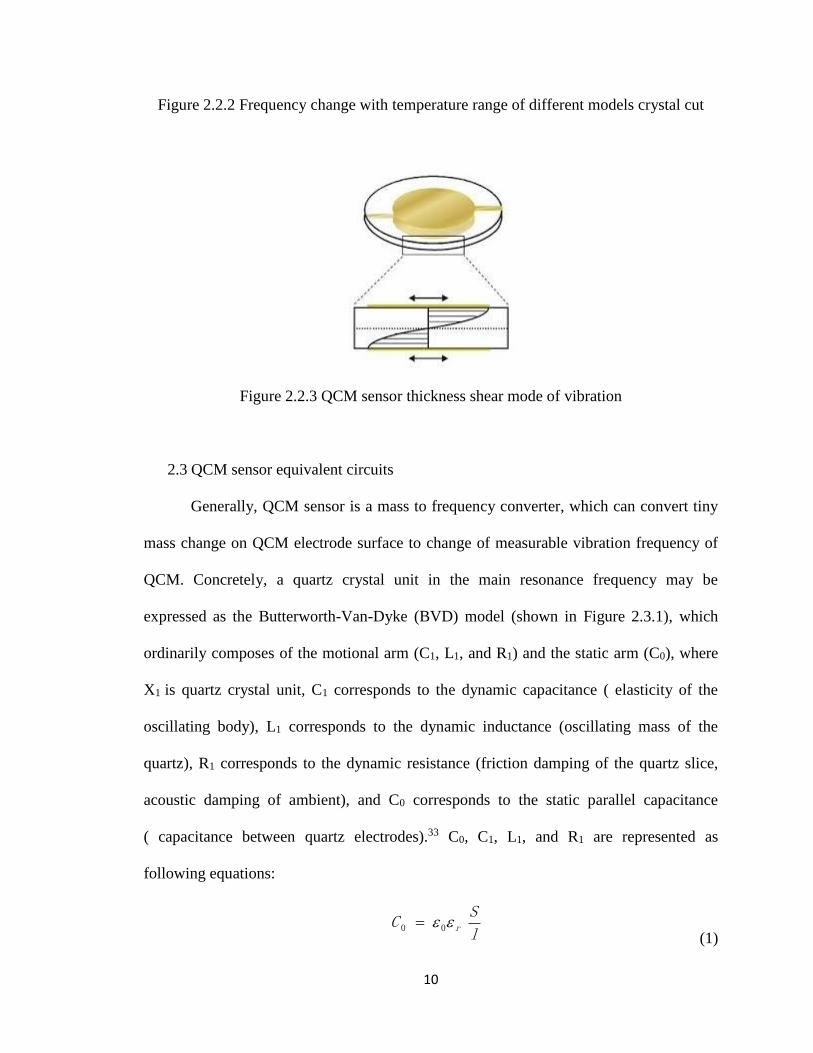
Figure 2.2.2 Frequency change with temperature range of different models crystal……..9
Figure 2.2.3 QCM sensor thickness shear mode of vibration……………………………10
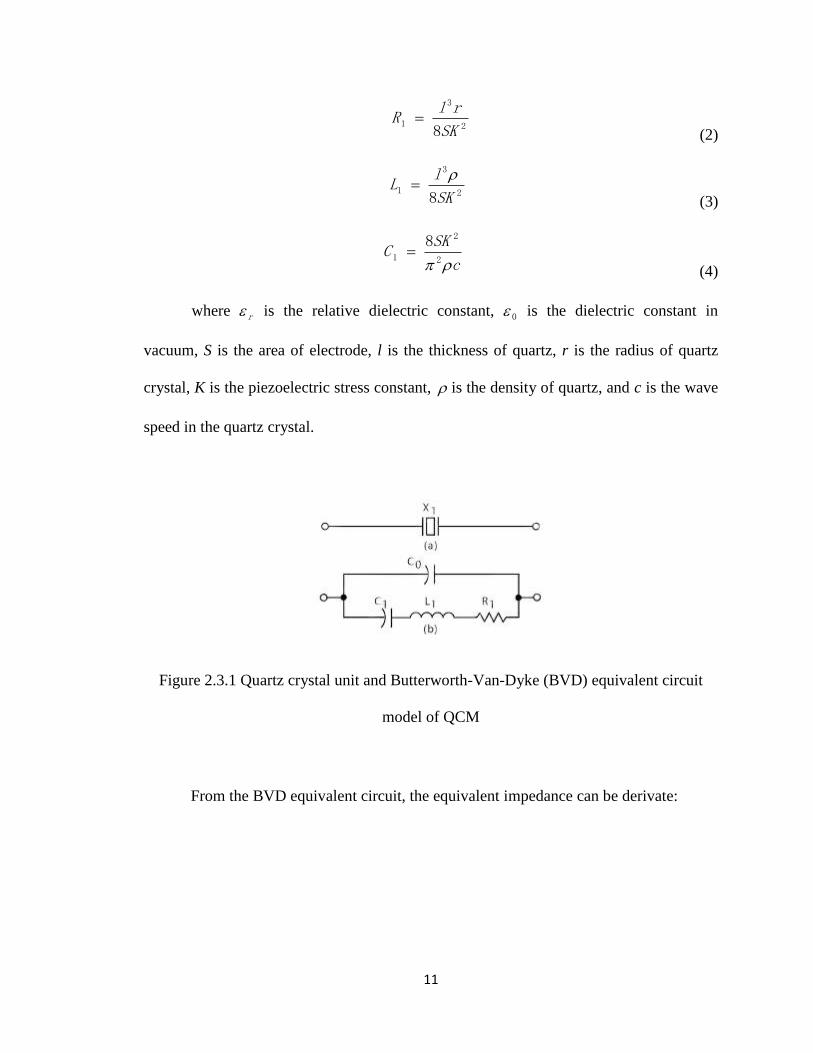
Figure 2.3.1 Quartz crystal unit and Butterworth-Van-Dyke (BVD) equivalent circuit
model of QCM…………………………………………………….……………………..11
Figure 3.1.1 Schematic of the QCM vibration model and the general QCM system …...16
Figure 3.2.1 Arduino UNO and Arduino Mega2560……………………………...…..…18
Figure 3.2.2 Shield board of oscillator circuits and flip-flops chip………………...……19
Figure 3.3.1 SN74LVC1GX04 crystal oscillator driver logic diagram……………...…..20
Figure 3.3.2 Oscillator circuit based on SN74LVC1GX04 crystal oscillator driver…….22
Figure 3.3.3 SN74LS74AN top view and logic diagram………………….……………..23
Figure 3.3.4 D-type positive-edge-trigger ports………………………………...……….24
Figure 3.3.5 Difference frequency generated by D-type trigger…………………………25
Figure 3.3.6 The Arduino Mega2560 before and after combing with oscillator circuit
shield board……………………………………………..………………..………………26
Figure 3.3.7 Schematic diagram of oscillator circuit unit two…………………………..27
Figure 3.3.8 Oscillator circuit unit two…………………………………………….…….27
Figure 3.3.9 Thermistor with 10 KΩ connect to Arduino UNO…………………………28
Figure 3.3.10 Schematic diagram of oscillator circuit unit three …………..……….…...29
Figure 3.3.11 Power supply for oscillator circuit unit three………………………..……29
ix
Figure 3.3.12 Oscillator circuit unit three and power supply circuit…………………….30
Figure 3.3.13 Arduino software (IDE) for code writing…………………………………31
Figure 3.4.1 QCM system interface programmed by Java language……………….……36
Figure 3.4.2 QCM system interface designed by Labview…………………………...….37
Figure 3.4.3 Block diagram for Labview interface………………………………………37
Figure 3.4.4 Labview interface with real-time monitoring for frequency counter…...….38
Figure 3.4.5 Block diagram for interface…………………………………………...……38
Figure 4.3.1 Oscillator circuit unit one with two QCM sensors ………………….……..42
Figure 4.3.2 Oscillator circuit unit two with two QCM sensors…………………………43
Figure 4.3.3 photocatalytic degradation processing of Rhodamine B (RB) at the Surface
of nanocrystalline TiO2………………….……………………………………………….44
Figure 5.2.1 SEM scanned features of 10mg/ml, 15V, 30s; 5mg/ml, 10V, 30s; 5mg/ml,
5V, 30s;5mg/ml, 5V, 15s; 50mg/ml, 1V, 15s; and 5mg/ml, 1V, 30s TiO2 electrophoretic
deposition………………………………………………………………….……..………47
Figure 5.3.1 Photocatalytic degradation of 6MHz methyl orange-TiO2-coated QCM
sensor…………………………………………………………………………………….49
Figure 5.3.2 Photocatalytic degradation of 10MHz methyl orange-TiO2-coated QCM
sensor…………………………………………………………………………………….49
Figure 5.5.1 The frequencies of two QCM sensor in unit one………..……...………….52
Figure 5.5.2 Calculated values VS experimental values in unit one…………………….52
Figure 5.5.3 The frequencies of two QCM sensor in unit two………………….…….…53
Figure 5.5.4 Calculated values VS experimental values in unit two…………………….53
Figure 5.6.1 Ethanol evaporation on one QCM sensor without liquid cell………...……55
x
Figure 5.7.1 Photocatalytic degradation processing of Rhodamine B (RB) at the Surface
of nanocrystalline TiO2………………………………………………………………………………….………….…..…56
Figure 5.7.2 Photocatalytic degradation processing of Rhodamine B (RB) at the Surface
of nanocrystalline TiO2-GP…………………………….…………………………..……57
Figure 6.1 Multi-channel valves array system…………………………………….……..59
Figure 6.2 Logic diagram for multi-channel valves array system……………………….60
Figure 6.3 Labview interface for Multi-channel valves array system……………..….…61
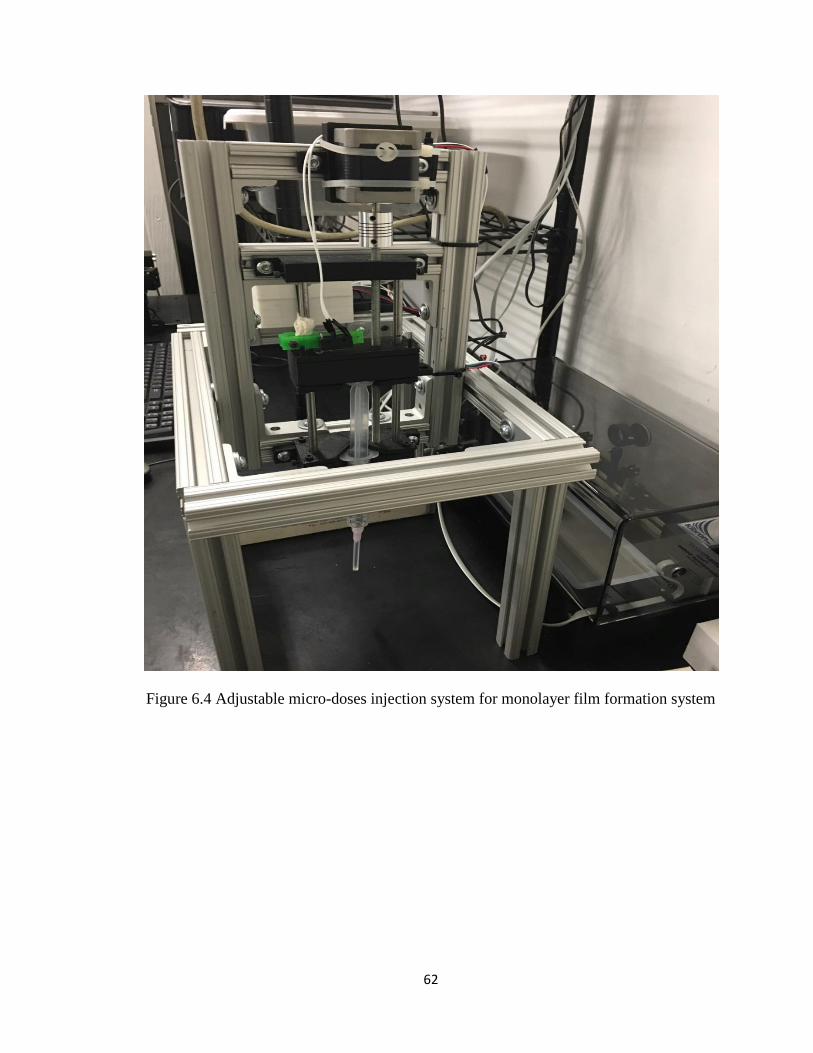
Figure 6.4 Adjustable micro-doses injection system for monolayer film formation
system………………………………………………………………..…………………..62
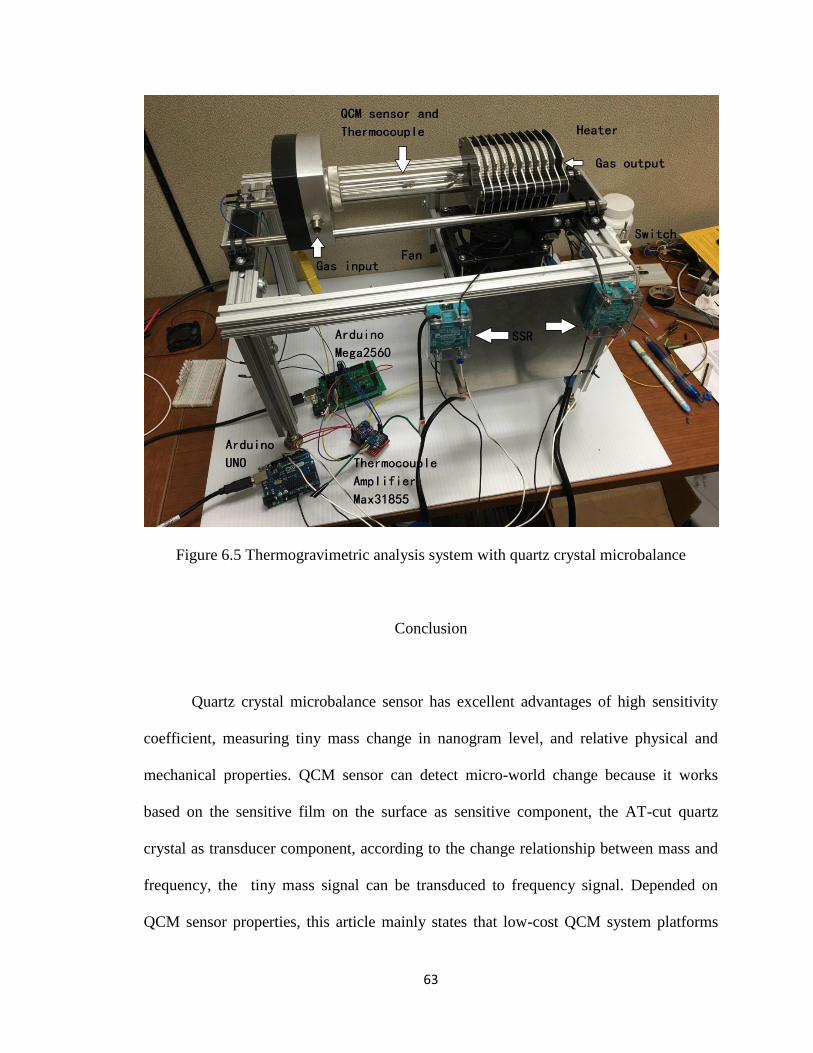
Figure 6.5 Thermogravimetric analysis system with quartz crystal microbalance….…...63
xi
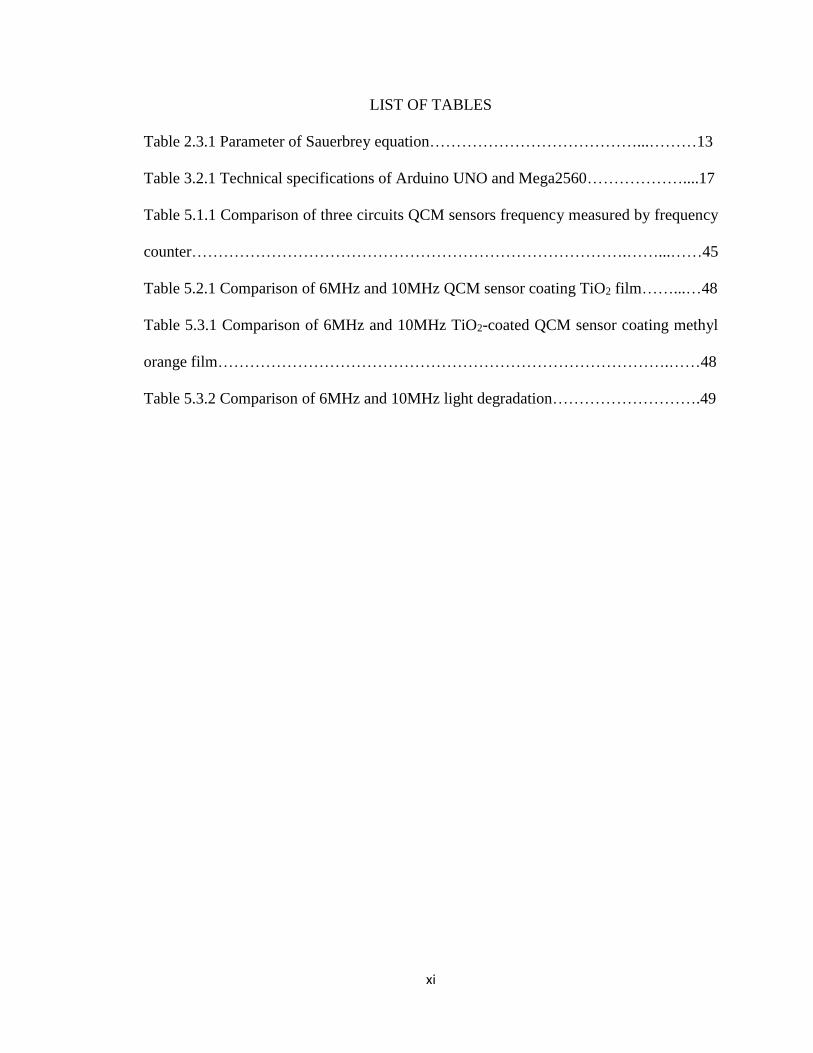
LIST OF TABLES
Table 2.3.1 Parameter of Sauerbrey equation…………………………………...………13
Table 3.2.1 Technical specifications of Arduino UNO and Mega2560………………....17
Table 5.1.1 Comparison of three circuits QCM sensors frequency measured by frequency
counter……………………………………………………………………….……...……45
Table 5.2.1 Comparison of 6MHz and 10MHz QCM sensor coating TiO2 film……...…48
Table 5.3.1 Comparison of 6MHz and 10MHz TiO2-coated QCM sensor coating methyl
orange film………………………………………………………………………….……48
Table 5.3.2 Comparison of 6MHz and 10MHz light degradation……………………….49
xii
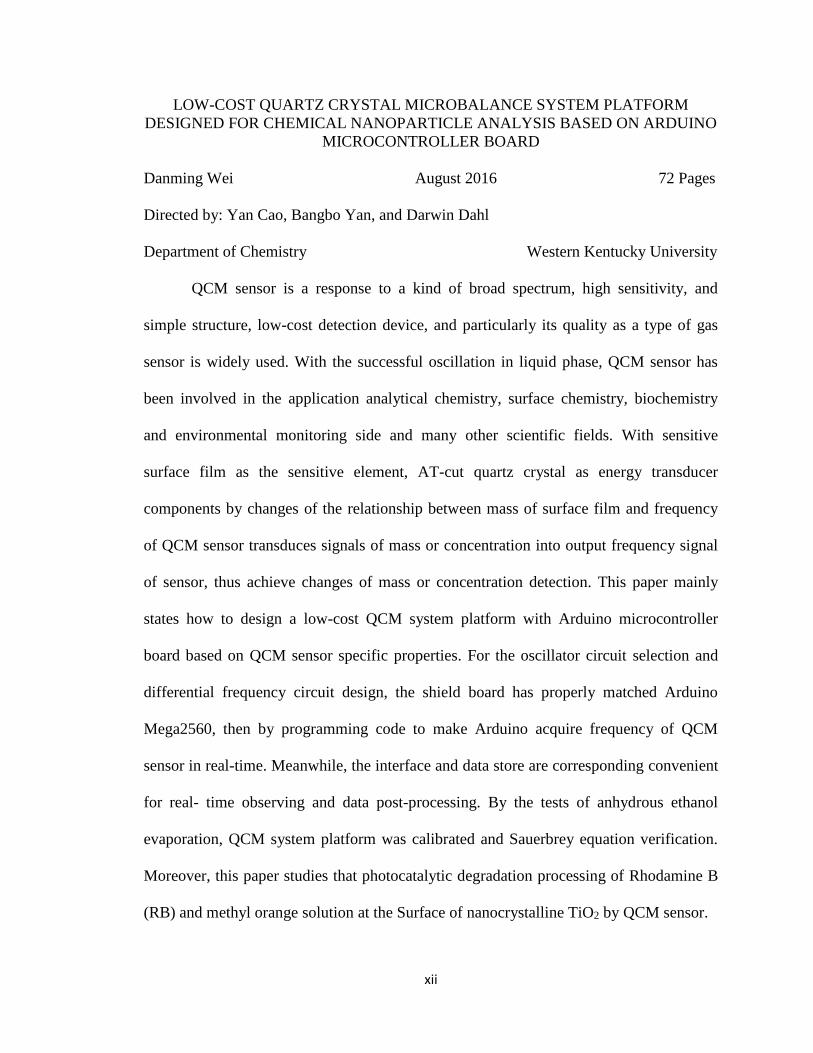
LOW-COST QUARTZ CRYSTAL MICROBALANCE SYSTEM PLATFORM
DESIGNED FOR CHEMICAL NANOPARTICLE ANALYSIS BASED ON ARDUINO
MICROCONTROLLER BOARD
Danming Wei August 2016 72 Pages
Directed by: Yan Cao, Bangbo Yan, and Darwin Dahl
Department of Chemistry Western Kentucky University
QCM sensor is a response to a kind of broad spectrum, high sensitivity, and
simple structure, low-cost detection device, and particularly its quality as a type of gas
sensor is widely used. With the successful oscillation in liquid phase, QCM sensor has
been involved in the application analytical chemistry, surface chemistry, biochemistry
and environmental monitoring side and many other scientific fields. With sensitive
surface film as the sensitive element, AT-cut quartz crystal as energy transducer
components by changes of the relationship between mass of surface film and frequency
of QCM sensor transduces signals of mass or concentration into output frequency signal
of sensor, thus achieve changes of mass or concentration detection. This paper mainly
states how to design a low-cost QCM system platform with Arduino microcontroller
board based on QCM sensor specific properties. For the oscillator circuit selection and
differential frequency circuit design, the shield board has properly matched Arduino
Mega2560, then by programming code to make Arduino acquire frequency of QCM
sensor in real-time. Meanwhile, the interface and data store are corresponding convenient
for real- time observing and data post-processing. By the tests of anhydrous ethanol
evaporation, QCM system platform was calibrated and Sauerbrey equation verification.
Moreover, this paper studies that photocatalytic degradation processing of Rhodamine B
(RB) and methyl orange solution at the Surface of nanocrystalline TiO2 by QCM sensor.
xiii
Key words: QCM sensor, Arduino, frequency measurement, photocatalytic degradation
1
Introduction
1.1 Background
In 1880, piezoelectric effect was first discovered by French physicists Jacques and
Pierre Curie1, it brought to scientists a new direction of electromechanical interaction
between electrical and mechanical state in crystalline materials with no inversion
symmetry2. After that, scientists began to explore electromechanical area and tried to find
certain relationship between them. In 1959, German physicist Sauerbrey3 firstly was
engaged in research about the relationship between mass absorption on the surface of
quartz and offset of its frequency in gas phase, which established the foundation for
quartz crystal microbalance(QCM) researches in various areas of sciences until now.
Meanwhile, he came up with the famous Sauerbrey equation, which became the
indispensable key for science to explore micro-mass world. Later, King4 was the first
person who applied QCM sensor into chemical analysis, and a series of gas detection
experiments based on QCM sensor were put in practice, and J. F. Ai de and J. J.
Mccallum5 5bmade a detailed review about that. In the early gas phase analysis, there
were no active materials to fix chemical compounds onto the QCM sensor surface. In
1983, Guilbault6 discovered dehydrogenase when methanol was for fixed on the QCM
sensor surface. Certain properties of methanol could be detected by the QCM sensor.
Later on, he companied with Ngeh-Ngwainbils7 firstly tried to investigate the immune
reaction in gas phase. They coated parathion antibody on QCM sensor surface to detect
the change of quinalphos.
2
In 1972, Shons et al8 developed the first piezoelectric immune sensor which
combined piezoelectric sensor and immune reaction. From then on, most researchers, like
Muramatsu, Guibault, Okahata, Thompson, and so on, began working on intensive
researches and applications on the piezoelectric immune sensor. Now, the piezoelectric
immune sensor has been applied into various areas to understand behaviors of bacteria9
10, virus11 12 13, and proteins14, such as clinical diagnosis, industrial control, food and drug
analysis, and environmental protection and so on.
There were two main methods in the early research on the piezoelectric biosensor:
immersion and drying15 . For example, the bio-active materials are attached on the
piezoelectric sensor and immersed into determined solutions to react for a while, taken
out for drying and weighed or measured for other changes of properties. Therefore, this
dry method was more cumbersome because of many steps of cleaning and drying
included, but its measurement occurred in the gas phase which was not effected by some
factors in the liquid phase. In 1980, Konash and Bastiaans16 tried to design QCM sensors
which could detect in liquid phase by improving the circuits to make QCM sensors
vibrate more stably. In 1982, Nomura and Okuhara17 explored frequency response of
QCM sensor in liquid phase, and came up with experienced equation, which correlated
the change of frequency with the square root of density and viscosity of the liquid. In
1985, Kanazawa and Gordon18 came up with a theory model about the correlation
between frequency response and parameters of QCM sensor and liquid. In the same year,
Bruckenstein and Shay19 also gave a similar equation which was verified by experiments.
At present, piezoelectric sensors mostly can be directly contact testing solutions so that it
could acquire real-time data on reactions on QCM sensor surface. Usually, piezoelectric
3
sensor is unloaded in a flow chamber, and one side of sensor was sealed from the liquid,
the other side directly contacts to the flow liquid. The tested materials are coated on the
QCM sensor which could be reacted with constituents in liquid directly. However, the
methods above were only limited to sensor in single channel.
The research methods of piezoelectric sensors could be divided into two types:
active and passive20 21. Active method is also called oscillating method, which means that
sensor needs to be connected into an oscillator amplifier circuit as a part to provide
positive feedback. The piezoelectric crystal would vibrate on its own frequency that
could be measured by frequency counter. However, in the passive method, the
piezoelectric crystal needs to be connected to measure port of instrument as an external
component, like an impedance analyzer or a spectrum analyzer, which stimulates
different frequency sine waves at two sides of piezoelectric crystal and records the output
signals from crystal. By comparison of input and output signals, it could acquire some
parameters of crystal like impedance, admittance, phase and so on. If combined electrical
characteristics of equivalent circuit of piezoelectric crystal and ones of experimental
environment, it could obtain relevant information by analyzing the change of parameter
of crystal before and after reaction. Thus, the oscillating method has several advantages,
such as simple structure, easy operation, and forming small functional instruments. But it
only provided limited properties of the piezoelectric crystal in reaction environments. On
the contrary, the passive method could provide multiple electrical parameters and also
obtain all-sided and multi-dimension information of the piezoelectric crystal. Therefore,
instruments for the passive method are complicated and expensive, and the active method
has been adopted into the piezoelectric biosensor applications. Okahata et al22 employed
4
27 MHz QCM to research hybridization kinetics of the nucleic acid and measured
relevant kinetics constant.
Most piezoelectric sensors are used mainly based on mass sensitive properties of
piezoelectric material; the frequency of sensor is affected by mass absorbed on surface of
the piezoelectric sensor. Thus, it is also called as the mass piezoelectric sensor. All of
mass piezoelectric sensors are applied into research based on the Sauerbrey equation to
measure the change of mass. However, some piezoelectric sensors are also applied into
non-mass researches, such as viscosity, density, stress, viscoelasticity, conductivity,
dielectric, and surface properties. Schmittl23 adopted piezoelectric sensors to measure a
variety of electricity and mechanical characteristics in liquid phase. Moreover, he
discovered the best angle (AT-cut) for cutting crystal to get crystal, which is more stable
under room temperature. Kanazawa24 pointed out frequency response was not only
affected by absorbed mass on the sensors, but also mechanical characteristics of
deposition film. So he set up an electric-mechanical model to describe that mechanical
characteristic of deposition film on sensors could affect sensor frequency response. This
model could be applied into both steady state and transient state.
The piezoelectric material acts as a core part in the piezoelectric sensor. The
acoustic wave spread acts as a method for measuring. When acoustic wave spread in
piezoelectric medium, it could be influenced by property of medium, direction of cutting,
and thickness. Utilizing different transducer could stimulate different kinds of acoustic
waves. Acoustic waves used in biosensor included: bulk acoustic wave (BAW), surface
acoustic wave (SAW)25 26, acoustic plate mode (APM)27 28, and love wave (LW)29 30.
Bulk acoustic wave was a widely pattern of acoustic waves in piezoelectric sensor
5
applications because it spread in the medium. It usually is made of quartz crystal cut by
AT-cut as medium, acoustic wave formed standing wave by spreading in thickness
direction, so the directions of particle vibration and wave spreading were vertical, which
was called thickness shear mode (TSM). Therefore, sensitivity of BAW was related to
thickness of crystal, the thicker it is, the more sensitive it is. QCM is a piezoelectric
sensor depended on bulk acoustic wave mode. At present, QCM has been widely adopted
in various areas of science because of its simple structure and high sensitivity.
Quartz crystal microbalance (QCM)
In the area of natural science research, the measurements of mass always
encounter various problems. Scientists are eager to explore much smaller trace amount
change of chemical compounds in reactions. The request for measurement precision is
significantly taken in account, especially in nanogram level (ng). The QCM sensor
technology is a new method of mass measurement to detect chemical compounds in
nanogram level.
2.1 Piezoelectric effect
When a piezoelectric substance is squeezed or stretched by a mechanical stress, its
surface will produce an electric charge. When the mechanical stress is taken away, the
piezoelectric substance turns to a balance state and no electric charge exists. This
phenomenon is called piezoelectric effect. Specifically, it is because of electric
polarization when mechanical stress is applied on some certain piezoelectric substances
6
like crystal. This electric polarization is proportional to the strength of mechanical stress,
the positive and negative of polarization is depended on the direction of stress. The
electric polarization of substance formed by mechanical methods is named the
piezoelectric effect, conversely, a mechanical deformation is produced when an electric
field is applied, which is named the inverse piezoelectric effect. The common
piezoelectric materials are classified into four categories: piezoelectric crystals,
piezoelectric ceramic, macromolecular piezoelectric materials, and semiconductor
materials. Among them, the piezoelectric quartz crystal has been widely applied to
various scientific fields due to its excellent mechanical, electrochemical and thermal
integrated properties.
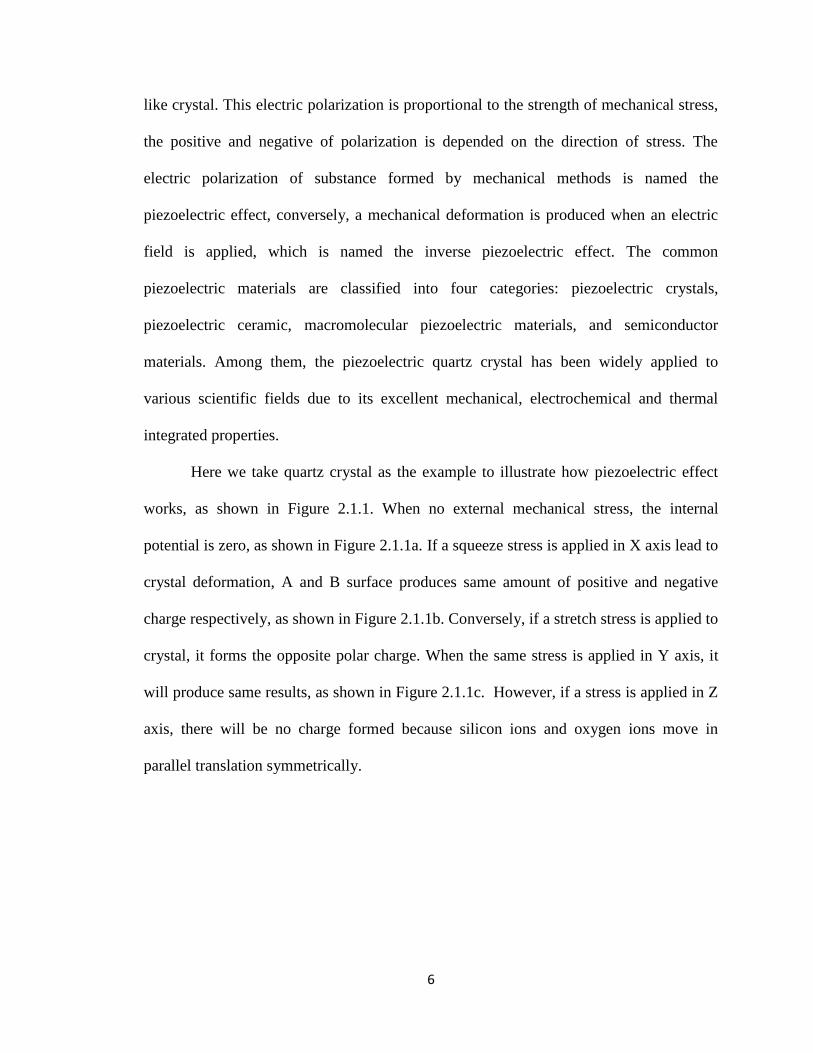
Here we take quartz crystal as the example to illustrate how piezoelectric effect
works, as shown in Figure 2.1.1. When no external mechanical stress, the internal
potential is zero, as shown in Figure 2.1.1a. If a squeeze stress is applied in X axis lead to
crystal deformation, A and B surface produces same amount of positive and negative
charge respectively, as shown in Figure 2.1.1b. Conversely, if a stretch stress is applied to
crystal, it forms the opposite polar charge. When the same stress is applied in Y axis, it
will produce same results, as shown in Figure 2.1.1c. However, if a stress is applied in Z
axis, there will be no charge formed because silicon ions and oxygen ions move in
parallel translation symmetrically.
7
Figure 2.1.1 The piezoelectric effect in quartz crystal
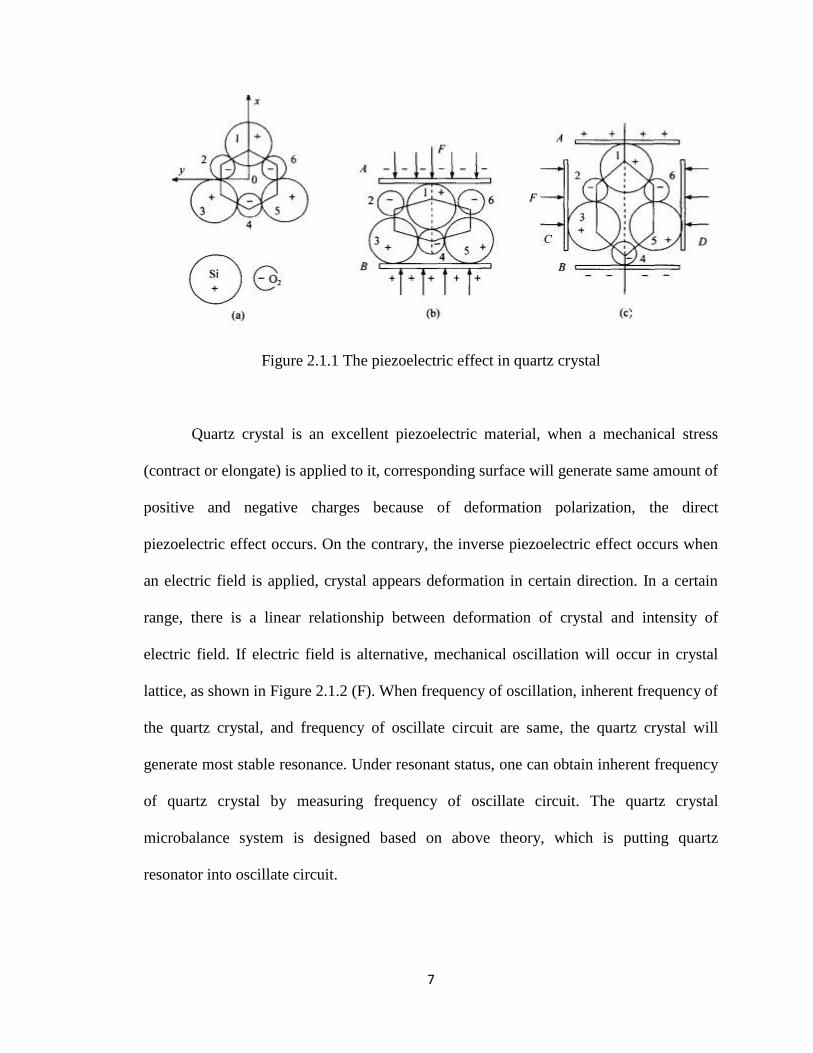
Quartz crystal is an excellent piezoelectric material, when a mechanical stress
(contract or elongate) is applied to it, corresponding surface will generate same amount of
positive and negative charges because of deformation polarization, the direct
piezoelectric effect occurs. On the contrary, the inverse piezoelectric effect occurs when
an electric field is applied, crystal appears deformation in certain direction. In a certain
range, there is a linear relationship between deformation of crystal and intensity of
electric field. If electric field is alternative, mechanical oscillation will occur in crystal
lattice, as shown in Figure 2.1.2 (F). When frequency of oscillation, inherent frequency of
the quartz crystal, and frequency of oscillate circuit are same, the quartz crystal will
generate most stable resonance. Under resonant status, one can obtain inherent frequency
of quartz crystal by measuring frequency of oscillate circuit. The quartz crystal
microbalance system is designed based on above theory, which is putting quartz
resonator into oscillate circuit.
8
Figure 2.1.2 The direct piezoelectric effect and the inverse piezoelectric effect
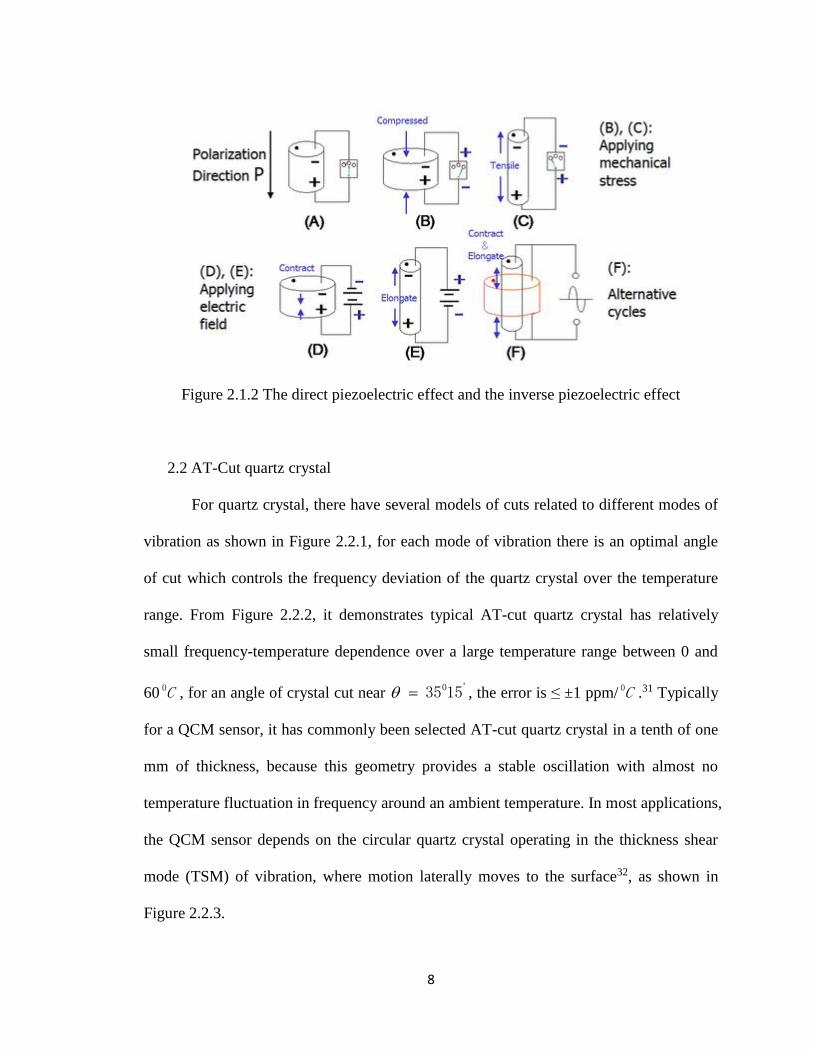
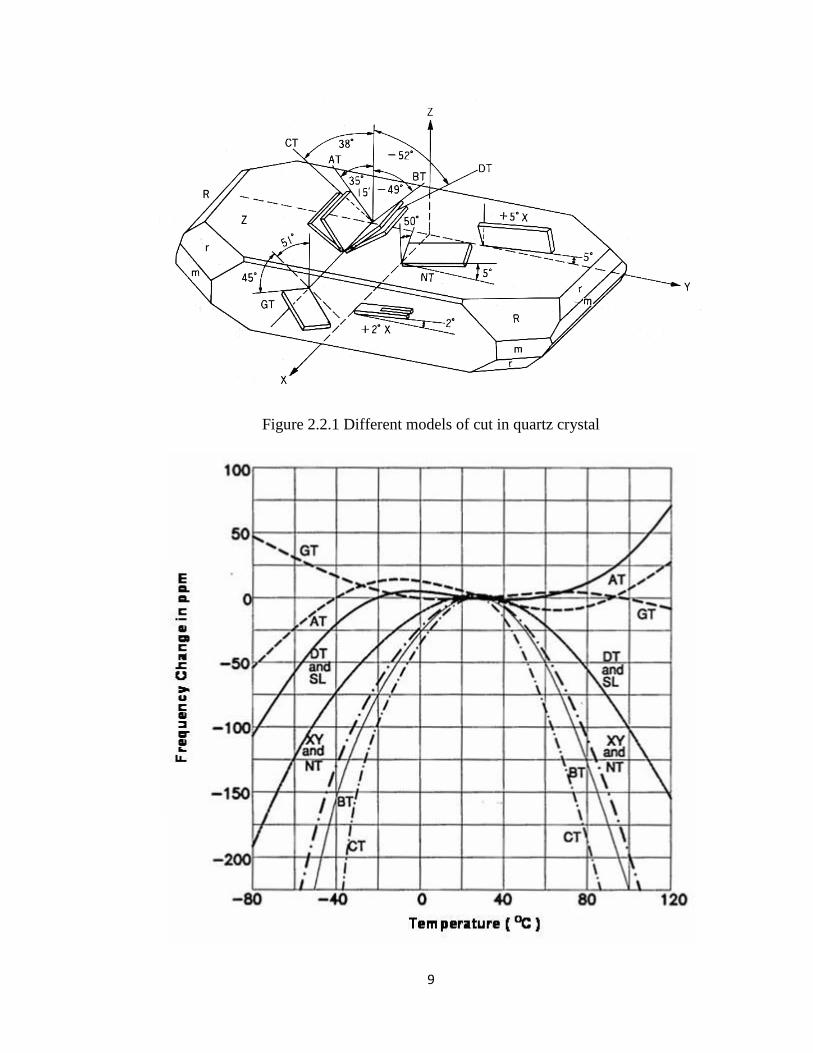
2.2 AT-Cut quartz crystal
For quartz crystal, there have several models of cuts related to different modes of
vibration as shown in Figure 2.2.1, for each mode of vibration there is an optimal angle
of cut which controls the frequency deviation of the quartz crystal over the temperature
range. From Figure 2.2.2, it demonstrates typical AT-cut quartz crystal has relatively
small frequency-temperature dependence over a large temperature range between 0 and
60 C0 , for an angle of crystal cut near '01535 , the error is ≤ ±1 ppm/ C0 .31 Typically
for a QCM sensor, it has commonly been selected AT-cut quartz crystal in a tenth of one
mm of thickness, because this geometry provides a stable oscillation with almost no
temperature fluctuation in frequency around an ambient temperature. In most applications,
the QCM sensor depends on the circular quartz crystal operating in the thickness shear
mode (TSM) of vibration, where motion laterally moves to the surface32, as shown in
Figure 2.2.3.
9
Figure 2.2.1 Different models of cut in quartz crystal
10
Figure 2.2.2 Frequency change with temperature range of different models crystal cut
Figure 2.2.3 QCM sensor thickness shear mode of vibration
2.3 QCM sensor equivalent circuits
Generally, QCM sensor is a mass to frequency converter, which can convert tiny
mass change on QCM electrode surface to change of measurable vibration frequency of
QCM. Concretely, a quartz crystal unit in the main resonance frequency may be
expressed as the Butterworth-Van-Dyke (BVD) model (shown in Figure 2.3.1), which
ordinarily composes of the motional arm (C1, L1, and R1) and the static arm (C0), where
X1 is quartz crystal unit, C1 corresponds to the dynamic capacitance ( elasticity of the
oscillating body), L1 corresponds to the dynamic inductance (oscillating mass of the
quartz), R1 corresponds to the dynamic resistance (friction damping of the quartz slice,
acoustic damping of ambient), and C0 corresponds to the static parallel capacitance
( capacitance between quartz electrodes).33 C0, C1, L1, and R1 are represented as
following equations:
l
SC r 00
(1)
11
2
3
18SK
rlR
(2)
2
3
18SK
lL
(3)
c
SKC
2
2
1
8
(4)
where r is the relative dielectric constant, 0 is the dielectric constant in
vacuum, S is the area of electrode, l is the thickness of quartz, r is the radius of quartz
crystal, K is the piezoelectric stress constant, is the density of quartz, and c is the wave
speed in the quartz crystal.
Figure 2.3.1 Quartz crystal unit and Butterworth-Van-Dyke (BVD) equivalent circuit
model of QCM
From the BVD equivalent circuit, the equivalent impedance can be derivate:
12
011
001
2
111
1
1
CRjC
CCL
CLjR
Z
(5)
When the quartz crystal is oscillating, the equivalent impedance acts resistive, and
the imaginary part is zero in equation 5, in the other word, the imaginary part of
01
00
21 11 CRj
CCLC
CLjR
is zero, which means:
0110
21
00
2
CRC
CLCC
L
(6)
Considering the value of R1 is too small (around 100 Ohm), the R12 can be
ignored. So
011 00
2
C
CLCC
L
(7)
Means:
LCs12 Or
LCfs
21 (8)
0
2 11LCLCp Or
0
1121
LCLCfp
(10)
Where s is the series angle frequency, sf is the series resonance frequency, p
is the parallel angle frequency, and pf is the parallel resonance frequency. Because of 1C
<< 0C ( 1C value is around 10-2~10-1pF, 0C value is around several or dozens of pF), so sf
and pf are too close. Generally thinking:
LCfff ps
121
(11)
13
The equivalent circuit components of C1, L1, and R1 are represented the
mechanical properties of the quartz crystal, in parallel with a static capacitance C0 which
represents the electrical connections to the crystal. The series components determine the
basic frequency of the quartz crystal oscillation which operates towards its series
resonance. Quartz resonators are characterized by the following essential properties:33
Very high quality (Q = 104-105)
High L/C ratio
1C << 0C
Frequency stability resff / ≤ 10-4-10-10
2.4 Theoretical basis of QCM technique
Since 1959, Sauerbrey3 firstly discovered the proportional relationship between
mass increasing on the quartz crystal surface and frequency decreasing of it accordingly.
He came up with the well- known linear Sauerbrey equation (eq. 1), which found a new
method to explore the micro-world. The Sauerbrey equation is used to precisely quantify,
with nanogram level sensitivity, the elastic mass added to the surface of quartz crystal.32
When a QCM sensor was chosen the 0f , q , q , and A are constant, so there exists a
linear proportional relationship between f and m .
mA
ffqq
202 (12)
Table 2.3.1 Parameters in the Sauerbrey equation
f the measured resonant frequency change (Hz)
0f the intrinsic frequency of the quartz crystal (Hz)
A the piezoelectlyrical active crystal area (electrodes
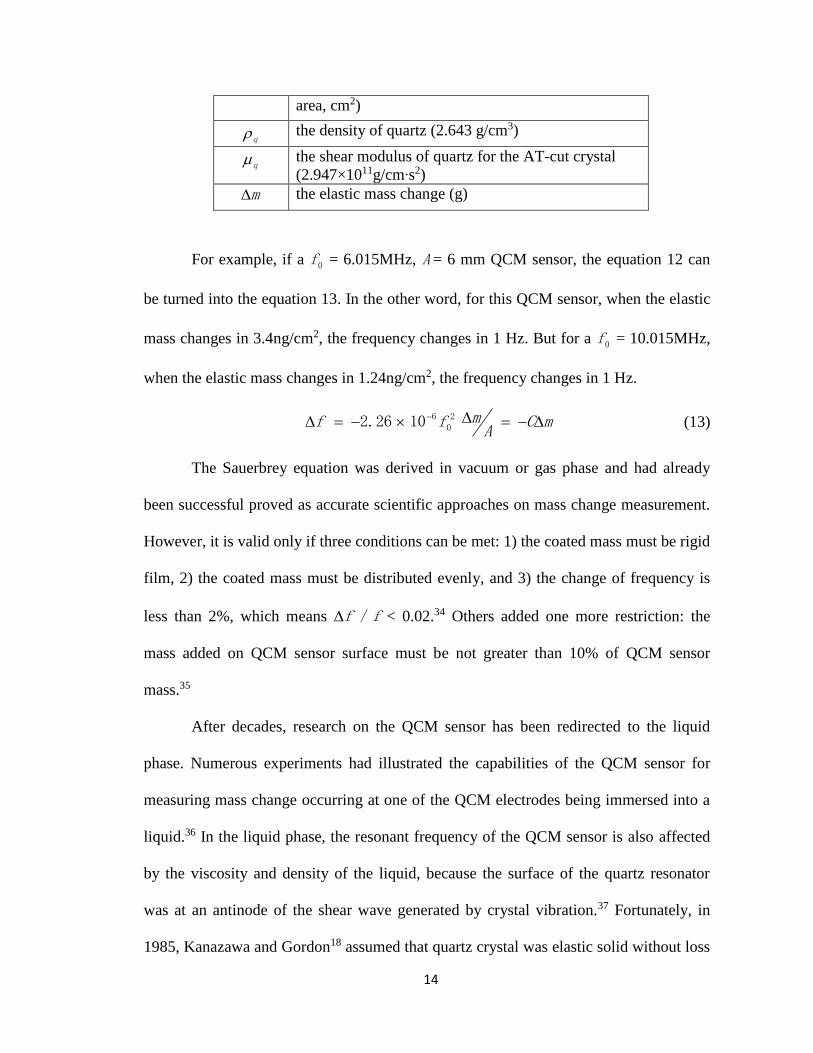
14
area, cm2)
q the density of quartz (2.643 g/cm3)
q the shear modulus of quartz for the AT-cut crystal
(2.947×10¹¹g/cm∙s2)
m the elastic mass change (g)
For example, if a 0f = 6.015MHz, A = 6 mm QCM sensor, the equation 12 can
be turned into the equation 13. In the other word, for this QCM sensor, when the elastic
mass changes in 3.4ng/cm2, the frequency changes in 1 Hz. But for a 0f = 10.015MHz,
when the elastic mass changes in 1.24ng/cm2, the frequency changes in 1 Hz.
mCAmff 2
061026.2 (13)
The Sauerbrey equation was derived in vacuum or gas phase and had already
been successful proved as accurate scientific approaches on mass change measurement.
However, it is valid only if three conditions can be met: 1) the coated mass must be rigid
film, 2) the coated mass must be distributed evenly, and 3) the change of frequency is
less than 2%, which means ff / < 0.02.34 Others added one more restriction: the
mass added on QCM sensor surface must be not greater than 10% of QCM sensor
mass.35
After decades, research on the QCM sensor has been redirected to the liquid
phase. Numerous experiments had illustrated the capabilities of the QCM sensor for
measuring mass change occurring at one of the QCM electrodes being immersed into a
liquid.36 In the liquid phase, the resonant frequency of the QCM sensor is also affected
by the viscosity and density of the liquid, because the surface of the quartz resonator
was at an antinode of the shear wave generated by crystal vibration.37 Fortunately, in
1985, Kanazawa and Gordon18 assumed that quartz crystal was elastic solid without loss
15
and liquid was a Newtonian fluid. Under this assumption, they discovered the
relationship between the resonant frequency change and the viscosity and density of
liquid, as follow:
2123
0 )( qqllff (14)
Where l is the density of the liquid and l is the viscosity of the liquid. When
the QCM sensor vibrates in the liquid, the total frequency decrease cannot be
deconvoluted into a contribution from a bound mass distinguishable from the liquid
contribution.32 When 0f , q ,and q are constant, f is proportional to 21ll .
Low-cost QCM system platform design
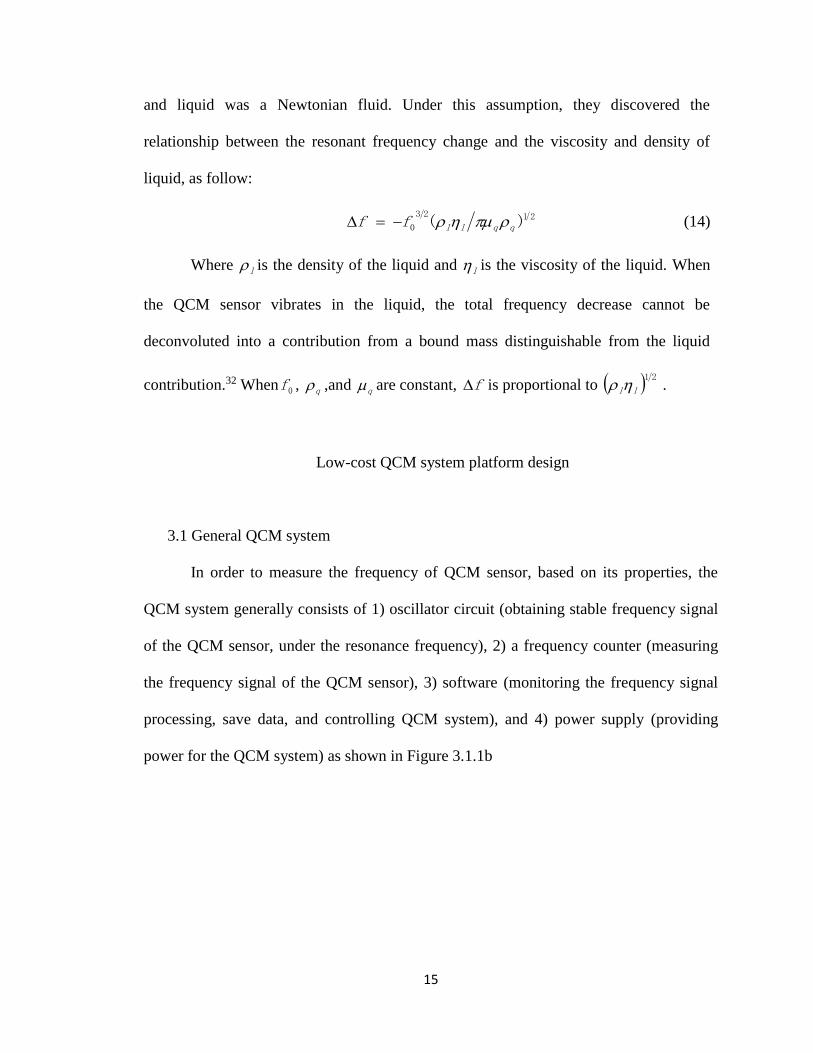
3.1 General QCM system
In order to measure the frequency of QCM sensor, based on its properties, the
QCM system generally consists of 1) oscillator circuit (obtaining stable frequency signal
of the QCM sensor, under the resonance frequency), 2) a frequency counter (measuring
the frequency signal of the QCM sensor), 3) software (monitoring the frequency signal
processing, save data, and controlling QCM system), and 4) power supply (providing
power for the QCM system) as shown in Figure 3.1.1b
16
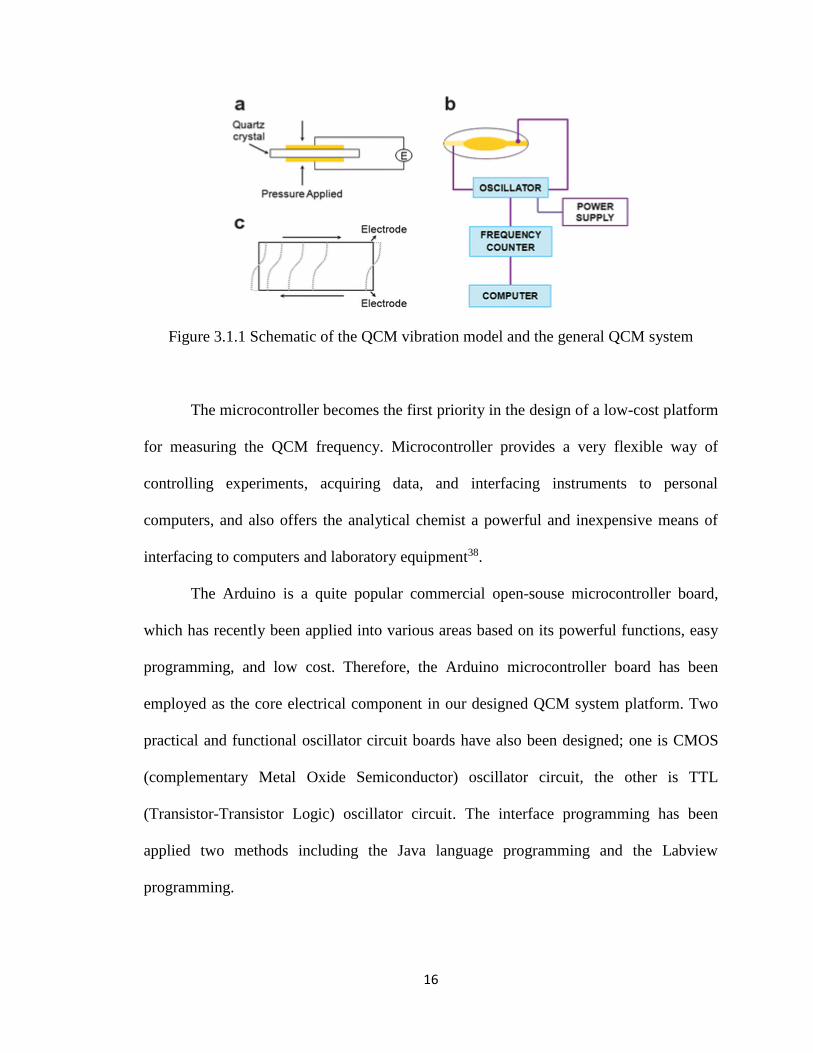
Figure 3.1.1 Schematic of the QCM vibration model and the general QCM system
The microcontroller becomes the first priority in the design of a low-cost platform
for measuring the QCM frequency. Microcontroller provides a very flexible way of
controlling experiments, acquiring data, and interfacing instruments to personal
computers, and also offers the analytical chemist a powerful and inexpensive means of
interfacing to computers and laboratory equipment38.
The Arduino is a quite popular commercial open-souse microcontroller board,
which has recently been applied into various areas based on its powerful functions, easy
programming, and low cost. Therefore, the Arduino microcontroller board has been
employed as the core electrical component in our designed QCM system platform. Two
practical and functional oscillator circuit boards have also been designed; one is CMOS
(complementary Metal Oxide Semiconductor) oscillator circuit, the other is TTL
(Transistor-Transistor Logic) oscillator circuit. The interface programming has been
applied two methods including the Java language programming and the Labview
programming.
17
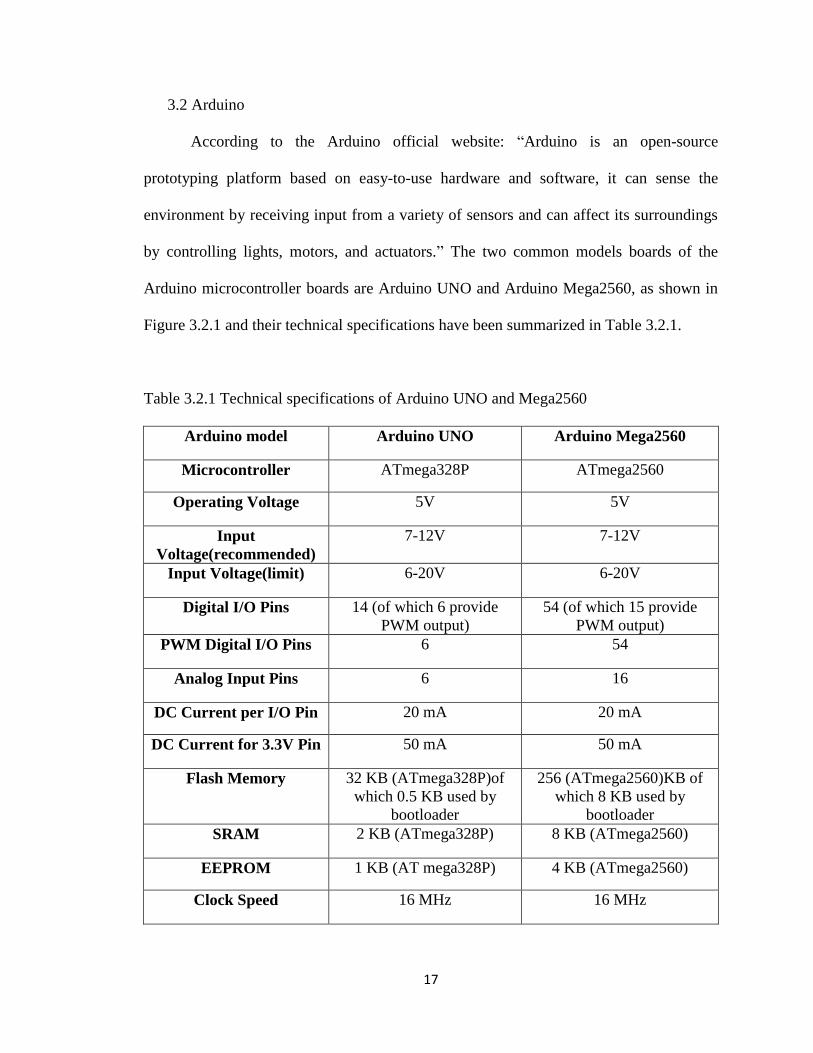
3.2 Arduino
According to the Arduino official website: “Arduino is an open-source
prototyping platform based on easy-to-use hardware and software, it can sense the
environment by receiving input from a variety of sensors and can affect its surroundings
by controlling lights, motors, and actuators.” The two common models boards of the
Arduino microcontroller boards are Arduino UNO and Arduino Mega2560, as shown in
Figure 3.2.1 and their technical specifications have been summarized in Table 3.2.1.
Table 3.2.1 Technical specifications of Arduino UNO and Mega2560
Arduino model Arduino UNO Arduino Mega2560
Microcontroller ATmega328P ATmega2560
Operating Voltage 5V 5V
Input
Voltage(recommended)
7-12V 7-12V
Input Voltage(limit) 6-20V 6-20V
Digital I/O Pins 14 (of which 6 provide
PWM output)
54 (of which 15 provide
PWM output)
PWM Digital I/O Pins 6 54
Analog Input Pins 6 16
DC Current per I/O Pin 20 mA 20 mA
DC Current for 3.3V Pin 50 mA 50 mA
Flash Memory 32 KB (ATmega328P)of
which 0.5 KB used by
bootloader
256 (ATmega2560)KB of
which 8 KB used by
bootloader
SRAM 2 KB (ATmega328P) 8 KB (ATmega2560)
EEPROM 1 KB (AT mega328P) 4 KB (ATmega2560)
Clock Speed 16 MHz 16 MHz
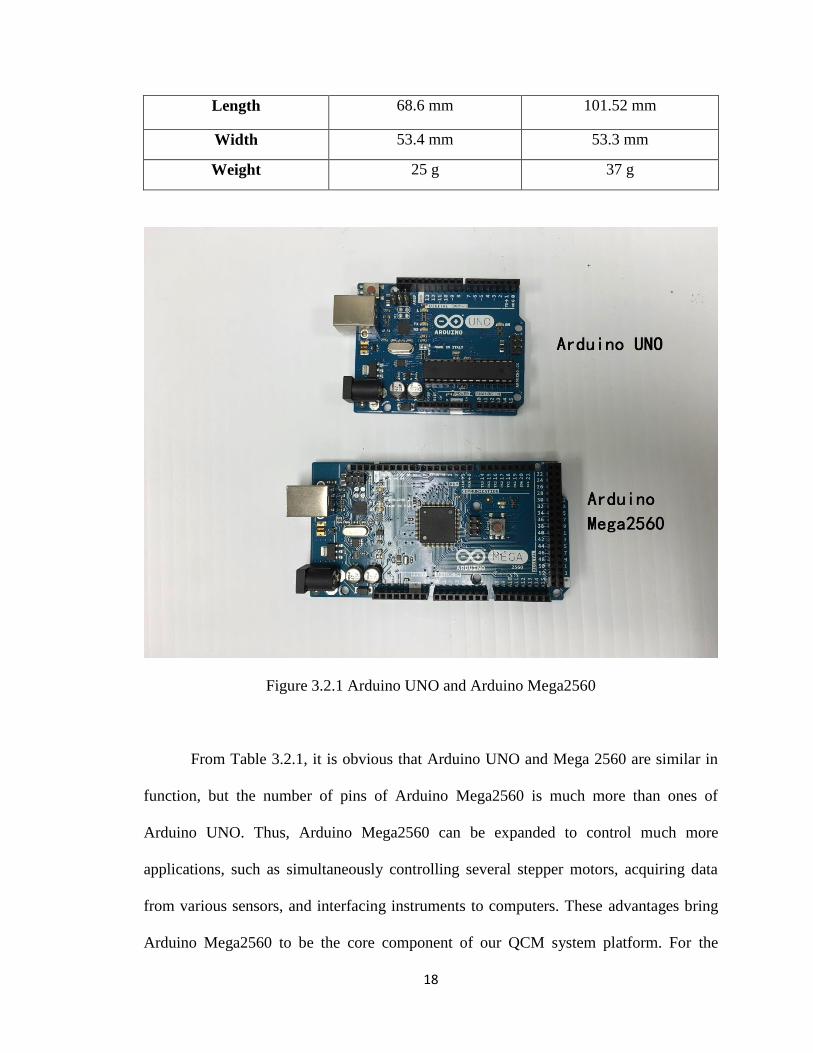
18
Length 68.6 mm 101.52 mm
Width 53.4 mm 53.3 mm
Weight 25 g 37 g
Figure 3.2.1 Arduino UNO and Arduino Mega2560
From Table 3.2.1, it is obvious that Arduino UNO and Mega 2560 are similar in
function, but the number of pins of Arduino Mega2560 is much more than ones of
Arduino UNO. Thus, Arduino Mega2560 can be expanded to control much more
applications, such as simultaneously controlling several stepper motors, acquiring data
from various sensors, and interfacing instruments to computers. These advantages bring
Arduino Mega2560 to be the core component of our QCM system platform. For the
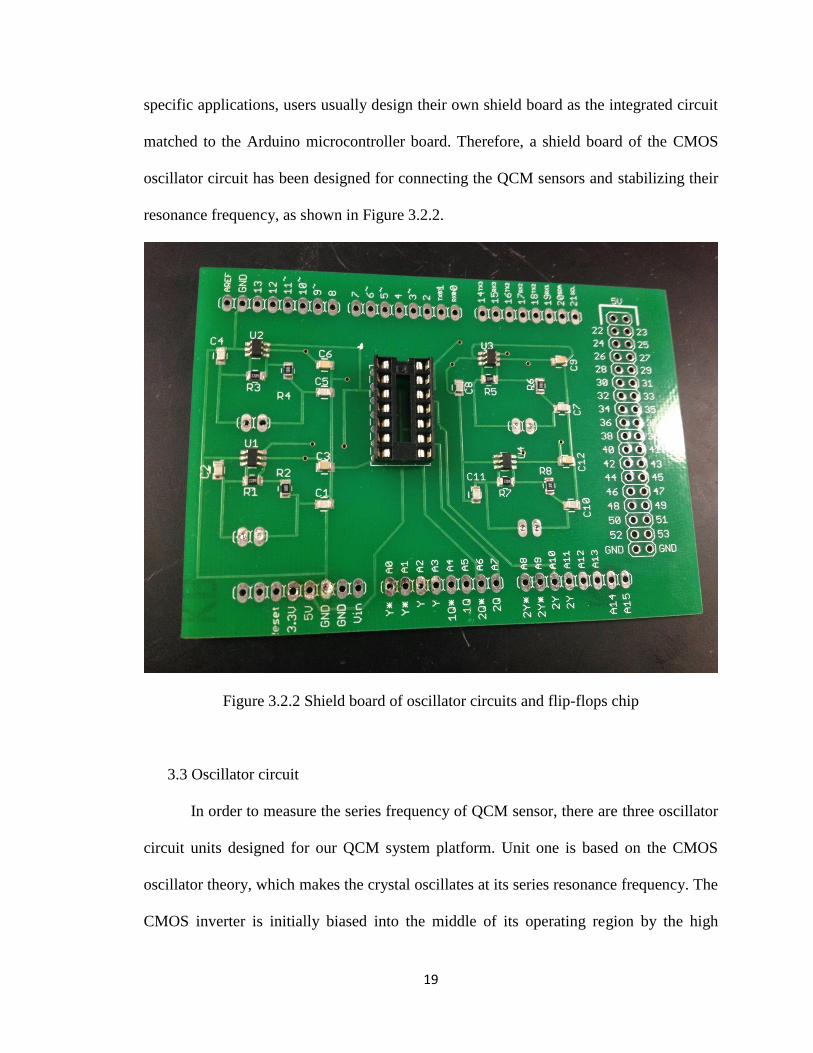
19
specific applications, users usually design their own shield board as the integrated circuit
matched to the Arduino microcontroller board. Therefore, a shield board of the CMOS
oscillator circuit has been designed for connecting the QCM sensors and stabilizing their
resonance frequency, as shown in Figure 3.2.2.
Figure 3.2.2 Shield board of oscillator circuits and flip-flops chip
3.3 Oscillator circuit
In order to measure the series frequency of QCM sensor, there are three oscillator
circuit units designed for our QCM system platform. Unit one is based on the CMOS
oscillator theory, which makes the crystal oscillates at its series resonance frequency. The
CMOS inverter is initially biased into the middle of its operating region by the high
20
feedback resistor, usually more than 1 MΩ; additional inverter is used to buffer the
output from the oscillator to the connected load. The inverter provides 1800 of phase shift
and the crystal capacitor network the additional 1800 required for oscillation. The
advantage of the CMOS crystal oscillator is that it will always automatically readjust
itself to maintain this 3600 phase shift for oscillation. According to the CMOS oscillator
theory, SN74LVC1GX04 crystal oscillator driver is chosen to be the core component in
the oscillator circuit unit one. Its top view and logic diagram are shown in Figure 3.3.1.
Therefore, a modified CMOS oscillator circuit is designed with SN74LVC1GX04 crystal
oscillator drivers and SN74LS74AN dual D-type positive-edge-triggered flip-flops,
which is employed for generating a differential frequency of two QCM sensors, as shown
in the APPENDIX A. Figure 3.3.2 shows one of four oscillator circuits based on
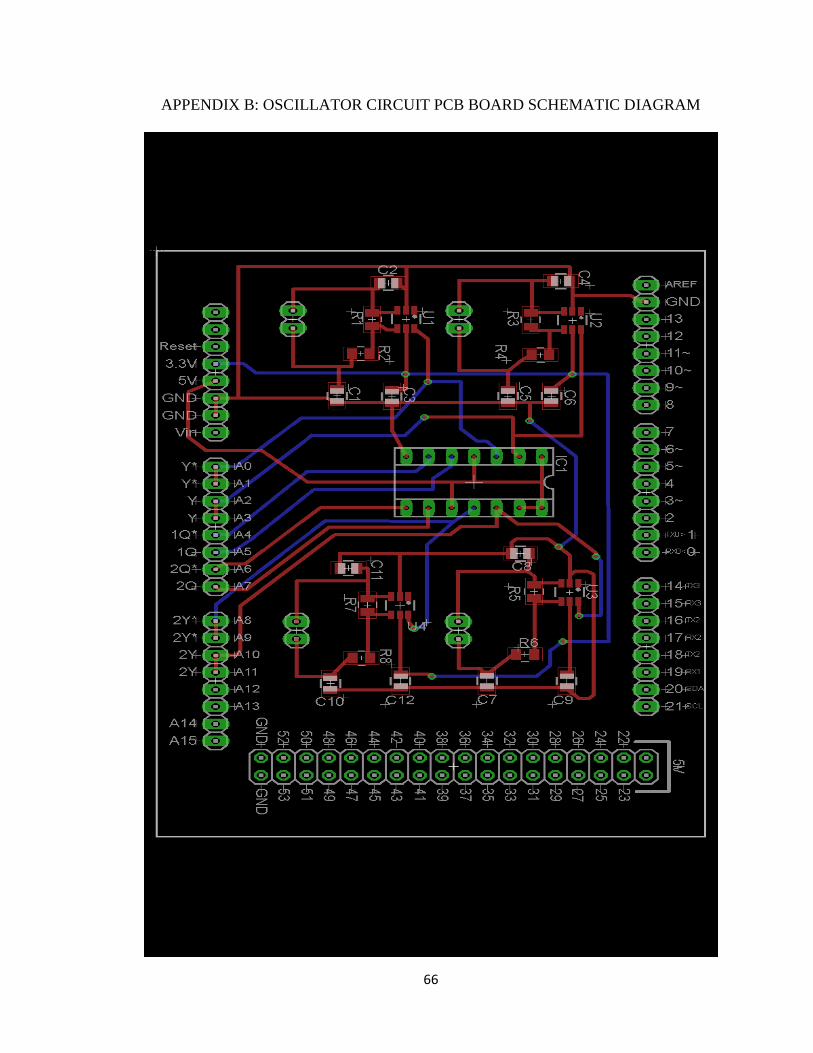
SN74LVC1GX04 crystal oscillator driver. The whole circuit schematic diagram and PCB
are designed and drawn by the Eagle software, as shown in the APPENDIX B. The PCBs
are printed and made in the SeeedStudio Company, and the devices for components
soldered are provided by the Department of Engineering in Western Kentucky University.
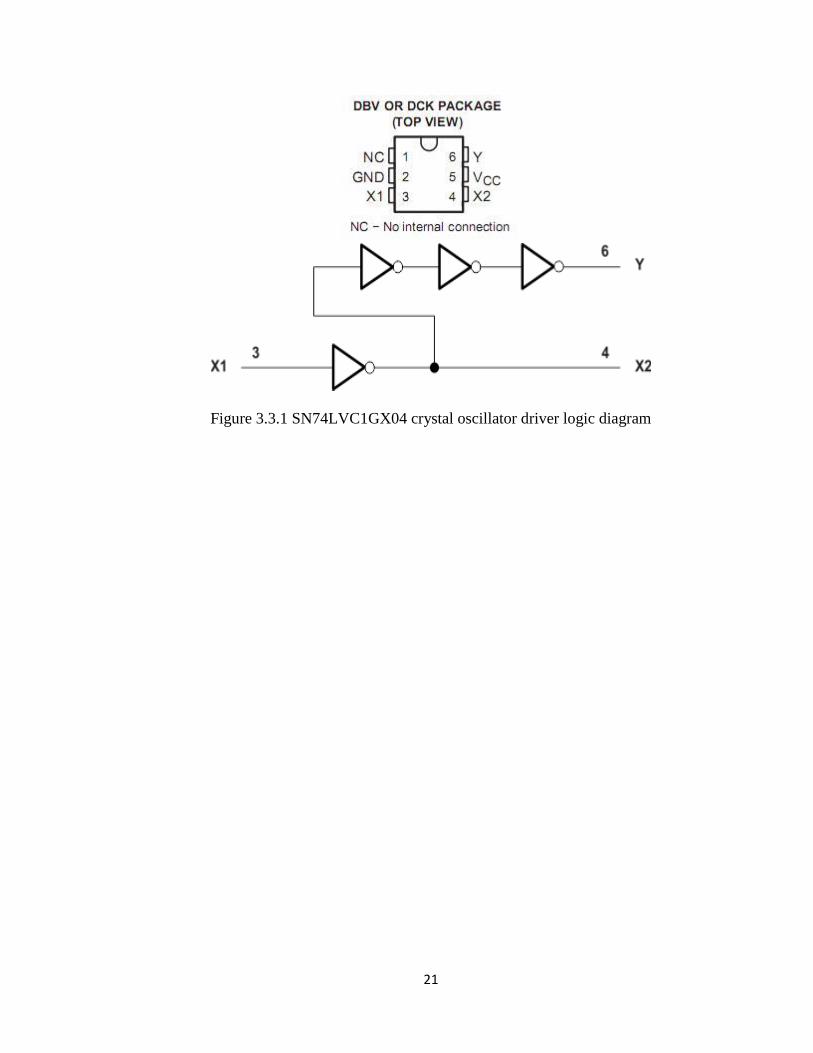
21
Figure 3.3.1 SN74LVC1GX04 crystal oscillator driver logic diagram
22
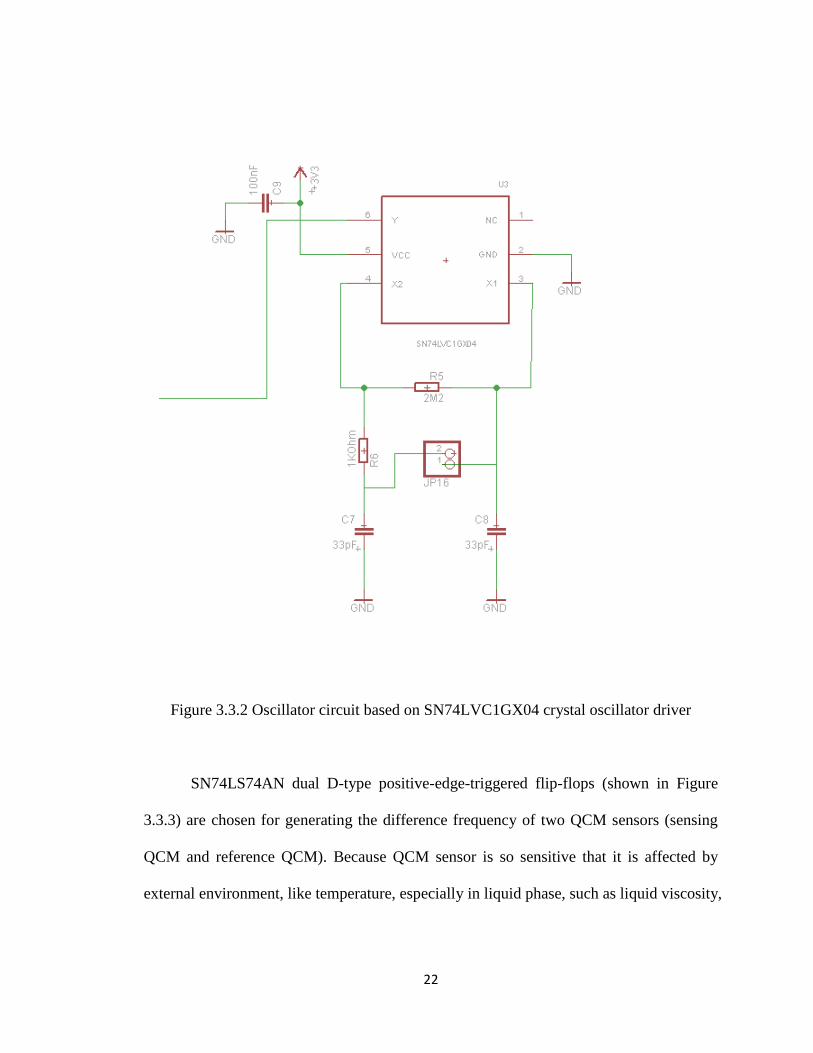
Figure 3.3.2 Oscillator circuit based on SN74LVC1GX04 crystal oscillator driver
SN74LS74AN dual D-type positive-edge-triggered flip-flops (shown in Figure
3.3.3) are chosen for generating the difference frequency of two QCM sensors (sensing
QCM and reference QCM). Because QCM sensor is so sensitive that it is affected by
external environment, like temperature, especially in liquid phase, such as liquid viscosity,
23
density, and conductivity. In order to minimize the effects of these irresistible factors, the
difference frequency should be measured during the experiments.
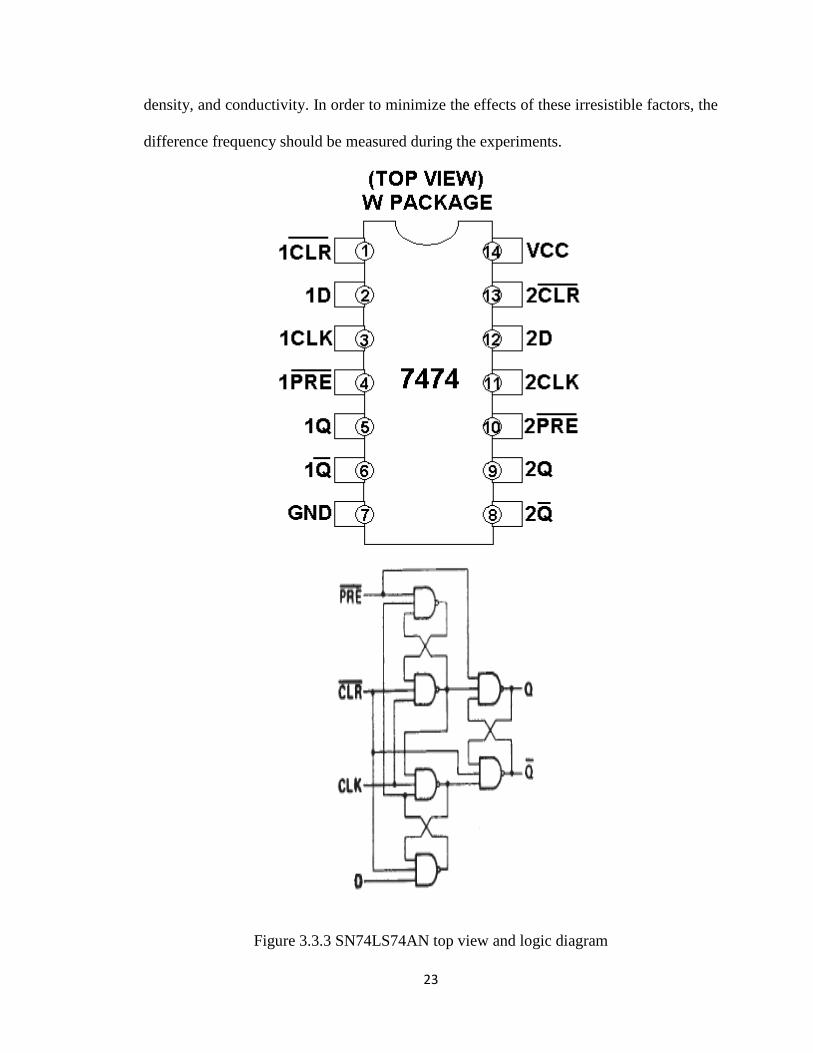
Figure 3.3.3 SN74LS74AN top view and logic diagram
24
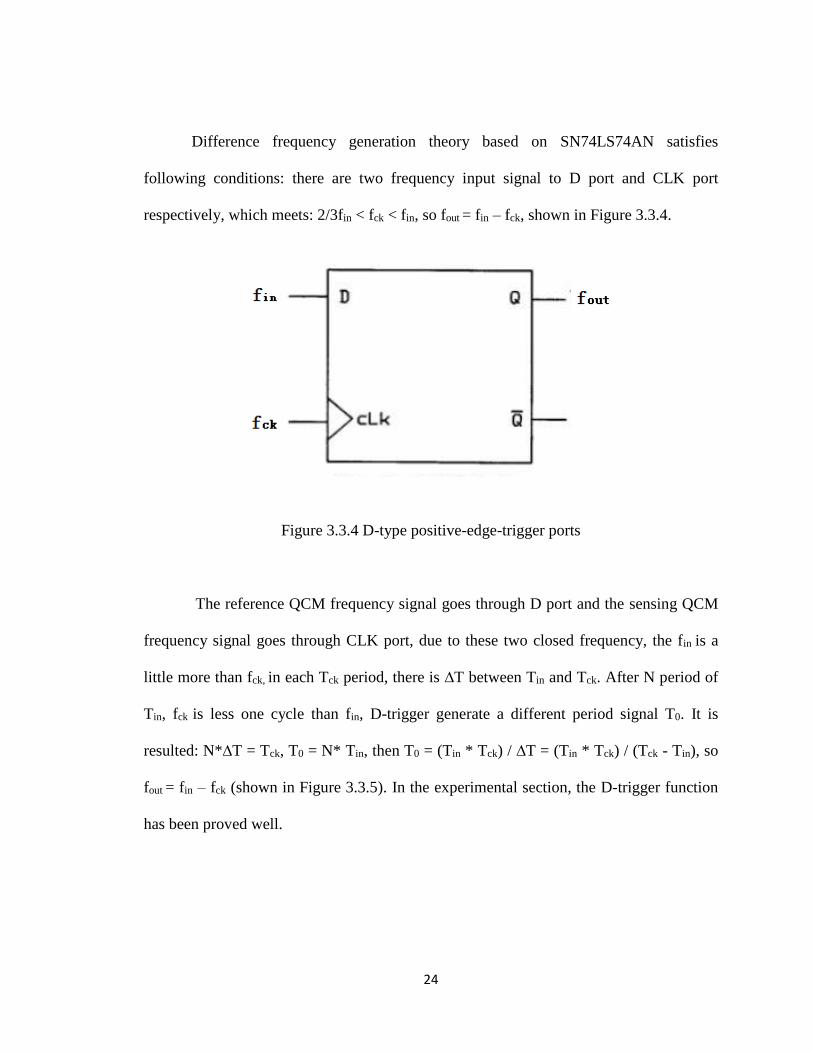
Difference frequency generation theory based on SN74LS74AN satisfies
following conditions: there are two frequency input signal to D port and CLK port
respectively, which meets: 2/3fin < fck < fin, so fout = fin – fck, shown in Figure 3.3.4.
Figure 3.3.4 D-type positive-edge-trigger ports
The reference QCM frequency signal goes through D port and the sensing QCM
frequency signal goes through CLK port, due to these two closed frequency, the fin is a
little more than fck, in each Tck period, there is ∆T between Tin and Tck. After N period of
Tin, fck is less one cycle than fin, D-trigger generate a different period signal T0. It is
resulted: N*∆T = Tck, T0 = N* Tin, then T0 = (Tin * Tck) / ∆T = (Tin * Tck) / (Tck - Tin), so
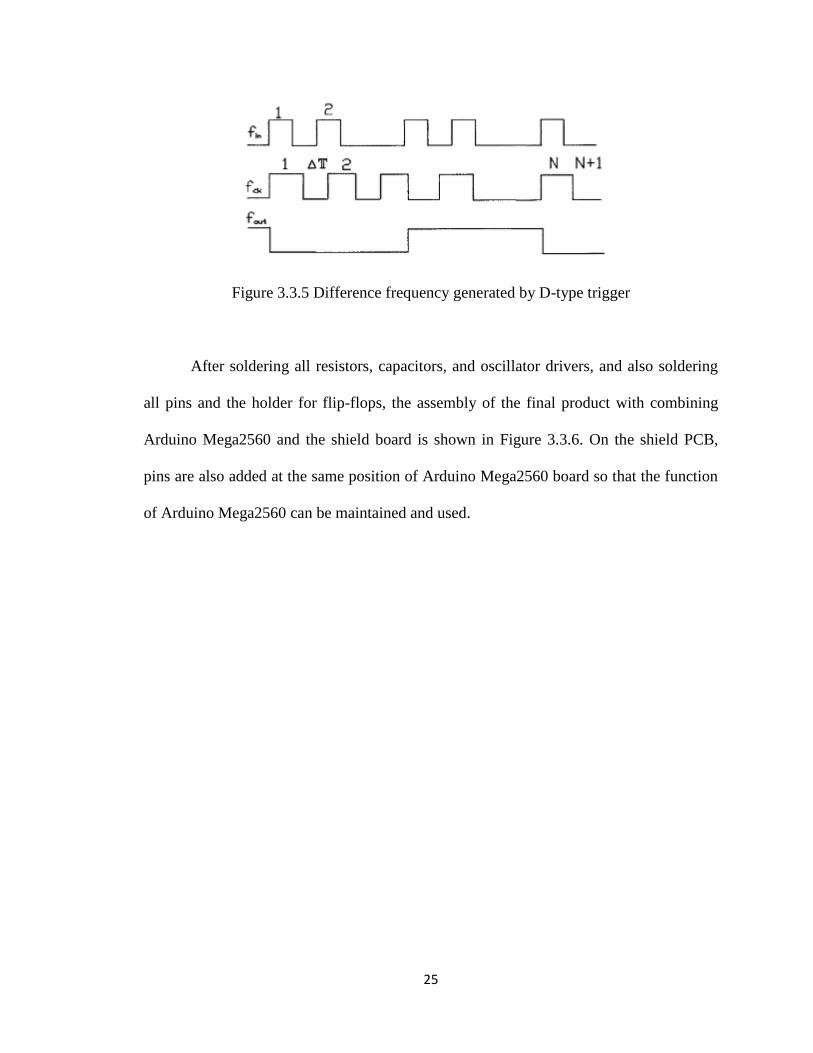
fout = fin – fck (shown in Figure 3.3.5). In the experimental section, the D-trigger function
has been proved well.
25
Figure 3.3.5 Difference frequency generated by D-type trigger
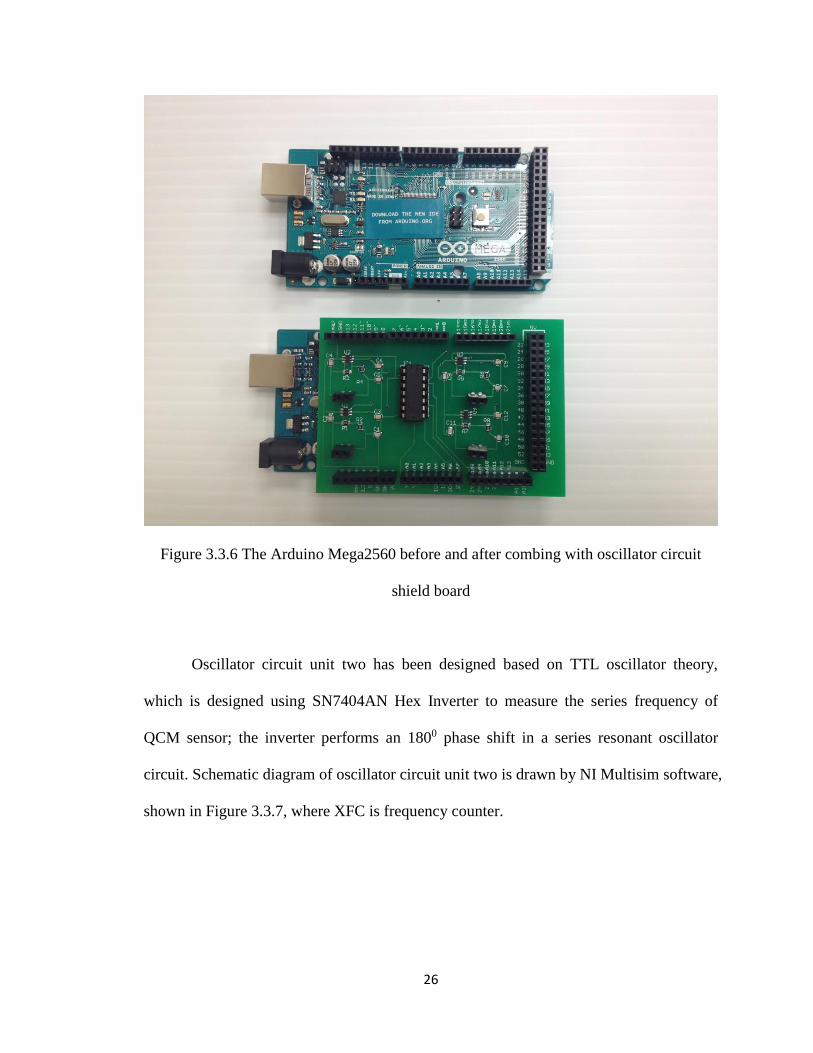
After soldering all resistors, capacitors, and oscillator drivers, and also soldering
all pins and the holder for flip-flops, the assembly of the final product with combining
Arduino Mega2560 and the shield board is shown in Figure 3.3.6. On the shield PCB,
pins are also added at the same position of Arduino Mega2560 board so that the function
of Arduino Mega2560 can be maintained and used.
26
Figure 3.3.6 The Arduino Mega2560 before and after combing with oscillator circuit
shield board
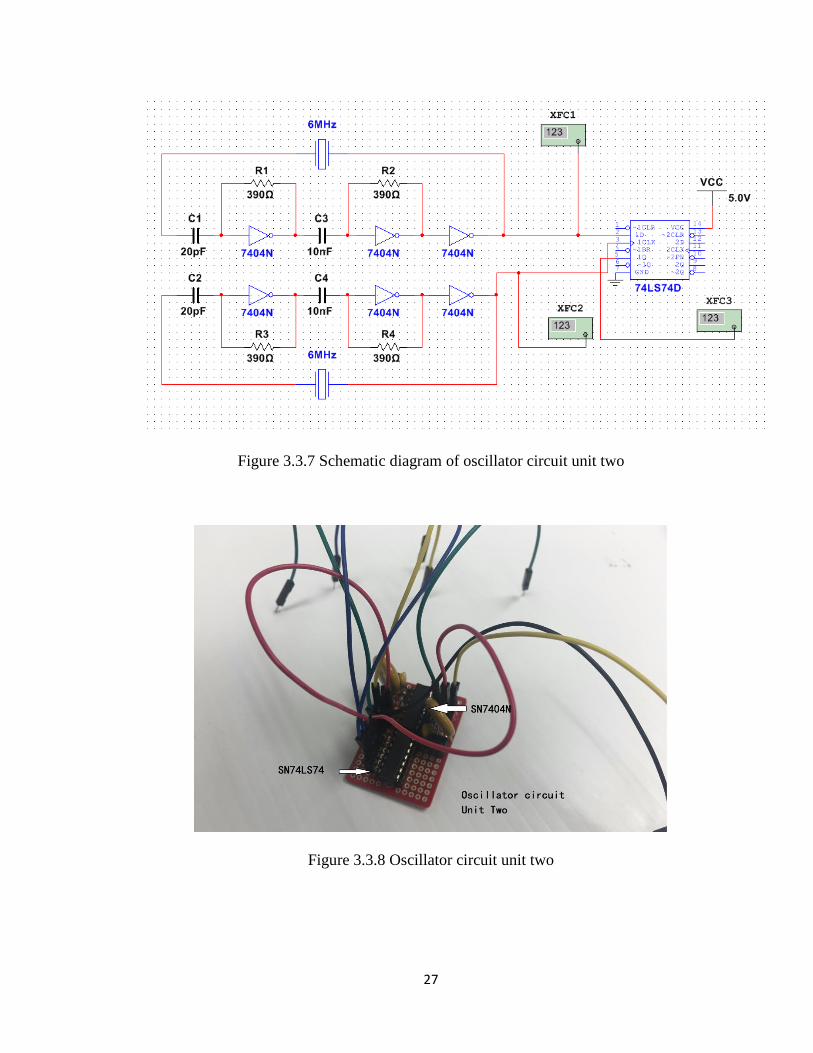
Oscillator circuit unit two has been designed based on TTL oscillator theory,
which is designed using SN7404AN Hex Inverter to measure the series frequency of
QCM sensor; the inverter performs an 1800 phase shift in a series resonant oscillator
circuit. Schematic diagram of oscillator circuit unit two is drawn by NI Multisim software,
shown in Figure 3.3.7, where XFC is frequency counter.
27
Figure 3.3.7 Schematic diagram of oscillator circuit unit two
Figure 3.3.8 Oscillator circuit unit two
28
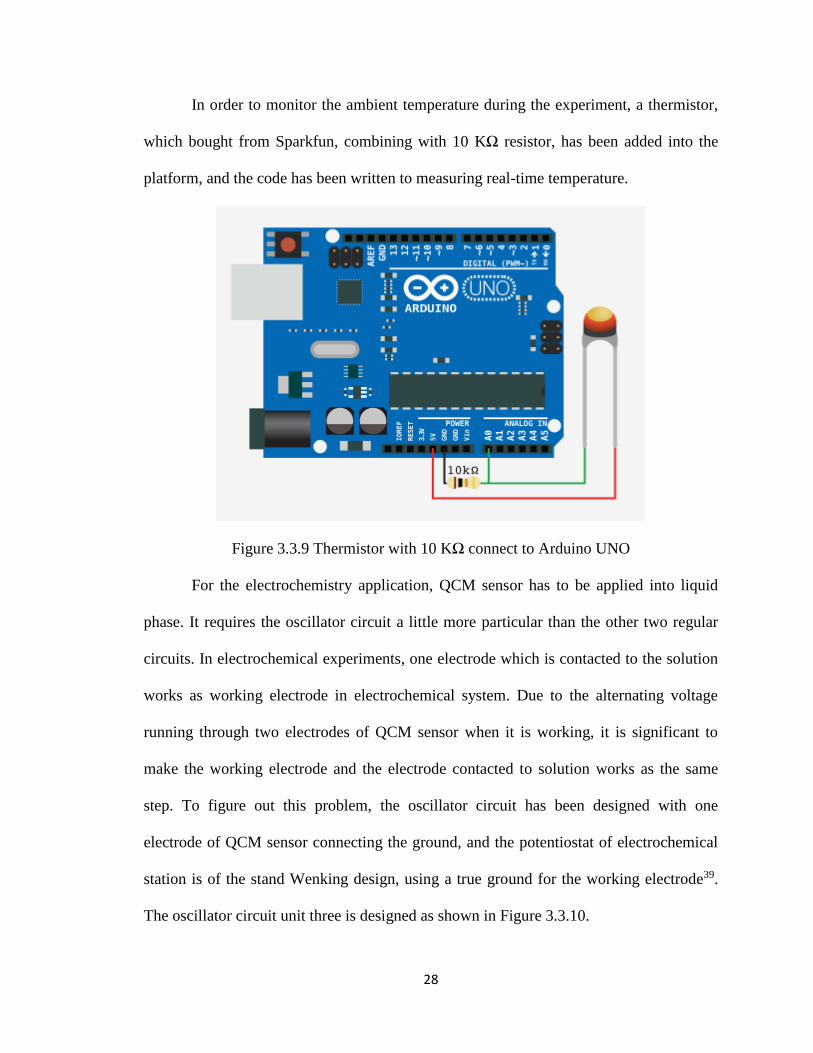
In order to monitor the ambient temperature during the experiment, a thermistor,
which bought from Sparkfun, combining with 10 KΩ resistor, has been added into the
platform, and the code has been written to measuring real-time temperature.
Figure 3.3.9 Thermistor with 10 KΩ connect to Arduino UNO
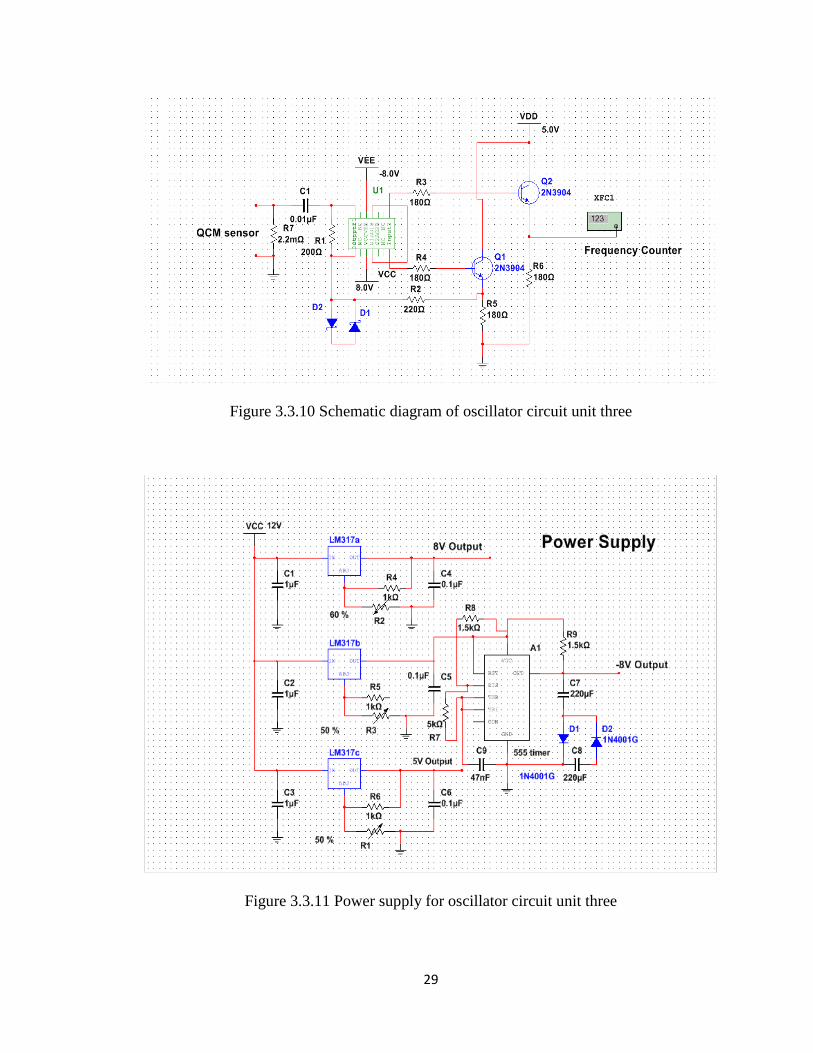
For the electrochemistry application, QCM sensor has to be applied into liquid
phase. It requires the oscillator circuit a little more particular than the other two regular
circuits. In electrochemical experiments, one electrode which is contacted to the solution
works as working electrode in electrochemical system. Due to the alternating voltage
running through two electrodes of QCM sensor when it is working, it is significant to
make the working electrode and the electrode contacted to solution works as the same
step. To figure out this problem, the oscillator circuit has been designed with one
electrode of QCM sensor connecting the ground, and the potentiostat of electrochemical
station is of the stand Wenking design, using a true ground for the working electrode39.
The oscillator circuit unit three is designed as shown in Figure 3.3.10.
29
Figure 3.3.10 Schematic diagram of oscillator circuit unit three
Figure 3.3.11 Power supply for oscillator circuit unit three
30
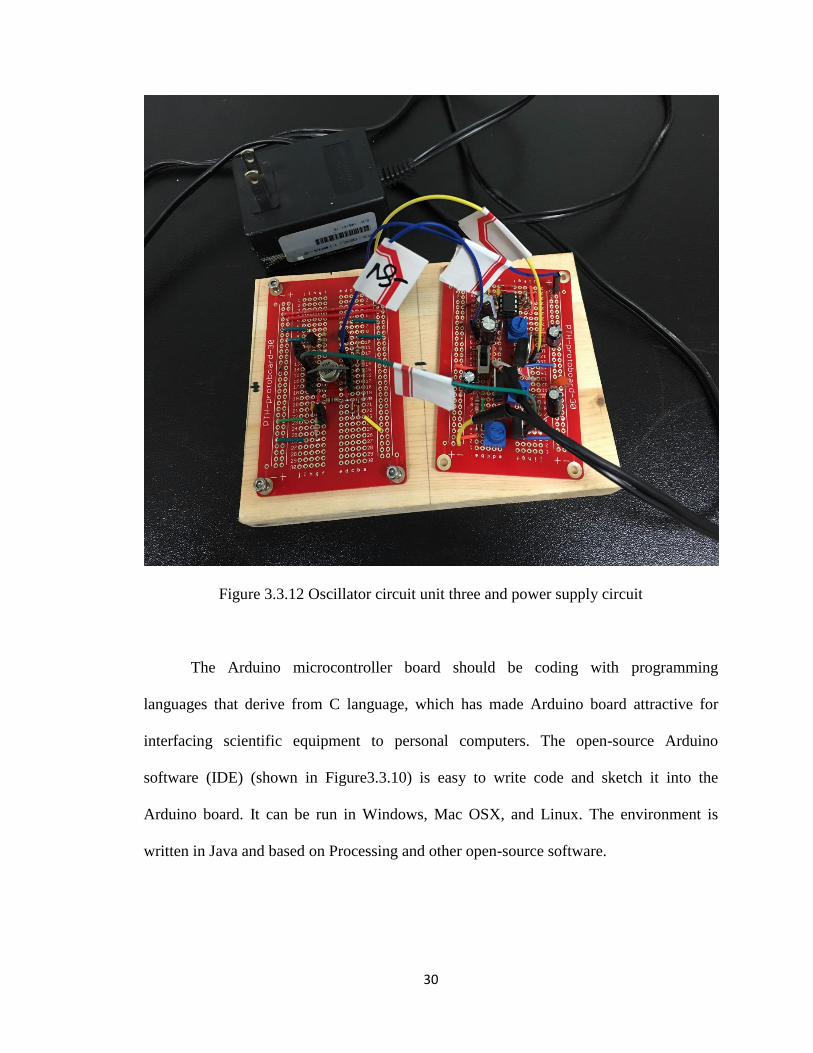
Figure 3.3.12 Oscillator circuit unit three and power supply circuit
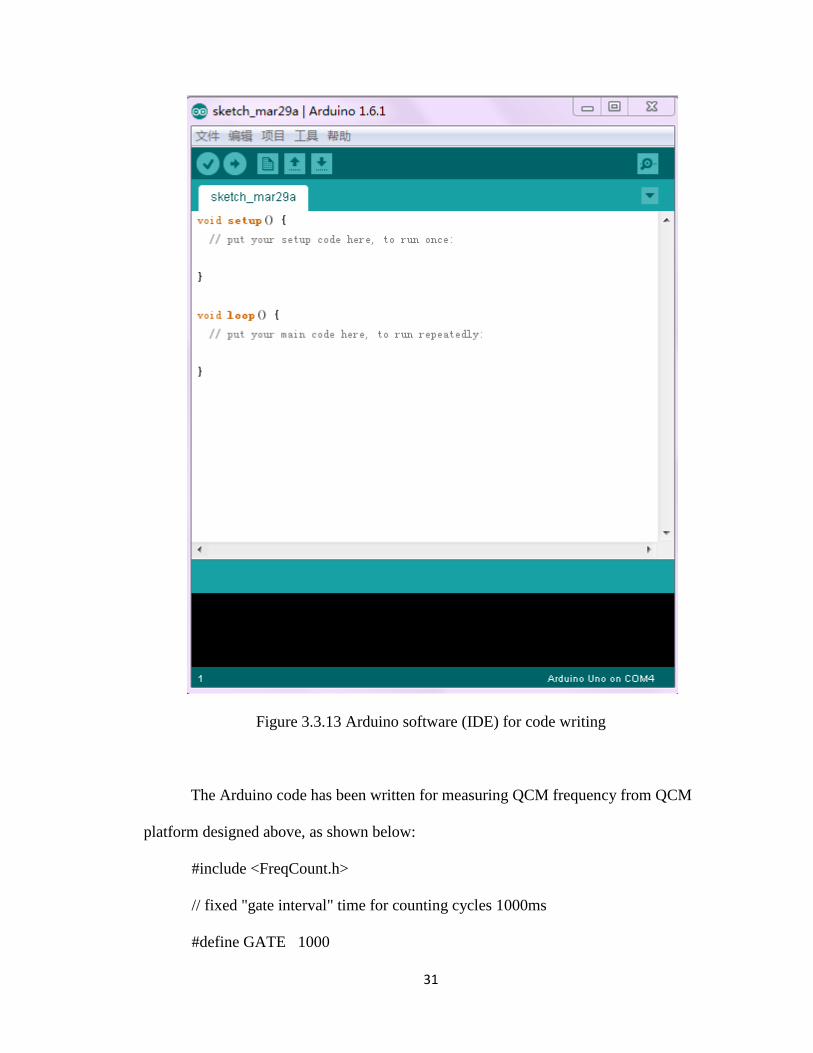
The Arduino microcontroller board should be coding with programming
languages that derive from C language, which has made Arduino board attractive for
interfacing scientific equipment to personal computers. The open-source Arduino
software (IDE) (shown in Figure3.3.10) is easy to write code and sketch it into the
Arduino board. It can be run in Windows, Mac OSX, and Linux. The environment is
written in Java and based on Processing and other open-source software.
31
Figure 3.3.13 Arduino software (IDE) for code writing
The Arduino code has been written for measuring QCM frequency from QCM
platform designed above, as shown below:
#include <FreqCount.h>
// fixed "gate interval" time for counting cycles 1000ms
#define GATE 1000
32
// Thermistor pin
#define THERMISTORPIN A1
// // resistance at 25 degrees C
#define THERMISTORNOMINAL 10000
// temp. for nominal resistance (almost always 25 C)
#define TEMPERATURENOMINAL 25
// how many samples to take and average
#define NUMSAMPLES 10
// The beta coefficient of the thermistor (usually 3000-4000)
#define BCOEFFICIENT 3950
// the value of the 'other' resistor
#define SERIESRESISTOR 10000
// print data to serial port
void dataPrint(unsigned long Count, int Temperature)
Serial.print("RAWMONITOR");
Serial.print(Count);
Serial.print("_");
Serial.print(Temperature);
Serial.write(255);
// measure temperature
33
int getTemperature(void)
int i;
float average;
int samples[NUMSAMPLES];
float thermistorResistance;
int Temperature;
// acquire N samples
for (i=0; i< NUMSAMPLES; i++)
samples[i] = analogRead(THERMISTORPIN);
delay(10);
// average all the samples out
average = 0;
for (i=0; i< NUMSAMPLES; i++)
average += samples[i];
average /= NUMSAMPLES;
// convert the value to resistance
thermistorResistance = average * SERIESRESISTOR / (1023 - average);
34
float steinhart;
steinhart = thermistorResistance / THERMISTORNOMINAL; // (R/Ro)
steinhart = log(steinhart); // ln(R/Ro)
steinhart /= BCOEFFICIENT; // 1/B * ln(R/Ro)
steinhart += 1.0 / (TEMPERATURENOMINAL + 273.15); // + (1/To)
steinhart = 1.0 / steinhart; // Invert
steinhart -= 273.15; // convert to C
// decimal value
Temperature = steinhart * 10;
return(Temperature);
// variable declaration
// QCM frequency
unsigned long frequency = 0;
// counting the number of pulses in a fixed time
unsigned long count = 0;
// thermistor temperature
int temperature = 0;
void setup()
Serial.begin(115200);
35
// Configure the reference voltage used for analog input
analogReference(EXTERNAL);
// init the frequency counter
FreqCount.begin(GATE);
void loop()
if (FreqCount.available())
count = FreqCount.read(); // counting the number of pulses
frequency = count; // measure QCM frequency
temperature = getTemperature(); // measure temperature
dataPrint(frequency, temperature); // print data
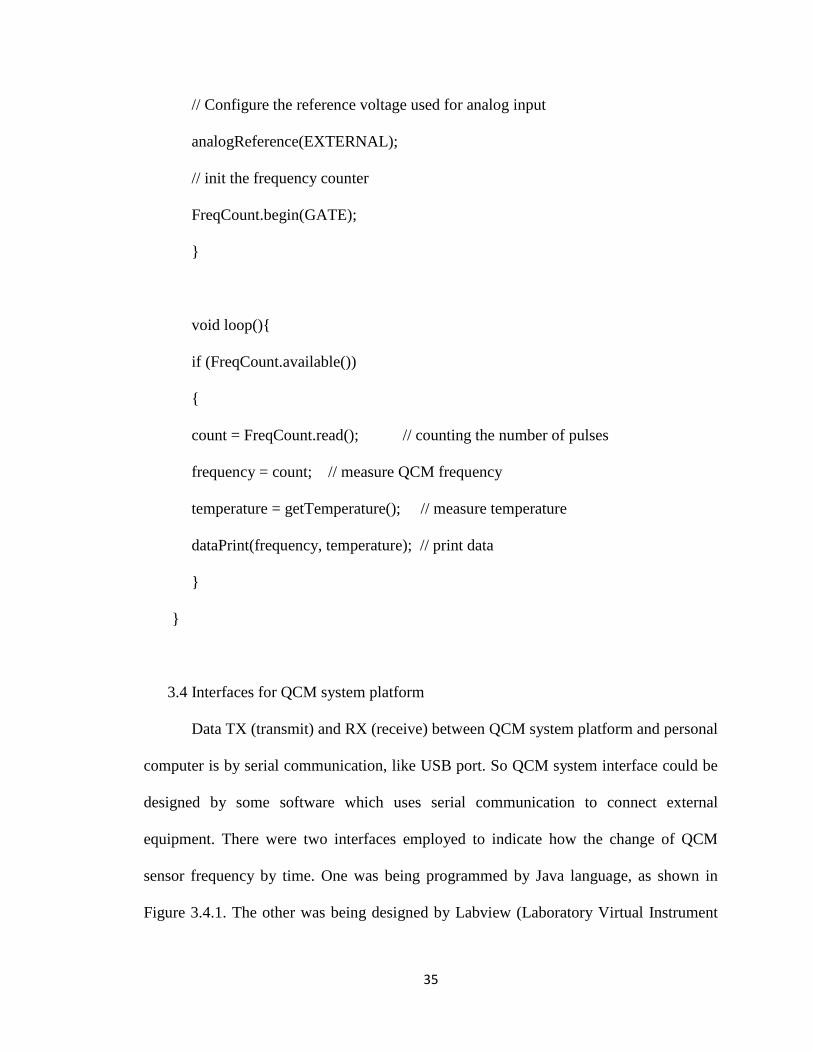
3.4 Interfaces for QCM system platform
Data TX (transmit) and RX (receive) between QCM system platform and personal
computer is by serial communication, like USB port. So QCM system interface could be
designed by some software which uses serial communication to connect external
equipment. There were two interfaces employed to indicate how the change of QCM
sensor frequency by time. One was being programmed by Java language, as shown in
Figure 3.4.1. The other was being designed by Labview (Laboratory Virtual Instrument
36
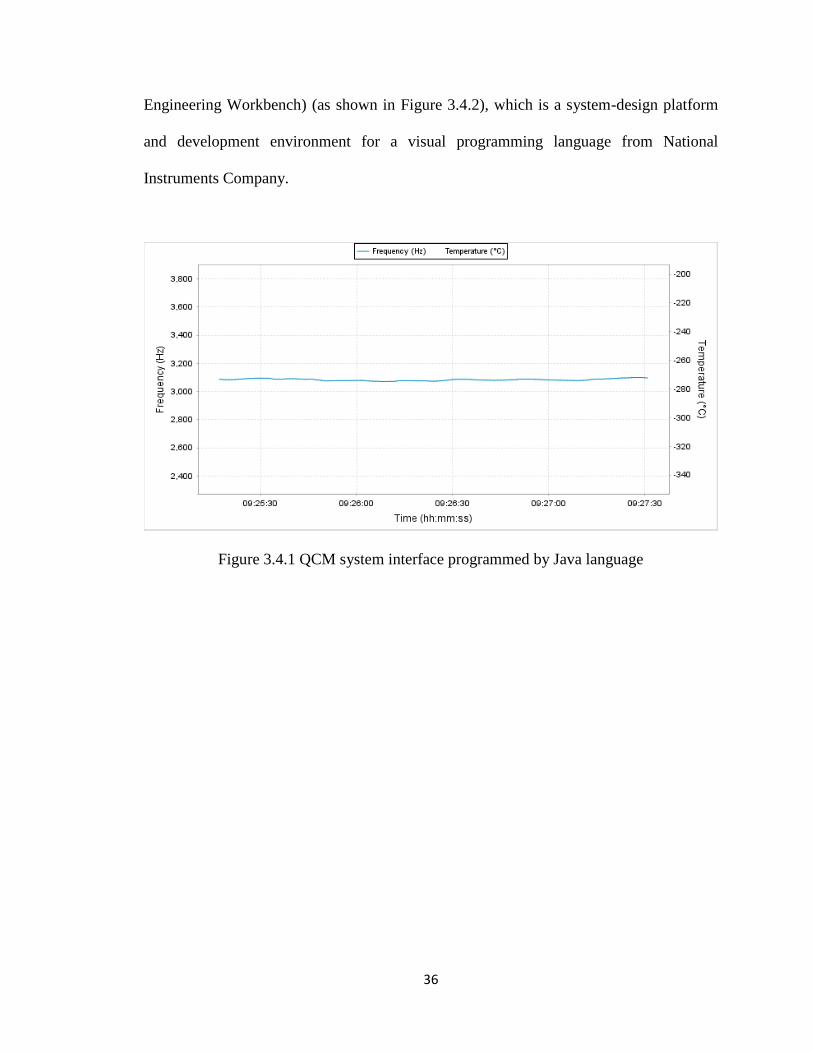
Engineering Workbench) (as shown in Figure 3.4.2), which is a system-design platform
and development environment for a visual programming language from National
Instruments Company.
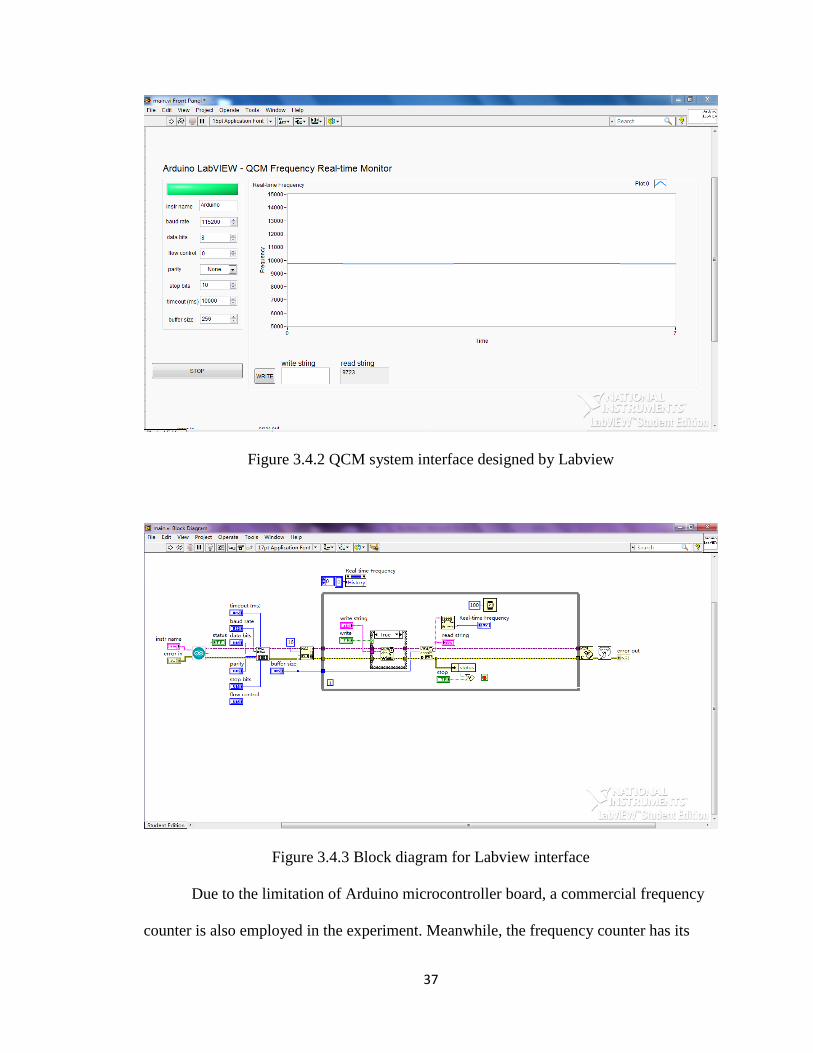
Figure 3.4.1 QCM system interface programmed by Java language
37
Figure 3.4.2 QCM system interface designed by Labview
Figure 3.4.3 Block diagram for Labview interface
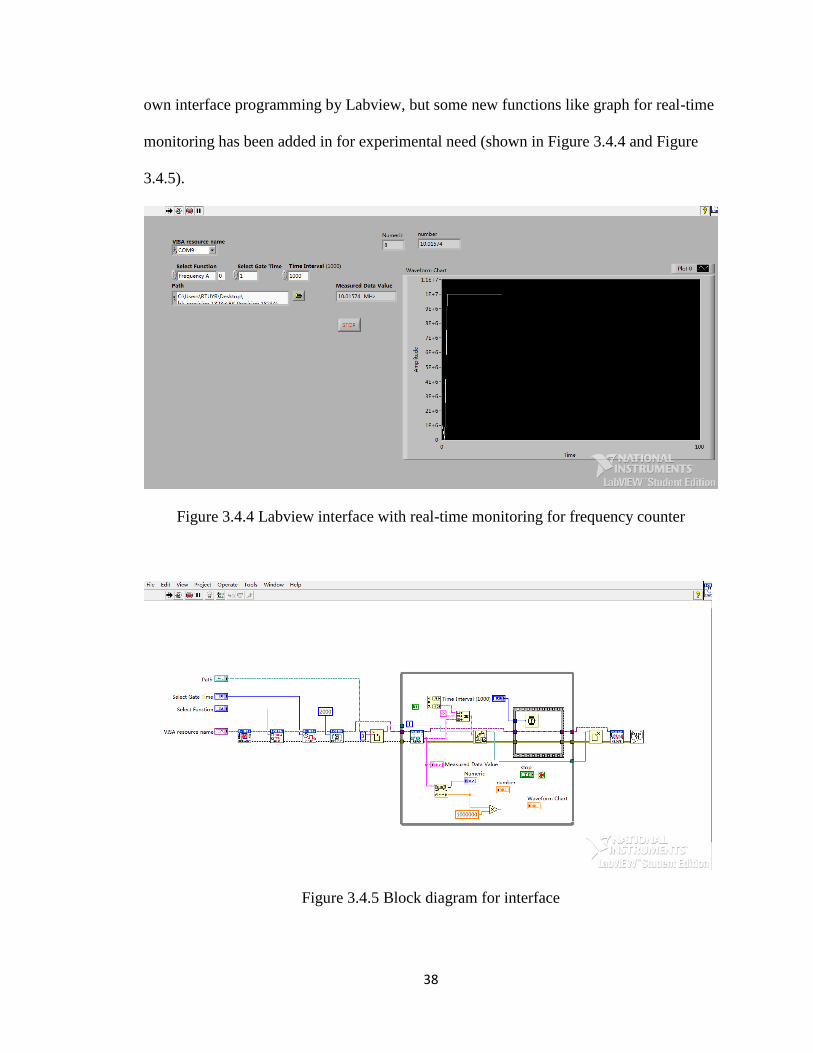
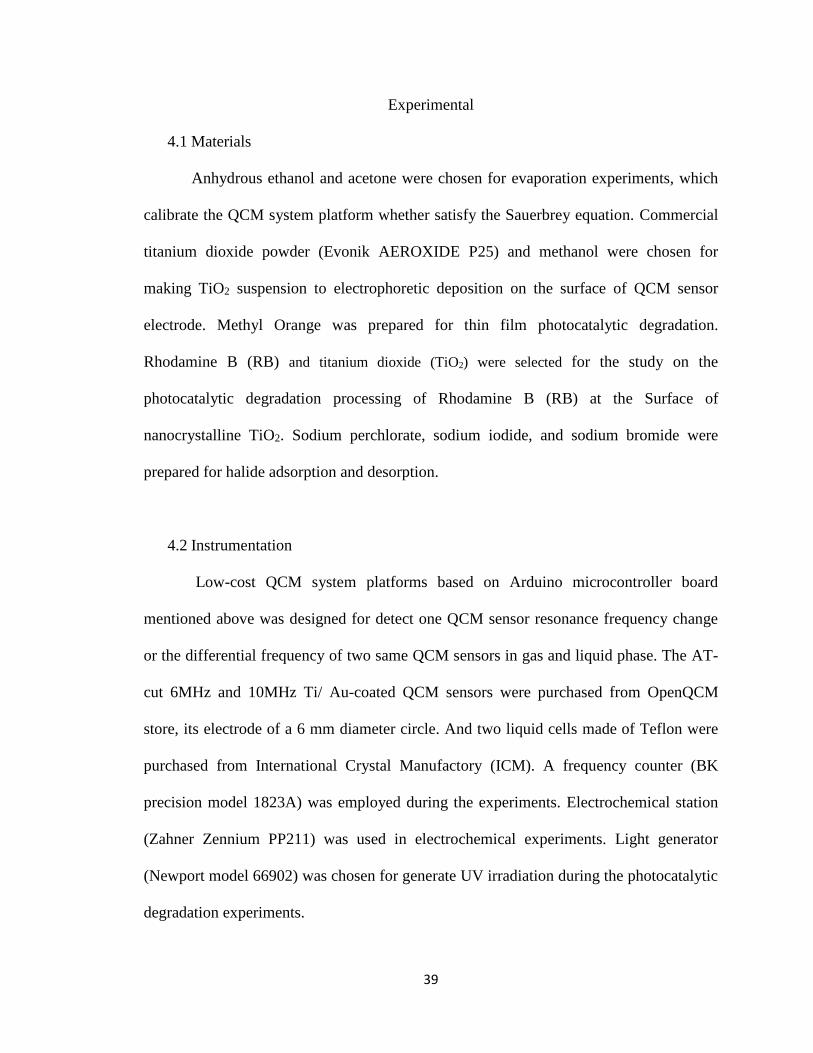
Due to the limitation of Arduino microcontroller board, a commercial frequency
counter is also employed in the experiment. Meanwhile, the frequency counter has its
38
own interface programming by Labview, but some new functions like graph for real-time
monitoring has been added in for experimental need (shown in Figure 3.4.4 and Figure
3.4.5).
Figure 3.4.4 Labview interface with real-time monitoring for frequency counter
Figure 3.4.5 Block diagram for interface
39
Experimental
4.1 Materials
Anhydrous ethanol and acetone were chosen for evaporation experiments, which
calibrate the QCM system platform whether satisfy the Sauerbrey equation. Commercial
titanium dioxide powder (Evonik AEROXIDE P25) and methanol were chosen for
making TiO2 suspension to electrophoretic deposition on the surface of QCM sensor
electrode. Methyl Orange was prepared for thin film photocatalytic degradation.
Rhodamine B (RB) and titanium dioxide (TiO2) were selected for the study on the
photocatalytic degradation processing of Rhodamine B (RB) at the Surface of
nanocrystalline TiO2. Sodium perchlorate, sodium iodide, and sodium bromide were
prepared for halide adsorption and desorption.
4.2 Instrumentation
Low-cost QCM system platforms based on Arduino microcontroller board
mentioned above was designed for detect one QCM sensor resonance frequency change
or the differential frequency of two same QCM sensors in gas and liquid phase. The AT-
cut 6MHz and 10MHz Ti/ Au-coated QCM sensors were purchased from OpenQCM
store, its electrode of a 6 mm diameter circle. And two liquid cells made of Teflon were
purchased from International Crystal Manufactory (ICM). A frequency counter (BK
precision model 1823A) was employed during the experiments. Electrochemical station
(Zahner Zennium PP211) was used in electrochemical experiments. Light generator
(Newport model 66902) was chosen for generate UV irradiation during the photocatalytic
degradation experiments.
40
4.3 Procedures
For QCM experiments, coating substrates onto the surface of QCM sensor acts an
important role in preparation phase. There are several common methods for coating QCM
sensor: 1) drop coating 2) spin coating, and 3) electrophoretic deposition. For the
evaporation experiments, drop coating as a simple and easy method has been adopted,
and for photocatalytic degradation, electrophoretic deposition is better because of its
available and efficient.
Before each experiment, QCM sensor should be rinsed by ethanol and DI water
for several times. After air drying, QCM sensors are assembled with oscillator circuit unit
one, two or three and Arduino microcontroller board or frequency counter. If the liquid
cell was used, it also should be rinsed and dried, and then put QCM sensor inside, using
four screws on its bottom to fix it.
1) Comparison of three different oscillator circuits to measure 10MHz and 6MHz
QCM sensors frequencies with or no cell.
2) TiO2 thin film formation
TiO2 powder was suspended in methanol in three 40ml beakers; three
concentrations of TiO2 were prepared in 50mg/ml, 10mg/ml, and 5mg/ml
respectively. When coating TiO2, which has a positive charge in methanol, the
electrode of QCM sensor was placed at the cathode. Samples were prepared at 1V,
5V, 10V, or 15V for 15s or 30s40. After drying in air and cleaning the extra TiO2
which were out of active area. SEM technique was employed to observe their
surface features to find the best coating condition.
41
3) Methyl orange thin film formation and photocatalysis test
Making 90 mg/L methyl orange solution, using 10uL dropper drop coat one drop
on the TiO2 thin film of QCM surface, drying in the dark. Repeat two or three
times to form methyl orange thin film. Using the 210W special white light, which
has some UV light along with it, to exposure QCM sensor combined with methyl
orange and TiO2 thin film on the electrode surface. Meanwhile, a thermistor was
adopted to measure real-time ambient temperature during the experiment.
4) Oscillator circuit unit three applied to electrochemical test
Connecting the 10MHz QCM sensor with cell to oscillator circuit unit three, it
was to measure initial frequency of QCM sensor before adding reagent solution.
The working electrode of electrochemical station and the electrode surface which
was contacted with solution are connected together to the ground of oscillator
circuit unit three. 1.0mM and 5.0mM NaI in 50mM NaClO4 and 1.0mM and
5.0mM NaBr in 50mM NaClO4 solution had been prepared for halide adsorption
and desorption experiments.
5) Test two oscillator circuit units and difference frequency of each of both
without cell
Connect and assemble the QCM system platforms following Figure 4.3.1 and
Figure 4.3.2, measuring and save the sensing QCM sensor frequency, reference
QCM sensor frequency, and difference frequency between them respectively.
Compare the result of calculated frequency of sensing and reference QCM sensor
and the result of measured difference frequency.
42
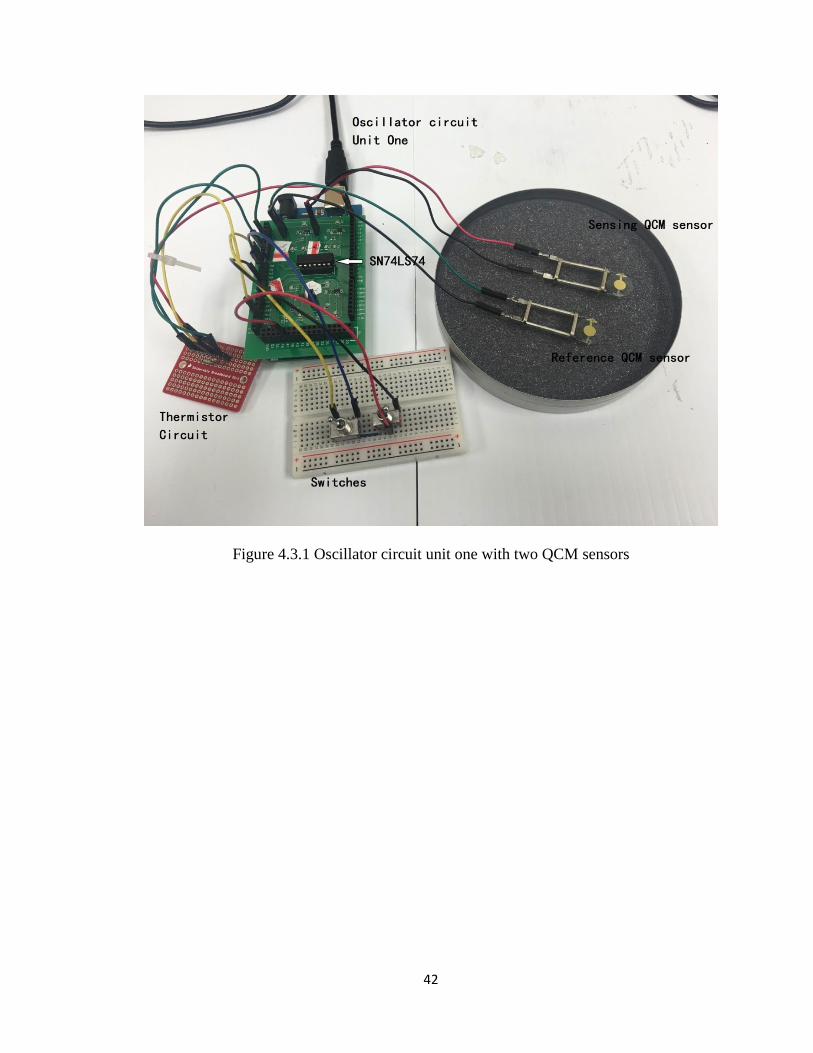
Figure 4.3.1 Oscillator circuit unit one with two QCM sensors
43
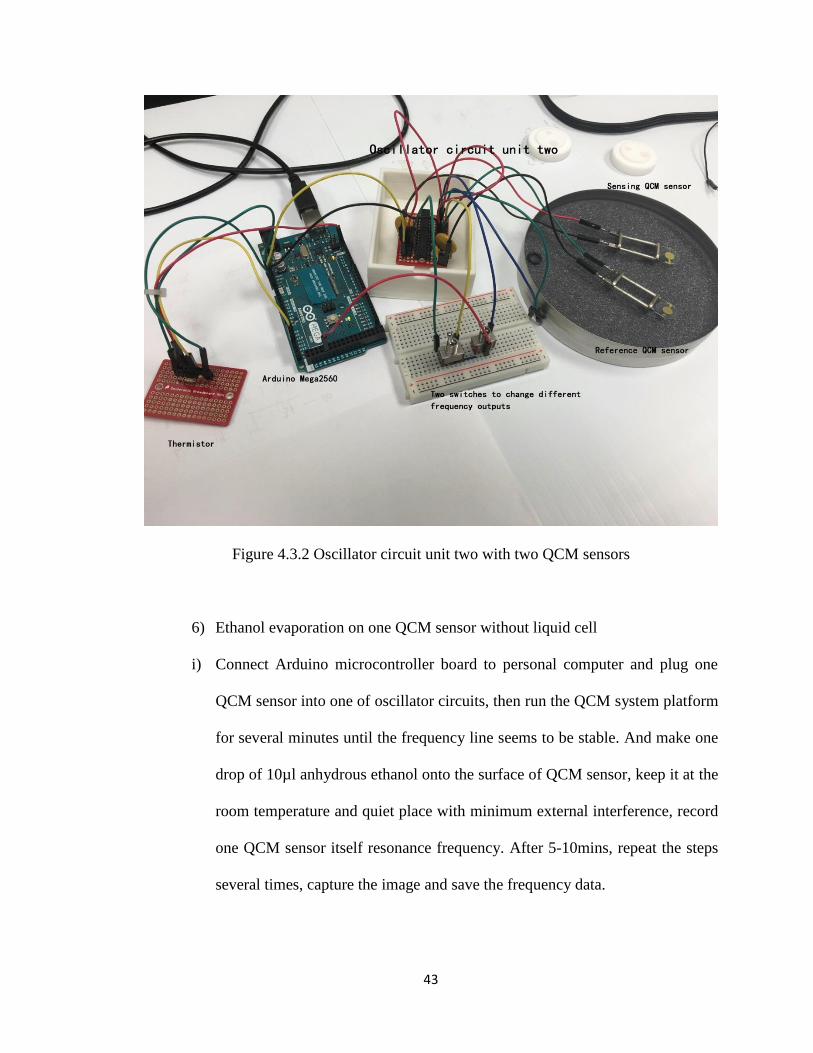
Figure 4.3.2 Oscillator circuit unit two with two QCM sensors
6) Ethanol evaporation on one QCM sensor without liquid cell
i) Connect Arduino microcontroller board to personal computer and plug one
QCM sensor into one of oscillator circuits, then run the QCM system platform
for several minutes until the frequency line seems to be stable. And make one
drop of 10µl anhydrous ethanol onto the surface of QCM sensor, keep it at the
room temperature and quiet place with minimum external interference, record
one QCM sensor itself resonance frequency. After 5-10mins, repeat the steps
several times, capture the image and save the frequency data.
44
ii) Connect Arduino microcontroller board to personal computer and plug two
QCM sensors into the left or right side of oscillator circuits, as shown in
Figure 4.3.1. Then run the QCM system platform for several time until the
frequency line seems to be stable. And make one drop of anhydrous ethanol
onto one surface of two QCM sensors, the other is as reference sensor, keep
them at the room temperature and quiet place without external interference,
record the differential resonance frequency of two QCM sensor. After 5-
10mins, repeat the steps several times, capture the image and save the
frequency data.
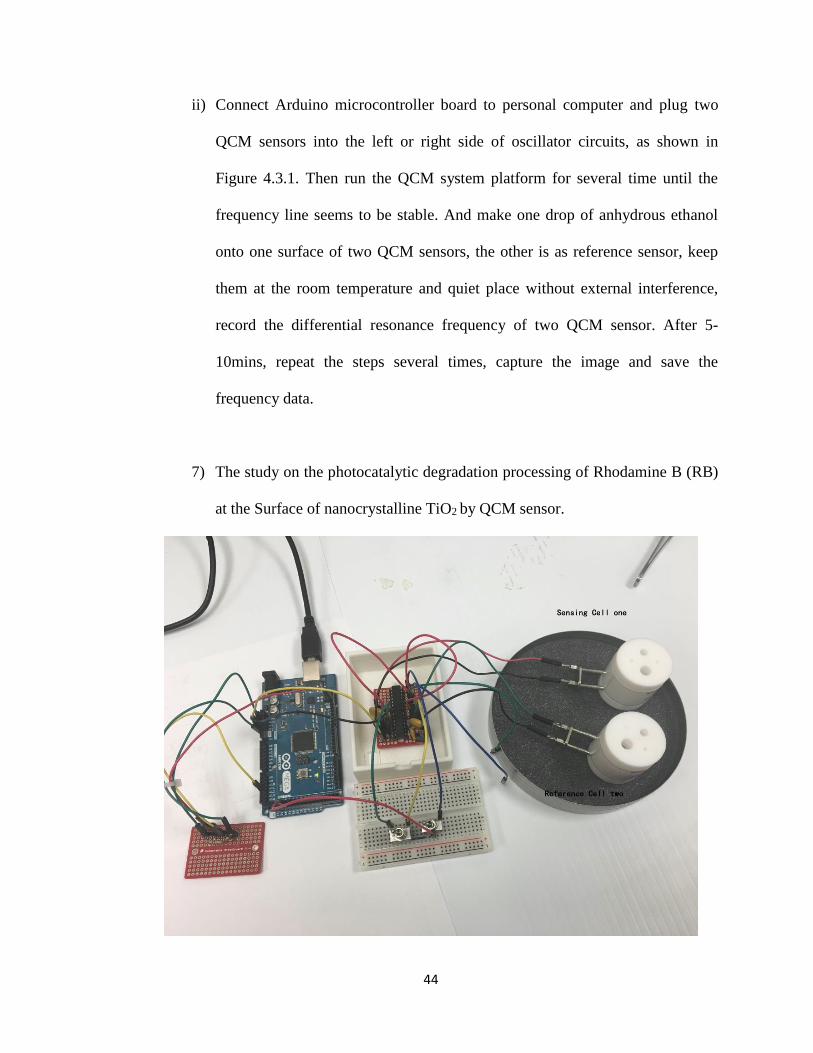
7) The study on the photocatalytic degradation processing of Rhodamine B (RB)
at the Surface of nanocrystalline TiO2 by QCM sensor.
45
Figure 4.3.3 photocatalytic degradation processing of Rhodamine B (RB) at the Surface
of nanocrystalline TiO2
After cleaning the electrode surface by anhydrous ethanol and DI water, QCM
sensor is fixed in the cell. TiO2 nano-film is made by drop-coating method, and
then put the cell into drying box. After 5 minutes, take the cell out of drying box
and connect to the QCM system platform, measuring the frequency of QCM
sensor with TiO2 nano-film until the frequency reach a stable range. Thus, 2 ml of
Rhodamine B is injected into the cell, and move the cell under the natural light for
several hours. Frequency data are acquired continuously and saved. In order to
detect that graphene can affect the speed of photocatalysis of Rhodamine B and
TiO2, graphene is added to TiO2 solution and form TiO2-GP mixed solution. And
following steps are the same as ones above.
Result and discussion
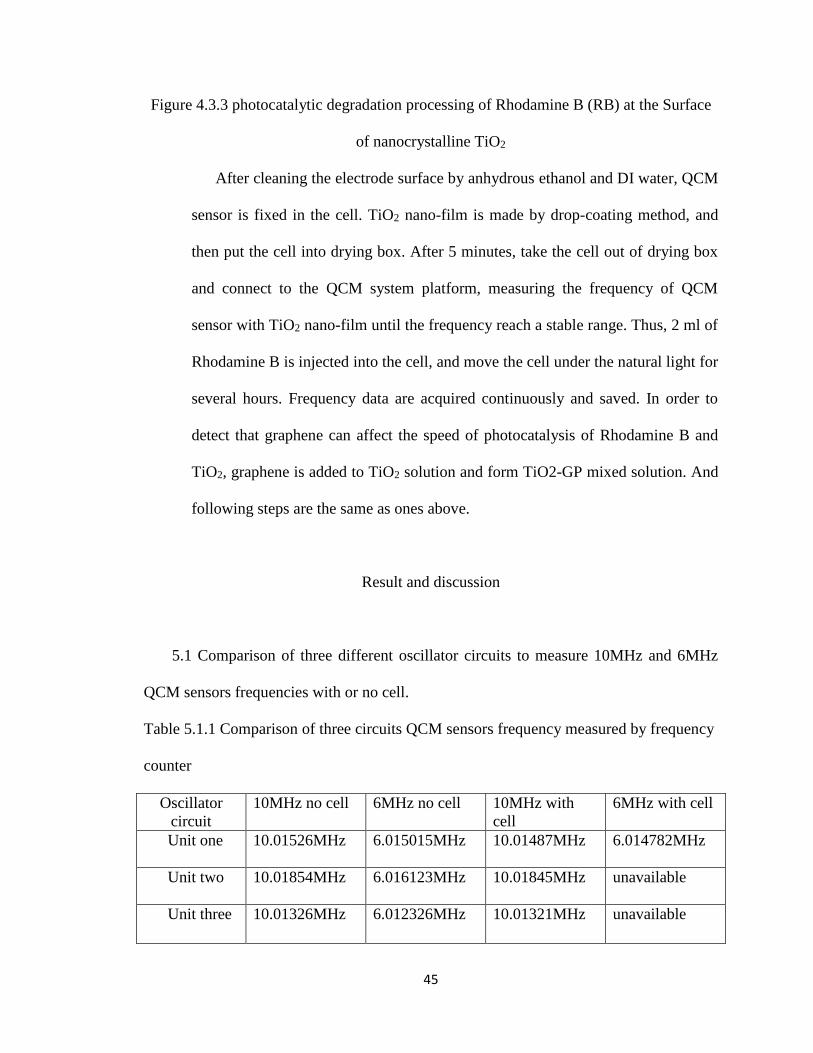
5.1 Comparison of three different oscillator circuits to measure 10MHz and 6MHz
QCM sensors frequencies with or no cell.
Table 5.1.1 Comparison of three circuits QCM sensors frequency measured by frequency
counter
Oscillator
circuit
10MHz no cell 6MHz no cell 10MHz with
cell
6MHz with cell
Unit one 10.01526MHz 6.015015MHz 10.01487MHz 6.014782MHz
Unit two 10.01854MHz 6.016123MHz 10.01845MHz unavailable
Unit three 10.01326MHz 6.012326MHz 10.01321MHz unavailable
46
From Table 5.1.1, 10MHz QCM sensor’s frequency was stable with or without
cell, but 6MHz QCM sensor’s frequency was stable without cell and only stable will cell
in oscillator circuit unit one.
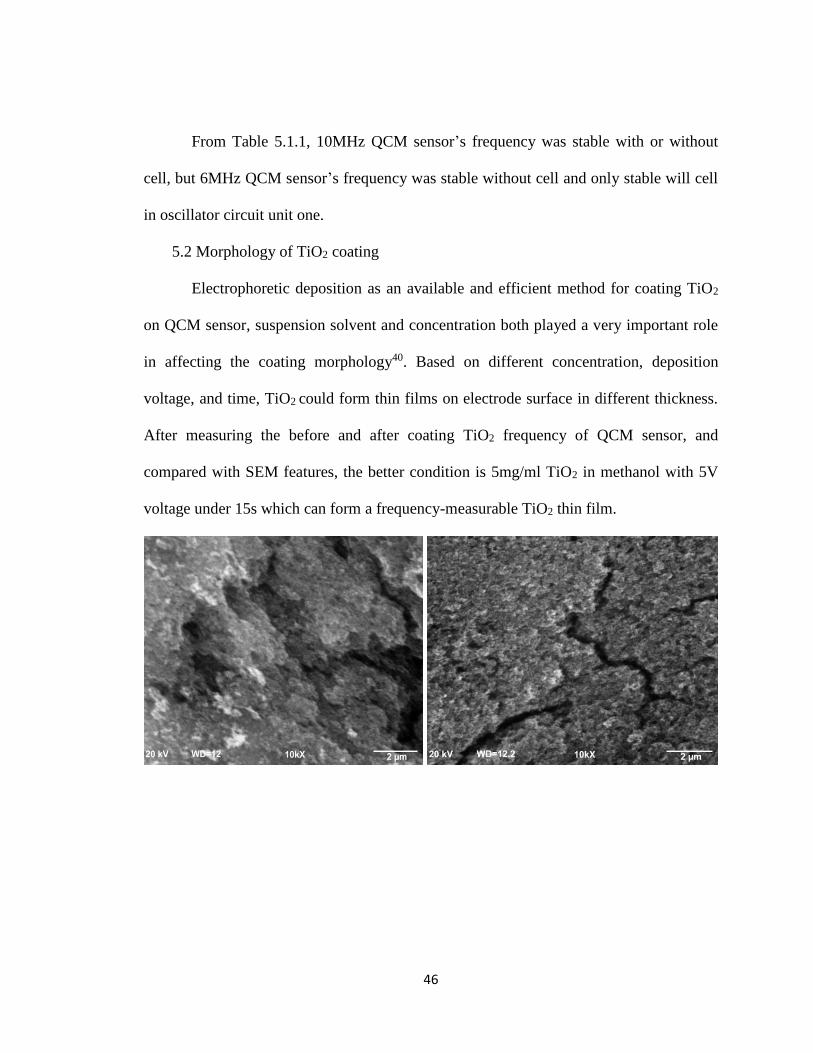
5.2 Morphology of TiO2 coating
Electrophoretic deposition as an available and efficient method for coating TiO2
on QCM sensor, suspension solvent and concentration both played a very important role
in affecting the coating morphology40. Based on different concentration, deposition
voltage, and time, TiO2 could form thin films on electrode surface in different thickness.
After measuring the before and after coating TiO2 frequency of QCM sensor, and
compared with SEM features, the better condition is 5mg/ml TiO2 in methanol with 5V
voltage under 15s which can form a frequency-measurable TiO2 thin film.
47
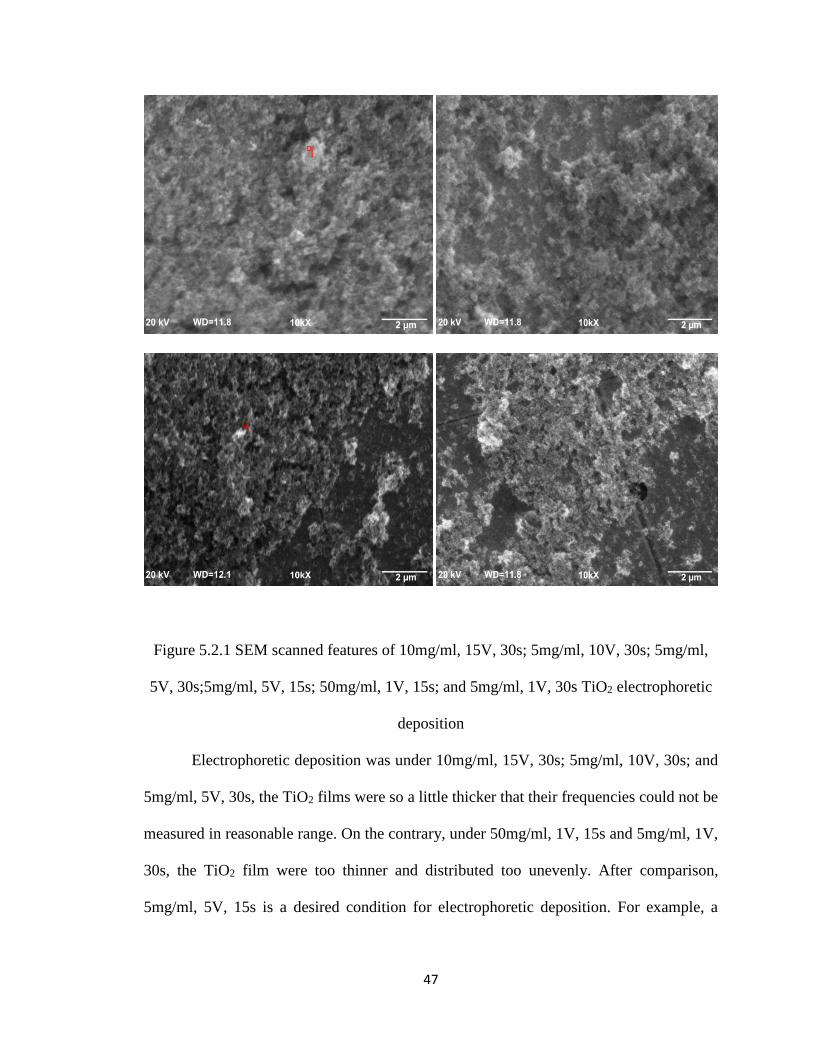
Figure 5.2.1 SEM scanned features of 10mg/ml, 15V, 30s; 5mg/ml, 10V, 30s; 5mg/ml,
5V, 30s;5mg/ml, 5V, 15s; 50mg/ml, 1V, 15s; and 5mg/ml, 1V, 30s TiO2 electrophoretic
deposition
Electrophoretic deposition was under 10mg/ml, 15V, 30s; 5mg/ml, 10V, 30s; and
5mg/ml, 5V, 30s, the TiO2 films were so a little thicker that their frequencies could not be
measured in reasonable range. On the contrary, under 50mg/ml, 1V, 15s and 5mg/ml, 1V,
30s, the TiO2 film were too thinner and distributed too unevenly. After comparison,
5mg/ml, 5V, 15s is a desired condition for electrophoretic deposition. For example, a
48
6MHz and a 10MHz QCM sensor were coated TiO2 under 5mg/ml, 5V, 15s condition (as
shown Table 5.2.1).
Table 5.2.1 Comparison of 6MHz and 10MHz QCM sensor coating TiO2 film
0f f m
6.011813MHz 7205Hz 24.497ug/cm2
10.01543MHz 19186Hz 23.791ug/cm2
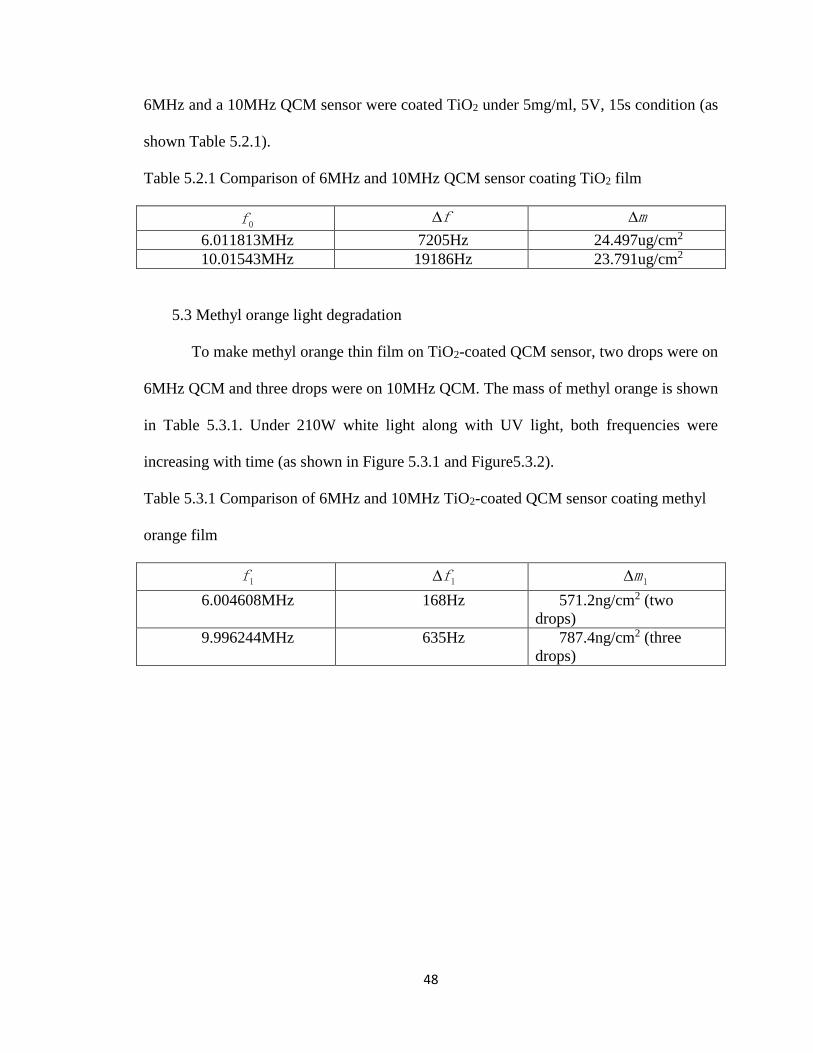
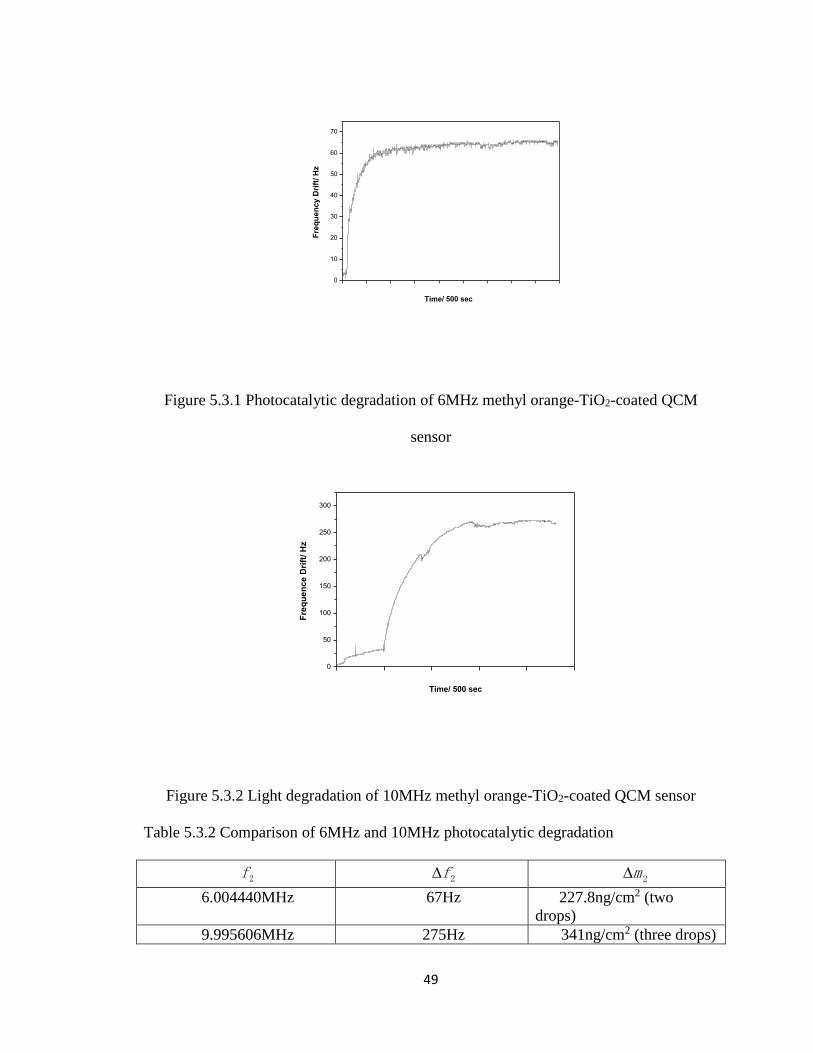
5.3 Methyl orange light degradation
To make methyl orange thin film on TiO2-coated QCM sensor, two drops were on
6MHz QCM and three drops were on 10MHz QCM. The mass of methyl orange is shown
in Table 5.3.1. Under 210W white light along with UV light, both frequencies were
increasing with time (as shown in Figure 5.3.1 and Figure5.3.2).
Table 5.3.1 Comparison of 6MHz and 10MHz TiO2-coated QCM sensor coating methyl
orange film
1f 1f 1m
6.004608MHz 168Hz 571.2ng/cm2 (two
drops)
9.996244MHz 635Hz 787.4ng/cm2 (three
drops)
49
0
10
20
30
40
50
60
70
Fre
qu
en
cy
Dri
ft/ H
z
Time/ 500 sec
Figure 5.3.1 Photocatalytic degradation of 6MHz methyl orange-TiO2-coated QCM
sensor
0
50
100
150
200
250
300
Fre
qu
en
ce
Dri
ft/ H
z
Time/ 500 sec
Figure 5.3.2 Light degradation of 10MHz methyl orange-TiO2-coated QCM sensor
Table 5.3.2 Comparison of 6MHz and 10MHz photocatalytic degradation
2f 2f 2m
6.004440MHz 67Hz 227.8ng/cm2 (two
drops)
9.995606MHz 275Hz 341ng/cm2 (three drops)
50
For 90mg/l methyl orange solution, 10ul dropper could make around 3 drops,
after calculation, the masses of methyl orange before photocatalytic degradation were
close to the value measured by QCM system. But after photocatalytic degradation, the
masses of methyl orange were smaller than the ones calculated before. One assumption
was that after photocatalytic degradation, some degradation productions of methyl orange
were left on the TiO2 – coated QCM sensor surface due to frequencies not increasing to
the initial values. For instance, molecule of methyl orange had –SO3H, under the
photocatalyst, it turned to SO42- which was left on the QCM sensor, and other elements
(N, C, H, etc.) were gone in gas state.
5.4 Oscillator circuit unit three applied to electrochemical test
Using oscillator circuit unit three, measure 10MHz QCM sensor initial frequency
with cell, which has been mention in 5.1. Because of complexity of liquid phase in QCM
application, the measured frequencies were too much unstable and swift changed up and
down in several thousand Hz after injecting the reagent solutions. Even though
unexpected drift exist, the trend of frequency was in right direction. However, it
extremely influenced the precision of measurement. There was a big challenge to figure
out QCM sensor stably vibrating in liquid phase. Fortunately, when the oscillator circuit
unit one connected to electrochemical station, they did not affect their functions each
other. Therefore, more efforts need to do to improve oscillator circuit function to
overcome the problems in QCM liquid applications.
5.5 Test two oscillator circuit units and difference frequency of each of both without
cell
51
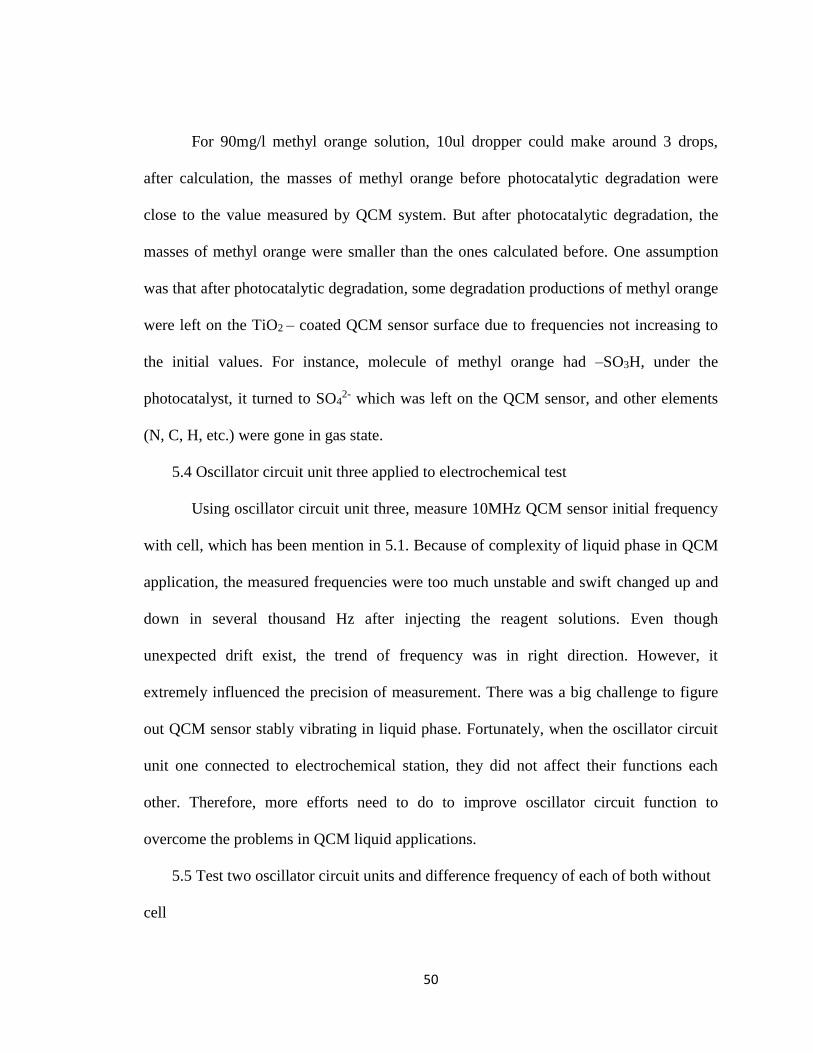
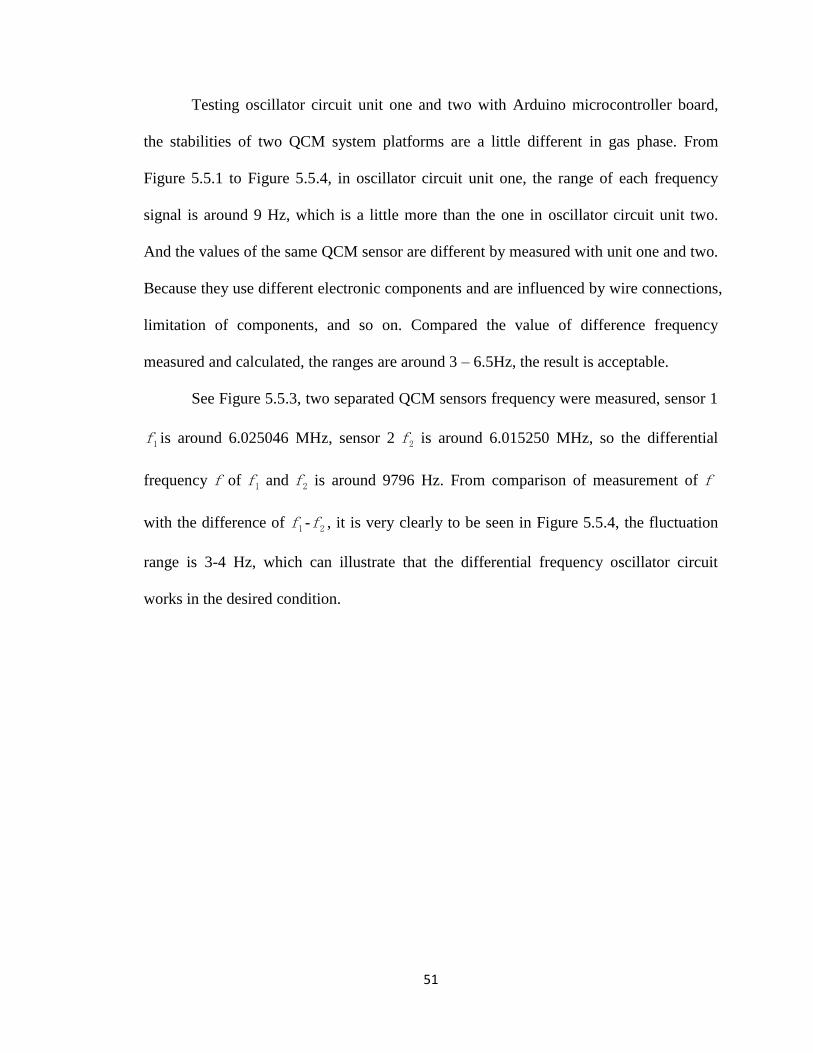
Testing oscillator circuit unit one and two with Arduino microcontroller board,
the stabilities of two QCM system platforms are a little different in gas phase. From
Figure 5.5.1 to Figure 5.5.4, in oscillator circuit unit one, the range of each frequency
signal is around 9 Hz, which is a little more than the one in oscillator circuit unit two.
And the values of the same QCM sensor are different by measured with unit one and two.
Because they use different electronic components and are influenced by wire connections,
limitation of components, and so on. Compared the value of difference frequency
measured and calculated, the ranges are around 3 – 6.5Hz, the result is acceptable.
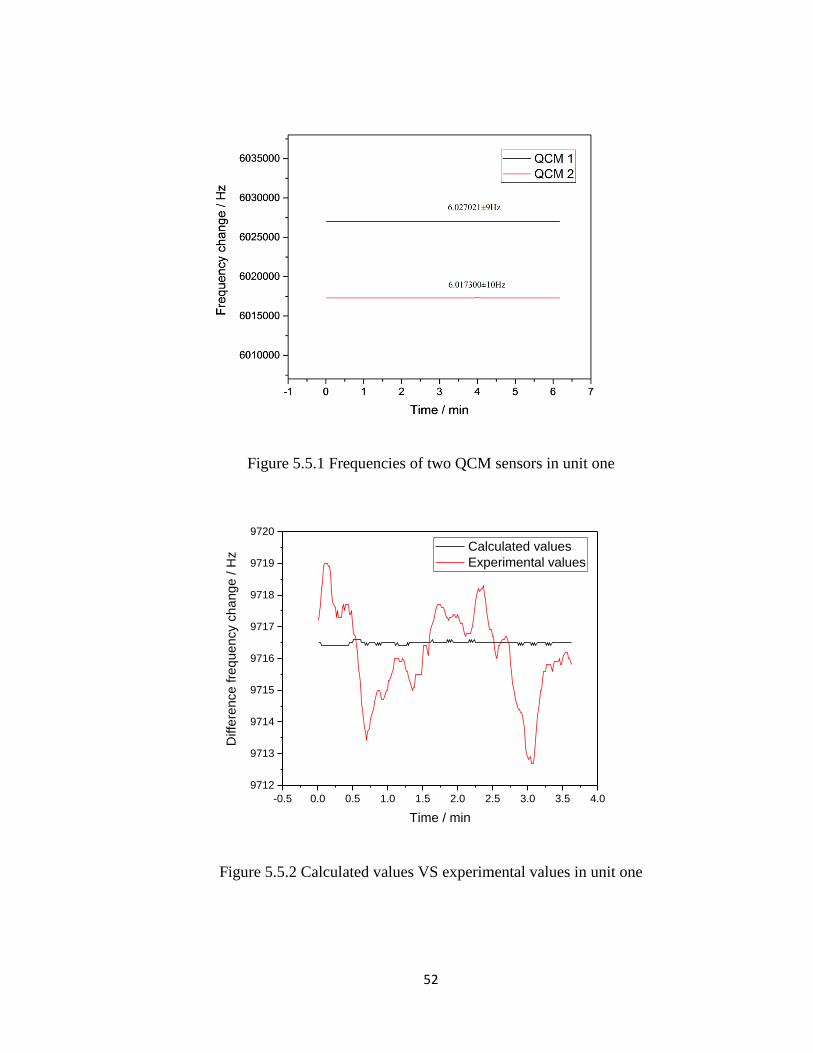
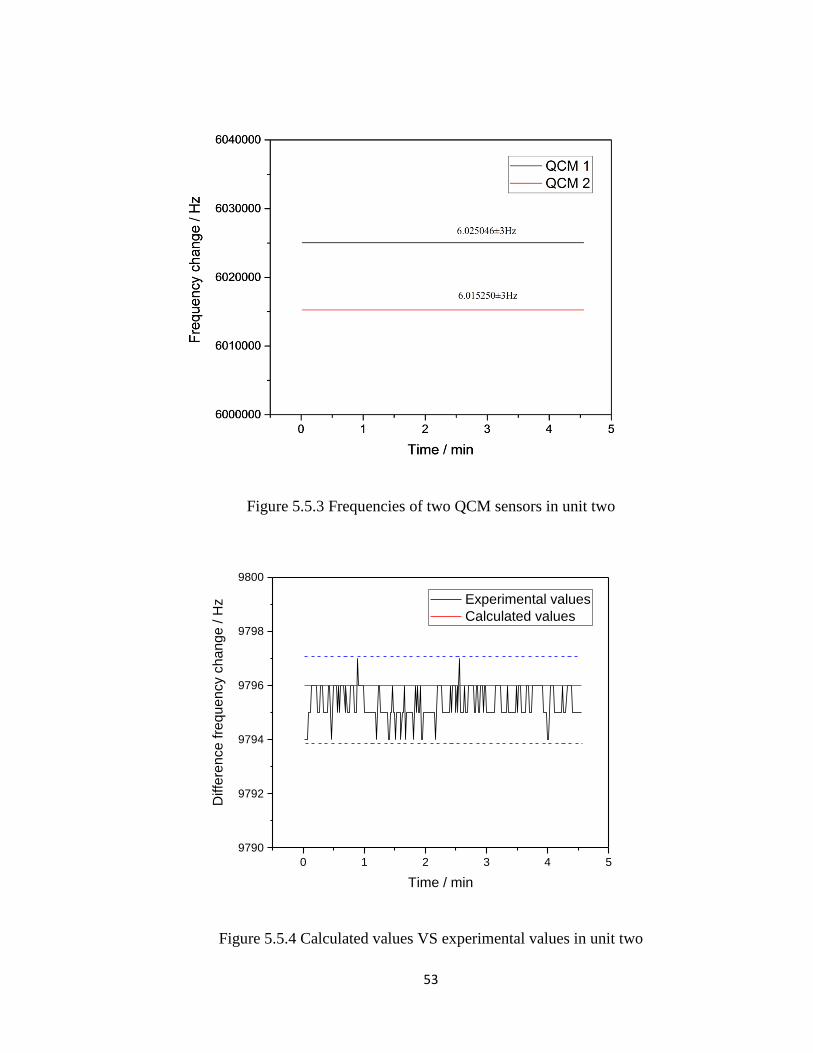
See Figure 5.5.3, two separated QCM sensors frequency were measured, sensor 1
1f is around 6.025046 MHz, sensor 2 2f is around 6.015250 MHz, so the differential
frequency f of 1f and 2f is around 9796 Hz. From comparison of measurement of f
with the difference of 1f - 2f , it is very clearly to be seen in Figure 5.5.4, the fluctuation
range is 3-4 Hz, which can illustrate that the differential frequency oscillator circuit
works in the desired condition.
52
Figure 5.5.1 Frequencies of two QCM sensors in unit one
Figure 5.5.2 Calculated values VS experimental values in unit one
-0.5 0.0 0.5 1.0 1.5 2.0 2.5 3.0 3.5 4.0
9712
9713
9714
9715
9716
9717
9718
9719
9720
Diffe
ren
ce
fre
qu
en
cy c
ha
ng
e / H
z
Time / min
Calculated values
Experimental values
53
Figure 5.5.3 Frequencies of two QCM sensors in unit two
Figure 5.5.4 Calculated values VS experimental values in unit two
0 1 2 3 4 5
9790
9792
9794
9796
9798
9800
Diffe
ren
ce
fre
qu
en
cy c
ha
ng
e / H
z
Time / min
Experimental values
Calculated values
54
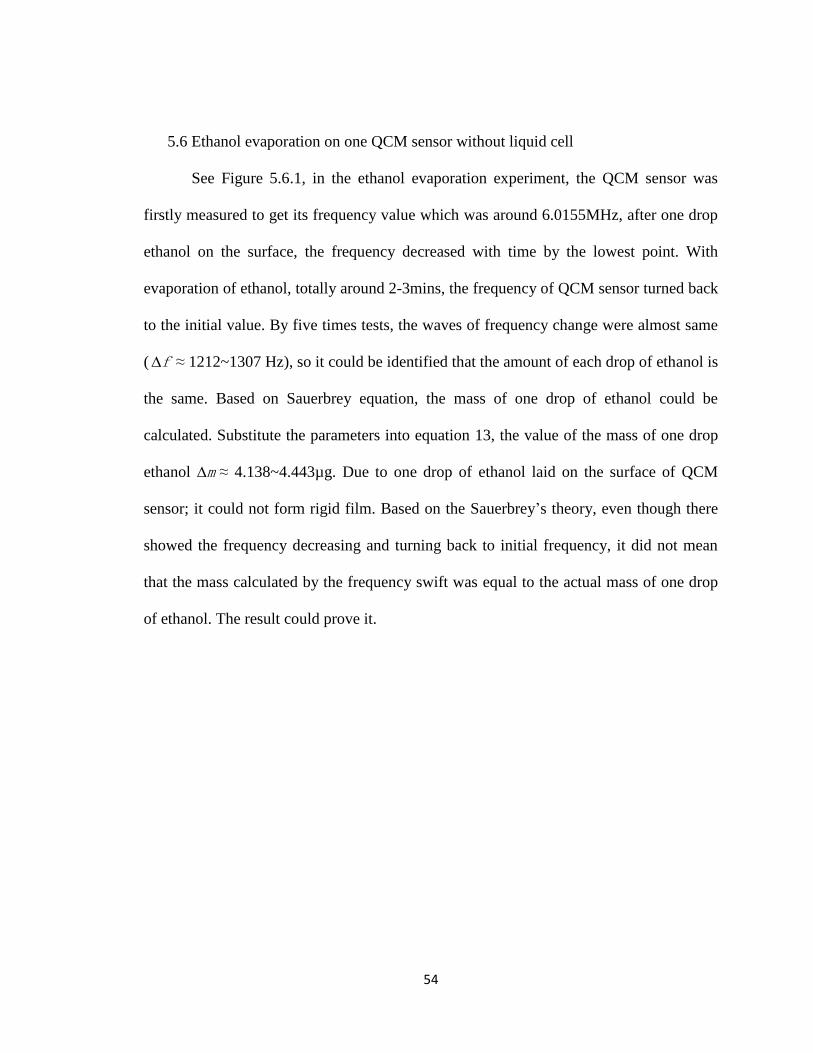
5.6 Ethanol evaporation on one QCM sensor without liquid cell
See Figure 5.6.1, in the ethanol evaporation experiment, the QCM sensor was
firstly measured to get its frequency value which was around 6.0155MHz, after one drop
ethanol on the surface, the frequency decreased with time by the lowest point. With
evaporation of ethanol, totally around 2-3mins, the frequency of QCM sensor turned back
to the initial value. By five times tests, the waves of frequency change were almost same
( f ≈ 1212~1307 Hz), so it could be identified that the amount of each drop of ethanol is
the same. Based on Sauerbrey equation, the mass of one drop of ethanol could be
calculated. Substitute the parameters into equation 13, the value of the mass of one drop
ethanol m ≈ 4.138~4.443µg. Due to one drop of ethanol laid on the surface of QCM
sensor; it could not form rigid film. Based on the Sauerbrey’s theory, even though there
showed the frequency decreasing and turning back to initial frequency, it did not mean
that the mass calculated by the frequency swift was equal to the actual mass of one drop
of ethanol. The result could prove it.
55
Figure 5.6.1 Ethanol evaporation on one QCM sensor without liquid cell
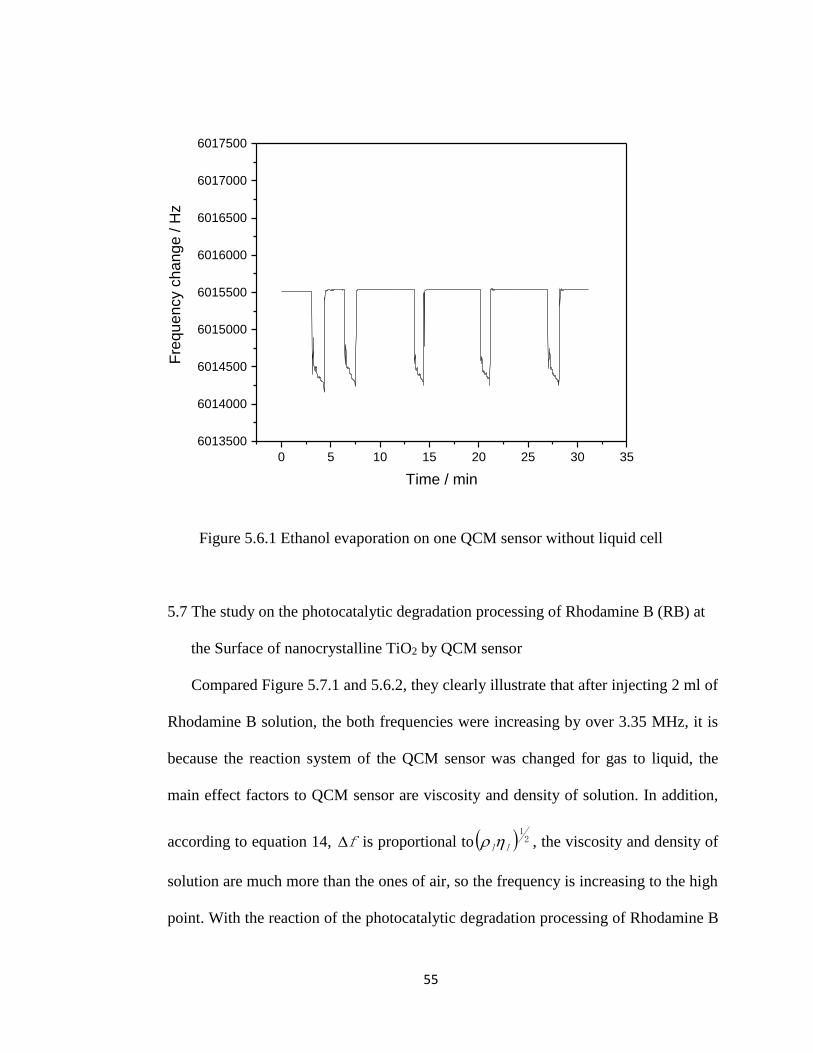
5.7 The study on the photocatalytic degradation processing of Rhodamine B (RB) at
the Surface of nanocrystalline TiO2 by QCM sensor
Compared Figure 5.7.1 and 5.6.2, they clearly illustrate that after injecting 2 ml of
Rhodamine B solution, the both frequencies were increasing by over 3.35 MHz, it is
because the reaction system of the QCM sensor was changed for gas to liquid, the
main effect factors to QCM sensor are viscosity and density of solution. In addition,
according to equation 14, f is proportional to 21
ll , the viscosity and density of
solution are much more than the ones of air, so the frequency is increasing to the high
point. With the reaction of the photocatalytic degradation processing of Rhodamine B
0 5 10 15 20 25 30 35
6013500
6014000
6014500
6015000
6015500
6016000
6016500
6017000
6017500
Fre
qu
en
cy c
ha
ng
e / H
z
Time / min
56
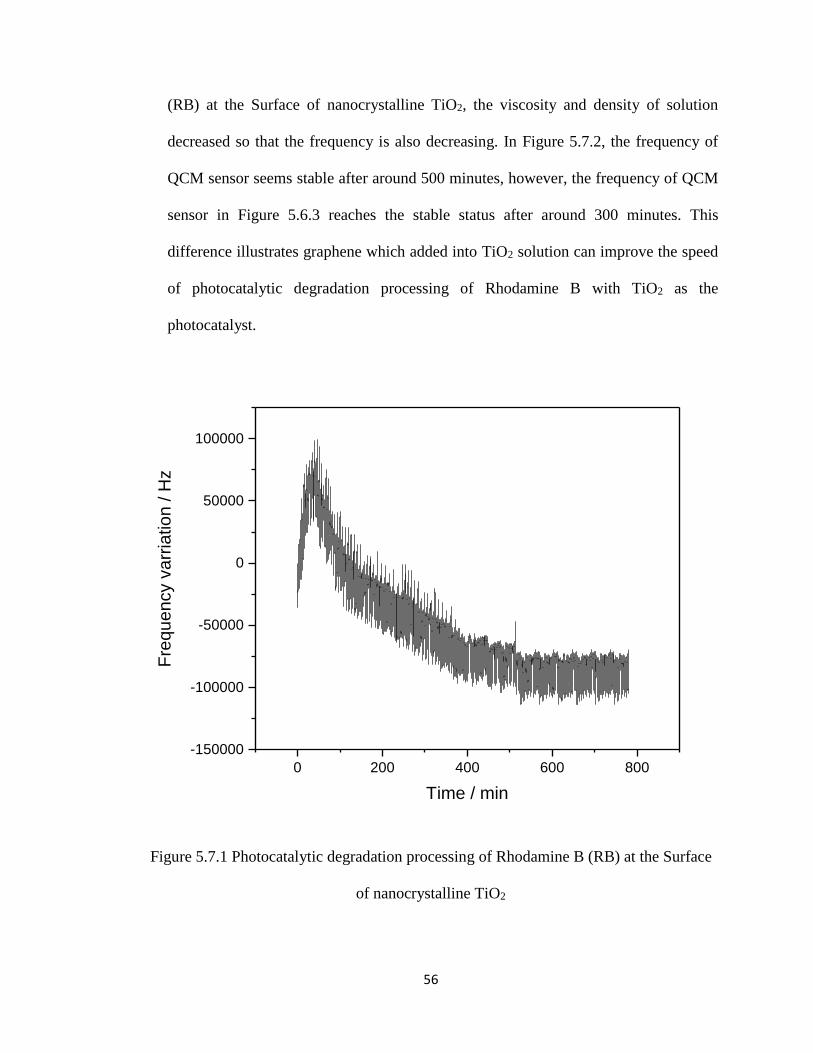
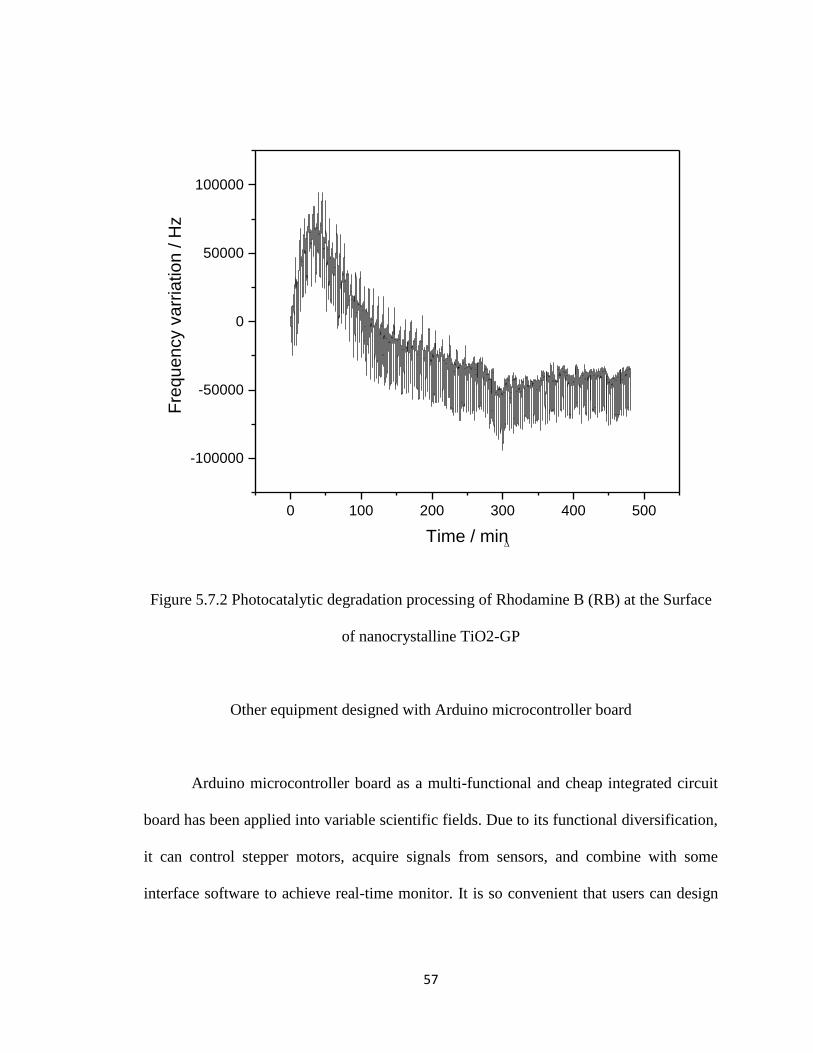
(RB) at the Surface of nanocrystalline TiO2, the viscosity and density of solution
decreased so that the frequency is also decreasing. In Figure 5.7.2, the frequency of
QCM sensor seems stable after around 500 minutes, however, the frequency of QCM
sensor in Figure 5.6.3 reaches the stable status after around 300 minutes. This
difference illustrates graphene which added into TiO2 solution can improve the speed
of photocatalytic degradation processing of Rhodamine B with TiO2 as the
photocatalyst.
Figure 5.7.1 Photocatalytic degradation processing of Rhodamine B (RB) at the Surface
of nanocrystalline TiO2
0 200 400 600 800
-150000
-100000
-50000
0
50000
100000
Fre
qu
en
cy v
arr
iatio
n / H
z
Time / min
57
Figure 5.7.2 Photocatalytic degradation processing of Rhodamine B (RB) at the Surface
of nanocrystalline TiO2-GP
Other equipment designed with Arduino microcontroller board
Arduino microcontroller board as a multi-functional and cheap integrated circuit
board has been applied into variable scientific fields. Due to its functional diversification,
it can control stepper motors, acquire signals from sensors, and combine with some
interface software to achieve real-time monitor. It is so convenient that users can design
0 100 200 300 400 500
-100000
-50000
0
50000
100000F
req
ue
ncy v
arr
iatio
n / H
z
Time / minΔ
58
their own devices by programming for Arduino microcontroller board. The following
systems are designed with Arduino boards.
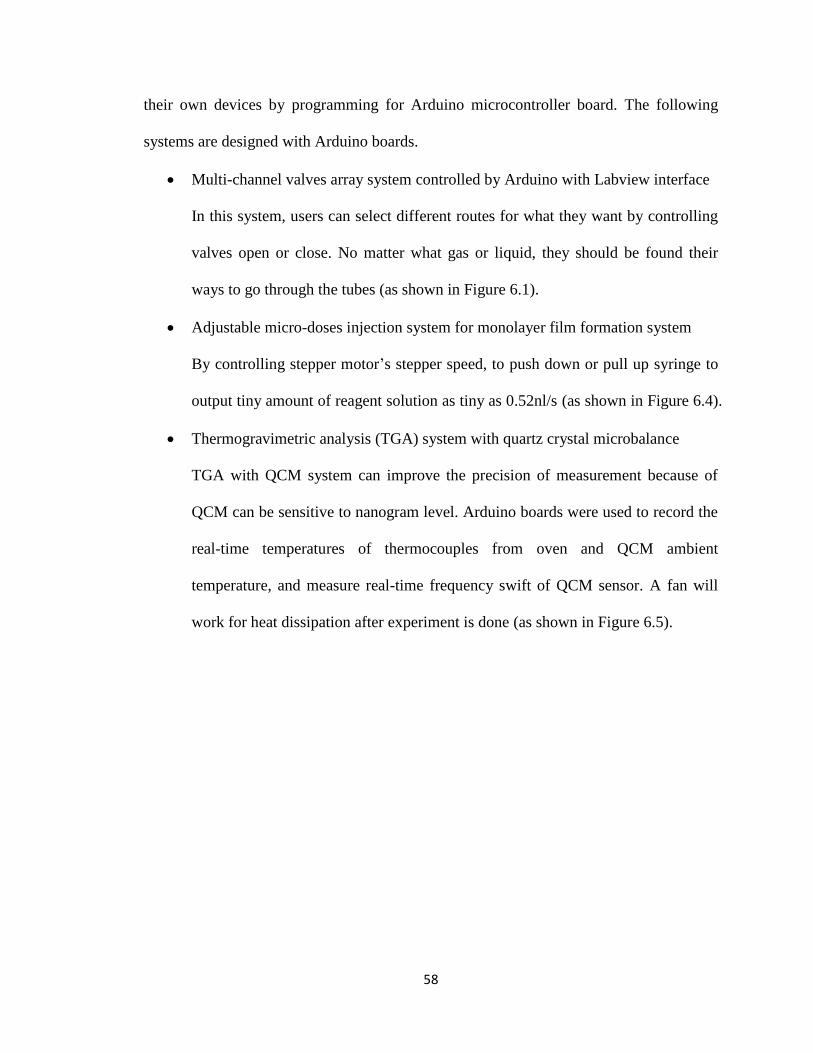
Multi-channel valves array system controlled by Arduino with Labview interface
In this system, users can select different routes for what they want by controlling
valves open or close. No matter what gas or liquid, they should be found their
ways to go through the tubes (as shown in Figure 6.1).
Adjustable micro-doses injection system for monolayer film formation system
By controlling stepper motor’s stepper speed, to push down or pull up syringe to
output tiny amount of reagent solution as tiny as 0.52nl/s (as shown in Figure 6.4).
Thermogravimetric analysis (TGA) system with quartz crystal microbalance
TGA with QCM system can improve the precision of measurement because of
QCM can be sensitive to nanogram level. Arduino boards were used to record the
real-time temperatures of thermocouples from oven and QCM ambient
temperature, and measure real-time frequency swift of QCM sensor. A fan will
work for heat dissipation after experiment is done (as shown in Figure 6.5).
59
Figure 6.1 Multi-channel valves array system
60
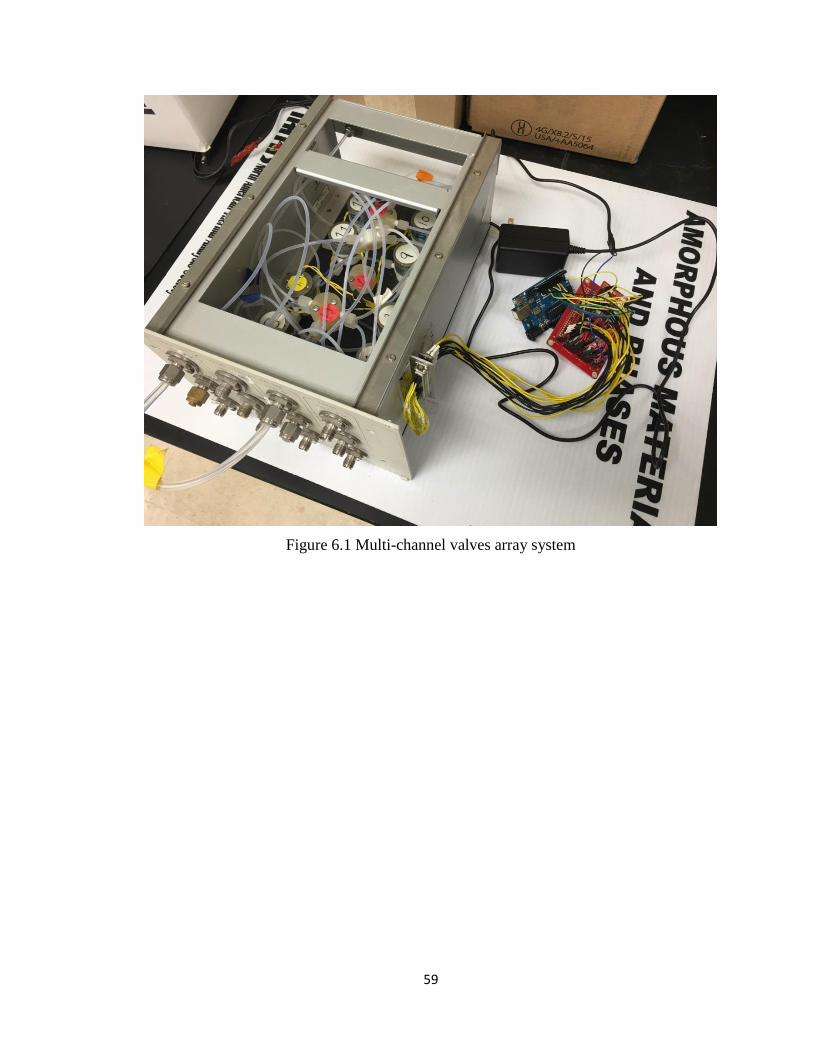
Figure 6.2 Logic diagram for multi-channel valves array system
61
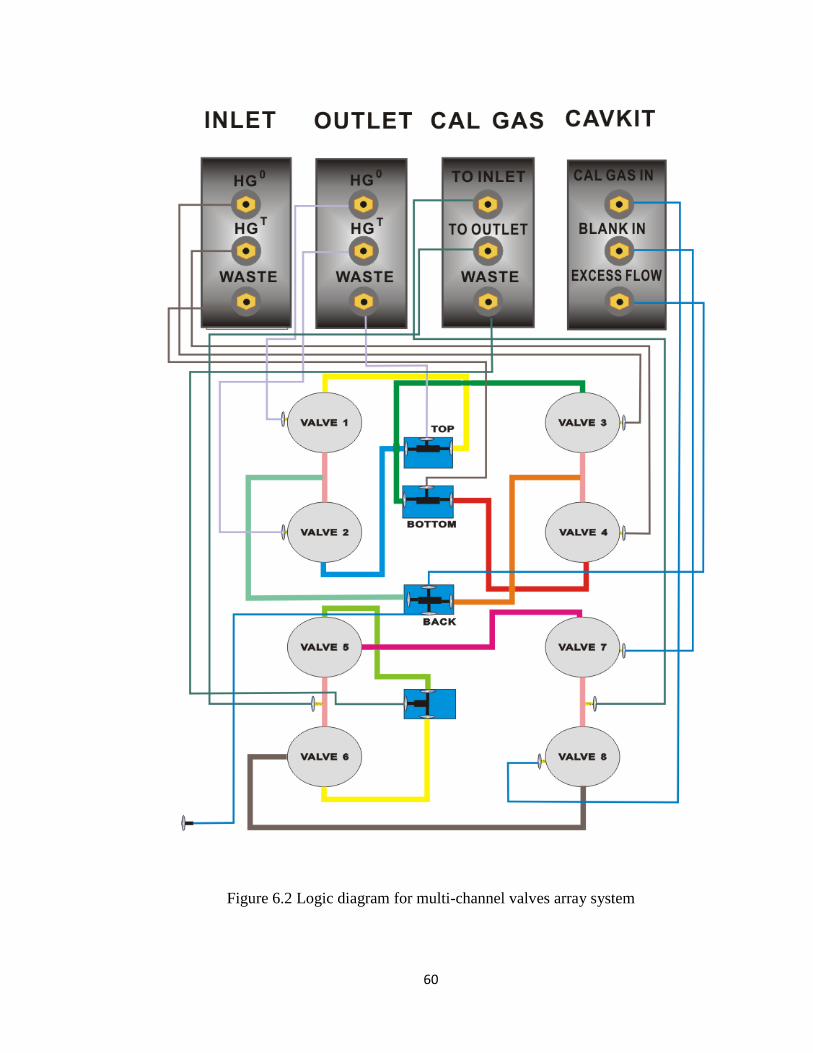
Figure 6.3 Labview interface for Multi-channel valves array system
62
Figure 6.4 Adjustable micro-doses injection system for monolayer film formation system
63
Figure 6.5 Thermogravimetric analysis system with quartz crystal microbalance
Conclusion
Quartz crystal microbalance sensor has excellent advantages of high sensitivity
coefficient, measuring tiny mass change in nanogram level, and relative physical and
mechanical properties. QCM sensor can detect micro-world change because it works
based on the sensitive film on the surface as sensitive component, the AT-cut quartz
crystal as transducer component, according to the change relationship between mass and
frequency, the tiny mass signal can be transduced to frequency signal. Depended on
QCM sensor properties, this article mainly states that low-cost QCM system platforms
64
are designed with Arduino microcontroller board, three simple-construction, low-cost
difference frequency oscillator circuit units were designed and used some simple and
representative experiments to detect how the platforms preform. For the coating methods,
electrophoretic deposition was much better that drop coating. Methyl orange light
degradation with TiO2 worked successfully matching Sauerbrey’s theory and equation,
which had proved that the QCM systems could come to use in gas phase. However, due
to extreme frequency drift in liquid phase, QCM system for liquid application should be
improved and enhanced. It needs to be more explored. Two setup platforms which were
working for gas phase and liquid phase exist its own weaknesses, which need to
continuously improved and enhanced, like stability and sensitivity of oscillator circuits,
reducing the effect factors of temperature, viscosity and density of liquid. The oscillator
circuit should be added more functional components, like filter, inductor, amplifier, and
so on, to work in gas and liquid phase better.
65
APPENDIX A: OSCILLATOR CIRCUIT SCHEMATIC DIAGRAM
66
APPENDIX B: OSCILLATOR CIRCUIT PCB BOARD SCHEMATIC DIAGRAM
67
APPENDIX
APPENDIX A: OSCILLATOR CIRCUIT SCHEMATIC DIAGRAM…………...…….65
APPENDIX B: OSCILLATOR CIRCUIT PCB BOARD SCHEMATIC DIAGRAM…66
68
LITERATURE CITED
1. Curie, J.; Curie, P., Développement, par pression, de l’électricité polaire dans les
cristaux hémièdres à faces inclinées. Comptes Rendus 1880, 91, 294-295.
2. Gautschi, D.-I. E. G., Piezoelectric sensors. Springer: 2002.
3. Sauerbrey, G., Verwendung von Schwingquarzen zur Wägung dünner Schichten
und zur Mikrowägung. Zeitschrift für physik 1959, 155 (2), 206-222.
4. King Jr, W. H., Piezoelectric Sorption Detector. Analytical Chemistry 1964, 36
(9), 1735-1739.
5. (a) Alder, J. F.; McCallum, J. J., Piezoelectric crystals for mass and chemical
measurements. A review. Analyst 1983, 108 (1291), 1169-1189; (b) McCallum, J. J.,
Piezoelectric devices for mass and chemical measurements: an update. A review. Analyst
1989, 114 (10), 1173-1189.
6. Guilbault, G. G., Determination of formaldehyde with an enzyme-coated
piezoelectric crystal detector. Analytical Chemistry 1983, 55 (11), 1682-1684.
7. Ngeh-Ngwainbi, J.; Foley, P.; Kuan, S. S.; Guilbault, G., Parathion antibodies on
piezoelectric crystals. Journal of the American Chemical Society 1986, 108 (18), 5444-
5447.
8. Shons, A.; Dorman, F.; Najarian, J., An immunospecific microbalance. Journal of
biomedical materials research 1972, 6 (6), 565-570.
9. Plomer, M.; Guilbault, G. G.; Hock, B., Development of a piezoelectric
immunosensor for the detection of enterobacteria. Enzyme and Microbial Technology
1992, 14 (3), 230-235.
69
10. He, F.; zhu, W.; Geng, Q.; Nie, L.; Yao, S., Rapid detection of Escherichia
coliform using a series electrode piezoelectric crystal sensor. Analytical letters 1994, 27
(4), 655-669.
11. Carter, R.; Mekalanos, J.; Jacobs, M.; Lubrano, G.; Guilbault, G., Quartz crystal
microbalance detection of Vibrio cholerae O139 serotype. Journal of immunological
methods 1995, 187 (1), 121-125.
12. König, B.; Grätzel, M., A piezoelectric immunosensor for hepatitis viruses.
Analytica chimica acta 1995, 309 (1), 19-25.
13. Rickert, J.; Weiss, T.; Kraas, W.; Jung, G.; Göpel, W., A new affinity biosensor:
self-assembled thiols as selective monolayer coatings of quartz crystal microbalances.
Biosensors and Bioelectronics 1996, 11 (6), 591-598.
14. Sakai, G.; Saiki, T.; Uda, T.; MiuraΔ, N.; Yamazoe, N., Selective and repeatable
detection of human serum albumin by using piezoelectric immunosensor. Sensors and
Actuators B: Chemical 1995, 24 (1), 134-137.
15. Muramatsu, H.; Kajiwara, K.; Tamiya, E.; Karube, I., Piezoelectric immuno
sensor for the detection of Candida albicans microbes. Analytica chimica acta 1986, 188,
257-261.
16. Konash, P. L.; Bastiaans, G. J., Piezoelectric crystals as detectors in liquid
chromatography. Analytical Chemistry 1980, 52 (12), 1929-1931.
17. Nomura, T.; Okuhara, M., Frequency shifts of piezoelectric quartz crystals
immersed in organic liquids. Analytica Chimica Acta 1982, 142, 281-284.
18. Kanazawa, K. K.; Gordon, J. G., The oscillation frequency of a quartz resonator
in contact with liquid. Analytica Chimica Acta 1985, 175, 99-105.
70
19. Bruckenstein, S.; Shay, M., Experimental aspects of use of the quartz crystal
microbalance in solution. Electrochimica Acta 1985, 30 (10), 1295-1300.
20. Schmitt, N.; Tessier, L.; Watier, H.; Patat, F., A new method based on acoustic
impedance measurements for quartz immunosensors. Sensors and Actuators B: Chemical
1997, 43 (1), 217-223.
21. Bizet, K.; Gabrielli, C.; Perrot, H.; Therasse, J., Validation of antibody-based
recognition by piezoelectric transducers through electroacoustic admittance analysis.
Biosensors and Bioelectronics 1998, 13 (3), 259-269.
22. Okahata, Y.; Kawase, M.; Niikura, K.; Ohtake, F.; Furusawa, H.; Ebara, Y.,
Kinetic measurements of DNA hybridization on an oligonucleotide-immobilized 27-MHz
quartz crystal microbalance. Analytical Chemistry 1998, 70 (7), 1288-1296.
23. Schmitt, R. F.; Allen, J. W.; Vetelino, J. F.; Parks, J.; Zhang, C., Bulk acoustic
wave modes in quartz for sensing measurand-induced mechanical and electrical property
changes. Sensors and Actuators B: Chemical 2001, 76 (1), 95-102.
24. Kanazawa, K. K., Steady state and transient QCM solutions at the metal∣ solution
interface. Journal of Electroanalytical Chemistry 2002, 524, 103-109.
25. Welsch, W.; Klein, C.; Von Schickfus, M.; Hunklinger, S., Development of a
surface acoustic wave immunosensor. Analytical chemistry 1996, 68 (13), 2000-2004.
26. Wessa, T.; Rapp, M.; Ache, H., New immobilization method for SAW-biosensors:
covalent attachment of antibodies via CNBr. Biosensors and Bioelectronics 1999, 14 (1),
93-98.
27. Dahint, R.; Grunze, M.; Josse, F.; Renken, J., Acoustic plate mode sensor for
immunochemical reactions. Analytical Chemistry 1994, 66 (18), 2888-2892.
71
28. Dahint, R.; Seigel, R. R.; Harder, P.; Grunze, M.; Josse, F., Detection of non-
specific protein adsorption at artificial surfaces by the use of acoustic plate mode sensors.
Sensors and Actuators B: Chemical 1996, 36 (1), 497-505.
29. Kovacs, G.; Vellekoop, M.; Haueis, R.; Lubking, G.; Venema, A., A Love wave
sensor for (bio) chemical sensing in liquids. Sensors and Actuators A: Physical 1994, 43
(1), 38-43.
30. Harding, G.; Du, J.; Dencher, P.; Barnett, D.; Howe, E., Love wave acoustic
immunosensor operating in liquid. Sensors and Actuators A: Physical 1997, 61 (1), 279-
286.
31. Bechmann, R., Frequency-temperature-angle characteristics of AT-type
resonators made of natural and synthetic quartz. Proceedings of the IRE 1956, 44 (11),
1600-1607.
32. Marx, K. A., Quartz crystal microbalance: a useful tool for studying thin polymer
films and complex biomolecular systems at the solution-surface interface.
Biomacromolecules 2003, 4 (5), 1099-120.
33. Eichelbaum, F.; Borngraber, R.; Schroder, J.; Lucklum, R.; Hauptmann, P.,
Interface circuits for quartz-crystal-microbalance sensors. Review of Scientific
Instruments 1999, 70 (5), 2537.
34. Srivastava, A.; Sakthivel, P., Quartz-crystal microbalance study for characterizing
atomic oxygen in plasma ash tools. Journal of Vacuum Science & Technology A 2001, 19
(1), 97-100.
72
35. Guilbault, G.; Lu, S.; Czanderna, A., Application of piezoelectric quartz crystal
microbalances. Methods and Phenomena, Their Applications in Science and Technology
1984, 7, 251.
36. Buttry, D. A.; Ward, M. D., Measurement of interfacial processes at electrode
surfaces with the electrochemical quartz crystal microbalance. Chemical Reviews 1992,
92 (6), 1355-1379.
37. Lin, Z.; Ward, M. D., Determination of contact angles and surface tensions with
the quartz crystal microbalance. Analytical Chemistry 1996, 68 (8), 1285-1291.
38. Mabbott, G. A., Teaching Electronics and Laboratory Automation Using
Microcontroller Boards. Journal of Chemical Education 2014, 91 (9), 1458-1463.
39. Buttry, D. A. Applications of the quartz crystal microbalance to electrochemistry;
DTIC Document: 1989.
40. Torrey, J. D.; Kirschling, T. L.; Greenlee, L. F., Processing and characterization
of nanoparticle coatings for quartz crystal microbalance measurements. Journal of
research of the National Institute of Standards and Technology 2015, 120, 1.
Recommended