Louisiana Health Insurance Survey, 2013
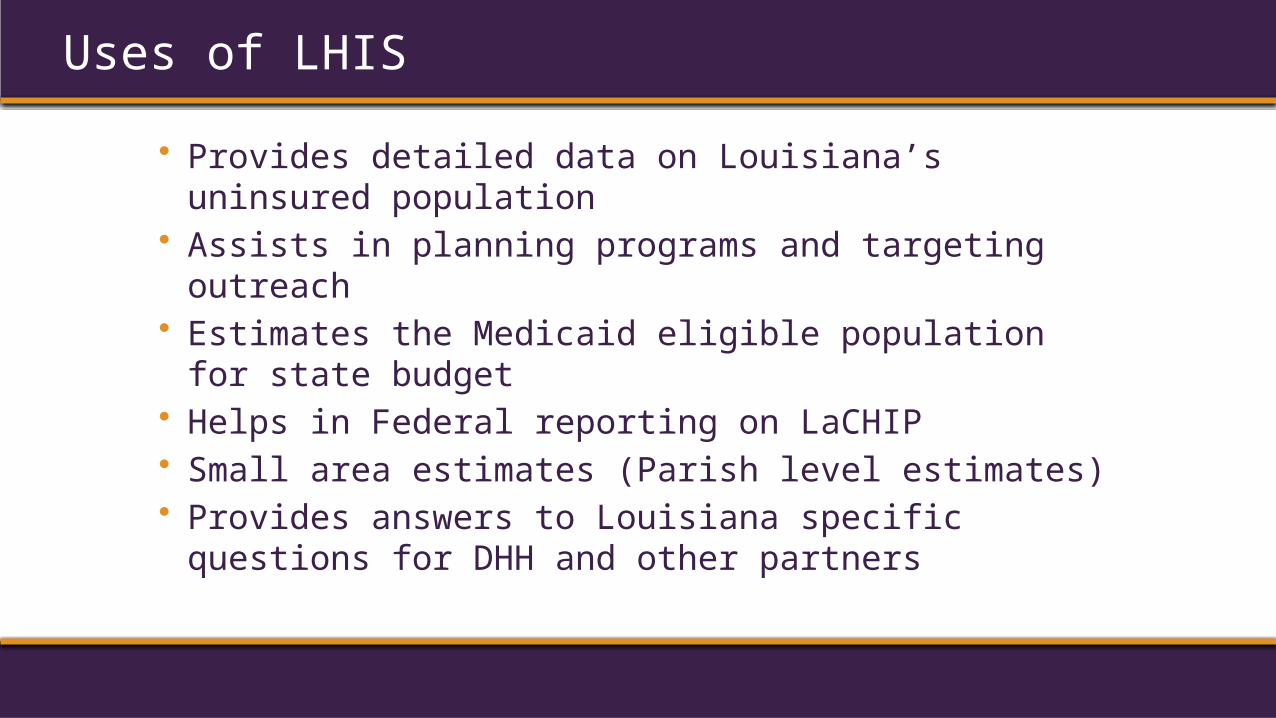
• Provides detailed data on Louisiana’s uninsured population
• Assists in planning programs and targeting outreach
• Estimates the Medicaid eligible population for state budget
• Helps in Federal reporting on LaCHIP• Small area estimates (Parish level estimates)• Provides answers to Louisiana specific
questions for DHH and other partners
Uses of LHIS
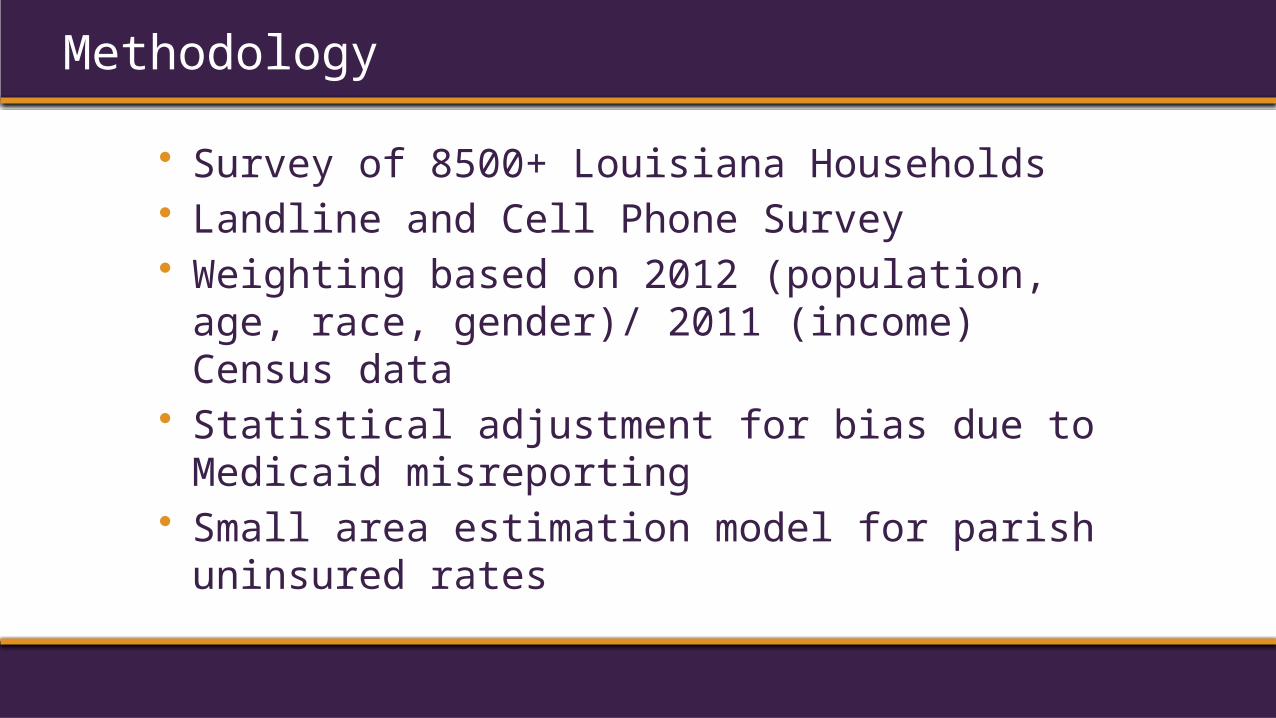
• Survey of 8500+ Louisiana Households• Landline and Cell Phone Survey• Weighting based on 2012 (population, age,
race, gender)/ 2011 (income) Census data• Statistical adjustment for bias due to
Medicaid misreporting• Small area estimation model for parish
uninsured rates
Methodology
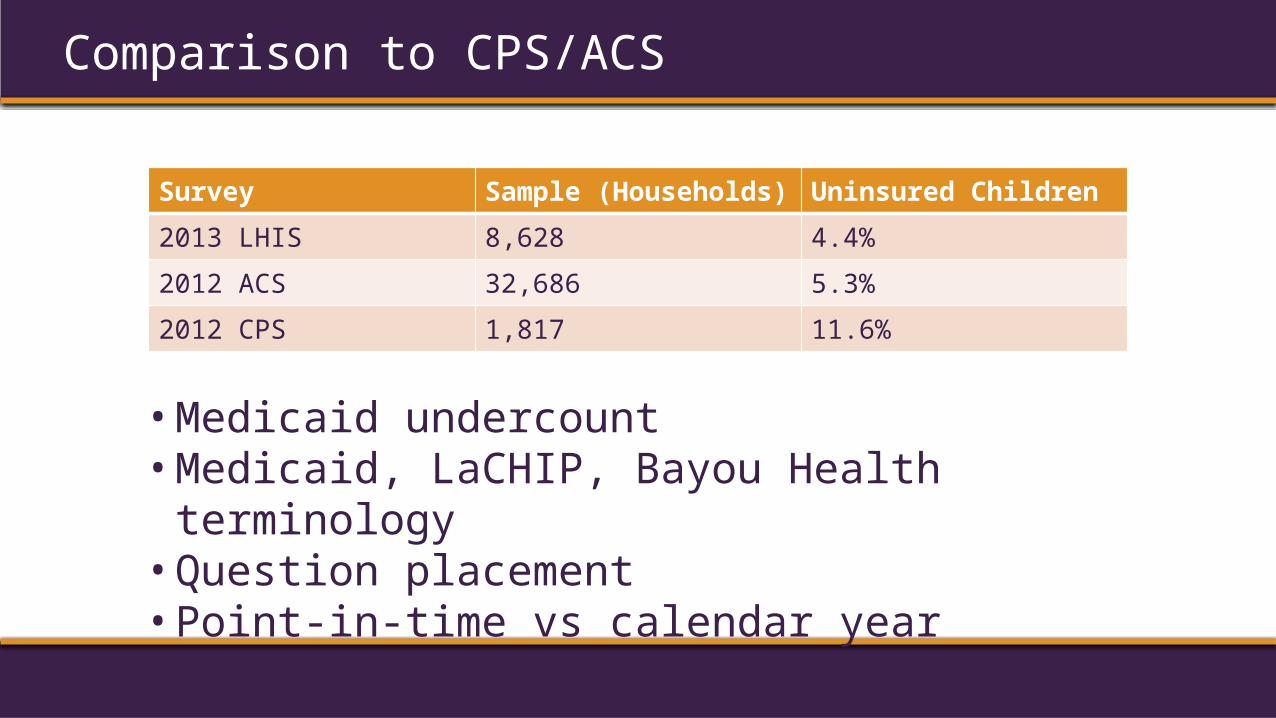
Survey Sample (Households) Uninsured Children
2013 LHIS 8,628 4.4%
2012 ACS 32,686 5.3%
2012 CPS 1,817 11.6%
Comparison to CPS/ACS
• Medicaid undercount• Medicaid, LaCHIP, Bayou Health terminology• Question placement• Point-in-time vs calendar year

Some results from the 2013 LHIS…
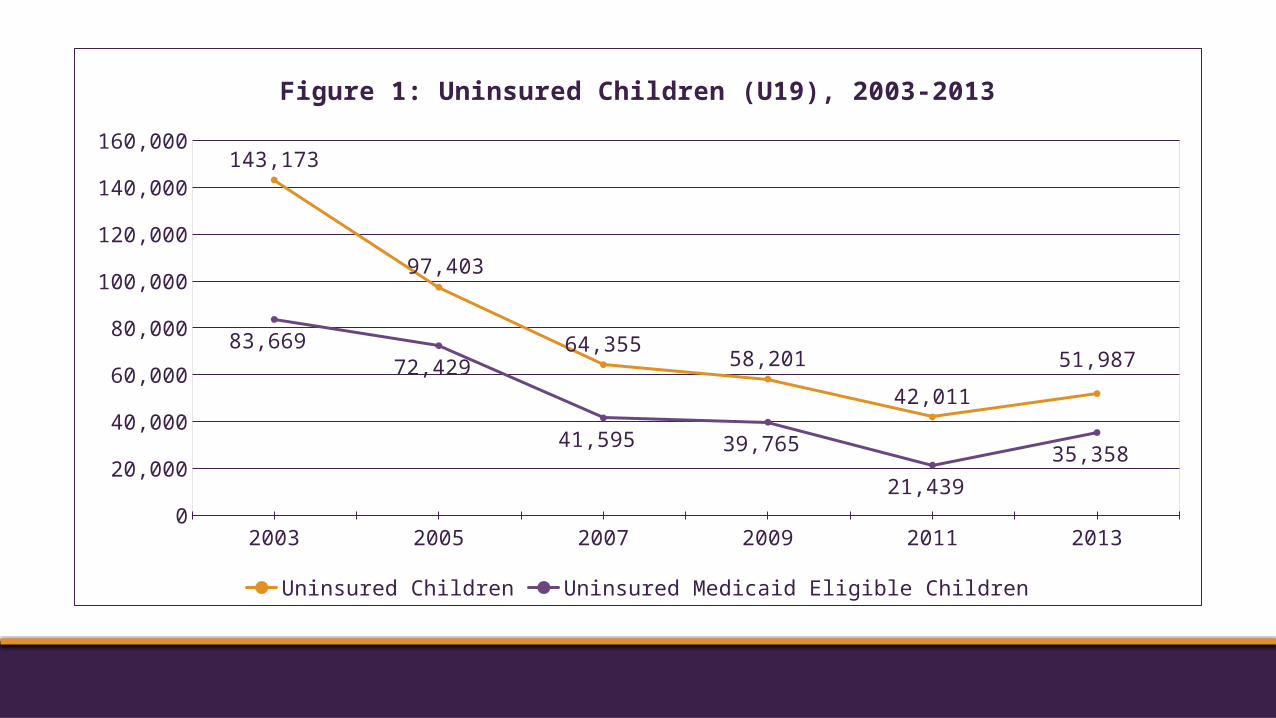
2003 2005 2007 2009 2011 20130
20,000
40,000
60,000
80,000
100,000
120,000
140,000
160,000143,173
97,403
64,35558,201
42,011
51,98783,669
72,429
41,595 39,765
21,439
35,358
Figure 1: Uninsured Children (U19), 2003-2013
Uninsured Children Uninsured Medicaid Eligible Children
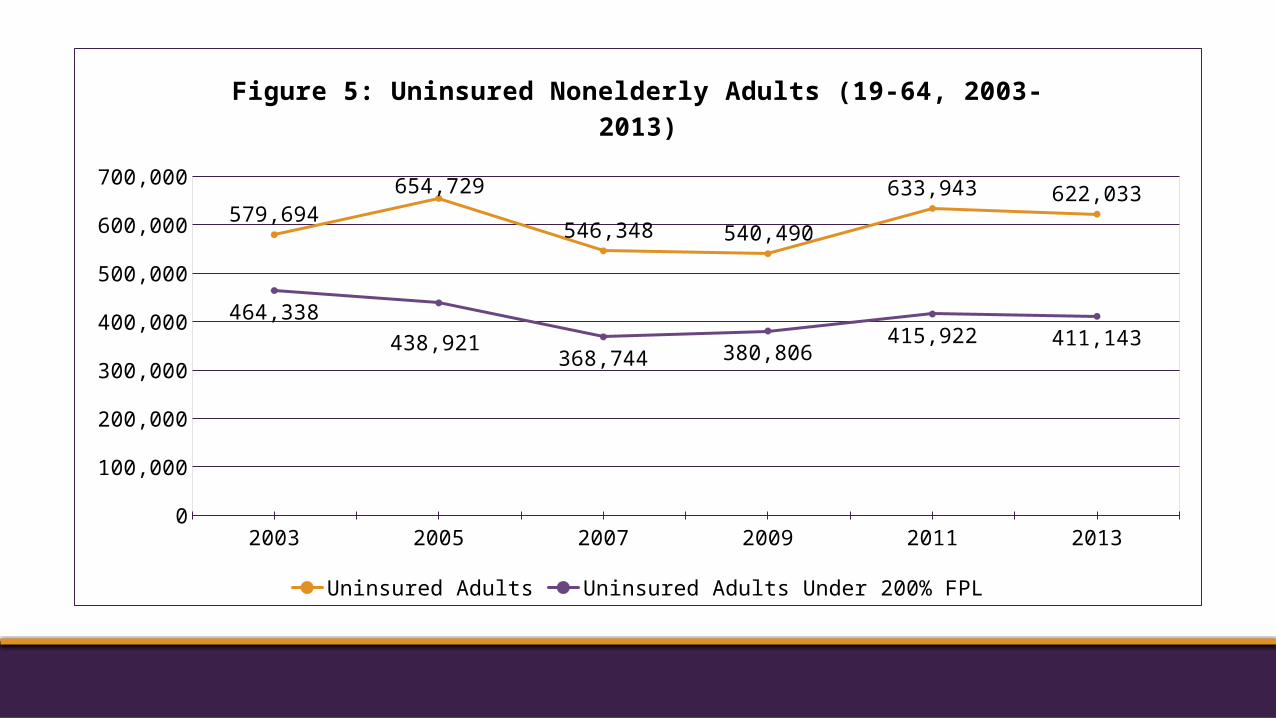
2003 2005 2007 2009 2011 20130
100,000
200,000
300,000
400,000
500,000
600,000
700,000
579,694
654,729
546,348 540,490
633,943 622,033
464,338
438,921368,744 380,806
415,922 411,143
Figure 5: Uninsured Nonelderly Adults (19-64, 2003-2013)
Uninsured Adults Uninsured Adults Under 200% FPL
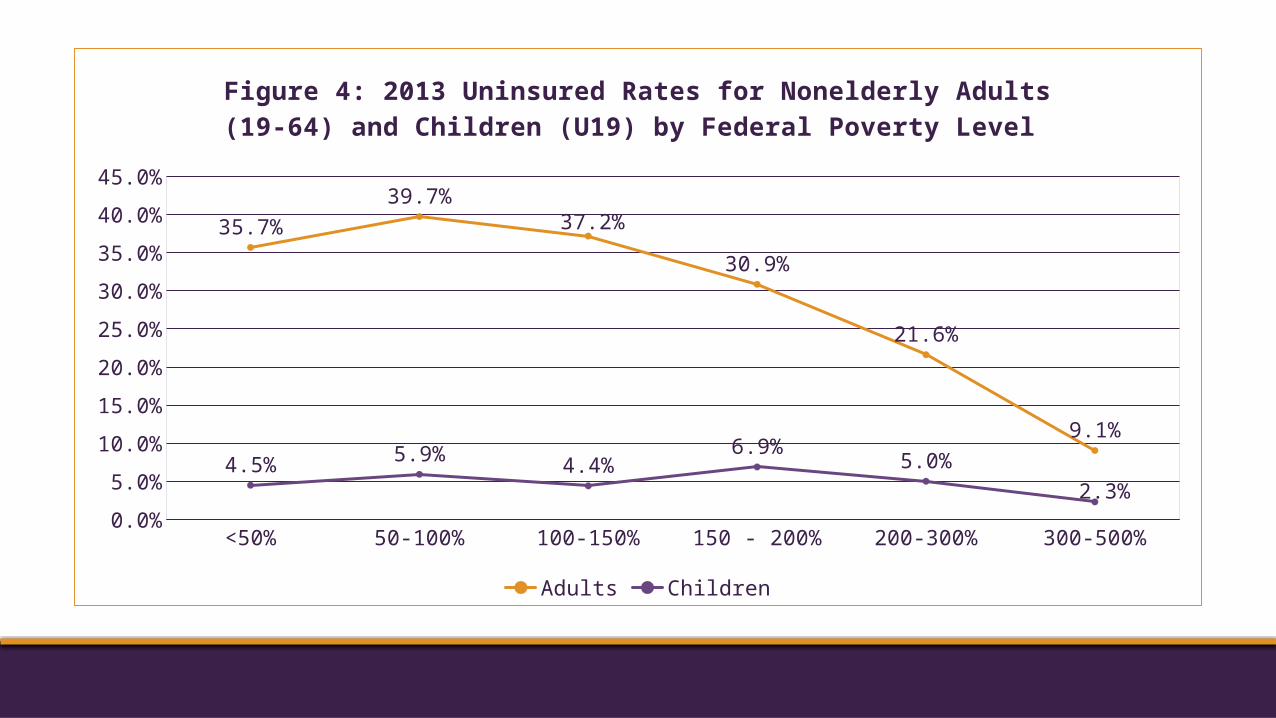
<50% 50-100% 100-150% 150 - 200% 200-300% 300-500%0.0%
5.0%
10.0%
15.0%
20.0%
25.0%
30.0%
35.0%
40.0%
45.0%
35.7%
39.7%37.2%
30.9%
21.6%
9.1%
4.5% 5.9%4.4%
6.9%5.0%
2.3%
Figure 4: 2013 Uninsured Rates for Nonelderly Adults (19-64) and Children (U19) by Federal Poverty Level
Adults Children
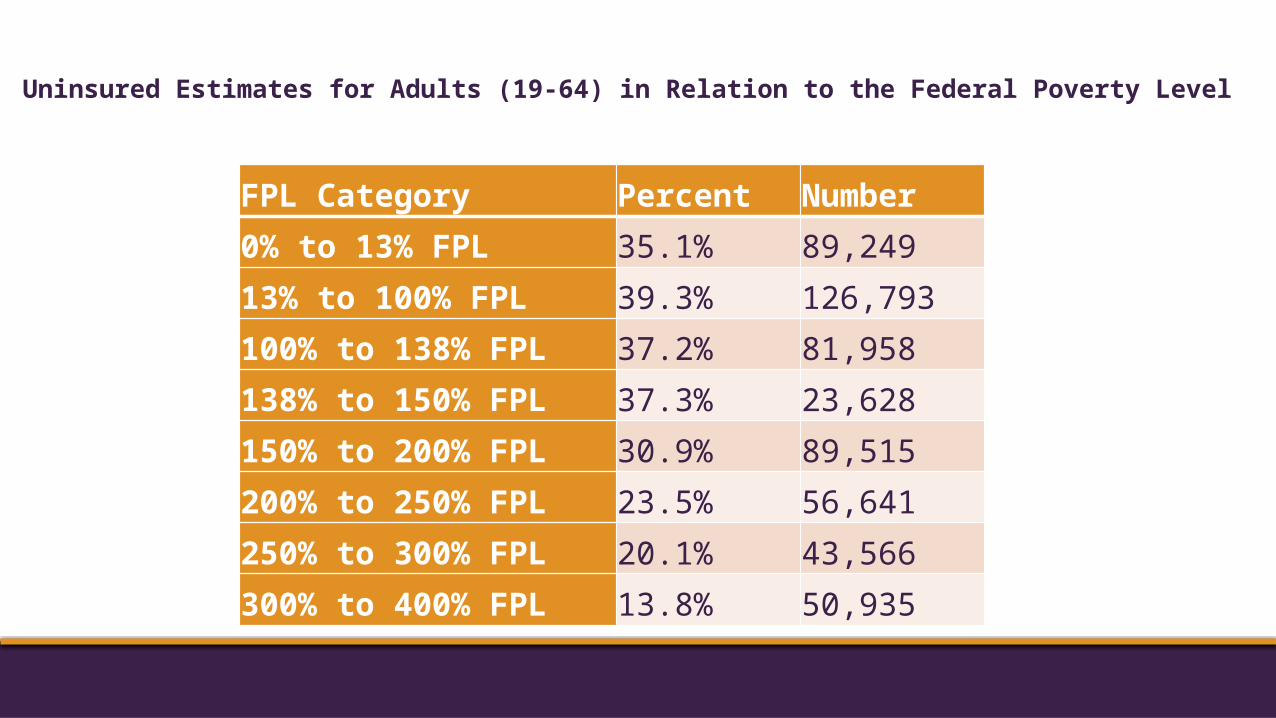
FPL Category Percent Number0% to 13% FPL 35.1% 89,24913% to 100% FPL 39.3% 126,793100% to 138% FPL 37.2% 81,958138% to 150% FPL 37.3% 23,628150% to 200% FPL 30.9% 89,515200% to 250% FPL 23.5% 56,641250% to 300% FPL 20.1% 43,566300% to 400% FPL 13.8% 50,935
Uninsured Estimates for Adults (19-64) in Relation to the Federal Poverty Level
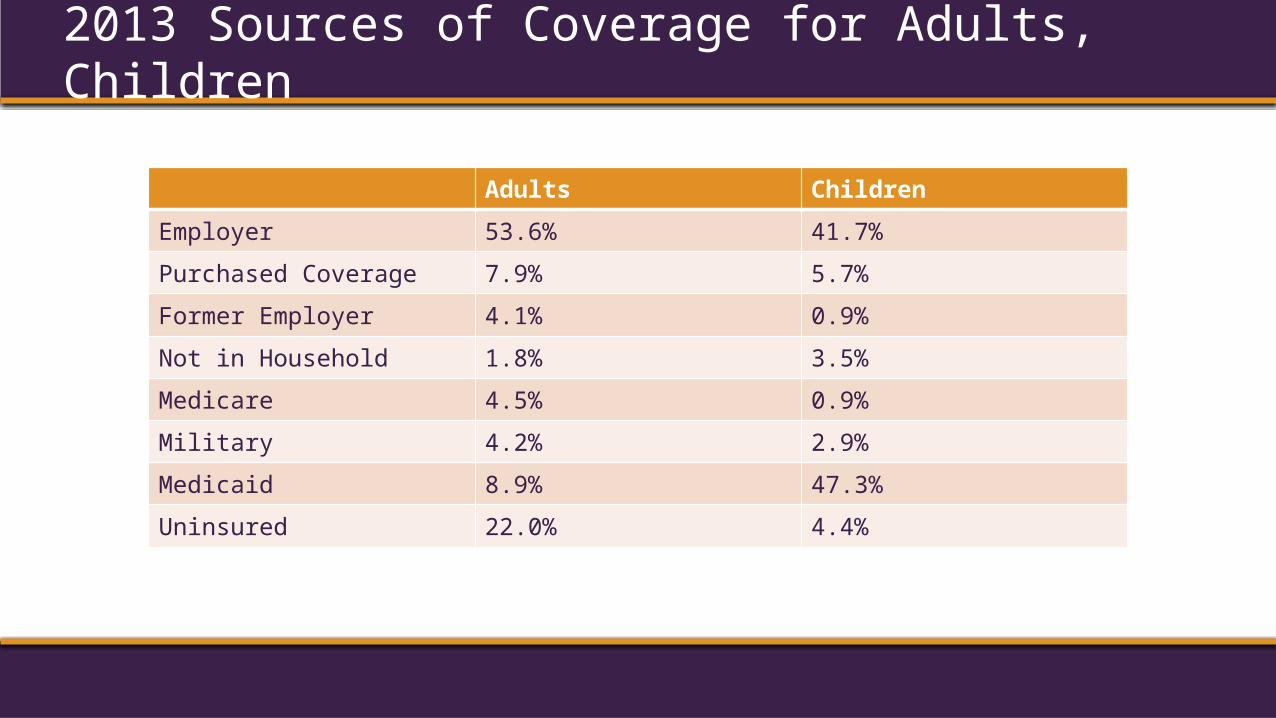
Adults Children
Employer 53.6% 41.7%
Purchased Coverage 7.9% 5.7%
Former Employer 4.1% 0.9%
Not in Household 1.8% 3.5%
Medicare 4.5% 0.9%
Military 4.2% 2.9%
Medicaid 8.9% 47.3%
Uninsured 22.0% 4.4%
2013 Sources of Coverage for Adults, Children
• Small area estimation, updated twice a year• Combines micro level data from survey with
parish demographic and administrative data• Separate models for Adults and Children• Models include all years of LHIS• Predictions based on these factors: income,
race, age, gender, Medicaid enrollment, free and reduced school lunch enrollment, and employment
Parish Results
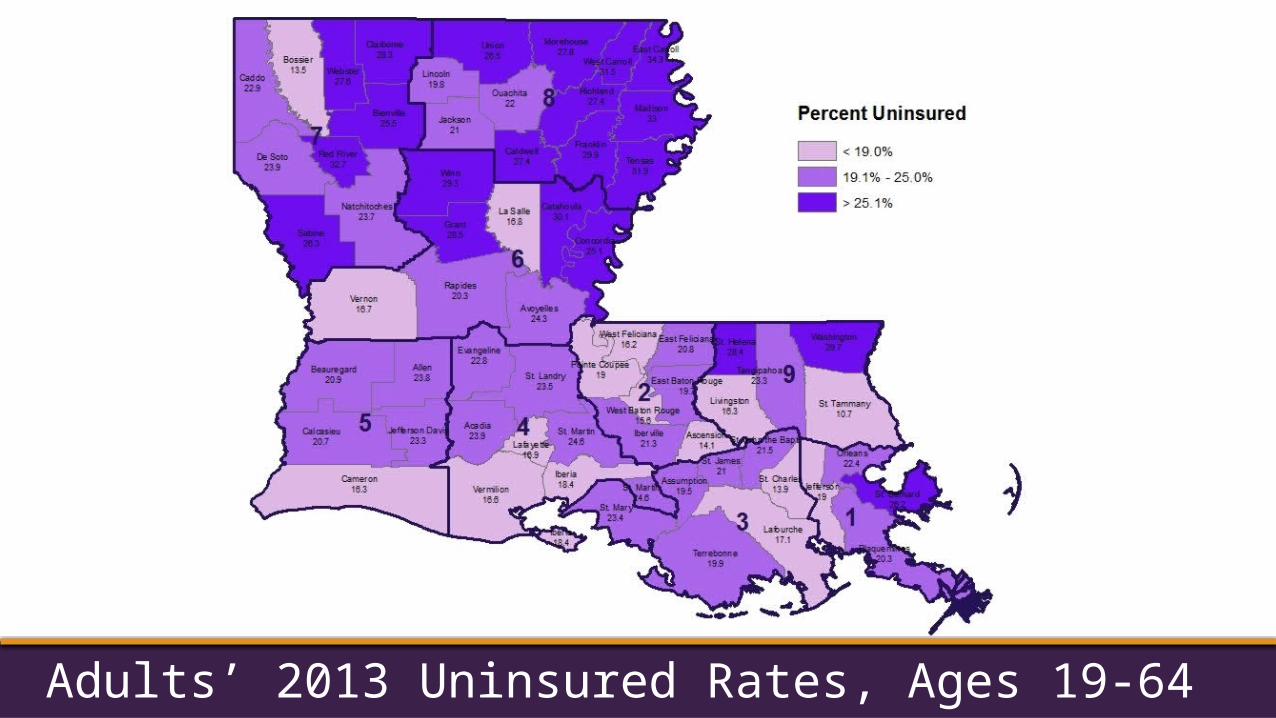
Adults’ 2013 Uninsured Rates, Ages 19-64
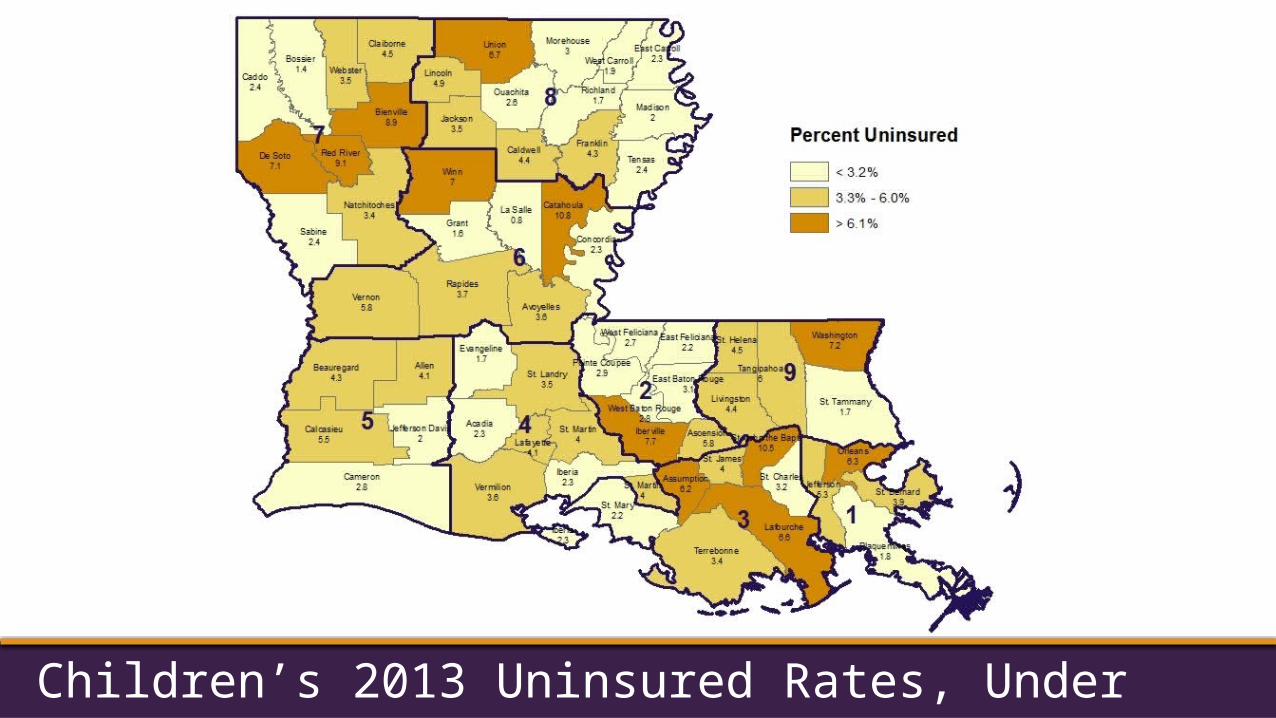
Children’s 2013 Uninsured Rates, Under 19
Recommended