© PA Knowledge Limited 2013 1
© PA Knowledge Limited 2013
LOS ANGELES DEPARTMENT OF WATER AND POWER REVENUE REQUIREMENT EVALUATION
Prepared for Board of Water and
Power Commissioners
May 19, 2015

© PA Knowledge Limited 2013 2
Discussion Topics
• Objectives of Our Assignment
• Major Recent LADWP Initiatives
• Current Industry Trends
• Revenue Requirement Analysis
– Water System
– Power System
• Industry Rate Trends
• Summary

© PA Knowledge Limited 2013 3
Objectives of Our Assignment PA’s Role
PA is providing LADWP independent evaluation and assistance on a wide variety of
tasks associated with development of the revenue requirement and proposed new
rates to help the Department plan for the future.
Water and Power Cost of Service Studies
Benchmarking
Revenue Requirement Analysis
Rate Design Alternatives
Rate Action Reports
Industry Rate Trends

© PA Knowledge Limited 2013 4
Objectives of Our Assignment Development and Analysis of Revenue Requirement
PA is assisting LADWP with the development of its new revenue requirements and
rates for water and power services for FY 2015-16 through FY 2019-20. As part of
this effort, we have reviewed the revenue requirements to validate:
Financial plans reflect budget and financial metric requirements, so resulting
rates will both recover adequate revenues and minimize customer bill impacts
Regulatory mandated obligations are met
Infrastructure investments are designed to move towards industry standards for
asset replacement and plant age
Cost of service studies meet industry standards
Guiding legal principles are followed
Board approved financial metrics are maintained

© PA Knowledge Limited 2013 5
© PA Knowledge Limited 2013
MAJOR RECENT LADWP INITIATIVES

© PA Knowledge Limited 2013 6
Major Recent LADWP Initiatives
Similar to other utilities, LADWP has undertaken many initiatives designed to meet
Council recommendations, improve operations and financial performance, and
increase accountability.
Significant cost reduction
plan savings
A new labor agreement
Working with the
Ratepayer Advocate
Business planning to avoid
unnecessary rate increases
Establishment of corporate
performance unit
System-
Wide
Renewable energy supply,
reduction of GHG emission
Local solar
programs
Energy
efficiency
Transitioning off
coal
Electric vehicle
programs
Power System Reliability
Program (PSRP)
Power
Eastern Sierra
commitments Seismic retrofits
Infrastructure improvements:
mainlines, regulator stations, etc.
Meeting water quality
compliance regulations Water conservation
Water
Increasing local water
supply
Once-Through Cooling /
Repowering

© PA Knowledge Limited 2013 7
Major Recent LADWP Initiatives Response to Council Recommendations
In response to the 2012 Council recommendations, LADWP has taken actions that
contribute to cost efficiencies, accountability and benchmarking.
All of the recommendations have been addressed; however, programs implemented for some of the
recommendations require recurring efforts.
Recommendation Status Recommendation Status
Negotiate with labor to increase flexibility for
contracting out and to bring salaries and
benefits closer to utility market rates
Complete
Reevaluate surcharge-based restructuring
approach with fully restructured, permanent
rates, if legally permissible
Complete
Conduct benchmarking assessment to
review cost per project and to ensure cost
reasonableness
Initial study
completed /
On-going
Conduct new cost of service studies in
preparation for new rate restructuring Complete
Submit a semi-annual report to Mayor and
City Council on status of Renewable
Portfolio Standards
Several reports
submitted / On-
going
Establish plan for energy efficiency that
maintains expenditures at cost effective
levels
Complete
Identify opportunities to contract out and
explore potential savings On-going
Review overtime expense allocations and
contractual requirements that have an
impact on overtime
On-going
Seek Departmental efficiencies by pursuing
process improvements On-going
Review the Department’s hedging plan to
lock in low fuel prices Complete

© PA Knowledge Limited 2013 8
Major Recent LADWP Initiatives Cost Reduction Plan
LADWP has saved $467 million from the initial cost reduction plan exceeding the
original $459 million three-year target. Major cost reduction initiatives included:
• Negotiation and implementation of new labor
agreement
• Reduced overtime, vacancies, and attrition-
based labor savings
• Increased vigilance over hiring
• Refinancing, state grants and low interest
loans
• Reduce new computer purchases - stretch out
life to 5 year cycle
• Suspend office remodels and furniture
purchases
Source February 2011 – June
2014 Savings ($M)
Labor $230.0
Non-Labor $142.8
Capital $94.1
Total $466.9
Castaic
power plant
improvements
Electronic
WQ report
Power Water
Solar facilities
on LADWP
property
Shade balls Pipe material
evaluations
City
coordination
Capital
project
controls
Capital
prioritization
LADWP has also been pursuing other cost reduction efforts.

© PA Knowledge Limited 2013 9
Major Recent LADWP Initiatives New Labor Agreement
LADWP’s new labor agreement will provide $456 million in savings over FYs 2013-14
through FY 2016-17 and an estimated $5 billion in savings over thirty years.
Key Components of the MOU Four-Year Savings
Estimate ($M)
Defer Cost of Living Adjustment from 10/1/13 to 10/1/16 $385.0
Entry Level Salary Reduction for 34 Common Classes $15.0
Sick Time Medical Certification Requirement $12.0
Contracting Out Overtime Restriction - Reduction from 10% to 5% $3.0
Retirement Plan Tier 2 For All New Hires $41.0
Total $456.0

© PA Knowledge Limited 2013 10
Major Recent LADWP Initiatives Benchmarking – Water System
LADWP has begun a comprehensive benchmarking program to identify areas with
strong performance and areas for further cost and operational improvements.
Considerations:
• High reliance on walk in payment centers compared to electronic based solutions
• Infrastructure age; upgrades should reduce maintenance costs over long term
• Higher relative cost of living in California
• Allocation process between water and power for Customer service costs
= LADWP position
Note: Large Utility Companies: AWWA benchmarks comprised of 7 survey participants (water operations only, >500,000 customers)
Western Region : 1) AZ, CO, ID, MT, NV, NM, UT, WY, AK, CA, HI, OR, WA (16 survey participants (water operations only, Region 4)
Source: LADWP 2012 Financial Statements, LADWP Water Executive Office, AWWA 2012 Water Utilities Benchmarking Survey (including LADWP’s survey responses), Strategy& analysis
LADWP
1Q
2Q
3Q
4Q
558 2,049
2,160
1,651
1,052
563
422
269
O&M Cost Per Customer
($MM/Cust)
O&M Cost Per Million Gallons
Distributed
($MM/MG) (Large Utility
Companies)
(Western
Region)
(Large Utility
Companies)
(Western
Region)
3,983
2,554
1,858
2,049
717
542
416
558
63.54
48.23
30.10
Customer Service Cost per
Account
($/Account) (Large Utility
Companies)
(Western
Region)
66.35
53.43
43.25
71.53 71.53

© PA Knowledge Limited 2013 11
Major Recent LADWP Initiatives Benchmarking – Power System
The Power System’s performance is strong overall; however, individual areas for
further cost and operational improvements were identified for further evaluation.
Considerations:
• 2nd Quartile performance on a
per customer basis is a strong
indicator of cost effectiveness
• Low distribution capital
expenditures may indicate
underspending
Source: LADWP 2012/2013 Financial Statements, FERC Form 1 Data, SNL Data, Strategy& analysis
1Q
2Q
3Q
4Q
LADWP
(Large Utility Companies)
n=29
745
630
469
625
(Western Region)
n=22
805
642
506
625
(Western Region)
n=15
2.15
1.73
1.35
1.48
1Q
2Q
3Q
4Q
LADWP
(Large Utility Companies)
n=31
2.07
1.70
1.44
1.48
= LADWP position
Total O&M per Customer
($/Customer)
Distribution CapEx per Distribution
Depreciation Expense
($/$)

© PA Knowledge Limited 2013 12
Major Recent LADWP Initiatives Benchmarking – Power System
= LADWP position
(Large Utility
Companies)
n=32
132
118
93
80
LADWP
1Q
2Q
3Q
4Q
Distr O&M per Customer
($/Customer)
(Western
Region)
n=15
93
84
63
132 65
Customer Service O&M per
Customer
($/Customer)
(Large Utility
Companies)
n=32
(Western
Region)
n=15
65
134
94
66
126
109
86
The Distribution area appears to offer an opportunity for future improvement.
Considerations:
• Infrastructure age; upgrades should reduce maintenance costs over long term
• Allocation process between water and power for Customer service costs
• Recent IOU increased customer service focus
• Higher relative cost of living in California
Source: LADWP 2012/2013 Financial Statements, FERC Form 1 Data, SNL Data, Strategy& analysis

© PA Knowledge Limited 2013 13
Major Recent LADWP Initiatives Benchmarking – Power System (continued)
LADWP’s Power System operational performance is generally strong.
SAIFI - System Average Interruption Frequency Index: the average annual number of times each customer sees an interruption
SAIDI - System Average Interruption Duration Index: the average annual number of minutes each customer sees during an interruption
CAIDI - Customer Average Interruption Duration Index): the average annual number of minutes each customer sees during an interruption
for those customers that have an interruption
Considerations:
• Weather contributes to higher
reliability in Southern California
• Aging infrastructure could impact
future results
LADWP
1Q
2Q
3Q
4Q
115.66
88.23
61.65
SAIDI
National Panel
63.69
1.25
0.84
0.72
SAIFI
National Panel
0.45
115.66
88.23
61.65
CAIDI
National Panel
63.69
= LADWP position

© PA Knowledge Limited 2013 14
© PA Knowledge Limited 2013
CURRENT INDUSTRY TRENDS

© PA Knowledge Limited 2013 15
Current Water Utility Industry Trends
LADWP is facing many of the same opportunities and challenges being addressed by
other water utilities in California (and elsewhere).
Response to historic drought in California
Aging infrastructure (EPA forecasts $384.2 billion
required investment in water infrastructure
nationwide over 20 years)
Regulatory mandates (e.g., Long-Term 2 Enhanced Surface Water
Treatment and Stage 2 Disinfectants and Disinfection Byproducts Rule –
EPA/Safe Drinking Water Act )
Bay Delta Conservation Plan
Balancing investment needs with
maintaining reasonable customer rates
Proposition 218
requirements and recent
legal challenges

© PA Knowledge Limited 2013 16
Current Power Utility Industry Trends
Similarly the Power System is facing many of the same opportunities and challenges
being addressed by other power utilities in California (and elsewhere).
Meeting renewable energy
resource targets
Aging infrastructure (195,000
(61%) of poles are more than 50
years old)
Regulatory mandates (e.g., elimination of once-through-cooling –
EPA/Clean Water Act; SWRCB)
Energy efficiency goals
Balancing investment needs with maintaining
reasonable customer rates
Proposition 26 requirements and recent legal
challenges
Net energy metering

© PA Knowledge Limited 2013 17
© PA Knowledge Limited 2013
REVENUE REQUIREMENT ANALYSIS WATER SYSTEM

© PA Knowledge Limited 2013 18
Water System Revenue Requirement Analysis How Funds are Used?
95% of the change between LADWP’s Water Revenue Fund actual spending in FY
2013-14 to proposed spending in FY 2019-20 (O&M and capex) is projected to be
non-labor. • Non-labor spending is projected to
increase from $382M in FY 2013-14 to
$1.15B in FY 2019-20.
• The average annual Water System
spending of $1.5 billion per year over the
five-year rate action will support an annual
18,000 jobs and induce an annual $4
billion in additional economic activity and
output.*
Non-labor expenditures include outside services and materials
*Source: Derived from Exhibit 3-2, page 14. “Los Angeles Department of Water and Power: Supplying Power, Water and Jobs for Los Angeles,” September 2012. Economic and Policy
Analysis Group; Los Angeles County Economic Development Corporation

© PA Knowledge Limited 2013 19
Water System Revenue Requirement Analysis Current Revenue Situation
Based on an analysis of the financial plan, underlying budget and required major
programs, LADWP’s current Water System revenues will not cover the revenue
requirement.
• Capital spending for
infrastructure and mandated
programs is a large driver.
• The gap slowly increases over
time as investments are made.
*Purchased water is based on the current assumption of normal hydrology for the next five-years, which is subject to change.
*

© PA Knowledge Limited 2013 20
Water System Revenue Requirement Analysis Incremental Required Revenues
To meet its obligations, LADWP will require $90 million
in additional revenue requirement on average over the
next five years (not including the impact of purchased water).
Five-Year Revenue Requirement
Source Five Years ($M)
Infrastructure $300
Conservation* ($30)
Water Quality $108
Water recycling $22
Stormwater $8
Groundwater $24
Owens Valley $19
Purchased water** ($220)
Total $230
Revenue Requirement
Rate Driver Average Annual Increase ($M)
Infrastructure $59
Conservation (Securitization)* ($6)
Water Quality $22
Groundwater (Securitization) $5
Stormwater $2
Recycled Water $4
Owens Valley $4
Total before Purchased Water $90
Purchased Water** ($44)
Total $46
*Many conservation investments are eligible for lower financing through
securitization, resulting in a reduction in revenue requirement.
**Purchased water is negative due to the current assumption of normal hydrology for
the next five-years.
Infrastructure and water quality are the major
drivers of revenue requirement.

© PA Knowledge Limited 2013 21
Water System Revenue Requirement Analysis Meeting Regulatory Obligations and Increasing Infrastructure Investment
LADWP’s revenue requirement should allow the Department to meet water quality
mandates, increase local supply and increase infrastructure reliability investments in
a measured manner.
New revenues will help reduce the mainline
replacement cycle from 250 to 182 years, which
is a good movement towards a more reliable and
sustainable infrastructure
The revenue requirement reflects an increase in
conservation and a gradual shift to a more local water
supply (assuming a return to normal hydrology).

© PA Knowledge Limited 2013 22
© PA Knowledge Limited 2013
REVENUE REQUIREMENT ANALYSIS POWER SYSTEM

© PA Knowledge Limited 2013 23
Power System Revenue Requirement Analysis How Funds are Used?
80% of the change between LADWP’s Power Revenue Fund actual spending in FY
2013-14 to proposed spending in FY 2019-20 (O&M and capex) is projected to be
non-labor.
Non-labor expenditures include outside services and materials
*Source: Derived from Exhibit 3-2, page 14. “Los Angeles Department of Water and Power: Supplying Power, Water and Jobs for Los Angeles,” September 2012. Economic and Policy
Analysis Group; Los Angeles County Economic Development Corporation
• Non-labor spending is projected to
increase from $827M in FY 2013-14 to
$1.41B FY 2019-20.
• The average annual Power System
spending of $2.65 billion per year over the
five-year rate action will support an annual
33,321 jobs and induce an annual $8.39
billion in additional economic activity and
output.*

© PA Knowledge Limited 2013 24
Power System Revenue Requirement Analysis Current Revenue Situation
Based on an analysis of the financial plan, underlying budget and required major
programs, LADWP’s current Power System revenues will not cover the revenue
requirement.
• Capital spending for
infrastructure and mandated
supply programs is a large
driver.
• The gap slowly increases over
time as investments are made.
© PA Knowledge Limited 2013 25
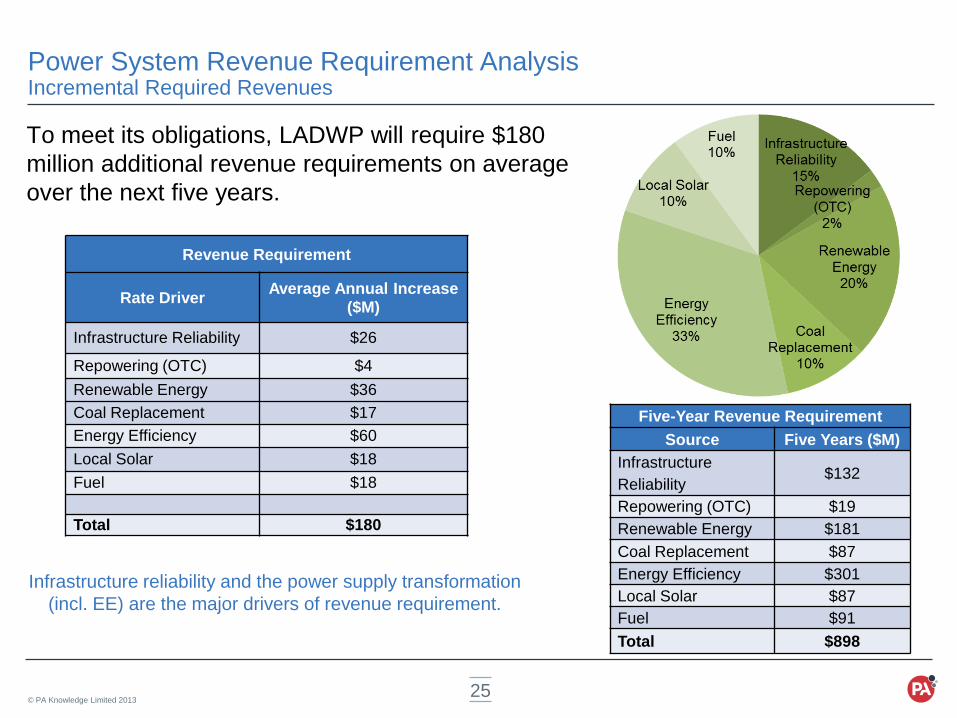
Power System Revenue Requirement Analysis Incremental Required Revenues
To meet its obligations, LADWP will require $180
million additional revenue requirements on average
over the next five years.
Five-Year Revenue Requirement
Source Five Years ($M)
Infrastructure
Reliability $132
Repowering (OTC) $19
Renewable Energy $181
Coal Replacement $87
Energy Efficiency $301
Local Solar $87
Fuel $91
Total $898
Revenue Requirement
Rate Driver Average Annual Increase
($M)
Infrastructure Reliability $26
Repowering (OTC) $4
Renewable Energy $36
Coal Replacement $17
Energy Efficiency $60
Local Solar $18
Fuel $18
Total $180
Infrastructure reliability and the power supply transformation
(incl. EE) are the major drivers of revenue requirement.

© PA Knowledge Limited 2013 26
Power System Revenue Requirement Analysis Increasing Infrastructure Reliability and Meeting Regulatory Obligations
LADWP’s revenue requirement should allow the Department to meet renewable
energy mandates and increase infrastructure reliability investments in a measured
manner.
The number of poles over fifty years old will
decrease over five years, but the average
age will still be over fifty years.
Elimination of Once-Through Cooling continues to be a major
LADWP program as LADWP meets EPA mandates.

© PA Knowledge Limited 2013 27
© PA Knowledge Limited 2013
INDUSTRY RATE TRENDS

© PA Knowledge Limited 2013 28
Industry Rate Trends Water Utilities
LADWP has not had a base water rate change in over five years; however, other
major California cities have been increasing rates to address the challenges facing
the industry.
• Water utility rate increases are
expected to continue as more
drought management programs
are implemented and aging
infrastructure replacement
accelerates.
• LADWP’s typical single- family
residential customer bill is
currently very competitive, a
situation expected to continue as
other water utilities increase rates.
Anticipated increases are either proposed or approved.
Bill comparisons for utilities with water budgets were based on medium temperature zone, low season, lot size < 7,500 sqft,
three people per household, January month, 1,500 sqft irrigable land and lowest pumping zone charge where applicable.

© PA Knowledge Limited 2013 29
Industry Rate Trends Power Utilities
LADWP has not had a base power rate increase for three of the last five years;
however, other major California cities have been steadily increasing rates to address
the challenges facing the industry.
• Power utility rate increases are
expected to continue to allow utilities
to increase infrastructure
replacement and meet additional
regulatory requirements.
• LADWP’s typical customer bill is
currently less than most other major
California cities on average.
Anticipated increases are either proposed or approved.
Bill comparisons based on 500kWh usage in summer

© PA Knowledge Limited 2013 30
© PA Knowledge Limited 2013
SUMMARY

© PA Knowledge Limited 2013 31
Summary
LADWP’s proposed five-year revenue requirement has been developed based on a
comprehensive budget and financial plan that was developed to balance program
needs and customer rate implications.
• Incremental revenue will be invested largely in
infrastructure and regulatory mandated programs.
• Competitive bidding will help ensure efficient use of
financial resources.
• Increased use of contract resources will help control
costs and increase business development in the Los
Angeles Region.
• The revenue requirement should allow LADWP to
maintain Board approved financial metrics.
Given the trend toward increasing water and power
rates in California (and elsewhere in the United States)
LADWP customer rates should remain competitive.
Major Water Rate Drivers
Infrastructure
Water Quality
Sustainable Local Water Supply
Owens Valley Regulatory Compliance
Purchased Water*
*Purchased water can increase or decrease the revenue requirement depending on hydrology conditions.
Major Power Rate Drivers
Infrastructure
Power Supply Transformation
Renewable Energy Resources
Customer Opportunity Programs (EE, local
solar)
Fuel
Recommended