School of Industrial and Information Engineering
Master of Science in Management Engineering
Logistics service optimization
- The case of Luxottica -
Supervisor:
Prof. Alessandro Perego
Master Graduation Thesis by:
Giacomo Lucchetta [835550]
Academic year 2015-2016

2

3
Alla mia famiglia

4
5
INDEX
INDEX ................................................................................................................................................. 5
TABLES INDEX ................................................................................................................................. 7
FIGURES INDEX................................................................................................................................ 8
ABSTRACT ....................................................................................................................................... 10
EXECUTIVE SUMMARY................................................................................................................ 11
1. THE EYEWEAR INDUSTRY ...................................................................................................... 16
1.1 THE PRODUCT....................................................................................................................... 16
1.2 THE PLAYERS ....................................................................................................................... 19
1.3 THE HISTORY ........................................................................................................................ 21
1.4 INDUSTRY’S EXTERNAL CONTEXT ................................................................................ 24
1.5 INDUSTRY’S INTERNAL CONTEXT.................................................................................. 27
1.6 FUTURE TRENDS .................................................................................................................. 29
2. LUXOTTICA ................................................................................................................................. 31
2.1 HISTORY ................................................................................................................................. 31
2.2 BUSINESS MODEL ................................................................................................................ 33
2.3 OPERATIONS ......................................................................................................................... 34
2.4 INTERNAL ANALYSIS ......................................................................................................... 40
2.5 STRENGHTS, WEAKNESSES, OPPORTUNITIES AND THREATS ................................. 43
3. OBJECTIVES AND METHODOLOGIES ................................................................................... 47
3.1 OBJECTIVES .......................................................................................................................... 47
3.2 METHODOLOGIES ................................................................................................................ 48
4. LITERATURE REVIEW ABOUT LOGISTICS CUSTOMER SERVICE .................................. 56
4.1 PAPERS SELECTION AND COLLECTION ......................................................................... 56
4.2 PAPERS CLASSIFICATION .................................................................................................. 57
4.3 GENREAL OVERVIEW ABOUT LOCISTICS CUSTOMER SERVICE............................. 66
4.4 MAIN THEMES ...................................................................................................................... 68
4.5 GAP ANALYSIS AND CONCLUSIONS .............................................................................. 80
6
5. THE PROJECT IN LUXOTTICA ................................................................................................. 82
5.1 GENERAL OVERVIEW ......................................................................................................... 82
5.2 THE FOCUS OF THE STUDY ............................................................................................... 83
5.2.1 BUSINESS DESIGN ......................................................................................................... 84
5.2.2 LOGISTICS NETWORK SETUP ..................................................................................... 86
5.3 THE VARIABLES OF THE STUDY ..................................................................................... 87
5.3.1 THE PERIMETER ............................................................................................................ 87
5.3.2 THE PARAMETERS ........................................................................................................ 91
6. THE ANALYSIS OF LUXOTTICA LOGISTICS CUSTOMER SERVICE ............................. 104
6.1 THE AS IS LOGISTICS CUSTOMER SERVICE ................................................................ 104
6.1.1 PERIMETER OVERVIEW ............................................................................................. 104
6.1.2 PARAMETERS OVERVIEW......................................................................................... 105
6.1.3 MAIN FINDINGS ........................................................................................................... 112
6.2 TOWARD THE TO BE LOGISTICS CUSTOMER SERVICE ........................................... 113
6.2.1 IMPROVEMENT OF CUSTOMERS’ CLASSIFICATION .......................................... 113
6.2.2 CUSTOMERS’ COST-TO-SERVE ................................................................................ 118
6.2.3 MAIN FINDINGS, FUTURE STEPS AND LIMITATIONS ........................................ 126
7. CONCLUSIONS .......................................................................................................................... 128
8. REFERENCES............................................................................................................................. 130

7
TABLES INDEX
Table 1: Classification of the reviewed papers .................................................................................. 58
Table 2: STARS classes based on sell-out ......................................................................................... 85
Table 3: STARS classes not based on sell-out ................................................................................... 85
Table 4: Main STARS markets: sell-in and n° of customers ............................................................. 88
Table 5: Main STARS markets: sell-in and n° of customers normalized .......................................... 89
Table 6: STARS stores distribution per class .................................................................................... 90
Table 7: Order to Delivery Lead Time calculation model ................................................................ 96
Table 8: Couriers and express couriers rate structure ..................................................................... 100
Table 9: Cost-to-Serve qualitative assessment ............................................................................... 101
Table 10: Theoretical and Actual shipping profile .......................................................................... 111
Table 11: New logistics based classes and TSF ............................................................................... 115
Table 12: Details of new classes per macro-region: sell-in, stores and TSF ................................... 118
Table 13: Potential shipping days combinations.............................................................................. 122
Table 14: New potential shipping days combinations ..................................................................... 124
Table 15: Final shipping days combination ..................................................................................... 124
Table 16: Final TSF and OtD LT assessment per class ................................................................... 125

8
FIGURES INDEX
Figure 1: Macro phases composing the methodology analysis .......................................................... 13
Figure 2: Tommaso da Modena, Cardinal Nicholas of Ruen, 1351-52 ............................................. 21
Figure 3: Luxottica’s business model ................................................................................................ 33
Figure 4: Luxottica’s production footprint......................................................................................... 35
Figure 5: Luxottica’s 2014 global production – Split by volume ...................................................... 36
Figure 6: Luxottica’s logistics footprint............................................................................................. 37
Figure 7: Luxottica’s proprietary brands ........................................................................................... 38
Figure 8: Luxottica’s licensed brands ................................................................................................ 38
Figure 9: Luxottica’s retail chains ..................................................................................................... 39
Figure 10: Objectives of the study .................................................................................................... 47
Figure 11: Objectives beyond the study ............................................................................................. 48
Figure 12: Macro phases composing the methodology analysis........................................................ 48
Figure 13: Luxottica’s areas touched for achieving a global comprehension .................................... 49
Figure 14: Luxottica’s areas touched during the STARS deep dive .................................................. 51
Figure 15: Phases composing the literature review ........................................................................... 51
Figure 16: Phases composing the AS IS scenario analysis ............................................................... 53
Figure 17: Luxottica Order to Delivery process ................................................................................ 93
Figure 18: Order to Delivery Lead Time model ................................................................................ 94
Figure 19: Example of Cost-to-Serve ratio path .............................................................................. 102
Figure 20: STARS stores geographical distribution ........................................................................ 104
Figure 21: STARS stores class distribution ..................................................................................... 104
Figure 22: STARS volume distribution per class ............................................................................ 105
Figure 23: Theoretical & Actual OtD Lead Time per class ............................................................. 106
Figure 24: Theoretical & Actual Shipping Frequency per class ...................................................... 107
Figure 25: Theoretical & Actual sell-in per Shipping Frequency .................................................... 108
Figure 26: Theoretical Shipping Frequency distribution per class .................................................. 109
Figure 27: Actual & Theoretical Cost-to-Serve ratio per class ........................................................ 111
9
Figure 28: Italy, France and Spain, stores and sell-in ...................................................................... 116
Figure 29: Germany and UK, stores and sell-in ............................................................................... 117
Figure 30: Shipping profile per macro-region and per class ............................................................ 119
Figure 31: OtD LT model for class A .............................................................................................. 120
Figure 32: OtD LT model for class B .............................................................................................. 120
Figure 33: OtD LT model for class C .............................................................................................. 121
Figure 34: OtD LT model for class D .............................................................................................. 121
Figure 35: New CtSr per class and macro-region ............................................................................ 123
Figure 36: Workload schedule of the chosen alternative ................................................................. 125

10
ABSTRACT
The purpose of this thesis is to describe an analytical and practical approach to assess the costs and
benefits of a logistics services rationalization in the eyewear industry.
The thesis is based on a literature review and a classification of the main contributions regarding the
assessment of logistics services impact on customers and suppliers. The impact of logistics services
rationalization on supply chain processes has been modelled using a quantitative approach applied
to a real world case. An extensive, ten-month interaction with the business environment and a
refinement process with the logistics and supply chain managers of Luxottica is conducted to collect
the required inputs and to practically implement the solution.
Different markets within the European area and special kinds of customers have been explored. The
business case conducted for United Kingdom and Germany shows limited benefits, whereas the
actual potential of the model becomes clear for Spain, France and Italy. The profitability of this
project is significantly affected by the costs of delivery services and by the characteristics of the
service required by the different customers. The model provides a clear assessment of how and
when a positive return, both in monetary and in service level terms, can be achieved.
This is one attempt to provide a comprehensive analysis of the costs and benefits of a logistics
service rationalization, taking into account all the major factors involved and focusing on a real
world case. The model can be a valid support to large companies willing to improve the service
offered to their customer without incurring in extra costs.

11
EXECUTIVE SUMMARY
THE PROBLEM
Luxottica Group is a leader in premium, luxury and sports eyewear with over 7,000 optical and sun
retail stores in North America, Asia-Pacific, China, South Africa, Latin America and Europe, and a
strong, well-balanced brand portfolio which includes about the 70% of the world’s most known
brands. In addition to a global wholesale network involving 130 different countries, the Group
manages leading retail chains in major markets. In 2014 Luxottica Group posted net sales of more
than € 7.6 billion confirming its dominant position in the eyewear industry. The solidity of the
Group is additionally boosted by its completely vertically integrated business model and by its
focus on product and service quality. The almost absence of threatening close competitors gives the
Company the possibility to shift the focus from the competition against rivals to the performance
toward its customers, which are generally provided with an excellent service level. Actually the
performance of Luxottica in terms of service provided to its clients sometimes might result even
over-estimated in respect to what perceived as essential: the Company, through a world-class
logistics network, is used to succeed in delivering goods in a while all around the world and with an
excellent capability to meet its customers’ requests. However, since these performances can be
considered as exceeding expectations, and even since nowadays customers are not always targeted
with customized logistics services, Luxottica believes there is still room for improvement. In
particular, as things currently stands, the Company generally segments its customers from a
commercial point of view, providing them with ad-hoc assortments and tailor made collections.
Nevertheless, from a logistics viewpoint, the concept of customers’ classes is decoupled from the
actual provision of services and for that reason all clients are served in the shortest possible time
and with highest possible shipping frequency, even though they might accept and willing also less
frequent deliveries. It is thus clear that the cost-to-serve might be studied and then optimized.
RELEVANCE AND COMPLEXITY
The above mentioned problematic regards the entire Luxottica’s network in which customer
satisfaction represents the main pillar for the Company and where the Logistics has the hard tasks to
deliver the right quantity in the right place at the right time. Actually in a so complex and highly
interconnected world as Luxottica’s one is an apparently simple and soft touch in a variable
generally engenders hundreds of small-to-large scale changes that might distress the balance of the
overall business; then this cause and effect relationship is even more exasperated when dealing with
the logistics in the fashion industry, where a late arrival of a frame might cause the impossibility to
launch an event for a well-known brand. This is the reason why the study of the variables affected
12
by a possible service rationalization has to be carefully evaluated and a cross-cutting effort is
needed from all the different teams involved. In addition to the strong degree of complexity given
by the industry-specifics characteristics it is crucial to take into account the cost side that the
logistics machine entails for the entire organization. Nowadays it is reasonable to assume that
logistics related costs account for about the 5% of the annual Company’s turnover (Alicke, 2012),
where this slice of costs can be further split in warehousing and transportation, and the latter
account for more than the 47%2 on the total. Thus the revision of logistics services might impact on
the 2,4% of Luxottica’s spending becoming one of the most relevant actions to be put in place in
order to achieve a sort of cost review and reduction. Additionally, given the recent Luxottica’s
strategy to centralize more and more the stock and thus to serve the customers directly from the
primary distribution centres bypassing the second echelon with direct to customers shipments, the
choice of the right transportation mode will increase year over year its impact, both in terms of
service level and in terms of costs. Finally the research will consider as sample one of the most
promising Luxottica’s business, the so called STARS one, for which the Company has increased its
emphasis over the recent years and has planned a double digit growth for the incoming 5 years
ahead.
OBJECTIVES
The opportunity to revise the logistics services and to introduce a sort of customization for them
could have a strong impact on both costs rationalization and service level, driving toward a higher
customer satisfaction, a better consciousness on costs and a superior warehouse planning.
Therefore, the main objective of this study is to develop a model enabling firms involved in the
business-to-business markets to increase the effectiveness and the efficiency of their physical
distribution system. Nevertheless, given the double-side of the study, characterized by a literature
review and by an on-field experience, the achievement of this objective naturally engenders the
needs to:
Analyse the scientific journals and papers in order to appraise the evolution of the whole
research production;
Analyse, through an on-field experience, how the eyewear industry leader Luxottica is
coping with these themes;
Once the objective related to the development of the above mentioned model would be achieved its
validity will be proved by applying its rules to a particular and narrow set of customers.
Subsequently, if results would be promising, Luxottica’s objective is to apply it on a broader set of
customers.

13
METHODOLOGY
The way toward the achievement of the research objectives consists in a step-by-step analysis made
of five either sequential or parallel macro-phases linked each other by input-output relationships.
Some macro-phases are then composed by different sub-phases, linked to input-output relationships
as well. The main phases taken into consideration are reported here below:
Environment and business comprehension and mapping is considered to be the backbone of the
whole study: throughout this phase the general rules behind Luxottica’s business model have been
discovered and comprehended, and a precious set of embedded knowledge has emerged and pointed
out.
As soon as the awareness of the environment has been achieved the study moved to the next phase
where two parallel themes are have been exanimated on details. On one hand STARS trade channel,
given its prominence for Luxottica, has been deep dived; on the other hand an assessment of the
existing literature has been performed. Precisely the strategic relevance of STARS business model
is nowadays well supported by the corporate strategy that has decided to serve these opticians with
the highest possible priority: this is the reason why, in addition to a general comprehension of the
environment also a deep dive on this particular business model has been carried out. Then the
literature review consisted in the all-round appraisal of the contributions related to the main topics
touched within the study: the systematic examination of the published papers has allowed
accumulating precious knowledge about the research themes and making the point about the state of
the art in the field of research. The literature review has also helped to point out what are the main
gaps between the best performing institutions and the Company under examination. Moreover this
first step has acted as a fly-wheel for collecting new ideas and for sharpening the objectives of the
research. The literature review exploited the large number of articles collected in the academic
journals, the great variety of papers published by scholars and industry experts, and in less part,
academic thesis, and books. During this phase of the dissertation, 52 papers have been reviewed.
Particularly, the papers research followed different streams, each of them more or less concatenated
to the main topic of the study.
Figure 1 – Macro phases composing the methodology analysis

14
Once a precise and well-comprehensive awareness of the theoretical frameworks and of the
practical world as well has been achieved the analysis phase has started. It is subdivided in three
main steps:
The AS IS scenario analysis, through which the actual way in which business was conducted
has been highlighted;
Insights for improvement, through which the possible main improvements to reinforce and
enhance the business have been pointed out;
The TO BE scenario, though which the effects of the improvements have been
hypothesized;
In order to get a comprehensive and all-round picture of the current scenario encompassing all the
different aspects the involvement of the most disparate business functions has been required. More
in details Transportation and Customer Service Teams have interacted closely with the aim to
provide a structured and well comprehensible framework on how the business has been actually
working and what would have been the most relevant actions to be taken in order to improve it.
Logistics Supply and Purchasing Department has been involved in order to provide support in terms
of tariff requirements and supplier negotiation, and finally Sales and Planning, the owners of the
business, have been requested to validate the analysis. On top of Luxottica’s Logistics corporate
teams a special consideration has been granted to the Subsidiaries, which, as a matter of fact, have a
great sensitivity on customers’ needs and perceptions.
During the analysis of the AS IS scenario a critique and reviewing approach has been implemented:
thorough the interactions with the different teams there has been the possibility to collect some
clues that represented then the fundamental pillars for the possible improvements. Every variable
that was considered not fully and optimally operational within the AS IS scenario has been widely
discussed and enhanced. This continuous deep dive has been supported by a twofold trial-and-error
process: the choices on how to improve the current set-up have been firstly looked and discussed
with the Logistics Customers Service team that during the whole duration of the project has acted as
a link between Transportation and STARS Planning, in a weekly review. Starting from the needs of
the business, Transportation Team had proposed a new classification of STARS customers parallel
to the one already identified and still utilized by the Sales and Commercial Team. Even though the
creation of an additional way of clustering customers can be intended as a way to increase the
management complexity of customers, it allows to decouple Sales and Commercial scope, such as
assortments and brands selection, from Logistics scope, such as service level and service cost. In
parallel a model to define the optimal Order To Delivery Lead Time theoretically achievable by
working on the picking and shipping days has been created. This model takes into consideration the

15
delivery lead time agreed with forwarders and couriers and the number of times a customer should
be served, and gives as output the optimal days in which to ship and the related Order To Delivery
Lead Time. Afterward the above mentioned model has been coupled with the previously defined
classes and the mock-up has been fine-tuned and then revised together with the business owners.
The continuous interaction between Transportation and STARS planners has been fundamental in
order to understand which services the market was expecting and what were the fundamental needs
of the customers. In addition a careful evaluation of costs has been performed in order to see how
the expenditure would have been changed and if glimmers for cost saving would have been arose.
As soon as the model has been set up the Logistics Customer Service Team devoted to the
management of STARS customers had effectively implemented the outcome through the
Company’s ERP. The change from the old model to the new one has been performed after the peak
period in order not to complicate the management of the trade channel with the risk to throw the
business out of balance in the high season. Additionally the first tests have been carried out for a
sample of countries within the ones analysed in that research project: this had allowed
understanding the goodness of the results of the model.
The profitability of the model has not been widely assessed due to the lack of actual data available,
but the conditions to make the model applicable and profitable for other countries have been
pointed out.
EXPECTED RESULTS
The project is expected to produce a tangible effect in the long term, and in particular it can steer
Luxottica’s Logistics toward either a customer service improvement at the as-is costs, or an overall
cost-to-serve frontier reduction at the as-is customer service.
The outcome would strongly depend on business needs, however, irrespectively from what will be
requested from the market, it is reasonable to expect that all the leverages that could be touched
without neither increase the complexity of the network nor involve extra costs will be touched. For
instance if there would be room for improvement on the actual shipping calendar, improvements
will be re-arranged in order to secure the shorter Order To Delivery possible with the actual
network set-up. Then according to what the business would require, in respect to the AS IS
scenario, it is reasonable to assume that a service improvement would be agreed mainly to the high-
end part of the customers, while the service would be rationalized for the low end ones. The extra
cost for the further service will be realistically offset by the savings achievable from the
rationalization in the bottom part of the market.

16
1. THE EYEWEAR INDUSTRY
The global eyewear market consists of prescription glasses, sunglasses, lenses, contact lenses and
ready-readers and it accounted for about $96 billion in 2015 (Global Market Insights Inc., 2016). It
has increased with a healthy growth rate over the years and it is expected to increase further during
the next five years were it has been estimated to reach about $140 billion by 2020 (Mellery-Pratt,
2015). From a geographical perspective, in 2014, North America eyewear market share accounted
for over 30%3 of the volume and revenue share. The spur can be attributed to rising demand for
plan sunglasses along with increasing consciousness regarding eye examination across the region.
Asia Pacific eyewear market size was over 20% in 2014 in terms of revenue (Global Market
Insights, 2016). Rapidly increasing wearer base is likely to drive consumption in the incoming
years. Europe eyewear market size amounted to over 35%3 of the global revenue in 2014 (Global
Market Insights, 2016), primarily due to high average selling prices and the presence of key
participants in the region. Finally Latin America, driven by Brazil is expected to witness steady
gains over the next years. The global eyewear market is fragmented due to the presence of a few
international and many local players operating in the market. The largest international vendors are
headquartered in Europe, especially Italy, while few others are based in US. Every one of these
vendors has an extensive product and brand portfolio and an online presence as well as retail chains,
which are a must to be able to compete in this industry. The market is supported by various growth
drivers, such as aging population, urbanization, rise of middle income, increasing number of people
requiring vision correction and use of eyewear as a fashion statement.
In the following paragraphs the eyewear industry will be introduced with respect to its production
and players; additionally its evolution and development over years will be pointed out. Once an all-
round general perspective will become clear a deep dive about the political, economic, social,
technological and legal external aspects will be carried out as well as a further disquisition of the
main internal forces that are shaping the industry. Finally the main trends that will drive the
industry for the incoming years will be briefly discussed.
1.1 THE PRODUCT
The eyewear market can be segregated into Plano Sunglasses, Spectacles, and Contact Lenses. The
spectacles segment dominates the global eyewear market in terms of revenue and is expected to
grow at a CAGR of close to 7% during the next four years (Technavio, 2016).

17
PLANO SUNGLASSES
Plano sunglasses are defined as sunglasses that are fitted with non-prescription lenses, and thus are
not used for vision correction. They are mainly used for aesthetic purposes and for protecting the
eyes against harmful ultraviolet (UV) rays. In recent years scientific studies has shown that
exposure of the eyes to UV rays over a period of time makes them susceptible to developing a
cataract and may also cause damage to the retina and, according to the American Optometric
Association, these risks can be combated by wearing sunglasses with high eye protection factor
(EPF). Therefore, growing awareness among the general population regarding the importance of
protecting the eyes is the key driving force for the market.
Plano Sunglasses market is further segmented on the basis of product and material. On the basis of
product it can be sub-segmented into non-polarized and polarized sunglasses, while based on
material it can be differentiated into CR-39, polycarbonate, polyurethane and glass.
Normal non-polarized sunglass lenses only help in reducing the amount of visible light entering the
eye, while polarized sunglasses are used also for improving visual acuity and enhancing vision.
Actually using vertically aligned filters, unwanted horizontally polarized light is blocked and useful
vertical light is allowed to enter through to the eye. Polarizing lenses are manufactured using
techniques such as vacuum forming, injection moulding, and casting and they are quite expensive if
compared with non-polarized ones. On the other hand lens materials include CR-39 or allyl di-
glycol carbonate (ADC), polycarbonate, polyurethane, and others such as glass and nylon. CR-39 is
the most commonly used material, primarily on account of its durability and cost effectiveness and
accounts for almost half of market share in the plane sunglasses market. Polycarbonate lenses
provide superior impact resistance and are lightweight; however, they suffer from drawbacks
including lower scratch resistance and reduced optical clarity as compared to other materials.
Finally, despite glass lenses provide the highest optical clarity and scratch resistance, they are more
expensive and are not very impact resistant.
SPECATCLES
Spectacles, or corrective lenses, are used to correct refractive errors by bending the light entering
the eye in order to alleviate the effects of conditions such as near-sightedness
(myopia), farsightedness (hypermetropia) or astigmatism. Another common condition in patients
over forty years old is presbyopia, which is caused by the eye's crystalline lens losing elasticity,
progressively reducing the ability of the lens to accommodate (i.e. to focus on objects close to the
eye). Corrective lenses are made to conform to the prescription of an ophthalmologist or optometrist

18
and they are typically segregated into Spectacle Frames, Spectacle Lenses, Ready-Made Reading
Glasses and Sunglasses.
CONTACT LENSES
A contact lens, or simply contact or CL, is a thin lens placed directly on the surface of the eye. CLs
are considered medical devices and can be worn to correct vision, or for cosmetic or therapeutic
reasons. They offer a variety of benefits over their traditional counterparts. Advantages associated
with the daily disposable modality include lesser time for building up deposits, no need for
cleaning, and elimination of care solutions. When compared with spectacles, CLs typically provide
better peripheral vision, and do not collect moisture (from rain, snow, condensation etc.) or
perspiration; this makes them ideal for sports and other outdoor activities. Market categorization on
the basis of product includes contact, Rigid Gas Permeable (RGP) or Gas Permeable (GP), soft, and
hybrid lenses. RGP or GP lenses are custom-made from a rigid oxygen-permeable material and are
more resistant to proteins and other deposits, making them easy to keep clean. Also, GP and RGP
lenses tend to last much longer than soft contacts, reducing lens replacement costs. On the other
hand soft lenses offer several advantages over their RGP counterparts such as greater comfort and
flexibility. They also permit more oxygen to pass through to the wearer’s cornea and are used
extensively for ametropic correction.
OTHERS
In addition to the standard above mentioned products a specialized branch of the eyewear industry
is also involved in the production of safety frames, worn to protect the eyes during a variety of
tasks. They are made with shatter-resistant plastic lenses to protect the eye from flying debris and
can shield the eyes from hazardous splatters such as blood or chemicals. There are also safety
glasses for welding, while nylon frames are usually used for protection eyewear for sports because
of their lightweight and flexible properties. Additionally, with the technological development
occurred in the last years 3D glasses have been developed as well. Actually 3D glasses create the
illusion of three dimensions by filtering a signal containing information for both eyes. The signal,
often light reflected off a movie screen or emitted from an electronic display, is filtered so that each
eye receives a slightly different image. The filters only work for the type of signal they were
designed for. Glasses can also provide magnification that is useful for people with vision
impairments or specific occupational demands. An example would be bioptics or bioptic telescopes
which have small telescopes mounted on, in, or behind their regular lenses. Newer designs use
smaller lightweight telescopes, which can be embedded into the corrective glass and improve

19
aesthetic appearance (mini telescopic spectacles). They may take the form of self-contained glasses
that resemble goggles or binoculars, or may be attached to existing glasses.
1.2 THE PLAYERS
From a first insight one could believe that eyewear industry’s players are the companies that
produce, and in some cases, retail glasses and sunglasses. However this is only partially true.
Actually eyewear companies on one side play the role of glasses producers and retailers, on the
other side, almost all, can be also considered as firms operating in the luxury industry, and finally
some of them are also involved in the manufacturing of optical lenses as well. This implies that the
set of players operating in the eyewear industry has a double face: on one hand there are “standard”
competitors (firm that produce and sell similar product) and on the other hand comparable (firm that
face similar economic conditions) play a relevant role.
Taking into consideration the mere process of sun and prescription frames production and retailing
Luxottica, Safilo, Marcolin, De Rigo and Marchon are the top players in the industry. In particular
Luxottica Group S.p.A, founded in 1961 in Agordo (Belluno, Italy) by Leonardo Del Vecchio, is
the undisputable market leader in the eyewear design, manufacturing, wholesaling and retailing, and
owning the most famous eyewear brands, such as RayBan, Oakley, Chanel, Prada and Burberry it is
the biggest player in the whole industry.
Safilo Group S.p.A. is Luxottica’s “rival” and the second worldwide eyewear maker and marketer.
It was founded in 1934 by the Tabacchi family, in Italy. Over years has grown to become a world
leader in creation, production and distribution of eyeglasses, sunglasses, sport glasses, ski masks
and ski helmets, and nowadays it retails cover 39 countries. The Company can count on its brands
and licensed labels portfolio that includes Carrera, Polaroid, Marc Jacobs and many others and one
of the biggest chain store it owns is Solstice, which covers the U.S. market,
De Rigo S.p.A. is behind Luxottica Group and Safilo Group and among the brands it owns there are
Sting, Police and Lozza. Additionally its licensed labels include Fendi, Pirelli and Fila and the
Company’s retail network is built around General Optica with more than 200 stores around the
world.
Marcolin S.p.A. is a small but dynamic player in the eyewear industry and it produces labels such
as Ferrari, Mont Blanc and Tom Ford and sells its products through a retail network based on
outlets in about eighty different countries. The Company operates also in the sport sector through its
subsidiary Cébé producing ski goggles and sports eyewear and it belongs to Della Valle family,
which owns a 40% of it, and Marcolin family which founded the company in 1961.

20
Finally, besides the four main Italian players there is the US based Marchon Eyewear, which was
founded in 1983 and now among its licensed brands it can count Calvin Klein and Nike. The
company has its headquarters in New York, along with offices in 18 other countries, with
manufacturing in Italy, Japan, and China.
Enlarging the boundaries of the industry and taking thus into account also lenses and contact lenses
manufacturers and retailers Essilor, Formosa Optical, St. Shine and Fielmann can be considered the
main actors in the competitive arena.
Essilor International S.A. is a French company, engaged in the design and manufacture of lenses,
under the Varilux, Crizal, Essilor and Definity brands, for all types of visual disorders including
myopia, hypermetropia, presbyopia, and stigmatism. The company also engages in the manufacture
and sale of optical instruments, which are mainly machines used to edge finished lenses and
diagnose visual disorders. Essilor has a strategy of acquisition, across and along the value chain of
glasses, of lens manufacturers, wholesalers and laboratories across its key markets. Essilor has the
number one market share in almost all of the markets it operates in and in 2010 it has made a joint
venture with Luxottica for the laboratory Eyebiz in Australia.
Formosa Optical is the world’s largest Chinese optical technology group and the biggest
glasses/contact lenses distributor in Taiwan. Formosa principal operative core is customer service,
well known as "honest service”, a gift provided by the group that is a concrete idea of professional
optical services accompanied with reasonable prices and quality of products, which has gained
belief over years. This service provides customers with three guarantees which are "quality,
technology and satisfaction". Formosa Optical is gaining various national certificates to strengthen
its brand values and aim to join the world market in the future and become one of world's top three
optical companies.
St. Shine was established in 1986 and listed in 2004. St. Shine is the fifth largest contact lens maker
in the world, and specializes in manufacturing cast-moulding soft contact lens, including disposable
and frequent replacement contact lens. St. Shine generated nearly 50% of revenue from Asia and it
has a strong position in Japan, which is the second largest single contact lens market. Company’s
products are less expensive and have a wider range of specialty products such as ring colour lens
and cosmetic lens.
Fielmann was established in 1972 and with its 664 subsidiaries the Company is a leader in the
German market (and the largest optical chain in Europe with branches in Austria, Switzerland,
Poland, Luxembourg and the Netherlands. Fielmann designs, develops and produces lenses and
frames, sunglasses and contact lenses, which are distributed via own Fielmann stores; it also offers

21
hearing aids via a shop-in-shop concept and, in particular, it is known for having signed the first
deal with a public health insurance in 1981. Thus, it is classified as a producer, broker and service
provider and it covers the entire chain in the optical industry. Anyway, the key element among these
different activities is the supply of competitively priced lenses, giving the customer the opportunity
to choose among a wide range of products.
1.3 THE HISTORY
Even though nowadays glasses and sunglasses are one of the most diffused stuffs in the world, their
history and development is still something foggy. Actually there is no precise documentation stating
an univocal moment in which glasses had become to be part of humans’ life. On the other hand
nowadays it is quite immediate to understand the importance and the value that eyewear stuff has
for humans.
BEGINNING AND EVOLUTION OF A GLOBAL INDUSTRY
Worldwide it is believed that optics began with the development of lenses by the ancient Egyptians
and Mesopotamians, followed by theories on light and vision developed by ancient Greek
philosophers, and the development of geometrical optics in
the Greco-Roman world. The word optics is derived from
the Greek term τα ὀπτικά meaning "appearance, look".
Optics was significantly reformed by the developments in
the medieval Islamic world, such as the beginnings of
physical and physiological optics, and then significantly
advanced in early modern Europe, where diffractive optics
began. For instance the 13th century Venetians glass
blowers are known to have produced reading stones made of
solid glass that was put into hand-held, single lens-type
frames made of horn or wood: these reading stones were
similar to hand-held magnifying lenses of today.
Additionally the oldest known pictorial representation of
eyeglasses is a fresco in the Chapter House of the
Dominican Monastery attached to the Basilica of San
Niccolò in Treviso. It was painted by Tommaso da Modena
(1325-1379) in 1352 and shows Cardinal Hugh of Provence (1200-63) wearing a pair of rivet
spectacles.
Figure 2 – Tommaso da Modena, Cardinal
Nicholas of Ruen, 1351-52

22
Additionally the 15th century has marked a crucial time in the development of spectacles. By the
time of Johann Gutenberg’s invention of the printing press around 1450, glasses were already used
by artisans as well as monks and other religious scholars. Then once books were made available to
everyone, the demand and subsequent popularity of spectacles rose dramatically: the early
spectacles were full of charm and rapidly became a symbol of wisdom and learning. The first
rational application of glasses can be attributed to Francisco Donders, a Dutch ophthalmologist
which has been the first to prescribe a pair of lenses with power correction corresponding to the
visual defect. Finally the first step of glasses industrialization began in 1877 in Italy, where Angelo
Frescura together with his brother and Giovanni Lozza founded the first glasses factory in Calalzo
di Cadore, the centre of gravity of the modern eyewear district.
THE EYEWEAR INDUSTRY TODAY
Even though the evolution of lenses and spectacles has dealt with most world’s regions nowadays
approximately the 50% of the global production of glasses and eyewear stuffs is carried out in Italy.
Actually in 2015 more than 860 companies (about 650 handcrafters, 206 small-medium enterprises
and 4 global leaders) with about 16.000 people employed, where focused on setting the rules for the
whole global market (ANFAO, 2015). According to the ANFAO (Associazione Nazionale
Fabbricanti Articoli Ottici, an association that groups most of the Italian companies operating in the
eyewear industry) Italy possesses more than 70% of market share in the luxury eyewear segment
and the 50% of market share in the production of licensed brands, and in that country the eyewear
market accounts for $2.9 billion of production, $2,8 billions of export, $0.1 billion of import and
0.1 billion of domestic market5.
Within the internal Italian market the 80% of production and turnover comes from the territories
near Belluno, which consists in the Italian eyewear industrial district. Actually, in accordance with
current legislation, the Veneto Region identifies 47 municipalities which define the eyewear
district: 45 are located in the Province of Belluno and the remainder two in the Province of Treviso.
The term “districts” appears to have been first used by Alfred Marshall in his The Principles of
Economics (1890), which describes them as a territorial concentration of numerous (small)
enterprises characterized by high vertical and horizontal specialization, a dense network of social
and economic, competitive and co-operative relations in which the exchange of commercial and
technical information including any innovations is prompt but informal. Marshall ascribes their
competitive advantage to the presence of external economies (i.e. economies linked to the
environment in which the enterprise operates). These include faster dissemination of new ideas,

23
experience and know how thanks to geo- graphical propinquity, cultural homogeneity, common
manufacturing traditions, reduced cost of transport (and of transactions in general), and the easier
access to complementary services or capabilities. Within the study of economics, the term has
evolved and now implies the ways in which economic specialization arises through clustering in a
particular industry-zoned urban area. Since the 1980s, the term has become connoted with an
important element of dynamic industrial development in Northern Italy, where after the Second
World War clusters of small and medium-sized enterprises (SME) experienced strong growth.
Industrial districts in Northern Italy have a coherent location and a narrow specialization profile,
e.g. Prato in woollen fabric, Sassuolo in ceramic tiles, Brenta in ladies' footwear and Belluno in
glasses.
Basically the first factories producing glasses and sunglasses were born in Belluno in the late 1800s
by developing the field until getting to over 1000 factories in the territory at the end of last century.
The complexity of the system has counted on one side on the spread over the territory of many
medium-sized enterprises, or even micro enterprises that have scored above the front of third-party
work and sub-provision and, on the other side, on the rapid emergence of companies which soon
took a characterization of large firms being able to establish their selves as a leader in the
international market. According to Bramanti, in his “Enciclopedia delle economie territoriali” the
main aspects that over years concurred to the creation of a strong competitive advantage in the
eyewear industry in the territories near Belluno are:
The presence of natural resources, such as the hydroelectric power and the low cost manpower, that
have widely offset the potential disadvantages coming from the uncomfortable geographical
position of the district;
The tacit knowledge accumulation that over years has allowed the companies located in the district
to create an unique and inimitable know-how;
Given these two sources of competitive advantage the district of Belluno has had a continuous
growth until 1996 reaching a share of world production by about 50% concentrated in high-end and
mid-high end range. However in the early ‘00s, it felt down in a general downturn: the crisis was
primarily determined by the entry of new competitors, especially from the Asian markets, who, with
their products at low cost, have posed a threat to many businesses. The crisis is still not going
through Chinese competitors that, in addition to offer a low cost product, can also ensure a
sufficient quality to overcome competitors. One of the most evident consequences of the crisis was
the increased selection of companies: only the competitive ones have remained.
24
Actually within the Belluno’s eyewear cluster one can note a characteristic feature which experts
call “two-speed district”: from one side it is possible to note the big firms which, with greater
vertical integration and greater economies of scale, have managed to cope better with the crisis, not
varying much their profits. On the other side there are many small and medium enterprises which,
for the lack of adequate resources, have failed to successfully withstand the crisis. Larger
companies such as Luxottica, Safilo, De Rigo, and Marcolin are those which, thanks to increased
economic and financial resources, are likely to introduce themselves into a global market, also by
doing acquisitions and joint ventures with foreign companies.
1.4 INDUSTRY’S EXTERNAL CONTEXT
The following analysis aims at investigate the political/legal, economic, social and technological
variables that might somehow influence the eyewear industry and the companies operating in the
eyewear sector.
POLITICAL/LEGAL
Political and legal influences and behaviours are somehow quite difficult to assess given the
vastness of the industry and its worldwide coverage. However, what can indisputably pointed out is
that at least some firms operating in this industry, hold by the big Luxottica and Essilor, seems
willing to pursue a “monopoly looking strategy”. Actually it is common knowledge that Luxottica
owns over the 80% of the world’s major eyewear brands and that Essilor is not far to achieve the
highest possible market share. If from one side these circumstances result from the leading capacity
of the firms and are generally associated to a year-by-year increase of quality of outputs and labour
productivity, on the other hand these companies might enter in contrast with the laws regarding
competition matters around the world. For instance, in the USA, the “United States Antitrust Law”
is made by combining different Acts: the “Section 1” of the Sherman Act, 1890, declares illegal
every contract, in the form of trust or otherwise, or conspiracy, in restraint of trade or commerce
among the several States, or with foreign nations. Additionally the “Section 2” prohibits
monopolies, or attempts and conspiracies to monopolize. Since the Sherman Act promoted the
greatest wage of mergers ever, it has been later on improved by the Clayton Act, which specifically
prohibited exclusive dealing agreements and mergers achieved by purchasing financial stock. In
Europe, the “European Union Competition Law” is found in the “Treaty of Lisbon” which makes
illegal any anticompetitive agreement such as price fixing, dominant position and price
discrimination. It also allows the European Council to govern any merger between firms through

25
specific regulations. It seems the industry’s leading companies are almost close to violate these
rules and laws.
Taking into consideration, on the other hand, the political matters the industry and its main players
seems to be in a comfortable position. Actually it is proved that the majority of revenues are
collected from trade blocks, such US and EU, that are characterized by stability and that are far to
suffer from deep disruptions and internal conflicts. Additionally trade restrictions and tax policies
unexpected modification among these areas are not likely to be put in place. With regard to the big
emerging (China, India, Brazil, Mexico, Turkey) the political situation seems to be less stable rather
than in the US or EU but it is far to be believed against the business. Finally the portion of revenues
and the presence of the business in the mature emerging (Singapore, Hong Kong, Malaysia,
Argentina, Chile) and in the new emerging (Thailand, Vietnam, Indonesia, Colombia, Peru,
Ecuador) are still limited, pooling down the possible effects of political disorders with respect to the
overall business.
ECONOMIC
“Despite the cooling of the overall global luxury market, the outlook for sunglasses and eyewear,
especially in emerging and developing markets, including South America and Asia, looks
bright.”
GoskaKafel, Marketline.
Since 2008 the financial crisis and a fall of consumption affected mostly every developed country,
but it is also true that the global eyewear industry operating among five continents has been
supported by places like South Eastern Asia, Brazil, China and India that had preserved (even
though slower than before, due to the strictly influence of trades with the West) a growing GDP.
More in particular, in the advanced countries, while purchasing activity for general retail goods is
up sharply from 2009-2011 levels, purchasing activity for the optical industry is only up moderately
in response to the recent improvements in the economies. On the bright side, while the number of
people increasing their purchases of optical goods and services has only increased slightly over the
past year in response to changes in the economy, the number of people decreasing their purchases
of optical products declined and it is at its lowest level since the beginning of “The Great
Recession”.

26
SOCIAL
“More affordable than a decent watch, less ostentatious than jewellery: come the summer months, a
pair of cool sunglasses are the swimtrunksuited man’s best friend[...].”
Bill Prince, Financial Times.
The market of shades represents nowadays a rentable sector, due to its unlimited potential market,
divided in several segments according to each demographic variable (gender, age, nationality, etc.).
Furthermore one does not have to forget the emerging markets in South-Eastern Asia and South
America grown up with globalized trends promoted by fashion lobbies, which aims at the middle
income classes growing with occidental tastes and perception. All over the world sunglasses are
thought to be “in” and “cool”, especially for teenagers. That is why people are willing to pay more
for them. Movies like Top Gun have enhanced the perception of sunglasses in a lot of people’s
mind and during the eighties Ray Ban’s products were the most wanted on the market because VIPs
used to wear them. Nowadays someone who wears sunglasses looks more attractive, richer or
younger. Sunglasses, and normal spectacles as well, have become more than a way to protect one’s
eyes from the UV rays, they are worn to be giving a better, cooler look. Following this path,
eyewear producers came up with lots of varieties, different colours and frames. The latest fashion
points out the direction and eyewear producers make their way through customers’ needs and
desires.
TECHNOLOGICAL
Recently it has been shown a very large variety of innovation such as smartphones, smart TVs and
smart PC software. The acronym S.M.A.R.T means Self-Monitoring Analysis and Reporting
Technology and it also refers to the way in which new products are thought and built nowadays,
according to a high technology growing rate. The eyewear market keeps in touch with technology
and Google is developing Google Glasses: “Google announced that they will be releasing goggles
which run on the Android operating system. These goggles or smart glasses will have the ability to
augment reality. This means these glasses can duplicate the surrounding environment of the user
into a computer.” (Smartglasses.com, 2016). When products like Goggle Glasses will be available
to be produced the eyewear companies will have to consider them some sort of substitutive product
and their strategy would be either to stay out of this completely new segment or to step in and come
to an agreement with Google. It is safely assumable that companies such as Google do not have the
knowledge to produce a suitable, comfortable and well-designed frame for its Google Glasses and
eyewear players, such as Luxottica, could be the proper partner to commercialize and launch them

27
on the global market. Additionally nowadays choosing the right lenses is up to a medical analysis
but even who has no need of wearing glasses gets the opportunity of having a pair. Indeed, there are
lenses able to filter the light and protect eyes, lenses that get darker as the sunlight becomes more
aggressive and lenses that can help eyes resting while reading. Last but not least, the materials used
to build the frame are changed in order to reach better results in terms of duration, comfortability
and ecology. Plastic frames are made of Xylonite, which is very lightweight and has a large variety
of layered colours, or Nylon, which happens to be really strong and lightweight. Metal frames
(titanium or beryllium) are also very common between customers’ choices for they are lightweight,
strong and corrosion resistant.
1.5 INDUSTRY’S INTERNAL CONTEXT
The internal context of an industry and its inner level of competition, and thus its profitability, can
be investigated through the analysis of the so-called “Porter’s Five Competitive Forces”. These
forces are drivers that determine in the long run the industry’s and companies’ possibilities under a
certain competitive pressure. The particular influence of each of these five forces changes in
accordance to the business structure and the economic and technical characteristics of the sector.
More in particular three out of five forces (current competition, potential competition and
substitutive products) can be seen as “horizontal” since they take place at focus company’s level,
while the remainder two (bargaining power of customers and bargaining power of suppliers) can be
considered as “vertical” since they act on the focus company’s Supply Chain.
CURRENT COMPETITION
As highlighted in the paragraph 3.3 the eyewear industry is wider than what could appear from a
first insight. It results that the potential competition might come from different sources and may be
driven by different aspects. However it is also true that eyewear players’ missions generally deal
especially with the production and the distribution of sun and prescription eyewear of high technical
and stylistic quality rather than the production of lenses or low-end style frames. As a consequence
it is possible to partially narrow the focus down and consider as competitors only the companies
that operate in the high end market, design and produce frames rather than lenses and have their
own retailers. It results that Luxottica Group S.p.A., De Rigo S.p.A., Safilo Group S.p.A. and
Marcolin S.p.A. are the set of companies in direct competition among each others. All of these have
high installed capacity to be producing large volumes and keeping the costs low, plus almost all are
vertically integrated (they produce, store, transport, wholesale and retail). This, together with the
fact that there are only a few real current competitors in the whole market, throws the basis for an

28
oligopoly market form. Oligopolists are able to accord on prices and many other things that can
reduce the competition and lead to higher costs for customers. This could be the reason why luxury
sunglasses cost so much and it might become a serious threat for buyers. Furthermore they all came
from the same region, Veneto, on the northeast of Italy, which can be considered as a Porterian
cluster in the eyewear industry. On the other hand the relative size of the above mentioned
companies is quite different: Luxottica’s critical mass greatly exceeds the others’ one resulting in a
market dominated by a major firm that is followed by a set of three to four additional strong
players.
POTENTIAL COMPETITION
An attractive market usually has high entry barriers and a few competitors. This is the first aspect to
analyse in the eyewear market: entry barriers. A potential competitor may find this market very
profitable since margins tend to be high when producing and selling sunglasses and spectacles but,
on the other hand there are running companies like Luxottica Group and its competitors. These
companies exploit scale economies, achieved thanks to a worldwide operating industry, and a
position of advantage on experience curves, gained due to a several years experience in this sector.
It is rather impossible for a new entry to compete with such companies in a short-medium range.
Luxottica owns many firms and producers, plus it has the largest retail network in the market and it
should not be forgotten that it has been working for around fifty years now. A potential competitor
that would prove its strength and knowledge by opening a door for itself in the eyewear market
would be bought by Luxottica Group as soon as it shows like a menace (as far as it is not a
“diversification venture” of another big firm). In conclusion, this is a high profit margin market
with a few current competitors but it is real tough to go through its entry barriers and properly
compete.
SUBSTITUTIVE PRODUCTS
As far as the eyewear market goes there are no real substitutive product menaces, apart from
refractive optical surgery and contact lenses (business Luxottica and few other players already
operates in). Prescription glasses and sunglasses are much differentiated and the global market
opportunities are growing fast but there is no substitutive product able to replace them so far. There
are people who need spectacles for they can’t see properly and people who want to wear sunglasses
for many reasons, but there is no demand for any other product different enough to be considered a
substitute for glasses.

29
BARGAINING POWER OF SUPPLIERS
Given most eyewear companies’ business model characterized by a strong vertical integration the
role of suppliers can be considered as marginal. It is true that these companies need to find excellent
raw material and/or components producers or service providers (for instance in Logistics) but it is
also true that their dimensions and production volumes are generally too huge to let suppliers have
room for bargaining. Additionally the degree of customization of components and services, apart
from few occasions, can be considered as not so vast and this creates the opportunity for eyewear
players to preserve a quite large supplier base helping them in keeping a strong bargaining power
during negotiations.
BARGAINING POWER OF BUYERS
The bargaining power of buyers is really low in this market. First of all the product is highly
differentiated: the firm or licensed label on it plays a key role in its price definition. Main eyewear
brands are owned by four/five producers, which rise their bargaining power to the buyers’
detriment. This is true especially in the B2B market: single opticians and optical chains are required
to deal with few players in order to hold on their store an attractive showcase and portfolio of
brands. Furthermore, to generate consistent sales volume, they must have in stock the most popular
brands; however these brands are licensed or directly owned by one single player at a time reducing
thus buyers’ bargaining power. Last but not least, these companies have their own retail networks,
another variable which brings up the prices and reduces B2B buyers’ bargaining power.
1.6 FUTURE TRENDS
The global eyewear industry growth is expected to intensify during the next years and it has been
estimated to reach about $140 billion by 2020. Actually it is expected that the eyewear market will
benefit not only from increased awareness of the dangers of UV exposure but also from frames and
sunglasses being increasingly perceived as fashion products. Additionally in the developed
countries high growth opportunities are expected for the eyewear market due to: aging population
(eyesight deterioration) that requires people to buy lenses with high value added (e.g. progressive
lenses); changes in lifestyle that deteriorates the sight (e.g. increasing computer use) or necessitate
new technologies in sport (e.g. polarized lenses) or new technologies in general (e.g. 3D glasses).
Moreover, consumers, especially the younger generation, are likely to try out new products as long
as they provide real added value and contribute to their quality of life; and, with a higher percentage
of population being able to afford luxury goods, increasing disposable income is a major driving

30
force for the expansion of the eyewear market And then there is the digital opportunity. Due to the
product's small size and one-size-fits-all model, eyewear is well-suited to digital retail, creating
further opportunity for growth. For instance Luxottica has acquired in 2014 Glasses.com, an
advanced digital environment with a proprietary virtual try-on technology: the technology, that uses
a 3-dimensional image of the consumer’s face, allows the consumer itself to try glasses with real
likeness enabling to see how the frame fits the face features in detail from multiple angles. In
addition, in the same year, Luxottica again has built the Ray-Ban digital sales platform. Tapping
into the current consumer trend for customisation, the platform allows consumers to choose any
combination of lens, frame style and colour. The Company has seen that service has been doubling
year-on-year, starting from a relatively low base and small numbers, but it is developed enough to
understand the potential of that channel. In the future years additional technological improvements
are expected by all the major competitors creating the possibilities for a kind of revolution in the
industry.
In addition to the main trends that might take place at the market level, the industry may be shaken
by a new entrant: Kering. The current size of the Kering brands’ business is roughly €350 million,
making the Company one of the top five players in the industry. Kering has planned to fully control
the eyewear value chain, from design to product development and supply chain, and from branding
and marketing to sales. However it is true that its scale is significantly smaller than that Luxottica’s
and Safilo’s ones and that, at least in the short-medium term, the Company will operate at a
commercial and distribution cost disadvantage versus the others. Indeed, although Kering has a
global network of stores (respectively, Gucci and Saint Laurent had 408 and 91 mono-brand points
of sale in 2014), it pales in significance compared to the own-retail network of Luxottica. In the
unlikely event that Luxottica, the largest eyewear retailer in the world, stopped buying Kering
eyewear, Kering would lose key distribution points, especially outside of its own stores in North
America. The question to which Kering should answer is what could a new entrant into the market
offer that will allow that company to enter the market without a return for the people who they are
going to be competing with.
On the other hand, to inhibit market growth there could be the increasing acceptance rate
towards refractive surgeries and treatments: as these methodologies provide a complete alternative
to the usage of corrective eyewear products and require a one-time investment omitting periodic
expenses of eyewear and eye care products the market might suffer from a new and bizarre sort of
substitutive product.

31
2. LUXOTTICA
Luxottica Group is the market leader in the design, manufacture and distribution of fashion, luxury,
sports and performance eyewear. Founded in 1961 by Leonardo Del Vecchio, Luxottica is a
vertically integrated organization whose manufacturing of sun and prescription eyewear is backed
by a wide-reaching wholesale organization and a retail network located mostly in North America,
Latin America and Asia-Pacific. Product design, development and manufacturing take place in
Luxottica’s six production facilities in Italy, three factories in China, one in Brazil and one facility
in the United States devoted to sports and performance eyewear. Luxottica also has a small plant in
India serving the local market. In 2014, the Group’s worldwide production reached approximately
83 million units. Additionally the Group’s wholesale distribution network covers more than 130
countries across five continents and has approximately 50 commercial subsidiaries providing direct
operations in key markets.
2.1 HISTORY
The development of a vertically integrated business model passed through several phases:
INCORPORATION: Luxottica was founded by Leonardo Del Vecchio in 1961. The
Company started out as a small workshop and operated until the end of the 1960s as a
contract producer of dyes, metal components and semi-finished goods for the optical
industry. It gradually widened the range of processes offered until it had an integrated
manufacturing structure capable of producing a finished pair of glasses. In 1971, Luxottica’s
first collection of prescription eyewear was presented at Milan’s MIDO (an international
optics trade fair), marking Luxottica’s definitive transition from contract manufacturer to
independent producer.
EXPANSION IN WHOLESALE DISTRIBUTION: in the early 1970s, the Company sold
its frames exclusively through independent distributors. In 1974, after five years of sustained
development of its manufacturing capacity, it started to pursue a strategy of vertical
integration, with the goal of distributing frames directly to retailers. The first step was the
acquisition of Scarrone S.p.A., which had marketed the Company’s products since 1971
bringing with it a vital knowledge of the Italian eyewear market. Luxottica’s international
expansion began in the 1980s with the acquisition of independent distributors and the
formation of subsidiaries and joint ventures in key markets. Luxottica’s wholesale
distribution expansion focuses on customer differentiation, customized service and new
32
sales channels, such as large department stores, travel retail and e-commerce, as well as
continuous penetration into the emerging markets.
EYEWEAR, A NEW FRONTIER OF FASHION: the acquisition of La Meccanoptica
Leonardo in 1981, the owner of the Sferoflex brand and of an important flexible hinge
patent, enabled the Company to enhance the image and quality of its products and increase
its market share. From the late 1980s, eyeglasses, previously perceived as mere sight-
correcting instruments, began to evolve into “eyewear”. Continual aesthetic focus on
everyday objects and designers’ interest in the emerging accessories industry led Luxottica
to embark on its first collaboration with the fashion industry in 1988 by entering into a
licensing agreement with Giorgio Armani. The Company followed that initial collaboration
with numerous others and with the acquisition of new brands, gradually building the current
world-class brand portfolio and thereby increasing its commitment to research, innovation,
product quality and manufacturing excellence. Over the years Luxottica has launched
collections from names like Bulgari (1997), Chanel (1999), Prada (2003), Versace (2003),
Donna Karan (2005), Dolce & Gabbana (2006), Burberry (2006), Ralph Lauren (2007), Paul
Smith (2007), Tiffany and Co. (2008), Tory Burch (2009), Coach (2012), Starck Eyes
(2013), Armani (2013) and Michael Kors (2015).
Moreover, in 1999 Luxottica acquired Ray-Ban, one of the world’s best-known sunglasses
brands. Through this acquisition the Company obtained crystal sun lens technology.
In 2007, Luxottica acquired California-based Oakley, a leading sport and performance
brand, which owned the Oliver Peoples brand and a license to manufacture and distribute
eyewear under the Paul Smith name. At the time of the acquisition, Oakley had its own retail
network of over 160 stores.
In 2013, Luxottica acquired Alain Mikli International, a French luxury and contemporary
eyewear company, which owned the Alain Mikli brand and the Starck Eyes license. As a
result of the acquisition, Luxottica strengthened both its luxury brand portfolio and
prescription offerings, which now include Alain Mikli’s distinctive designs.
EXPANSION IN RETAIL DISTRIBUTION: in 1995, Luxottica acquired the United States
Shoe Corporation, which owned LensCrafters, one of North America’s largest optical retail
chains. As a result, Luxottica became the world’s first significant eyewear manufacturer to
enter the retail market, thereby maximizing synergies with its production and wholesale
distribution and increasing penetration of its products through LensCrafters stores. Since
2000, Luxottica has strengthened its retail business by acquiring a number of chains,
including Sunglass Hut (2001), a leading retailer of premium sunglasses, OPSM Group

33
(2003), a leading optical retailer in Australia and New Zealand, and Cole National (2004),
which brought with it another important optical retail chain in North America, Pearle
Vision, and an extensive retail licensed brands store business (Target Optical and Sears
Optical). In 2005, the Company began its retail expansion into China, where LensCrafters
has become a leading brand in the country’s high-end market. In the same year, the Group
also started to expand Sunglass Hut globally in high-potential markets like the Middle East,
South Africa, India, Southeast Asia, Mexico, Brazil and Europe. In 2011, Luxottica started
its optical retail expansion in Latin America by completing the acquisition of GMO, a
leading retailer in Chile, Peru, Ecuador and Colombia.
2.2 BUSINESS MODEL
One of the competitive advantages underpinning the Group’s past and
future successes is the vertically integrated business model that Luxottica
has built over the decades.
The Group’s present structure, covering the entire value chain, is the
result of a far-sighted choice made by the Company’s founder and
current Chairman, Leonardo Del Vecchio, who understood the potential
of a vertical integration strategy when he decided to make entire frames
rather than just components. Vertical integration of manufacturing was
gradually accompanied by the expansion of distribution, first wholesale
and, from 1995, retail and by the creation of a key presence in the high
value-added business of lens finishing.
Over decades, the Company has vertically integrated all phases of the
production process to attain a level of efficiency in line with the quality
of products and services it offers. Direct control of the entire production
platform makes it possible to verify the quality of both products and
processes, introduce innovations, identify synergies and new operating
methods and optimize time and costs. Direct distribution enables
Luxottica to offer its products in major developed and emerging markets
and achieve a unique understanding of consumer needs and tastes both globally and locally. This
capability is viewed as a strength by fashion houses that come to Luxottica to produce their eyewear
collections and access the Group’s global and widespread distribution network.
Figure 3 – Luxottica’s
business model

34
2.3 OPERATIONS
Luxottica’s vertically integrated business model and geographically diversified manufacturing
footprint have led to greater efficiency, flexibility and speed in product design, engineering, supply,
manufacturing and logistics, while maintaining uncompromising quality.
DESIGN
Emphasis on product design and the continuous development of new styles are key to Luxottica’s
success. During 2014, Luxottica added approximately 1,900 new styles to its eyewear collections.
Each style is typically produced in two sizes and five colours.
The design of the Group’s products is the focal point where vision, technology and creativity
converge. Each frame expresses Luxottica’s two core precepts: the use of innovative materials,
technologies and processes, and unparalleled craftsmanship. The design process begins with
Luxottica’s in-house designers who work in an environment that promotes innovation, originality
and a creative process. In addition, the design team works directly with the marketing and sales
departments, which monitor the demand for current models, as well as general style trends in
eyewear.
After the design process has been completed, the product development process is executed through
engineering, planning, manufacturing and distribution of Luxottica’s products.
PRODUCT DEVELOPMENT
The engineering process consists of the product development stages between style sketches and the
manufactured final products. By using a launch calendar that focuses on customer and geographic
demand, the engineering department has been able to decrease product development timelines in
recent years.
The research and development efforts of Luxottica’s engineering staff play a crucial role in the
development process. Engineers are continuously looking for new materials, concepts and
technology innovations to apply to products and processes in an effort to differentiate them in the
eyewear market.
During the initial phase of the development process, the prototype makers transform designs into
one-off pieces, crafted by hand with meticulous precision. Once developed, they are passed on to
the product department, which uses visual rendering and 3D software to analyse the necessary steps
to bring the prototype to mass production. At this point in the cycle, the mold workshop designs and
assembles the equipment needed to make the components for the new model. The first samples are
assembled and undergo a series of tests required by internal quality control procedures.

35
Production Plant
Brazil
Ontario
India
China
Italy
MANUFACTURING
In 2014, Luxottica’s manufacturing facilities, located in Italy, China, India, the United States and
Brazil, produced a combined total of approximately 83 million prescription frames and sunglasses.
Six manufacturing facilities are located in Italy and these represent the 43% of global production
output. Five facilities are located in North-eastern Italy (Agordo, Sedico, Pederobba, Cencenighe,
Rovereto), where most of the country’s eyewear industry is based, and one is located near Turin
(Lauriano). Over the years, the Group has consolidated its manufacturing processes and allocated
specific production roles and technologies to each plant. This has enabled Luxottica to improve
both the productivity and quality of its manufacturing operations.
The three manufacturing facilities in China (Dongguan) and a small plant in India (Bhiwadi)
collectively represent another 43% of total production output. From 1998 to 2001, Luxottica
operated the Dongguan plant in China’s Guangdong province through a 50%-owned joint venture
(Tristar Optical Company Ltd.) with a Japanese partner. In 2001, Luxottica acquired the remaining
50% interest in this Chinese manufacturer and in 2006, it increased its manufacturing capacity in
China through the construction of a new manufacturing facility to produce both metal and plastic
frames. With the opening of this new facility, the annual average daily production in China
increased by approximately 80% from 2005 to 2006. In 2010, its Tristar facility started producing
plastic sun lenses to be paired with frames manufactured in the same location. In 2013, Luxottica
integrated into its manufacturing processes a newly developed state-of-the-art plant, partly
dedicated to decorations, utilizing techniques adapted from other industries.
Figure 4 – Luxottica’s production footprint
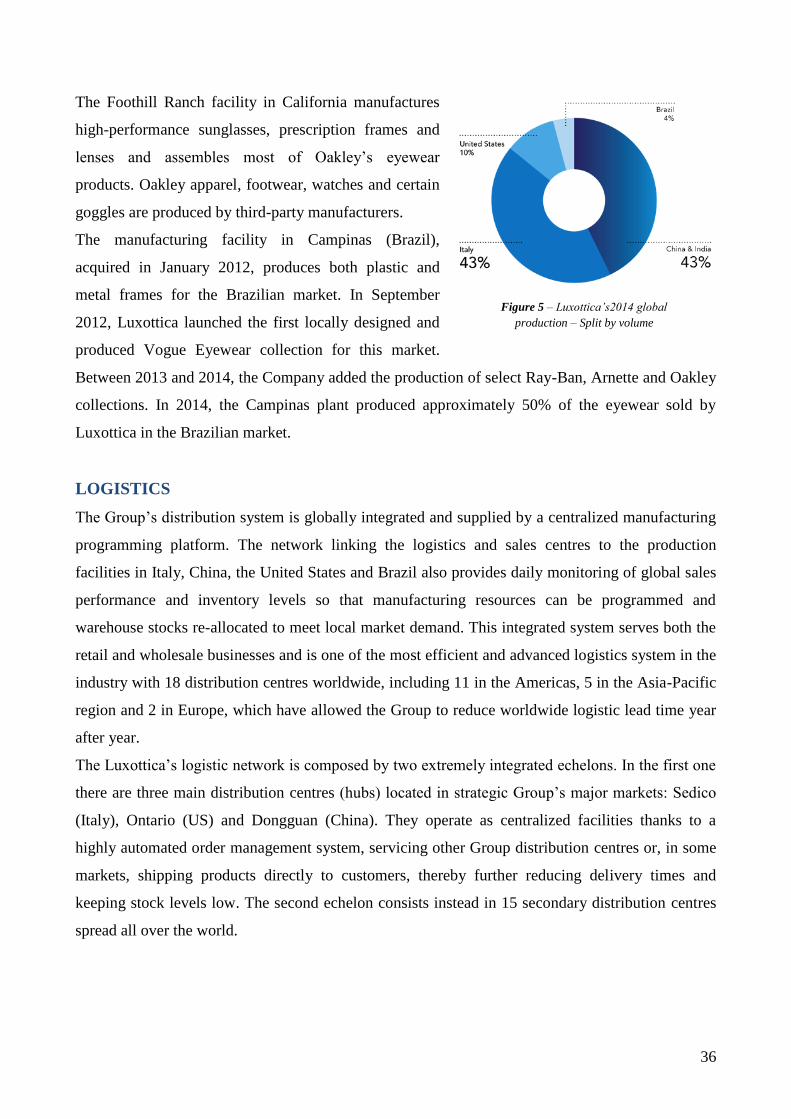
36
The Foothill Ranch facility in California manufactures
high-performance sunglasses, prescription frames and
lenses and assembles most of Oakley’s eyewear
products. Oakley apparel, footwear, watches and certain
goggles are produced by third-party manufacturers.
The manufacturing facility in Campinas (Brazil),
acquired in January 2012, produces both plastic and
metal frames for the Brazilian market. In September
2012, Luxottica launched the first locally designed and
produced Vogue Eyewear collection for this market.
Between 2013 and 2014, the Company added the production of select Ray-Ban, Arnette and Oakley
collections. In 2014, the Campinas plant produced approximately 50% of the eyewear sold by
Luxottica in the Brazilian market.
LOGISTICS
The Group’s distribution system is globally integrated and supplied by a centralized manufacturing
programming platform. The network linking the logistics and sales centres to the production
facilities in Italy, China, the United States and Brazil also provides daily monitoring of global sales
performance and inventory levels so that manufacturing resources can be programmed and
warehouse stocks re-allocated to meet local market demand. This integrated system serves both the
retail and wholesale businesses and is one of the most efficient and advanced logistics system in the
industry with 18 distribution centres worldwide, including 11 in the Americas, 5 in the Asia-Pacific
region and 2 in Europe, which have allowed the Group to reduce worldwide logistic lead time year
after year.
The Luxottica’s logistic network is composed by two extremely integrated echelons. In the first one
there are three main distribution centres (hubs) located in strategic Group’s major markets: Sedico
(Italy), Ontario (US) and Dongguan (China). They operate as centralized facilities thanks to a
highly automated order management system, servicing other Group distribution centres or, in some
markets, shipping products directly to customers, thereby further reducing delivery times and
keeping stock levels low. The second echelon consists instead in 15 secondary distribution centres
spread all over the world.
Figure 5 – Luxottica’s2014 global
production – Split by volume

37
The Sedico hub was opened in 2001 and is one of the most technically advanced in the industry. In
2014, it managed approximately 20,000 orders per day, including eyeglasses and spare parts. Sedico
ships approximately 210,000 units daily to customers in Europe, Middle East, Africa, selected US
markets and to the Group’s distribution centres in the rest of the world, where they are then shipped
to local customers. In addition, Sedico manages customized services, such as Ray-Ban Remix,
providing direct global deliveries.
The Dongguan hub was opened in 2006 and manages an average of 170,000 units per day. The
growth in the Asia-Pacific region has made this hub a strategic part of the Group’s distribution
network.
BRAND PORTFOLIO
Luxottica’s brand portfolio is one of the largest in the industry and continuously evolves, with
major global brands backed by leading brands both at a regional level and in particular segments
and niche markets.
The presence of Ray-Ban, one of the world’s best-selling brands of sun and prescription eyewear,
and Oakley, a leader in the sport and performance category, gives the proprietary brand portfolio a
strong base, complemented by Persol, Oliver Peoples and Alain Mikli in the high-end of the market,
Arnette in the sport market, and Vogue Eyewear in the fashion market. Alongside the proprietary
brands, the portfolio has over 20 licensed brands, including some well-known and prestigious
names in the global fashion and luxury industries.
Primary DC Secondary DC
Ontario Columbus
Atlanta Dallas
Colombia Ecuador
Brazil
Chile
Peru
Sedico
Turkey
India Dongguan
Japan
Australia
Mexico
Figure 6 – Luxottica’s logistics footprint

38
PROPRIETARY BRANDS
In 2014, proprietary brands accounted for
approximately 69% of total sales of frames.
Ray-Ban and Oakley, the two biggest
eyewear brands in Luxottica’s portfolio,
accounted for 27% and 11.7%, respectively,
of the Group’s 2014 net sales.
LICENSED BRANDS
Designer lines are produced and distributed through license agreements with major fashion houses.
These agreements are exclusive contracts which typically have terms of between four and ten years,
and may contain options for renewal for additional periods. Under these license agreements,
Luxottica is required to pay a royalty ranging from 6% to 14% of the net sales of the related
collection and a mandatory marketing contribution of between 5% and 10% of sales.
Prada is the most significant license in Luxottica’s portfolio as measured by total sales. In 2014,
sales realized through the Prada, Prada Linea Rossa and Miu-Miu brand names together represented
approximately 4% of total sales.
DISTRIBUTION
Luxottica’s global distribution network is one of the Group’s core strengths. It includes retail stores
as well as a wholesale network of third-party stores and chains. Luxottica operates in all the world’s
major markets and continues to expand in emerging markets, where it has made substantial
investments over the last few years and intends to broaden and strengthen its distribution platform
going forward. The Company furthermore exploits three main channels of trade:
Figure 7 – Luxottica’s proprietary brands
Figure 8 – Luxottica’s licensed brands
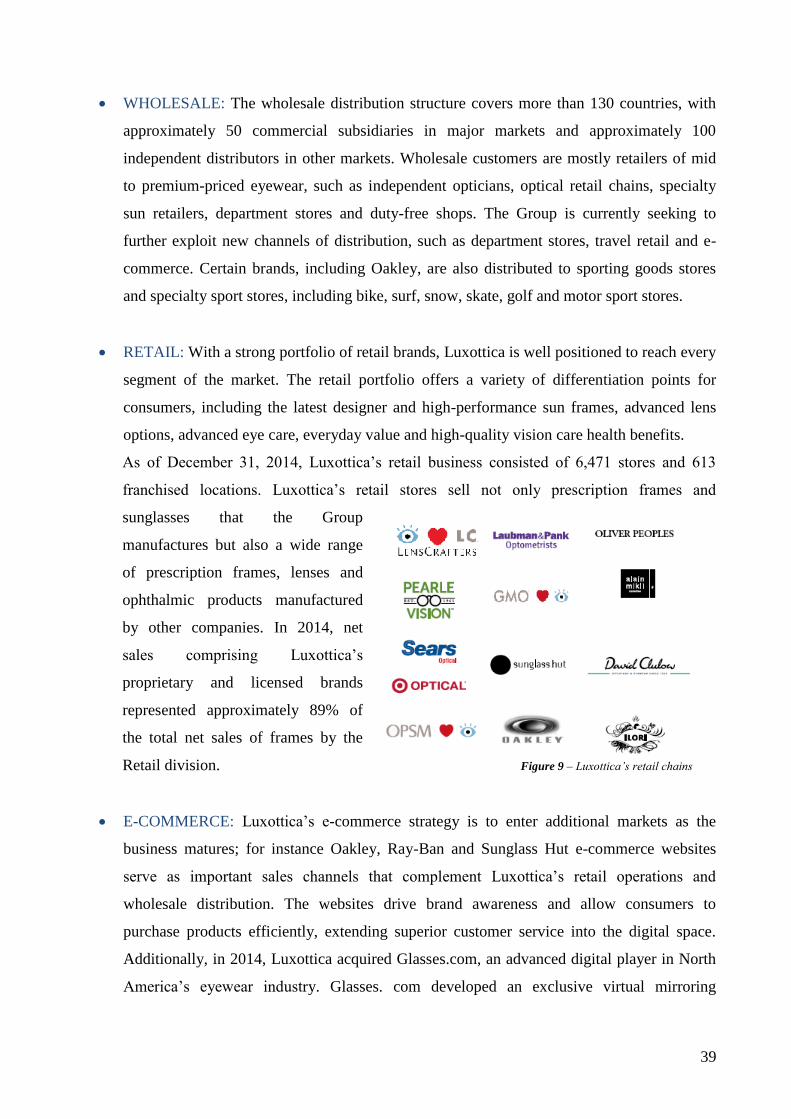
39
WHOLESALE: The wholesale distribution structure covers more than 130 countries, with
approximately 50 commercial subsidiaries in major markets and approximately 100
independent distributors in other markets. Wholesale customers are mostly retailers of mid
to premium-priced eyewear, such as independent opticians, optical retail chains, specialty
sun retailers, department stores and duty-free shops. The Group is currently seeking to
further exploit new channels of distribution, such as department stores, travel retail and e-
commerce. Certain brands, including Oakley, are also distributed to sporting goods stores
and specialty sport stores, including bike, surf, snow, skate, golf and motor sport stores.
RETAIL: With a strong portfolio of retail brands, Luxottica is well positioned to reach every
segment of the market. The retail portfolio offers a variety of differentiation points for
consumers, including the latest designer and high-performance sun frames, advanced lens
options, advanced eye care, everyday value and high-quality vision care health benefits.
As of December 31, 2014, Luxottica’s retail business consisted of 6,471 stores and 613
franchised locations. Luxottica’s retail stores sell not only prescription frames and
sunglasses that the Group
manufactures but also a wide range
of prescription frames, lenses and
ophthalmic products manufactured
by other companies. In 2014, net
sales comprising Luxottica’s
proprietary and licensed brands
represented approximately 89% of
the total net sales of frames by the
Retail division.
E-COMMERCE: Luxottica’s e-commerce strategy is to enter additional markets as the
business matures; for instance Oakley, Ray-Ban and Sunglass Hut e-commerce websites
serve as important sales channels that complement Luxottica’s retail operations and
wholesale distribution. The websites drive brand awareness and allow consumers to
purchase products efficiently, extending superior customer service into the digital space.
Additionally, in 2014, Luxottica acquired Glasses.com, an advanced digital player in North
America’s eyewear industry. Glasses. com developed an exclusive virtual mirroring
Figure 9 – Luxottica’s retail chains

40
technology, accessible through smartphones or tablets that uses a 3D image of the user’s
face to allow for multiple try-on options with real likeness.
2.4 INTERNAL ANALYSIS
Given Luxottica’s characteristics reported in the paragraphs above it is possible to conduct an
internal analysis about Company’s Resources and Capabilities. Company’s internal status can be
then compared with the general state of the eyewear industry in order to assess the final positioning
of Luxottica.
RESOURCES
The resources are tangible and intangible assets a company can count on when defining its
comparative advantage strategy. They can be classified into the following different categories in
order to be deeply analysed.
TANGIBLE RESOURCES
Tangible resources are the resources that can be quantified. They are:
Financial Assets: Luxottica Group’s incomes are way higher than its competitors’. In
addition, it also has a better EBITDA % of its total income which means the company is
leading the market in keeping low costs, exploiting economies of scale, profitable
geographic areas and thus making the best earnings out of its sales. In conclusion there is a
need to say that the great earnings of the Company can be also explained by the pieces
Luxottica is able to set given its high-end brand portfolio. There is, indeed, an outstanding
margin between the production cost and the price of a pair of glasses, especially for luxury
eyewear.
The rating company Standard and Poor’s rates Luxottica’s bonds better than its competitors,
making it easier for the company to get money on the financial markets (New York Stock
Exchange since 1990, Borsa Valori di Milano since 2000):
o Luxottica Group Financial Rating SP’s: [BBB+] (Reuters, 2016);
o Competitors’ Financial Rating SP’s : Safilo Group: [B]; Marcolin: [B] (Reuters,
2016)
Physical assets: Luxottica Group has controlled since 2001 its global demand with three
main distribution centres (hubs) situated in strategic positions in order to better serve the
major markets and achieve a proper level of flexibility. These hubs are placed in Sedico

41
(Italy), Ontario (US), Dongguan (China). The hubs serve more than 50,000 orders per day,
the biggest one in Sedico counts 210,00 units shipped per day, and they are all integrated
with SAP system (System Application and Products in data processing) which optimizes
inventory control, order management process and manufacturing management, allowing an
higher level of efficiency and lower logistic costs. These facilities allowed Luxottica to
change an old local warehouse system of serving in order to improve speed and efficiency
both in mature markets, such as Europe and North America, and in developing ones like
Brazil, China, India, and Mexico. The Group has an outstanding retaliatory capacity as well.
Since the 2001, when Luxottica acquired Sunglass Hut, it has become the leader of sun retail
business. Its network consists of more than 6,000 corporate stores of several brands all over
the world operating in optical and sun and luxury retail.
INTANGIBLE RESOURCES
Tangible resources are the resources that are unable to be quantified. They are:
Technological Assets: Luxottica Group owns many brands and licensed labels and has an
efficient retaliatory capacity that counts many stores and shops. The company is developing
new features and designs for its products to make sure they are going to be leading the
worldwide sales:
o Balance of iconic and casual styles;
o New materials & techniques: carbon fibre, titanium hinges, aluminium;
o Line extensions that reach new customers;
o Styleswitch – first lifestyle product with Switchlock technology;
o Crosslink Switch – interchangeable lens carrier technology;
o Lens storytelling for different environments. The Snow/Skiing market segment has
been growing fast and full of opportunities lately. That’s why Luxottica Group has
been developing high technological products in this direction as well, starting from
the Airwave snow goggle with heads up display which integrates the Bluetooth
connectivity, GPS and RFid;
Reputation Assets: Luxottica Group exploits the consumer’s awareness to the brands it
owns or has licensed labels on. The most known brands among the Group’s portfolio are
RayBan, Persol and Oakley. They also have lots of famous stylists and fashion brands’
names among their licensed labels. The most important are the following: Bulgari,

42
Dolce&Gabbana, Armani, Chanel, Burberry, Miu-Miu, Prada, Ralph Lauren, Tiffany and
Versace.
Human Resources: “People working in Luxottica know they are part of something unique.
Team spirit is a founding value that enables everyone to progress in their work thanks to a
positive and supportive environment.” (Luxottica website). Luxottica Group counts more
than 70,000 employees. More than half of them (64,5%) operates in the retail business, only
a few (10%) work in the wholesale segment and around 17,600 employees (25%) work in
manufacturing activities and logistics. Management and Directory services represent 0.5%
of the total. In terms of the geographic distribution, 58% of employees are in North
America, 14% are in Europe, 21% are in the Asia-Pacific area and Latin America increased
to 6% in the last years.
Luxottica Group investments focused especially on Singapore, where the company is
looking forward to establish a “shared service centre” in order to support local markets and
improve its sales in Malaysia, Indonesia and Thailand, which are fast growing markets that
offer many profitable possibilities. In 2012 the company participated to a global employee
engagement survey, in which recorded a 88% participation index, according to an attendance
of more than 55,000 employees.
Luxottica Group is also working on some technological projects:
o The operational Platform has been further increased in 2012 with the full
management integration of all regional units, both in manufacturing and logistics;
o The Lean System program allows the company to reach high quality, speed and
production flexibility;
o The “Zero Accidents” program that has given appreciable results improving security
standards;
o The e-commerce areas have been improved;
CAPABILITIES
Some assets have to be working together in order to obtain sustainable competitive advantages,
known as Capabilities. Thanks to its available financial resources and to its vertical integration
purposes, the direction function of Luxottica developed an excellent strategy based on acquisition
management. This capability led the Company outside the country borders to the global market
where it started buying other brands with an aggressive approach and established retail stores and
shops in foreign countries in order to conquer emerging markets and different geographic areas.
43
Fabrication and logistic efficiency are obtained thanks to its physical assets: hubs, which are
facilities, used to store and organize products. This capability enables Luxottica to react fast and in
a flexible way to demand’s changes and work after-sale services better (e.g.: shipping of spare
parts).
Marketing and Brand management are as well very important for Luxottica, due to its
differentiation business policy. The company only promotes its brands not the company itself, that
is why it is important to have a very well organized Marketing function and a detailed Brand
Management.
All these factors together throw the basis for sustainable comparative advantages. The leadership
position in the market that the company has gained is the result of the deep integration of these
capabilities. Leonardo del Vecchio (Luxottica chairman) and the two CEOs play a critical role in
the company’s strategy since they are the only ones able to coordinate resources worldwide and
control the market leadership over the years by managing established markets and conquering
emerging markets.
2.5 STRENGHTS, WEAKNESSES, OPPORTUNITIES AND THREATS
The following analysis will be devoted as a recap of what has been mentioned about the Company
in the paragraphs above and it will summarize Luxottica’s strengths and weaknesses pointing out
market’s opportunities and threats as well.
STRENGTHS
Vertical integration: Luxottica’s structure covers the entire chain of value to offer a quality
in product and services. The Company has managed to build an agile organizational
structure, avoiding the risks and problems typically associated with the bureaucratization of
large organizations, without losing the advantages of a small enterprise;
Dedicated distribution channel: For fast service and cost optimization, the Company has
divided the distribution in 3 main centres (hubs) in strategic locations serving the major
markets: Sedico in Europe, Ontario in US and Dongguan in the Asia-Pacific region. The
SAP system provides daily monitoring of global sales performance and inventory levels so
that manufacturing resources can be programmed and warehouse stocks reallocated to meet
local market demand;

44
Brand portfolio: The company has a solid brand portfolio and its brands are known in the
world for quality, design and fashion. Luxottica has 12 house brands (like Ray-Ban, Persol,
Oakley, Vogue, etc.) and 22 license brands (like DKNY, Chanel, Tiffany & Co. and many
others). Brand portfolio helps the company to strengthen its reputation and to achieve client
loyalty and attract new customers;
Quality: “Hand made in Italy” is a symbol of quality in the world. The technology and the
R&D are continually being developed to achieve new level of customer satisfaction;
12 plants: Luxottica has 6 plants in Italy, 2 in USA, 2 in China, 1 in India and 1 in Brazil to
ensure excellence in quality, technology and product differentiation;
Retail network: The retail network reaches many markets and covers most of the geographic
areas of interest for Luxottica. Additionally through STARS, a project in which retail enters
in wholesale division, Luxottica has created a sophisticated distribution approach which
provides clients with an excellent service;
Eyewear market: prescription frames and lenses most of all has an inelastic demand which
is expected to rise up according to demographic growth tends;
WEAKNESSES
Luxury eyewear based: Luxottica Group is well positioned in the luxury market, thanks to
the high quality of products and their innovative design. Their lines are suitable for
developed markets like Europe and the United States, but not for new economies such as
Brazil, Mexico, China and India where the GDP per capita level is not very high;
Presence in fragile economies: From 2004 to 2010 Emerging Markets growth has been
16,35%, while growth in developing economies was only 4,94%. The developed countries
from which Luxottica supply the 77% of net sales have reached a maturity stage. It seems
almost impossible that a decline stage will start in the short-medium term, but the main
markets are now considerable as steady;
GDP growth rate and future economic conditions: Luxottica’s business is exposed to the
cyclicality of demand. Given the strong positive correlation between real GDP and eyewear
demand, the overall performance will suffer from economic setbacks leading to falling GDP
as in the period of economic recession 2008-2009. Luxottica’s sales register a decrease of
2.06% in 2009 as the world annual GDP falls to 2.05%;
Currency: The company is exposed to the weakening/strengthening of Euro versus other
currencies, in particular USD, AUD and Yuan, due to manufacturing costs incurred in Euro
and Chinese Yuan and revenues mostly received in USD and AUD (transaction risk).

45
Secondarily, there could be a gap between operating results, reported in Euro, and other
budget items such as assets, liabilities, revenues and costs denominated in various
currencies, which leads the company to face a translation risk. Finally, the foreign currency
rate sensitivity could impact on the Group’s competitive position in a given market;
OPPORTUNITIES
Acquisition: The Group has a good track record in managing acquisition. Luxottica
proposes the purchase of new companies when it is possible to take advantage of synergies
(e.g. the acquisition of Oakley which brought the know-how for the sport sector and the
polarization of lenses) or to enter in new markets (as for the recent acquisition of Tecnol in
Brazil). In North Europe there are companies with big market share and a big number of
stores so in the next years a new deal or acquisition can be expected here or in the emerging
markets in order to increase the presence of the Firm;
Changing in lifestyle: The increase in television and computer use, in formal employment
and female participation in the labour force in the emerging markets are all related to
eyesight worsening and the consequent needs for vision correction;
Increasing fashion content of frames: With the licensing of fashion design, Luxottica
Group focuses on a new costumers segment that is people who consider eyeglasses and
especially sunglasses more as an accessory rather than a need;
OneSight: It is an opportunity to enhance Luxottica corporate image; the objective is to
improve the quality of eye care by creating new partnerships to focus its resources on the
areas of particular need, offering continuous assistance to patients all year round and
increasing awareness of the importance of sight;
New Technology: Oakley has invented the Superior High Definition Optics for world-class
athletes, military, law enforcement and active consumers. Then the innovative new 3D
eyewear and the AIRBRAKE™ is the world’s first snow goggle to take advantage of
SwitchLock™ Technology. Additionally the partnership with Google might open the Hi-
Tech market for Luxottica;
Web: Luxottica is developing Ray Ban as epicentre brand with events and presence on
Facebook; with the success of Sunglass.com e-commerce platform the Group expects that
sales will double in the U.S. for 2016;

46
THREATS
Alternative prescription: Luxottica profitability may be affected by a reduction of the sales
of prescription glasses, lenses and accessories if consumers prefer correction alternatives to
prescription eyeglasses, such as corneal implant, laser surgery or contact lenses. However,
eye surgery is not a strong threat for the Group because of the high costs and the fact that
people invest on more expensive sunglasses after the operation. In contrast with Fielmann
and St Sunshine, Luxottica does not produce contact lenses but sells them in its stores;
nevertheless, this is not a real problem because who uses contact lenses usually buys
sunglasses to protect the vision;
License loss: Luxottica has a strong brand portfolio, but changing in consumer preferences or
in fashion could affect the value of fashion license and reduce the likelihood of favourable
renegotiation of license agreement. Additionally licensed labels need to be renewed every
couple of years contracting with fashion stylists and firms;

47
3. OBJECTIVES AND METHODOLOGIES
3.1 OBJECTIVES
The present study is intended to apply the theoretical knowledge, frameworks and models learned in
the fields of Logistics and Supply Chain over a multinational context in order to, on one hand
sustain the development of the business for a worldwide player, and, on the other hand, to enlarge
the actual available literature generating knowledge spill-overs from a business environment to an
academic one. In practical terms it means to develop a model enabling firms involved in the
business-to-business markets to increase the effectiveness and the efficiency of their physical
distribution system. This study actually seeks to shape a structured procedure and method to
understand why and when a particular kind of
customer has to be served either in a
preferential or standard way both from a
warehouse point of view and from the
transportation perspective. Nevertheless, given
the double-side analysis characterized by a
literature review and by an on-field experience,
the achievement of this objective naturally
engenders the needs to:
Analyse the scientific journals and papers in order to appraise the evolution of the whole research
production from it early beginnings to 2015, with particular interest on themes such as Logistics
Service Quality and Cost-to-Serve. Additionally, to achieve a larger picture on how scholars and
academicians have dealt over years with these topics, a higher level research on how Logistics gets
into contact and interacts with other companies’ disciplines is carried out;
Analyse, through an on-field experience, how the eyewear industry leader Luxottica is coping with
these themes and understand how they are addressed and managed within multinational business
environments;
Once the objective related to the development of the above mentioned model aimed at addressing
the right service to the right customer would be achieved its validity will be proved by applying its
rules to a particular and narrow set of customers. Subsequently, if results would be promising,
Luxottica’s objective is to apply it on a broader set of customers. The opportunity to enlarge the
sample of customers revising the logistics services and introducing a sort of customization for them
could have a strong impact on both costs rationalization and service level provision, driving toward
Figure 10 – Objectives of the study
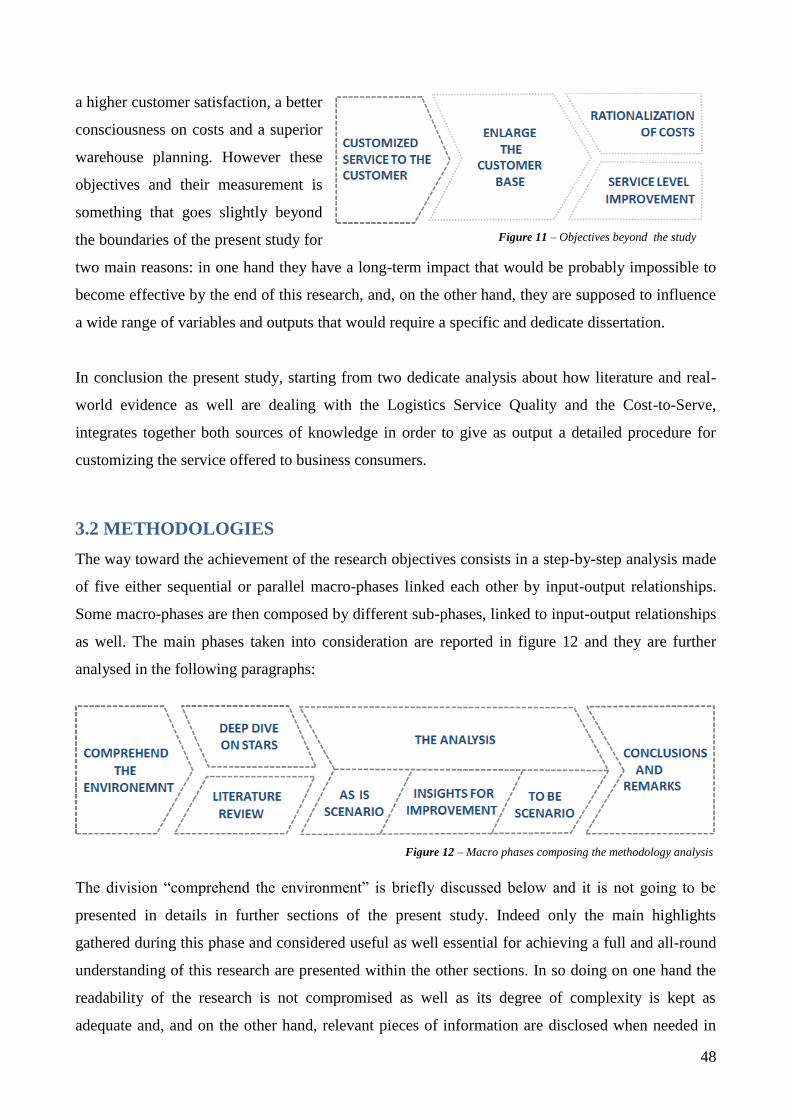
48
a higher customer satisfaction, a better
consciousness on costs and a superior
warehouse planning. However these
objectives and their measurement is
something that goes slightly beyond
the boundaries of the present study for
two main reasons: in one hand they have a long-term impact that would be probably impossible to
become effective by the end of this research, and, on the other hand, they are supposed to influence
a wide range of variables and outputs that would require a specific and dedicate dissertation.
In conclusion the present study, starting from two dedicate analysis about how literature and real-
world evidence as well are dealing with the Logistics Service Quality and the Cost-to-Serve,
integrates together both sources of knowledge in order to give as output a detailed procedure for
customizing the service offered to business consumers.
3.2 METHODOLOGIES
The way toward the achievement of the research objectives consists in a step-by-step analysis made
of five either sequential or parallel macro-phases linked each other by input-output relationships.
Some macro-phases are then composed by different sub-phases, linked to input-output relationships
as well. The main phases taken into consideration are reported in figure 12 and they are further
analysed in the following paragraphs:
The division “comprehend the environment” is briefly discussed below and it is not going to be
presented in details in further sections of the present study. Indeed only the main highlights
gathered during this phase and considered useful as well essential for achieving a full and all-round
understanding of this research are presented within the other sections. In so doing on one hand the
readability of the research is not compromised as well as its degree of complexity is kept as
adequate and, and on the other hand, relevant pieces of information are disclosed when needed in
Figure 11 – Objectives beyond the study
Figure 12 – Macro phases composing the methodology analysis

49
order to enable readers to catch the big picture of the study. Additionally this initial phase, together
with the “deep dive on STARS” has had the fundamental and crucial role of making it possible to
assimilate what would have been the topics of the study addressing all the subsequent steps, with
particular influence over the literature review. All the others sections, “literature review”, “the
analysis” and “conclusion and remarks” are further discussed in dedicated sections and the related
methodologies are expressed in the following paragraphs.
COMPREHEND THE ENVIRONMENT
Environment and business comprehension and mapping has been the most complex and long lasting
step of the current study: throughout this phase the general rules behind Luxottica’s business model
have been discovered and comprehended, and a precious set of embedded knowledge has emerged
and pointed out. Actually this first phase has been intended as the opportunity and the chance to get
in touch with Luxottica processes and operations, both from a practical point of view and,
concurrently, from a theoretical perspective: the strict interrelation among theoretical and practical
worlds has been fundamental in order to be firstly inducted on how Company’s logistics works, and
then to have a real-world evidence of what learned. This particular approach, characterized by an
on-field learning and training has been carried out through weekly meetings and inductions with
managers, team leaders, and operators that have given an all-round perspective of the different
business units within Company’s logistics.
In particular, as showed above in figure 13, a backward process has been undertaken starting from
the last step of the order fulfilment chain, the physical pick-up of goods by forwarders at the
Figure 13 – Luxottica’s areas touched for achieving a global comprehension

50
warehouse dock, passing then through all the operational phases, moving toward the tactical
activities, such as the transportation and warehouse short-term planning, and finally concluding
with a clear explanation of the most strategical and core competence activities, such as the network
development.
These kinds of on-field inductions have resulted in a sort of fly-well originating precious streams of
knowledge and a virtuous cycle that has allowed to find links, commonalities and divergences
between the different processes, which, in turn, have prepared the way and laid the ground for a
much more deep understanding of the following phases. Practically it is not possible and fair to
consider this process as definitive as well as closed since, for its own nature, it is a continuous
advancement in terms knowledge accumulation.
In conclusion this long and fascinating step can be intended as the backbone of the present study,
which has enabled and supported all the subsequent steps and, additionally, has been enriched
during the whole appraisal of the research.
DEEP DIVE ON STARS
Alongside with the comprehension of the environment it has been necessary to deep dive on how
Luxottica’s business models as well as logistics were impacting the STARS channel of trade. As it
is going to be further discussed in paragraph 5, STARS is trade channel devoted to opticians with
whom Luxottica has established a partnership program that allows the Company to manage an
independent store as a proprietary one. Opticians joining this opportunity are particularly important
for Luxottica, and exactly for this reason the Company has established a dedicated business units
that over year has grown with a strong pace and nowadays is one of Luxottica’s key hearts. The
strategic relevance of STARS business model is well supported by the corporate strategy that has
decided to serve these opticians with the highest possible priority: logistics at first has particular and
dedicated procedures and processes to assure the best possible service. This is the reason why, in
addition to a general comprehension of the environment also a deep dive on this particular business
model has been carried out.
The deep dive has required different meetings involving STARS dedicated teams and it has been
conducted leveraging especially on theoretical concepts rather than on on-field training and
experiences; in particular, most of the information have been collected in meetings held with
STARS Logistics Customer Service Team and STARS Planning Team. This methodology,
apparently greatly different from the one adopted for the comprehension of the environment, is
justified by the nature of STARS: this particular trade channel, from an operative point of view, is
fulfilled as all the other businesses are served, on the other hand it logically follows totally different

51
rationales. This is the reason why only tactical and strategical activities, have been impacted in this
phase of the study:
Throughout this deep dive a better understanding of what STARS is has been achieved and a more
detailed picture of this channel of trade has been emerged. With this superior awareness it has been
possible to deploy the concepts arisen in the former step and to start, together with the results
coming from the literature review, the analysis of the AS IS scenario.
LITERATURE REVIEW
The literature review phase has been conducted immediately after a sufficient comprehension of the
business has been achieved. Additionally the literature has been analysed in parallel with the deep
dive about STARS trade channel. This timing has been fundamental: on one hand the worthy
comprehension of the environment has allowed to understand the criticalities of the business,
routing the literature review over certain topics, while, on the other hand, the deep dive on STARS
has permitted to refine that topics addressing the analysis of journals and papers on specific issues
regarding, mainly, that part of Luxottica business.
The literature review, in fact, has helped to build a clear image on what, from a theoretical point of
view, was the state-of-the art of the main topics under examination. This research acted as a fly-well
providing a series of meaningful starting points on which to base the subsequent phases.
Figure 14 – Luxottica’s areas touched during the STARS deep dive
Figure 15 – Phases composing the literature review

52
The first phases consist on papers selection and collection, while the second is focused on their
classification. Then the third phase involves a brief analysis of the selected literature and lastly that
is going to be greatly enlarged on paragraph 4, in phase four research gaps and potential areas for
further investigation are identified.
During the literature overview two main themes have been found as key:
- The analysis of customer profitability, driven by the Cost-to-Serve (CtS) and influenced by
the Logistics Service Quality;
- The analysis of the strict relationship between Logistics and Marketing;
Once introduced these themes a detailed description and development of them has been done
addressing topics such as the way in which the Cost-to-Serve is defined and measured and what are
its main drivers, which are the fundamental parameters considered when evaluating the Logistics
Service Quality and what are the main aspects that link together two apparently distant disciplines
such as marketing and logistics. The relevance of the addressed themes is disclosed for each paper
in table I. These topics have been developed trying to always maintain a strict link with practice and
with the business case under examination: in fact the development of the themes has been always
concerned with the implications that the working experience would have. More in particular some
papers have also been discussed together with managers and with some teams involved in the
research in order to find commonalities between the way in which practical aspects have been
discussed in literature, or, at the opposite, how theoretical dissertations may have implications for
Luxottica. This exchange between theoretical and practical world has been fundamental to carry on
further with a refinement of topics and for finding a fil rouge between them.
The papers review has been the initial part of the research process and has provided the basis for the
following phases of the current work. The study of the current contribution allowed, on one hand, to
have confirmation about the importance of the theme, and on the other hand, to highlight some gaps
to be deepened and analysed in this work and to sharpen the objectives of the study. Gaps have been
detected comparing what has been developed over years in literature with what has been practically
applied in Luxottica without being formalized in theory. To find gaps papers have been examined
firstly by looking at the introduction section, which has been found to always deploy a sentence or
more about the reasons why that research is done, at the conclusion and at the suggestions for future
research section in which the authors of articles, having examined the literature and having
conducted a research themselves, would point their readers to areas which lack investigation or
need closer examination. Additionally some systematic reviews have been analysed: these papers

53
delved deep into the literature and examine the trends and changes in a discipline or specific field of
study and providing summaries of the literature.
THE ANALYSIS
The analysis of the STARS business has been subdivided in two main steps:
AS IS scenario analysis, through which the actual way in which business was conducted
has been highlighted;
Insights for improvement, through which the possible main improvements to reinforce and
enhance the business have been pointed out;
AS IS SCENARIO
The AS IS scenario analysis has been characterized by one major objective: apply both the practical
and the theoretical learnings gathered in the three previous phases in order to map how the STARS
business is conducted. In order to achieve
such objective it has been necessary to define
a methodology helping to slightly reduce the
complexity of the business. A twofold
approach has been evidenced and used:
firstly a perimeter has been defined and
secondly the parameters on which to base the
analysis have been identified.
The perimeter definition consisted in the first opportunity to reduce the complexity of the
analysis. Actually, being STARS trade channel developed in more than 50 countries all over
the world and counting thousands of partners worldwide, it would have been particularly
difficult to analyse in a one-shot study all the geographies, even because to different
geographies may correspond different rationales. As a consequence the perimeter has been
drafted under both a timing and a geographical perspective, with the objective to craft a
homogenous and well balanced set of markets and to be able to analyse data relative to
2015. One of the instruments utilized in order to carry out such fine-tuning consisted in the
weighted score point technique, however in these steps not only quantitative, but also
quantitative variables has been assessed. Finally the last refinement has been driven by the
STARS classification;
The parameters definition gave the chance to identify which KPIs would have been later
applied and utilized in order to assess the performances of the business. The literature
Figure 16 – Phases composing the AS IS scenario analysis

54
review have played a relevant role acting as a font of knowledge and actually two of the
most important KPIs drown during the analysis of the literature have been selected. The
selection criteria and process have been clearly pointed out and it is widely described in
section 5.
Given the perimeter and the parameters the analysis of the AS IS scenario has been pointed out. In
this phase the theoretical concepts highlighted through the literature review have been applied to the
real world, involving a quite complicated effort: the level of complexity embedded in Luxottica was
much higher in respect to the concepts pinpointed in literature. In fact the number of leverages,
variables and exceptions managed within the Company has required a strong determination for the
understanding of which KPIs would have represented the best the actual set-up. Even though the set
of parameters evidenced during the literature review was broad and complete, the introduction of a
new KPI has been necessary in order to reach the scope of the project. As a consequence, after a
methodological study with managers and team leaders there has been the need to develop a brand-
new framework, the so-called Order to Delivery Lead Time calculation model, that enabled to
measure Luxottica’s Lead Time to customers.
The methodology that led to the analysis of the AS IS scenario has been reinforced with a
preliminary summary of the main gaps giving a full perspective of the current way in which the
Company was leading its business.
INSIGHTS FOR IMPROVEMENT
During the analysis of the AS IS scenario a critique and reviewing approach has been implemented:
every variable that was considered not fully and optimally operational within the AS IS scenario has
been widely discussed and enhanced. This continuous deep dive has been supported by a twofold
trial-and-error process: the choices on how to improve the current set-up have been firstly looked
and discussed with the Logistics Customers Service team that during the whole duration of the
project has acted as a link between Transportation and STARS Planning, in a weekly review.
Additionally a bi-weekly review with STARS business owners has been regularly carried out in
order to validate the improvements and to freeze the findings. The implementation of the TO BE
scenario has been partially possible: in order not to disrupt the business it has been necessary to find
the right moment in which to make the innovations applicable. As a consequence together with the
STARS Planning Team and with the STARS Logistics Customer Service Team some meetings
have been held and the final decision has been also validated both by Sedico DC manager and by
the Logistics Network manager.
55
CONCLUSIONS AND REMARKS
Once the main highlights and the most important insights for improvements have been collected and
practically applied, a brief section pointing out the overall conclusion of the present study and its
main points of attentions fort future research paths is then depicted.

56
4. LITERATURE REVIEW ABOUT LOGISTICS
CUSTOMER SERVICE
The literature review consists in the all-round appraisal of the contributions related to the main
topics touched within the study. The systematic examination of the published papers has allowed
accumulating precious knowledge about the research theme and making the point about the state of
the art in the field of research. The literature review has also helped to point out what are the main
gaps between the best performing institutions and the Company under examination. Moreover this
first step has acted as a fly-wheel for collecting new ideas and for sharpening the objectives of the
research.
The section is organized as follows. The next paragraph points out the way through which papers
have been selected and collected, and subsequently, in the second paragraph, how they have been
classified. Then, once the body of knowledge has been fully organized, a general overview of the
results obtained by reviewing and analysing papers together with the main themes arose is
presented. These general themes are consistently presented and widely discussed in the fourth
paragraph. Finally the limitations of the research are identified and research gaps and potential
directions for future research in this field are highlighted.
4.1 PAPERS SELECTION AND COLLECTION
Similarly to Perego et al. (2011), the preliminary point for the identification of appropriate and
significant papers was a number of different library databases (i.e. Scopus, Science Direct, ISI Web
of Knowledge, and Google Scholar). The search was conducted using several keywords (i.e.
“Logistics,” “Eyewear,” “Cost-to-Serve,” “Clustering,” “Segmentation,” “Customization,” “Service
Level,” “Supply Chain,” “District”, “Cluster”, “Performance” and “Customer Profitability
Analysis”) and their combinations as well have been used in both the abstract and the main body of
the papers. In order to avoid the omission of other potentially major papers, as suggested by other
authors (e.g. Marchet et al., 2014), most of the cited contributions were also cross-referenced. By
applying this method, it was possible to assure a satisfactory coverage of the existing body of
research in the field. During the examination of the papers that were found, some were recognized
to be more relevant than others for the purposes of the current study. As such, a sub-set of papers
dealing with the Cost-to-Serve and the Logistics Service Quality aspects was finally selected, and
52 papers published from 1948 to 2015 were considered for in-depth investigation.

57
4.2 PAPERS CLASSIFICATION
Different methods used in previous literature-review papers (e.g. Carter et al., 2007; Ghadge et al.,
2012; Meixell and Norbis, 2008; Natarajarathinam et al., 2009; Perego et al., 2011; Pettit and
Beresford, 2009) were examined. For the purposes of this research, the selected contributions were
classified based on: their main characteristics (i.e. year of publication, journal title, regions
addressed), the research method(s) adopted, and their content. Table I, based on Natarajarathinam et
al. (2009), summarizes the key attributes of each paper, and the research method(s) adopted.
Aligned with Perego et al. (2011), the papers are listed in chronological order to show the evolution
of the main themes arisen: the integration between Marketing and Logistics, the Logistics Service
Quality and the developments toward the Cost to Serve and Customer Profitability Analysis. In
addition to the clusters by themes, papers have been classified and evaluated as well on the basis of
their research methodology. The categories used were based on a study by Meixell and Norbis
(2008), who recognized seven research methods, i.e., conceptual models or frameworks, surveys,
case studies, analytical/mathematical models interviews, simulations, and others. As shown in Table
I, many of the papers reviewed are research papers and frameworks (31) some others are articles
(8). In terms of the other methodologies, a number of papers have been found belonging to
dissertation books (4), case studies and working papers (4) and then general and literature reviews
(2) and others (3). The 52 papers examined were published in 39 different scientific journals, books
and faculty’s presses and, in particular on logistics journals (21%), marketing journals (19%),
transportation journals (4%), cost journals (2%), business reviews (10%), academic literature (6%)
and others (36%).
Focusing on the year of publication, the majority of the papers are relatively recent: almost 60% has
been published from 2000 on, and a huge gap in the ‘70s and ‘80s was observed, followed by a
rising trend. A further increase in the number of papers occurred on 2012 and 2014, thus attesting
an increase in the amount of attention being paid by the research community to these issues. Finally,
looking at the regions addressed, it should be noted that the number of contributions in which the
first author is from the USA is 28 (corresponding to 53%), followed by UK, Greece and China (3
each, i.e. 6%). Other publications were written by researchers from Taiwan (2), the Netherlands (2),
Sweden (1), Germany (1), Belgium (1), Australia (1), Finland (1), Italy (1), Brazil (1), Denmark (1),
India (1) and Poland (1). These results appear to be consistent with the attention of Marketing
aspects and the development Logistics and Customer Satisfaction.

58
No. Author (year) Country Journal Title
Research
method
Addressed themes
Logistics &
Marketing LSQ
CtS &
CPA
1 Culliton J.W.
(1948)
USA Harvard Business
Review
The management of Marketing
costs
Book Ancillary Absent Core
2 Magee J.F.
(1960)
Harvard Business
Review
The Logistics of distribution Article Absent Ancillary Ancillary
3 Stern L.W.
(1969)
USA American
Marketing
Association
Distribution channels: a social
system approach to the study of
Marketing
Research
paper
Core Ancillary Absent
4 Peter Gilmour
(1974)
Australia Physical
Distribution
Management in
Australia
Development of physical
distribution models
Research
paper
Ancillary Ancillary Absent
5 Peter Gilmour et al.
(1976)
USA Int. J. of Physical
Distribution &
Logistics
Management
Customer Service: differentiating
by market segment
General
review
Core Ancillary Absent
6 Lloyd M. Rinehart et
al.
(1989)
USA J. of the Academy
of Marketing
Science
Furthering the integration of
Marketing and Logistics through
Customer Service in the channel
Article Core Absent Absent
7 Zeithaml, V.A. et al.
(1990)
USA The Free Press Delivering quality service:
balancing customer perception
and expectations
Book
Absent Core Absent

59
No. Author (year) Country Journal Title
Research
method
Addressed themes
Logistics &
Marketing LSQ
CtS &
CPA
8 Jay U. Sterling et al.
(1989)
USA Int. J. of Physical
Distribution &
Materials
Management
Customer Service research: past,
present and future
Research
paper
Ancillary Ancillary Absent
9 E. Powell Robinson et
al.
(1990)
USA Int. J. of Physical
Distribution &
Logistics
Management
Customer Service: implications
for distribution system design
Research
paper
Core Ancillary Absent
10 Byrne, P.M. et al.
(1991)
USA Council of
Logistics
Management
Improving quality and
productivity in the Logistics
process: achieving customer
satisfaction breakthroughs.
Book Ancillary Core Absent
11 M. Johnston
(1991)
USA Int. J. of Physical
Distribution &
Logistics
Management
Customer Service in physical
distribution: the dimensions and
some strategies for achieving
them
Research
paper
Ancillary Ancillary Absent
12 Cavinato J.L.
(1992)
USA J. of Business
Logistics
A total cost/value model for
supply chain competitiveness
Article Ancillary Ancillary Core
13 Paul R. Murphy et al.
(1994)
USA Int. J. of
Physical
Distribution &
Logistics
Management
A framework for applying
logistical segmentation
Research
paper
Absent Ancillary Ancillary

60
No.
Author (year)
Country
Journal
Title
Research
method
Addressed themes
Logistics &
Marketing LSQ
CtS &
CPA
14 Coyle J.J. et al. (1996) USA West publishing
company
The management of business
Logistics
Book Absent Absent Ancillary
15 Gebert P.
(1996)
England CMA Magazine Managing customers through
Cost-to-Serve
Article Absent Absent Core
16 Timo Pirttilg et al.
(1996)
Finland Int. J. of
Production
Economics
A framework for cost-service
analysis in differentiation of
Logistics services
Research
paper
Absent Ancillary Core
17 Ko de Ruyter et al.
(1996)
Neth. European J. of
Marketing
The power of perceived service
quality in international Marketing
channels
Research
paper
Ancillary Core Absent
18 Bienstock C.C. et al.
(1997)
USA J. of the Academy
of Marketing
Science
Measuring physical distribution
service quality
Conceptual
paper
Absent Core Absent
19 James H. Bookbinder
(1997)
USA Int. J. of Physical
Distribution &
Logistics
Management
Customer Service in physical
distribution: a utility‐function
approach
Research
paper
Absent Ancillary Absent
20 Alan Braithwaite et al.
(1998)
USA Int. J. of Logistics
Management
The Cost-to-Serve method Research
paper
Absent Absent Core
21 Lambert, D.M. et al.
(2000)
USA Int. J. of Logistics
Management
Measuring and selling the value
of logistics
Research
paper
Absent Ancillary Core

61
No. Author (year) Country Journal Title
Research
method
Addressed themes
Logistics &
Marketing LSQ
CtS &
CPA
22 Blair Freeman et al.
(2000)
Germany Supply Chain
Forum
Managing your Cost-to-Serve Article Absent Absent Core
23 Kaplan R.S. et al.
(2001)
USA J. of Cost
Management
Measuring and managing
customer profitability
Article Absent Absent Core
24 Zeithaml V.A. et al.
(2001)
USA California
Management
Review
The customer pyramid: creating
and serving profitable customers
Research
paper
Absent Ancillary Core
25 Norek C.D. et al.
(2001)
USA Int. J. of Logistics
Management
Cost knowledge: a foundation for
improving supply chain
relationships
Research
paper
Absent Ancillary Ancillary
26 John T. Mentzer et al.
(2001)
USA J. of Marketing Logistics Service Quality as a
segment-customized process
Research
paper
Absent Core Absent
27 Göran Svensson
(2002)
Sweden European Business
Review
Supply chain management: the re-
integration of Marketing issues in
logistics theory and practice
Literature
review
Core Absent Absent
28 The Insitute of
Chartered Accountants
(2002)
England Good Practice
Guideline
Customer Profitability Analysis Article Absent Absent Core
29 Stapleton D. et al.
(2004)
USA Business Process
Management J.
Activity-based costing for
Logistics and Marketing
Conceptual
paper
Ancillary Absent Core
30 John T. Mentzer et al.
(2004)
USA Industrial
Marketing
Management
Global market segmentation for
Logistics services
Research
paper
Absent Ancillary Ancillary

62
No. Author (year) Country Journal Title
Research
method
Addressed themes
Logistics &
Marketing LSQ
CtS &
CPA
31 Darline Vandaele et al.
(2004)
Belgium Int. J. of u- and e-
service
Development of a measurement
scale for business -to-business
service quality
Working
paper
Absent Core Absent
32 Erik M. van Raaij
(2005)
Neth. Marketing
Intelligence &
Planning
The strategic value of Customer
Profitability Analysis
Literature
review
Absent Absent Core
33 Spiros Gounaris
(2005)
Greece J. of Services
Marketing
Measuring service quality in b2b
services: an evaluation of the
SERVQUAL scale
Research
paper
Absent Core Absent
34 Eleonora Bottani et al.
(2006)
Italy Int. J. of
Production
Economics
Strategic management of
Logistics service: a fuzzy QFD
approach
Research
paper
Absent Ancillary Ancillary
35 Uta Jüttner et al.
(2007)
England
Industrial
Marketing
Management
Demand chain management-
integrating Marketing and Supply
Chain management
Research
paper
Core Ancillary Ancillary
36 Hsiao Ching Chen et
al.
(2007)
Taiwan Int. Conference on
Industrial
Engineering
Analyzing customer satisfaction
and service level using AI
technique
Research
paper
Absent Ancillary Absent
37 Anthony D. Ross et al.
(2007)
USA Int. J. of
Production
Research
Optimizing 3PL service delivery
using a Cost-to-Serve
and action research framework
Research
paper
Absent Absent Core

63
No. Author (year) Country Journal Title
Research
method
Addressed themes
Logistics &
Marketing LSQ
CtS &
CPA
38 Yuexue Hu et al.
(2008)
China Int. Conference on
Service Operations
Analyzing Logistics service
performance Level based on
customer perception
Research
paper
Absent Ancillary Ancillary
39 Mariah M. et al.
(2008)
USA Supply Chain
Management: An
Int. J.
Determining a cost-effective
Customer Service level
Research
paper
Absent Ancillary Core
40 Reinaldo Guerreiro et
al.
(2008)
Brazil The Int. J. of
Logistics
Management
Cost-to-Serve measurement and
Customer Profitability Analysis
Case study Absent Absent Core
41 You Heng Huang et al.
(2009)
China Int. Conference on
Intelligent
Computation
Technology and
Automation
Research on the optimal
theoretical value of enterprise
Logistics service level
Research
paper
Absent Ancillary Absent
42 Estelle R.S. et al.
(2011)
USA Computers &
Industrial
Engineering
Combining a new data
classification technique and
regression analysis to predict the
Cost-to-Serve new customers
Article Absent Absent Core
43 Nai Hua Chen et al.
(2011)
Taiwan Springer Science
Business Media
Market segmentation, service
quality, and overall satisfaction:
self-organizing map and structural
equation modeling methods
Research
paper
Ancillary Ancillary Absent
44 Morten Holm V. et al.
(2012)
Denmark J. of the Academy
of Marketing
Science
Measuring customer profitability
in complex environments: an
interdisciplinary framework
Research
paper
Absent Ancillary Ancillary

64
No. Author (year) Country Journal Title
Research
method
Addressed themes
Logistics &
Marketing LSQ
CtS &
CPA
45
Varanya Tilokavichai
et al.
(2012)
India World Review of
Business Research
Establishing Customer Service
and Logistics management
relationship under uncertainty
Research
paper
Core Ancillary Absent
46 Ryszard Barcik et al.
(2013)
Poland University of
Bielsko-Biała press
Marketing and Logistics Research
papers
Core Absent Absent
47 Maria G. Piscopo
(2013)
USA Georgia State
University
Scholar Works
Effect of relationship quality and
Cost to Serve on customer value
in business market
Research
paper
Absent Ancillary Ancillary
48 Yannis Politis et al.
(2014)
Greece J. of Modelling in
Management
Logistics Service Quality and its
effects on customer satisfaction in
the manufacturing companies’
supply chains
Case study Absent Core Absent
49 Lei Sun et al.
(2014)
USA Computers &
Industrial
Engineering
Estimating the long-term Cost to
Serve new customers in joint
distribution
Research
paper
Absent Absent Core
50 Paul Hong et al.
(2014)
USA J. of Service
Management
Strategic Customer Service
orientation: an empirical study
Case study Ancillary Ancillary Absent
51 Weihua Liu et al.
(2014)
China Hindawi Publishing
Corporation
Discrete Dynamics
in Nature and
Society
A determination method of
optimal customization degree of
Logistics service supply chain
with mass customization service
Research
paper
Absent Ancillary Ancillary

65
Notes: Generally only the first author’s country is reported; as for the addressed themes, please note that: core, (one of the) central subject(s) of the paper;
ancillary, partially tackled within the paper but not as the main focus; absent, not discussed.
No. Author (year) Country Journal Title
Research
method
Addressed themes
Logistics &
Marketing LSQ
CtS &
CPA
52 Gajewska Teresa et al.
(2015)
Greece &
Poland
Int. Conference on
Advanced logistics
and Transport
Importance of Logistics services
attributes influencing customer
satisfaction
Research
paper
Absent Ancillary Absent
Table 1 – Classification of the reviewed papers

66
4.3 GENREAL OVERVIEW ABOUT LOCISTICS CUSTOMER SERVICE
The central issue for any business is how to meet or to exceed customers’ expectations, at an
affordable cost in respect to prices customer are willing to pay. This means overcoming the
tendency, within marketing, of taking decisions aimed entirely at the search for customer
satisfaction, without taking into account the effect on the profit. It also means overcoming the
tendency, within management control, of focusing on cost orientation without understanding the
effects on customer satisfaction. From a business point of view it means understanding the
relationships between services received and customers’ willingness to pay a specific price,
identifying the methodology of value creation for the customer and finding the costs of the activities
creating value for the customer in order to prove profit sustainability. In other words it means
creating a methodical approach which integrates the instruments employed in marketing and
logistics. Even though these disciplines have been studied separately, in recent years many logistics
texts and journal offer a large number of examples of how marketing and logistics interact in terms
of the marketing mix components. In fact, numerous marketing theories, concepts, and ideas are
applicable to the logistics field: the concept of market segmentation, for instance, is a strategic
marketing management tool that involves the clustering of customers who have similar responses to
a product offering in order to be able to maximize the value extraction. The conceptual foundations
of market segmentation can be easily conveyed to logistics: segmentation falls between
customization at one end of the spectrum and mass marketing at the other. Actually logistics
services have become a substantial source of competitive advantages between firms and major
challenges exist relative to their customization and, nowadays, irrespectively of produce markets or
service markets, customer demands present different levels and different characteristics. It means
that a type of product or service could possibly have the extremely high effectiveness to a certain
kind of customers in a market, but could actually be good for nothing to another kind of consumer.
Facing various customer’s demands, companies and industries as a whole can not meet the needs of
their entire customer base by providing standard logistics services. However, with respect to
logistics, it would generally be excessively expensive and highly unrealistic for companies to design
a separate logistics network for each and every customer except if there were a limited number of
customers. Otherwise, companies may waste resources and alienate customers by applying one
logistics scheme to all customers. Just as most businesses can recognize separate market segments,
Fuller et al. (1993) argue that most companies compete in logistically distinct businesses. While
Fuller et al. (1993) and Daley (1981) have espoused the value of logistical segmentation, such
segmentation has seldom been applied to transport and logistics decisions, and it is proved by the

67
lack of researches and case studies concerned with this theme. On the other hand, most companies
have taken a “generic” approach (Fuller, 1993) to the provision of logistics services supplying, for
instance, one single level of service to all customers. This frequently results in some customer
groups being overserved, while other customer clusters are underserved. The challenge thus is to
mature practical tools for logistical segmentation and in this vein, Fuller et al. (1993) provide a
number of different variables (e.g. unit value, sales volume) which might be used to segment
customers logistically. If customer segmentation can benefit companies in providing different
services to their customer it is also true that this subject stands at the base of the customer-service
costs measurement, and, more in general, at the base of the customer profitability analysis. For
instance Niraj et al. (2001) have noted that, in recent years, marketing professionals and
academicians have established a series of new marketing concepts with emphasis over the
importance of building relationships with customers. The straightforward principle behind these
concepts is that a customer-driven tactic enables a firm to focus on individual, or on homogeneous
groups, of customers and consequently enhance its profitability by serving these customers in a
differentiated way. An essential aspect of such a customer-driven marketing method is an
assessment of profitability at the customer level with a view for formulating more effective
marketing plans (Lloyd, 1982). Additionally, over the last 10 years, strategic cost management and
activity-based costing (ABC) have shaped a framework for firms to examine further closely the
drivers (or causes) of their costs in order to develop management choices and corporate
profitability. Companies originally focused on product profitability are now using ABC and other
models to examine deeply the profitability of distribution channels and customers. These analysis
are part of the customer profitability analysis (CPA) which consists in the analysis of the revenue
streams and service costs associated with specific customers or customer groups (Bottani, 2006).
Good practice suggests that the customer profitability analysis should be undertaken over the
lifetime of customers, so that a customer lifetime value (CLV) can be obtained. An accurate
customer-profitability analysis is compulsory if firms are to formulate appropriate marketing and
logistics strategies with the objective of maximizing their profits. Such an analysis involves first of
all the clear understanding of what are the common fields between marketing and logistics, then an
accurate assessment of customer service costs and profitability per customer.
In this context the three prominent themes further discussed in the following paragraphs are:
1. Marketing and logistics: diverse disciplines linked by the customer service rationale;
2. The evaluation of the logistics service quality;
68
3. The cost-to-serve (CTS) and the customer profitability analysis (CPA);
4.4 MAIN THEMES
The main themes emphasized in paragraph 4.3, given their input-output relationship, are discussed
separately and consecutively. Indeed the main highlights resulting from the dissertation of synergies
and commonalities between marketing and logistics might put the drive for a more detailed and well
comprehensive analysis the main drivers for the evaluation of the logistics service quality. In turn
the discussion about the Logistics Service Quality is supposed to support and strengthen the
awareness about the quality of the service provision, while the cost-to-serve is intended to
strengthen and support the awareness on the cost side of the service provision. In turn these two
may reinforce the background and influence the knowledge about the factors at the base of the
customer profitability analysis.
MARKETING AND LOGISTICS: DIVERSE DISCIPLINES LINKED BY THE
CUSTOMER SERVICE RATIONALE
From a first insight one may believe that marketing and logistics are two totally separate and
distinct disciplines, and worldwide it is acknowledged that they are generally very far from each
others. This hypothesis is well supported in the practical and empirical world by the current set-up
of companies: nowadays it is hardly conceivable to see and study companies treating logistics and
marketing together and establishing among them close relationships. Indeed the real world evidence
shows these two functions as two different drivers that rarely get in touch. However recent
emphasis on physical distribution in both academic and trade literature discloses a growing body of
knowledge around the commonalities between these disciplines, especially for what concerns the
concept of customer service. In fact both marketing and logistics disciplines have offered over years
various definitions of customer service, but they have failed to offer a comprehensive framework
representing it together with related marketing and logistics issues concurrently (Ryszard, 2013). As
a matter of fact customer service is in the process of a major evolution and the effort to more
accurately define and understand the area, its scope, role, responsibilities and definition have to be
discussed and questioned in details. The importance of customer service as a strategic issue has
emerged in particular during the last decade, due to a twofold reason (Bottani, 2006). First, brand
power has progressively decreased, making products almost undifferentiated in terms of
trademarks. Customers do not rely on brands except in a few market niches, such as fashion.
Second, due to technology diffusion, the functionalities and technological features of products tend

69
to be the same (Bottani, 2006). It means that today new customers cannot be acquired counting only
on brands or on technical characteristics of products. On the contrary, the breath of logistics
services related to products may play a noteworthy role in the competitive scenario (Vandermerwe
and Rada, 1988; Bailey, 1996). As a consequence of this shift towards service, customers have
become more and more exacting about logistics performances (Lee-Kelley, 2002). Many forces,
including an emerging buyer/seller relationship which accentuates closeness and understanding,
enlarged communication and information, organizational specialization, and substitutive
production/distribution techniques have in part instigated this evolution (Ryszard, 2013). Continued
efforts of marketing, which is concerned with the activities leading to the transaction, and logistics,
which addresses the physical movement and storage of goods and services contribute to improved
understanding of their roles and boundaries over customer service activities (Harris and Stock
1985). Consequently, this attention has led to some confusion over what customer service is, and
how it fits with marketing and logistics. Such confusion origins from a diversity of questions,
including: who should be responsible for customer service? is customer service conceptual,
strategic or operational?; and is customer service cost controller or profit driven? (Ryszard, 2013).
Some authors view customer service as a part of marketing or physical distribution (Kotler 1984;
Bowersox, Closs and Helferich 1986; LaLonde and Zinszer 1976; LaLonde, Cooper and
Noordewier 1988). Others, especially those within organizationally defined customer service groups
do not see themselves as a subset but rather a separate function of the company. The International
Customer Service Association (ICSA) defines customer service as “those functions within a
business that have customer satisfaction as their responsibility and provide that satisfaction through
the fulfilment of sales order demand and/or information needs” (ICSA Certification).
Organizationally, customer service involves a variety of people at different levels within the
organization and it is a pervasive, boundary-spanning activity that takes place from within and
beyond the firm (Ryszard, 2013). The key to create a unified perspective is integration from within
the firm and between the firm and the other channel members (Barton, 1995). Integration within the
firm should focus on marketing and logistics activities: these are the primary functions which
interface with the customer and the thrust of the firm (to obtain and service demand). As previously
evidenced, traditionally marketing and logistics have evolved separately within many corporations,
however, one key to resolve the role, responsibilities and scope of customer service begins with the
integration of these major customer contacting functions (Harris and Stock 1985) through a deep
dive about their activities over the market (Ryszard, 2013). Actually the market is a logical point of
departure for analysis of organizational activities and it is useful to introduce the notion of
70
“channel”, that, according to Palmer (2012) consists in the set of practices or activities necessary to
transfer the ownership of goods from the point of production to the point of consumption. Moreover
the channel is not only the way of products’ physical delivering to stores, but also a choice of
stores’ type, their location and forms of sales, which influences a way of products delivering to
consumers. The consideration of channel integration on the firm’s marketing and logistics activities
substantiates the need for coordinated marketing and logistics interface activities between channel
members as well as between the functional areas within each firm (Ryszard, 2013). As an example,
the salesperson’s ability to complete the transaction with the customer may be dependent on
logistics’ ability to deliver the product within the allowable delivery window determined by the
customer’s warehouse operating constraints. In this case the purchasing agent and salesperson
interact as marketing channel representatives, while the managers of the supplier and customer
warehouses and the transportation carriers participate in the logistics activities which contribute to
the transaction. Without coordination of the marketing and logistics functions within both firms,
channel effectiveness can not be maximized. The notion that the channel system is an appropriate
vehicle for integrating marketing and logistics activities is not new in literature, however what has
been lacking is a better understanding of how the coordinated efforts of marketers and logisticians
is required and impacts the ability of the channel system to deliver the appropriate service output
levels. As a consequence a deep dive about the main interfaces between marketing and logistics is
pointed out in agreement with what deeply evidenced by Lloyd M. Rinehart, M. Bixby Cooper and
George D. Wagenheim from the Michigan State University in 1987 with an article published on the
Journal of the Academy of Marketing Science.
Marketing activities have traditionally been classified into the general areas of product, price,
promotion, and place: the interaction of these four areas enables the possibility to carry out
transactions between the firm and its customers lead to customer satisfaction or dissatisfaction:
Product: marketing decisions with respect to the product have a direct impact on logistics.
The interface between these product decisions and logistical performance determines if
channel member expectations of service will be satisfied. For instance product line breadth
and width determines the number of stock keeping units (SKUs): as the number of SKUs
increases, customer expectations regarding product practical performance can be more
closely matched. Nevertheless, this increase in SKUs totally affects the ability of the
logistics system to maintain adequate inventory levels and fill rates. The likely result is that
the stock-out rate will increase, fill rates will decrease, and customer expectations regarding
71
product obtainability will not be met. Failure to provide availability of the product worsens
customer service levels and increases customer dissatisfaction. On top of that it is also
proven that packaging decisions are directly linked to logistics activities: package design,
size, and shape influence materials handling characteristics, transportation mode selection,
and space utilization issues in bit logistics facilities and transportation matters. Indeed
changes in package design can have a dramatic impact on all three of these areas (Razzano
1986). In addition, improved package design and reduced damage rates in shipment are
directly related, with concomitant results on customer satisfaction based on their perception
of the service provided by sellers.
Price: pricing decisions can have a similar effect on logistics activities with a severe impact
on customer service performance. The quantity discount structure serves to influence
customer order size, and order size, in turn, may be a determinant of the transportation mode
selected. A not well-designed discount structure may lead to numerous small orders or even
to less-than-truckload shipments. Alongside, traditional industry practices of periodic price
allowances and trade incentives might create a “bumpy” demand pattern (Powers 1985).
This pattern in demand can increase the difficulty in managing inventory levels, facility
utilization and transportation operations. The impact of a bouncy demand pattern is an
increase in stock-outs, decreased fill rates, and longer orders cycle times. Additionally
promotional decisions statements and promises made by the firm’s sales force during
negotiation with customers influence the customer’s expectations of customer service: such
declarations concern logistics activities which include delivery times and inventory
availability. In circumstances where the customer is told by the sales representative that the
product can be delivered on a certain day, the delivery on that day becomes a customer
expectation. When the delivery cannot be made on time, the discrepancy between the actual
performance and the expectation created during negotiation likely creates customer
dissatisfaction.
Place and promotion: behavioural and channel structure strategies influence the customer
service provided by the firm. A classic example of this is when the producer wants to
achieve additional control over the product display, promotion and pricing to consumers: in
one hand this strategy enables the producer to see what is going on in the market making
empowering it in collecting feedbacks and improving market awareness, on the other hand
this creates a reduced retailer control of product management and other marketing
responsibilities creating dissatisfaction when retailers want to implement promotional or

72
pricing strategies of their own, which were not part of the accepted policy of the produces.
Beside that the postponement strategy is an often ignored channel alternative which is also
directly related to logistical activity (Alderson 1950): implementation of the principle results
in shifting activities through the channel in an effort to gain logistical efficiency and/or
higher service levels. In addition to channel structure and control, firms have found
advantages by trading off the cost of carrying inventory in the channel, with the cost of
locating production and assembly operations closer to customers: firms implementing a
postponement strategy may locate final assembly and packaging operations at their
distribution centres. This strategy provides higher levels of service by allowing customer
specification of product characteristics while at the same time reducing transportation time
for delivery.
In addition to the marketing mix leverages also some major logistics strategies and activities are
intended to influence the customer service strategies, and they are:
Inventory decisions: customers’ inventory requirements cans influence the level of service
expected. Actually customers who attempt to minimize inventory, often require that
suppliers assume the cost of keeping inventory in the channel, or the cost of first-class
transportation to meet the service standards required for a just-in-time inventory
management strategy: these systems force more formal vertical marketing relationships
between suppliers and customers. They also require different roles for sales representatives
who must make service performance a priority: customers who use a just-in-time philosophy
with their suppliers reduce their inventory carrying costs which allow greater flexibility in
establishing prices, but given the need to replenish constantly the customer they increase
transportation costs. Firms in free flow channel systems that do not capitalize on established
relationships within the channel must be prepared to interface with independent distributors
that draw from existing inventories. Delivery from these inventories can provide a high level
of customer service without the need for an established ongoing relationship between the
parties. However, in these systems each firm assumes greater costs in holding inventories,
maintaining facilities, and staffing the sales force that pushes the product in the channel,
which results in higher product prices.
Transportation decisions: transportation decisions can provide divergent levels of customer
service within the channel and influence the price offered to the customer. The modes and
carriers used by suppliers influence arrival times and ultimately the customers perception of

73
the service level provided by the supplier. For-hire carriage may be used in free flow
systems to maximize the level of customer service provided to one time customers or to
customers that order infrequently. In other situations, the customer may demand the use of a
specific carrier with the threat to take their business elsewhere if the carrier is not used. On
the other hand, arrangements made between two members of an administered vertical
marketing system may justify the use of contract carriage to provide service when the
contractual agreement between the supplier and the carder may have a stronger legal base
than the agreement between the supplier and the customer for the goods being moved.
Finally, private fleets give participants at all levels of the channel the opportunity to directly
control the movement of products to and from their locations. This can maximize the benefit
from the cost/service trade-offs which influence the transaction and customer service
environments.
As widely showed, in addition to the marketing mix leverages, both inventory and transportation
decisions represents a sort of link between marketing and logistics: actually literature well explains
how logistics and marketing are strictly wired and what is the importance of the roles they mutually
perform, with special regards to the process of delivering a consistent and effective customer
service. The tangible aspects of this linkages have been someway evaluated through the logistics
service quality function that is going to be assessed in the following paragraph.
LOGISTICS SERVICE QUALITY
As highlighted through the dissertation about the customer service, many businesses have moved
beyond viewing Logistics as merely an area for cost improvements to viewing logistics as a key
source of competitive advantage (Novack, Rinehart, and Langley 1994) and as a significant driver
for the provision of an optimal customer service. Stemming from this stream of research, logistics
service capabilities can be leveraged to create customer and supplier value through service
performance (Novack, Rinehart, and Langley 1994); increase market share (Daugherty, Stank, and
Ellinger 1998); enable mass customization (Gooley 1998); positively affect customer satisfaction
and, in turn, corporate performance (Dresner and Xu 1995). However to successfully leverage on
Logistics excellence as a competitive advantage to customers, logisticians must coordinate with
marketing departments (Kahn 1996; Kahn and Mentzer 1996; Mentzer and Williams 2001; Murphy
and Poist 1996; Williams et al. 1997). Actually the quality of logistics service performance is a key
marketing component that helps create customer satisfaction (Bienstock, Mentzer, and Bird 1997;
Mentzer, Gomes, and Krapfel 1989). There are many definitions and descriptions of how logistics
74
creates customer satisfaction. The most traditional are based on the creation of time and place utility
(Perreault and Russ 1974). The so-called “Seven Rs” describe the attributes of the company's
product/service offering that lead to utility creation through logistics service; that is, part of a
product's marketing offering is the company's ability to deliver the right amount of the right product
at the right place at the right time in the right condition at the right price with the right information
(Coyle, Bardi, and Langley 1992; Shapiro and Heskett 1985; Stock and Lambert 1987). On the
other hand Parasuraman, Zeithaml and Berry (1985), on the basis of focus group interviews with
customers and in-depth interviews with executives in consumer sectors, defined ten dimensions of
service quality: tangibles, reliability, responsiveness, competence, access, courtesy, communication,
credibility, security and understanding the customer. Subsequent research (Parasuraman, Zeithaml
and Berry, 1988) exposed only five dimensions. Tangibles, reliability and responsiveness remain
the same, while assurance and empathy incorporate the other seven dimensions. Moreover in the
past, it has been assumed that the service quality dimensions found in consumer settings could be
applied to business markets as well (Holmlund and Kock, 1995). However, in a B2B environment
other factors may play a role in perceived service quality than the ones found in a B2C context.
Kong and Mayo (1993) stated that reliability and responsiveness may also be important in a
business setting, but a dimension dealing with innovativeness can be important as well. In their
study, Babakus, Pedrick and Richardson (1995) observed that price could be another indicator of a
dimensional conceptualization of perceived service quality. The most elaborate research for the
determinants of perceived service quality in a business setting was published by Westbrook and
Peterson (1998). The academics discovered twelve dimensions or determinants for perceived
service quality in a B2B environment: responsiveness, competence, consultative selling, reliability,
price, interpersonal skills, accessibility, credibility, product offering, market clout, geographical
presence and tangibles. The comparison of the ten dimensions of perceived service quality initially
defined by Parasuraman, Zeithaml and Berry (1985) (B2C dimensions) and the twelve dimensions
for perceived service quality in a business scenery defined by Westbrook and Peterson (1998) (B2B
dimensions) reveals that some of the scopes defined in a consumer context also appear in a business
context, like reliability, responsiveness, competence, accessibility, and credibility However, not all
the dimensions are similar across the two different settings. The B2C tangibles dimension
encompasses the physical evidence of the service, while the B2B tangibles dimension stresses the
tangible support for service delivery. The research of Westbrook and Peterson (1998) also revealed
four dimensions which were not indicated by Parasuraman, Zeithaml and Berry (1985): price,
product offering, market clout and geographical presence. This comparison between the

75
determinants of perceived service quality in a consumer (Parasuraman, Zeithaml and Berry, 1985)
versus a business (Westbrook and Peterson, 1998) setting confirms the previous research of Kong
and Mayo (1993) and Babakus, Pedrick and Richardson (1995): in a B2B environment other
determinants may play a role in perceived service quality. Until now, the instrument to measure
perceived service quality that is most widely spread, in academic research but also in practice (Lam
and Woo, 1997), is the SERVQUAL scale developed by Parasuraman, Zeithaml and Berry in 1988
(Parasuraman, Zeithaml and Berry, 1988). This assessment of perceived service quality by means of
SERVQUAL is based on the service quality dimensions (Parasuraman, Zeithaml and Berry, 1988).
As those dimensions are not identical in a consumer versus a business framework, the measurement
of perceived service quality in a B2B context needs to comprise other determinants than those used
in a B2C context. As a consequence over years a new scale, called the B2B SERVQUAL scale,
intended to measure the perceived service quality in a B2B environment and based on the business
scopes as defined by Westbrook and Peterson (1998), has been developed. In order to do so the
items defined by Parasuraman, Zeithaml and Berry (1988) to outline the SERVQUAL are replaced
by items that refer more to a business environment. Moreover, the five dimensions defined by
Parasuraman, Zeithaml and Berry (1988) are converted and extended with other dimensions that
seem to play a role in the perceived service quality of a B2B setting, based on the research of
Westbrook and Peterson (1998). These aspects have been widely studied in a research by Gajewska
(2015), in which the author assessed the importance of the logistics services attributes influencing
business customer satisfaction with the quality of logistics services. It was concluded that according
to customers’ expectations, the most important attributes were the promptness and the timeliness of
deliveries, followed by completeness of deliveries, whilst the least important was the transportation
conditions (Gajewska, 2003). On top of this research the promptness and the timeliness as well as
the quality of the physical distribution service industrial purchasers received from suppliers has
been shown to be an important consideration in industrial purchasing decisions, and both
corporations and researchers are becoming increasingly aware of the strategic role of logistics
services in a firm's overall success (Bienstock, Mentzer, and Bird 1997; Bowersox, Mentzer, and
Speh 1995; Brensinger and Lambert 1990; Mentzer, Gomes, and Krapfel 1989). In particular
Bienstock, Mentzer, and Bird developed a multi stage model to evaluate the satisfaction level of the
customer. Among the other findings they pointed out that order release quantities positively affects
order accuracy and timeliness, and in turn that timeliness positively affects satisfaction. Actually
timeliness has long been discussed as an important component of logistics services: these scholars
theorized that an order would be considered on time when it was considered accurate, in good

76
condition, and of acceptable quality. If these three criteria are not met, timeliness is also affected by
when the discrepancies are handled adequately. Then, additionally, they hypothesized that
perceptions of order accuracy. order condition, order quality, and order discrepancy handling affect
perceptions of timeliness (Bienstock, Mentzer, and Bird, 1997).
It is pretty evident that the SERQUAL has been widely used among logisticians and marketers;
however in recent years a SERVQAL dedicated to the business-to-business market has been
developed. In this particular kind of scale particular attention has been put over the timeliness
perspective of logistics that has been widely discussed mainly by academicians. However logistics
service quality does not consist in the only one parameter used to assess capabilities in service
provision. Actually in literature another approach to service orientation is diffused, the cost to serve.
This particular methodology is generally intended to assess the service delivery under an
economical point of view, and according to many academicians it should be studied concurrently
with the logistics service quality.
COST TO SERVE AND CUSTOMER PROFITABILITY ANALYSIS
Customer service is an extremely important aspect of the corporate physical distribution operation,
and the physical distribution management must operate with a continual inter relationship with
customer service. Indeed it makes no sense to minimise total distribution costs if at the same time
customer relations are being eroded. On the other hand customer service levels can be excessive and
wasteful of resources (Gilmour, 1976). The difficult task is to find the balance between these
extremes. “The problem at the management interface between marketing and distribution is to
decide where on the trade-off continuum between distribution cost and customer service the
company should operate.” (Yannis, 2014) Related to this task, logistics literature offers generally
two divergent main approaches: the total cost concept and the customer service concept. The total
cost concept considers logistics as a cost incurring function, which has to be managed by
minimizing total logistics costs. According to the total cost concept, the costs of individual
functions need not be at their optimum, but attention must be paid to minimizing the delivery costs
of the entire firm (Pirttila, 1996). To avoid excessive attention to cost control, and to focus more on
the needs of customers, the customer service concept could be applied. In the customer service
approach, logistics customer service is split into components or service elements making it possible
for a company to differentiate itself from the competitors by offering better logistics services
appreciated by the customers. With regards to the total cost concept firms incur a series of cost and
expenses to develop and maintain relationship with customers (Piscopio, 2013). Such costs may

77
include communication, support service, loyalty programs and order management among others
(Kumar and Rajan, 2009; Niraj, Foster, Gupta, and Narasimhan, 2008). However, customers are not
equal in the amount of services and activities they demand from suppliers, consuming unequal
amount of resources: actually activities such as order management, logistics, sales and marketing
support are performed at different levels for different customers (Piscopio, 2013). The cost of
maintaining relationships can vary greatly across customers, impacting the profit generated from
relationships (Van Triest, 2009). An assessment of the value generated by a customer relationship is
not complete without including all costs and expenses dedicated to serve such relationship
(Guerreiro et al., 2008; Niraj, 2001). Different terms are found in the literature to refer to the cost of
serving and maintaining customer relationships, being some: customer-specific cost (Niraj, 2001),
customer relationship costs (Van Raaij, 2005), customer-specific marketing expenses (Van Triest,
2009), marketing cost (Kumar, 2008), relationship cost (Stahl, Matzler, & Hinterhuber, 2003), cost
of sales (Berger, 1998), customer service cost (Niraj, 2008) and, finally, cost-to-serve (Braithwaite,
1998; Guerreiro, 2008; Kaplan, 2001; Ryals, 2006). Cost-to-serve (CtS) has been demarcated as the
total pre-sale, order related, distribution, and post-sale service cost required to preserve an ongoing
exchange relationship with a customer firm (Guerreiro, 2008). Cost-to-Serve® also refers to a
quantitative, financial-driven practice developed and registered by Braithwaite and Samakh
(Braithwaite, 1998). Their method analyses how costs are spent throughout the supply chain and
estimates the profitability of products, customers and marketing channels. The evidence is then used
in decision making to optimize firm’s profitability. Cost-to-Serve is a more comprehensive concept
than customer-specific marketing cost, including relevant logistic and financial costs related to
servicing individual customers. Kaplan and Cooper (1999) explained their cost-to-serve analysis
and matured a model to classify customers based on how costly they are to serve (dividing
customers into high and low cost-to-serve). In their conceptualization, drivers of high cost-to-serve
customers comprise demand for customized products, customization and changes in delivery
requirements, small and random orders, large amount of presales support (marketing, technical and
sales resources), large amount of post-sales support (installation, training, warranties, etc.,),
inventory requirements. The authors stated that low cost-to-serve customers are not automatically
profitable: profitability depends on the gross margin the customer generates, which finally depends
on relationship specific policies. Their model proposes a two by two matrix in which the horizontal
axis represents the cost-to-serve and the vertical axis reproduces net margin (revenue minus cost of
goods sold). Customers above the diagonal line are profitable while the ones below engender losses.
There is no problem with customers demanding high service level as long as they are willing to pay

78
for them. Selling firms’ strategy should attempt to move all customers to the profit area, by either
reducing cost-to-serve or improving the margin of customers. Customers in the bottom right
quadrant (low-margin, high CtS) represent a major challenge. Later on Niraj, Gupta and
Narasimhan (2001) developed a model to estimate customer profitability from a supply chain
perspective. The authors calculated customer-specific costs by determining the share of supply
chain activities that are attributable to individual customers. Their model includes both complexity
and efficiency factors that can either increase or decrease customer-specific costs. They found
empirical evidence that even though sales volume remains an important meter of customer
profitability, differences in the cost of serving the customer play an equally important role. In a later
study Niraj and colleagues (2008) estimated the cost of servicing customers by using an activity-
based costing approach and including seven major activities areas: order processing, sales, delivery,
expedited delivery, quality management, purchasing and warehousing. Costs of these events are
allocated to customers using three categories of cost drivers: volume related drivers, complexity
related drivers and efficiency related drivers. Customer-specific marketing expenses have also been
used to estimate the profitability of individual customers. A 2009 study classifies marketing
expenses in two categories: general and customer-specific, which they define as those “made to
increase profitability in specifically target customers” (Van Triest, 2009). The authors found
evidence that customers receiving higher customer-specific expenses show higher retention rate,
sales and profits. However, their study also shows that volume is the main driver of both retention
and customer profitability. Since cost-to-serve includes all sales, marketing, administrative and
logistic costs incurred while serving a customer, customer-specific marketing investment can be
considered a sub-set of cost-to-serve. Cost-to-serve is a decision variable controlled by the selling
firm (Venkatesan, 2007) but also depends on customer behaviour (Guerreiro, 2008): customers vary
in their demands for service, their customization requests, their ordering patterns, and their
propensity to return sales to name a few behaviours (Piscopio, 2013). The more bargaining power
customers have over suppliers, the more demanding they would be and the more costly to serve.
Customers bargaining power is strong when customers are large, concentrated and educated about
the product they are buying (Porter, 2008). Cost-to-serve is of particular relevance in business-to-
business marketing, where customers tend to have more bargaining power over suppliers due to
their size and concentration. Organizational customers tend to be more demanding and expect a
higher level of customized service. Organizations usually need higher level of technical support
than consumers do, especially when the firm’s offering impacts the customer’s production process.

79
In general, the cost of maintaining relationships in business-to-business markets is more significant
than in consumer markets.
Even though several models have been discussed there is a certain degree of uncertainty when the
cost-to-serve has to be measured. For instance most academics, with the notable exception of
Johnson (1992), have advocated the ABC system as the most appropriate costing method for
measuring customer-service costs. Kaplan and Cooper (1998) stated that the ABC system is, in
theory, the most appropriate method for determining customer-service costs in companies with
complex product, customer, and service requirements. However, despite this endorsement, ABC
accounting has traditionally been applied to the measurement of costs in manufacturing activities,
and only a limited number of empirical studies have applied this system to customer-service
activities (Guerreiro, 2008). Other authors who have addressed this subject include Lewis (1991),
who described a relatively simple ABC system for assessing marketing costs per product line and
specified how this might be used to structure a profitability statement. Turney and Stratton (1992)
presented a more organized activity-based model that included two activity levels – micro-activities
and macro-activities – in allocating costs to products and customers. Foster and Gupta (1994)
emphasized that marketing costs represent a significant part of the cost structure of many
companies; however, in comparison with industrial cost studies, they noted that marketing costs
have received very little consideration in the accounting literature. Stapleton et al. (2004) noted that
the ABC system, after more than a decade of slow growth, had been achieving greater acceptance as
a marketing and logistics cost-determination tool. In addition to these contributions, various
conceptual studies have associated logistics activities and customer-service costs (Lambert and
Lewis, 1983; Pohlen and LaLonde, 1994; Lambert and Burduroglu, 2000; Cokins, 2003). In the
costing process of different objects, such as customers and marketing channels, Kaplan and Cooper
(1998) recommended the allocation of sales, marketing, distribution and administrative (SMDA)
expenses to the costing objects, in accordance with the proposal of Christopher (1997). Kaplan and
Cooper (1998) noted that such an allocation of expenses is not usually applied to customers because
it is generally considered that these expenses are fixed and that any allocation would be random and
confusing. However, in view of the growth of these expenses in all companies, Kaplan and Cooper
(1998) argued that they are not actually fixed costs but they could not be considered variable costs
because they are not directly influenced by sales volumes. Therefore, Kaplan and Cooper (1998)
created a distinctive categorization to be applied to SMDA expenses – super-variable expenses. In
an effort to identify the ABC method, Anderson and Kaplan (2004) proposed a so-called time-

80
driven ABC. The novelty of this approach is its emphasis on time as an activity-time driver and its
determination of the unit times of services and non-used capacity time.
At the end over years hundreds ways on how to assess the cost-to-serve and the customer
profitability analysis have been pointed out, and nowadays little evidence exists on what is
considered as the best way. Actually almost all the approaches highlighted and discussed by
scholars have found time by time practical implication in the real world and, at the moment, the
assessment of the performance of these costing methods has not been fully appraised. As a
consequence it is practically impossible to determine, with the instruments academicians have on
hands, what is the best performing costing technique. Many scholars believe that there are different
effective approaches and that their validity depends on the actual case in which they are applied.
Actually, according to Cooper (1998) each case has to be clearly and fully studied in order to
determine, on a case-by-case perspective, the most appropriate technique to assess the cost-to-serve
and to perform a meaningful customer profitability analysis.
4.5 GAP ANALYSIS AND CONCLUSIONS
In this literature review section 52 contributions published between 1948 and 2015 on the mutual
linkages between marketing and logistics and on descendent themes have been analysed. The papers
have been revised with a two-pronged approach: research method(s) adopted and paper contents.
The contribution is twofold: first, the development of a structured review that provides a guide to
understand how the field of research had assessed the above mentioned themes, and second, and the
identification of research issues for practical implementation. In general, a number of interesting
themes in literature has been found: an in-depth analysis on the specific theme of past and present
integration between marketing and logistics, their commonalities and their linkages has been
performed. It has been observed that the topic has been tackled so far by several authors, thus
highlighting the rising interest that researchers have in this theme. While contributions from the
“public” (i.e. institutional) perspective are generally missing and papers focusing on practical
implementation cases are totally absent. An absence of real world cases has been encountered also
for the other two themes of this literature review: in fact, apart the outstanding work of Gajewska
(2003) there is no evidence of practical application on how to practically measure the service
quality of logistics and its cost-to-serve in real world companies. As far as the methodology is
concerned, the review revealed that, alongside what expressed above, most of the examined articles

81
are research papers and also a number of conceptual papers have been analysed. At the opposite
very few contributions based empirical studies have been encountered.
This review has thus revealed that the most important area, the practical submission of theoretical
concepts (whatever the topic under analysis among the three evidenced) is under-represented. In
general, what has emerged is the substantial lack of an up-to-date application in industrial as well as
service on one hand and in business-to-business and business-to-consumers environments as well of
the theoretical aspects that have been widely discussed among academicians. Moreover, the two
subjects that could have been most likely studied under a practical point of view are not fine defined
in theory as well: it seems that, even if the topics have been over years extensively assessed, a
coherent model and a well-articulated execution strategy have not been designed yet. This results in
the impossibility for practitioners willing to translate theory into practice to find a valid prototype as
well as findings on which to base their implementation studies. Furthermore, from the point of view
of the research methods, the under-representation of certain research methodologies, i.e. empirical
studies and simulations, suggests opportunities in future research. This study has one major
limitation which has to be considered. Indeed, while efforts were made to be all-inclusive, as Boone
et al. (2007) recognised in their review of postponement, relevant research efforts may have been
inadvertently omitted.

82
5. THE PROJECT IN LUXOTTICA
The present dissertation is integrated in a project carried out within Luxottica operations and
focused in improving the logistics customer service and its related processes in order to somehow
have an impact on both effectiveness and efficiency. This section of the dissertation is thus aimed at
describing the perimeter of the project and the KPIs utilized in order to provide an overview of the
instruments exploited to depict the AS IS processes and the possible insights for improvement.
More in particular, in the first paragraph, a general overview about the on-field experience is
provided, and then the second paragraph presents a deep-dive on the part of the business under
analysis. Subsequently, in the third paragraph, the perimeter is further refined and the main KPIs are
disclosed.
5.1 GENERAL OVERVIEW
The experience in Luxottica took place from 2015, September the 7th
, within the EMEA
Transportation Team in Sedico Distribution Centre. The main tasks concerned with that experience
deal with the management of transport related KPIs aimed at measuring the overall speed of
Luxottica logistics network and on their improvement as well. Additionally there has been the
opportunity to deal with some projects among which the one further examined in the present study.
This pilot project, managed for the first time in Luxottica, is aimed at revising, and consequently
reorganizing, the logistics services delivered to a special category of Luxottica’s customers, STARS
ones. Further information about this particular kind of business are evidenced in the following
sections, however, before moving ahead it crucial to understand that in drawing and finalizing the
current dissertation two major constraints have arisen: the on-field level of complexity and the need
to preserve sensitive data. Indeed, on one hand, Luxottica’s multidimensional structure and huge
size result in an extremely heterogeneous domain that can not always be simplified into few and
easy describable as well as understandable variables: each business decision is influenced by
thousands of aspects and thus the activity to reduce complexity might sometimes result too
simplistic, even though necessary in order to move further along with the project objectives. On the
other hand, the order of magnitude of the Company and its world-class leader role in the market has
forced not to publish all the relevant information and data utilized for the purpose of this research.
Additionally, some delicate phases of calculus as well as explanations of process and output figures
have been concealed on purpose in order not to lose the opportunity to publish the present
dissertation.

83
5.2 THE FOCUS OF THE STUDY
The present research is focused on a particular trade channel, the so-called STARS. STARS is the
acronym of Superior Turn Automatic Replenishment System, and this particular way of doing
business is devoted to opticians with whom Luxottica has established a partnership program that
allows the Company to manage an independent store as a proprietary one. STARS business model
has been introduced in 2002 by Luxottica within its Wholesale division with the aim to provide
customers with an enhanced service that leverages Company’s knowledge of local markets and
brands to deliver new, high-turnover products and maintain optimal inventory levels at each point
of sale. By strengthening the partnership between Luxottica and its customers, this program directly
manages product selection activities, assortment planning and automatic replenishment of
Luxottica’s products in the store on behalf of the third-party customer, utilizing ad hoc systems,
tools and state-of-the-art planning techniques. At the end of 2015, STARS served a total of over
5,700 stores in the major European markets, United States, Middle East and emerging markets for a
total of 55 countries offering to customers:
1. Best product selection, based on brand segmentation, store profiles and market best
sellers;
2. Continuous refresh of products in line with new releases and market trends plus recalls
of slow moving items;
3. Automatic replenishment system to timely replace sold items through exchange of sell-
out data;
4. Store consulting activity and merchandising tools to optimize displays and store layouts;
5. Optimized stock levels based on sales trends, seasonality and store profiles;
These five key pillars engender likewise crucial benefits for customers:
1. Guaranteed increase of sales: steady sales increase through a faster turn of display. During
the first year of partnership sales increase up to 25%, while in the years beyond they usually
grow at 8-10% yearly;
2. Optimized working capital: lower inventory levels through lower back stock and fast
replenishment. Being STARS customers’ stock directly managed by Luxottica they do not
face any problem of back stock and their replenishment is automatically planned by the
Company;
84
3. Faster go to market: priority on new releases through an advanced selection. STARS
membership allows opticians to receive in advance in respect to standard customers new
items and collections;
4. Sharing of expertise: a global benchmark available for stores. Luxottica shares its global
expertise with opticians helping them to have always available the world’s top selling
frames;
5. Lower operating costs: more efficiencies in stores’ supply chain activities. Luxottica plans
in agreement with stores the dispatching frequency of orders and the delivery service, so that
opticians know in advance when the replenishment is carried out;
The partnership is acknowledged to be a sort of win-win solution: in one hand opticians benefit
from Luxottica’s endorsement and market awareness, on the other hand Luxottica benefits from the
opportunity to enter in the retail market without owning the physical point of sale and thus without
impacting, among the others, on fixed assets. Exactly for this reason this particular channel of trade
is well developed in more than 55 countries globally, and its expansion trend is continuously rising.
5.2.1 BUSINESS DESIGN
STARS business is designed and organized into four main geographically areas: EMEA (Europe,
Middle East and Africa), APAC (Asia Pacific), LATAM (Latin America) and US (United States
and Canada). However, due to the vastness of the business in each macro region, the trade channel
is managed with a country-by-country perspective. Furthermore, within the single countries,
STARS customers are then segmented on the basis of both quantitative and qualitative variables.
From a quantitative point of view the sell-out consists in the most important parameter, which
basically is made up of in the number of frames sold by a STARS point of sale to end customers. In
addition to the sell-out the surface of the store and of its own showcases are then considered. On the
other hand, assuming a qualitative perspective, the location of the store and its relevance,
qualitatively evaluated in terms of visibility opportunities it can create over customers, are taken
into account as well. The combination of these variables engenders the establishment of four main
classes: 0, 1, 2 and 3. In addition to these classes there are some other STARS customers that, given
the particularity of the business they manage, are treated differently. These categories are
Boutiques, Online stores, Outlets and DCs, and they are replenished with particular assortments and
specific price policies.
On the basis of the above mentioned variables it is thus possible to distinguish between:

85
0
Class 0 is defined on the basis of the sell-out and it generally (each country is free to
slightly adapt the boundary in accordance with the peculiarities of the market)
includes only opticians that sell more than 3000 frames per year.
1
Class 1 is defined on the basis of the sell-out and it generally (each country is free to
slightly adapt the boundaries in accordance with the peculiarities of the market)
includes only opticians that sell no less than 800 frames per year, but no more than
3000. In combination to the sell-out class 1 is characterized by other variables, such as
the assortment, which is mostly focused on high-end brands.
2
Class 2 is defined on the basis of the sell-out and it generally (each country is free to
slightly adapt the boundaries in accordance with the peculiarities of the market)
includes only opticians that sell no less than 800 frames per year, but no more than
3000. In combination to the sell-out class 2 is characterized by other variables, such as
the assortment, which is mostly focused on medium-end brands.
3
Class 3 is defined on the basis of the sell-out and it generally (each country is free to
slightly adapt the boundary in accordance with the peculiarities of the market)
includes only opticians that sell no more than 800 frames per year.
Additionally the other classes can be described in the following way:
Boutique
Boutiques are mono-brand stores that are filled with special assortments and served
with higher priority in respect to other STARS customers. Being focused on the
luxury segment their sales volume is not considered as the primary objective and thus
the sell-out is not taken into account for this kind of customers. On the other hand the
position and visibility of stores is a crucial variable to determine their importance.
Online
Online are non-physical stores involved on the e-commerce business. These kinds of
stores have a dedicated assortment which is more general and ample in respect to
STARS physical stores and includes especially sunglasses rather than eyeglasses.
Outlet Outlets are multi-brand stores that are filled with ad-hoc and exclusive assortments
and apply special price practices.
DC Distribution Centres warehouses of customers that manage several points of sale and
that prefer to receive a consolidate shipping instead direct to store deliveries.
Table 2 – STARS classes based on sell-out
Table 3 – STARS classes not based on sell-out

86
5.2.2 LOGISTICS NETWORK SETUP
As reported above two pillars of the STARS business are the possibility for opticians to have a
continuous refresh of product in line with new releases and market trends plus recalls of slow
moving items and the opportunity to have an optimized stock levels based on sales trends,
seasonality and store profiles. In order to effectively and consistently deliver these privileges to its
customers Luxottica needs to optimize and continuously improve not only its internal processes,
such as demand planning and after sales services, but it is also required to reliably manage what is
beyond its boundaries, such as the transportation. Actually Luxottica works closely with a restricted
number of logistics providers with whom it has developed long term partnerships as well as
cooperation platforms. Generally STARS stores of each region are served by a representative
distribution centre (Sedico, Italy, for EMEA, Dong Guan, China, for LATAM, Campinas, Brazil,
for LATAM and Atlanta, Georgia, for US); however, if business requirements can not be directly
and briefly satisfied by the representative DC, a back-up network of direct shipments from the other
DCs exists. In order to assure state-of-the art deliveries the Company works with three main kinds
of logistics service providers:
Global forwarders, which are mainly intended to move large portions of freight across the
different DCs. Luxottica deals with few trusted partners for covering its worldwide STARS
needs and thanks to a joint cooperation it has created over years a hub and spoke network;
Couriers and express couriers, which are mainly intended to carry out either 24 hours or 48
hours national and international deliveries of medium-small shipments. Luxottica generally
has a partner for each single country (or set of homogeneous countries, such as BENELUX)
in order to exploit in full couriers’ awareness of the local market;
Groupage service providers, which are mainly intended to carry out either 48 or 72 hours
international deliveries of large consolidated shipments. Generally Luxottica make use of
these providers to fulfil the needs of single STARS customers that given their huge sell-out
volumes justify a dedicated delivery;
On top of these three main solutions the Company deals with other types of providers to reach
either difficult countries (i.e. countries for which long lasting and time consuming customs
operations are needed) or depressed zones. Additionally the above mentioned transportation
solutions can be mixed together in order to reach relevant markets that are not geographically close
to the main DCs. This is the case of Turkey, UAE or South Africa, which are generally served by a
mixed model in which a global forwarder is appointed to move consolidated shipments from the

87
representative DC to the domestic courier’s hub, which in turn is employed in order to carry out the
final delivery to the store.
5.3 THE VARIABLES OF THE STUDY
The present study goes through the assessment of STARS business according to by two main steps:
First of all, in order to reduce the complexity of the business case and obtain an homogenous
sample on which to build the analysis, the perimeter of the study is restricted to a sample of
representative countries. Rules and final outcomes are discussed in paragraph 5.3.1;
Secondly the parameters used to assess the performance of STARS markets included in the
perimeter are discussed in details in paragraph 5.3.2. These KPIs are the Logistics Service
Quality to STARS customers and the Cost-to-Serve;
5.3.1 THE PERIMETER
Given the global coverage of STARS business it is reasonable to expect a huge network complexity
as well as the existence of several dissimilarities from country to country in terms of business
management. As a matter of fact dealing with such complexity would be counterproductive: the
great diversity that characterizes the business case would lead to a lack of focus and a waste of
resources. In addition being the project aimed at creating an overall and cross-cutting model there
are no reasons to deal with an extreme heterogeneous set of variables. Given these assumptions it is
thus reasonable to define both a temporal and a physical perimeter through which complexity can
be reduced. Additionally the perimeter has to be further refined through a deep dive about STARS
classes.
TIME
In terms of time the perimeter is related to the year 2015 only: all STARS customers that have
received at least one shipment between 2015, January the 1st and 2015, December the 31
st are taken
into account. These boundaries allow dealing with the most recent, but steadying, data so as to
characterize the analysis by high accuracy, well representing the trends of the markets.
GEOGRAPHY
The definition of the physical perimeter, in terms of which countries to analyse, requires a more
careful analysis rather than for the temporal perimeter. Actually to narrow the field and to reduce
diversity it is possible to consider only the countries that are served by the same Distribution
Centre. Being Sedico DC in charge of serving all the EMEA customers, the geographical

88
boundaries are restricted to the EMEA region only. However, this region consists of 41 countries,
which, as a matter of fact, are still too uneven. As a consequence to refine the perimeter a weighted
analysis through the score points technique is carried out: EMEA countries with more than 10 stores
are thus compared on the basis of the following variables:
1. Sell-in 2015, which describes markets in terms of units shipped from Sedico DC to the
customers of each single country all along the 2015. The sell-in is thus comparable to the
sell-out (the number of units actually sold by stores to end customers must have the same
order of magnitude of the number of units actually shipped to stores from the DC) and so it
can be considered as the closest logistics variable to the turnover generated by the markets;
2. Number of STARS customers, which describes markets in terms of penetration of the
STARS channel of trade and it is directly proportional to the complexity of the logistics
network within a certain country;
COUNTRY
CODE COUNTRY
SELL-IN 2015
[units]
CUSTOMERS
[#]
AE United Arab Emirates 250.000 111
BH Bahrain 17.000 14
CH Switzerland 11.000 18
DE Germany 200.000 252
DK Denmark 43.000 115
EG Egypt 58.000 51
ES Spain 1.000.000 828
FR France 500.000 572
GB Great Britain 670.000 520
IN India 28.000 63
IT Italy 1.100.000 1075
KW Kuwait 38.000 32
LB Lebanon 38.000 18
NO Norway 27.000 90
OM Oman 16.000 10
PT Portugal 42.000 28

89
QA Qatar 99.000 44
SA South Africa 248.000 177
SE Saudi Arabia 119.000 28
These two variables, being strictly and equally linked to the two main drivers and scopes of the
project are considered to account the 50% each on the calculation of the countries’ score. However
their order of magnitude is greatly different and thus, to make them comparable, they are
normalized within a scale that ranges from 1 to 10:
COUNTRY
CODE COUNTRY
SELL-IN 2015
[units]
CUSTOMERS
[#] SCORE
AE United Arab Emirates 2,3 1,0 3.3
BH Bahrain 0,2 0,1 0,3
CH Switzerland 1 0,2 1,2
DE Germany 1,8 2,3 4,1
DK Denmark 0,4 1,1 1,5
EG Egypt 0,5 0,5 1,0
ES Spain 9,1 7,7 16,8
FR France 4,5 5,3 9,8
GB Great Britain 6,1 4,8 10,9
IN India 0,3 0,6 0,9
IT Italy 10 10 20
KW Kuwait 0,3 0,3 0,6
LB Lebanon 0,3 0,2 0,5
NO Norway 0,2 0,8 1,0
OM Oman 0,1 0,1 0,2
PT Portugal 0,4 0,3 0,7
QA Qatar 0,9 0,4 1,3
SA South Africa 2,3 1,6 3,9
SE Saudi Arabia 1,1 0,3 1,4
Table 4 – Main STARS markets: sell-in and n° of customers
Table 5 – Main STARS markets: sell-in and n° of customers normalized

90
As it emerges from the table above the most important country according to the previously defined
variables is Italy, followed by Spain, Great Britain, France Germany and South Africa. Then other
countries’ scores are slightly distant to these countries, pointing out a quite important gap in terms
of business size. Among these five countries five of them share a close geographical location (Italy,
Spain, Great Britain, France and Germany are quite nearby among each others), while South Africa
is visibly far from the others under a geographical point of view. This causes a potential
discrepancy in terms of transportation services to the latter market: given the centrality of Sedico
DC for the European countries these are served through couriers, express couriers, and groupage
service provider; on the other hand South Africa is served through a combination between a global
forwarder (for the international flow) and an express courier (for the local flow). This difference
clearly affects the businesses homogeneity and thus the study is further performed with disregard to
South Africa.
CLASSES
Nowadays among the 2.993 STARS customers belonging to the time and geographical perimeter of
the analysis, 2.799 (94%) are segmented on the basis of their sell-out, and the remainder 194 (6%)
on the basis of the trade channel to which they belong. More details, with an overview for the
different classes are reported in the table below:
SEGMENTATION CLASS STORES
[#]
STORES
[%]
Sell-out
0 97 3%
1 414 13%
2 679 21%
3 1.959 60%
Trade channel
Boutique 59 2%
Online 22 1%
Outlet 29 1%
DC 10 0%
It is clearly evident that the focal point of the STARS business is centred on the classes 0, 1, 2 and 3
rather than on classes clustered on the basis on the trade channel. Additionally, given the huge
Table 6 – STARS stores distribution per class

91
differences in terms of management of classes and assortments based on the sell-out variable rather
than on the trade channel, only customers belonging to former type of segmentation are further
taken into account in the following steps.
5.3.2 THE PARAMETERS
Results of the present research are based on the assessment of two min KPIs, that are the Logistics
Service Quality, used to assess the quality of the service provided to customers, and the Cost-to-
Serve, essential to understand how much the provision of that service costs.
LOGISTICS SERVICE QUALITY
As shown in paragraph 4 the Logistics Service Quality might be influenced by several different
parameters and evaluated through a well comprehensive set of KPIs. Nevertheless not all the
indicators can be quantitatively and precisely assessed and this might create the opportunity for
subjective interpretations. As a consequence, for the purpose of this study, only quantitatively KPIs
are considered. Again, as widely discussed in the literature, the KPIs could be selected among a
broad set, which consists, for instance on, Order Accuracy, Order Discrepancy Handling,
Timeliness, Order Release Quantities, Order to Delivery and on Delivery Frequency, etc., however
a further refinement is needed in order not to lose the focus of the analysis. Actually, as extensively
described in the previous paragraphs, the purpose of this study is to evaluate Luxottica’s
performance over its customers in terms of transportation matters, thus all the KPIs that do not
allow to monitor transportation performances and costs will be disregarded. It results that, in order
to properly fit Luxottica’s business characteristics, and, more in particular, STARS peculiarities, the
Order to Delivery Lead Time (OtD LT) and the Shipping Frequency (SF) are the only KPIs further
considered. Indeed on one hand the OtD Lead Time expresses how fast is the Company in serving
its customers as soon as they are willing to be served, on the other hand the Shipping Frequency
expresses how many times these customers are served. It is crucial to recognize that, if considered
alone, these KPIs are quite meaningfulness, while, if considered concurrently, they capture much
more significance. Actually in the fashion industry, and especially in the eyewear one, the fast and
continuous fulfilment of orders is a crucial matter for Companies and so either the minimization of
the OtD Lead Time or the maximization of the Shipping Frequency alone would not be enough to
deliver a consistent service: in fact fast replenishments would not have effect if they occur too
rarely, and, on the other hand, orders could be also fulfilled on a daily basis, but if they were
characterized by a too long cycle time products would become obsolete before they arrival into the
store.

92
ORDER TO DELIVERY LEAD TIME
From a Supply Chain perspective, the Order To Delivery (OtD) process is one of the most
important procedures to be managed in a company (Forslund, 2009). It can be considered as a
cross-company business process from the customer over the supplier back to the customer. An
OtD process starts with the recognition of a need to order and it ends with the product delivery.
In general, the major sub-processes involved are (Forslund, 2009):
i. The ordering sub-process at the customer, which starts with the recognition of a need at
a certain time and ends when a customer order reaches the supplier;
ii. The production sub-process at the supplier, which starts with the receipt of the order and
ends when the goods are available for shipment;
iii. The deliver sub-process, which starts when the ordered goods are available to be picked
up and ends when the goods have been unloaded at the customer;
iv. The goods receipt sub-process, which starts when the ordered goods have been received
and ends when they are available for use.
The performance of an OtD process traditionally concerns lead time and on-time delivery. Lead
time is typically defined “as the time between recognition of the need to order and the receipt of
goods” (Forslund, 2009). Moreover the on-time delivery is the extent to which the lead time
corresponds to what has been agreed with customers. Generally both the dimensions have an
equal weight when evaluating the overall performance, even because they are closely interrelated
among each others. More in particular it is generally assumable that the on-time performance
strongly depends on the lead time performance: an order delivered with a lead time different
from what agreed with the customer, either longer or shorter, can not be considered as on-time.
Given the purpose of the study, that is not concerned with customers’ needs recognition phase,
and considering the market characteristics and setups (several shipments and almost daily
deliveries of small-sized orders), the importance of a short lead time performance significantly
overtakes the prominence of the on-time performance. Exactly for this reason in the present
study the OtD process performance is evaluated through the Order to Delivery Lead Time.
In order to proceed with the evaluation of the OtD LT it is necessary to move further in order to
understand Luxottica’s process from order receipting to delivery. For sake of simplicity the
whole OtD process is summarized in five main consecutive phases:
The Order Receipt phase is pretty straightforward and it consists in the momentary instant
in which an order is placed. Different ways exist for placing an order, such as telephone,

93
mail and MyLuxottica (the website reserved to opticians); however STARS business model
is set for an automatic and scheduled exchange of data between opticians and the Company.
It happens that as a pair of glasses is sold in a store the system on its own automatically
creates a replenishment order for that SKU. At the end of the day all the orders are
consolidated and transmitted to Luxottica via EDI communication;
The Order Allocation phase consists in the process of releasing an order into picking.
Generally the orders collected all along the day are allocated during the night and they are
sent thus the day later into picking (according to precise rules, such as customers’ priority,
order expiration date, fill rates guidelines, etc.). What makes the Order Allocation one of the
most critical phases within the OtD process is the weekly shipping calendar that can be
considered as a virtual agenda stating what are the weekdays in which an order can be
released into picking and thus shipped. Actually in order not to clog the warehouse and to
increase picking efficiency not all the orders are allocated each day, but each macro cluster
of customers or channels of trade has its own weekly shipping calendar;
The Picking phase consists in the set of physical operations aimed at withdrawing the goods
form the warehouse shelves in order to practically assemble an order;
The Shipping phase starts as soon as the picking ends and it is aimed at packaging the
orders in order to make them available for the forwarders’ pick-up;
The Transport & Delivery phase is the conclusive step of the process and it basically
consists in the pick-up of the freight at the warehouse dock and in its physical movement
until the reach of the end customer;
Given the above mentioned Luxottica’s process and considered its main particularities, the OtD
Lead Time calculation model is developed. The model, aims at pointing out the OtD Lead
Time for each combination of weekly shipping calendar and delivery service.
Figure 17 – Luxottica Order to Delivery process

94
The model considers as inputs:
The weekly shipping calendar, which states the days in which orders can be
allocated;
A delivery service from the representative DC to the STARS stores equal either to 24
hours, when express couriers are utilized, or to 48 hours, when couriers or groupage
service providers are utilized;
A timeframe of one week, from Monday to Sunday;
The model produces as outputs:
The Theoretical Shipping Frequency (TSF), calculated taking into consideration the weekly
shipping calendar. The TSF ranges from 1 time per week (minimum) to 5 times per week
(maximum);
The average Theoretical OtD Lead Time, evaluated as average between the single OtD LT
performances generated for each different weekly shipping day (the OtD LT is evaluated
gross of weekends, but net of holydays and other possible, but unforeseeable, causes of
delays such as strikes, service provider non-performance, etc.);
To achieve a better understanding of the model it is possible to go through the following
example for which, given the weekly shipping calendar for a certain customer with picking (and
thus shipping) days equal to Mondays and Tuesdays and a delivery service equal to 24h it is
required to calculate the weekly average OtD Lead Time:
An order placed on Monday would be allocated on Monday night and, under the assumption
that it respects all the allocation conditions, it would be released into picking on Tuesday,
early morning. On Tuesday, noon time, the picking could be considered as ended, and the
order would flow into the shipping area in order to be shipped. Since Tuesday is set in the
Figure 18 – Order to Delivery Lead Time model

95
weekly shipping calendar as a day favourable to ship the transportation phase begins, and
given the hypothesized delivery service, the order would be delivered the next day within
the standard points of sale working time. Consequently, given the above mentioned
assumptions, an order placed on Monday would have an OtD LT equal to 2 days;
An order placed on Tuesday would be allocated on Tuesday night and, under the assumption
that it respects all the allocation conditions, it would be released into picking on Wednesday,
early morning. On Wednesday, noon time, the picking could be considered as ended, and the
order would flow into the shipping area in order to be shipped. However Wednesday,
according to the weekly shipping calendar, is not set as shipping day and thus the order
would wait for being shipped until the next first available shipping day, which is Monday,
week +1. On Monday, week +1, the order would then be shipped and it would be delivered
the next day within the standard shops working time. Consequently, given the above
mentioned assumptions, an order placed on Tuesday would have an OtD LT equal to 7 days
The exercise continues until, give the above mentioned assumptions, the OtD Lead Time is
calculated for all the possible week days. It results that the Theoretical Shipping Frequency
would be equal to 2 times per week, while the average Order to Delivery Lead Time would last
4,14 days. Then the exercise is extended considering all the other combinations of the weekly
shipping calendar (for a total number of combinations equal to 30) and delivery services (for a
total number of combinations equal to 2). As the model is properly and completely ran it gives as
output the OtD Lead time and the Theoretical Shipping Frequency for 60 combinations of inputs.
As one might expect the model points out that as the delivery service is equal to 24 hours the
OtD Lead Time is shorter in respect to what it would be with a 48 hours delivery service.
However what it is interesting to note is that the advantages to use a faster delivery service are
even more accentuated for certain combinations of shipping days. For instance when the
shipping days are Mondays and Thursdays, and so the TSF is equal to 2 times per week, if a 24h
delivery service is used the average OtD Lead Time is equal to 3,29 days, while with a 48h
delivery service a 5,14 days of OtD Lead Time would be achieved. The reason behind this huge
discrepancy is that the model considers the OtD Lead Time as gross and so the KPI itself is
strongly impacted by mutual occurrence of shipping days and non-working days.

96
Table 7 – Order to Delivery Lead Time calculation model

97
Table 7 shows all the possible combinations of inputs in the OtD LT model and it can be red in the
following way:
The first column indicates the delivery service;
The second column denotes the time frame, equal to one week. This column is then further
segmented into seven sub-columns, where each of them is assigned to a week-day. Days
highlighted in light blue are the shipping days, while days highlighted in light grey are non-
working days. Numbers within days’ cells represent the OtD Lead Time that orders would
incur in if generated in the corresponding day;
The third column represents the Theoretical Shipping Frequency;
The fourth column points out the average Order To Delivery Lead Time. Green-highlighted
OtD Lead Times are the shortest possible (given a certain combination of inputs), while red-
highlighted OtD LT are the longest possible (given a certain combination of inputs); if OtD
LT are not highlighted there are no differential performances given the inputs combination;
SHIPPING FREQUENCY
As pointed out in paragraph 4 the Shipping Frequency consists in one of the most important
indicators to evaluate the Logistics Service Quality, and together with the OtD Lead Time it
gives a clear picture of how customers are served promptly.
Given the structure of Luxottica’s business, and the steps of the above mentioned OtD process it
is possible to discriminate between:
Theoretical Shipping Frequency (TSF), evaluated on the basis of how many times within a
certain time band the orders placed by a store are expected to be allocated, picked and then
shipped out;
Actual Shipping Frequency (ASF), evaluated on the basis of how many times the orders
placed by a store have been actually allocated, picked and shipped out;
More in practical, as discussed in the previous paragraph, the Theoretical Shipping Frequency
originates from the weekly shipping calendar, while the Actual Shipping Frequency results from
the impacts of contingent events on the TSF. Practical evidence over Luxottica’s processes and
business shows that there are three main sources of contingent events, and that they are
imputable to:

98
Holydays: the weekly shipping calendar is set-up for shipping in certain week-days
(differentiated according to all the 26 weeks of high season and the remainder 26 weeks of
low season). It might results that, over weeks, shipping days take place exactly at the same
time of holydays, in which the Distribution Centre is closed. If so the order receipt and
allocation phases are carried out, but the picking and shipping steps can not be practically
performed;
Customers and orders: orders might be subjected to commercial policies or to expiration
rules that, if not effective, prevent the orders to be allocated. Additionally customers might
be exposed to commercial/credit blocks due to missed payments or other causes. Again, if it
happens, Luxottica does not allocate the orders coming from that customers even though
they were scheduled in the weekly shipping calendar;
Warehouse and stock: the fulfilment of orders is strongly linked to stock and SKUs
availability that, even if rarely, might not be sufficient for satisfying the fill rate. Indeed, if
the minimum fill rate is not achieved the system automatically holds the order from picking.
In addition the workload capacity (both human and technological) might act as constraint: in
fact, even if order are released into picking since they satisfy the above mentioned
conditions, it might not be sufficient to successfully complete the picking and/or the
shipping phase;
COST TO SERVE
Until now only aspects related to service level to customers have been considered; however,
given Luxottica’s nature of profit-oriented company, business profitability is understandably
considered a primary objective for the Company, which is always seeking, in addition to
optimal service provision, for cost-effectiveness maximization. Luxottica, as almost all the other
for profit companies, defines profitability in economics terms as the difference between
revenues and costs; it means that in order to achieve its objective the Company has either to
maximize revenues or to minimize costs, or both of them concurrently. In Luxottica these goals
are addressed in different ways to the each single business unit: indeed if in one hand all the
functions can achieve a cost reduction by reviewing their expenses, on the other hand not all of
them can be considered able to increase their margins. Actually business units such as Logistics,
that are devoted at providing services, are considered to be a cost driver instead of revenue
makers. In reality Logistics, delivering the right product at the right time in the right place, is a

99
crucial functions for supporting sales and thus for revenues generation, nevertheless since it
does not have a direct impact in creating incomes, for the purpose of this dissertation, it is
considered as affecting costs only. Under this assumption Logistics costs and Cost-to-Serve
customers are thus further analysed into more details in this section.
Generally Logistics cost can be grouped in five main different macro-categories:
Transportation costs, which are the costs sustained for moving the goods from the point of
origin to the point of destination;
Warehousing costs, which are the costs sustained in order to physically store, handle,
package and label the goods;
Customer service costs, which encompass the costs sustained for receiving and processing
the orders from the customers;
Inventory carrying costs, that include the costs of holding goods in inventory such as
capital, warehousing, depreciation, insurance, taxation, and obsolescence, and are
commonly expressed as a share of the inventory value;
Administration costs, that include all the overheads;
According to the Council of Supply Chain Management Professionals the incidence of cost
items varies across industries and geographies, however, on average, transportation costs
amount to the 47% of total Logistics costs, while, inventory carrying costs to 24%, then
warehousing costs to 22%, customer service costs to 4% and finally administration costs to 3%.
Given the average huge impact of transportation costs over the total Logistics expenses and the
emphasis of the present study over the transportation step of the order fulfilling process, they are
considered as the main driver for analysing the Cost-to-Serve. Consequently, in order to
understand which are the operational as well as the managerial levers that can be touched in
order to act on transportation costs it is crucial to understand how these costs are built, or, in
other words, which is their structure. Transportation cost structure generally varies on the basis
of the typology of service provider: on one hand there are couriers and express couriers, on the
other hand there are groupage forwarders and global forwarders. For what concerns Luxottica
STARS channel of trade, as expressed in the following 5.2.2, the majority of customers are
served through either couriers or express couriers, as a consequence the cost structure of this
kind of service providers is examined on details.
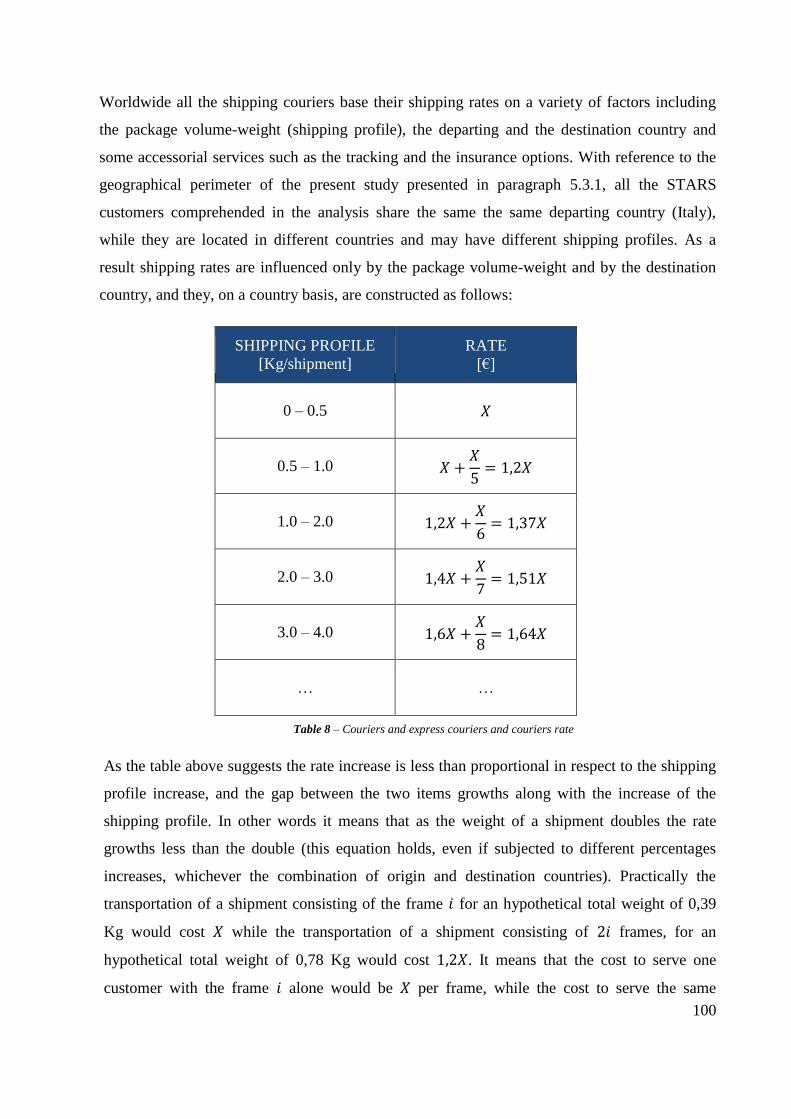
100
Worldwide all the shipping couriers base their shipping rates on a variety of factors including
the package volume-weight (shipping profile), the departing and the destination country and
some accessorial services such as the tracking and the insurance options. With reference to the
geographical perimeter of the present study presented in paragraph 5.3.1, all the STARS
customers comprehended in the analysis share the same the same departing country (Italy),
while they are located in different countries and may have different shipping profiles. As a
result shipping rates are influenced only by the package volume-weight and by the destination
country, and they, on a country basis, are constructed as follows:
SHIPPING PROFILE
[Kg/shipment]
RATE
[€]
0 – 0.5 𝑋
0.5 – 1.0 𝑋 +𝑋
5= 1,2𝑋
1.0 – 2.0 1,2𝑋 +𝑋
6= 1,37𝑋
2.0 – 3.0 1,4𝑋 +𝑋
7= 1,51𝑋
3.0 – 4.0 1,6𝑋 +𝑋
8= 1,64𝑋
… …
As the table above suggests the rate increase is less than proportional in respect to the shipping
profile increase, and the gap between the two items growths along with the increase of the
shipping profile. In other words it means that as the weight of a shipment doubles the rate
growths less than the double (this equation holds, even if subjected to different percentages
increases, whichever the combination of origin and destination countries). Practically the
transportation of a shipment consisting of the frame 𝑖 for an hypothetical total weight of 0,39
Kg would cost 𝑋 while the transportation of a shipment consisting of 2𝑖 frames, for an
hypothetical total weight of 0,78 Kg would cost 1,2𝑋. It means that the cost to serve one
customer with the frame 𝑖 alone would be 𝑋 per frame, while the cost to serve the same
Table 8 – Couriers and express couriers and couriers rate
structure

101
customer with two frames 𝑖 together would be 0,6𝑋 per frame. Consequently it is clearly
evident the greater the shipment, that is the higher the number of pieces in the same shipment,
the lower the cost to serve the customer.
Larger shipments can be obtained by increasing orders size and thus by either reducing the
Theoretical, and thus Actual as well, Shipping Frequency or by increasing the sell-in to
customers. As presented in paragraph 4 the TSF is a proxy of the service level offered to the
customer, that if too disrupted might generate a potential lost sale (as soon as the Company
decides to reduce the replenishment frequency of customers in order to achieve a lower Cost-
to-Serve, the likelihood of fulfilling on time an order decreases and consequently the possibility
to increase the sell-in decreases). In addition, if in one hand the TSF can be considered an
endogenous – Luxottica has full ownership of the leverages to act on it – variable, on the other
hand the sell-in has to be considered as an exogenous one. Actually the latter is strongly driven
by customers’ sales that can be surely influenced by Luxottica through instruments such as
marketing campaigns, promotions, and commercial policies as well, but these instruments act
only in the long term. In other words it means that, in the short-medium term, given the sell-in,
the Theoretical Shipping Frequency is the only variable through which the Company can adjust
the Cost-to-Serve (practically also couriers’ rates can be considered as a driver for determining
the cost to serve, but they are a steady variable that can not be impacted by substantial
increases/decreases in the short term). In particular the relation between TSF and sell-in gives
origin to the so-called shipping profile, which consists in the average orders size and is
evaluated for each single customer.
Given the above mentioned assumptions (the larger the shipment the lower the Cost-to-Serve),
the Cost-to Serve can be qualitatively assessed by looking at the shipping profile, and thus by
looking at the mutual relationship between sell-in and Theoretical Shipping Frequency. The
Cost-to-Serve is qualitatively expressed in the table below:
SELL-IN
LOW HIGH
THEORETICAL
SHIPPING
FREQUENCY
LOW LOW VERY LOW
HIGH HIGH LOW
Table 9 – Cost-to-Serve qualitative assessment

102
Low Cost-to-Serve customers are those customers characterized by a well-balanced
relationship between TSF and sell-in. It means that they either generate few volumes being
served few times or they generate high volumes being served numerous times and thus the
average weight of their shipments falls into a favourable rate;
High Cost-to-Serve customers are those customers characterized by a negatively
outbalanced relationship between TSF and sell-in. It means that they generate few volumes
being served numerous times, and thus the average weight of their shipments falls into an
unfavourable rate;
Very low Cost-to-Serve customers, are those customer characterized by a positively
outbalanced relationship between the TSF and sell-in. It means that they generate high
volumes being served few times, and thus the average weight of their shipments falls into a
very favourable rate;
In conclusion the Cost-to-Serve can be assessed through the combination between the
Theoretical Shipping Frequency and the sell-in and. Consequently the “Cost-to-Serve ratio” can
be defined as the cost per unit sustained by Luxottica to serve one customer given a certain
shipping profile. The Cost-to-Serve ratio (CtSr) can be quantitatively evaluated through the
following formula:
𝐶𝑡𝑆𝑟 =𝑊𝑒𝑒𝑘𝑙𝑦 𝑠𝑒𝑙𝑙 − 𝑖𝑛
𝑊𝑒𝑒𝑘𝑙𝑦 𝑆ℎ𝑖𝑝𝑝𝑖𝑛𝑔 𝐹𝑟𝑒𝑞𝑢𝑒𝑛𝑐𝑦
Given that equation assuming a fixed weight per unit and idealizing a possible rate table, the
Cost-to-Serve ratio can be graphically depicted in the following way:
Figure 19 – Example of Cost-to-Serve ratio path

103
It is clearly evident that as soon as the number of units per shipment increases the Cost-to-
Serve ratio decreases and even though figure 20 evidences that relationship till a shipment
composed by 16 units it is assumable that the decreasing trend holds its validity also for larger
shipments until the maximum shipments’ size is reached. However, given couriers’ and express
couriers’ rate structure toward Luxottica and the Company’s business set-up considered in the
present dissertation, that maximum weight and dimensional thresholds are supposed not to be
reached.

104
6. THE ANALYSIS OF LUXOTTICA LOGISTICS
CUSTOMER SERVICE
6.1 THE AS IS LOGISTICS CUSTOMER SERVICE
The AS IS analysis is conducted in order to pinpoint firstly the overall set-up of the actual business
and then in order to assess the value of the chosen KPIs. That assessment is carried out considering
a general perspective and looking at the entire perimeter discussed in paragraph 5.2.1 without
focusing on a country by country perspective.
6.1.1 PERIMETER OVERVIEW
The 2,799 STARS stores within the previously identified perimeter are distributed, per country and
per class, as follows:
As it emerges from the figures reported above Italy is the country with the largest number of stores:
this is mainly due to the fact that STARS business model was launched firstly in Luxottica’s home
country. On the other hand Germany, due to the novelty of the STARS channel of trade, is the
country in which the business is less diffused. Additionally, from a class point of view, the majority
of stores belongs to the class 3, on the other hand there are few stores in the class 0. This
subdivision reflects the connotations of exclusivity and high-end assortments typical of class 0 and
the need to have only few selected stores for these kinds of luxury and prestigious brands.
Despite the mere distribution of stores in terms of number of physical locations, a more
understandable picture of the business is pointed out through the assessment of volumes shipped to
Figure 20 – STARS stores geographical distribution Figure 21 – STARS stores class distribution

105
stores. Given the 1,729 stores
of class 3 it is reasonable to
expect they generate the
largest part of the business,
however, this assumption can
be partially offset by the
relevant turnover in terms of
pieces generated by the top-
sellers of class 0. Figure 22 graphically expresses these numbers.
From a service perspective most of the French, German, Italian, Spanish and UK customers are
served with couriers (80% of overall volumes), additionally some huge customers are served also
through groupage service providers (13% of overall volumes) and finally the remainder part (7% of
overall volumes) through express couriers. Disregarding the customers served with groupage
service providers, for which orders’ size justifies this type of service, it emerges that there is no a
fully understandable rationale behind the decision to serve a customer either with express or with
standard couriers. In other words it might be that the Company is not using the most appropriate
service for all its customers: this set-up currently is not leading customers to complain or deliveries
not to be performed with an acceptable OtD Lead Time (since, at most, an order is fulfilled, from a
transportation point of view, in 48 hours), but it might further optimized. Moreover the choice of
the delivery service is not driven by the class in which the STARS store is located.
6.1.2 PARAMETERS OVERVIEW
In this section of the dissertation all the parameters (KPIs) identified on paragraph 5.5 are assessed
and valued on the basis of the AS IS way in which business is conducted.
ORDER TO DELIVERY LEAD TIME
According to the geographical and temporal perimeter of the analysis the Theoretical and Actual
Order to Delivery Lead Time per class weighted on sell-in volume and evaluated in number of days,
are reported in the graph below (figure 22). It results that the Theoretical OtD Lead Time (TOtD
LT), for each class and with an almost constant trend, is lower than the Actual OtD Lead Time.
More in particular the average Theoretical OtD LT is equal to 3,71 days, against the Actual one that
values 3,91 days.
Figure 22 – STARS volume distribution per class

106
In addition both an intra-classes and inter-classes analysis can be performed:
1. Considering an intra-classes perspective the differences between the Theoretical OtD LT
and the Actual OtD LT are almost null. Indeed, on average, the difference between the two
is 0,20 days, with a maximum of 0,44 days for class 3 and a minimum of 0,09 days for class
2, with a standard deviation of 0,18 days;
2. Considering, on the other hand, an inter-classes analysis the differences between the
Theoretical OtD LT and the Actual OtD LT are evident. Actually, the trends of both of them
are similar and from a minimum Theoretical OtD LT equal to 2,61 days, observed for class
1 and the maximum one, observed for class 3 and equal to 5,11 days, there is a gap of 2,06
days (the gap between the Actual OtD LT for the same classes equals to 2,39 days);
From that analysis it results that, on average, the Company is performing as it intended to do: the
small gaps between intra-classes TOtD and AOtD Lead Times are negligible and they are mainly
ascribable to the causes previously expressed in 5.3.2. On the other hand, the analysis clearly points
out that customers are served with extremely heterogeneous OtD Lead Times on the basis of the
clusters in which they are classified. Gaps between Actual as well as Theoretical OtD LT among
classes might be well explained by the OtD Lead Time Model according to which the OtD LT is
influenced in a limited manner by the shipping days, while huge discrepancies might be created by
the match between delivery service and Shipping Frequency (for instance, considering the shipping
frequency and shipping days as constants and respectively equal to 2 times/week and Thursday and
Friday, the usage of a 48h Delivery Service strongly impacts in the TOtD LT moving it up to 7,14
Figure 23 – Theoretical & Actual OtD Lead Time per class

107
days rather than 4,43 days when a 24h Delivery Service is utilized, for an overall increase of 62%).
The validity of that assumption is systematically proved through the analysis of the different
combinations within the OtD LT model, which depict that the increase in the OtD LT goes along
with the reduction of the Shipping Frequency. Additionally the almost negligible gaps among OtD
Led Times within the same class reinforce the validity of the OtD Lead Time model.
SHIPPING FREQUENCY
Given these premises and the FY 2015 historical data about the countries and the stores under
analysis, the Theoretical and Actual Shipping Frequencies per class weighted on sell-in volume and
evaluated in number of shipments per week, are reported in the graph below:
It results that the TSF is, for each class and with an almost constant trend, higher than the ASF.
More in particular the overall Theoretical Shipping Frequency is equal to 3,44 times per week,
while the Actual values 2,46 times per week, were a week is considered to be composed, on
average, by 5 days (from Mondays to Fridays – all and only the days in which the DC is able to
pick and ship –). On average the difference between TSF and ASF is 0,98 times per week, with a
maximum of 1,08 times per week for class 2 and a minimum of 0,86 for class 1 (standard deviation
of 0,095). The exact and accurate analysis of the actual causes leading to this discrepancy can be
considered as outside the perimeter of that study and for this reason they will not be scrutinized
further in respect to what disserted above in paragraph 5.3.2.
Other than the differences between Actual and Theoretical Shipping Frequencies, what can be
further analysed is how these frequencies vary across the different STARS classes. One might
expect Shipping Frequencies to be in line with classes: being classes created on the basis of the sell-
Figure 24 – Theoretical and Actual shipping frequency per class

108
out it is reasonable to believe that greater sellers are served more frequently in respect to smaller
sellers. In other words it is expectable to see a TSF almost close to 5 times per week for class 0 and
then to see it arranged differently class by class until it reaches about 2 times per week for class 3.
What actually emerges is that, as predicted, the TSF of class 0 is very close to 5 times per week,
however it is also true that the TSF of class 1 and 2 are very close among each others and not far
from the almost 5 times per week of class 0. In fact the marked cut of TSF takes place only passing
from class 2 to class 3, where the KPI decreases more than 1 time per week. The Actual Shipping
Frequency follows the same trend, remaining steady and between 3,61 and 3,11 times per week for
classes 0, 1 and 2, and decreasing strongly as far a class 3 is concerned.
In conclusion the analysis shows two main phenomena: on one hand, with an intra-class perspective
little discrepancies between Theoretical and Actual Shipping Frequencies can be highlighted; on the
other hand and it seems that both TSF and ASF are not driven by the class. As a consequence a
separate deep dive on both phenomena has to be carried out.
From one side Shipping Frequencies can be further studied according to their distribution and for a
start the part of the volume, in percentage terms, that should have been delivered with a certain
Theoretical Shipping Frequency, and that, instead, has been actually shipped with an Actual
Shipping Frequency is reported in the graph below:
From that graph it results that the 25% of the volume was planned to be shipped with a Theoretical
Shipping Frequency of 5 times per week, the 28% with a TSF of 4 times per week, and so on until
the 10% of volumes with a TSF of 1 times per week. It results that roughly the 53% of volumes was
planned to be shipped more than 3 times per week. On the other hand it is clearly visible that the
Figure 25 – Theoretical and Actual sell-in per Shipping Frequency
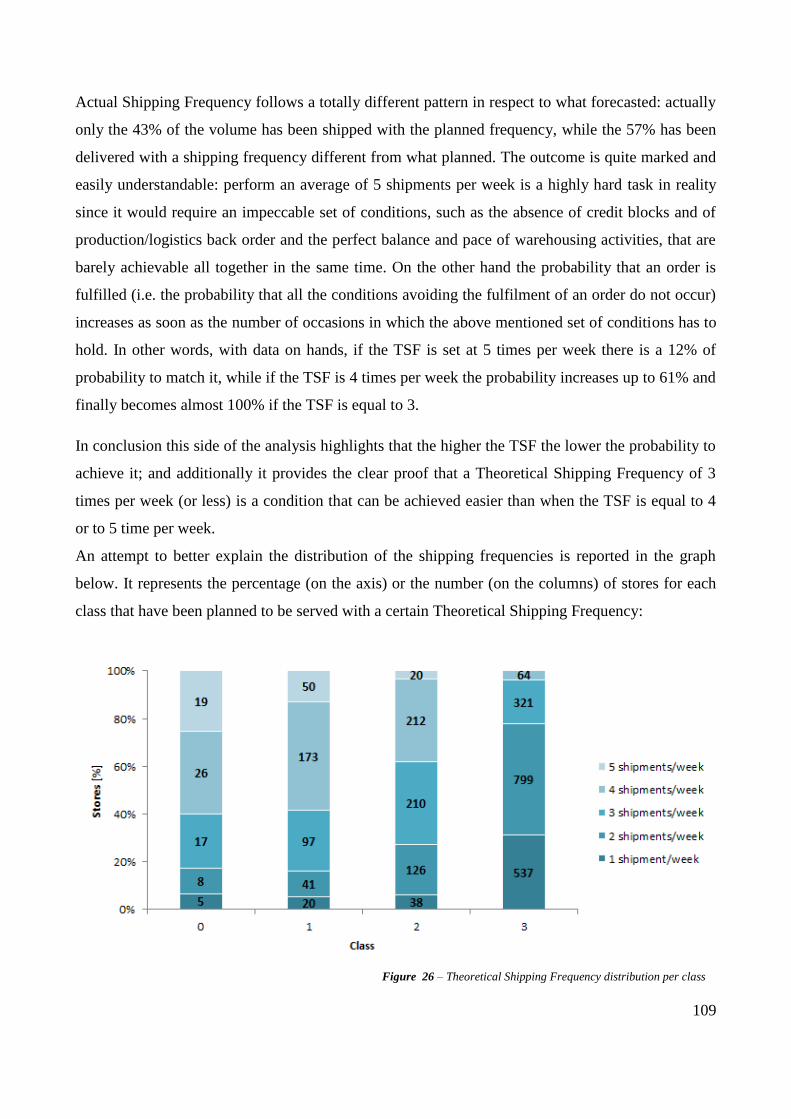
109
Actual Shipping Frequency follows a totally different pattern in respect to what forecasted: actually
only the 43% of the volume has been shipped with the planned frequency, while the 57% has been
delivered with a shipping frequency different from what planned. The outcome is quite marked and
easily understandable: perform an average of 5 shipments per week is a highly hard task in reality
since it would require an impeccable set of conditions, such as the absence of credit blocks and of
production/logistics back order and the perfect balance and pace of warehousing activities, that are
barely achievable all together in the same time. On the other hand the probability that an order is
fulfilled (i.e. the probability that all the conditions avoiding the fulfilment of an order do not occur)
increases as soon as the number of occasions in which the above mentioned set of conditions has to
hold. In other words, with data on hands, if the TSF is set at 5 times per week there is a 12% of
probability to match it, while if the TSF is 4 times per week the probability increases up to 61% and
finally becomes almost 100% if the TSF is equal to 3.
In conclusion this side of the analysis highlights that the higher the TSF the lower the probability to
achieve it; and additionally it provides the clear proof that a Theoretical Shipping Frequency of 3
times per week (or less) is a condition that can be achieved easier than when the TSF is equal to 4
or to 5 time per week.
An attempt to better explain the distribution of the shipping frequencies is reported in the graph
below. It represents the percentage (on the axis) or the number (on the columns) of stores for each
class that have been planned to be served with a certain Theoretical Shipping Frequency:
Figure 26 – Theoretical Shipping Frequency distribution per class

110
The graphs clearly depicts that Theoretical Shipping Frequencies are strongly heterogeneous within
the same classes. Indeed it does not exist a class in which all the stores (or, at least, the majority of
them) have been planned to be shipped with the same number of occurrences per week. For instance
in class 0 there are 5 stores that have been planned to be shipped 1 time per week, 8 that have been
planned to be shipped 2 times per week, 17 that have a Theoretical Shipping Frequency of 3 times
per week, etc.. The same reasoning can be done the other classes as well. The misalignment
between classes and Theoretical Shipping Frequencies might be explained by the fact that some
stores have been included in the wrong class. This may happen because clusters are updated once a
year and because the sell-out of stores might substantially vary all along the year. Thus it results
that stores, given their historical and especially previous year sell-out are inserted in a certain
cluster for the year to come, but then they under-perform/over-perform not respecting anymore the
boundaries of the class and requiring thus a class downgrade/upgrade. However, according to the
figures of graph 25 the extent of the phenomenon seems to be quite huge for being justified by a
misalignment between consecutive years performances and thus it might be ascribable to an
incorrect and disregarded utilization of classes.
In conclusion, from an overall point of view, it emerges that there is no a clear link between classes
and Theoretical Shipping Frequencies and thus that current classes are not intended to be a driver
for the TSF. Additionally the discrepancies between ASF and TSF can be partially explained by the
contingent event typical of the business.
COST TO SERVE
As expressed in paragraph 5.3.2, to understand customers’ Cost-to-Serve it is possible to assess
their shipping profile’s Cost-to-Serve ratio. On this purpose Figure 27 shows, on a class basis, both
the Theoretical and the Actual Cost-to-Serve ratios. Apart from the gaps between the Theoretical
and Actual KPI, that are due to the discrepancies between the ASF and TSF already highlighted in
Figure 24, the CtSr value on a class base follows an unexpected trend: class 0, that is generally
assorted with premium and high-end brands, is characterized by the lowest CtSr (both Theoretical
and Actual), while class 3, that is generally provided with medium-end brands, is served with the
highest CtSr (both Theoretical and Actual). In other words, from a first overview, it seems that the
cost to serve a class whose sales needs to be supported in the best possible way is lower than the
cost to serve a less valued class with direct consequences in terms of service: to a lower Cost-to-
Serve it should correspond a less performing transportation service.

111
Moreover one might believe that the high CtSr is impacted by the Shipping Frequency mostly and
thus, to a high CtSr it should correspond a high Shipping Frequency and consequently a prompt and
on-time service. However, going further in the analysis, it has to be evidenced that the Cost-to-
Serve ratio origins from the shipping profile and thus by the ratio between the sell-in and the
Shipping Frequency. As a consequence the low CtSr typical of class 0 can be explained by a
favourable shipping profile. Besides, given the findings expressed in Figures 21, 22 and 24 that mix
together the number of stores per class, the sell-in per class and the Shipping Frequency per class,
numbers displayed on Table 10 express the shipping profile per class:
CLASS
THEORETICAL
SHIPPING PROFILE
[units/shipment]
ACTUAL SHIPPING
PROFILE
[units/shipment]
0 14,29 18,37
1 9,41 11,70
2 7,31 9,85
3 4,57 6,82
These figures clearly evidence that fluctuations in the Cost-to-Serve ratio are due to the different
shipping profiles (irrespectively whether Theoretical or Actual, since their trends are similar). It
means that there could be two main actions available to optimize the actual set-up of the business:
Under the assumption that the maximum Theoretical CtSr, equal to € 4.50 per unit, is
acceptable there could be room for improving the service to customers of the other classes
Table 10 – Theoretical & Actual shipping profile
Figure 27 –Actual & Theoretical Cost-to-Serve ratio per class

112
by either increasing their shipping frequency or by granting them a 24 hours delivery
service, or both of them;
Under the assumption that the maximum Theoretical CtSr, equal to € 4.50 per unit, is not
acceptable there would be the need to revise the services offered to customers clustered in
class 3 and to study as well also the services offered to the other customers in order to reach
a well-balanced portfolio of services.
6.1.3 MAIN FINDINGS
As far as the analysis of the AS IS Luxottica’s logistics customer service is concerned three main
conclusions can be drafted:
1. Classes are not intended to support Logistics activities.
Classes are built on the basis of the sell-out, which is a purely commercial variable. More in
particular, since the sell-out considers only the units sold by a store net of returns performed
by opticians to Luxottica, it can be used only to gain an order of magnitude of the sell-in,
which on the other hand is a logistics variable. Indeed opticians, according to Company’s
rules about commercial returns, might decide to free their obsolete stock shipping it back to
Luxottica part of the SKUs they have in store. It results that even if these SKUs have been
shipped to stores impacting logistics they are not counted in the sell-out, while they would
have been considered in the sell-in. Additionally it has been proved that a clear relationship
between classes and Theoretical Shipping Frequency does not exist;
2. Differences among Theoretical and Actual Shipping Frequency can not be always
addressed to manageable events.
As far as Luxottica’s Order to Delivery process is concerned the gaps between ASF and TSF
generally arise in the phases between the order allocation and the transport and delivery
steps, which are characterized by contingent and unforeseeable events. Actually
unavailability of stocks on the shelves, under/over exploitation of picking, packaging and
shipping capacity, other capacity constraints and customers’ prioritization might strongly
impact the orders fulfilment, leading to an Actual Shipping Frequency different from the
Theoretical one. These disruption elements, even though crucial for the purpose of the
business, are not further discussed in the following sections. Additionally also causes totally
independent from Luxottica’s behaviour can also become a driver of the gap between the
ASF and the TSF: for instance customers’ behaviour, such as the payment fulfilment or the

113
order placement policy can influence the possibility to ship, reducing thus the Actual
Shipping Frequency. Even more so these causes are not studied in this dissertation;
3. Customers’ Cost-to-Serve strongly depends on the shipping profile.
The combination between customers’ Theoretical (and Actual) Shipping Frequency and
their sell-in is the main driver of the Cost-to-Serve, and they have to be properly balanced in
order to obtain a valid and meaningful Cost-to-Serve ratio.
6.2 TOWARD THE TO BE LOGISTICS CUSTOMER SERVICE
During the analysis of the current status of Luxottica’s logistics customer service for STARS
customers, and the given the outputs of the exploration, some clues on how to improve the current
way of doing business are emerged. All of them are related only to the manageable events (it would
be impossible to improve something that is not on improver’s hands) and they are linked to the two
main aspects arose when analysing the STARS logistics customer service status and subsequently
wrapped-up in drawing the conclusions of the AS IS scenario: the improvement of customers’
classification and the opportunity to work on the customers’ Cost-to-Serve ratio in order to further
optimize the service provision.
6.2.1 IMPROVEMENT OF CUSTOMERS’ CLASSIFICATION
As it has been widely described in paragraph 6.1.2 nowadays classes are built on a purely
commercial variable such as the sell-out, rather than on a logistics variable. Additionally, in the
current setup, each country is supposed to have its own rules to set the parameters for building
classes. As a result the improvement of customers’ classification has to pass through:
1. The selection of the driver on which to base classes together with general rules to
understand if and were to place exceptions;
2. The identification of the geographical coverage of classes to deep-dive the possibility of
reducing the diversity existing nowadays;
3. The choice about the number of classes that suit the most the business scenario;
4. The selection of the classes’ boundaries that best represent the market;
CLASSES DRIVER & GEOGRAPHICAL COVERAGE
As per the outcomes expressed in paragraph 6.1.2, in the AS IS set-up of STARS business, classes
are built on the basis of the sell-out as well as some other quali-quantitative variables. Other than

114
that their scope is to help planners in addressing the right assortment of products to the right store
typology. On the other hand logistics does not have in place any kind of classification for that
business typology and this finds it origins from the fact that the whole STARS business has been
generally always treated with the highest possible priority for the Company. However, over years,
the business has evolved and new opportunities are emerged creating the possibility for Luxottica to
carry out an intra-business classification to allow delivering a logistically differentiated service to
its customer base.
As a result, in order to define the pillars of the TO BE scenario, rules by which classes are created
have been simplified and the usage of a single quantitative variable rather than a mix of qualitative
and quantitative ones has been enforced. In so doing the classification would follow always the
same rule without leaving rise to ambiguity and making its understanding simpler. More in details it
has been decided to consider the sell-in as the new segmentation variable: practically the sell-in
consists in the number of pieces shipped to a certain store, and it is preferred to the sell-out since the
latter does not consider the pieces returned to Luxottica that, anyway, have been shipped to that
store. On top of this decision it has been guaranteed the possibility to freely classify 10 stores per
macro-region that can be manually inserted in whatever class by STARS planners. This choice has
been driven by the necessity to match customers’ requirements: on one hand customers located in
prestigious locations may need to be served with special care even though they do not generate a
huge sell-in since they are intended to act as showcases for the Company; on the other hand there
might be stores that prefer to receive few consolidated shipments rather than daily deliveries that
would be probably assigned to them given their consistent and remarkable sell-in.
In parallel with the definition of the new driver also the geographical scope of classes has been
revised. The geographical scope consists in the number of countries over which the same set of
clusters can be applied. Actually, given the macroeconomic differences and the dissimilar maturity
stages reached by STARS channel of trade in the different countries analysed the idea to build a set
of classes for each different country has its own cornerstone. However this choice compromises the
uniformity of the model and increases the future management complexity of the business. As a
consequence, given the trade-off between the opposite needs of complexity reduction and market
accuracy, two homogeneous areas have been defined:
a. Italy, France and Spain;
b. Germany and UK;

115
According to Table 4, Italy, France and Spain represent the countries in which the business is more
developed; it is thus assumable that, given the similarities between the number of stores and the
yearly sell-in, customers’ needs and shipping profiles would be somehow similar. Additionally
these countries, from a service point of view, are served in a very similar way: even though
forwarders are different all of the countries share a road service in which deliveries are carried out
by a local courier that, exploiting the large market knowledge and coverage, is able to deliver a
consistent service. On the other hand Germany and UK are served by the same supplier and
according to the same ground service. Additionally in these two countries the relatively novelty of
the business results in a more fragmented customer base thus creating the need of fulfilling different
shipping profiles.
NUMBER OF CLASSES AND BOUNDARIES
In order to guarantee a manageable level of complexity in the TO BE scenario the numerousness of
classes is intended to be the same for each homogeneous area and that number is driven mainly by
business needs. Actually, from a business point of view it is not possible to serve a customer less
than 2 times per week and, understandably, it has no sense to serve customers more than one time
per day. Given that four classes are then created, each of them characterized by a certain Theoretical
Shipping Frequency:
CLASS TSF
[shipments/week]
A 5
B 4
C 3
D 2
The rationale behind the link of class A with a Theoretical Shipping Frequency equal to 5 times per
week bases its motivation on the idea that part of the business has to be served constantly in order to
support its sales. On the other hand class D is characterized by a Theoretical Shipping Frequency of
2 times per week, which even though representing the lowest one in the whole business case, it is
assumed to be sufficient for avoiding service disruption to customers. Between these two upper and
lower bounds class C and B are associated to a Theoretical Shipping Frequency of 3 and 4 times per
Table 11 – New logistics based classes and TSF

116
week respectively in order to raise-up the level of service of the overall business and allow to
consistently manage the Cost-to-Serve ratio by balancing classes’ boundaries.
Given the four classes the boundaries are then defined, for each group of countries, according to
two main rules:
a. The set of customers generating the 20% of the sell-in are grouped together and inserted in
class A;
b. The other customers, able to generate the remainder 80% of sell-in are then further
segmented according to an ABC analysis;
ITALY, FRANCE AND SPAIN
The set of countries composed by Italy, France and Spain engenders a sell-in equal about to
2,900,000 pieces overall, and the 20% of this sell-in is generated by 53 stores. All of these
stores, as disclosed above, are inserted in class A. In so doing business leaders are supposed to
be served with the highest service possible and their sales will be sustained even the re-layout of
classes has occurred.
The remainder part of 2,082 stores, accounting for about the 80% of the business, are then
segmented with an ABC analysis, which considers three classes:
Class B is the class providing the 50% of the sell-in, and it consists of the 23% of stores;
Class C is the class providing the 20% of the sell-in, and it consists of the 29% of stores;
Class D is the class providing the 10% of the sell-in, and it consists of the 46% of stores;
Figure 28 – Italy, France and Spain, stores and sell-in

117
GERMANY AND UK
Germany and UK together engender a sell-in equal about to 440,000 pieces overall and the 20%
of this sell-in is generated by 35 stores. All of these stores, similarly to what has been done for
the other macro-region, are inserted in class A.
The remainder part of 664 stores, accounting for about the 80% of the business are then
segmented with an ABC analysis, which considers three classes:
Class B is the class providing the 70% of the sell-in, and it consists of the 24% of stores;
Class C is the class providing the 20% of the sell-in, and it consists of the 36% of stores;
Class D is the class providing the 10% of the sell-in and it consists on the 40% of stores;
Going into more details and comparing the outcomes of the segmentation for the two macro-regions
it is evident that the German and UK markets are heavily fragmented if compared to Italian, French
and Spanish ones. Actually in the former geography the 20% of sell-in (class A) is engendered by
the 5% of stores, while for the latter set of markets the same 20% is produced by the 2% of stores.
This evidences how, in Italy, France and Spain there are few stores leading the market and able to
consistently drive the sales of the overall region. Then, with regards to the other classes (B, C and
D) the results are pretty similar, with class B providing the 50% of market’s sell-in and
characterized by the 23% and by the 21% of stores for Italy, France and Spain and for Germany and
UK respectively. A similar trend is depicted for class C and D as well, and, in conclusion, apart
Figure 29 – Germany and UK, stores and sell-in

118
from class A the two macro regions seem to have a similar market structure path. A detailed recap
is showed on Table 12:
MACRO-REGION CLASS SELL-IN STORES TSF
[shipments/week]
Italy, France and
Spain
A 20% 2% 5
B 50% 23% 4
C 20% 29% 3
D 10% 46% 2
Germany and UK
A 20% 5% 5
B 50% 21% 4
C 20% 32% 3
D 10% 42% 2
On top of this classification, as previously highlighted, there could be the possibility upon STARS
planners’ request, to revise the clustering and change the classification of maximum of 10 stores per
each macro-region. Even though this request might outbalance the clustering outcome it is believed
not to turn upside-down the overall model and, furthermore, it is something that has to be managed
for a great fine-tune of the project. Actually the present study is dedicated on enhancing the service
provision to customers and, as a matter of fact, carrying out a purely mathematical exercise
disregarding the business needs might occasionally lead to counterproductive results. As a
consequence the cross-functional dialogue with STARS planners had led to a slight review of 4
stores within the macro-region composed by Italy, France and Spain and by 8 stored for the other
geographical perimeter. This minor change, after being approved by STARS Logistics Customer
Service, has been included in the business case and taken into consideration for the next steps of the
project.
6.2.2 CUSTOMERS’ COST-TO-SERVE
The new classification based on a logistics variable, the linkage of a Theoretical Shipping
Frequency to each class and the classes’ volumes, both in terms of sell-in and in terms of stores,
arranged the possibility to start considering the Cost-to-Serve. The revision of the Cost-to-Serve has
to pass through:
Table 12 – Details of new classes per macro-region: sell-in, stores and TSF

119
1. The evaluation of the new shipping profile typical of each class and diversified for each
macro-region;
2. The understanding of the most favourable shipping calendar, given the TFS;
3. The assessment of the delivery service, the main driver of the Cost-to-Serve ratio;
4. The evaluation of the Order to Delivery Lead Time;
SHIPPING PROFILE
The new classification of customers and the new perimeters of classes lead to a modification of the
average shipping profile that has to be carefully evaluated in order to make the assessment of the
Cost-to-Serve ratio possible. The shipping profile is evaluated again as the average weekly number
of pieces per shipment and per store and even though differentiated by class, it has been evaluated
in parallel for Italy, France and Spain, and for Germany and UK:
From Figure 30 it is greatly evident how the shipping profile varies on a macro-region base and,
additionally, class by class within the same region. The greatest figure regards the macro-region
composed by Italy, France and Spain, were moving from the 261,95 pieces per shipment per store
per week of class A to the 58,02 pieces of class B, the shipping profile decreases for about the 78%.
Additionally a huge discrepancy is also highlighted always with regard to class A between Italy,
France and Spain’s shipping profile and Germany and UK’s one: the difference between the two is
close to 80%, and this gap is well explained by the different maturity stages reached in the markets
and by the strongly diverse size of the players, both of them leading to different sell-in volumes.
Figure 30 – Shipping profile per macro-region and per class

120
SHIPPING CALENDAR
The understanding of the best performing shipping calendar is something that does not have direct
impact on the Cost-to-Serve ratio, however it allows skimming, given the Theoretical Shipping
Frequency associated to the different classes, the best combinations of shipping days and delivery
service that, in turn, have a direct impact on the Cost-to-Serve ratio. As a consequence, given each
class – and thus each different Theoretical Shipping Frequency – the Order to Delivery Lead Time
Calculation Model is used to understand how the Order to Delivery Lead Time varies on the basis
of the combination between delivery service and shipping days. Clearly, this assessment has the
objective to choose the combination of shipping days that minimizes the OtD LT, and it is carried
out per class and irrespectively of the macro-region.
Class A has a Theoretical Shipping Frequency of 5 times per week, as a consequence there is no
choice about the shipping days. It results:
Class B has a Theoretical Shipping Frequency of 4 times per week and three out of five
combinations of weekly shipping days for both the 24h and 48h delivery services are
comparable in terms of OtD LT:
In order to simplify as much as possible the management of the shipping calendar in the TO BE
scenario the combinations able to minimize the OtD LT for both the 24h and 48h delivery
services concurrently are further considered. As a result class B can be shipped either on Mon.,
Tue., Wed., and Thu., or on Mon., Wed., Thu., and Fri..
Figure 31 – OtD LT model for class A
Figure 32 – OtD LT model for class B

121
Class C has a Theoretical Shipping Frequency of 3 times per week and if the 24 hours delivery
service is used the combination Mon., Tue., and Thu., is the one that minimizes the OtD LT. On
the other hand, considering a 48 hours delivery service the KPI is minimized for two
combinations of shipping days: Mon., Wed., and Thu., and Mon., Wed., and Fri..
Class D has a Theoretical Shipping Frequency of 2 times per week:
Figure 33 – OtD LT model for class C
Figure 34 – OtD LT model for class D
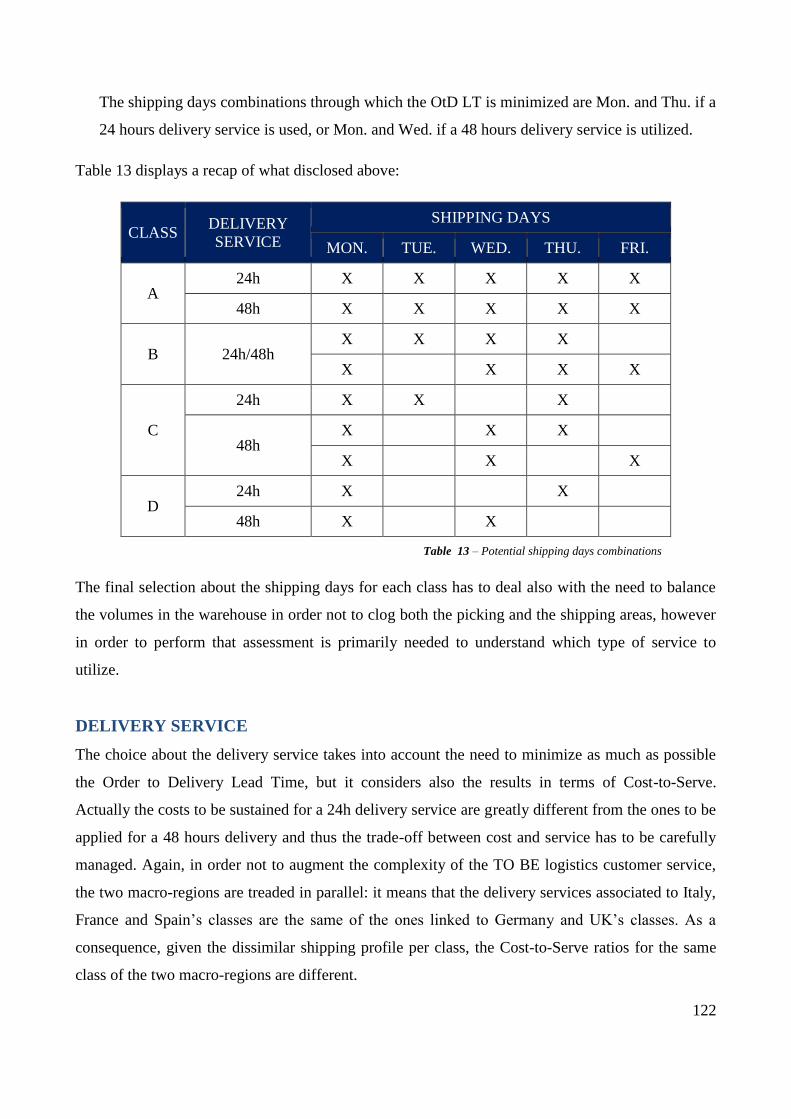
122
The shipping days combinations through which the OtD LT is minimized are Mon. and Thu. if a
24 hours delivery service is used, or Mon. and Wed. if a 48 hours delivery service is utilized.
Table 13 displays a recap of what disclosed above:
CLASS DELIVERY
SERVICE
SHIPPING DAYS
MON. TUE. WED. THU. FRI.
A 24h X X X X X
48h X X X X X
B 24h/48h X X X X
X X X X
C
24h X X X
48h X X X
X X X
D 24h X X
48h X X
The final selection about the shipping days for each class has to deal also with the need to balance
the volumes in the warehouse in order not to clog both the picking and the shipping areas, however
in order to perform that assessment is primarily needed to understand which type of service to
utilize.
DELIVERY SERVICE
The choice about the delivery service takes into account the need to minimize as much as possible
the Order to Delivery Lead Time, but it considers also the results in terms of Cost-to-Serve.
Actually the costs to be sustained for a 24h delivery service are greatly different from the ones to be
applied for a 48 hours delivery and thus the trade-off between cost and service has to be carefully
managed. Again, in order not to augment the complexity of the TO BE logistics customer service,
the two macro-regions are treaded in parallel: it means that the delivery services associated to Italy,
France and Spain’s classes are the same of the ones linked to Germany and UK’s classes. As a
consequence, given the dissimilar shipping profile per class, the Cost-to-Serve ratios for the same
class of the two macro-regions are different.
Table 13 – Potential shipping days combinations
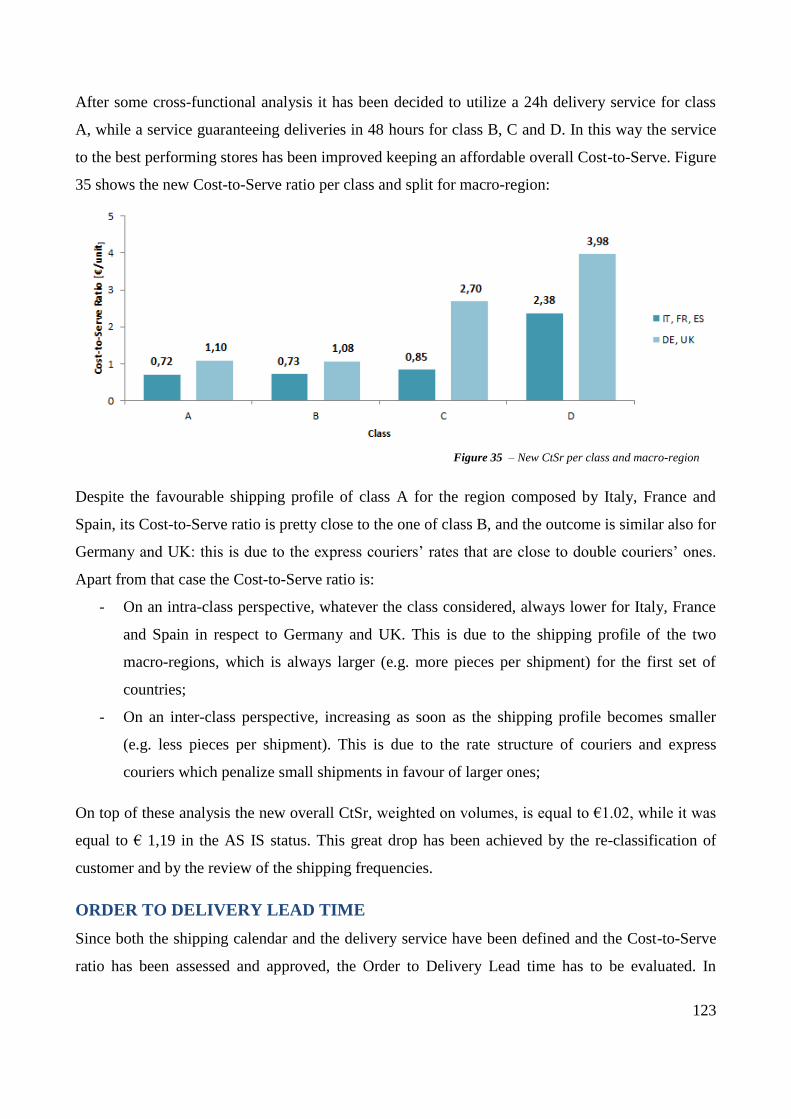
123
After some cross-functional analysis it has been decided to utilize a 24h delivery service for class
A, while a service guaranteeing deliveries in 48 hours for class B, C and D. In this way the service
to the best performing stores has been improved keeping an affordable overall Cost-to-Serve. Figure
35 shows the new Cost-to-Serve ratio per class and split for macro-region:
Despite the favourable shipping profile of class A for the region composed by Italy, France and
Spain, its Cost-to-Serve ratio is pretty close to the one of class B, and the outcome is similar also for
Germany and UK: this is due to the express couriers’ rates that are close to double couriers’ ones.
Apart from that case the Cost-to-Serve ratio is:
- On an intra-class perspective, whatever the class considered, always lower for Italy, France
and Spain in respect to Germany and UK. This is due to the shipping profile of the two
macro-regions, which is always larger (e.g. more pieces per shipment) for the first set of
countries;
- On an inter-class perspective, increasing as soon as the shipping profile becomes smaller
(e.g. less pieces per shipment). This is due to the rate structure of couriers and express
couriers which penalize small shipments in favour of larger ones;
On top of these analysis the new overall CtSr, weighted on volumes, is equal to €1.02, while it was
equal to € 1,19 in the AS IS status. This great drop has been achieved by the re-classification of
customer and by the review of the shipping frequencies.
ORDER TO DELIVERY LEAD TIME
Since both the shipping calendar and the delivery service have been defined and the Cost-to-Serve
ratio has been assessed and approved, the Order to Delivery Lead time has to be evaluated. In
Figure 35 – New CtSr per class and macro-region

124
parallel the assessment of the estimated picking and shipping volumes per day has to be performed
in order to verify the correct balancing of warehousing and shipping activities. To do so, given the
hypothesized delivery services, it is possible to skim the arrangements expressed in Table 13 and to
obtain the following ones:
CLASS DELIVERY
SERVICE
SHIPPING DAYS
MON. TUE. WED. THU. FRI.
A 24h X X X X X
B 48h X X X X
X X X X
C 48h X X X
X X X
D 24h X X
In order to find the best alternative among the four achievable by combining the rows of Table 14,
the daily workload in terms of overall pieces shipped per day has been assessed. The preeminent
alternative is the one characterized by the more balanced daily workload, or in other words, by the
lowest standard deviation among the daily workloads, and it is the following one:
CLASS DELIVERY
SERVICE
SHIPPING DAYS
MON. TUE. WED. THU. FRI.
A 24h X X X X X
B 48h X X X X
C 48h X X X
D 24h X X
For this alternative the standard deviation is equal to 16,122 pieces, while for all the other three
alternatives it would have been equal to 21,591 pieces. This alternative is in fact characterized by to
peak days – Monday and Wednesday – in which all the four classes are released into picking and
thus shipped, by two “average workload days” – Tuesday and Thursday – and by a really unloaded
day, Friday. However the low Friday’s workload is common to all the alternatives under
Table 14 – New potential shipping days combinations
Table 15 – Final shipping days combination

125
examination and it does not represent thus something that could be eluded with other allocation
schedules.
Graphically that alternative can be depicted as follows, where columns represent the workload in
terms of pieces shipped for each working day and are built considering classes’ contribution:
Once the classes have been created, the Theoretical Shipping Frequency and the Cost-to-Serve ratio
assessed and the workload balanced as much as possible, it is finally possible to point out the
definitive picture of the Order to Delivery Lead Time of the TO BE logistics customer service,
which is expressed on Table 16:
CLASS TSF
[shipments/week]
OtD LT
[days]
A 5 2,71
B 4 4,14
C 3 4,29
D 2 4,57
From that figures it emerges that class A customers are served with the shortest possible Order-to-
Delivery Lead Time and, theoretically, their shipments are performed 5 times per week. In this way
their huge sales are constantly supported by the continuous and fast refilling of their shelves and
showcases. Moreover the Order-to-Delivery Lead Times for class B, C and D being pretty close
Figure 36 – Workload schedule of the chosen alternative
Table 16 – Final TSF and OtD LT assessment per class

126
among each others and always shorter than 5 days allow that customers to receive their orders in a
reasonable time frame. Given the closeness of the OtD LT for these classes the main driver for the
service differentiation consists in the number of shipments per week: thanks to this variable the best
performing stores are served always on a regular base and even to stores clustered on class D at
least two deliveries per week are guaranteed. These differences in the Theoretical Shipping
Frequency had allowed to balance the shipping profile and thus to obtain an acceptable Cost-to-
Serve customers.
6.2.3 MAIN FINDINGS, FUTURE STEPS AND LIMITATIONS
In conclusion, thought this study most of the insights, lacks and omissions encountered in the
analysis of the set-up and performance of the AS IS logistics customer service have been touched.
Firstly classes are now built on the basis of a single quantitative variable: this point disables the
possibility for subjective interpretations and it is finally based upon logistics needs. For second, in
the TO BE logistics customer service set-up classes have a geographical scope and their boundaries
varies across macro-regions in order to guarantee the highest possible adherence of the model to the
maturity stage reached by the different markets. Additionally the number of classes has been
reviewed and their numerousness has now a clear rationale behind. Fourthly each class now has a
dedicated delivery service and a dedicated Theoretical Shipping Frequency, two factors that
together are able to fully guarantee the actual achievement of a more than reasonable Order to
Delivery Lead Time. Lastly all these steps and consideration have made possible the proper
evaluation of the Cost-to-Serve: the Cost-to-Serve now is in line with the services agreed to each
class and well represents the set-up of the business.
Additionally all the insights for improvement expressed in paragraph 6.2 have been shared together
with and beyond the Teams that participated to the project in order to ensure the largest possible
spread of knowledge and awareness about the possible results achievable, and they are considered
to be the basis of the future set-up of the business. Practically they have been implemented in
September 2016 becoming effective starting from October 2016 together with the go-live of the Q4.
The choice was driven by the fact that, even if the scenario was widely studied and accepted by all
the Teams involved in the project, it has been almost impossible to clearly predict what would have
been its impact over the business. As a consequence it has been decided to wait until the arrival of
the low season in order to perform a trial without the risk of affecting the business. If after this first
test the outcome would be positive it has been planned to finally and definitely implement the

127
project over the five reference markets also for the peak season. In the meanwhile it has been agreed
to extend the analysis both to other markets within the STARS trade channel and to other
Luxottica’s businesses, such as its Wholesale and Retail divisions.
In its entirety the project lasted for a total of 10 months and it has been characterized by three well-
differentiated phases:
1. The analysis of the AS IS scenario, which began in November 2015 and ended in April
2016, for an overall duration of 5 months;
2. The provision of the insights for improvement, which lasted 5 months, from April 2016
to September 2016;
3. The TO BE scenario implementation, which went live on October 2016 and is still
ongoing;
Even though these three phases can be easily recognized along the project, it has to be considered
that the former two have been carried out in parallel for at least one month. The overlap was due to
the strict deadline imposed to the project in order to be able to go-live for Q4 2016 and thus to
pinpoint improvements before the full end of the analysis phase. This overlap did not cause
conflicts or redundancy since in the first moments of the second phase only macro considerations
have been pointed out. The project, to pass all along these three phases, required the involvement of
many teams, and foremost EMEA Transportation, EMEA Logistics Customer Service and STARS
Business Planning, and required a deep cross-functional effort to match and properly balance each
team’s objectives. At the end it resulted with an improved awareness of how the business was
carried out and how it is going to be run, on what are the leverages to touch in order to improve its
performance and on what could be the next steps in order to exploit the results of this research for
similar purposes.
The greatest limitations of the study are mainly two, and both of them are concerned with the
perimeters of the project. Actually on one hand the study has been carried out with regard to a
single trade channel over the other three currently managed by the company (Wholesale, Retail,
Ecommerce), and it has considered only a sample of five markets over the 130 countries in which
Luxottica operates. On the other hand the present dissertation has been focused on the implications
that the right segmentation of customers could have over the transportation step of the Order to
Delivery process, but it did not consider in an accurate and comprehensive way all the other steps,
such as the allocation phase and the warehouse activities.

128
7. CONCLUSIONS
In a context in which competition is growing more and more and firms need to be innovative,
constantly in evolution and projected toward customers and their needs, an analysis aimed at
improving the Logistics Customer Service can help companies in looking at logistics not only as a
cost driver, but as a revenue enabler. Additionally the present study, involving the assessment of the
industry world leader in the eyewear business, has clearly evidenced that nowadays several gaps
between theory and practice still exist. Indeed, on one hand, the theories dissertated in this study
have been treated since 1948 and a large body of knowledge has been developed around ‘90s and
‘00s, however, on the other hand, limited application is visible in practice: in the academic
environment case studies and practical revisions and deep-dives on these topics are something very
rare; similarly, among the business environment, these concepts are seldom applied. This has been
confirmed also by the approach characterizing this research, in which the literature review has been
analysed alongside the on-filed experience. This kind of exercise is something relatively new in the
academic environment and it has led to favourable results being successful in well integrating the
two environments and in leveraging on the peculiarities of the former to bridge the gaps of the latter
and vice-versa. Actually the on-field experience had allowed practically touching and
experimenting different tangible problematics and several diverse themes and topics that have
clearly evidenced the huge gap existing between theory and practice. The more significant lesson
learnt among several others probably consists in the precious awareness that the pace of the
academic environment is not always able to proper sustain the frenetic rhythm of the business:
business decisions, especially the most operative, usually have to be taken within a certain time
frame which, as long as that might be, is always too short to allow the perfect study from the
academic viewpoint of the effects of that choice in a so complex environment. On the other hand it
has been evidenced that sometimes the practical world is missing the full picture that, on the
contrary, is almost always evidenced in literature.
On top of that the study has undoubtedly evinced the great complexity behind Luxottica’s
operations: the density of variables, leverages and equilibria to respect and balance is huge and this
is something that had, in some specific and delicate phases, slowed down the pace of the study.
Even though sometimes it has been necessary to employ more resources rather than what
hypothesized, the major milestones have been reached always on time and, moreover, the objectives
of the research have been met as well as the expected results have been achieved. Indeed at the end
of the study a clear model to evaluate and improve Company’s logistics performance toward
129
customers has been drafted and the model, validated by Luxottica’s Teams involved in Planning
and Logistics, has been practically applied. After the go-live the model has been implemented also
for other markets, impacting thus on additional trade channels and additional geographical areas. As
a consequence the final objective of the study - to achieve a standard methodology able to lead to a
customer service improvement at the as-is costs, or an overall cost-to-serve frontier reduction at the
as-is customer service – has been achieved.
Even though the model has been practically applied and in the very short-run it had already
evidenced some streams for improvement it is crucial to note that one of the major limitation
consists in the short breadth of variables that, being pretty far and beyond the perimeter of the
study, have not been faultlessly assessed. Indeed once pointed out that they would not have been
disrupted as the model would have been implemented, their valuation has been left out. For second
it is essential to consider that the project has been developed in order to perfectly fit Luxottica’s
processes, meaning that in order to be applied to other scenarios it has to be slightly adapted and
routed on other entities’ processes. However, even though fine-tunings would be necessary, the
current structure of the model and the methodologies on which it is based can support a wide range
of applications, especially in business to business environment. Ultimately it is crucial to keep into
consideration that a six-month internship would not have been enough to achieve a sufficient
appraisal of the business and thus to conclude in a coherent and articulated way the present study.
Fortunately further time on the project has been spent and this had allowed the achievement of an
optimal model completeness and potential.

130
8. REFERENCES
1. Knut Alicke, Martin Lösch, “Lean and mean: How does your supply chain shape up?”
McKinsey&Company, 2010
2. CSCMP, Council of Supply Chain Management Professionals (2014). “Logistics Cost and
Service 2014”, retrieved on 03/10/2016 at: http://www.establishinc.com/wp
content/uploads/2014/09/Establish-Davis-Logistics-Cost-and-Service-Presentation-2014.pdf
3. Global Market Insights Inc. (2016). “Eyewear market size is projected to exceed USD 165
billion by 2022, growing at a CAGR of 7% from 2015 to 2022”, retrieved on 25/08/2016 at
http://www.getnews.info/562491/eyewear-market-size-is-projected-to-exceed-usd-165-billion-
by-2022-growing-at-a-cagr-of-7-from-2015-to-2022-global-market-insights-inc.html
4. Mellery-Pratt (2015). “A Closer Look at the $13 Billion Premium Eyewear Market”, retrieved
on 26/08/2016 at https://www.businessoffashion.com/articles/intelligence/a-closer-look-at-the-
13-billion-premium-eyewear-market
5. Global Market Insights (2016). “Eyewear market size forecast to reach USD 165 billion by
2022”, retrieved on 25/08/2016 at https://www.gminsights.com/industry-analysis/eyewear-
market
6. Technavio (2016). “GLOBAL EYEWEAR MARKET 2016-2020”, retrieved on 24/08/2016 on
http://www.technavio.com/report/global-general-retail-goods-and-services-eyewear-market
7. ANFAO (2015), “ Italy, Key Figures 2015”, retrieved on 23/08/2016 at
http://www.femcacisl.it/images/allegati/italian_eyewear_industry_and_market_2015_01.pdf
8. Smartglasses.com (2016). “The benefit of sunglasses”, retrieved on 21/08/2016 at
http://www.smartglasses.org/benefitssmartglasses/
9. Reuters (2016). Retrieved on 30/08/2016 at
http://www.reuters.com/finance/stocks/SFLG.MI/keydevelopments/article/2710703
10. Alderson, W. (1950). Marketing Efficiency and the Principle of Postponement. Cost and Profit
Outlook.
11. Anderson, S.R. and Kaplan, R.S. (2004). Time-driven activity-based costing. Harvard Business
Review, November, pp. 131-8.

131
12. Babakus E., Pedrick D., Richardson A (1995). Assessing Perceived Quality in Industrial Service
Settings: Measure Development and Application. Journal of Business-to-Business Marketing
vol.2, pp. 47-68.
13. Bailey R. C. (1996). A Guide to Qualitative Field Research. Thousand Oaks, California: Pine
Forge Press.
14. Barton A. W., Sandy D. J. (1995). Relationship marketing and distribution channels. Journal of
the Academy of Marketing Science, vol. 23, no. 4, pp. 305-320.
15. Berger, P. D., & Nasr, N. I. (1998). Customer lifetime value: marketing models and
applications. Journal of Interactive Marketing, vol. 12, no. 1, pp. 17-30.
16. Bienstock C. C, Mentzer J. T. Bird M. M. (1997). Measuring Physical Distribution Service
Quality. Journal of the Academy of Marketing Science, vol. 25, no. 1, pp. 31-44.
17. Braithwaite, A., & Samakh, E. (1998). The Cost-to-Serve Method. International Journal of
Logistics Management, vol. 9, no. 1, pp. 69-84.
18. Brensinger. R. P., Douglas M. L. (1990). Can the SERVQUAL Scale Be Generalized to
Business-to-Business Services?
19. Bottani E, Rizzi A. (2006). Strategic management of logistics service: A fuzzy QFD approach.
International Journal of Production Economics, pp.1.
20. Bowersox D. J., Mentzer J. T., Speh W. T. (1995). Logistics Leverage. Journal of Business
Strategies, vol. 12, pp. 36-49.
21. Christopher, M. (1997), Logistica e gerenciamento da cadeia de suprimentos: estrategias para a
reducao de custos e melhoria dos servicios. Pioneira, Sao Paulo.
22. Cooper R., Kaplan R. S. (1999). Design of Cost Management Systems. Upper Saddle River,
NJ: Prentice Hall.
23. Cokins, G. (2003). Measuring profits and costs across the supply chain for collaborations. Cost
Management, vol. 17, no. 5, pp. 22-9.
24. Coyle J. J., Edward J. B., John L. Jr. (1992). The Management of Business Logistics. St. Paul,
MN: West Publishing Company.
25. Daley, J.M. (1981). Marketing Motor Transportation. The American Trucking Association,
Washington, DC.
26. Daugheny P. J., Theodore P. S., Alexander E. E. (1998). Leveraging Logistics/Distribution
Capabilities: The Effect of Logistics Service on Market Share. Journal of Business Logistics,
vol. 19 no. 2, pp. 35-51.

132
27. Donald J. Bowersox, David J. Closs, Omar Keith Helferich (1986). Logistical management: a
systems integration of physical distribution, manufacturing support, and materials procurement.
Macmillan.
28. Dresner M., Kefeng X. (1995). Customer Service, Customer Satisfaction, and Corporate
Performance. Journal of Business Logistics, vol. 16 no. I, pp. 23-41.
29. Foster, G. and Gupta, M. (1994). Marketing, cost management and management accounting.
Journal of Management Accounting Research, vol. 6, pp. 43-77.
30. Fuller J. B., O’Conor, J., Rawlinson R. (1993). Tailored Logistics: The Next Advantage.
Harvard Business Review, pp. 87-95.
31. Gilmour P, Borg G, Peter A. D., Nigel D. Johnston, B. E., Limbek, M. R. S. (1976). Customer
Service: Differentiating By Market Segment. International Journal of Physical Distribution, vol.
7, no. 3, pp. 141 – 148.
32. Gooley T. B. (1998). Mass Customization: How Logistics Makes It Happen. Logistics
Management and Distribution Report, vol. 37 no. 4, pp. 49-54.
33. Guerreiro R., B., Vazquez S. R., Merschmann E. V. (2008). Cost-to-serve measurement and
customer profitability analysis. International Journal of Logistics Management, vol. 19, no. 3,
pp. 389-407.
34. William H., Stock J. (1985). Marketing and Distribution: Coming Back Together at Last.
Proceedings of the 1985 Transportation and Logistics Educators' Conference, pp. 48-67.
35. Holmlund M., Kock, S. (1995). Buyer Perceived Service Quality in Industrial Networks.
Industrial Marketing Management vol. 24, pp. 109-121.
36. Johnson T. H. (1992). It’s time to stop overselling activity-based concepts. Management
Accounting, pp. 26-35.
37. Kahn K. B. (1996). Interdepartmental Integration: A Definition with Implications for Product
Development Performance. Journal of Product Innovation Management, vol.13, no. 137-5.
38. Kahn K. B. John T. M. (1996). Logistics and Interdepartmental Integration. International
Journal of Physical Distribution and Logistics Management, vol. 26, no. 8, pp- 6 -14.
39. Kaplan R.S. and Cooper R. (1998), Cost and Effect: Using Integrated Cost Systems to Drive
Profitability, Harvard Business School Press, Boston, MA.
40. Kaplan R. S., Narayanan, V. G. (2001). Measuring and managing customer profitability. Journal
of Cost Management, vol. 15, no. 5, pp. 5.
41. Kong R. M. (1993). Measuring Service Quality in the Business-to-business Context. The
Journal of Business & Industrial Marketing, vol. 8, pp. 5-15.

133
42. Kotler P. (1984). Marketing Management: Analysis, Planning, and Control, Prentice-Hall.
43. Kumar V., Rajkumar V., Tim B., Denise B. (2008). The Power of CLV: Managing Customer
Lifetime Value at IBM. Marketing Science, vol. 27, no. 4, pp. 585.
44. Kumar V., Shah, D. (2009). Expanding the Role of Marketing: From Customer Equity to
Market Capitalization. Journal of Marketing, vol. 73 no. 6, pp. 119-136.
45. Kyj L. and Kyj M. (1989). Customer service: Product differentiation in international markets.
International Journal of Physical Distribution Material Management, vol. 19, no. l, pp. 30-38.
46. LaLonde B.J., Zinszer P.H. (1976). Customer Service: Meaning and Measurement. National
Council of Physical Distribution Management, Chicago, IL.
47. LaLonde B. Coope M., Noordewier T. (1988). Customer service: a management perspective.
Oak Brook, Ill: The Council of Logistics Management.
48. Lambert D.M., Burduroglu R. (2000). Measuring and selling the value of logistics. International
Journal of Logistics Management, vol. 11, no. 1, pp. 1-17.
49. Lambert D.M., Lewis M.C. (1983). Managing customer service to build market share and
increase profit. Business Quarterly, vol. 48, no. 3, pp. 50-57.
50. Lam S.S., Woo K.S. (1997). Measuring service quality: a test-retest reliability investigation of
SERVQUAL. Journal of the Market Research Society, vol. 39, pp. 381-396.
51. Lee-Kelley L., Davies S., Kangis P. (2002). Service quality for customer retention in the UK
steel industry: old dogs and new tricks? European Business Review, vol. 14, no. 4, pp. 276-286.
52. Lewis R.J. (1991). Activity-based costing for marketing. Management Accounting, pp. 33-8.
53. Lloyd M. R., Cooper M. B., Wagenheim G. D. (1982). Furthering the Integration of Marketing
and Logistics Through Customer Service in the Channel. Journal of the Academy of Marketing
Science, pp. 1.
54. Mentzer J. T., Lisa R. W. (2001). The Role of Logistics Leverage in Marketing Strategy.
Journal of Marketing Channels, vol. 8 no.3/4, pp. 29-48.
55. Mentzer J. T. (1993). Managing Channel Relations in the 21st Century. Journal of Business
Logistics, vol. 14, no. 1, pp. 27-42.
56. Mentzer J. T., Roger G., Robert E. K. Jr. (1989), Physical Distribution Service: A Fundamental
Marketing Concept? Journal of the Academy of Marketing Science, vol. 17, pp. 53-62.
57. Murphy P., Richard F. P. (1996). Comparative Views of Logistics and Marketing Practitioners
Regarding Interfunctional Coordination. International Journal of Physical Distribution and
Logistics Management vol.2, no.6-8, pp. 15-28.

134
58. Niraj R., Foster G., Gupta M. R., Narasimhan C. (2008). Understanding customer level
profitability implications of satisfaction programs. Journal of Business & Industrial Marketing,
vol. 23, no. 7/8, pp. 454-463.
59. Niraj R. (2001). Customer Profitability in a Supply Chain. Journal of Marketing, vol. 65, no. 3,
pp. 1-16.
60. Novack R. A., Langley C. J. Jr., Rhinehan L. M. (1995). Creating Logistics Value: Themes for
the Future. Oak Brook, IL: Council of Logistics Management.
61. Palmer A. (2012). Introduction to Marketing: theory and practice. OUP Oxford.
62. Parasuraman A. (1998). Customer service in business-to-business markets: an agenda for
research. Journal of Business & Industrial Marketing, vol.13, pp. 309-321.
63. Parasuraman A., Zeithaml V. A., Berry L. L. (1994). Alternative Scales for Measuring Service
Quality: A Comparative Assessment Based on Psychometric and Diagnostic Criteria. Journal of
Retailing, vol. 70, pp. 201-230.
64. Parasuraman A., Zeithaml V. A., Berry L. L. (1994). Reassessment of Expectations as a
Comparison Standard in Measuring Service Quality: Implications for Further Research. Journal
of Marketing, vol. 58, pp. 111-124.
65. Parasuraman A., Zeithaml V. A., Berry L. L. (1993). Research Note: More on Improving
Service Quality Measurement. Journal of Retailing, vol. 69, pp. 140-147.
66. Parasuraman A., Zeithaml V. A., Berry L. L. (1991). Refinement and Reassessment of the
SERVQUAL Scale. Journal of Retailing, vol. 67, pp. 420-450.
67. Parasuraman A., Zeithaml V. A., Berry L. L. (1988). SERVQUAL: A Multiple-Item Scale for
Measuring Consumer Perceptions of Service Quality. Journal of Retailing, vol. 64, pp. 12-40.
68. Parasuraman A., Zeithaml V. A., Berry L. L. (1985). A Conceptual Model of Service Quality
and Its Implications for Future Research. Journal of Marketing vol. 49, pp. 41-50.
69. Perrault W. D., Frederick R. (1974). Physical Distribution Service: A Neglected aspect of
Marketing Management. MSU Business Topics, vol. 2, no. 2-3, pp. 7-45.
70. Piscopo M. G. (2013). Effect of Relationship Quality and Cost to Serve on Customer Value in
Business Market. Dissertation. Georgia State University.
71. Pirttila T., Huiskonen J. (1996). A framework for cost-service analysis in differentiation of
logistics services. International Journal of production economics, vol. 45, pp. 131-137.
72. Pohlen, T. L., LaLonde, B. J. (1994). Implementing activity-based costing (ABC) in logistics.
Journal of Business Logistics, vol. 15, no. 2.

135
73. Porter, M. E. (2008). The five competitive forces that shape strategy. Harvard Business Review,
vol. 86, no. 1, pp. 78-93.
74. Powers T. (1985). An Examination of the Effects of Trade Incentives on Logistical Performance
in The Grocery Products Industry. Dissertation, Michigan State University.
75. Niraj R., Foster G., Gupta M. R., Narasimhan C. (2008). Understanding customer level
profitability implications of satisfaction programs. Journal of Business & Industrial Marketing,
vol. 23, no. 7, pp.454-463.
76. Niraj R., Foster G., Gupta M. R., Narasimhan C. (2001) Customer Profitability in a Supply
Chain. Journal of Marketing, vol. 65, no. 3, pp. 1-16.
77. Razzano R. (1986). DDP: Merchandising Decision-Maker. Chain Store Age Executive, pp. 169-
170.
78. Ryals L. (2006). Profitable relationships with key customers: how suppliers manage pricing and
customer risk. Journal of Strategic Marketing, vol. 14, no. 2, pp. 101-113.
79. Ryszard B., Marcin J. (2013). Marketing and Logistics. University of Bielsko-Biała Press.
80. Schary P. (1984). Logistics Decisions: Text and Cases. Chicago: Dryden.
81. Shapiro R. D., James L. H. (1985). Logistics Strategy: Cases and Concepts. St. Paul, MN: West
Publishing
82. Stahl H. K., Matzler K., Hinterhuber H. H. (2003). Linking customer lifetime value with
shareholder value. Industrial Marketing Management, vol. 32, no. 4, pp. 267.
83. Stapleton D., Pati S., Beach E., Julmanichoti P. (2004). Activity-based costing for logistics and
marketing. Business Process Management Journal, vol. 10, no. 5, pp. 584-97.
84. Stock J. R., Douglas M. L. (1987). Strategic Logistics Management. Homewood, IL: Irwin
Publishing.
85. Turney P. B., Stratton A. J. (1992). Using ABC to support continuous improvement.
Management Accounting, pp. 46-50.
86. Vandermewe S., Rada J. (1988). Servitization of Business: Adding Value by Adding Services.
European Management Journal, vol. 6, no. 4, pp. 314-324
87. Van Triest S., Bun M., Raaij E., Vernooij M. (2009). The impact of customer-specific
marketing expenses on customer retention and customer profitability. Marketing Letters, vol.
20, no. 2, pp. 125-138.
88. Venkatesan R., Kumar V., Bohling T. (2007). Optimal Customer Relationship Management
Using Bayesian Decision Theory: An Application for Customer Selection. Journal of Marketing
Research, vol. 44, no. 4, pp. 579-594.

136
89. Van Raaij E. (2005). The strategic value of customer profitability analysis. Marketing
Intelligence & Planning, vol. 23, no. 4/5, p. 372.
90. Zinszer H. P. (1976). Customer service: meaning and measurement. Chicago: National Council
of Physical Distribution Management.
91. Yannis P., Apostolos G., Spyridon B. (2014). Logistics service quality and its effects on
customer satisfaction in the manufacturing companies’ supply chains. Journal of Modelling in
Management, vol. 9, no. 2, pp. 215-237.
92. Westbrook K. W., Peterson, R. M. (1998). Business-to-Business Selling Determinants of
Quality. Industrial Marketing Management, vol. 27, pp. 51-62.
93. Luxottica (2016). “Annual Review 2015”, retrieved on 01/09/2016 at http://www.luxottica.com
94. Luxottica (2016). “Relazione finanziaria 2012”, retrieved on 21/08/2016 at
http://www.luxottica.com/sites/luxottica.com/files/relazione_finanziaria_annuale_2012_v2.pdf
Recommended