Locating the rock art of the Maloti-
Drakensberg:
Identifying areas of higher likelihood using Remote Sensing
A Dissertation submitted to the Faculty of Science, University of the Witwatersrand,
Johannesburg, in fulfilment of the requirements for the degree of Master of Science
James Pugin
374962
Johannesburg, February 2016
Supervisors: Dr Sam Challis and Dr Clement Adjorlolo

ii
Declaration
I hereby declare that this is dissertation is my own, original work, except where otherwise
acknowledged. It is being submitted for the degree MSc to the University of the
Witwatersrand, Johannesburg. I have not submitted it previously, for the purpose of
obtaining any degree, qualification at this, or any other, university.
James Pugin Date

iii
Acknowledgements
Usually acknowledgements given to supervisors are to recognise their continuous and
unwavering support throughout the research, however, in this case it does not suffice. Both
Dr Sam Challis and Dr Clement Adjorlolo were always readily available to assist with any
queries and problems encountered throughout this research, for your help I am truly
grateful.
To Nicoletta Maraschin, your assistance, support and motivation throughout this research
has been a constant force that has enabled me to continue when at times I thought I would
never finish. Thank you for everything, I would not be here if were not for you.
Furthermore this research would not have been possible if it were not for the generous
funding provided by the National Research Fund (Innovation Masters and Doctoral
Scholarships for 2013-14) and the Archaeological Society of South Africa (ArcSoc Student
Equipment Grant).
To the Ministry of Tourism, Environment and Culture of the Kingdom of Lesotho for affording
this research an opportunity to test its effectiveness.
To the Mehloding Community Trust, the researchers are grateful for access into this
amazing area to conduct this research.
To those that assisted with the arduous task of proof reading your help is much appreciated:
Nicoletta Maraschin
Michael Cadmen
Dr Barbara Duigan
Alison Zeelie
To all that assisted with surveying and recording sites under the auspices of the MARA
programme in Matatiele and Sehlabathebe:
Puseletso Lecheko
Joseph Ralimpe
Rethabile Mokhachane
Hugo Pinto
Dr Sam Challis
Mncedisi Siteleki
Ntabiseng Mokeona
Lineo Mothopeng
Dr Mark McGranaghan
Pulane Nthunya
Andrew Pugin
Alice Mullen

iv
To all at the University of the Witwatersrand that assisted with guidance and offered support:
Prof Karim Sadr
Prof Fethi Ahmed
Prof Stefan Grab
Janista Daya
Dr Elhadi Adam
Dr Cornelia Kleinitz
Dr Stefania Merlo
Dr Mark McGranaghan
Dr Rachel King
Azizo de Fonseca
Dr Barend Erasmus
To all those at SANSA that assisted me with obtaining and processing data for this research:
Dr Clement Adjorlolo
Nosiseko Mashiyi
Dr Jane Olwoch
Nomnikelo Bongoza

v
Abstract
This dissertation examines the role of remote sensing on rock art survey and is motivated
by two key objectives: to determine if remote sensing has any value to rock art survey,
furthermore if remote sensing is successful to determine if these individual remote sensing
components can contribute to a predictive (site locating) model for rock art survey. Previous
research effectively applied remote sensing techniques to alternate environmental studies
which could be replicated in such a study. The successful application of google earth
imagery to rock art survey (Pugin 2012) demonstrated the potential for a more expansive
automated procedure and this dissertation looks to build on that success. The key objectives
were tested using three different research areas to determine remote sensing potential
across different terrain.
Owing to the nature of the study, the initial predictions were formulated using the MARA
database – a database of known rock art sites in the surrounds of Matatiele, Eastern Cape
– and were then applied to surrounding areas to expand this database further. Upon adding
more sites to this database, the predictions were applied to Sehlabathebe National Park,
Lesotho and then 31 rock art sites in the areas adjacent to Underberg. The findings of this
research support the use of predictive models provided that the predictive model is
formulated and tested using a substantial dataset. In conclusion, remote sensing is capable
of contributing to rock art surveys and to the production of successful predictive models for
rock art survey or alternate archaeological procedures focusing on specific environmental
features.

vi
Table of Contents
Declaration .......................................................................................................................................... ii
Acknowledgements ............................................................................................................................ iii
Abstract ............................................................................................................................................... v
Table of Contents ............................................................................................................................... vi
List of Figures ...................................................................................................................................... x
List of Tables ...................................................................................................................................... xi
List of Photos ..................................................................................................................................... xii
List of Equations ................................................................................................................................ xii
List of Rock Art Sites ......................................................................................................................... xii
Glossary ............................................................................................................................................xiii
Introduction ............................................................................................................................ 1
1.1 Rock Art Survey Past and Present .............................................................................................. 1
1.2 The Study Area and MARA Research Area ................................................................................ 3
1.3 Rock Art Deterioration, a motivating factor for predictive modelling ........................................... 4
1.4 Remote Sensing applications to rock art research ...................................................................... 7
1.5 Aims and Objectives .................................................................................................................... 9
1.6 Chapter Breakdown ................................................................................................................... 10
Background and History of Matatiele and Sehlabathebe .................................................... 12
2.1 Research Area........................................................................................................................... 12
2.2 Climatic Conditions .................................................................................................................... 15
2.3 Geological Formations .............................................................................................................. 17
2.3.1 Drakensberg Basalt Formation ...................................................................................... 17
2.3.2 Clarens Sandstone Formation or Cave Sandstone Stage ............................................ 18
2.3.3 Molteno Formation......................................................................................................... 18
2.3.4 Elliot Formation or Red Beds Stage .............................................................................. 19
2.3.5 Burgersdorp Formation ................................................................................................. 19
2.4 Vegetation of the research areas .............................................................................................. 19
2.5 Elevation Sub Regions .............................................................................................................. 20
2.6 The History of the Area ............................................................................................................. 21
2.7 The Archaeology of the Matatiele Region ................................................................................. 23

vii
2.8 Rock Art Research to date in the Matatiele Region .................................................................. 25
2.9 Brief History, Archaeology and Rock Art Research of Sehlabathebe ....................................... 26
2.9.1 Archaeological research ................................................................................................ 27
2.9.2 History of Sehlabathebe ................................................................................................ 28
Literature review .................................................................................................................. 29
3.1 Rock Art Surveying .................................................................................................................... 29
3.1.1 Hunter Gatherer Rock Art Site Selection ...................................................................... 31
3.1.2 Rock Art and Environmental Determinism .................................................................... 36
3.1.3 Other Applicable Biases ................................................................................................ 36
3.2 Literature Supporting Methodology ........................................................................................... 37
3.2.1 Introduction .................................................................................................................... 37
3.2.2 Case studies implementing similar techniques ............................................................. 38
Methods ............................................................................................................................... 60
4.1 Introduction ................................................................................................................................ 60
4.2 Data Acquisition......................................................................................................................... 60
4.3 Processes .................................................................................................................................. 63
4.4 Components used for predictive modelling ............................................................................... 64
4.4.1 Normalized Vegetation Difference Index ....................................................................... 65
4.4.2 MARA database and Site Record Sheets ..................................................................... 66
4.4.3 Hill/Relief Shading ......................................................................................................... 67
4.4.4 Slope ............................................................................................................................. 67
4.4.5 Predictive Modelling ...................................................................................................... 68
4.4.6 Applying Predictive Models to Alternate Areas ............................................................. 69
4.4.7 Weightings ..................................................................................................................... 70
4.5 How the models were applied? ................................................................................................. 75
4.6 Comments on the initial models ................................................................................................ 76
4.7 Fieldwork ................................................................................................................................... 77
4.8 Conclusion ................................................................................................................................. 78
Results ................................................................................................................................. 79
5.1 The Individual Thresholds ......................................................................................................... 80
5.1.1 MARA Database ............................................................................................................ 80
5.1.2 Slope ............................................................................................................................. 80
5.1.3 Shaded Relief ................................................................................................................ 82
5.1.4 NDVI .............................................................................................................................. 83
5.1.5 Aspect ............................................................................................................................ 85
viii
5.2 The Predictive Model based on MARA 2012 dataset ............................................................... 86
5.3 Predictive model vs SNP ........................................................................................................... 95
5.3.1 Slope ............................................................................................................................. 99
5.3.2 Shaded Relief .............................................................................................................. 100
5.3.3 NDVI ............................................................................................................................ 100
5.3.4 Aspect .......................................................................................................................... 100
5.4 Predictive model vs random SARADA Rock Art Sites ............................................................ 101
5.5 Conclusion ............................................................................................................................... 106
Discussion ......................................................................................................................... 107
6.1 Components that were tested but excluded ............................................................................ 107
6.1.1 Aspect .......................................................................................................................... 107
6.1.2 Supervised and Unsupervised Classification .............................................................. 108
6.1.3 Geological Map ............................................................................................................ 108
6.2 The different predictive models ............................................................................................... 108
6.2.1 MARA Models .............................................................................................................. 109
6.2.2 SNP Models ................................................................................................................. 111
6.2.3 Test Models ................................................................................................................. 112
6.3 Was the research a success? ................................................................................................. 113
6.4 What the results mean ............................................................................................................ 114
6.5 Limitations ............................................................................................................................... 115
6.5.1 Data resolution ............................................................................................................ 115
6.5.2 Site characteristics ...................................................................................................... 115
6.5.3 Remote Sensing Thresholds ....................................................................................... 115
6.5.4 Site Database .............................................................................................................. 116
6.6 How can the results be improved? .......................................................................................... 116
6.7 Were the aims achieved? ........................................................................................................ 117
6.8 Recommendations for future research .................................................................................... 117
6.9 Remote sensing components and exclusions ......................................................................... 118
Conclusion ......................................................................................................................... 119
7.1 Achievement of aims ............................................................................................................... 119
7.1.1 Test methods/components that had been effectively applied elsewhere .................... 119
7.1.2 Test whether predictive models had any value to rock art surveys ............................ 120
7.2 Implications to rock art research ............................................................................................. 121
7.3 Future Work ............................................................................................................................. 122

ix
References ........................................................................................................................ 123
Appendix ............................................................................................................................ 138
9.1 Tables ...................................................................................................................................... 138
9.2 Data Used ................................................................................................................................ 152
9.3 Figures ..................................................................................................................................... 153
9.4 Site List .................................................................................................................................... 172
9.5 Site usage ................................................................................................................................ 173
9.5.1 Aspect .......................................................................................................................... 173
9.5.2 Environmental Determinism ........................................................................................ 173
9.6 Case Studies ........................................................................................................................... 174
9.6.1 Phuting Valley Case Study .......................................................................................... 175
9.6.2 Mofoqoi Valley Case Study ......................................................................................... 175
9.7 Predictive Modelling Process .................................................................................................. 176
9.8 Rock Art Sites .......................................................................................................................... 177

x
List of Figures
Figure 1.1: MARA survey tracks with known site locations, showing the extent of the unsurveyed region. .... 5
Figure 2.1: Locating map of both research areas. .......................................................................................... 14
Figure 2.2: Suspected site locations in the areas surrounding Matatiele (Derricourt 1976, see also van Riet
Lowe 1956; Vinnicombe 1976) ........................................................................................................................ 24
Figure 3.1: Image taken from Smits (1983: 62) depicting the ARAL survey areas. Research areas include
Phutiatsana (top), Qhoqhoane (left), Sebapala (bottom), Sehlabathebe (right). ............................................ 33
Figure 4.1: Methodological Process ................................................................................................................ 62
Figure 5.1: Model Output 1 with near equal value weightings and individual remote sensing components
background data negated, white background reflects areas with null values. ................................................ 87
Figure 5.2: Model output 2 with doubled slope thresholds and individual remote sensing components
background data negated, showing so called ‘blanket coverage’, white background reflects areas with null
values. ............................................................................................................................................................. 89
Figure 5.3: Model Output 3 with the 1.5x threshold for slope, individual remote sensing components
background data negated, white background reflects areas with null values. ................................................ 91
Figure 5.4: Model Output 7 with expanded slope and NDVI thresholds, white background reflects areas with
null values........................................................................................................................................................ 92
Figure 5.5: SNP Model Output 1, white background reflects areas with null values. ..................................... 96
Figure 5.6: SNP Model Output 2, white background reflects areas with null values. ..................................... 97
Figure 5.7: SNP Model Output 3. .................................................................................................................... 98
Figure 5.8: Further test 1, white background reflects areas with null values. ............................................... 103
Figure 5.9: Further test 2, white background reflects areas with null values. ............................................... 104
Figure 5.10: Further test 3 ............................................................................................................................. 105
Figure 9.1: MARA survey tracks, areas without tracks depict areas where tracks were overwritten. .......... 153
Figure 9.2: Painted Relief for the Alfred Nzo and Joe Gqabi Districts with MARA Sites as of 2012. ........... 154
Figure 9.3: Slope slice for the Alfred Nzo and Joe Gqabi Districts, white background reflects areas with null
values. ........................................................................................................................................................... 155
Figure 9.4: 150% extension of the slope slice, white background reflects areas with null values. Large white
area depicts the alluvium as discussed earlier. ............................................................................................. 156
Figure 9.5: MARA shaded relief, white background reflects areas with null values. .................................... 157
Figure 9.6: MARA NDVI, white background reflects areas with null values. ................................................ 158
Figure 9.7: MARA NDVI with thresholds expanded by 150%, white background reflects areas with null values.
....................................................................................................................................................................... 159
Figure 9.8: MARA aspect slice, derived from SRTM, white background reflects areas with null values. ..... 160
Figure 9.9: Model Output 4, white background reflects areas with null values. ............................................ 161
Figure 9.10: Model Output 5, white background reflects areas with null values. .......................................... 162
Figure 9.11: Model Output 6, white background reflects areas with null values. .......................................... 163
Figure 9.12: Model Output 8, white background reflects areas with null values. .......................................... 164
Figure 9.13: Model Output 9 .......................................................................................................................... 165
xi
Figure 9.14: Slope slice for the Alfred Nzo and Joe Gqabi Districts, white background reflects areas with null
values. ........................................................................................................................................................... 166
Figure 9.15: 150% extension of the slope slice, white background reflects areas with null values. Large white
area depicts the alluvial plain discussed earlier. ........................................................................................... 167
Figure 9.16: MARA shaded relief, white background reflects areas with null values. .................................. 168
Figure 9.17: MARA NDVI, white background reflects areas with null values. .............................................. 169
Figure 9.18: MARA NDVI with thresholds expanded by 150%, white background reflects areas with null values.
....................................................................................................................................................................... 170
Figure 9.19: MARA aspect slice, derived from SRTM, white background reflects areas with null values. Red
and purple depicts areas that are preferential based on the mean aspect. .................................................. 171
List of Tables
Table 3.1: Geological breakdown for sites located by ARAL (Smits 1983: 68-69) ........................................................... 32
Table 3.2: Exposure for sites located by ARAL (Smits 1983: 69) ....................................................................................... 33
Table 3.3: Location/Feature types for sites located by ARAL (Smits 1983: 70) ................................................................ 34
Table 3.4: Aspects of Sites located by ARAL (Smits 1983: 70) .......................................................................................... 34
Table 4.1: Geological Breakdown for MARA Rock Art sites .............................................................................................. 71
Table 4.2: Breakdown of slope for MARA sites ................................................................................................................. 72
Table 4.3: Breakdown of MARA sites against Aspect ....................................................................................................... 73
Table 4.4: Breakdown of MARA sites against NDVI ......................................................................................................... 74
Table 4.5: Breakdown of MARA database against shaded relief ..................................................................................... 75
Table 5.1: Slope values for the MARA research areas. ..................................................................................................... 81
Table 5.2: Shaded relief values for the MARA research areas. ......................................................................................... 83
Table 5.3: NDVI values for the MARA research areas. ..................................................................................................... 84
Table 5.4: Aspect values for the MARA research areas. ................................................................................................... 85
Table 5.5: Breakdown of the initial output models. ......................................................................................................... 94
Table 5.6: Comparison of test models ............................................................................................................................ 101
Table 9.1: SNP Database ................................................................................................................................................ 138
Table 9.2: MARA Database. ............................................................................................................................................ 144
Table 9.3: List of known sites in the surrounding areas of Matatiele. Abbreviations included for Natal Museum Records
(NMR), East London Museum Records (ELMR), Archaeological Data Recording Centre (ADRC), and Van Riet Lowe (VRL)
........................................................................................................................................................................................ 172

xii
List of Photos
Photo 1.1: Displaying the severity of the terrain with Three Sisters Mountains in the background Photo: James
Pugin 2013. ....................................................................................................................................................... 2
Photo 1.2: Image of Kinira Poort 3 showing the extent of paint removed to date. Photo: Dr Sam Challis 2010
........................................................................................................................................................................... 6
Photo 1.3: Image of Phepela 1 showing extensive paint removal. Photo: Puseletso Lecheko 2014 ............... 7
Photo 2.1: James Pugin recording of site E01, Sehlabathebe National Park. Photo: Dr Sam Challis 2015 .. 28
Photo 5.1: Image showing nature of terrain northeast of the old lodge, Sehlabathebe. Photo: James Pugin
2015 ................................................................................................................................................................. 99
Photo 7.1: An example of sudden drop that is unlikely to be present in poorer resolution data. Photo: Dr Sam
Challis 2012 ................................................................................................................................................... 121
List of Equations
Equation 4.1 Calculation for the threshold maximum ..................................................................................... 65
Equation 4.2: Calculation for the threshold minimum ..................................................................................... 65
Equation 4.3: Formula to calculate NDVI (Campbell 2008, Lasaponara and Masini 2012: 27) ..................... 66
List of Rock Art Sites
Rock Art Site 1: Dipaki 2 ............................................................................................................................... 177
Rock Art Site 2: Ha Phiri 1 ............................................................................................................................. 178
Rock Art Site 3: Hekeng Ya Tshepe 1 .......................................................................................................... 179
Rock Art Site 4: Malithethana Source 6 ........................................................................................................ 180
Rock Art Site 5: Mambhele 1 ......................................................................................................................... 181
Rock Art Site 6: Phuting 5 ............................................................................................................................. 182
Rock Art Site 7: Phuting 6 ............................................................................................................................. 183
Rock Art Site 8: Phuting 8 ............................................................................................................................. 184
Rock Art Site 9: Phuting 11 ........................................................................................................................... 185
Rock Art Site 10: Phuting 15 ......................................................................................................................... 186

xiii
Glossary
A.D.: Anno Domine
ARAL: Analysis of Rock Art in Lesotho Project
ARCGIS: Aeronautical Reconnaissance Coverage Geographic Information System
ASAPA: Association of Southern African Professional Archaeologists
ASTER: Advanced Spaceborne Thermal Emission and Reflection
c.: circa – approximate date, around
COMRASA: Conservation and Management of Rock Art Sites in Southern Africa
DEM: Digital Elevation Model
DTM: Digital Terrain Model
ENVI: Environment for Visualizing Images
ERDAS: Earth Resources Data Analysis System
EROS: Earth Resource Observation Services
ETM: Enhanced Thematic Mapper
GIS: Geographical Information System
GMTED: Global Multi Resolution Terrain Elevation Data
IR: Infrared
ISODATA Iterative Self Organizing Data
km: Kilometres
LAMAP: Locally Adaptive Model Of Archaeological Potential
Landsat ERTS: Earth Resource Technology Satellite
MYA: Million Years Ago
MAP Maximum A Prior Probability
MARA: Matatiele Archaeology and Rock Art
m: metres
MK: Umkhonto we Sizwe
ML: Maximum Likelihood
NDVI: Normalized Difference Vegetation Index
NIR: Near Infrared
R: Red
RARI: Rock Art Research Institute
SANSA: South African National Space Agency
SARADA: South Africa Rock Art Digital Archive
SNP: Sehlabathebe National Park
SPOT: Satellite Pour l’Observation de la Terre
SRTM: Shuttle Radar Topography Mission
UKZN: University of KwaZulu Natal
UNESCO: United Nations Educational Scientific and Cultural Organisation
WOE: Weight of evidence
1
Introduction
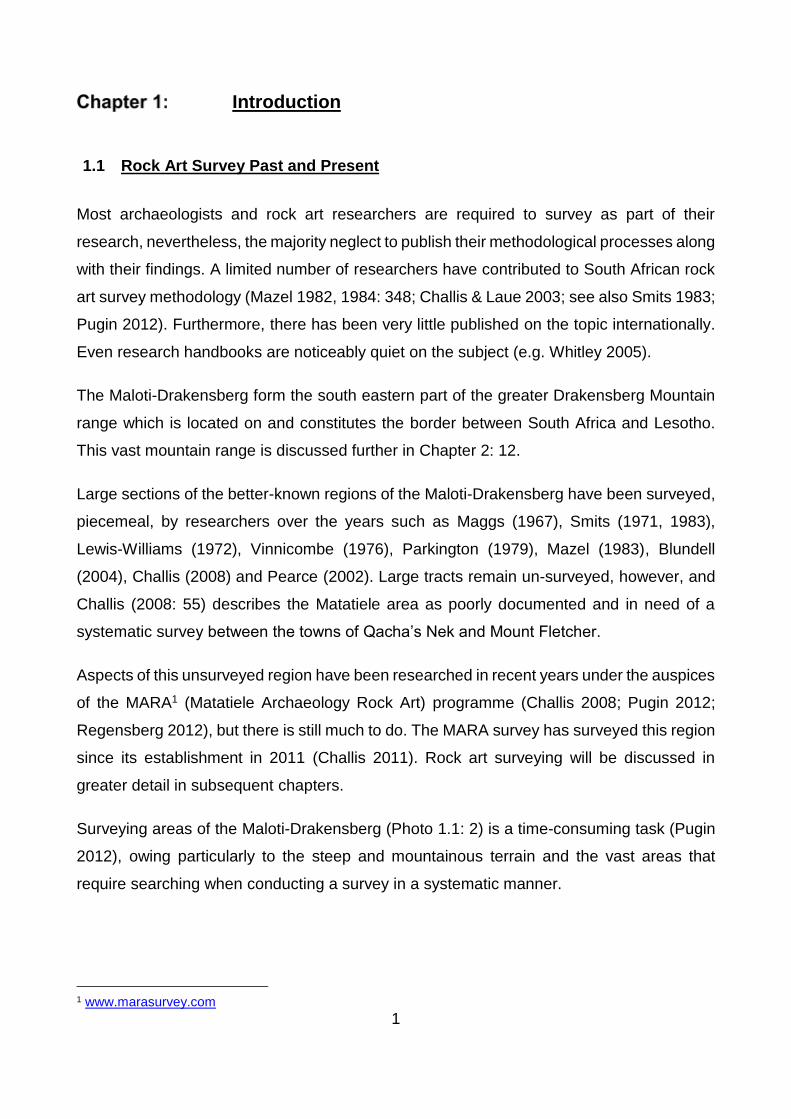
1.1 Rock Art Survey Past and Present
Most archaeologists and rock art researchers are required to survey as part of their
research, nevertheless, the majority neglect to publish their methodological processes along
with their findings. A limited number of researchers have contributed to South African rock
art survey methodology (Mazel 1982, 1984: 348; Challis & Laue 2003; see also Smits 1983;
Pugin 2012). Furthermore, there has been very little published on the topic internationally.
Even research handbooks are noticeably quiet on the subject (e.g. Whitley 2005).
The Maloti-Drakensberg form the south eastern part of the greater Drakensberg Mountain
range which is located on and constitutes the border between South Africa and Lesotho.
This vast mountain range is discussed further in Chapter 2: 12.
Large sections of the better-known regions of the Maloti-Drakensberg have been surveyed,
piecemeal, by researchers over the years such as Maggs (1967), Smits (1971, 1983),
Lewis-Williams (1972), Vinnicombe (1976), Parkington (1979), Mazel (1983), Blundell
(2004), Challis (2008) and Pearce (2002). Large tracts remain un-surveyed, however, and
Challis (2008: 55) describes the Matatiele area as poorly documented and in need of a
systematic survey between the towns of Qacha’s Nek and Mount Fletcher.
Aspects of this unsurveyed region have been researched in recent years under the auspices
of the MARA1 (Matatiele Archaeology Rock Art) programme (Challis 2008; Pugin 2012;
Regensberg 2012), but there is still much to do. The MARA survey has surveyed this region
since its establishment in 2011 (Challis 2011). Rock art surveying will be discussed in
greater detail in subsequent chapters.
Surveying areas of the Maloti-Drakensberg (Photo 1.1: 2) is a time-consuming task (Pugin
2012), owing particularly to the steep and mountainous terrain and the vast areas that
require searching when conducting a survey in a systematic manner.
1 www.marasurvey.com

2
Photo 1.1: Displaying the severity of the terrain with Three Sisters Mountains in the background Photo: James
Pugin 2013.
Previous inquiry found that there is limited recorded methodology describing how to survey
and locate rock art sites (Pugin 2012). The records to date showing explicit survey methods
are limited to Mazel (1983) and a COMRASA report (Challis & Laue 2003). With such limited
written accounts on how to survey, any methodological developments that will aid in
reducing this knowledge gap are vital. Describing the survey methods used by the MARA
programme, and then developing techniques for their improvement can be seen as the two
primary contributions of this research project.
This research project looked into different experimental methods that could enable the
recognition of regions likely to contain rock art sites based on environmental characteristics
observed at previously discovered rock art sites. The remote sensing predictive model
described in this thesis is the result of a combination of key factors that, among others, were
tested and found most relevant: slope, NDVI (Normalized Difference Vegetation Index) and
shaded relief. As we shall see, the specifics of selecting the appropriate components, and
3
testing them in a variety of landscapes, form the main body of this text. Subsequent to the
completion of this research a similar predictive model was found to be successful in the
locating of sandstone outcrops in India (Banerjee & Srivastava 2014).
1.2 The Study Area and MARA Research Area
The Matatiele region falls into the Alfred Nzo District and is adjacent to the Joe Gqabi district
to the southwest. The Transkei region was proclaimed as a homeland or ‘Bantustan’ during
the Apartheid regime (Mauder 1982: 573; Douek 2013: 207). Related histories provide
insight into why this area was neglected by researchers. However, this does not explain the
lack of research attention succeeding the decline of the Apartheid era.
The MARA survey is aimed at redressing the lack of historical record in the Matatiele region
(Challis 2011). The project set out by Challis initiated a systematic survey of the region,
which to date has discovered more than 200 previously unknown archaeological sites. Since
the MARA survey has had limited time, and funds, to achieve its aims, the methods outlined
in this dissertation will assist in achieving this goal.
The research area for this project extends from the Qacha’s Nek Border Post towards the
Ongeluks Nek Border Post, which falls within the MARA survey area. Figure 1.1: 5 shows
the research area set out by the MARA survey together with the sites that had been located
by the MARA survey. Figure 1.1: 5 also illustrates the current extent of the MARA survey
tracks prior to the commencing of this research project. Despite the MARA successes, a
substantial amount of surveying is still required between the Qacha’s Nek border post and
Mount Fletcher in order to establish the presence of other sites. Due to the unsurveyed
areas surrounding Matatiele, there are concerns about the condition of possible rock art
sites because many sites located to date are in close proximity to local villages2.
During the writing of this thesis, the opportunity arose to test the model in Lesotho’s
Sehlabathebe National Park (SNP) as part of the UNESCO (United Nations Educational
Scientific and Cultural Organisation) World Heritage Survey. The survey was required to map
out the park for rock art site locations. This then considerably expanded the dataset by
2 Throughout this research when referring to potential rock art sites, the following are grouped into one label: shelters, overhangs, kranslines, and boulders

4
introducing a new site database and survey data for a separate area to the initial model that
could be used for testing purposes.
The final aspect of the research presented in this thesis tests the output models against a
further 31 rock art sites in the surrounding areas of Sehlabathebe which include some areas
above and below the escarpment.
1.3 Rock Art Deterioration, a motivating factor for predictive modelling
Rock art deteriorates due to many different factors, some of which are natural such as
flaking, exfoliation, water seepage; others are anthropogenic, like vandalism, graffiti, fires
and damage caused by the kraaling of domestic animals (Ward 1996; Meiklejohn et al.
2009). Limiting the damage to the rock art is dependent on identifying the forces that are
damaging the rock art. The concern related to the rock art in the MARA survey area is
locating the sites in order to record and then identify the possible threats to the rock art in
an expedient manner.
The deterioration of rock art sites is discussed in great depth by Ward (1996) and Meiklejohn
et al. (2009). Ward used historical sketches by Taylor from 1896 to try and assess the
deterioration of rock art in the Giants Castle Game Reserve. One of the initial causes of
degradation in the 1890s was vandalism and it is seen to be a recurring trend (Ward 1996).
Ward discussed four types of deterioration that she found and they seem to be common
trends in rock art studies to date. These deterioration types include the exfoliation of the
rock face, fading of the paintings, complete deterioration of the art and finally vandalism.
Meiklejohn et al. (2009) support the claims of Ward (1996) and go on to discuss how rock
art is being damaged by both natural and anthropogenic forces.

5
Figure 1.1: MARA survey tracks with known site locations, showing the extent of the unsurveyed region.

6
Photo 1.2: Image of Kinira Poort 3 showing the extent of paint removed to date. Photo: Dr Sam Challis 2010
Listing the forces of deterioration is relevant because similar trends have been documented
by Challis and displayed by Regensberg (2013). Although the records of the paintings span
about five years, the damage to the sites is still significant enough to be noticeable. In the
case of the rock art in the MARA survey area, it is been observed that this damage is mostly
due to anthropogenic forces such as vandalism and graffiti (James Pugin 2013 pers. obs.).
One key factor that affects the rock art which may not be termed as vandalism is the removal
of paint for the use in the preparation of traditional medicines and may represent one of the
last remaining links between current occupants of the land and their San ancestors
(Regensberg 2013; Dr Sam Challis 2013 pers. comm.). Limiting the effect of anthropogenic
forces relies on education about the rock art and its historical cultural importance. The
MARA survey has since used community involvement to promote a sense of ownership and
heritage management in an attempt to limit the damage to the rock art (Mokoena 2015).

7
Consideration of the threats to the rock art of the MARA survey region was the main
contributor towards the use of expedited methods of surveying.
Photo 1.3: Image of Phepela 1 showing extensive paint removal. Photo: MARA, Puseletso Lecheko 2014
1.4 Remote Sensing applications to rock art research
Testing the applicability of remote sensing methods in rock art surveying, if successful, will
provide a method for identifying areas that are most likely for rock art to occur. Remote
sensing provides the researcher with accurate tools to determine areas of interest. Current
research methods lack this aspect and would benefit from such an approach.
This research, if successful or not, is necessary because it will determine whether remote
sensing techniques are a viable method for locating rock art sites. The success of the model
will either encourage further research into the applications of remote sensing to rock art

8
surveys or guide further research in a different direction. A model that incorporates geology,
terrain modelling, with all other aspects that are relevant to rock art survey should contribute
to the improvement of archaeology and rock art surveying techniques.
Previous studies have revealed that GIS (Geographic Information Systems) and RS
(Remote Sensing) are applicable tools for rock art research (Russell 2012: 37; Pugin 2012).
The research method employed by Pugin (2012) involved an analysis of aerial photographs
and utilised Google Earth in an attempt to visually identify possible sandstone rock feature
locations (i.e. shelters, boulders, and cliff faces/kranslines) in the hope that these features
may contain rock art sites (Pugin 2012: 19). The advantage of this method is the ability to
remotely locate rock features of relevance for rock art sites on a larger scale than previous
methods like Google Earth. Pugin (2012), however, barely scratched the surface of a
complex process. The limitation of the technique used in the 2012 method was the lack of
capacity to use three-dimensional images to locate these rock features. The two-
dimensional aerial photographs and Google Earth imagery lacked the vertical
depth/dimension that are seen in a three-dimensional representation. The problem with
trying to identify rock features on a two-dimensional image is that some features appear flat
when they are in fact three-dimensional (Pugin 2012: 12).
At the very least, previous research (Pugin 2012) revealed the potential for a basic remote
sensing process to be used for rock art surveys. The use of Google Earth imagery and aerial
photographs showed that areas of interest for rock shelters could be identified remotely.
Although it was stated that satellite imagery was not used owing to its cost and lack of
resolution, with the availability of new satellite imagery it has become feasible to test
whether remote sensing procedures can aid in locating rock art shelters.
There is a need for a method or model that can identify areas likely to contain sites, thereby
reducing the time spent surveying unlikely areas. Remote sensing was seen as a possible
method that could assist with discovering the rock art of the Alfred Nzo district quickly. The
remote sensing approach accounts for different landscape conditions and then provides an
output map showing the areas that have the potential for containing rock art. This thesis set
out to test the effectiveness of remote sensing-based surveys by identifying the sandstone
rock features that are likely to contain rock art. It does not ‘find’ rock art sites by itself, rather
it puts the researcher in areas more likely to contain rock art.

9
The remote sensing method incorporates vegetation analysis and DEM (Digital Elevation
Model) by-products such as relief shading analysis, slope and aspect to derive a predictive
model for locating rock art sites.
The use of specific remote sensing methods aids in identifying site-specific attributes and
allow for future identifications of such features. Remote sensing will aid in identifying the
features that are synonymous with rock shelters and related features that are known to
contain rock art sites. Therefore, as long as these diagnostic features are replicated
elsewhere in the world this method is effective at locating rock shelters not just in the
Matatiele Drakensberg, or the Maloti-Drakensberg in general but, conceivably in any similar
setting. A secondary application of this method is to check whether other known site
locations correspond to the features identified. Finally, the method can also be used to
check supposed areas that have been extensively surveyed to see if there were any sites
that were not found in the areas of most potential.
1.5 Aims and Objectives
It is important to note that this research, as much as trying to locate the rock art of the
Maloti-Drakensberg, is in actual fact aimed at identifying the likely environmental
conditions where these sites occur. Potential site locations are rock features such as rock
shelters, overhangs, boulders, and cliff faces/kranslines. The model is judged on its
effectiveness at locating these geomorphological features not the presence of rock art. The
placement of rock images is a human choice and this exercise does not attempt to model
for the human agency. Therefore, any viable surface that is considered a potential site will
be recorded as well as any rock art sites encountered.
The remote sensing method analyses NDVI (Normal ized Vegetation Difference Index),
geology, shaded relief, slope and aspect as well as other applicable procedures. The
combined effect of these processes tests the effectiveness of remote sensing based
surveys by identifying the sandstone rock features that are most likely to contain the
locations that house the rock art. These processes look to emphasise and reinforce an
aspect already known to many rock art researchers, which is that rock art occurs in
mountainous regions that have outcropping sandstone or other rock faces that provide
shelter, with a suitable canvas for rock art.

10
Remote sensing identifies such outcrops and puts researchers in survey areas with the
greatest potential. The objective of the research was to test whether the application of
spectral and three-dimensional remote sensing methods could enhance the identification of
areas that may contain rock art and then identify the likely locations for rock art sites to
occur within these areas. This research tests whether remote sensing is applicable in
identifying features of relevance for rock art site locations: that is, the shelters and boulders
themselves. Remote sensing methods were applied in conjunction with field surveys and
was utilised in two areas to test their effectiveness and tested against a computer database
for another area.
A breakdown of the remote sensing based processes that were applied includes a number
of techniques that identify specific features of the landscape that are to be associated with
the presence of rock art, namely analysing NDVI, slope, shaded relief and lastly aspect
against the known site locations of the MARA database (Table 9.2: 144).
Some processes did not produce the desired result and were therefore discarded.
Furthermore, this research assesses the credibility of the different environmental
characteristics and determines which of these has the biggest impact on the location of
areas that contain rock art (i.e. boulders, shelters, overhangs, cliffs).
There are numerous methods of modelling that are considered and these are discussed in
the latter sections of this research (3.2.2.6: 44). Modelling for rock art is different to other
predictive models due to the nature of where rock art sites are found. Most predictive models
are reliant on replicating specific conditions of known site characteristics that vary from site
to site whereas, in the case of a rock art specific model, these sites are found in somewhat
more consistent locations. These sites are specifically found in sandstone formations
because of the nature of features found within these geological formations, however, the
other characteristics are more varied.
1.6 Chapter Breakdown
Chapter 1 outlines the motivation and importance of this research. The objectives,
limitations and rationale are described in regards to how this research can benefit rock art
research and assist in more rapid discovery of previously unrecorded heritage sites.

11
The justification as to why the research is necessary for this area is explained further (1.3:
4). By assessing the history of the MARA and SNP research areas. Assessing the history
of the Alfred Nzo and Joe Gqabi districts, it is possible to understand why this research area
was neglected for large parts of the 20th century. The chapter also focuses on Sehlabathebe
by providing a brief outline of the area in terms of archaeology, vegetation, geology, and
history.
By assessing the available literature in Chapter 3: 29, methods that have been applied
successfully in other research areas are discussed with relevance to how this research can
be applied effectively. The methods discussed here provide the groundwork on how to set
out the remote sensing components for the modelling procedure to be effective.
The application of remote sensing methods discussed in Chapter 3 is further developed in
Chapter 4: 60 with regard to how they will be implemented and what these methods
contribute towards creating a predictive model. This chapter sets out to explain this research
so that it can be replicated in future.
The results of the different processes and the predictive model, Chapter 5: 79, look at the
overall success of the predictive model and then focus in on the individual remote sensing
outputs compared to the different test areas. This dataset is then expanded to include the
newly discovered sites and the thresholds determined from the collective MARA database
will be used to model the areas of likelihood within Sehlabathebe National Park.
A discussion in Chapter 6: 107 reviews the model’s success and discusses how it can be
improved with relevance to how the results were calculated, how they may contribute
towards future modelling parameters and, whilst noting limitations experienced throughout
the research, how these were overcome. The discussion focuses on key archaeological
topics such as environmental determinism, seasonal site usage and site preference.
Finally, Chapter 7: 119 draws conclusions about how the model performed in regard to its
results, how it may be improved in the future, what implications it may have for rock art
research and whether or not it is an acceptable tool to complement or advise rock art survey.

12
Background and History of Matatiele and
Sehlabathebe
As the research takes place within South Africa and Lesotho, the background chapter will
first assess and describe the conditions of the landscape of South Africa and then turn its
focus to the Sehlabathebe National Park, Lesotho. While the predictive model used the data
from the Matatiele area to identify the thresholds of the different characteristics, it is
important to make the reader aware of how the landscape differs between the two research
areas. A further aspect to note is that the geological formations are the same for
Sehlabathebe as Matatiele, as well as a few of the vegetation groups. These similarities in
vegetation and geology should improve the success of a model based on environmental
features.
2.1 Research Area
This thesis is concerned with the un-surveyed areas of the former Transkei Maloti-
Drakensberg Mountains of the Eastern Cape3 (Displayed previously in Figure 1.1: 5). The
Drakensberg Mountains have been surveyed piecemeal, with certain areas receiving more
research attention than others. This region (or parts of it) have at times been referred to as
Nomansland, East Griqualand, and from 1976 to 1994, the Transkei. The area is now
referred to as the Eastern Cape Province, and subdivisions are known as districts. The
region encompassing the Alfred Nzo and Joe Gqabi districts cover most of the mountainous
geology that contains rock shelters in this academically neglected region (Challis 2008:
305). Challis (2008) identified the region between Qacha’s Nek and the town of Mount
Fletcher because it had not been systematically surveyed and was in an area that possibly
had a high rock art density. It is here that the MARA programme has set up its parameters
for survey (MARA 2011). Because of the large size of this research area identified by Challis
(2008), the area from Qacha’s Nek towards Ongeluks Nek was identified as a more suitable
target survey sample area.
The MARA survey was started in 2011 to redress the history of the misunderstood former
‘Transkei’ and to document the archaeology of the region (Challis 2011). The aim of the
MARA survey is to locate as much archaeology as possible (especially rock art because it
is exposed) which will enable it to be conserved and understood. Since the MARA survey
3 Also known as the Ukhahlamba Drakensberg in Kwa-Zulu Natal (Wright & Mazel 2007, 2012)

13
has limited time to achieve its aims, the methods of this dissertation will assist in achieving
this goal.
Subsequent to the commencement of the systematic survey, the MARA survey had
surveyed a substantial portion of its research area in an attempt to document the
archaeology of the region. To date, track logs show that surveyors have covered at least
500 km4. However, despite the MARA successes, a large amount of surveying is still
required between the Qacha’s Nek border post and Mount Fletcher in order to establish the
presence of other sites. Figure 9.1: 153 shows the research area set out by the MARA
survey and displays the sites that have been located and the current extent of the MARA
survey tracks.
4 This is the total distance of the survey tracks combined.

14
Figure 2.1: Locating map of both research areas.

15
2.2 Climatic Conditions
The Maloti-Drakensberg mountain range has the largest influence on the climate of Lesotho,
south Natal and the north Eastern Cape and acts as a climatic divide, which splits the east
and west of Southern Africa.
Roe (2005: 646) describes the effect a mountain range can have on rainfall in the mid-
latitudes as follows “The classic picture of orographic rainfall is of a mountain range in the
mid-latitudes whose axis lies perpendicular to the prevailing wind direction. In the
climatological average, the windward flank of the mountain range receives much more
precipitation than the leeward flank, resulting in the well-known rain shadow that is reflected
in sharp transitions in climate, flora, and fauna across the divide.”
The Maloti-Drakensberg acts as a drainage divide, which causes areas on the leeward side
of the mountains (Lesotho above the escarpment) to fall into the rain shadow, and the
windward side (Eastern Cape below the escarpment) to receive more rainfall. The
precipitation is due to relief/orographic rainfall (Roe 2005), whereby warm moist air is forced
up the leeward side of the mountain by the prevailing wind and the air column is cooled,
which in turn results in condensation and precipitation (Tyson et al. 1976; Smith et al. 2003;
Tyson & Preston-Whyte 2004; Roe 2005: 656). An additional feature that contributes to the
difference in temperature is the difference in altitude between the coastal regions and the
Highveld interior.
The Maloti-Drakensberg mountains are unsurprisingly identified as having a mountain
climate, i.e. having lower temperatures than surrounding areas of lower altitude (Van Zyl
2003: 50). The area is synonymous with winter, and occasional summer, snowfall at higher
altitudes. The region relies on heavy thunderstorms for the summer rainfall (Van Zyl 2003).
The major determinant affecting the climate and weather of the Drakensberg region is the
effect of altitude which impacts directly on the temperature and rainfall patterns. Rainfall
generally occurs in two forms; deluges and drizzle (Irwin et al. 1980: 49). The weather can
be unpredictable in the summer months as conditions can worsen in a short period of time.
Winter conditions in the Maloti-Drakensberg are generally dry and have predominant
westerly winds that can exceed 60kmph. The area benefits from a high-pressure system
when there are clear skies. However, the appearance of Cirrus clouds is a good indicator
for inclement weather which is associated with frontal systems moving across southern

16
Africa. The poor weather conditions are often associated with precipitation and snow fall
which occurs between 6 and 12 times a year (Irwin et al. 1980: 49) although farmers in the
Matatiele district also rely on the infrequent snowfalls to water the soil for crops.
The topological difference between the two areas of Matatiele and Qacha’s Nek is as
follows: Qacha’s Nek is situated on a pass of the Maloti-Drakensberg at an altitude of
1950m. This is compared to the town of Matatiele which is situated below the escarpment
at an altitude of approximately 1460m above sea level. Van Zyl (2003) shows how areas at
higher altitudes have lower temperatures than surrounding areas at lower altitudes. This
trend can be identified by consideration of the temperature data for the region of Matatiele
and comparing the towns of Qacha’s Nek and Matatiele (Tyson et al. 1976: 35).
The temperature and precipitation for both Matatiele and Qacha’s Nek are described by
Tyson et al. (1976). The towns of Qacha’s Nek and Matatiele are separated by 27 kilometres
yet differentiated by 500 metres in altitude and show a difference in rainfall of 242 mm. The
two areas have been portrayed in graphs where similar trends are depicted (Tyson et al.
1976: 35). The daily average temperature at Qacha’s Nek for summer is 18⁰C and
decreases to 10⁰C in the winter months, whereas Matatiele has a daily average temperature
of 22⁰C in summer and 12⁰C in winter (Tyson et al. 1976: 35). The two areas have similar
climatic conditions because of their proximity. The main observable differences are that can
be seen is the Qacha’s Nek weather station is situated on the escarpment, which shows
lower temperature averages and increased annual rainfall.
Although Van Zyl (2003) describes the effect that altitude has on temperature, there is a
similar effect with regard to the precipitation. The Qacha’s Nek area receives a higher
amount of annual rainfall (928mm) and has a higher number of days with precipitation (97
days). The Matatiele area, however, receives a lower yearly total (686 mm) of rain and has
fewer days of precipitation (78 days). By comparing the monthly rainfall, the Qacha’s Nek
area receives more rainfall in the summer months (928mm compared with 686mm) (Tyson
et al. 1976: 54). Therefore, the higher area of Qacha’s Nek receives more rainfall compared
to Matatiele due to orographic rainfall. However, the Lesotho District of Qacha’s Nek,
immediately behind the escarpment and encompassing Sehlabathebe, falls within the
Drakensberg rain shadow.

17
Both areas receive annual snowfall but the records are limited to newspaper articles. The
Maloti-Drakensberg has on average 8 days with snow (Tyson et al. 1976: 60). Resident
Ntate Puseletso Lecheko has reported that there has been at least one snowfall in recent
years about 1m deep in the Machekong village at an altitude of 1630m above sea level
(Puseletso Lecheko pers. comm. 2012).
2.3 Geological Formations
The geology of the Matatiele and the Maloti-Drakensberg falls into what is commonly known
as the Karoo System/Supergroup, which covers much of Lesotho and the surrounding
areas. As mentioned earlier, much of the geology of the two research areas are identical.
The Stormberg series exists as a component of the Karoo system and is comprised of the
following geological groups Clarens (Cave) Sandstone Formation, the Molteno or Red Beds
Formation and Elliot Formation (Hamilton & Cooke 1960; Visser 1989; Johnson et al. 2006).
The layers are listed based on the order in which they appear from the areas of higher
altitude to the lower altitudes. This geological sequence is capped with the extensive
Drakensberg Basalt sheets (Haughton 1969). The Cave sandstone band of the Lower
Jurassic period has been eroded into numerous rock shelters which provided the ideal
canvas for rock paintings (Du Toit 1966). The layer that is of most interest with regard to
rock art and archaeological research is the Clarens Formation or Cave sandstone band.
2.3.1 Drakensberg Basalt Formation
The Drakensberg Basalt Formation covers most Lesotho and the surrounding highland
areas (Haughton 1969: 154) and was formed approximately ±187 MYA, during the Early
Jurassic (Visser 1989: 155). The Drakensberg Basaltic Formation was formed by stacked
lava flows, fissure eruptions, and volcanic lava that comprise the upper part of the Maloti-
Drakensberg escarpment. This layer is also known as the Drakensberg Volcanic stage
(Visser 1989: 154). This upper portion forms the border between Lesotho, the South African
provinces of the Eastern Cape and KwaZulu-Natal. This layer is dark grey to black and once
weathered appears brown to purple (Haughton 1969: 154). The basalt caps the Sandstone
in many places and erodes slowly, which prevents the breakdown of the sandstone layers
below (Hamilton & Cooke 1960: 368). Shelters containing rock art have been found in

18
basaltic formations but only within Lesotho, around the Mokhotlong area (Pinto 2014). So
far no such shelters have been seen in the basalt on the escarpment and, therefore, this
geology was excluded from the model.
2.3.2 Clarens Sandstone Formation or Cave Sandstone Stage
The Clarens Formation was formed predominantly by fine-grained Aeolian sand during the
Late Triassic/Early Jurassic (Visser 1989: 153; Johnson et al. 2006: 482). This layer is
uniform and consists of white, cream or pinkish coloured sandstones (Visser 1989: 154). In
parts, basalt is incorporated into the layers because of the increase in volcanic activity
during its creation (Hamilton & Cooke 1960: 368). The Clarens Sandstone layer was initially
referred to as the cave sandstone stage and is known for the weathered overhangs and
caves, which are known to contain San rock art (Hamilton & Cooke 1960: 265).
The rock overhangs of the Clarens sandstone Formation of the Maloti-Drakensberg were
once inhabited by the San, in a similar fashion to the way in which the current Basotho herd
boys use the shelters today (Vinnicombe 1976: 2). The majority of paintings occur in the
yellow sandstone of the Clarens/Cave sandstone Formation, with a few found on Clarens
Sandstone boulders or rocks (Irwin et al. 1980: 43).
2.3.3 Molteno Formation
The Late Triassic Molteno Formation encircles Lesotho and is comprised of medium to
coarse-grained sandstones and grey mudstones, shales and infrequent conglomerates
(Beukes 1969: 366; Visser 1989: 151). The sandstones and mudstones present in the
Molteno Formation may contain glittering quartz particles (Haughton 1969: 365). The layer
also contains sandy shale that weathers (Visser 1989: 151). This layer has some rock art
sites present.

19
2.3.4 Elliot Formation or Red Beds Stage
The Elliot Formation was formed during the Late Triassic and is comprised of mudrock and
fine to medium grained sandstones, red to purple shales. The Elliot is a further sandstone
Formation known for containing rock art sites. The felspathic sandstones exist in yellow or
white with red mudstones (Hamilton & Cooke 1960). The Elliot formation is typically caused
by flash flood depositions and the sandstones are due to the deposition of fine sheet sand
(Visser 1989: 152).
2.3.5 Burgersdorp Formation
The Burgersdorp Formation exists below the Molteno Formation in the geological strata but
as part of the Beaufort group. The formation exists mainly with sandstones occurring in red
and maroon, whilst interspersed with grey-white sandstones (Schlüter 2008: 140).
2.4 Vegetation of the research areas
In a similar manner to the geology, certain vegetation groups are present within both
research areas. The vegetation groups that are present will be discussed briefly to show the
similarities between the two research areas.
Owing to the diverse characteristics of the rock art sites encountered to date, vegetation
was seen as a possible indicator of where rock art sites may occur. Due to the relationship
that exists between NDVI and the rock art sites of the MARA database, it is important to list
the different vegetation types in the instance that there is a higher correlation to one such
vegetation subgroup. Vegetation is described in detail because of the correlation with the
NDVI. By defining the different vegetation groups within this study it is therefore possible to
determine correlations with these smaller vegetation units.
Cowling et al. (2004) note that there are extensive grasslands located throughout the Maloti-
Drakensberg Mountains. Both research areas fall into the broader grassland biome and
contain different subgroups of this biome (Mucina & Rutherford 2004). The vegetation units
included the following: Southern Drakensberg Highland Grassland, Drakensberg Foothill

20
Moist Grassland, Lesotho Highland Basalt Grassland, Lesotho Mires, Eastern Temperate
Freshwater Wetlands, Southern Mistbelt Forest, Mabela Sandy Grassland, East Griqualand
Grassland, Drakensberg Wetlands, and Drakensberg Afroalpine Heathland (Mucina &
Rutherford 2004).
The Matatiele region appears in the grassland biome. The vegetation units are the Southern
Drakensberg Highland Grassland and the Drakensberg Foothill Moist Grassland (Mucina &
Rutherford 2004: 366, 423).
The prominent grasses found within the subalpine belt are the Themeda triandra and the
Festuca species of grasses. The Themeda triandra occurs throughout the subalpine belt,
whereas, the Festuca appears in the upper portion of the belt (Killick 1963; Irwin et al. 1980:
77-80). The specific bioregions are described further by Mucina and Rutherford (2006).
2.5 Elevation Sub Regions
There are varying accounts as to the exact names of regions based on elevation. Three
regions have been identified by Bester (1998) namely: the Alpine belt (>2850m above sea
level), the Sub-alpine belt (1830-2850m above sea level) and the Montane belt (1280-
1850m above sea level).
Conversely, Irwin et al. (1980) describe the Montane regions as everything exceeding
2000m and classify areas below 2000m as highland to sub-montane. The sub-montane
region is recognised as having forest, sub-forest, grasslands with proteas and riverine
scrub, whilst the montane region has a variety of Drakensberg fynbos, and stunted forest
(Irwin et al. 1980: 47).
The shrub species listed by Bester (1998: 6) occurring in the sub-alpine belt includes:
Cliffortia linearifolia, Leucosidia sericea, Buddleja salviflora. However, the Montane grasses
include the: Themeda triandra, Hyparrhenia, Miscantidum-Cymbopogon.
The presence of two invasive Australian Wattle species (Acacia mearnsii and Acacia
dealbata) has been identified within the research area (de Neergaard et al. 2005). The
researchers were able to identify that these invasive Wattle species have grown in coverage
in two aerial photographs of Madlangala since 1953. It was identified that the Wattle

21
coverage increased in the two plots from 7% to 48% and 20% to 58% (de Neergaard et al.
2005: 216, 230).
A further study completed by Poona and Shezi (2010) assessed invasive alien plants across
KwaZulu-Natal. Poona and Shezi (2010) employed plant mapping methods using SPOT 5
multispectral imagery with both supervised and unsupervised classifications. This research
identified that using the Maximum Likelihood and Mahalanobis classification algorithms
were the most successful in identifying and delineating areas covered by these plants.
Identifying the coverage of Wattle species is relevant to rock art research as these species
have increased in coverage since the 20th century. Rock art sites can easily be concealed
by Wattle forests. These species are seen to flourish in areas where rock art exists (Pugin
2012: 21). Therefore, in many cases, it is pertinent to identify areas that have Wattle species
as areas that require surveying.
2.6 The History of the Area
Owing to the space constraints and focus of this project, a brief overview of the history of
the area is provided.
Hunter-gatherers have occupied the Maloti-Drakensberg for the last 100 000 years and are
known to be have been home to the San hunter-gatherers (Wright & Mazel 2007: 1).
Approximately 8 000 years ago, groups of hunter-gatherers started living in the Maloti-
Drakensberg Mountains for longer periods of time. These hunter-gatherers are believed to
be the ancestors of the San people (Wright & Mazel 2012: 6). An absence of hunter-gather
presence in the Drakensberg has been noted later than 25 000 years ago (Wright & Mazel
2007: 29, 2012).
Using this analysis (Wright & Mazel 2007: 25), the last glacial maximum provides a reason
for the absence of hunter-gatherers during the period between 25 000 to 10 000 years ago.
During the glacial maximum, temperatures are believed to have been 5⁰C colder than
current day temperatures. There is a presence of hunter-gatherers across Lesotho for this
time period in shelters such as Sehonghong cave, Lesotho (Wright & Mazel 2007: 25; Carter
et al. 1988; Mitchell 1996).

22
The San hunter-gatherers existed for millennia without interaction from outsiders until the
emergence of pastoralists and arrival of agriculturalist groups. The San are believed to have
had interactions with Khoekheon pastoralists around 300 AD in the southern and western
Cape (Schweitzer & Scott 1973: 547; Vinnicombe 1976: 9). In the last 1 000 years, the
emergence of African Iron Age farmers is noted (Vinnicombe 1976; Mazel 1989, 1993,
1997; Mitchell 1996: 22, 2002: 294). Early Iron Age farmers populated the shoreline and
hinterland of the south-eastern Cape in the firth millennium AD (Feely 1987) However, it is
noted that the arrival of the Iron Age farmers, most notably the Cape Nguni and Sotho in
the Matatiele regions of the Maloti-Drakensberg, occurred at approximately 1800 AD
(Huffman 1996: 55; Mitchell 2009: 18; Regensberg 2011: 4), after political instability and an
inability for crops such as millet and sorghum, to possibly grow in the area.
Wright and Mazel (2012) have noted that the San hunter-gatherers moved into the Thukela
basin for increased interactions with farming communities (Mazel 1996a cf; Mazel 1996b
cf). Around 700 years ago, groups of African farmers started settling at the base of the
foothills of the Maloti-Drakensberg (Wright & Mazel 2007: 23). Eventually, the farmers
encroached into the higher lying grasslands the San were forced to retreat further into the
mountains (Thorpe 1997; Wright & Mazel 2012: 27). By the 19th century, the San were
confined to the mountainous regions of the Maloti-Drakensberg.
During the mid-19th century, the European colonists started taking control of the area. White
farmers gradually hunted out most of the game that the San subsisted on, which in turn
forced the San communities to raid the farmers’ cattle. The San cattle raids continued as a
form of subsistence until the colonial powers declared all such activities illegal – essentially
reducing the San to the status of vermin. Upon this declaration, hunting parties were set up
to exterminate the San people residing in the Maloti-Drakensberg. San communities existed
until the close of the 19th century. By the 1890s, San communities, through expansion of
neighbouring groups, had ceased to exist. Many of the San were exterminated, however,
many were incorporated or absorbed into other cultural groups (Mitchell 1996: 22, 2009: 18-
9; Mazel 2007: 119; Challis 2008: 4; Mitchell et al. 2008: 5).

23
2.7 The Archaeology of the Matatiele Region
Until recently, the archaeology of the Matatiele area has not received sufficient research
attention. There have been few archaeological studies that were undertaken in the area
(Farnden 1966; Derricourt 1977; Feely 1987; Challis, 2008, 2009, 2012; Pugin 2012;
Regensberg 2012). Accounting for this research, there is still a substantial amount of
surveying required in the area to locate more undocumented rock art, and archaeological,
sites. Accounts by Vinnicombe (1976) and Derricourt (1977) provide details of some site
locations in the East Griqualand area. The site lists (tables. 2 & 3) of Derricourt (1977: 253-
258) include numerous sites that the MARA survey has been able to locate and record.
However, the survey will cover these areas timeously as the systematic survey continues.
Derricourt (1977) listed the sites that form part of his research area in the Transkei and
Ciskei of which he included 42 sites that are within the MARA survey area, the sites listed
are largely based on Van Riet Lowe’s (1956) archaeological survey. However, Derricourt’s
site list has six sites that were documented and Pigeon Rocks was the only site to have
been excavated (Derricourt 1977). The extent of the Derricourt sites (Figure 2.2: 24) shows
the likely distribution of rock art sites across the Matatiele area.
With this expansive area displaying potential for high site density, there is a definite need for
research. The presence of sites outside of areas described by Derricourt indicates a possible
high density for rock art to occur throughout the region (Derricourt 1976: 257-258).
The lack of documented sites shows the knowledge gap that prevails in the Matatiele region,
whereby sites are known to be in the vicinity of named farms instead of exact locations.
Subsequent to recent consultation with Derricourt, it was uncovered that he had limited
knowledge of the exact site locations for most of the sites listed in the Matatiele area. The
sites in the area of which he was aware, are based on locations provided by others.
Vinnicombe (1976) and Carter both have listed some site locations in the area of Matatiele
which are listed in the appendices (Table 9.3: 172)

24
Figure 2.2: Suspected site locations in the areas surrounding Matatiele (Derricourt 1976, see also van Riet Lowe
1956; Vinnicombe 1976)

25
2.8 Rock Art Research to date in the Matatiele Region
Rock art from the greater Matatiele area has been included sporadically in numerous
publications (Batiss 1948; Willcox 1956; 1963: 32-33; Malan 1955; Cook 1969; Vinnicombe
1976; Derricourt 1977), however, there was little research prior to the involvement of the
MARA survey. Patricia Vinnicombe visited a number of sites5 in the surrounds of Matatiele,
some of which are included in the People of the Eland (Vinnicombe 1976). Further research
was limited to Patricia Vinnicombe’s tracing of the New Amalfi Rock Shelter (Farnden 1966)
and the recordings of around 42 possible site locations (Table 9.3: 172) in the MARA survey
area, of which only the Pigeon Rocks site was excavated (Derricourt 1977: 257).
Subsequent to the MARA survey, there has been unpublished honours research completed
by Regensberg (2012) and Pugin (2012), and the MARA excavation results are forthcoming
(Pinto et al. in prep).
The MARA survey has completed two excavations in the Matatiele region where the first
excavation occurred at the Mafusing 1 shelter and the second excavation at Gladstone 1
shelter. The excavation at Mafusing was used to understand the social narrative of the rock
shelter (Regensberg 2012). The comparison of the rock art and the material culture from
the excavation of the Mafusing rock shelter contributed towards the construction of this
social narrative. Regensberg (2012) was able to relate the different stratigraphic layers to
different occupation periods where hunter-gatherers and farming communities had utilised
the rock shelter (Regensburg 2012: 49).
The second research component of the MARA survey was the completion of an honours
dissertation (Pugin 2012). Pugin (2012) employed the use of a Google Earth-based survey
to identify areas with possible rock art sites (Pugin 2012). The researcher focused on
identifying areas with exposed Clarens Sandstone features in Google Earth/Aerial
Photographs and then digitised these likely points for future surveys. These digitised points
were then surveyed to see if the method was effective at identifying possible rock art site
locations. One remit of this research was not to look for rock art, but rather to look for areas
that had site types that corresponded with known rock art sites such as rock shelters,
overhangs, kranslines and boulders. It must also be noted that the research was at no stage
5 Site list in appendix
26
looking for the rock art, instead looking to identify geomorphological features that had a
possibility of containing rock art.
The method proved successful because it identified areas where rock art sites existed,
however, in many cases there were points that didn’t contain any rock art sites (Pugin 2012).
The research identified areas with rock shelters, overhangs, kranslines and boulders that
could contain rock art sites in the vicinity to these digitised points. The method analysed
shaded areas in the imagery to see if there was a link to possible rock shelters. The method
proved successful in identifying areas of interest for containing possible rock art sites. This
was a success insofar as it was more concerned with locating likely features that resembled
rock art sites (i.e. rock shelters, boulder and kranslines). In the process these results allowed
for user-based discrimination of survey areas, thereby allowing the researcher to choose
areas based on potential and exclude improbable areas.
The method was effective in placing the researcher in the place within the field and provided
a reasonable chance of locating rock art. However, this research had its drawbacks, namely
the time-consuming nature of processing aerial photographs in order to identify areas that
could be of interest. Secondly, the inability to process multiple areas at a time slowed the
procedure down. A further drawback experienced was linked to the use of Google Earth
imagery, which in some cases areas appear as though they are flat when in fact these areas
are steep and had some large overhangs.
2.9 Brief History, Archaeology and Rock Art Research of Sehlabathebe
Owing to the space constraints and focus of this project, a brief overview of the history of
the area and archaeology is given. Importantly, the recent UNESCO survey conducted by
members of the MARA team has added significantly to the data for the Sehlabathebe
National Park (Challis et al. 2015)

27
2.9.1 Archaeological research
Archaeological research throughout Lesotho was limited prior to gaining independence in
1996 (Mitchell 1992: 3-34). Prior to this research was limited to Carter (1969, 1978; Carter
et al. 1988), Vinnicombe (1976), Smits (1983), Mitchell (1995, 1996, Mitchell & Plug 2008),
and Arthur (cf Mitchell 2009).
Research that has been undertaken in the vicinity to the Sehlabathebe includes Carters’
excavation of Ha Moshebi and Ha Soloja, and the initial survey of Sehlabathebe National
park by Lucas Smits in the late 1970s and early 1980s (Smits 1983). The ARAL (Analysis of
Rock Art in Lesotho Project) record compiled by Smits consisted of field notes and
photographs which are curated by the Rock Art Research Institute at the University of the
Witwatersrand.
2.9.1.1 UNESCO World Heritage Survey 2015
Subsequent to the inclusion of Sehlabathebe National Park into the Ukhahlamba
Drakensberg World Heritage Site, a baseline survey of the park was required as a record
of the archaeological sites within the park was limited to a few none sites. This UNESCO
World Heritage survey of Sehlabathebe National Park, Qacha’s Nek, Lesotho was
undertaken and performed by a team of trained field technicians with the assistance of the
MARA/RARI team of researchers.
Owing the transformation process that the MARA project has in place, the majority of the
team are field technicians with professional experience in either Lesotho or South Africa.
The field survey was directed by BoNtate Rethabile Mokhachane and Puseletso Lecheko.
This team of researchers surveyed the park in three months with the assistance of the
MARA/RARI researchers.

28
Photo 2.1: James Pugin recording of site E01, Sehlabathebe National Park. Photo: Dr Sam Challis 2015
The UNESCO survey of Sehlabathebe was the first baseline survey of the national park and
aimed to locate and record the rock art and archaeology of the national park. The ARAL
survey during the late 1970’s located 85 rock art sites, however, the UNESCO survey
located a further 20 rock art sites and numerous other archaeological sites within the park.
2.9.2 History of Sehlabathebe
Records of a San presence, in or around the Sehlabathebe National Park, first come
encountered around 1850 AD. Although there are records’ supporting the presence of the
San throughout the parts of Lesotho for the past 8 000 years is discussed previously by
Wright and Mazel (2012: 6). Owing to increased livestock numbers in areas that the San
relied upon for hunting, game numbers diminished correspondingly. As a result, the hunter
gatherer lifestyle was compromised by 200 years of colonial expansion and 1 500 years of
contact with Nguni speakers. This forced the San to depend on stock theft to survive (Wright
1971; Challis 2012; Challis et al. 2015).

29
Literature review
The need for advanced methods of survey in rock art can perhaps only be comprehended
after one has seen the effort and difficulty associated with such surveys. Finding rock art
and archaeological sites in the mountains of Southern Africa can be a costly and time-
consuming exercise. Numerous rock art researchers have painstakingly surveyed the
Maloti-Drakensberg Mountains by foot to some avail. However, locating rock art is
especially reliant on good survey planning, knowledge of the research area and
understanding the types of features where the rock art is usually painted, and most
importantly the existence of rock art within a possible site. One problem associated with
rock art surveying is the very few published accounts of survey methodology (Mazel 1983;
Challis & Laue 2003). In an attempt to rectify this lack of survey methodology, this research
expands on the path set out by Pugin (2012) and incorporate further remote sensing
techniques to best assist in surveying for rock art sites. Therefore, any advances made in
remote sensing that can be made applicable to rock art surveying is beneficial.
3.1 Rock Art Surveying
Assessing the available rock art survey literature provides little evidence for how to actually
locate rock art sites. The few examples that discuss the actual methodology of rock art
research predominantly discuss the recording process that ensues after locating a rock art
site (e.g. Loendorf 2001; Whitley 2005; Sharpe & Barnett 2008). The lack of published
methodology on how to locate rock art sites is problematic, not because researchers have
limited knowledge on how to locate rock art sites, but rather because only two accounts of
distinct methods have been published (Mazel 1983; Challis & Laue 2003).
Research by Mazel (1984: 349) is the first published example that includes a portion on
termed ‘rock art searching strategy’. In this short paragraph, the method of survey and the
way it was implemented was discussed during the survey undertaken in the Royal Natal
National Park and surrounding areas. Mazel discussed two different methods that were
implemented depending on the features that he was surveying. Simply put, Mazel (1984)
surveyed the areas most likely to contain rock art by walking along the valleys that had
exposed sandstone outcrops.

30
With the intention of checking the area’s most likely to contain rock art (e.g. valleys with
exposed sandstone outcrops) Mazel (1984) was able to survey the area effectively. Mazel
(1984) accounts for the occurrence of rock shelters that are likely to contain rock art in
various sandstone bands, namely Clarens, Molteno, Elliot and Upper Tarkastad. According
to (Mazel 1984: 348) there was no record of rock art sites occurring in the Drakensberg
Basalt Formation, however, prior to this Vinnicombe (1976: Map 5, 2009: 357) located a site
‘X1’ within the Drakensberg Basalt Formation (Pinto 2014: 5, 6, 37, 113).
Rock art research requires a standardised method of survey that can be used to survey
areas for rock art. Although there is methodology associated with rock art surveying it is
rarely discussed or published. In an attempt to rectify this methodological void, a method
that incorporated aerial photographs, Google Earth imagery, survey planning and survey
tactics was instituted as part of the MARA survey (Pugin 2012). The survey used aerial
photographs and google earth to determine the likely locations of exposed sandstone
outcrops (Pugin 2012). The next stage was to digitise areas that indicated that they may
contain shelters or overhangs. After digitising these locations, they are surveyed along with
any adjacent areas that looked promising. The survey method used was the uncontrolled
exclusive survey (White & King 2007: 85). The aim of this survey was to exclude the areas
that did not contain any sandstone, whilst providing the surveyor with the freedom to deviate
from the course if there was a likely rock art site that was not located within the original
survey location.
The research was successful in identifying areas that looked promising to contain rock art
by identifying areas with outcropping sandstone. The research was successful because it
was able to place the researcher in areas that contained rock art. Through the application
of these techniques, the MARA survey was able to utilise this methodology to locate other
undiscovered rock art sites.
Research has shown that GIS and remote sensing can be applicable to archaeology
(Parcak 2009; Lasaponara & Masini 2011) and to rock art (Pugin 2012; Russell 2012), and
this was seen as an ideal opportunity to incorporate techniques and processes into this
survey methodology.
A secondary aspect to consider when assessing rock art surveying is the need for an
understanding of how sites were selected in the past because it provides an insight into

31
what a researcher is required to look for in the field. The section on site selection is valuable
as a guideline to make researchers aware of the likely features that could have been painted
on and to be able to identify any likely site locations.
3.1.1 Hunter Gatherer Rock Art Site Selection
It is important to consider that rock art sites were possibly chosen based on characteristics
that are largely unknown to researchers today. Therefore, any environmental proxies could
assist researchers identifying a trend. Insights into these environmental proxies, are
discussed in depth for sites distributed across Southern Africa (Mazel 1984: 67-75) and are
compared to the distribution of sites for the Matatiele region. This breakdown of sites is
valuable for consideration when assigning values to the different factors that affect a
predictive model.
The evaluation of rock art site conditions (altitude, aspect, geology, distance to water, etc.)
was completed as part of the Analysis Rock Art Lesotho (ARAL) research (Smits 1983). The
ARAL survey included the Sehlabathebe National Park, which is the second area that this
method is applied to (Figure 3.1: 33). The publication has listed breakdowns of the sites
against different characteristics.
A valuable aspect included in Smits’ (1983) ARAL survey of Lesotho is the presence of a
breakdown of sites against different feature types, geological formations, and aspect. This
breakdown of sites showed how site distribution can differ in alternate areas across Lesotho
and provided an insight into possible site distribution types and trends.
The inclusion of the different factors affecting the distribution of sites for the multiple areas
across Lesotho and South Africa is a valuable aspect to take into consideration when
assigning values to different components that will be used to assign weights to a model. It
is useful to use existing data from previous surveys. However, as this type of data is seldom
available, the availability of the ARAL data for predictive models is an advantage.
It is of interest to note how the differences in landscape and site conditions affect the
distribution and density of sites within a specific area. Site distributions that are of interest
are listed below, and discussed to show their relevance and how these distributions were
taken into consideration in regards to how they affect or impact on future models weighting.

32
The different factors are discussed as listed in Smits (1983). It is of interest to test other
areas that are not expected to contain rock art such as Polihali (Mokhotlong) in Lesotho
(Pinto 2014).
The first aspect discussed takes into consideration the changes and variations within the
different areas, and how the rock art sites are distributed amongst different geological
formations. The second aspect taken into consideration is site exposure and how this varies
across the different research areas listed. The final characteristics discussed by Smuts
(1983) are site type, which shows the distribution of sites per site type for the different
research areas and finally, how aspect varies across the multiple research areas.
These distributions show how sites are not necessarily dependent on geology as can be
seen in Table 3.1: 32. Phutiatsana is an area where sites are located within all the geological
formations including the basalt, whereas Sebapala and Sehlabathebe contain sites located
within only the Clarens and Elliot formations. The results listed by Smits (1983: 68-69) are
misleading because the presence of sandstone lenses within the basalt refer to sites that
are located within the basalt Formation where in fact these sites could be painted on
sandstone.
Table 3.1: Geological breakdown for sites located by ARAL (Smits 1983: 68-69) 6
Geology Phuthiatsana Qhoqhoane Sebapala Sehlabathebe
Basalt* 28(11%) 0 0 0
Clarens 190(73%) 21(22%) 33(44%) 53(82%)
Elliot 12(5%) 18(19%) 42(56%) 12(18%)
Molteno 28(11%) 47(50%) 0 0
Burgersdorp 1(%) 8(9%) 0 0
Exposure is one characteristic that does not seem to vary as much as aspect or geology.
As listed the Table 3.2: 33, displays the majority of sites that occur within overhangs with a
few outliers occurring in caves and even less that are exposed.
6 Smits discusses sandstone lenses within the Lesotho Basalt formation. There are however sites located within the basalt around the Mokhotlong region of Lesotho as evidenced in Vinnicombe’s X1 site (Vinnicombe 1976: Map 5, 2009: 357) and Pinto’s survey of the Polihali Dam Survey (Pinto 2013)

33
Figure 3.1: Image taken from Smits (1983: 62) depicting the ARAL survey areas. Research areas include
Phutiatsana (top), Qhoqhoane (left), Sebapala (bottom), Sehlabathebe (right).
Table 3.2: Exposure for sites located by ARAL (Smits 1983: 69)
Exposure Phuthiatsana Qhoqhoane Sebapala Sehlabathebe
Exposed 4% 2% 3% 0%
Overhang 93% 97% 88% 97%
Cave 3% 1% 9% 3%
Location is a characteristic that does fluctuate between the different areas. As Smits (1983)
has shown that certain areas have features that are more popular and likely to contain rock
art than others. The distribution of sites across the range of features might be an indication
of the broader landscape of the area but this is a more accurate display of the feature
preferences per research area.

34
Table 3.3: Location/Feature types for sites located by ARAL (Smits 1983: 70)
Location Phuthiatsana Qhoqhoane Sebapala Sehlabathebe
Boulder 11% 21% 4% 5%
Outcrop 42% 55% 41% 71%
Cliff 47% 23% 55% 25%
Aspect is one of the most varied components and this is due to the varied environments
across Lesotho. The majority of sites from Lesotho occur in a range of aspects whereas the
aspects of sites within South Africa occur in a more varied range of aspects from North West
to East, with fewer occurring elsewhere.
The variations in aspect could suggest multiple possibilities from seasonal site usage (I.e.
North facing sites used in winter due to greater heat within these shelters, whereas south
facing sites in summer due to cooler temperatures), variations in drainage patterns, the
availability of sites in a specific direction, preferences for painted sites to occupational sites.
All these are possibilities that could affect distribution of rock art sites.
Table 3.4: Aspects of Sites located by ARAL (Smits 1983: 70)
Aspect
Phuthi
atsana
Qhoqh
oane
Seba
pala
Sehlab
athebe
Ndedem
a Gorge
Giants
Castle
Barkley
East
Olifants
River
Valley
N 18 11 27 11 17 42 11 16
NE 14 7 12 26 24 15 18 13
E 17 13 9 28 21 29 34 21
SE 15 12 7 6 5 7 0 9
S 9 26 15 6 0 0 0 15
SW 6 14 9 14 0 2 3 7
W 9 15 11 2 7 4 8 14
NW 13 3 11 8 26 21 26 5
The ARAL research comprised a list of data that is shown in Table 3.4: 34 that displays the
differences in distribution compared to the ARAL study areas within Lesotho and others
mentioned within the Maloti-Drakensberg.

35
Many of these proxies are identified as possible indicators for this research. Whilst
considering the differences in environments there are many similarities (Refer to Predictive
Modelling) in conditions such as geology and geomorphological features. However, aspect
and exposure would differ firstly due to the position of the areas and secondly, the nature
of the drainage system that affects the Matatiele area as opposed to elsewhere in the Maloti-
Drakensberg.
However, this research (Smits 1983: 70) concluded that the physical site
characteristics/location had little effect on site choice and distribution but rather the most
crucial aspect affecting the presence of a rock art site was the availability of a suitable rock
surface to paint. This is an important point to consider in regard to this research because
the objective of this research is to locate areas with suitable rock faces to facilitate rock art.
These areas occur at the juncture of sandstone outcrops and specific geomorphological
process that form these sites.
Although the ARAL team’s research (Smits 1983) does not include any relevant survey
methodology, it does uncover some valuable factors that affect rock art site selection. These
aspects could enable researchers to focus on identifying the most likely aspects of San
hunter gatherer site choice. Although hunter gatherer site selection is a delicate topic of
discussion, in many cases rock art sites can be identified by the availability of a
shelter/overhang and the presence of a rock face. Understanding the exact attributes or
characteristics of a site may never be fully known to researchers but the requirement for
shelter and rock face provide researchers with an important starting point to identify further
locations (Smits 1983; Mazel 1984).
Although there are few cases of rock art occurring within the basalt, these cases are few
and far between (Vinnicombe 1976; Smits 1983, Mazel 1984). Subsequent to the Polihali
Dam survey (Pinto 2014) discovered numerous sites within the basalt. With the discovery
of rock art within the basalt formation, there could be rock art present in areas that were
once neglected due to geological formation.
These findings could indicate that in the case where no suitable shelters exist, the basalt
may be used as a substitute. That is to say, the necessity to paint prevailed over the choice
of substrate.
36
3.1.2 Rock Art and Environmental Determinism
Considering methods that are dependent on site-specific characteristics requires an
understanding of the limitations of taking an environmentally deterministic approach. This
research may be seen as environmentally deterministic because it employs
geomorphological proxies and vegetation data in an attempt to locate rock art sites.
However, the only proxies that are known to researchers are based on physical
environmental characteristics. An experienced researcher’s view may and often does
contain an environmental consideration because many of these sites may not have been
selected based on geomorphological proxies but the presence of the rock art sites is
dependent on the presence of specific geomorphological features. In fact, there are
problems in trying to predict human choices and behaviour. However, identifying sites in
using an environmental consideration is less problematic because the locations of painted
rock art sites seem to be in similar features (shelters, overhangs, cliff faces). The
parameters that can be identified, however, are largely environmental (specific features
include geology, aspect, landscape features, surrounding vegetation, nearby water sources
etc.). Other than these physical features, rock art sites were chosen with parameters that
are largely unknown to us (Ouzman 2001: 252). “In Smits opinion (1983: 63), the best
indication was a suitable surface on which to paint. This, of course means that rock art
occurs in rock shelters and this, we knew. Whether that shelter contains a suitable canvas
one can only discover by visiting the site, which necessitates systematic survey. Since we
must do this anyway the criteria are not so useful. Ouzman observes that beyond the
parameters of physical geography (rock shelter), the reasons for site choice are largely
unknown.”
3.1.3 Other Applicable Biases
Most predictive model based surveys will create a field survey bias that will prioritise areas
that correspond with known site based thresholds. This bias will enable the surveys to be
expedient and make best use of time and resources, whilst locating as many sites as
possible. In a method that looks to be expedient, there will be areas that are discarded at
the time of the initial survey, however, they are not excluded from future research. Although
researchers have funding grants and research time frames, applying biases that will
encourage the locating of archaeological sites in an expedient manner will maximise the
time and funding of the researcher and increase future funding opportunities owing to the

37
discoveries made. Survey methodology has an inherent problem with the statement “100 %
survey or fully extensive survey” namely because of the risk of missing any potential
archaeological evidence is high (Renfrew & Bahn 2004; White & King 2007).
3.2 Literature Supporting Methodology
3.2.1 Introduction
Geographic Information Systems (GIS) have been used effectively in archaeological
research for some time (Lock & Stancic 1995; Westcott & Brandon 2003; Parcak 2009). Yet
although the applications of GIS systems have been used extensively in archaeology
(Scollar et al. 1990; Lock & Stancic 1995; Conolly & Lake 2006; Wiseman & El-Baz 2007),
they have rarely been applied to rock art studies (Pugin 2012).
Remote sensing is seen as the best way to assist in locating areas of interest prior to
stepping into the field. The applications of remote sensing are vast and can be seen
throughout archaeological practice, however, in regards to rock art surveying these
techniques are limited to Pugin (2012).
Remote sensing techniques have been used to identify archaeological sites through the
successful application and incorporation of aspects such as Normalized vegetation
difference indices, DEM and related elevation derivatives (aspect, slope, shaded relief/hill
shading) and predictive modelling. Owing to theoretical and methodological shortfalls,
predictive models are known to be contentious in Europe and North America (van Leusen
2009). Van Leusen identified six areas of concern for predictive models that have
contributed to the possible shortcomings of predictive models. The concerns listed
include:
are the quality of the archaeological data acceptable and are there enough data
are the environmental data relevant
the need for more social and cultural data
limited use of temporal or spatial data
limited application of spatial statistics
failure to adequately test predictive models

38
By taking these shortfalls into account, predictive models are more likely to be successful.
Prior to any remote sensing processes, uncorrected digital imagery requires data
processing. This occurs in two forms, Radiometric and geometric corrections. Image
rectification and restoration is undertaken as part of the pre-processing of the data prior to
the data input and is used to correct errors that affect the quality of the imagery. However,
due to the hybrid nature of this research, the pre-processing (correcting for geometric
distortion and to correct for radiometry) was undertaken by SANSA prior to obtaining the
necessary data (Schowengerdt 2006).
The focus of this section is on introducing the theory and methods used successfully in
other remote sensing research. The theoretical base of the research is set out and then
followed by the methodological process in the next chapter. The methods are discussed
individually and then culminate in the combined model and the outcome of the different
components.
Selecting components to be used in a predictive model for predicting rock art is not an
easy task, however, the analysis of similar case studies and predictive models allows
researchers the opportunity to understand the types of factors or characteristics that may
influence site selection.
3.2.2 Case studies implementing similar techniques
Owing to the nature of this research, any processes (namely NDVI, slope, shaded relief,
classifications, and predictive models) that could be of relevance are assessed and thus,
any case studies of relevance are listed in the coming section. Therefore, identifying the
ways these methods have been put to use in other studies would give an indication of
whether a specific component would be effective or not. With the research looking to find
exposed sandstone outcrops in mountainous terrain, there are certain processes that
stood out from the rest, which included the use of NDVI, a DEM model (Kvamme 1992;
Masini & Lasaponara 2007; Parcak 2009; Vaughn & Crawford 2009; Manap et al. 2010).
Approaches such as predictive modelling were identified as a means of combining the
different processes and aid in predicting or suggesting, where rock art sites could occur
(Brandt et al. 1992; Kvamme 1992; Carleton et al. 2012). The processes that are
identified as being applicable are listed below along with those that were believed to be

39
of importance, but which did not contribute towards effectively identifying areas that
contained rock art sites.
3.2.2.1 Normalized Vegetation Difference Index
The NDVI normalizes green/fresh leaf scattering in the near-infrared wavelength and
chlorophyll absorption in the red bands, of multispectral imagery. The NDVI is seen as
one of the many ways of measuring vegetation abundance, vigour and health (Parcak
2009). An NDVI value greater than 0.4 will indicate an abundance of vegetation, whist
positive values greater than 0.1 would indicate senescing or sparse vegetation, whereas,
a negative value would indicate water, snow or ice and areas that are slightly higher than
0 represent soils and barren areas (Masini & Lasoponara 2012: 27). A lack of vegetation
can be seen when there is more absorption of the red band compared to the reflection of
the infrared band (Mather 2005: 142).
NDVI has been used extensively in archaeology to identify features that can have an
impact on vegetation growth such as buried walls (Winterbottom & Dawson 2005;
Aminzdeh & Samini 2006, Rowlands & Sarris 2006; Masini & Lasaponara 2006, 2007;
Taheri 2010). The successful use of NDVI to identify such features across Italy has been
a great success of Masini and Lasoponara (2006, 2007).
The NDVI is seen as a process that can contribute to identifying archaeological sites in
the current study area, since, as noted in field surveys, there are numerous sites that
occur in barren rocky outcrops. Different classes, such as densely vegetated areas,
sparsely vegetated areas as well other barren areas of greener grass can be identified
through the application of the NDVI (Campbell 2008; Lillesand et al. 2008).
Masini and Lasaponara (2007) effectively implemented NDVI to aid in locating sites in
Italy and are discussed as a successful case study. A further example of the use of NDVI
in predictive modelling is discussed as part of research that took place in Belize (Vaughn
& Crawford 2009).

40
3.2.2.1.1 Detection of archaeological crop marks by using satellite Quickbird multispectral
imagery
Research in the south of Italy on two different archaeological sites dating to the middle
ages was performed by Masini and Lasaponara (2007). The purpose was to determine if
differences in vegetation health could assist in the locating of buried archaeological sites.
The use of aerial photographs for the identification of buried archaeological remains has
been prominent for most of the 20th century. The modern approach implemented by
Masini and Lasaponara (2007) utilised Quickbird Multispectral imagery to aid in
identifying buried archaeological remains. Quickbird’s multispectral imagery offers a
much higher spatial resolution (2.44-2.88 m) compared to (for example) Landsat’s
Thematic Mapper (30 m). The research focused on the identification of vegetation
irregularities such as small areas of plant stress compared to surrounding areas that
could be affected by buried archaeological remains impacting on the health of the
vegetation. Through the application of NDVI to indicate areas of plant photosynthetic
activity, it was predicted that at this high resolution, crop marks are visible.
The approach, using very high resolution multispectral data, provided the researchers
with data that are unavailable if using aerial photography. The researchers identified that
NDVI allowed for the better identification of crop marks covered by healthy plants, and
secondly, that the near infrared channel was able to display areas with crop marks
covered by dry plants (Masini & Lasaponara 2007).
3.2.2.2 Geological Mapping
Mapping geological formations can be done in a few different ways, although not
completed in this research due to the poor geological data resolution. Spectral and spatial
data from remote sensing can provide detailed information relating to geological
formations. In barren areas, remote sensing can provide detailed information regarding
the geology (Chen 2006, 2012). Although not used, a few examples of geological
mapping are provided if the data resolution is of an acceptable standard, the first
assessing the texture of remotely sensed images in Mongolia (Lucie et al. 2004). The
second looks at the mapping of diagenetic heterogeneities in sandstone features in

41
Navajo sandstone (Bowen et al. 2007). Alternatively, the method and manner of soil
mapping performed by Nield and Boettinger (2007) show promise when identifying areas
of interest using Normalized difference ratios. The research was selected in regards to
the identification of soils derived from sandstone rock features.
3.2.2.3 Hill / Relief Shading Analysis
Relief shading was initially developed to enhance the visual aspects of maps and to show
relief and topography. Computer shaded relief maps incorporate colour and texture to aid
visual aspects of terrain (Zhou 1992). The terms ‘relief shading’ and ‘hill shading’ are both
used to describe the process of visually enhancing terrain maps. Two examples of
hill/relief shading are discussed, first the research on automated hill shading.
3.2.2.3.1 Hill Shading and the Reflectance Map (Horn 1981)
Automated hill shading began by attempting to use the grey levels to determine how
much light was reflected from the surface (Horn 1981). The hill shading process utilises
algorithms to associate grey scale values to pixels which assist in creating visually
enhanced two dimensional images (Hobbs 1999).
The hill shading process described in figure 4 set out by Horn (1981) will use the Shuttle
Radar Topography Mission Digital Elevation Model (DEM) because it has the best vertical
resolution available in Southern Africa. An automated process of relief shading will be
undertaken to provide a visually stimulated topographical map. Features of interest
(Shelters, kranslines and boulders) can be identified by understanding the types of
shades that these features may have. Therefore, allowing those sets of shades to be
identified on a large scale.

42
3.2.2.4 Terrain Mapping
Mapping terrain and geomorphology in remote locations has used remote sensing for
some time now, mainly for mapping areas for landslide susceptibility (Lee 2005;
Biswajeet & Saro 2007; Hong et al. 2007). Research (Abd Manap et al. 2010) has taken
to using remote sensing to identify aspects of geomorphology such as hillcrests, and
different types of slopes. These techniques are ideal when looking to determine possible
methods for mapping geomorphological features in mountainous terrain.
3.2.2.5 Application of remote sensing in the identification of the geological terrain
features in Cameron Highlands, Malaysia.
The process of terrain mapping was utilised in the Cameron Highlands, Malaysia by Abd
Manap et al. (2010). This study used aerial photographs and Landsat images in an
attempt to identify features of the terrain such as hillcrests, side slopes, foot slopes,
convex slopes, concave slopes and straight slopes. The aerial photographs and Landsat
images were draped over a digital elevation model to represent the environment in three
dimensions. Abd Manap et al. (2010) recalled on the researchers that utilised similar
methods prior to the research in the Cameron Highlands (Verstappen 1977; Davis &
Mason 2000; Novak & Soulakellis 2000; Bocco et al. 2001; Ramli 2001; Chang 2002).
Verstappen (1977) was the first to use Landsat ERTS 1 in an attempt to identify
geological features. Verstappen used band 5 and band 7 to distinguish between
variations in geomorphic units and vegetation. Kayan and Klemas (1978) concluded that
band 7 of the Landsat ERTS 1 was used for the identification of geological formations
and geomorphological slope contrast. Of which, band 5 was used to reinforce the data
obtained in band 7 as it provided detailed information on rock-soil boundaries, the tectonic
relationships between vegetation and structures for determining between flat surfaces
and steep slopes (Kayan & Klemas 1978). The false colour composite of bands 4, 5, 7
assigned to the red green and blue bands provided for the analysis of geology owing to
the higher contrast.
Novak and Soulakellis (2000) were able to implement principle component analysis for
the use of terrain mapping to identify geomorphological units. The purpose of the

43
research was to test the effectiveness of enhanced Landsat 5/TM multispectral imagery
to determine likely geomorphological features such as dissected metamorphic terrains,
lava plateaus, colluvial foothills, and alluvial plains (Novak & Soulakellis 2000).
Similar studies have carried out these techniques to map terrain, an example of this is
Bocco et al. (2001) who utilised landform classifications to classify the landscape and
determine areas such as low hills, high hills, sierras as well as flat land and piedmonts.
The project provided valuable data for an area where forested areas are maintained by
local communities. These landform classifications classified the major landforms and
dominant land cover, both of which are useful for a country with minimal resources and
a need for methods to classify land cover at a large scale (Bocco et al. 2010). Digital
elevation models were identified as a valuable tool for the identification of geological and
geomorphological features (Grover 1999; Davis & Mason 2000).
3.2.2.5.1 Method utilised by Manap et al. 2010
The initial stage of the terrain mapping procedure involved the development of a digital
elevation model (DEM) from contour data derived from topographic maps (1:10 000
resolution) (Abd Manap et al. 2010: 2). The topographic map resolution of 1:10 000 were
used to create a DEM with a pixel size of 5m. The DEM was then used to create a slope
map, aspect map and a shaded relief map (Abd Manap et al. 2010: 2).
The panchromatic aerial photographs (1:20 000 resolution) were scanned and then
georectified using ground features. The aerial photographs were then orthorectified using
ground control points and a cubic convolution resampling to maintain the accuracy in the
images. The aerial photographs were then mosaicked. The Landsat imagery undergoes
different procedures compared with the aerial photographs, the first stage was
implementing linear contrast stretching and histogram equalisation. The next stage was
draping the orthophotographs and Landsat images over the DEM. Finally, the results
were tested during field verification (Abd Manap et al. 2010: 4).
Manap et al. (2010) were able to identify the geological terrain through specific features
that are of relevance to the model that is being developed in this research. These features
include topography, drainage systems, vegetation, and land use. The bands of Landsat

44
used were valuable for geological terrain mapping, band 4 succeeds at demarcation of
water bodies, band 5 identifies soil or areas with a lighter tone and band 7(NIR) suffers
less attenuation and therefore is ideal for the identification of geomorphological slope
contrast (Abd Manap et al. 2010: 2).
3.2.2.6 Predictive/Likelihood Model
Predictive models use samples of archaeological sites or theories on human behaviour
to predict unknown site locations (Ebert 2004: 323). Predictive models have been used
extensively in archaeology to assist with locating sites. Such models have been used to
identify site locations for lithic assemblages, understanding hunter gatherer adaption,
locating archaeological resources and much more. These models predict site locations
using variables identified at known site locations. Duncan and Beckman (2005) describe
archaeological sites as the distribution of decisions made by humans within the
conditions presented within their environment (Duncan & Beckman 2005: 37).
Archaeological sites have a tendency to occur in environmentally favourable settings that
are preferable for resources, hunting or protection. The assumption made is that the
environment will impact on site locations and that these site locations will correlate with
other site locations in regards to common features (Marozasa & Zack 1990: 105; Ebert
2004: 325). An example of this is the repetitive nature of rock art sites in rock shelters
and boulders etc. Inductive modelling assumes a cultural-ecological view of human
settlement systems, which focus on parts of the environment rather than the individual
site (Ebert 2004: 235).
The method is somewhat criticised as there are limitations associated with the approach,
mainly in regard to stating that human behaviour was based on environmental choices
and conditions, these criticisms include a failure to account for environmental change
(Kvamme 1992; Wheatley 2004), an approach being environmentally deterministic (Ebert
2004). Predictive modelling is reliant on two assumptions: firstly, site choice is influenced
by the environment and secondly, that these environmental factors are portrayed in
remote sensing images and, or, maps. Numerous studies have been successful or shown
positives and were able to locate archaeological sites or understand human behaviour

45
and site selection due to these predictive models (Gaffney & van Leusen 1995; Dalla
Bona 2003; Ebert 2004; Wheatley 2004).
Analysing successful and unsuccessful models provides this research with the foundation
and approaches that need to be considered with regard to modelling the requisite
variables. A secondary aspect of this project is to look at site selection decisions and how
environmental factors possibly influenced these decisions. Assessing the positives of
predictive models allows this research to replicate these successes and avoid some of
the pitfalls of previous researchers.
Verhagen et al. (2008) show how archaeological predictive models are effective for use
in heritage management and related surveys. The main justification behind using
predictive models is their efficiency in locating areas that are more likely to contain
archaeological sites. The idea of priorities is related to surveying, there is little point
expending time and resources surveying areas that have a very small chance of
containing archaeological sites. Therefore, it is better practice to survey the most likely
areas first and then any other possible locations if time allows. Archaeology is arguably
about discovery, which is the main reason why projects get funded (Verhagen et al. 2009:
19).
“Archaeological predictive models will tell us where we have the best
chances of encountering archaeology. Searching for archaeology in the
high probability areas will ‘pay off’, as more archaeology will be found there
than in low probability zones. It is a matter of priorities: we can not survey
everything, and we do not want to spend money and energy on finding
nothing. And there is also the political dimension: the general public wants
something in return for the taxpayers’ money invested in archaeology. It’s
not much use telling politicians to spend money on research that will not
deliver an ‘archaeological return’.” (Verhagen et al. 2009: 19).

46
In an attempt to set a standard as to what is required of predictive models, Verhagen et
al. (2009) raised some valid points to ensure that data quality and predictive models are
acceptable. The points mentioned are generalised for most models but if achieved, would
result in good, reliable, predictive models which should:
Have a framework for site density patterns.
Motivate why the prediction is made.
Be transparent and reproducible.
Give best possible prediction and therefore, be optimised.
Perform well in future situations.
Specify uncertainty and the risk of classifying zones in high, medium and low
probability.
Verhagen (2009) sets out these criteria as guidelines to aid for predictive models and as
such they allow for these models to be successful and reproducible.
Criticisms of predictive models have been raised by many researchers in the past (Ebert
2004: 327; Wheatley 2004) with most criticisms aimed at the accuracy of site locational
data or environmental data. Ebert (2004: 237) notes that predictions based solely on
environmental considerations are effective for hunter-gather settlement patterns but
when the model is based on social or political practices the predictions are much less
likely to succeed. A further point is that GIS is believed to reintroduce environmental
determinism into archaeology but this is not necessarily the case because of the ability
to add non-environmental data into a GIS (Gaffney & Van Leusen 1995; Ebert 2004:
334). The thorny issue of environmental determinism and its links to GIS and predictive
modelling is addressed further (9.5.2: 173).
A useful consideration noted by Carleton et al. (2012) is that predictive models’ efficiency
is determined by the resolution of the data included, in their case, digital elevation model
with 30m resolution was more than suitable for testing the model’s potential although
higher resolution data is available. Therefore, any data limitations need to be taken into
consideration as well as the use of data at a standardised resolution throughout the
research.

47
Wheatley’s (2004) analysis of predictive models shows underlying problems that many
other researchers wouldn’t admit to. This research has noted that many researchers use
predictive modelling as a research method when there are limited financial resources.
That is, the researcher is unable to conduct research over the entire area and wants to
focus on the best areas for archaeological data to occur. The problem related to this is
that models in Wheatley’s (2004) view do not work that well and the resultant model would
not provide a representative archaeological record.
Landscape complexity contributes towards Wheatley’s (2004) view of predictive models
not working well. There is an underlying problem in trying to predict archaeological sites
based on environmental characteristics (Kvamme 1990; Wheatley 2004: 5).
Understandably, some landscapes are complex but in some cases trends can be mapped
accordingly. Finally, Wheatley (2004) believes that the problem of predictive modelling is
not always related to the models but rather the researchers. Most researchers
implementing predictive models are trying to avoid the fieldwork and data collection
involved with everyday archaeological prospecting and thus, using predictive models to
predict known site locations that they used to create their model (Wheatley 2004).
Justifiably, using a percentage of sites for validation is acceptable as it is a method to
test the validity a model, but modelling to predict the archaeological sites used to
construct the model is unethical and should be avoided.
Therefore, any predictive models that have been applied in a similar manner would be
relevant. Three such models have been analysed, the first completed by Vaughn and
Crawford (2009) and then Carleton et al. (2012) where both looked into ways of mapping
and modelling Mayan site selection choices in Belize to determine what factors might
have influenced these locations most. The third case study conducted by Kvamme
(1992), attempted to predict open air lithic scatters and sandstone rock shelters and
although the project was successful, technological limitations stifled the research. Finally,
Brandt et al. (1992) discuss the applicability of a predictive model for using a weighted
layer approach and demonstrate the issues of using predictive models to map human
behaviour.

48
3.2.2.6.1 A predictive model of archaeological potential: An example from northwestern
Belize
The study on the predictive modelling potential in north-western Belize (Vaughn &
Crawford 2009) assessed possible alternatives to costly time consuming ground based
surveys to identify and locate Mayan archaeological remains. The research focused on
mapping the variable concerned with site locations (Vaughn & Crawford 2009).
Elevation data was obtained through EROS (Earth Resource Observation Services) of
which this data included slope, aspect and hill shading. The slope data was used to
determine two variables, first, the distance to flat land and second, the sum of the area
of flat land. The slope layer was also used to identify areas suitable for agriculture and
settlement, therefore, any areas with between one and five degrees of slope, because
runoff at this more than 5 degrees of slope, would carry soils with it and second at this
slope the relief would drain suitably during the wet season.
Further, variables included drainage patterns derived from 1:50 000 topographic maps,
which were used to calculate the distance to water because it was seen as a likely
indicator of site locations. Vegetation indices were also included in the predictive model.
The indices used included the Normalized Difference Vegetation Index, Tasseled Cap
Greenness, and Wetness Index. Both the NDVI and Tasselled Cap Greenness are
vegetation indicators, whereas the Wetness Index is an index of water present throughout
the area whether in soil or the canopy.
The model used a binary logistic model and consequently identified aspect, greenness
and distance from known sites to arable land as the variables to identify Maya
settlements. Other instances show that water, slope and soil characteristics have
impacted Mayan site choices (Ford et al. 2009). Known non-site locations were also
derived from the surveyed tract and influenced the use of a weight-of-evidence model
(Vaughn & Crawford 2009).
Based on the initial predictions, the model successfully predicted two thirds of the known
site locations and sixty percent of these sites that were retained for validation and testing
purposes of future models. The predictive model performed well in locating areas of high
archaeological probability when locating site locations that were withheld from the initial

49
predictions, however, without actual field testing to validate this model, the actual success
rate is unknown (Vaughn & Crawford 2009).
3.2.2.6.2 A locally adaptive model of archaeological potential (LAMAP)
In an evaluation of predictive models, Carleton et al. (2012) discussed and critiqued two
commonly used predictive modelling techniques. In attempting to predict site locations,
ancient humans had a sense of where they needed to be in order to perform the functions
that were desired and thus when attempting to model these behaviours, researchers
needed to be cognisant of these decision making processes and how humans utilised
the landscape (Carleton et al. 2012). A common problem recognised in these models is
that they predict probable archaeological site locations instead of indicating areas of
archaeological potential. Areas of probability or likelihood are likely to contain sites,
whereas areas of potential may or may not contain archaeological sites based on the
modelling parameters, these areas of potential are selected based on parameters but
there is no expectation that there will be sites present. Most predictive models are
capable of locating sites that are already known to the researcher and that were used in
the model building process, but are unable to replicate this success due to landscape
change and variability (Butler 1987; Fedick, 1995, 1996; Dunning et al, 1998; Fedick et
al, 2000; Kunen, 2001; Penn et al, 2004; Ford et al, 2009; Patterson et al, 2010; Zhang
et al, 2010).
Landscape variability is a problem that affects predictive models, as it introduces
problems when trying to replicate a model’s success in a different landscape. Considering
the changes in landscapes, both weights of evidence and logit models, are weak and
impervious to this change. This is relevant to this study as the model is created using site
data for the Matatiele region which is located below the escarpment and will be tested in
Sehlabathebe which is located above the escarpment.
The two techniques discussed are the basic Logit model and the Weight of Evidence
model. The weight of evidence models looked at a breakdown of spatial variables for a
region, whereas, logit models assessed odds of binary result for distribution of variables
for a site without any assumptions being made about the distribution of the variables.

50
The method set out by Carleton et al. (2012) looked at the distribution of 69 Mayan sites,
whilst retaining 8 sites for model validation. Elevation data was acquired for the research
area from two sources namely ASTER and SRTM. The ASTER data was used to form a
15m stereoscopic DEM whilst the SRTM data was used replace cloud cover pixels on
the ASTER data. The primary resolution of the data was 15m or 30m (when stated).
Identifying variables that are of relevance to a project is a crucial stage in a modelling
procedure, Carleton et al. (2012) identified that the variables of relevance to their study
included: elevation, slope, terrain roughness, aspect, distance to nearest river and soil
types; however, aspect was discarded because it was indistinguishable amongst a group
of known sites. As we shall see, this is reflected in the findings of this project where aspect
was also discarded because of the underlying drainage basin which is determined by the
topography of the area. The success of the LAMAP set out by Carleton et al. (2012) has
advantages as listed below: the model is simple but robust, is able to account for issues
of spatial data scale and provides an adequate understanding of the landscape and
locational behaviour (Carleton et al. 2012).
3.2.2.6.3 Predictive Site Location Model on the High Plains: An Example with an
Independent Test
Kvamme (1992) focused on an area within the Piñon Canyon, Colorado, USA to apply a
predictive model to assist with locating sites in an ongoing archaeological survey. The
area is home to open air lithic scatters and rock shelters sites within the sandstone layer
in the canyons. The method of modelling took a representative sample of the sites for the
region that consisted of known site locations as well as known non-site locations and
applied a method of pattern recognition. The site and non-site locations were imported
into a GIS consisting of areas that that have been surveyed as well as other areas which
had not been surveyed.
An assumption of modern archaeology is that the behaviour of modern humans is not
random and thus sites should not be randomly placed throughout the landscape.
“With regard to the first assumption, it is a basic premise of modern
archaeology that human behaviour is non-random and, therefore, activity

51
places (i.e. sites) should be nonrandomly distributed. Numerous studies of
empirical settlement data have repeatedly demonstrated the significant
regional patterning exhibited by archaeological distributions (e.g. Judge
1973; Kvamme 1985; Roper 1979; Thomas & Bettinger 1976).” Kvamme
(1992: 21).
Therefore according to Kvamme’s statement, because site distribution is non-random it
is possible to be predicted (Kvamme 1992: 21; Brandt et al. 1992: 269). A limitation,
however, exists in the sample of sites selected, because it is not always a truly accurate
reflection of the sites discovered. Sites that were not found or possibly destroyed
contribute towards a model, but without any presence of their individual characteristics,
the factors associated with them would not be present in the model and would have an
effect on any undiscovered sites that exist in similar conditions as they would not
contribute any present in the initial site (Kvamme 1992: 20, 22). Therefore, it is important
to note that the sample is the only representative of the known sites and those site
conditions. A further point to consider is how the environment could have changed from
the time the site was first used until the point of its discovery (Kvamme 1992).
With regard to rock shelter site selection, Kvamme (1992) notes that these sites are fixed
and occur at the juncture of certain variables, namely geology and the occurrence of
erosive factors. Shelters of a suitable size often display some form of occupation
(Kvamme 1992: 23). At the time of the publication, Kvamme (1992) discussed the
difficulties of applying a predictive model to rock art studies, namely because of there
was no method or technology that allowed for the identification of rock shelters and
overhangs. A secondary issue in this research was the inability to identify suitable rock
faces for paintings because no model is able to provide information on whether there is
a suitable rock face within a shelter to contain rock art. Only after surveying can a site be
known for containing rock faces capable of containing rock art. Any regional model that
is capable of locating and predicting rock shelters is valuable to archaeologists as, more
often than not, these shelters contain some form of archaeological material.
There are certain factors that are common among locational studies. These include;
slope, aspect, shelter, distance to water and view. These factors are listed and discussed
in regards to how site locations were influenced. The first to consider is gradient of the
slope. This is widely considered as an indicator of human settlement because of a
52
preference to occupy flat areas over rough steep terrain (Kvamme 1992: 24). However,
the presence of rock shelters in steep mountainous terrain needs to be taken into
account.
The second factor for consideration is an aspect. Site selection in the northern
hemisphere is seen with multiple sites located on the south facing aspects due to greater
warmth provided by the sun and trends have been identified to support this claim which
makes it a useful modelling component (Kvamme 1992). In the southern hemisphere,
this would obviously be reversed to a north-facing preference.
Local relief or terrain roughness has been investigated as a decisive factor in location
studies because the nature of the terrain affects where settlement occurs. The values in
roughness are dependent on the fluctuations in elevation. Higher fluctuations equate to
rougher terrain, whereas, a smaller variation equates to flatter terrain.
Shelter is the final factor that Kvamme (1992: 26) considered, and is relevant because of
the protection provided by shelter to elements such as wind, poor weather or sunshine.
Shelter is measured in regards to how well sheltered a site location might be (Kvamme
1992).
Considering the description of deductive models (Kohler & Parker 1986), Kvamme (1992)
illustrates how the selection of variables disproves the simplistic nature of the deductive
models described because many of these deductive models make assumptions about
human behaviour. In this case, the variables are based on empirical data. However, with
regard to assigning weight to these models, guesswork and assumptions are needed at
times in order to determine the balance of factors assigned (Brown & Rubin 1982;
Kvamme 1992). Statistical processes are required for these weights to be scientific, such
as using mean and standard deviation or other statistics to accurately determine the
weighting.

53
3.2.2.6.4 An Experiment in Archaeological Site Location: Modeling in the Netherlands
using GIS Techniques
In the Netherlands, the process of archaeological discovery is problematic owing to the
nature of the archaeological sites: most sites, especially in densely populated regions in
Europe are found beneath the surface of the ground. Site location models have been
applied successfully in the United States of America, not only to show areas with
archaeological sensitivity but also for their predictive power for locating undiscovered
sites (Kvamme, 1992; Brandt et al. 1992).
A premise to be aware of when performing locational models in archaeology is the idea
that human behaviour is patterned and therefore, so is locational behaviour (Brandt et al.
1992: 269). Sites across a landscape should, therefore, display non-random
characteristics, which can then be used to predict undiscovered site locations. Most
modelling studies have examined common site preferences such as soil conditions,
elevation and terrain. Of these factors, data can be obtained for soils, geology, hydrology,
and topography (Brandt et al. 1992; Kvamme 1992; Carleton et al. 2012).
The use of a weighted map layer approach to modelling was chosen to best distinguish
subtle changes or combinations in the environmental dataset (Brandt et al. 1992). By
using a weighted map approach, a single category can be assigned a value pertaining to
the condition and whether it is favourable to contain archaeological sites. There are two
possible ways of doing this. First, a binary option displaying favourable and unfavourable
areas, and then second, a ranking system can be applied. Kohler and Parker (1986)
believe that implementing ranks without deductive reasoning is problematic and that
ranks need to be decided based on theory. These ranks are similar to the weights
assigned within a weight of evidence model.
The goal of Brandt et al. (1992) was to give researchers an advantage in locating
archaeological sites rather than an attempt to map human behaviour. Raster data is ideal
for associating weights with specific characteristics due the grid-like nature of the data.
After the modelling procedure was completed, the resultant weighted model is a summary
of the six contributing map layers that were added to the modelling process. The
summary of the weighted model would show areas ranging from favourable to less
favourable areas to contain archaeological sites (Brandt et al. 1992: 271).
54
The classic use of predictive modelling in archaeology has been criticised since it uses
environmental characteristics to not only predict site locations but also explain human
behaviour (Brandt et al. 1992: 271). In this study predictive modelling will be used without
making assumptions on human behaviour per se, but rather as a method for aiding
desktop research on rock art in advance of the archaeological survey. This predictive
model will focus solely on the identification of geomorphological proxies to identify areas
of higher likelihood of rock art occurrence which will then be ground-truthed.
3.2.2.6.5 Remote sening based identification of Painted rock shelter sites: Appraisal
using advanced wide field sensor, neural network and field observations.
Banerjee and Srivastava (2014) successfully applied a remote sensing method in Rewa
and Mirzapur, Central India, which is used to delineate areas of exposed sandstone. The
research area contained a total of 250 known rock art sites and subsequent to this
method being applied a further 40 sites were located.
Using multispectral data from the IRS-P6 (ResourceSat-1) satellite that has advanced
wide field sensor (AWiFS). The bands that the research focused on where bands 2-5.
The GPS locations of each site were used for ground truthing purposes. Furthermore,
digitized and geometrically corrected maps were used for classifying rock art into different
landscapes. As a result the area was divided into five separate classes; forest,
waterbodies, sandstone, alluvial land and cropland. All rock shelter sites were found
within the sandstone complexes.
The first algorithm applied in the research was the artificial neural network (ANN). The
ANN classifier identified five classes, forest, waterbodies, alluvial land, cropland and
sandstone. The method of ANN used is particularly successful as it is capable of learning
by pattern and therefore simplifying the process. The second method applied was the
Maximum Likelihood Classification (MLC) and is known for its ability to classify both
variances and covariances of the classes, subsequently assigning each to a pre identified
signature class. The MLC was also successful at identifying the five aforementioned
classes.

55
The ANN producer results differed significantly to the user results for each of the classes.
The forest and water body classes differed slightly, whereas, the producer successfully
identified 91.89% of the cropland compared with the user result of 61.82%. The user
successfully identified 100% of alluvial areas, 93.62 % of sandstone whereas the
producer identified 82.35 % and 69.84% respectively.
The MLC has similar classification results to the ANN, however slight differences
occurred in the classification as it was less successful at identifying waterbodies
(85.19%), cropland (89.19%) and sandstone (66.67%). User accuracy was similar for the
forest, waterbody and alluvial classes, but both cropland (57.89%) and sandstone
(91.30%) classes were less accurate. Overall accuracy of both methods differed slightly
as the ANN (84.29%) was more accurate than the MLC (81.15%).
Both methods proved successful at delineating areas of sandstone, as such a linear trend
of shelters were distributed across the Rewa Landscape. Although both the ANN and
MLC had slight differences in accuracy, they were able to map sandstone outcrops and
therefore assist rock art surveyors.
3.2.2.7 Interpretation
3.2.2.7.1 NDVI
This research assesses the successfully applied methods from others’ research in an
attempt to replicate the success of others and utilise it in a model for locating rock art in
the Maloti-Drakensberg. Looking at the success that Vaughn and Crawford (2009)
achieved by implementing NDVI to studies looking into human occupation based on
vegetation, it appears useful for this research. However, owing to the nature of site
locations, this research focuses on identifying barren rocky outcrops rather than highly
vegetated areas.
Owing to the expansive wattle cover throughout the research area, NDVI is useful to
delineate areas with this cover. The problem encountered with these vegetated areas is
that the wattle was introduced subsequent to the paintings and thus, some highly
vegetated areas are likely to contain rock art. It should be noted that the majority of wattle
56
growths occur adjacent to water courses and not the whole way up the side of a valley,
however, there are exceptions.
3.2.2.7.2 Terrain Mapping
The mapping of terrain that was completed by Abd Manap et al. (2010) shows a possible
method that can contribute towards locating specific geomorphological features.
Although the specific features of interest are different, this method holds promise with
regard to locating geomorphological features such as boulders, rock shelters and rock
overhangs.
3.2.2.7.3 Geological Mapping/Soil Mapping
Texture-based segmentation was used successfully in research by Lucie et al. (2004) for
mapping different geological units. This study shows relevance in mapping geology such
as sandstones and basalt, two geological units of interest.
In the mapping of Navajo sandstone Hyperspectral techniques were shown to be a
success (Bowen et al. 2007), however, due to the costs associated with the very high
resolution data that was employed, it cannot be used for the purpose of this study.
The method for mapping soil through the use of Normalized difference ratios is important
to this research as it shows the possibility of looking at ratios that could affect the
distribution of sandstone which would assist in locating areas of interest.
3.2.2.7.4 Classifications
The different forms of classifications that have been displayed throughout the case
studies (Inzana et al. 2003) have been assessed to identify the most relevant processes
and which is most likely to have the best possible influence in trying to identify rock art
shelters.

57
The classifications are performed to determine the distribution of land cover throughout
the research area. The classifications were believed to be of use to ascertain the extent
of the sandstone and other relevant geological formations but were unsuccessful at being
selective for the purpose of this study. Mapping land cover for the research area would
assist with predictive modelling by limiting areas that are unsuitable, such as areas that
are classified as ‘farming’ or ‘urban’.
3.2.2.7.5 Predictive Modelling
Predictive models are assessed to illustrate their relative strengths or weaknesses.
Certain conditions were laid out by Verhagen (2009) to ensure data quality and the
reputation of the predictive models. The first condition is that researchers should motivate
why the prediction is made, in our case predictive modelling was seen as a viable means
to distinguish areas of likelihood based on environmental conditions. In the cases listed
above (Kvamme 1992; Brandt et al. 1992; Vaughn & Crawford 2009; Carleton et al.
2012), predictive models might have been discredited by modelling primarily on
environmental conditions.
Predictive models need to be transparent and reproducible, two conditions that this
research hopes to achieve. Transparency is required in regards to how the model is
produced and to the breakdown of variables included in the model. A requirement of this
research is that the model is reproducible, in areas that the model was not constructed
or based on. In essence, the model can be reproduced but the weight of the different
variables might need to be altered to maximise the efficiency of the model when applied
elsewhere and in another region.
Models should produce the best possible predictions so that they can be effective and
optimised. In rock art research, surveyors require adequate knowledge of an area prior
to the survey to enable the best possible outcome and the likelihood of locating the most
sites possible for the time spent surveying. Therefore, any predictive model focusing on
predicting likelihood for the occurrence of rock art sites needs to be extremely accurate
and reliable.

58
As well as being reproducible models must have high predictive capacity. Ideally, any
model that is used to locate archaeological sites should have the newly located sites
added to the model to determine whether the likelihood of locating the previously ‘known
sites’ using only the recently discovered sites.
Classifying zones of probability is a problem with predictive models especially when trying
to derive areas of high, medium, and low probability. The difference in this case is that
low areas of probability will not receive the same amount of research attention as high
probability zones. The classification of these zones therefore needs to be accurate and
limiting the chance of sites occurring in less likely areas.
Site samples need to be representative for a predictive model to be successful. In Vaughn
and Crawford’s study (2009), a site sample of 50 sites used was an adequate base but
whether it is a true representation of the area is another problem that needs to be
considered as 50 sites might be sufficient enough to reflect the diverse nature of site
conditions across the study area. In modelling and validation, the MARA 2012 database
to date has 106 sites to work with, from an array of different conditions, adding to the
diversity of sites. Although there are 200 hundred sites within the overall MARA database,
many of these sites represent rock shelters that contain archaeological data that is not
rock art so it adds to the representation of the area and shows that even in cases where
rock art might not be found, there is a possibility of locating other archaeological
evidence.
Fieldwork and data collection are imperative for any predictive model which attempts to
locate future unknown site locations. Vaughn and Crawford (2009) used validation to test
the effectiveness of their predictive model which shows a circular argument, predictive
models are supposed to be able to predict unknown site locations. Understandably,
validation points are required to test the accuracy of models but they cannot display
whether a model is effective or not.
However, rock art site locations are confined to areas with exposed sandstone,
(predominantly Clarens or Elliot Formation and at times Molteno Formation) which occur
on near vertical rock faces. Focusing solely on geology and slope will afford rock art
researchers a huge advantage by substantially reducing the areas that need to be

59
surveyed. The inclusion of further variables such as NDVI, aspect, and shaded relief, it
is possible that this model can be refined further to better predict rock art site locations.
The different case studies assessed show the potential of this research. Although few of
these components have been previously used in conjunction, it is promising to see how
the different aspects are able to contribute towards the researchers’ objectives. As
mentioned earlier, this research is undertaken with the knowledge that the methods have
limited singular potential and is an attempt to determine the most useful combinations of
variables for the prediction of features that are synonymous for containing rock art sites.
With the limitations of some methods and the complex choices made with regard to site
selection certain aspects will contribute more than others, and this determines how the
model’s variables are then weighted. Weighting therefore needs to be discussed,
followed by how the variables are overlain to give a comprehensive picture.
Banerjee and Srivastava (2014) research methods were not available at the time of
writing, however, it would a profitable avenue for future research. Ideally the methods
applied within this research should be compared with those of Banerjee and Srivastava
(2014), as this would take time to test this is beyond the scope of this dissertation The
two models do differ in that the Banerjee and Srivastava model uses direct methods of
predicting the locations of sandstone whereas the methodology within this research looks
at indirect methods of locating sandstone rock shelters.

60
Methods
4.1 Introduction
This chapter outlines the processes that were tested throughout this thesis and creates a
discourse about the relevance of successful and unsuccessful remote sensing variables.
The methodology in a remote sensing study can be a lengthy process owing to the multiple
components that contribute towards a working output. Therefore, this chapter discusses all
factors from data acquisition to how the predictive model was constructed and finally how
surveying took place. The methodological process (Figure 4.1: 62) outlines basic data
acquisition, shows how the procedural breakdown of the methods and how the individual
remote sensing components contributed to the final likelihood model.
The remote sensing outputs or components are all discussed with regard to how the data
were processed and their expected outcomes. The MARA database has been compiled
from site record forms and was utilised in the identification of each individual remote sensing
outputs threshold prior to the modelling procedure so that the thresholds would reflect
potential rock art sites based on known site data. The remote sensing aspects that have
been discussed previously are all expanded here with relevance to the input of data and
how they were processed.
4.2 Data Acquisition
Initially, this research looked into the use of open-access imagery from platforms like the
USGS (United States Geological Survey) and SANSA (South African National Space
Agency). The data requested from the USGS included Landsat 7 and Landsat 8
multispectral imagery as well as DEM’s such as SRTM (Shuttle Radar Topography Mission),
ASTER (Advanced Spaceborne Thermal Emission and Reflection Radiometer) and GMTED
(Global Multi Resolution Terrain Elevation Data). The aforementioned imagery is freely
available to students upon request from SANSA as well as the USGS. In addition, higher
resolution SPOT 6 multi spectral data were sourced from SANSA.

61
Due to the hybrid nature of this archaeological/remote sensing study, the pre-processing
that is required before calibrated data can be utilised was completed by SANSA. Throughout
this research there is a mention of alternatives to SPOT 6 and other high resolution data,
these different data sources (Landsat 7, Landsat 8, and SPOT 5) are freely available and
are capable of providing adequate results7. This is to allow researchers with smaller budgets
to implement these methods on lower resolution data and still provide more than adequate
results. The difference between lower resolution data and SPOT 6 will be discussed further
in subsequent chapters.
7 Given the rapid improvement in image quality and turnover rate in software packages, SPOT 6 ought to be freely available within a year of submission of this dissertation.

62
Figure 4.1: Methodological Process

63
4.3 Processes
The method process tested components thought to be of relevance to the prediction of sites.
The success rate of those components determined whether they were included in the final
model. Some remote sensing outputs (slope, shaded relief, and NDVI) were seen to be
diagnostic of site location and these form the core components of the model. Aspect was
deemed relevant only in certain situations because of regional variation.
The specific remote sensing outputs were then assessed to determine the thresholds that
were synonymous with known rock art site locations. Hill shading/shaded relief, slope, and
NDVI were all assessed against the known site data of the MARA database site in order to
determine these thresholds.
The MARA site data was used to extract the common data ranges or thresholds that known
rock art sites occur within. These thresholds were then applied to other areas to determine
if they related to other possible site locations. If these thresholds identified areas with other
rock art sites or potential rock art site locations, they would be indicators of site potential.
The thresholds were identified by overlaying the site data onto the slope, shaded relief, and
NDVI that form part of the predictive model. By identifying these thresholds, the thresholds
excluded areas that were irrelevant as they contained no site data.
After the thresholds were identified the different data components were then processed in
ENVI to slice the data and, therefore, excluded any unlikely8 areas. Upon the completion of
the data slicing the different components were then imported back into ArcGIS 10.2 to
incorporate the data into a weighted output which would compile the different sliced datasets
into one combined output.
Subsequent to the data being sliced and re-imported into ArcGIS, the percentages of sites
per class were identified to determine the mean, median of the data classes to show whether
the class would be assigned a uniform weighting, or if specific aspects within the sliced data
would require higher weightings.
8 The term unlikely areas refer to the areas that fall outside the predetermined statistical threshold. This may be due to areas having slope which isn’t identified as being steep enough or having a shaded relief value either exceeding the minimum or maximum threshold identified.

64
The remote sensing components were then added to the weighted overlay and assigned
their relative weightings which were used to create an output map which showed potential
rock art site features.
Areas of the output map were then tested against known site locations to determine if the
model was accurate and able to predict known rock art site locations. The next stage was
testing to see if the model would be successful or not by ground truthing the predictive model
in unsurveyed areas in the Matatiele region. The Sehlabathebe National Park was selected
as the secondary test area and used to determine the percentage of features that the
predictive model could identify.
The final part of the testing procedure involved testing known sites that were not from
Sehlabathebe or Matatiele. Finally, this model is applied to areas that have not been
surveyed as part of the research, the model tested the locations of well-known sites in the
vicinity to the research areas to determine whether or not the model is applicable to alternate
areas.
4.4 Components used for predictive modelling
The remote sensing components that were used in this predictive model were selected to
cover a broad spectrum and, therefore, maximise the likelihood of locating potential rock art
sites. The logic behind the model was to attempt to model the landscape, which is theoretical
if features of the landscape can be replicated within a model. Certain features of the
landscape can be replicated by remote sensing data such as the use of DEM’s to recreate
the topography.
The different components were all tested against the known site data compiled from the
MARA database in order to identify the thresholds of these sites, and so that they could be
replicated. The threshold range was identified in the following way:

65
Equation 4.1 Calculation for the threshold maximum
𝑇ℎ𝑟𝑒𝑠ℎ𝑜𝑙𝑑 𝑚𝑎𝑥𝑖𝑚𝑢𝑚 = 𝑀𝑒𝑎𝑛 + 𝑆𝑡𝑑 𝐷𝑒𝑣𝑖𝑎𝑡𝑖𝑜𝑛
Equation 4.2: Calculation for the threshold minimum
𝑇ℎ𝑟𝑒𝑠ℎ𝑜𝑙𝑑 𝑚𝑖𝑛𝑖𝑚𝑢𝑚 = 𝑀𝑒𝑎𝑛 − 𝑆𝑡𝑑 𝐷𝑒𝑣𝑖𝑎𝑡𝑖𝑜𝑛
The aforementioned formula was used to calculate a minimum and maximum extent for the
thresholds and then applied to the data during the slicing stage, whereby the data was
processed in ERDAS Imagine to remove areas of unwanted pixels that were
uncharacteristic and unsuitable for rock art sites. The sliced partitions were then assigned
values based on the mean of the specific remote sensing component. This statistical
approach aimed to replicate the mean areas that were associated with rock art sites. The
partitions were prioritised so that the partitions nearest the mean had the highest values
and partitions closer to the minimum and maximum extent had lower values. Although rock
art sites are found outside of these thresholds, the combinations of thresholds aimed to
exclude areas that had lower potential than others. Because some rock art sites have
uncharacteristic features, the thresholds were used to maximise the likelihood of locating
the majority of sites based on the mean values.
4.4.1 Normalized Vegetation Difference Index
The NDVI was applied in ENVI (ENVI 5.0). The process required the analysis of the red and
the infrared bands of the SPOT 6 imagery. This process compared the absorption of
chlorophyll in the red (R) band and the reflection of the mesophyll in the infrared (IR) band.

66
𝑵𝑫𝑽𝑰 = 𝑰𝒏𝒇𝒓𝒂𝒓𝒆𝒅 − 𝑹𝒆𝒅
𝑰𝒏𝒇𝒓𝒂𝒓𝒆𝒅 + 𝑹𝒆𝒅
Equation 4.3: Formula to calculate NDVI (Campbell 2008, Lasaponara and Masini 2012: 27)
The NDVI was effective because it analysed areas with vegetation cover as well as those
that are barren. Identifying the exact thresholds of the NDVI and rock art sites provided a
good base to exclude irrelevant areas.
4.4.2 MARA database and Site Record Sheets
Compiled from site record sheets for the sites found to date, the MARA database is the
record of the existing sites from the Alfred Nzo and Joe Gqabi region of the Eastern Cape,
South Africa. The data obtained from the site record forms were inserted into the database.
Initially9, the database as of 2012 had a total of 119 sites of which 106 contain rock art, the
remaining 13 are other archaeological sites which include stone walled sites, Later Stone
Age scatters, and more. The database provided a substantial record for the characteristics
of sites in the region, and as the surveying continued, the database was and still is
continuously updated and expanded. The non-site areas are provided by the existing track
log. The database contributed to the model by providing the site characteristics and
locations of rock art sites that are required to formulate the thresholds of the different data
components.
The MARA database provides a diverse representation of rock art sites across the Matatiele
region. The majority of sites are what could be considered as mountainous sites, however,
there is still a range of low-lying sites which add to the diversity of this site register. This
database was, therefore, more than adequate to create data slice thresholds to delineate
and exclude areas of low potential and even more applicable when trying to predict rock art
sites within the mountainous terrain. Owing to the similarity in nature of the terrain of
Sehlabathebe National Park, the MARA database was seen as an accurate representation
of rock art in a mountainous terrain to be used to predict rock art potential but determining
9 To date the MARA database contains 206 archaeological sites, 176 Rock art sites and 30 archaeological sites.
67
whether the thresholds were applicable to the SNP region or not could only be seen after
the testing was complete.
4.4.3 Hill/Relief Shading
Hill shading, as discussed by Horn (1981), Zhou (1992), and Hobbs (1999) can be used to
display topography on a two dimensional image. Hill shading can be used to create a three
dimensional representation of a map by adding shadows based on hypothetical lighting from
a specific angle and altitude of the sun. The hill shading analysis uses the SRTM DEM
because the SRTM DEM has the best vertical resolution for a DEM in South Africa.
The hill shading analysis focuses on identifying areas that are indicative of rock shelters or
similar rock features. Areas of lower shades represent flatter terrain, whereas darker shades
indicate steeper terrain. Therefore, by identifying steeper terrain areas that are not
consistent with the surrounding areas it may provide a geomorphological proxy for
identifying rock shelters. The indicators could include: areas with a sudden drop that is
indicative of a rock shelter or a sheer rock face and secondly, areas that are adjacent to
sudden drops in elevation being flat.
4.4.4 Slope
The slope parameter was expected to be the most reliable component of this model due to
the nature of where rock art sites are found. Due to their locations in steep mountainous
terrain, characteristics like slope can eliminate flat areas which do not correspond with
known site locations. The known site data was used to identify the thresholds of slope. Two
thresholds were used for slope, the one that is applied to all other variables, and then
another threshold that takes into account the maximum slope values. This is to
accommodate sites occurring in steeper conditions, which have higher slope values that
were excluded using the initial threshold. The second threshold calculation for slope was
refined to include all areas of the lower range of the threshold calculation like other variables
but needed to include the maximum range for the slope to include sites that occur in steep
areas.

68
Rock art researchers would not expect to find sites within the Alluvial Formation because it
is flat and has no outcrops, this is also true for the valley bottoms where very few shelters
are located. However, buttresses and other features occurring within these flat areas are
reflected on the slope maps and contain possible rock art site locations. The slope is
valuable because it is the best means for discriminating between flat areas and those which
are not. This means of discrimination is vital as it excludes all areas of terrain which were
unsuitable. Flat areas are excluded however in some cases boulders are located in flat
areas as they roll from steep areas into adjacent flat areas and come to rest.
4.4.5 Predictive Modelling
Based on the assessment of the aforementioned case studies, different predictive models
can be applied. However, with the numerous data sources and components that can
contribute towards the effectiveness of the model, the weight of evidence model allows the
researcher to control weightings of the components according to importance in accordance
with terrain and the assigned thresholds. As the predictive model needs values prioritised,
certain components impact on site location more than others.
Specific remote sensing components focus on select characteristics of a landscape, in order
to ascertain which attributes of this landscape could be effectively incorporated into a
predictive model.
Outlining the process and how it was computed is important in a methodological study such
as this to demonstrate how it may be replicated. Listing the exact processes that were
undertaken during the methods of a research project will assist other researchers in trying
to implement the same processes.
4.4.5.1 The procedure
The steps that were taken throughout this research are listed in order below. The method
initially created the different components from the datasets. These components were then
tested to identify the statistics for the distribution of sites across the research area. The
individual components were then imported into ERDAS Imagine (Erdas Imagine 9.1) to slice

69
the dataset and remove the unwanted portions that were irrelevant for locating rock art sites.
Once the data had been sliced and it was then exported from ERDAS and reimported into
ArcGIS. This process was completed for each of the components. Once all the components
were imported into ArcGIS, they were added to the ‘Weighted Overlay’. The weighted
overlay was used to compute the overall predictive model, therefore, the different
components were assigned values during this stage to prioritise the different components
that had a higher influence on the presence of geomorphological features. Once the
weighted overlay was computed, the output map showed the distribution of areas that were
expected to contain possible rock art sites and areas without. The final stage tested whether
the areas predicted to contain rock art actually correlated with known site data.
4.4.6 Applying Predictive Models to Alternate Areas
A problem encountered in most predictive models occurs when the researcher attempts to
apply a predictive model to an alternate area. This is because so many models are
regionally specific and, therefore, are not successful when applied elsewhere. Models
become regionally specific because many of the characteristics included are based on
landscape features which are inherently specific to that region such as vegetation type,
geology, topography. This model was not created with the intention of being regionally
specific, however, the unique nature of the different components that form part of the model
enforce this regional drawback. Although some models are more regionally specific than
others, models that focus on specific attributes that are environmentally constant are likely
to be replicated and thus more successful.
An example of how site distribution changes with landscape is seen across four separate
regions within Lesotho (Smuts 1983, refer to: Table 3.1: 32, Table 3.2: 33, Table 3.3: 34,
Table 3.4: 34). Exposure is a problematic characteristic listed by Smits (1983) as it is not
explained to demonstrate what it actually refers to. Secondly, much of the ARAL compiled
data has been outstripped by powerful remote sensing tools and imagery. As this research
was compiled during the 1980s, there are much newer more powerful tools available to
researchers today which are capable of providing the same results at a higher resolution.
Aspect is useful for determining site usage, however, there is no substitute for field work as
the aspect from within a rock shelter can differ from the general aspect of the hillside.

70
Secondly, aspect is a regionally specific attribute of this research as can be seen in the
ARAL distribution of sites against aspect (Table 3.4: 34). Aspect is determined by the
underlying drainage system and especially in regions adjacent to the Maloti-Drakensberg
Mountains the drainage system is perpendicular to the escarpment. Therefore, if the Maloti-
Drakensberg faces east, the runoff from the escarpment would be in an easterly direction
and the valleys below the escarpment would run perpendicular and therefore, the aspect of
the hillsides on either side of the valleys are north and south. The discussion of site use will
follow in the subsequent section based on how aspect affects seasonal usage of sites.
Although the landscapes might vary drastically, it needs to be understood that possible site
distribution is affected by landscape however the site choice is determined by the human
agency. For example, numerous possible rock shelters can occur throughout a landscape
that could be potential rock art sites, however, because of human agency, only a select few
were chosen as rock art sites. Therefore, the presence of rock art within a rock shelter is a
conscious action and reliant on the human agency for it to occur.
The distribution of sites across varying features provides an insight into the problems that a
researcher implementing a predictive model may encounter. This problem can be rectified
by the application of a broad range of remote sensing components.
4.4.7 Weightings
Assigning weights to the different remote sensing components is non-trivial. Firstly, the
researcher had to determine what factors affected the presence of geomorphological
features and then determine what other characteristics would affect site selection. Two
factors were seen to determine the locations of areas that could contain rock shelters or
similar features and these are: slope and the presence of ideal geological formations such
as Clarens Sandstone Formation and Elliot Sandstone Formation. The combination of these
two factors was able to limit areas that were unlikely to contain rock shelters but also
promote areas of the higher likelihood for the existence of rock art sites (however, the
resolution of the geological data for this model was unsuccessful at 1:250 000). Further
aspects that were believed to impact site selection included elevation, NDVI, aspect, shaded
relief.

71
The biggest determinant for the location of rock shelters is the geology. Two specific
sandstone formations were identified as having the most impact on the research area, these
include the Clarens Sandstone Formation and the Elliot Sandstone Formation. The Clarens
Formation is probably better known for the presence of rock shelters as it was known as
Cave Sandstone Formation however Elliot sandstone also has numerous shelters present.
Molteno Sandstone is a further sandstone formation that has shelters and rock art. However,
the Molteno Sandstone Formation has received less surveying and is not as widely
distributed as the Elliot and Clarens, and is limited to lower lying areas to the south and
south-east of Matatiele. The distribution of sites within the Molteno Formation was therefore
not a true representation of the geomorphological features because of the limited number
of sites located within the Molteno Formation.
With the sandstone formations widely regarded as the most likely areas to contain rock art
sites, any modelling procedure would assign these areas the highest values and focus on
locating these areas first. Other geological formations contain rock art sites but not to the
same extent as the sandstones. Alluvium is a geological formation that has been noted to
contain rock art sites, although these sites are more likely located on sandstone lenses
occurring within the general Alluvium Formation. The basalt formation has a lower potential
for rock art sites owing to the limited discovery (Vinnicombe 1976; Pinto et al. 2014),
however, the areas with intercalated Clarens Formation are likely to contain rock shelters
or other related features. All these different components are taken into consideration when
weighting values for the weight of evidence model.
Table 4.1: Geological Breakdown for MARA Rock Art sites
Geology
Sites present per
geological formation
Percentage of sites
per class
Alluvium 6 5.66
Basalt 1 0.94
Basalt w/t sandstone 0 0.00
Clarens 30 28.30
Dolerite 5 4.72
Elliot 51 48.11
Molteno 8 7.55
Tarkastad 5 4.72

72
The slope is a factor that determines where sites are likely to occur. It is not an indicator of
site selection but rather an indication of areas that could contain rock shelters and similar
features such as boulders, rock faces etc. After evaluating the distribution of rock art sites
against slope, it was identified that there are areas that are more likely to be used than
others. Although initial expectations were that the steepest areas (>29˚) were used more
than less steep areas whereas areas of intermediate slope (10˚-29˚) were used most.
Table 4.2: Breakdown of slope for MARA sites
Slope˚
Breakdown of sites
per class
Percentage of sites
per class
0 - 9.99 10 9.52
10-19.99 41 39.05
20-29.99 46 43.81
30-39.99 8 7.62
40-49.99 0 0.00
50-59.99 0 0.00
60-69.99 0 0.00
The site data from the MARA database was used to determine the distribution of
archaeological sites against the different remote sensing components. Tables showing the
distribution of sites against the different components were used to determine the percentage
of sites and this was then used to determine the exact weighting of the model to enable the
best possible outcome.
The next step involved identifying whether aspect affected known site selection. Smits
(1983) showed how aspect was irrelevant in their study of the rock art of Lesotho, and the
availability of rock shelters and smooth rock faces to paint on where more important.
Aspect was assessed as it may have had an impact on site selection. The distribution of
sites was, however, rather generalised with sites occurring in a range of different aspects.
Although it must be noted that due to the general topography of the area and the nature of
the escarpment, the natural drainage direction of the escarpment changes from Qacha’s
Nek to Mount Fletcher and, therefore, the aspects of the shelters on either side of the valleys

73
would change as well. At Qacha’s Nek the drainage direction is southerly whereas nearer
to Nene Gate the escarpment curves south and the drainage direction is south-east at this
curve and finally from Ongeluks Nek towards Mount Fletcher the direction of drainage is
easterly.
Aspect turned out to be of less relevance to the modelling procedure, while, it may be of
use on a more local scale whereby the dominant drainage direction won’t change. The
drainage direction is not of importance to this research, however, the drainage direction
affects aspect of the valleys which contain the rock art sites.
Table 4.3: Breakdown of MARA sites against Aspect
Aspect
Breakdown of
sites per class
Percentage of
sites per class
0-44.99 13 12.38
45-89.99 19 18.10
90-134.99 21 20.00
135-179.99 15 14.29
180-224.99 8 7.62
225-269.99 13 12.38
270-314.99 8 7.62
315-360 9 8.57
In areas between Qacha’s Nek and Nene Gate, the drainage is southerly, therefore, sites
occur predominantly on east and west facing slopes, whereas the drainage nearer to Nene
gate and Pack Ox Nek is south easterly and, therefore, sites occur predominantly with
aspects of Northeast or Southwest. Finally south of Pack Ox Nek towards Mount Fletcher
the drainage is easterly, therefore, sites occur on either north or south facing slopes.
A further comment is required on aspect as most of the surveying for the MARA database
occurred between Qacha’s Nek and Nene Gate, the prevailing drainage systems run
predominantly north to south and, therefore, the majority of shelters would be east or west
facing. Consequently, any assumptions that take aspect as a possible indicator of site
selection in this study have to be aware of the local terrain before doing so as this affects
the aspect of rock shelters. Other points to take into consideration include the possibility of
sites having seasonal usage, for example, south facing sites being used in summer due to
cooler temperatures and North facing shelters in the winter months.

74
NDVI was seen to have a possible influence in locating areas of exposed rock and thus
possible help with locating rock art sites, however, with the sites occurring in such a broad
range of conditions there was a minimal correlation between the location of sites and
specific attributes of the NDVI. The range of values was however useful at discriminating
against certain areas that were considered unlikely to have rock shelters.
Table 4.4: Breakdown of MARA sites against NDVI
NDVI
Sites present
in class
Percentage of sites
per class
0-0.099 9 8.57
0.1-0.199 17 16.19
0.2-0.299 49 46.67
0.3-0.399 50 47.62
0.4-0.499 20 19.05
0.5-0.599 6 5.71
0.6-0.699 8 7.62
0.7-0.799 0 0.00
0.8-0.899 0 0.00
0.9-1 0 0.00
Elevation was the first characteristic to be evaluated against the MARA database. The sites
were distributed amongst four classes and showed a possible preference for site choices.
The majority of sites occur between 1300-1800m above sea level. Although this could show
elevation as an indicator of site selection, it must be noted that majority of surveying
occurred between 1200 and 2000 meters, thus owing to the lack of sites at higher or lower
elevations. A secondary aspect to take note of is that elevation is related to the geological
strata, therefore, the areas that contain the most sites are also the areas that contain the
most suitable geology for shelters to occur.

75
Table 4.5: Breakdown of MARA database against shaded relief
Elevation Breakdown of class
Percentage of sites
per class
300-499 6 5.71
500-699 14 13.33
700-899 19 18.10
900-1099 17 16.19
1100-1299 31 29.52
1300-1499 13 12.38
1500-1699 4 3.81
1700-1899 1 0.95
1900-2099 0 0.00
2100-2299 0 0.00
4.5 How the models were applied?
The MARA database with all known rock art sites located prior to the start of surveying in
2013 was used to determine the initial site thresholds against the remote sensing
components. This initial survey data was then used to construct the individual components
that were used to model for sites within the MARA survey area. Subsequent to surveying
these areas, all new sites that were located were then used to reverse model for the original
known sites of the MARA database. In some instances, variations in the threshold values
allowed for models to have higher as well as lower potential areas. These higher potential
areas focus on the mean values of the thresholds, whereas, areas of lower potential
constitute threshold values that are further from the mean are thus less likely to have
potential.
Upon the completion of the MARA data models, the thresholds identified were then applied
to Sehlabathebe National Park. The entire park was surveyed as part of the UNESCO
Survey. The thresholds for the Sehlabathebe were then applied to the MARA region to
determine if there were possible improvements that could be applied to the thresholds.
The last stage of the modelling procedure was to test the cumulative model – comprised of
the MARA and Sehlabathebe survey data – to some well-known sites that fall into the area
covered by the remote sensing data.

76
4.6 Comments on the initial models
The initial predictive model formulated from remote sensing outputs (slope, shaded relief,
and NDVI) was the first combination to be tested for predictive ability. These initial models
looked at identifying the thresholds and excluded data that existed outside of these
thresholds, these areas would represent the areas of highest likelihood based on MARA
2012 data thresholds. The model and all others to follow were scrutinised by the MARA
database. The testing stage looked at identifying the most likely breakdown of remote
sensing outputs or weights of these outputs that were able to best replicate and identify
areas within similar threshold values. The initial combinations looked at applying equal
weights to the different remote sensing outputs, however, it was seen that slope was the
most effective at isolating potential rock art site locations.
The initial weightings were also set to exclude background values from the model because
they occurred outside of the threshold range. However, a problem encountered was that the
slope threshold was excluding too many areas from the output model. Due to the critical
nature of the slope threshold, it was decided that it needed to be expanded to include a
wider range of slope values. The range of slope values that were mentioned in Table 4.2:
Breakdown of slope for MARA sites 72 is discussed in the coming subsection.
Inspecting the initial weighted output compiled on the data thresholds set out by the MARA
2012 site data, the predictive model analysed three different weightings to test the
effectiveness of the model. These weightings looked at the application of near equal
weightings to each of the remote sensing outputs (slope 34%, shaded relief 33%, and NDVI
33%). The second weighting looked at using the higher rate of discrimination of the slope
and gave equal values to the shaded relief and NDVI (slope 50%, shaded relief 25%, NDVI
25%), the final weighting looked at including the effect of aspect to see if it had any
relevance to the presence of rock art sites within the model (aspect 25%, slope 25%, shaded
relief 25%, NDVI 25%). These weightings were only possible with the expanded slope
threshold as excluding the background would classify only the areas within the slope
threshold. By expanding this threshold then allowed other variables to occur outside of their
initial thresholds.

77
4.7 Fieldwork
The research applied foot surveys to the Matatiele region under the auspices of the MARA
programme and these surveys covered a large portion of the region in a systematic fashion
from Qacha’s Nek border post towards the Ongeluks Nek border post. Although surveying
had taken place throughout this region there were still noticeable areas that needed
completion. Prior to 2012, surveyors were not required to log their tracks as part of the
MARA mandate. The track logs are what constitute the surveyed areas and as can be seen
in Figure 9.1: 153 there were areas that had no track logs with known site locations.
The database used to model consisted of 106 rock art sites of which 80 could be classified
as high lying – located in the valleys below the escarpment – and a further 20 sites – located
in low lying areas. These low lying areas are not within the valleys below the escarpment
and therefore, provide a diverse sample that can be used to model. These 106 rock art sites
were located up to the end of December 2013.
MARA sites prior to 2012 were located using ground survey teams working in a systematic
manner walking up and down both sides of a valley in an attempt to locate rock art. During
2012 the introduction of a Google Earth derived survey method was used to identify areas
that looked promising for rock art sites. Thereafter, the MARA programme moved away from
the intensive walking survey to a more focused survey trying to identify areas that could
contain rock art sites based on features identified in Google Earth (Pugin 2012).
Subsequent to this, the MARA programme employed a local survey team to continue the
survey throughout the area and this team was able to cover a substantial portion of the
research area. However, the survey tracks were accidentally overwritten on the GPS and,
therefore, some gaps still exist. Fortunately, some tracks were saved and are displayed in
Figure 9.1: 153.
Upon the development of a successful model, this research looked at surveying areas
adjacent to previously surveyed regions (yet to be surveyed but were seen as having the
potential for possible rock art site locations). The adjacent areas included regions with high
and low potential to determine if rock art sites occurred outside of the threshold range. By
locating sites outside these thresholds allowed for adjustment before applying the model to
Sehlabathebe.

78
The survey data from the UNESCO World Heritage Survey within Sehlabathebe National
Park, Lesotho provided an opportunity to test an area that had been surveyed exhaustively
by the survey teams in order to locate all the rock art within the park.
4.8 Conclusion
The methodological process led to the production of a model that is able to predict a
percentage of known rock art site locations. Whether this model is able to predict further
possible site locations is where it will succeed or not. Remote sensing has been successful
and shown that individual components have assisted in identifying areas that do contain
known rock art sites. Initially, slope and geology were identified as the main indicators of
rock features like boulders, rock shelters and overhangs. However, the inclusion of data
such as NDVI, shaded relief have aided this process and added extra components that
discriminate areas that have low potential.
The exclusion of the geological maps due to limited spatial resolution and the supervised,
unsupervised classifications could have impacted negatively on this study, but the other
components were more than effective in identifying the areas of interest. The geological
map combined with slope provided positive results and was able to identify areas that were
initially identified as problematic. Although it was able to achieve these results there can be
no guarantee about the accuracy and resolution of the geological data and therefore, it could
not be included. Future predictive models could include geological data, provided the
resolution was at an acceptable level and if it had the required accuracy. In that case, it
would be successful.
Initial results of the output data indicate certain trends and early results show that certain
processes are more effective than others. Initial expectations were that some processes
were more beneficial than they actually were as is the case with the supervised and
unsupervised classifications. Conversely, assessing an aspect of the sites and using
similarities of the two research areas may shed light on local site preference.

79
Results
Rock art sites may occur within similar rock features, however, there are numerous sites
that do not contain rock art at all. Therefore, any understanding that can be achieved as a
result of the findings of these models would be of great value to rock art research.
Thresholds calculated for the MARA 2012 database were used as a starting point for all
modelling procedures. The testing of the models was done using the known site locations
to identify the percentage of sites that occur within predicted areas. The distribution of rock
art sites against the different weighted output models for the MARA 2012 database allowed
for the identification of the thresholds, which were used and contributed towards the
improvement of the models being applied to the other research areas.
Initial thresholds were amended to allow for the positive identification of rock art sites within
the MARA database and then the thresholds were applied first to Sehlabathebe National
Park and then to surrounding random areas as a further test.
Breaking down the individual remote sensing components provides insight to how the
distribution of sites could be affected by the thresholds of the dataset and, therefore, adjust
them accordingly before being applied further. The individual remote sensing outputs that
are assessed include slope, shaded relief, NDVI, and aspect for each dataset/research area
starting with the MARA 2012 dataset, then focusing on the resultant MARA 2013 results,
and finally looking into the effects of each remote sensing output for Sehlabathebe National
Park. The differences in each characteristic were assessed to see how the distribution of
sites vary across the different research areas whilst paying particular attention to how these
values differ from the original values of the MARA database.
This was followed by the comparison of the research areas and how these characteristics
for each model contributed and affected the success or failure of this research. Finally, the
combined threshold dataset is analysed against 31 random site locations in the vicinity of
Sehlabathebe to test the regional variability of this research.
80
5.1 The Individual Thresholds
5.1.1 MARA Database
The distribution of rock art sites across the MARA research area displays the distribution of
the MARA sites against different terrain categories. A large percentage exist in areas below
the escarpment as well as many others in lower lying areas and this demonstrates the
distribution of known sites overlaid against the painted relief. This representation shows the
importance having site data in order to calculate the thresholds of sites throughout the
different mountainous terrain. The painted relief map is overlaid with all MARA sites found
prior to or as part of this research.
The model assisted with identifying three major regions for surveying; Phuting, New Stands,
and Military Hill; all of which have high site densities. Although these regions would have
been surveyed as part of the systematic survey, based on the output predictions, these
areas were prioritised for surveying sooner than they would have been surveyed if the
original methods were still in place.
As proof of the findings of the predictive models, some of the findings of the subsequent
surveys are placed in the appendices.
5.1.2 Slope
By using the MARA sites as of 2012, a representative sample distribution of 106 rock art
sites were used to analyse the occurrence of known rock art sites against an area likely to
contain other rock art sites. The application of the aforementioned threshold equation
(Equation 4.1: 65; Equation 4.2: 65), afforded the research the opportunity to determine the
slope that refers to areas that correspond most with areas with known rock art site locations.
Therefore, replicating areas that are most relevant based on environmental characteristics.

81
MARA 2012 MARA 2013 MARA Combined
Mean 19.63 19.45 19.57
Standard Deviation 7.39 5.97 6.93
Threshold Minimum 12.24 13.48 12.64
Threshold Maximum 27.02 25.43 26.50
Minimum 1.41 7.22 1.41
Maximum 38.47 31.17 38.47
Table 5.1: Slope values for the MARA research areas.
The range of slope values from the different datasets within this research, show that the
MARA 2012 database is and was representative and provided an acceptable initial slope
threshold range for the other sites to occur within (Table 5.1: 81). The presence of rock art
sites shows the relevance of this threshold Figure 9.14: 166.
Due to its larger standard deviation, the initial threshold accounted for the sites located
during 2013. This broad range was an acceptable base and included a percentage of
outliers that broadened the standard deviation. The 1.5 expansion to the slope threshold
was a good adjustment that included an increased percentage of sites (Figure 9.15: 167).
Prior to the expansion, slope was discriminating acceptable values that were of relevance
to rock art site locations.
Initial thoughts and expectations were that slope values would not be constrained by a
maximum threshold, however, depending on the area and the topography, the values of
slope are determined by the overall terrain. The slope threshold is determined by the
standard deviation and therefore, certain steeper values will be excluded from occurring
outside of the target threshold. The slope is the main constraint for where rock art sites can
occur as rock shelters require a slope to be eroded in order for the overhang or shelter to
occur.
The presence of steeper areas within the Alluvial Formation is one such way the slope
output excels at limiting areas with the right terrain features. The majority of the area shows
the underlying painted relief output which reflects areas with a slope value of less than
4.980°, which includes flat areas synonymous with flat alluvial plains.
The second component to consider is the data range that is selected by the slope threshold,
these values are reflected by the red and purple values, whereas the blue values show the

82
varying degrees of slope that are excluded by the slope threshold. The majority of sites in
this area fall into the threshold values set out by the slope slice (Figure 9.15: 167).
The data slice for slope removes a substantial portion of the research area based on the
statistical breakdown, these areas are, therefore, less likely to contain rock art.
Areas below the escarpment are steep enough to be considered within the threshold,
however, the alluvial plain discussed previously, which is reflected by the substantial white
area, (Figure 9.15: 167) and is excluded because it is flat or near flat and has no sudden
changes in slope indicative of areas with possible site characteristics.
The slope slice was the biggest discriminant because the thresholds identified were able to
exclude the majority of areas which were unlikely to contain rock art sites (Figure 9.15: 167).
The areas that are excluded are all areas with values that occur outside the slope threshold
and these include all flat areas, along with the extremely steep sided values that could
potentially contain rock art sites.
The expansion to the slope slice allowed for further discrimination without excluding the
crucial areas that are seen to correspond with rock art sites (Figure 9.15: 167). The
expansions also discriminated flat areas that are of little importance to the research. The
slope slice was one of the only variables to exclude background data because the expanded
threshold covered an adequate range.
5.1.3 Shaded Relief
The second characteristic assessed is the shaded relief and this displays a different trend
when compared to the slope thresholds. This is because the MARA 2012 dataset has a
greater mean value and a smaller standard deviation compared to that of the MARA 2013
sites (Table 5.2: 83). The combination of the MARA databases does, however, provide a
sample which is adequate for areas below the escarpment of the Maloti-Drakensberg. The
higher mean for the MARA 2012 dataset relates to a higher maximum threshold, which
exceeds that of the MARA 2013 sites. The MARA 2013 values do not differ drastically from
the MARA 2012 dataset and when combined to see the entire MARA dataset reflects how
similar the two datasets are.

83
Table 5.2: Shaded relief values for the MARA research areas.
MARA 2012 MARA 2013 MARA Combined
Mean 1009.75 936.68 985.40
Standard Deviation 314.43 336.48 322.73
Threshold Minimum 695.33 600.20 662.66
Threshold Maximum 1324.18 1273.16 1308.13
Minimum 398.00 351.00 351.00
Maximum 1716.00 1540.00 1716.00
The shaded relief slice displays how the shaded relief can be used to discriminate areas for
rock art potential (Figure 9.16: 168). The majority of sites occur within the threshold, and
the threshold excluded areas above the escarpment, which is based on the threshold values
all occurring below the escarpment. However, the minimum and maximum values do not
occur within the range, and therefore, this contributes towards the inclusion of the
background data.
This threshold does limit the specific areas from the model but not to the same extent as
the slope threshold. Due to the presence of sites within a broad range, the model included
the background data of the shaded relief threshold. These areas are optimised by
incorporating the other remote sensing components.
5.1.4 NDVI
Although the MARA 2013 has a broader threshold, it is based on the occurrence of rock art
sites in areas with higher NDVI values thus contributing to the greater maximum values and
greater maximum threshold values.
There are a few possibilities for the slight variations between the different datasets. Firstly,
the MARA 2012 dataset is composed of sites that occur in lower lying areas some of which
could occur in barren areas or areas with poorer vegetation. Allowing for the lower minimum
values, of the NDVI threshold. Secondly, the MARA 2013 dataset has some of the higher
NDVI values for the research and this is due to the sites found in the vicinity of black wattle
forests and clumps of trees adjacent to the rock shelters (e.g. Malithethana Source 6).

84
Table 5.3: NDVI values for the MARA research areas.
MARA 2012 MARA 2013 MARA Combined
Mean 0.25 0.46 0.32
Standard Deviation 0.08 0.10 0.14
Threshold Minimum 0.16 0.37 0.18
Threshold Maximum 0.33 0.56 0.45
Minimum 0.00 0.07 0.00
Maximum 0.69 0.66 0.69
These greater values also increase the mean of the MARA 2013 dataset substantially.
These maximum values add to the representative nature of the combined dataset, therefore,
expanding the likelihood of a predictive model identifying areas that occur closer to the
extents of the threshold.
Based on the above thresholds, the NDVI slice was less critical at excluding areas than the
slope slice, because the NDVI threshold that was used to create the NDVI slice covered a
broader range of values (Figure 9.17: 169). The majority of NDVI values largely exist within
or near the extents of ranges set out by the maximum and minimum threshold. The majority
of areas that were excluded were steep areas that coincide with Lesotho Highland Basalt
Grassland, which occurs on the slopes of the escarpment. These areas have exposed
Drakensberg Basalt Formation or soil with little or no vegetation cover that has reflected low
NDVI values.
The NDVI thresholds show that areas adjacent to the escarpment fall into the maximum
extent of the threshold, whereas the minimum threshold exists more above the escarpment
and in further low lying areas below the escarpment. The NDVI slice does not discriminate
areas as much as other processes because of the vast range of values that occur at the
sites. However, due to the minor correlation that exists it does contribute towards the greater
model. The data slice for the NDVI excluded fewer areas than other processes, such as
slope, due to the NDVI’s broad ranging threshold. Therefore, the values of the NDVI
threshold needed to cover this broader spectrum and focus on the mean and less on the
data extents.
The NDVI extended threshold was a supplementary approach that was used to increase
the predictive potential of the output model and second; to increase the areas discriminated

85
as part of the model (Figure 9.18: 170). By expanding the maximum and minimum
thresholds by 150%, this includes a broader spectrum of values. By applying this slice along,
with excluding background data during the weighting procedure incorporated more relevant
areas but excluded areas that were of little potential.
Comparing the differences between the thresholds of the MARA 2012 and 2013 area
discrimination, the MARA 2013 dataset discriminates areas based on the greater threshold
values. The areas that are represented in the MARA 2013 threshold occur in regions that
contain rock art sites as can be seen in (Figure 9.6: 158). The MARA 2013 slices
discriminated areas that are unlikely to contain rock art, such as the alluvial plain (Figure
9.3: 155; Figure 9.4: 156. Although NDVI covered a wide range of values, the major part of
the area discrimination occurred when combined with the slope slice to exclude areas of
little relevance.
5.1.5 Aspect
Aspect initially was identified as a component that varied substantially and was of little use
to this research for predictive purposes. However, the distribution of sites is valuable as it
can lend to the discussion surrounding seasonality and provide an idea as to when certain
rock art sites may have been used. The aspects that fall within an acceptable range between
the mean and the standard deviation demonstrate the areas that are considered favourable
for occupation. The possibility of seasonality and seasonal occupation will be discussed
further in the ensuing section.
Table 5.4: Aspect values for the MARA research areas.
MARA 2012 MARA 2013 MARA Combined
Mean 152.69 123.78 143.05
Standard Deviation 97.79 92.51 96.74
Threshold Minimum 60.17 54.90 46.31
Threshold Maximum 245.20 250.48 239.79
The aspect slice is selective but includes the vast majority of the MARA research area
(Figure 9.19: 171). The threshold includes most of the valleys, as the majority of the valleys

86
head south-east and have sites that occur on either side of the valley which face north east
or south west. The aspect slice does exclude just over half of the possible aspects.
The aspect threshold for the MARA region could provide some interesting points to discuss.
The mean aspect of 143° could suggest that there is a possible preference to paint in rock
shelters with a south easterly facing. The possibility of seasonal site usage could be
discussed further as certain aspects could have been preferential at certain times of the
year, but not others.
It was thought that aspect would have an effect but only in specific areas and that is based
on the nature of the terrain and position in relation to the escarpment. Comparisons for the
aspect between the MARA research area and Sehlabathebe should either support or
contradict this claim.
5.2 The Predictive Model based on MARA 2012 dataset
The modelling stage involved testing multiple different combinations of components to
determine which was the most successful. Success is determined not only by the
percentage of sites successfully identified but also the portion of research area excluded.
Therefore, a model that successfully identifies a high percentage of sites but fails to
discriminate other areas from surveying is considered a failure.
The threshold (Figure 5.1: 87) was hypercritical and needed broadening to be practical. The
initial model discriminated the majority of areas and needed improvement because of its
poor predictive potential and inability to locate known site locations. Subsequent to updating
the slope threshold the weighted output for the MARA research area was reapplied in the
Model Output 2, the update to this component of the weighted output improved the amount
of known sites located within areas of potential from 22% to 51.4%.

87
Figure 5.1: Model Output 1 with near equal value weightings and individual remote sensing
components background data negated, white background reflects areas with null values.

88
The two expansions that were applied to the slope thresholds were meant to increase
the likelihood of rock art sites occurring within the threshold. By doubling the standard
deviation of the slope, the threshold range was too broad as it included values as small
as 1.627771 and provided ‘blanket coverage’ of the region, identifying far too many areas
to possibly survey based on potential.
To isolate areas of steepness (Figure 5.2: 89) demonstrated the lack of effectiveness at
identifying and reducing areas that required surveying, due to the broad threshold
selected.This slope threshold was successful at identifying 98% of known rock art sites
because of the broader threshold, however, due to excluding background data, Figure
5.2 was only able to identify 51.4 % of the sites.
The Model Output 2 Figure 5.2: 89 emphasised the need for an intermediate slope
threshold and secondly, the need to include background data or to expand the shaded
relief and NDVI thresholds to the same degree as that expansion applied to the slope.
Although it was thought that the slope was the main reason for this poor distribution, it
was discovered that it was, in fact, the exclusion of background data. The lack of sites
predicted is a result of site threshold values occurring within one or two of the remote
sensing components but the third value occurred outside the range and, therefore, was
excluded. Identifying which dataset values occurred outside of the range allowed for
future manipulation, thereby increasing the success of the other model equations.
The third version of the MARA output turned out to be more successful as it focused on
a smaller slope threshold (8.63°-30.61°) and included the background data for the NDVI
and shaded relief slice but assigned lower values for areas occurring outside the
thresholds. The MARA output model was able to identify an improved percentage of sites
as it located 69.8% within areas of high potential and a further 16.9% if the sites occurred
within lower potential areas, which is a substantial improvement on the 51.4%. The
improvement in the slope threshold allowed for this increase in the final output model and
facilitated the exclusion of a substantial portion of the research area.

89
Figure 5.2: Model output 2 with doubled slope thresholds and individual remote sensing components
background data negated, showing so called ‘blanket coverage’, white background reflects areas with
null values.

90
By analysing the distribution of sites against the different models, the shortcomings of
the individual models were identified and improved upon. Although the intention was to
identify the best possible thresholds based on the initial MARA 2012 data, the occurrence
of sites outside of these thresholds is welcomed as they expand the threshold range and
improve the likelihood of future sites falling into these thresholds.
Although all the models delineated areas of potential, it was of relevance to identify which
set of thresholds returned acceptable results for future predictions. It was also noted that
due to the exclusion of the background data for both shaded Relief and NDVI, this
contributed to this model only identifying 51.4% of sites. The Output Model 1 was seen
as a failure as it was only able to positively identify 22% of the sites, and second, it
discriminated a large portion of the research area.
The Model Output 3 (Figure 5.3: 91) was reliant on the thresholds that were expanded
and excluded for modelling processes. This allowed for a more streamlined approach
that took into account the broad nature of values for both NDVI and shaded relief.
Excluding the background data of the slope allowed for the threshold to be maintained
without disturbing the output with fuzzy results that could obscure the final model.
Applying a 1.5 expansion to the thresholds of NDVI and shaded relief was tested in the
next version of the output model, in an attempt to reduce the areas of potential.
By applying increased weightings to areas with values that occur within the NDVI and
shaded relief thresholds, Model Output 7 effectively discriminated areas by selecting the
least pixels of the models and positively identifying 68.98% of the MARA 2012 rock art
sites (Figure 5.4: 92). Although the objective was to use the expanded thresholds of the
NDVI, the background values were important to contribute towards the larger success of
the model.
The expansion of NDVI values contributed towards the improvement in the model,
however, by expanding NDVI in a similar fashion to the slope would allow for more areas
of potential to be included, but by excluding the background data, more unwanted areas
should be removed.

91
Figure 5.3: Model Output 3 with the 1.5x threshold for slope, individual remote sensing components
background data negated, white background reflects areas with null values.

92
Figure 5.4: Model Output 7 with expanded slope and NDVI thresholds, white background reflects areas
with null values.

93
On completion of the different models, additional surveying was completed. This further
surveying added a further 54 rock art sites to the MARA database and this comprises the
MARA 2013 dataset. Some of these sites were located using the predictive model to
identify areas of potential whilst others were added through systematic surveying.
The success of the different models is displayed in Table 5.5: 94.This shows how each
model performed at identifying sites with known characteristics that comprise the MARA
2012 dataset as well as sites with unknown characteristics from the MARA 2013 dataset.
The representation of site distribution demonstrates the effectiveness of each model and
shows the likelihood of identifying unknown site location in the future. By analysing the
values of the sites located, the following sections will elaborate on the site threshold
values for slope, NDVI, and shaded relief in an attempt to rectify or adjust the thresholds
to accommodate for the most likely characteristics that are synonymous with rock art site
locations. According to the distribution of sites, the Model Output 9 was the most effective
at identifying possible site locations but negated no areas. A few of the other models
offered similar results, but the Model Output 10 and Model Output 3 identified the second
and third highest percentage of the sites and both discriminated a high portion of the
area. These models were then applied to Sehlabathebe National Park.

94
Table 5.5: Breakdown of the initial output models.
Model Name Subclass
Percentage of
MARA Sites
Idenitified
Total pixels
predicted as high
likelihood
Percentage of reserarch
area identified as high
potential
2012 2013 2012 2013
Model Output 1 25 13 23.58 24.07 23.75 34386903.00 35.25443425
Model Output 2 34 20 32.08 37.04 33.75 14939970.00 15.31688358
Model Output 3
Lower
Potential 18 5 16.98 9.26 14.38 33070168.00 33.90447995
Higher
Potential 74 40 69.81 74.07 71.25 13196800.00 13.52973595
Model Output 4 47 28 44.34 51.85 46.88 93080432.00 95.4287151
Model Output 5 47 28 44.34 51.85 46.88 93080432.00 95.4287151
Model Output 6 25 13 23.58 24.07 23.75 37671149.00 38.62153697
Model Output 7
Lower
Potential 21 9 19.81 16.67 18.75 52625785.00 53.95345655
Higher
Potential 71 38 66.98 70.37 68.13 11234970.00 11.51841185
Model Output 8 57 35 53.77 64.81 57.50 11177827.00 11.45982722
Model Output 9
Lower
Potential 23 8 21.70 14.81 19.38 75509485.00 77.41447882
Higher
Potential 83 46 78.30 85.19 80.63 22029743.00 22.58552118
Model Output 10
Lower
Potential 15 2 14.15 3.70 10.63 25080372.00 25.71311309
Higher
Potential 76 44 71.70 81.48 75.00 13995780.00 14.34887305
Sites Predicted
Percentage of sites
positively
identified by model

95
5.3 Predictive model vs SNP
Applying a predictive model formulated below the escarpment and attempting to apply it to
a region that is dissimilar was always thought to be an issue as the likelihood of thresholds
for rock art are based on the environment that the sites occur within. The difference with
Sehlabathebe is that this area occurs above the escarpment but as an outlier with rather
flat slope values, higher shaded relief values and similar NDVI values. Modelling for rock
art is dependent on a good starting range of thresholds. Three of the most successful Model
Outputs from the MARA research area were selected to model for the presence of rock art
within the park.
The ARAL survey of Sehlabathebe located approximately 65 rock sites within the park and
it was hoped that the application of one or more of the Model Outputs were successful at
assisting the research team in identifying the areas of interest. However, surveying the park
as part of the UNESCO World Heritage Survey discovered a total of 105 rock art sites. The
Model Outputs success rates were determined based on the percentage of sites located
within areas of high potential in the same manner that was applied to the MARA research
area.
The three most successful Model Output (Model Output 3, 7, 10) combinations from the
MARA research area were applied to Sehlabathebe National Park, to map areas of potential
for containing rock art sites. The first Model Output that was applied to the national park
performed adequately identifying 70 of the 105 (66.66%) within areas of moderate or higher
potential areas (Figure 5.5: 96). The Model Output struggled to identify sites outside of the
thresholds due to the occurrence of rock art sites on shallower slope values within the park.
The SNP Model Output 2 (Figure 5.6: 97) performed similarly to the SNP Model Output 1
as it also identified 70 of the 105 rock art sites, however, SNP Model Output 2 classified 69
of the 70 sites as higher potential. The model also disregarded the shallower slope values
that were classified as outside of the expanded threshold. Finally, SNP Model Output 3
(Figure 5.7: 98) illustrated the improvement required, as it identified an increased amount
of sites. The SNP Model Output 3 positively identified 76 of the 105 rock art sites as high
potential areas and a further 29 rock art sites in lower potential areas. Nonetheless, these
lower potential areas include all areas that do not correspond with the thresholds of the
Model Output.

96
Figure 5.5: SNP Model Output 1, white background reflects areas with null values.

97
Figure 5.6: SNP Model Output 2, white background reflects areas with null values.

98
Figure 5.7: SNP Model Output 3.

99
5.3.1 Slope
The Sehlabathebe National Park sites slope range is much more varied because of the
gentle terrain and gradual slope throughout the park. However, certain parts of the park still
display signs of sites occurring in steep areas a factor that is illustrated by the larger
standard deviation. An observation taken from Sehlabathebe shows the occurrence of large
boulder fields to the Northeast of the old lodge which occur in reasonably flat terrain.
Photo 5.1: Image showing nature of terrain northeast of the old lodge, Sehlabathebe. Photo: James Pugin 2015
The general trend is that the majority of sites occur in areas that are not as steep, this is
reflected by the lower mean value (16.08° compared to 19.56°). Although some slope values
occur outside of these ranges, these ranges have been identified as a diverse sample for
mountainous areas with similar characteristics to the Maloti-Drakensberg.
Although the range of sites for Sehlabathebe falls outside of this range, this is expected as
the sites are located on the escarpment whereas the MARA sites are below. A change in
slope threshold between the original MARA dataset to the Sehlabathebe dataset is seen in
the model as certain areas were excluded from the model due to the thresholds identified
for the MARA region. Better modelling procedures require better thresholds for the area in

100
focus because thresholds based on other areas exclude certain areas based on the initial
thresholds.
5.3.2 Shaded Relief
The shaded relief threshold values for Sehlabathebe exceeded the ranges of all the MARA
values, with certain of the Sehlabathebe values occurring within the MARA thresholds. The
maximum threshold values exceed the values of the MARA threshold. The higher values
could tentatively be associated with the higher proportion of sites in higher elevation regions.
This change in range values contributed to the overall model’s success rate within
Sehlabathebe National Park and would account for the higher proportion of rock art sites
occurring outside of the predicted areas. This is rectified by including the background data
of the shaded relief as rock art sites within Sehlabathebe occur over a broader range of
shaded relief values.
5.3.3 NDVI
NDVI is the least varied characteristic throughout the different research areas and seems
to be comparable for the MARA 2012, MARA Combined and SNP datasets. The NDVI
values for Sehlabathebe (0.14-0.44) are less broad and occur within the values of the MARA
(0-0.69) research area. The distribution of sites with higher NDVI values for the MARA
research area are related to the occurrence of rock art sites within invasive Black Wattle
forests.
5.3.4 Aspect
Aspect may offer very little predictive power, but it is of use in determining the common
trend that exists between the two research areas. The mean aspects for the MARA and
SNP research areas have very similar aspects (143° and 145° respectively). The preference
in the two areas is to paint mainly in sites with a south easterly aspect. Although most of the
sites occur between north east and south west, the similarity might be based on the general
drainage basin and the prevailing direction of run off.

101
5.4 Predictive model vs random SARADA Rock Art Sites
A final testing component of the research involved testing the most successful predictive
models in areas that are unrelated to both the MARA research area and Sehlabathebe
National Park. The research was tested against 31 rock art sites in the vicinity of Underberg.
These sites fall into a similar terrain that are found in the MARA research area, therefore, it
would be interesting to compare how a threshold derived from rock art sites located below
the escarpment fares up against the general threshold developed throughout this research.
The three models that were applied to Sehlabathebe National Park were then applied to the
surrounding areas with known sites locations. The three models were successful at
identifying sites, however, the third model was the most successful identifying a higher
percentage of rock art sites but also the least effective at discriminating the areas.
Model Level of Potential
Sites per
class
Percentage of
sites identified
Combined
Percentage of
sites identified Total Pixels
Area of No Potential 7 22.58
Low Potential 0 0.00 1287666.00
Moderate Potential 11 35.48 30317354.00
High Potential 13 41.94 77.42 8501069.00
Area of No Potential 7 22.58
Low Potential 5 16.13 2836541.00
High Potential 19 61.29 77.42 37269548.00
Low Potential 5 16.13 14763300.00
High Potential 26 83.87 100.00 43656565.00
Furt
her T
est 1
Furt
her T
est 2
Furt
her T
est 3
Table 5.6: Comparison of test models
Furthermore, Further Test 1 and Further Test 2 identified the same overall percentage of
rock art sites for areas of no potential. Additionally, Further Test 2 identified more sites in
areas of higher potential. Although both models identified the same amount of sites the
Further Test 2 model identified a larger amount of pixels.

102
In a similar fashion to the models applied to Sehlabathebe National Park, the models are
applied using the same parameters and therefore excluded areas in the same fashion. The
Further Test 3 model was the most successful as it identified 83.87% of the test sites.
However, it was not extremely critical at discerning areas of potential and due to the
threshold parameters and including the background data, no areas were excluded, which
resulted in a higher amount of pixels identified.

103
Figure 5.8: Further test 1, white background reflects areas with null values.

104
Figure 5.9: Further test 2, white background reflects areas with null values.

105
Figure 5.10: Further test 3

106
5.5 Conclusion
The research presented here set out to measure the percentage of possible shelters or
possible rock art site locations that could contain rock art instead of judging against a
number of sites found. However, it was found it is better to judge it on the percentage of
rock art that falls into predicted high potential areas. By applying the predictive models in
more than one area, this research was able to determine the different conditions that affect
these models and thus rectify these issues and identify the best threshold ranges to identify
the majority of promising areas for containing rock art. The testing of these models in three
different areas adds to the strength and adaptability of these models.
Owing to the nature of the formula and principle of standard deviation, only 68.2% of sites
fall into the first deviation. Therefore, it was dependent on the inclusion of background data
in order to improve the percentage of sites occurring within the threshold range. In all
likelihood, sites should and will occur outside of these thresholds and accounting for these
outliers is a demanding task.
Determining the possible rock art site locations is a limitation of this research.
Understandably, the surveyors can only judge rock art site likelihood by the availability of a
rock panel within a rock shelter, which could contain rock art.
Initial thoughts were that the model was applicable to areas below the escarpment and
another model was needed for areas above the escarpment. However, by applying the
model to Sehlabathebe National Park, and regions surrounding both Matatiele and
Underberg, allows this model to test and refine the thresholds on an expansive area.
Applying the model to steeper areas predominantly covered in basalt formation may require
some further changes to thresholds but at this stage, the models should be applicable to
areas along the Maloti-Drakensberg as long as the values occur within similar thresholds.
107
Discussion
This study demonstrates the potential of predictive models to rock art studies and
archaeology whilst particularly demonstrating their effective application to rock art studies.
Although the model focuses on the landscape aspects of rock art research, site locations
are inherently situated within this landscape and the approach identifies the characteristics
of the landscape that correspond most with known rock art locations. Owing to the range of
features that contain rock art sites, this method is capable of identifying the thresholds that
are pertinent to housing rock art sites.
This discussion interprets the findings of the research in order to determine whether the
research is successful or not. The interpretation will look into how the results were
formulated and explain what the results mean, how they can be improved, consider whether
the aims of the research were achieved, and to make recommendations for future research
to consider.
6.1 Components that were tested but excluded
There were several remote sensing components that were tested as part of the research
and excluded either due to a lack of relevance, resolution, or assisting with predictions
effectively. These components could have been included in the model but due to one or
more of these aforementioned problems would have impacted on the overall predictions
and, therefore, decreased the effectiveness of the model. The excluded components were
the following; aspect, supervised classification, unsupervised classification, and geological
maps. Delving into greater detail will explain why these specific components were excluded.
6.1.1 Aspect
Aspect was excluded due to the large degree of variance that occurs between the different
rock art sites. However, unlike the other variables, aspect has shown potential not for
predictions but rather for understanding possible site usage patterns and seasonal use or
occupation of specific rock art sites. Due to the large variance that occurs, predictions that
included aspect excluded some areas of potential just based on the direction that the site
faced.

108
6.1.2 Supervised and Unsupervised Classification
Both classifications offered little assistance to predictions as they lacked the ability to
accurately distinguish potential rock art sites from other areas of no potential. By failing to
accurately locate rock art sites on their own, there was little point obscuring overall predictive
results by including these classifications in the predictive model setup.
6.1.3 Geological Map
A remote sensing component that certainly has the potential for future predictions is the use
of accurate geological maps to aid with predicting sandstone locations. The 1:250 000
geological map that was georeferenced lacked the resolution to accurately discern whether
areas of the map were Clarens Formation sandstone or Elliot Formation sandstone,
although this may not be a problem for a geological map, detailed predictions that rely on
accurate data would suffer as a result. The inclusion of high resolution geological data is a
component that can contribute towards predictive modelling in the future as long as the
spatial resolution is similar to the other remote sensing components.
6.2 The different predictive models
As part of the analysis, different model combinations will be discussed to determine their
relevance for rock art surveys, whilst looking at the individual success rates of each model.
Model Outputs 1-5 were applied using the initial MARA 2012 database and subsequent to
further surveying the data thresholds were amended to include the thresholds that were
formulated from the entire MARA database. The adjusted thresholds included a large range
of NDVI and shaded relief values, which were included in Model Output 6-10 and the SNP
Models.

109
6.2.1 MARA Models
6.2.1.1 Model Output 1
The first version of the predictive model looked at including equal valued components that
would not include any user bias. Like the following two models, the Model Output 1 was set
to exclude background data that was comprised of values which occurred outside of the
thresholds identified. This model lacked the predictive ability due to the majority of sites
occurring outside of at least one threshold as this model output was too critical.
6.2.1.2 Model Output 2
The second version of the predictive model looked at including double the thresholds that
were identified in the hope of increasing the success of the model. This model provided
‘blanket coverage’ of the region and was thought to have predicted the majority of rock art
sites but similarly to Model Output 1 the exclusion of background data once again impacted
on the amount of known rock art sites identified by the model.
6.2.1.3 Model Output 3
Model Output 3 was the first version of the predictive model to include background data
(values that occurred outside of the thresholds) for two components the NDVI and shaded
Relief, as well as, an expanded slope threshold. This model immediately improved on the
success rate as it was able to identify 69.81% of rock art sites within high potential areas
and a further 16.98% of sites within lower potential areas. The model was able to effectively
discriminate areas of higher and lower potential as it identified a total of 13196800 pixels
within the MARA research area as areas of high potential. The MARA research area
contained a total of 97539228 pixels, therefore, this model identified 13.5 percent of the
entire research area as having the potential for rock art sites.

110
6.2.1.4 Model Output 4 and 5
Model Output 4 and 5 looked at including an expanded slope slice but excluding the
background data of all the components in an attempt to increase the areas discriminated by
the model, but failed due to a lack of sites occurring within areas of high potential.
6.2.1.5 Model Output 6
Model Output 6 failed to identify rock art sites but did include the combined thresholds of
the MARA database for shaded relief and NDVI. However, once again the exclusion of
background data caused the model to fail.
6.2.1.6 Model Output 7
This version of the predictive model attempted to include the background data of the shaded
relief and NDVI but not the background data of the extended slope. This combination proved
successful in identifying 66.98% of MARA 2012 rock art sites and 70.37% of the MARA
2013 rock art sites. The model was effective at discriminating areas of potential and
identified a total of 11234970.00 pixels.
6.2.1.7 Model Output 8
Model Output 8 looked to build on the success of the previous model by incorporating
extended slope and NDVI thresholds and in the process excluding background data. This
combination was successful (identifying 53.77 % of the MARA 2012 sites and 64.81% of
the MARA 2013 rock art sites) but not to the same degree as the previous model.
6.2.1.8 Model Output 9
In a similar manner to the Model Output 2, this model looked at trying to identify all sites but
without discriminating areas of potential. By including all background data of the remote

111
sensing components and extended thresholds for slope and NDVI, Model Output 9
successfully identified 78.3% of the MARA 2012 rock art sites as high potential areas and
a further 21.7 % of the sites as occurring within areas of lower potential. Results for the
MARA 2013 sites increased because this model was able to identify 85.19% in high potential
areas and a further 14.81% of sites within areas of low potential.
6.2.1.9 Model Output 10
The final Model Output that was applied to the MARA research area included the extended
NDVI threshold and background data, the extended slope threshold without background
data and the shaded relief threshold including background data. The Model identified 71.7%
of the rock art sites as high potential and 14.15% as lower potential for the MARA 2012
database. Assessing the results for the MARA 2013 database showed an increase as
81.48% of sites occurred within high potential areas and 3.7% of the sites occurred within
lower potential areas.
6.2.2 SNP Models
The SNP models were formulated using the data derived from the MARA database and
predictive models that were applied to the research area. However, because of the location
of SNP and the success of models that included the background data, the initial thresholds
that were applied to SNP were set to include background data. The three models that were
tested were the three most successful models from the MARA survey area.
6.2.2.1 SNP Output 1
By assigning equal values to the remote sensing components and including all background
data except that of the slope background data. This version of the predictive model is based
on Model Output 7 from the MARA research. This model performed adequately and
identified 70 of the 105 rock art sites within the SNP.

112
6.2.2.2 SNP Output 2
Continuing the exclusion of the slope background data, the SNP Output 2 model included
background data for the shaded relief and NDVI. The model proved successful in identifying
rock art sites within SNP. Accurately identifying a total of 69 sites within areas of high
potential and a further site in low potential areas.
6.2.2.3 SNP Output 3
The final SNP model included the background data of all components and assigned lower
values to the background data to discern lower potential areas from areas of higher
potential. The distinction between higher and lower potential areas allowed for the
successful identification of 76 sites occurred within areas of high potential whilst the
remaining sites occurred within areas of lower potential.
6.2.3 Test Models
The final testing procedure was designed to test the regional applicability of the predictive
model and tested the model against 31 sites in similar environmental conditions to that of
the initial models.
6.2.3.1 Further Test 1
The first test model applied to the random sites identified 77.42% of the 31 rock art sites
and placed 41.9% of the sites within high potential areas. This model showed potential but
when applied to alternate areas it may struggle to identify sites within high potential areas.
6.2.3.2 Further Test 2
The second model based on the same components as the first model achieved the same
success rate but it had placed more sites into higher potential areas. This model placed

113
61% of the rock art sites within areas of high potential but in the process selected more
areas than Further Test 1 as high potential.
6.2.3.3 Further Test 3
The final model identified 83.87% of the rock art sites within areas of high potential. With
the overwhelming majority of rock art sites located by this version of the model, shows its
potential for being applied to regions with similar environmental conditions. By adapting the
threshold that contributes to this model, the regional variability could be further improved.
6.3 Was the research a success?
Initial observation of the success rate of the different predictive models shows that the
research is successful. This success is based on the data quality and could be improved in
a number of ways. The research had its limitations, and although it was successful,
improvements to specific remote sensing components would improve the spatial resolution
of the overall predictive model, as this would decrease the pixel size of the predictive model
and would have a positive effect on the predictions.
“Another way to assess the performance of a predictive model is to measure
its gain in accuracy over a random or null classification”. (Warren & Asch
2000)
Assessing a predictive model such as this can be problematic and whether or not it is
successful all depends on the testing procedure. Testing a model like this is based on the
testing criteria. In this case, cross validation was used for testing the initial model in three
different areas and then using the findings of these areas to manipulate the thresholds
strengthened the model and improved the accuracy of the overall research. With a
systematic rock art survey, there is an expectation of finding all rock art sites because the
surveyors will walk up and down a valley whilst checking all rock outcrops for the presence
of rock art (although supposed 100% systematic surveys are still capable of missing sites).

114
A model such as this cannot be expected to find and locate every rock art site – that is not
what it is designed to do – but it should put researchers in areas of higher likelihood more
quickly, and effectively reduce survey time and costs.
Interpreting the results of predictive models can be misleading in that these results could
show the influence of human agency, where in fact, rock art sites are located on rock
surfaces which are not necessarily an indication of the agency but rather a consistency in
regards to site choice.
6.4 What the results mean
In a simplistic manner, the results display how many sites fall into areas of high potential.
This should be a given seeing as the site locations are used to determine the areas of high
potential. However, owing to the use of multiple thresholds certain sites may be excluded
due to a specific threshold that the characteristics do not adhere to. This leads to sites that
were excluded and, in turn, reduced the size of potential areas, in those models. Therefore
classifying potential areas without the potential for rock art and, therefore, reducing the
amount of surveying. Therefore, by expanding specific thresholds, this problem was
rectified. Second, owing to the use of standard deviation as a method of determining
thresholds for the individual components, there is a percentage of sites excluded based on
the relevant values because the standard deviation only accounts for 68% of the sites.
Owing to the multiple testing procedures, that the predictive model was exposed to showed
the robust nature of the model, and the ability to be applied to alternate areas. Although
these areas differed in geographic location, they shared similarities and thus the model
proved successful. It is pointless applying this model to an area with no similarities to the
model as it would literally be attempting to predict sites in the dark.
The high percentage of sites found within the high potential areas of the test models shows
the value a model like this has for future research.
115
6.5 Limitations
Research must take limitations into consideration in order to progress and being aware of
how these limitations affect the research, and how to manage them, are crucial factors for
understanding how to improve.
6.5.1 Data resolution
In most cases data resolution is the biggest constraint of remote sensing research, and by
using Shuttle Radar Topography Mission DEM’s with a resolution of 1 arc second (c. 30m)
limits the resolution of the predictions. However, resolution of 30m pixels is still detailed
enough to render positive results through applications like slope and shaded relief. The
SRTM data was more than adequate for accurate predictions, however, higher resolution
digital elevation models would result in better discrimination of unlikely areas due to the
smaller pixel size of higher resolution data.
6.5.2 Site characteristics
Although the MARA database has a representative sample of sites that were used to model
for unknown site locations, the likely that every site will fall into this specific range is small
allowing for possible outliers. Rock art sites occur in a multitude of different locations, which
is a problem that can only be addressed by including all sites from a representative
environment. Therefore predictive models that are applied below the Maloti-Drakensberg
escarpment should use sites that occur throughout the region as this increases the
thresholds capacity to identify unknown sites. However, it need only include the regions that
have similar conditions as data from other areas would impede the success of the model.
6.5.3 Remote Sensing Thresholds
Based on the equation for determining the remote sensing thresholds, specific outliers were
excluded because of the standard deviation. Therefore stream-lining the sites that were
included and removing any outliers that could affect the integrity of the predictive model.
The standard deviation derived equation was used as an exploratory method for

116
determining the data thresholds and seemed to provide adequate results. Further
investigation into the exact threshold could have a positive impact on results.
6.5.4 Site Database
This representative data source was a prerequisite for modelling unknown rock art sites, as
the sample covers more variables than a smaller sample would. The sparse distribution of
sites throughout this area is owing to the nature of the initial survey, which was based on
local knowledge of rock art sites and then later surveys adapted the systematic approach
of walking up and down valleys. This technique of survey was able to locate the rock art
sites thus contributing to the higher density of rock art sites in the northern section of the
research area as can be seen by the two clusters of black dots depicting site locations.
The database was large and exceeded the usual 100 site prerequisite but because of the
unique nature of rock art sites and it is unlikely to account for every unknown site
characteristic. The presence of 106 sites at first proved useful but, as we have seen, there
are still sites that can occur outside of the threshold range. An example of this is the
presence of sites within the alluvial plain that comprised the MARA 2013 database as these
were located using the MARA 2012 database and were not accounted for, however, due to
slope thresholds they were identified. These sites occur within the alluvial plain although
within sandstone lenses on the sides of steep hills that occur throughout this region as can
be seen in the case of New Stands and Military Hill. Locating sites in unlikely areas such as
this is one of the strengths of the modelling procedure as it identifies areas with common
values that correspond to the thresholds identified.
6.6 How can the results be improved?
If better resolution data was to be used instead of the datasets used throughout this
research, it is likely to improve on the data as the thresholds could be manipulated better
due to smaller pixel sizes. Although the thresholds as is are able to determine the locations
of rock art sites, for example being able to determine the exact slope values of the near
vertical rock faces that contain the rock art sites. As is, the 30m slope is able to differentiate
areas of steep and shallow slopes, higher resolution DEM’s would be better suited to tease
apart these areas and offer an immediate improvement.

117
A speculative benefit of improved data resolution may not necessarily be associated with
the success rate of the model but rather the ability to discriminate a higher proportion of
areas from the regions that are likely to contain rock art. The higher resolution data might
also impact on the slope thresholds of the sites as higher resolution data would be better
suited to identify small changes that could be missed within a 30m pixel.
6.7 Were the aims achieved?
An objective of this research was to test the applicability of a predictive model to a rock art
survey. The use of this predictive model will certainly benefit rock art surveys as the majority
of rock art sites fall within the thresholds of the research and can, therefore, be used to
outline areas that need surveying. Although higher resolution data will better delineate areas
of interest for research, the data used throughout this project proved to be more than
adequate in identifying the areas with rock art sites.
6.8 Recommendations for future research
Further research can certainly look at engaging the methods and results of this research to
determine if higher resolution data could benefit this research. Other aspects include the
use of SARADA (South African Rock Art Digital Archive) national site database as site
locations as this consists of thousands of rock art sites that occur throughout southern
Africa. Applying this research to other areas could also be beneficial although it is possible
that the thresholds would change it, is interesting to see how the results of the models are
affected.
Site choice and environmental determinism are two broader archaeological topics that could
influence the use of predictive models (9.5.1: 173, 9.5.2: 173).
The locations of other archaeological sites regularly occur within rock shelters. Therefore,
this predictive model could benefit broader archaeological fields and assist with locating a
greater array of sites that occur within rock shelters. Kvamme (1992) understands the value
of a model that is capable of locating rock shelters and as described that in an American
context more of often than not shelters contain sites.

118
6.9 Remote sensing components and exclusions
Although the research initially looked at a multitude of different approaches to achieve a
successful predictive model, some of these approaches that were excluded include
supervised classifications, unsupervised classifications, and geological classifications.
A further change to the research was the scope of the project and the exact methods that
were used. It was thought that processes such as the supervised and unsupervised
classifications would be effective at locating and isolating the pixels of interest to likely
known rock art sites. These categories were expected to have correlations with known rock
art sites but due to the lack of any direct correlations, these methods were excluded. The
supervised and unsupervised classifications were unable to isolate the characteristics that
corresponded with the known rock art sites of the MARA database and the geological map
lacked the required resolution to relate to the other components of the predictive model.

119
Conclusion
Locating the rock art of the Maloti-Drakensberg is aided by the application of remote sensing
techniques employed throughout this research. Predictive models have had a positive
impact on archaeology together with broader fields of science. The unique application of
this research expands on the ground made by previous researchers (Kvamme 1992, Brandt
et al. 1992, Vaughn & Crawford 2009, Carleton et al. 2012). Many studies have tried to
apply predictive models to their research but often fail during the testing stage as the models
cannot be reproduced in other research areas. Owing to these failures, this research
employed a strict testing procedure that would be used across multiple site databases
relating to different terrain.
7.1 Achievement of aims
7.1.1 Test methods/components that had been effectively applied elsewhere
Remote sensing has been effectively applied to archaeological research worldwide and was
seen to have the potential for use with rock art surveys. Specific processes were believed
to have the potential for evaluating areas for parcels of land that would be of use for rock
art surveys. The inclusion of multiple processes allowed the evaluation of these different
processes to determine whether they are effective or not.
7.1.1.1 Normalized Difference Vegetation Index
One of the most effective remote sensing components for identifying rock art site locations
is the NDVI. The majority of sites occurred within a specific NDVI threshold thus allowing
for the consistent identification of areas suitable for other rock art sites.

120
7.1.1.2 Slope
The slope is the most critical element of this research as it contributed towards the models’
success and allowed for the identification of slope values most synonymous with known
rock art site locations.
7.1.1.3 Shaded Relief
A further component that teased apart areas with rock art site. The shaded relief was
successful at identifying areas that had the potential for rock art sites. Additionally, the
shaded relief component was even more effective when used alongside the NDVI and
slope.
7.1.1.4 Aspect
A component that contains valued data but offered little assistance for locating rock art sites.
Aspect is valuable because it can be used to contribute towards discussions of site selection
and usage as well as looking into topics such as seasonal usage of sites based on aspect.
Aspect varies based on the underlying drainage basin and is influenced as in this case by
mountainous features and surface runoff from the Maloti-Drakensberg Mountains.
7.1.2 Test whether predictive models had any value to rock art surveys
Predictive Modelling, when used correctly, can be a valued tool for archaeological research
and especially for surveying purposes, however, it cannot be used for predicting human
behaviour. For the locating of rock art sites, the predictive models combined the remote
sensing components to build on the individual successes.
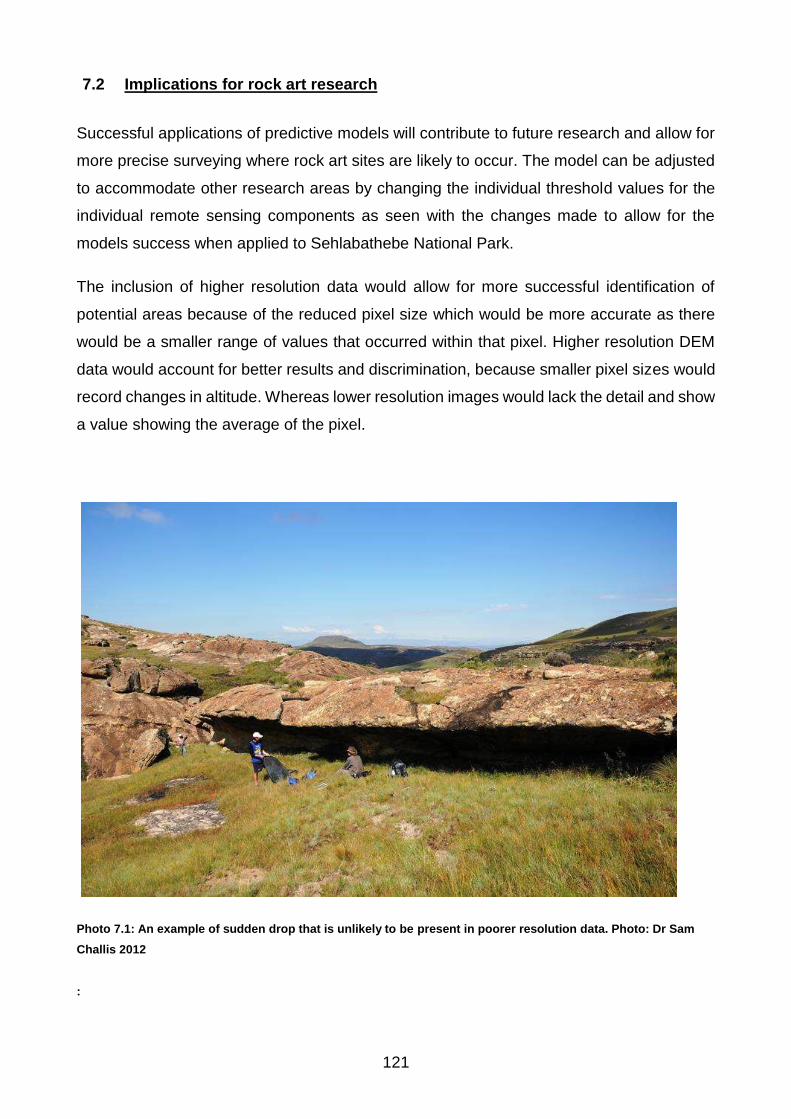
121
7.2 Implications for rock art research
Successful applications of predictive models will contribute to future research and allow for
more precise surveying where rock art sites are likely to occur. The model can be adjusted
to accommodate other research areas by changing the individual threshold values for the
individual remote sensing components as seen with the changes made to allow for the
models success when applied to Sehlabathebe National Park.
The inclusion of higher resolution data would allow for more successful identification of
potential areas because of the reduced pixel size which would be more accurate as there
would be a smaller range of values that occurred within that pixel. Higher resolution DEM
data would account for better results and discrimination, because smaller pixel sizes would
record changes in altitude. Whereas lower resolution images would lack the detail and show
a value showing the average of the pixel.
Photo 7.1: An example of sudden drop that is unlikely to be present in poorer resolution data. Photo: Dr Sam
Challis 2012
:

122
7.3 Future Work
The application of predictive modelling to rock art studies has the potential for further
research within the broader context of South African rock art research, as there are still
numerous areas that require surveying. Expanding the predictive model applied by Banerjee
and Srivastava (2014) to include modelling parameters that assess the environmental
characteristics such as slope and shaded relief. Furthermore, the inclusion of higher
resolution remote sensing data along with the incorporation of enhanced geological data,
these predictions could be refined further to narrow areas with potential for rock to occur.
As shown, there are broader uses for such a method as long as the researcher is attempting
to find rock art shelters or areas of similar geomorphological characteristics.
Testing procedures have illustrated the effective nature of the process at identifying areas
of potential, the next progression would be based on improvements in the discrimination of
unsuitable areas. Specific datasets could be sorted based on regional occurrences to
reduce the fluctuations to thresholds, therefore improving the accuracy of a model on a
smaller scale.
123
References
Abd Manap, M., Ramli, M. F., Sulaiman, W. N. A. & Surip, N. 2010. Application of remote
sensing in the identification of the geological terrain features in Cameron Highlands,
Malaysia. Sains Malaysiana 39(1): 1-11.
Abrams, M.J., Brown, D., Lepley, L. & Sadowski, R. 1983. Remote sensing for porphyry
copper deposits in southern Arizona. Economic Geology 78: 591–604.
Altschul, J. H., Sebastian, L. & Heidelberg, K. 2004. Predictive Modeling in the Military:
Similar goals, divergent paths. Rio Rancho: SRI Foundation. Campbell, J. B. 2008.
Introduction to Remote Sensing. London: Taylor and Francis.
Aminzadeh, B. & Samani, F. 2006. Identifying the boundaries of the historical site of
Persepolis using remote sensing. Remote Sensing of Environment. 102(1): 52-62.
Arthur, C. & Mitchell, P. J. 2009. Metolong Cultural Resource Management Phase 1, Volume
1: Inventorisation and Assessment. Unpublished report prepared for the Lesotho
Government's Commissioner for Water. Oxford: University of Oxford.
Arthur, C. & Mitchell, P. J. 2009. Metolong Cultural Resource Management Phase 1, Volume
2: Building Sustainable Cultural Resource Management in Lesotho. Unpublished
report prepared for the Lesotho Government's Commissioner for Water. Oxford:
University of Oxford.
Banerjee, R. & Srivastava, P.K., 2014. Remote sensing based identification of painted rock
shelter sites: appraisal using advanced wide field sensor, neural network and field
observations. In Remote sensing applications in environmental research (pp. 195-
212). Springer International Publishing.
Battiss, W. W. 1948. The Artists of the Rocks: Art in South Africa. Pretoria: Red Fawn Press.
Bester, S. P. 1998. Vegetation and flora of the southern Drakensberg escarpment and
adjacent areas. Unpublished MSc Thesis. Pretoria: University of Pretoria.
Beukes, N. J. 1969. Die Sedimentologie Van Die Etage Holkrans-sandsteen Sisteem Karoo.
Unpublished PhD dissertation. Bloemfontein: University of the Orange Free State.

124
Biswajeet, P. & Saro, L. 2007. Utilization of optical remote sensing data and GIS tools for
regional landslide hazard analysis using an artificial neural network model. Earth
Science Frontiers 14(6): 143-151.
Bocco, G., Mendoza, M. & Velázquez, A. 2001. Remote sensing and GIS-based regional
geomorphological mapping - a tool for land use planning in developing countries.
Geomorphology 39(3): 211-219.
Bowen, B.B., Martini, B.A., Chan, M.A. & Parry, W.T., 2007. Reflectance spectroscopic
mapping of diagenetic heterogeneities and fluid-flow pathways in the Jurassic Navajo
Sandstone. AAPG bulletin, 91(2): 173-190.
Brandt, R., Groenewoudt, B. J. & Kvamme, K. L. 1992. An experiment in archaeological site
location: modeling in the Netherlands using GIS techniques. World Archaeology
24(2): 268-282.
Campbell, J.B., 2008. Introduction to remote sensing. CRC Press.
Carleton, W. C., Conolly, J. & Ianonne, G. 2012. A locally-adaptive model of archaeological
potential (LAMAP). Journal of Archaeological Science 39(11): 3371-3385.
Carter, G.M., Karis, T. & Stultz, N.M., 1967. South Africa's Transkei: the politics of domestic
colonialism (Vol. 19). Evanston: Northwestern University Press.
Carter, P. L. 1977. The Prehistory of Eastern Lesotho. Unpublished PhD dissertation,
Cambridge: University of Cambridge.
Carter, P. L., Mitchell, P. J. & Vinnicombe, P. 1988. Sehonghong: the Middle and Later
Stone Age industrial sequence at a Lesotho rock-shelter. British Archaeological
Report International Series 406.
Challis, W. & Laue, G. 2001. COMRASA. Rock Art Documentation Course Manual
(Kasama) Zambia 1-14 July 2001.
Challis, W. 2008. The impact of the horse on the AmaTola ‘Bushmen’: new identity in the
Maloti-Drakensberg Mountains of Southern Africa. Unpublished PhD thesis. Oxford:
University of Oxford.
Challis, W. 2011 http://www.marasurvey.com/mission.php consulted 12/05/2014

125
Challis, W., Mullen, A. & Pugin, J. 2015. Rock Art and Baseline Archaeological Survey of
the Sehlabathebe National Park, Kingdom of Lesotho: Final Report to the World
Heritage Committee of the United Nations Educational, Scientific and Cultural
Organization (UNESCO).
Chan, Y. 2011. Location Theory and Decision Analysis, 2nd ed. Berlin: Springer.
Chang, K. 2002. Introduction to Geographic Information System, New York: Mc Graw-Hill.
Chen, C. H. 2007. Signal and Image Processing for Remote Sensing. Miami: CRC press.
Chen, C. H. 2012. Signal and Image processing for remote sensing. Miami: CRC press.
Conolly, J. & Lake, M. 2006. Geographical information systems in archaeology. Cambridge:
Cambridge University Press.
Cooke, C.K., 1969. Rock art of southern Africa. Minnesota: Books of Africa.
Cowling, R. M., Richardson, D. M. & Pierce, S. M. 2004. Vegetation of southern Africa.
Cambridge: Cambridge University Press.
Dalla Bonna, L. 2003. Protecting cultural resources through forest management planning in
Ontario using archaeological predictive modeling. In: Wescott, K. L. & Brandon, R. J.
(eds.). Practical applications of GIS for archaeologists: A predictive modelling toolkit.
Miami: CRC press.
Davis, A.M. & Mason, P.J. 2000. Three dimensional of landslide in SE Spain using a digital
elevation model (DEM) and orthophotography. Landslides in research, theory and
practice, London: Thomas Telford. 403-408
de Neergaard, A., Saarnak, C., Hill, T., Khanyile, M., Berzosa, A. M. & Birch-Thomsen, T.
2005. Australian wattle species in the Drakensberg region of South Africa – An
invasive alien or a natural resource? Agricultural Systems 85(3): 216-233.
Derricourt, R. M. 1977. Prehistoric man in the Ciskei & Transkei. New York: Lawrence Verry
Incorporated.
Douek, D. 2013. ‘They Became Afraid When They Saw Us’: MK Insurgency and
Counterinsurgency in the Bantustan of Transkei, 1988–1994. Journal of Southern
African Studies 39(1): 207-225.

126
Du Toit, A.L. 1954. The geology of South Africa, 3rd ed. Edinburgh: Oliver and Boyd.
Duncan, R.B. & Beckman, K., A. 2005. The application of GIS Predictive Site Location
Models within Pennsylvania and West Virginia. In: Wescott, K. L. & Brandon, R. J.
2003. Practical applications of GIS for archaeologists: A predictive modelling toolkit.
Chicago: CRC Press.
Dunning, N., Beach, T., Farrell, P. & Luzzadder-Beach, S., 1998. Prehispanic agrosystems
and adaptive regions in the Maya lowlands. Culture & Agriculture 20(23): 87-101.
Ebert, D. 2004. Applications of archaeological GIS. Canadian Journal of
Archaeology/Journal Canadien d'Archéologie, 319-341.
Espa, G., Benedetti, R., De Meo, A., Ricci, U. & Espa, S. 2006. GIS based models and
estimation methods for the probability of archaeological site location. Journal of
Cultural Heritage 7(3): 147-155.
Evans, D. 1988. Multisensor classification of sedimentary rocks. Remote Sensing of
Environment 25(2): 129-132.
Fabbri, A. G., van der Meer, F. D., Valenzuela, C. R. & Kushigbor, C. A. 1993. Shape
analysis and multispectral classification in geological remote sensing. Mathematical
Geology 25(7): 773-793.
Farnden, T. H. G. 1966. Excavation of a Late Stone Age Shelter at New Amalfi, East
Griqualand. The South African Archaeological Bulletin 21(83): 122-124.
Fedick, S. L. 1995. Land evaluation and ancient Maya land use in the Upper Belize River
area, Belize, Central America. Latin American Antiquity 6(1): 16-34.
Fedick, S. L. 1996. Managed mosaic. In Conference on Ancient Maya Agriculture and
Biological Resource Management (1991: University of California, Riverside). Utah:
University of Utah Press.
Fedick, S. L., Morrison, B. A., Andersen, B. J., Boucher, S., Acosta, J. C. & Mathews, J. P.
2000. Wetland manipulation in the Yalahau region of the northern Maya lowlands.
Journal of Field Archaeology 27(2): 131-152.
Feely, J. M. 1987. The early farmers of Transkei, southern Africa, before AD 1870). British
Archaeological Report International Series 378.

127
Ford, A. & Nigh, R. 2009. Origins of the Maya forest garden: Maya resource management.
Journal of Ethnobiology 29(2): 213-236.
Gaffney, V. & van Leusen, P. M. 1995. Postscript- GIS, Environmental Determinism and
Archaeology. In: Lock, G. and Stancic, Z. Archaeology and Geographical Information
Systems: A European Perspective 367-382. London: Taylor and Francis.
Goodwin, A. J. H. 1949. A Fishing Scene from East Griqualand. The South African
Archaeological Bulletin 4(14): 51-53
Grover, S., 1999. Perspectives of GIS modelling in hydrology. Asia's first
GIS/GPS/RS/monthly magazine (November-December).
Hamilton, G. N. G. & Cooke, H. B. S. 1960.Geology for South African students: an
introductory textbook. Johannesburg: Central News Agency.
Harris, T. M. & Lock, G. R. 1995. Toward an evaluation of GIS in European archaeology:
The past, present and future of theory and applications. Archaeology and
Geographical Information Systems: A European Perspective. London: Taylor and
Francis.
Haughton, S. H. 1969. Geological history of southern Africa. Cape Town: Geological Society
of South Africa.
He, G., Desai, M. D. & Zhang, X. 1999, March. Minimum component eigen-vector based
classification technique with application to TM images. In: Acoustics, Speech, and
Signal Processing, 1999. Proceedings. 1999 IEEE International Conference on 6:
3533-3536). IEEE.
Hobbs, K.F.1999. An investigation of RGB multi-band shading for relief visualisation.
Journal of Applied Gerontology 1(3/4): 181-186
Hong, Y., Adler, R. & Huffman, G. 2007. Use of satellite remote sensing data in the mapping
of global landslide susceptibility. Natural Hazards 43(2): 245-256.
Horn, B.K.P. 1981. Hill Shading and the Reflectance Map. Proceedings of the Institute of
Electrical and Electronics Engineers 69(1): 14-47.
Huffman, T. N. 1996. Archaeological evidence for climatic change during the last 2000 years
in southern Africa. Quaternary International 33: 55-60.

128
Iiames, J. & Congalton, R. 2006. A Comparison of Inter-Analyst Differences in the
Classification of a Landsat Etm+ Scene In South-Central Virginia ASPRS 2006
Annual Conference Reno, Nevada May 1-5, 2006.
Inzana, J., Kusky, T., Higgs, G. & Tucker, R. 2003. Supervised classifications of Landsat
TM band ratio images and Landsat TM band ratio image with radar for geological
interpretations of central Madagascar. Journal of African Earth Sciences 37(1): 59-
72.
Irwin, P., Akhurst, J. & Irwin, D. 1980. A field guide to the Natal Drakensberg. Durban: Natal
Branch of the Wildlife Society of Southern Africa.
Johnson, M. R., Anhauesser, C. R. & Thomas, R. J. 2006. The Geology of South Africa.
Cape Town: Geological Society of South Africa.
Karimi, H. A. & Peng, J. 2004. Using Maximum Likelihood (ML) and Maximum A Prior
Probability (MAP) in Iterative Self‐Organizing Data (ISODATA). Geocarto
International 19(1): 29-36.
Kayan, I. & Klemas, V. 1978. Application of LANDSAT Imagery to studies of structural
geology and geomorphology of the Mentese region of southwestern Turkey. Remote
Sensing of Environment 7(1): 51-60.
Kennelly, P. 2008. “Terrain maps displaying hill-shading with curvature.” Geomorphology
102: 567–577.
Killick, D. J. B. 1963. An account of the plant ecology of the Cathedral Peak area of the
Natal Drakensberg. Memoirs of the Botanical Survey of South Africa 34:
Kohler, T. A. & Parker, S. C. 1986. Predictive models for archaeological resource location.
Advances in archaeological method and theory 9: 397-452.
Kunen, J. L. 2001. Ancient Maya agricultural installations and the development of intensive
agriculture in NW Belize. Journal of Field Archaeology 28(3-4): 325-346.
Kusky, T.M. & Ramadan, T., 2002. Structural controls on Neoproterozoic mineralization in
the SE Desert, Egypt: an integrated field, Landsat TM, and SIR C/X approach.
Journal of African Earth Sciences 35: 107–121.

129
Kvamme, K. L. 1990. The fundamental principles and practice of predictive archaeological
modelling, in: Voorips, A. (eds.) Mathematics and information science in
archaeology: a flexible framework, vol. 3, Studies in modern archaeology. 257-295.
Bonn: Holos-Verlag.
Kvamme, K. L. 1992. A predictive site location model on the High Plains: An example with
an independent test. The Plains Anthropologist 37: 19-40.
Laake, A. 2011. Integration of Satellite Imagery, Geology and Geophysical Data, Earth and
Environmental Sciences, Dr. Imran Ahmad Dar (Ed.), ISBN: 978-953-307-468-9, In
Tech, Available from: http://www.intechopen.com/books/earth-and-environmental-
sciences/integration-of-satellite-imagery-geology-and-geophysical-data
Lasaponara, R. & Masini, N. 2007. Detection of archaeological crop marks by using satellite
QuickBird multispectral imagery. Journal of Archaeological Science 34(2): 214-221.
Lasaponara, R. & Masini, N. 2011. Satellite remote sensing in archaeology: past, present
and future perspectives. Journal of Archaeological Science 38(9): 1995-2002.
Lee, S. 2005. Application of logistic regression model and its validation for landslide
susceptibility mapping using GIS and remote sensing data. International Journal of
Remote Sensing 26(7): 1477-1491.
Lewis-Williams, J. D. 1972. The syntax and function of the Giant's Castle rock-paintings.
The South African Archaeological Bulletin 27: 49-65.
Lewis-Williams, J.D. & Thorp, C.A., 1989. Archaeology: Lesotho Highlands Water Project
environmental study. Unpublished Report by E.R Ltd: Lesotho Highlands
Development Authority.
Lillesand, T. M. & Kiefer, R. W. 1994. Remote sensing and image interpretation. Remote
sensing and image interpretation (Ed. 3). New York: Wiley.
Lillesand, T. M., Kiefer, R. W. & Chipman, J. W. 2008. Remote sensing and image
interpretation. New York: Wiley.
Liu, J. G. & Mason, P. 2013. Essential image processing and GIS for remote sensing. New
York: Wiley.

130
Lock, G. R. & Stancic, G. (eds.). 1995. Archaeology and geographic information systems: a
European perspective. Miami: CRC Press.
Loendorf, L., 2001 Rock Art Recording. In: Whitley, D. S. (eds.) Handbook of rock art
research. Lanham: Rowman & Littlefield.
Loyd, C. 2013. Putting Landsat 8’s Bands to Work (Consulted October 2013):
https://www.mapbox.com/blog/putting-landsat-8-bands-to-work/
Lucieer, A., Tsolmongerel, O. & Stein, A. 2004. Texture-based segmentation for
identification of Geological units in Remotely Sensed Imagery. In Proceedings of the
3rd International Symposium on Spatial Data Quality ISSDQ 4: 117-120.
Malan, B. D. 1955. A preliminary account of the archaeology of East Griqualand.
Johannesburg: University of the Witwatersrand.
Marozas, B. A. & Zack, J. A. 1990. GIS and archaeological site location. In: Allen, K.M.S.,
Green, S. W. & Zubrow, E.B.W. (eds.) Interpreting Space: GIS and Archaeology,
Taylor & Francis: London.
Masini, N. & Lasaponara, R. 2006. Satellite-based recognition of landscape archaeological
features related to ancient human transformation. Journal of Geophysics and
Engineering 3(3): 230.
Mather, P.M. 2005. Computer Processing of Remotely Sensed Images: An Introduction (3rd
Edition). London: Wiley.
Mauder, K. 1982. Atlas of Transkei - a cartographical project in a developing country.
GeoJournal 6(6): 573-574.
Mazel, A. 2008. Presenting the San Hunter-Gatherer past to the public: A view from the
uKhahlamba-Drakensberg Park, South Africa. Conservation and Management of
Archaeological Sites 10(1): 41-51.
Mazel, A. D. 1981. Up and Down the Little Berg: Archaeological Resource Management in
the Natal Drakensberg: Final Project Report to the Department of Water Affairs,
Forestry and Environmental Conservation. Sub-project Code: 23/1/2-1/3/10/03/02.
Mazel, A. D. 1984. Archaeological Survey of the Natal-Drakensberg, Natal, South-Africa.
Journal of Field Archaeology 11(3): 345-356.

131
Mazel, A. D. 1996a. Maqonqo Shelter: The excavation of early and mid Hoiocene deposits
in the eastern Biggarsberg, Thukela Basin, KwaZulu-Natal, South Africa. Natal
Museum Journal of Humanities 8: 1-39.
Mazel, A. D. 1996b. A special place: Maqonqo Shelter in the Thukela Basin, South Africa.
In Pwiti, G. & Soper, R. (eds.), Aspects of African Archaeology: Papers from the
Tenth Congress of the Pan-African Association for Prehistory and Related Studies,
University of Zimbabwe, Harare, pp. 343-354.
Mazel, A. D. 1997. Mzinyashana Shelters 1 and 2: excavation of mid and late Holocene
deposits in the eastern Biggarsberg, Thukela Basin, South Africa. Southern African
Humanities 9: 1-35.
Mazel, A.D. 1993. kwaThwaleyakhe Shelter: the excavation of mid and late Holocene
deposits in the central Thukela Basin, Natal, South Africa. Natal Museum. Journal of
Humanities 5: 1-36.
Mehrer, M. W. & Wescott, K. L. (eds.). 2005. GIS and archaeological site location modeling.
Miami: CRC Press.
Mehrer, M. W. 2002. A GIS-based archaeological decision-support model for Cultural
Resource Management. Archeologiae calcolatori 13: 125-134.
Meiklejohn, K. I., Hall, K. & Davis, J. K. 2009. Weathering of rock art at two sites in the
KwaZulu-Natal Drakensberg, southern Africa. Journal of Archaeological
Science 36(4): 973-979.
Mendoza, M.E., Bocco, G., López‐Granados, E. and Bravo Espinoza, M., 2010.
Hydrological implications of land use and land cover change: Spatial analytical
approach at regional scale in the closed basin of the Cuitzeo Lake, Michoacan,
Mexico. Singapore Journal of Tropical Geography, 31(2), pp.197-214.
Mitchell, P. 2000. The organization of Later Stone Age lithic technology in the Caledon
Valley, southern Africa. The African Archaeological Review 17(3): 141-176.
Mitchell, P. 2002. The archaeology of southern Africa. Cambridge: Cambridge University
Press.
132
Mitchell, P. J. 1995. Revisiting the Robberg: new results and a revision of old ideas at
Sehonghong Rock Shelter, Lesotho. The South African Archaeological Bulletin 50:
28-38.
Mitchell, P. J. 2009. Gathering together a history of the People of the Eland: towards an
archaeology of Maloti-Drakensberg hunter-gatherers. The Eland’s People: New
Perspectives in the Rock Art of the Maloti-Drakensberg Bushmen. Essays in Memory
of Patricia Vinnicombe. Johannesburg: Wits University Press.
Mitchell, P. Plug, I. Bailey, G. & Woodborne, S. 2008. Bringing the Kalahari Debate to the
mountains: late first millennium AD hunter-gatherer/farmer interaction in highland
Lesotho. Before Farming 2: 1-22.
Mitchell, P.J. 1996. Sehonghong: the late Holocene assemblages with pottery. South
African Archaeological Bulletin 51: 17-25.
Mokoena, T. 2015 Community involved heritage Management- the Case of Matatiele South
Africa. Unpublished Master’s Thesis. University of the Witwatersrand: Johannesburg.
Mucina, L. & Rutherford, M. C. 2006. The vegetation of South Africa, Lesotho and
Swaziland. South African National Biodiversity Institute.
Nield, S. J., Boettinger, J. L. & Ramsey, R. D. 2007. Digitally mapping gypsic and natric soil
areas using Landsat ETM data. Soil Science Society of America Journal 71(1): 245-
252.
Novak, I. D. & Soulakellis, N. 2000. Identifying geomorphic features using LANDSAT-5/TM
data processing techniques on Lesvos, Greece. Geomorphology 34(1): 101-109.
Ouzman, S. 2001. Seeing is deceiving: rock art and the non-visual. World Archaeology
33(2): 237-256.
Parcak, S. 2007. Satellite remote sensing methods for monitoring archaeological tells in the
Middle East. Journal of field archaeology 32(1): 65-81.
Parcak, S. H. 2009. Satellite Remote Sensing for Archaeology. Routledge: Oxford.
Parkington, J. 1976. Follow the San: An Analysis of Seasonality in Prehistory of the South
Western Cape PhD dissertation. Cambridge: University of Cambridge.

133
Patterson, M., Sarson, G., Sarson, H. & Shukurov, A. 2010. Modelling the Neolithic
transition in a heterogeneous environment. Journal of Archaeological Science 37:
2929-2937.
Pearce, D. G. 2002. Changing men, changing eland: Sequences in the rock paintings of
Maclear District, Eastern Cape, South Africa. American Indian Rock Art 28: 129–138.
Penn, M., Sutton, D. & Monro, A. 2004. Vegetation of the greater Maya mountains, Belize.
Systematics and Biodiversity 2(1): 21-44.
Pinto, H. 2014. Lesotho Highlands Water Project Phase II: Report of Baseline
Archaeological and Heritage Survey. Lesotho Highlands Development Authority.
Preston-Whyte, R. A. & Tyson, P. D. 1988. Atmosphere and weather of southern Africa.
Oxford: Oxford University Press.
Preston-Whyte, R. A. & Tyson, P. D. 2004. The weather and climate of southern Africa.
Cape Town: Oxford University Press.
Pugin, J.M. 2012. Improving rock art survey: finding the sandstone shelters of the Maloti-
Drakensberg. Unpublished honours dissertation. Johannesburg: University of the
Witwatersrand.10
Quinn, J.W. 2001. Landsat Band Combinations (Consulted September 2013):
http://web.pdx.edu/~emch/ip1/bandcombinations.html
Ramli, M. F. 2001. The use of remotely-sensed imagery for investigating landslides in
temperate environments. Unpublished Phd. thesis. University of Portsmouth, 277p
Regensberg R. M. 2013. The changing social character of a shelter: A case study from
Matatiele. Unpublished honours dissertation. Johannesburg: University of the
Witwatersrand.
Regensberg, R. 2013. Scratching the surface: rock art and traditional medicine. ASAPA
Conference Proceeding. Gaborone: University of Botswana.
10 Available on research gate and academia

134
Renfrew, C. & Bahn, P. G. 2004. Archaeology: theories, methods and practice. London:
Thames & Hudson.
Richards, J. A. & Jia, X. 2006. Remote Sensing Digital Image Analysis. Remote Sensing
Digital Image Analysis, an Introduction. Berlin: Springer.
Roe, G. H. 2005. Orographic precipitation. Annual Review of Earth and Planetary Sciences.
33: 645-671.
Rowlands, A. & Sarris, A. 2007. Detection of exposed and subsurface archaeological
remains using multi-sensor remote sensing. Journal of Archaeological Science 34:
795–803.
Russell, T. M. 2012. The position of rock art: a consideration of how GIS can contribute to
our understanding of the age and authorship of rock art. In: Smith B.W., Morris, D. &
Helskog, K. (eds.). Working with rock art: recording, presenting and understanding
rock art using indigenous knowledge. Johannesburg: Wits University Press. 37– 45.
Schlüter, T. 2008. Geological atlas of Africa (pp. 110-113). Berlin: Springer. Science, 34(5):
795-803.
Schowengerdt, R.A., 2006. Remote sensing: models and methods for image processing.
Academic press
Schweitzer, F. R. & Scott, K. J. 1973. Early occurrence of domestic sheep in sub-Saharan
Africa. Nature, 241: 547.
Scollar, I., Tabbagh, A., Hesse, A. & Herzog, I. 1990. Archaeological prospecting and
remote sensing. Cambridge: Cambridge University Press.
Sharpe, K. & Barnett, T. 2008. Recording England’s Rock Art: A Handbook for Project
Officers.
Shezi, M. I. Z. & Poona, M. N. K. 2010. Invasive Alien Plant Species Project: An investigation
into using different satellite remote sensors and techniques to identify, map, monitor
and predict the spread and distribution of some of the major current and emerging
invasive alien plant species in KwaZulu-Natal. Durban: UKZN/DAEA.

135
Smith, R. B., Jiang, Q., Fearon, M. G., Tabary, P., Dorninger, M., Doyle, J. D. and Benoit,
R. 2003. Orographic precipitation and air mass transformation: an Alpine example.
Quarterly Journal of the Royal Meteorological Society 129: 433–54
Smith, B., Helskog, K. A. & Morris, D. (eds.). 2012. Working with Rock Art: Recording,
Presenting and Understanding Rock Art Using Indigenous Knowledge.
Johannesburg: Wits University Press.
Smits, L. G. 1983. Rock paintings in Lesotho: site characteristics. The South African
Archaeological Bulletin 38: 62-76.
Smits, L. G. A. 1973. Rock-painting sites in the upper Senqu Valley, Lesotho. The South
African Archaeological Bulletin 28: 32-38.
Sultan, M., Arvidson, R.E. & Sturchio, N.C., 1986. Mapping of serpentinites in the E. Desert
of Egypt using Landsat Thematic Mapper data. Geology 14: 995–999.
Taheri, S. 2010. Hyper temporal NDVI images for modelling and prediction the habitat
distribution of Balkan green lizard (Lacerta trilineata). Unpublished Master’s Thesis.
Enschede, Netherlands: International Institute for Geo-information Science and
Earth Observation.
Thorp, C. 1997. Evidence for interaction from recent hunter-gatherer sites in the Caledon
Valley. African archaeological review 14(4): 231-256.
Tyson, P. D., Preston-Whyte, R. A. & Schulze, R. E. 1976. The climate of the Drakensberg
(Vol. 15). Town and Regional Planning Commission.
Van Leusen, M. 2009. Archaeological predictions contested: the role of the Dutch Indicative
Map of Archaeological Values (IKAW) in local planning procedures in Kamermans,
H. van Leusen, M. Verhagen, Ph. (eds.). Archaeological Prediction and Risk
Management: Alternatives to Current Practice. Leiden: Leiden University Press. 49-
55.
Van Zyl, D. 2003. South African weather and atmospheric phenomena. Pretoria: Briza
Publications.
Vaughn, S. & Crawford, T. 2009. A predictive model of archaeological potential: an example
from northwestern Belize. Applied Geography 29(4): 542-555.

136
Verhagen, P. 2008. Testing Archaeological Predictive Models: A Rough Guide. In:
Posluschny, A., K. Lambers and I. Herzog (eds.) Layers of Perception. Proceedings
of the 35th International Conference on Computer Applications and Quantitative
Methods in Archaeology (CAA), Berlin, Germany, April 2–6, 2007 (Kolloquien zur
Vor- und Frühgeschichte, Vol. 10). Dr. Rudolf Habelt GmbH, Bonn, pp. 285-291.
Verhagen, P., Kamermans, H. & Leusen, M. V. 2009. The future of archaeological predictive
modelling. In Kamermans, H. van Leusen, M. Verhagen, Ph. (eds.). Archaeological
Prediction and Risk Management: Alternatives to Current Practice. Leiden: Leiden
University Press. 49-55.
Verstappen, H.TH. 1977. Remote sensing in geomorphology, New York: Elsevier Scientific
Publishing Company.
Vinnicombe, P. 1976. People of the Eland. Pietermaritzburg: University of Natal.
Visser, P.J.L. 1989. The Geology of the Republics of the South Africa, Transkei,
Bophuthatswana, Venda and Ciskei and the Kingdoms of Lesotho and Swaziland:
Explanation of the 1: 1000000 Geological Map, 1984. Department of Mineral and
Energy Affairs, Geological Survey.
Volker, W. 1998. Automatic classification of remote sensing data for GIS database
revisions. In: Fritsch, D., Englich, M. & Sester, M. (eds.) 'IAPRS', 32(4): 641-648,
ISPRS Commission IV Symposium on GIS - Between Visions and Applications
Ward, V. 1997. A century of change: rock art deterioration in the Natal Drakensberg, South
Africa. Southern African Humanities 9: 75-97.
Wescott, K. L. & Brandon, R. J. 2003. Practical applications of GIS for archaeologists: A
predictive modelling toolkit. Chicago: CRC Press.
Wheatley, D. 2004. Making space for an archaeology of place. Internet Archaeology 15.
White, G. G. & King, T. F. 2007. The archaeological survey manual. California: Left Coast
Press.
Whitley, D. S. (eds.). 2001. Handbook of Rock Art Research. Lanham: Rowman & Littlefield.
Whitley, D. S. 2005. Introduction to rock art research. California: Left Coast Press.

137
Whittow, J. B. 2000. The Penguin dictionary of physical geography. Oxford: Penguin
Publishers.
Willcox, A. R. 1956. Rock Paintings of the Drakensberg. Johannesburg: Thomas Nelson
and Sons.
Willcox, A. R. 1963. The rock art of South Africa. Johannesburg: Thomas Nelson and Sons.
Winterbottom, S. J. & Dawson, T. 2005. Airborne multi‐spectral prospection for buried
archaeology in mobile sand dominated systems. Archaeological Prospection 12(4):
205-219.
Wiseman, J. R. & El-Baz, F. 2007. Remote sensing in archaeology. Berlin: Springer.
Wright, J. B. & Mazel, A. D. 2007. Tracks in a mountain range: exploring the history of the
uKhahlamba-Drakensberg. Johannesburg: Wits University Press.
Wright, J. B. & Mazel, A. D. 2012 Umlando Wezintaba ZoKhahlamba: History of the
Ukhahlamba Mountains. Johannesburg: Wits University Press.
Wright, J. B. 1971. Bushman Raiders of the Drakensberg 1840-1870: A Study of Their
Conflict with Stock Keeping Peoples in Natal. Pietermaritzburg: University of Natal
Press.
Zenobia, J., Roberts, R.G., Galbraith, R.F., Deacon, H.J., Grün, R., Mackay, A., Mitchell,
P., Vogelsang, R. & Wadley, L. 2008. Ages for the Middle Stone Age of southern
Africa: implications for human behavior and dispersal. Science 322(5902): 733-735.
Zhang, H., Bevan, A., Fuller, D. & Fang, Y. 2010. Archaeobotanical and GIS-based
approaches to prehistoric agriculture in the upper Ying valley, Henan, China. Journal
of Archaeological Science 37 (7): 1480-1489.
Zhou, Q. 1992. Relief Shading Using Digital Elevation Models. Computers and Geosciences
18(8): 1035-1042.

138
Appendix
9.1 Tables
Table 9.1: SNP Database

139

140

141

142
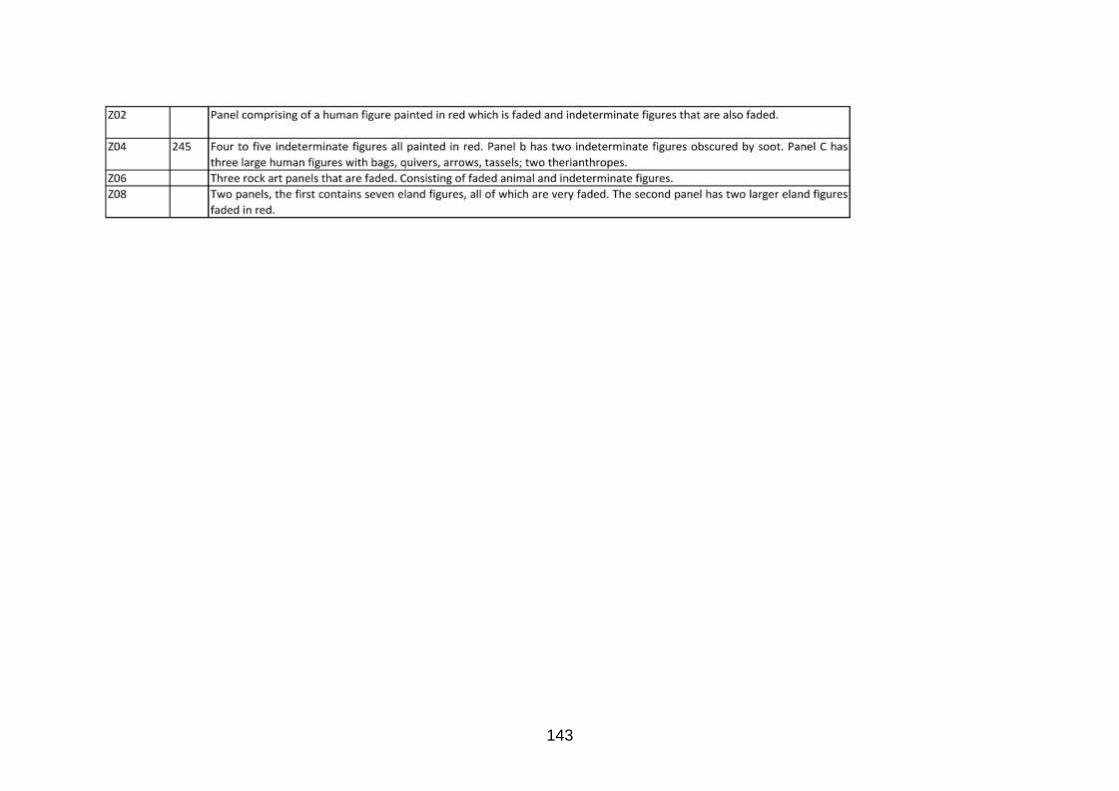
143

144
Table 9.2: MARA Database.

145

146
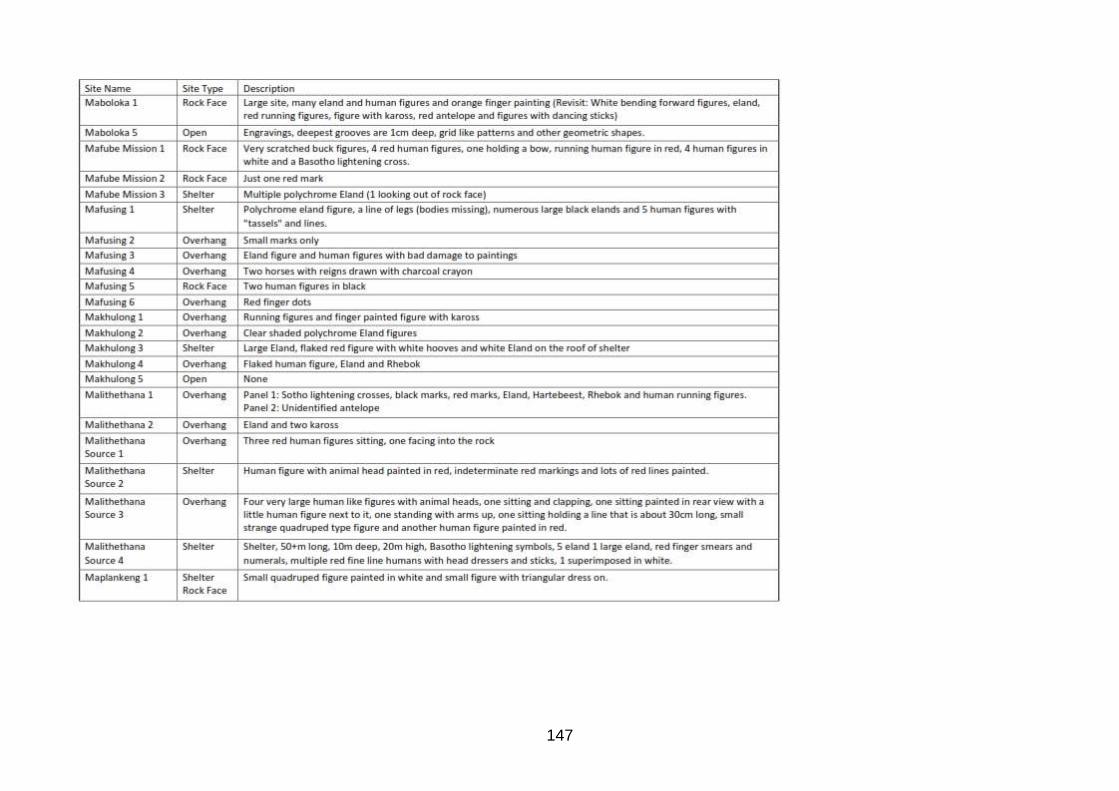
147

148

149

150

151
.

152
9.2 Data Used
9.2.1.1 SRTM
USGS (2014), Shuttle Radar Topography Mission, 1 Arc Second scene SRTM1S30E029V3, Unfilled
Unfinished 2.0, Global Land Cover Facility, University of Maryland, College Park, Maryland, Feb 2000.
USGS (2014), Shuttle Radar Topography Mission, 1 Arc Second scene SRTM1S30E029V3, Unfilled
Unfinished 2.0, Global Land Cover Facility, University of Maryland, College Park, Maryland, Feb 2000.
USGS (2014), Shuttle Radar Topography Mission, 1 Arc Second scene SRTM1S30E028V3, Unfilled
Unfinished 2.0, Global Land Cover Facility, University of Maryland, College Park, Maryland, Feb 2000.
9.2.1.2 SPOT 6
Astrium 2013, SPOT6/7 Satellite imagery for global solutions, Astrium EADS Company,
http://www.astrium.eads.net/en/programme/spot-603.html. Airbus Defence and Space

153
9.3 Figures
Figure 9.1: MARA survey tracks, areas without tracks depict areas where tracks were overwritten.

154
Figure 9.2: Painted Relief for the Alfred Nzo and Joe Gqabi Districts with MARA Sites as of 2012.

155
Figure 9.3: Slope slice for the Alfred Nzo and Joe Gqabi Districts, white background reflects areas with null values.

156
Figure 9.4: 150% extension of the slope slice, white background reflects areas with null values. Large white area depicts the
alluvium as discussed earlier.

157
Figure 9.5: MARA shaded relief, white background reflects areas with null values.
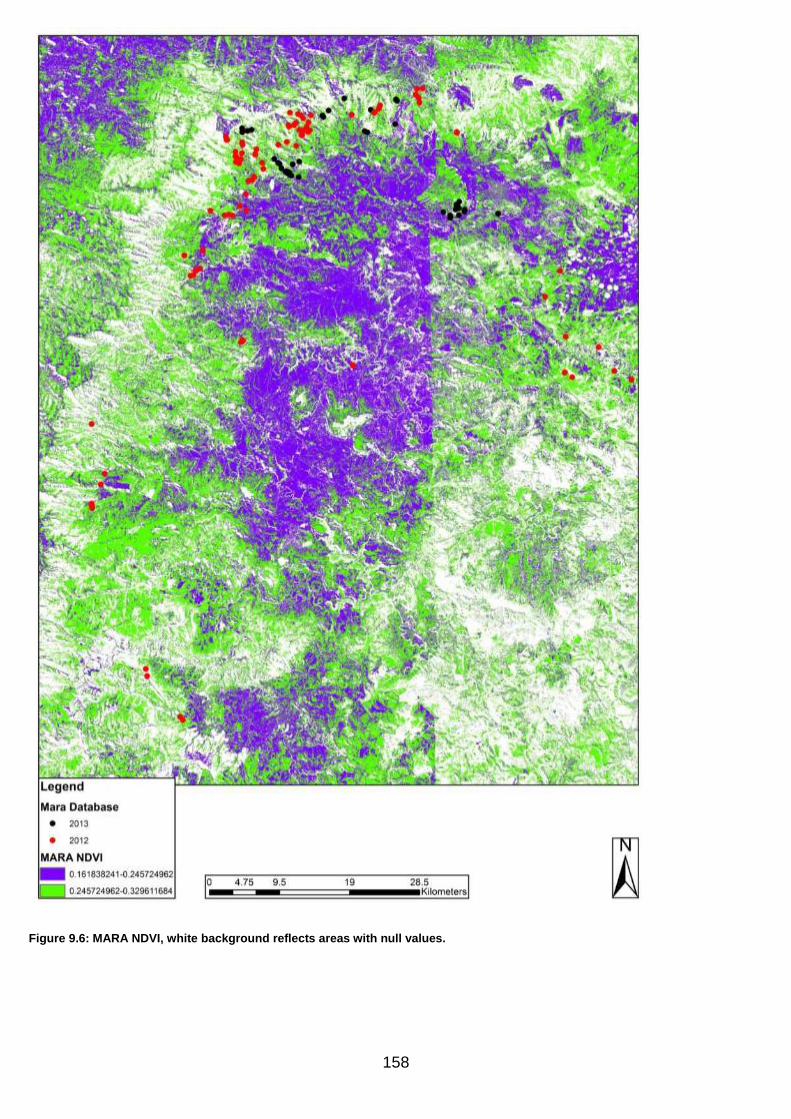
158
Figure 9.6: MARA NDVI, white background reflects areas with null values.

159
Figure 9.7: MARA NDVI with thresholds expanded by 150%, white background reflects areas with null values.

160
Figure 9.8: MARA aspect slice, derived from SRTM, white background reflects areas with null values.

161
Figure 9.9: Model Output 4, white background reflects areas with null values.

162
Figure 9.10: Model Output 5, white background reflects areas with null values.
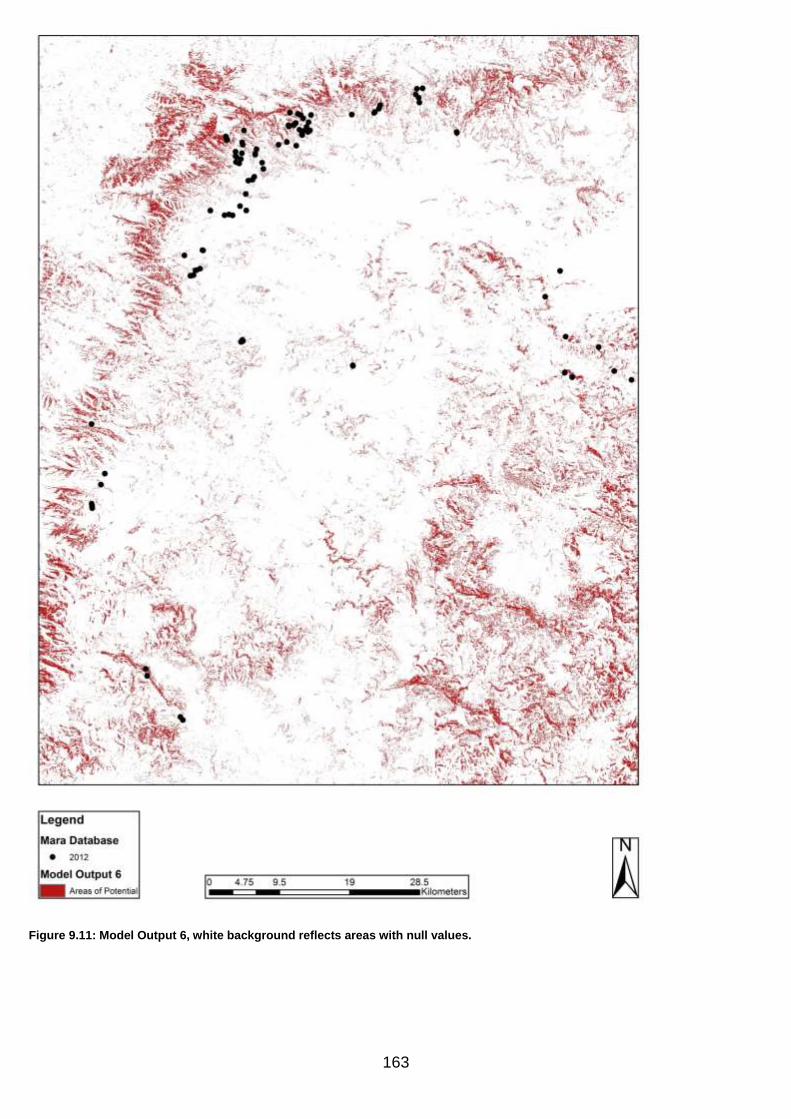
163
Figure 9.11: Model Output 6, white background reflects areas with null values.

164
Figure 9.12: Model Output 8, white background reflects areas with null values.

165
Figure 9.13: Model Output 9

166
Figure 9.14: Slope slice for the Alfred Nzo and Joe Gqabi Districts, white background reflects areas with null values.

167
Figure 9.15: 150% extension of the slope slice, white background reflects areas with null values. Large white area depicts the
alluvial plain discussed earlier.

168
Figure 9.16: MARA shaded relief, white background reflects areas with null values.

169
Figure 9.17: MARA NDVI, white background reflects areas with null values.

170
Figure 9.18: MARA NDVI with thresholds expanded by 150%, white background reflects areas with null values.
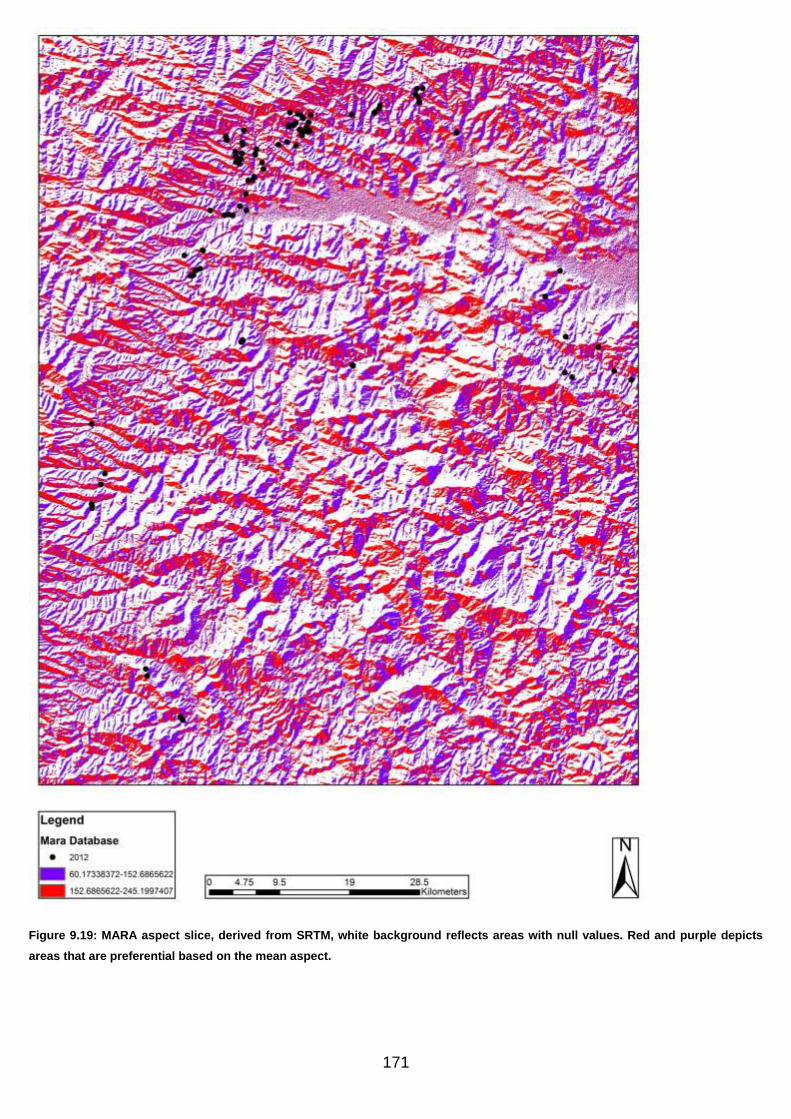
171
Figure 9.19: MARA aspect slice, derived from SRTM, white background reflects areas with null values. Red and purple depicts
areas that are preferential based on the mean aspect.
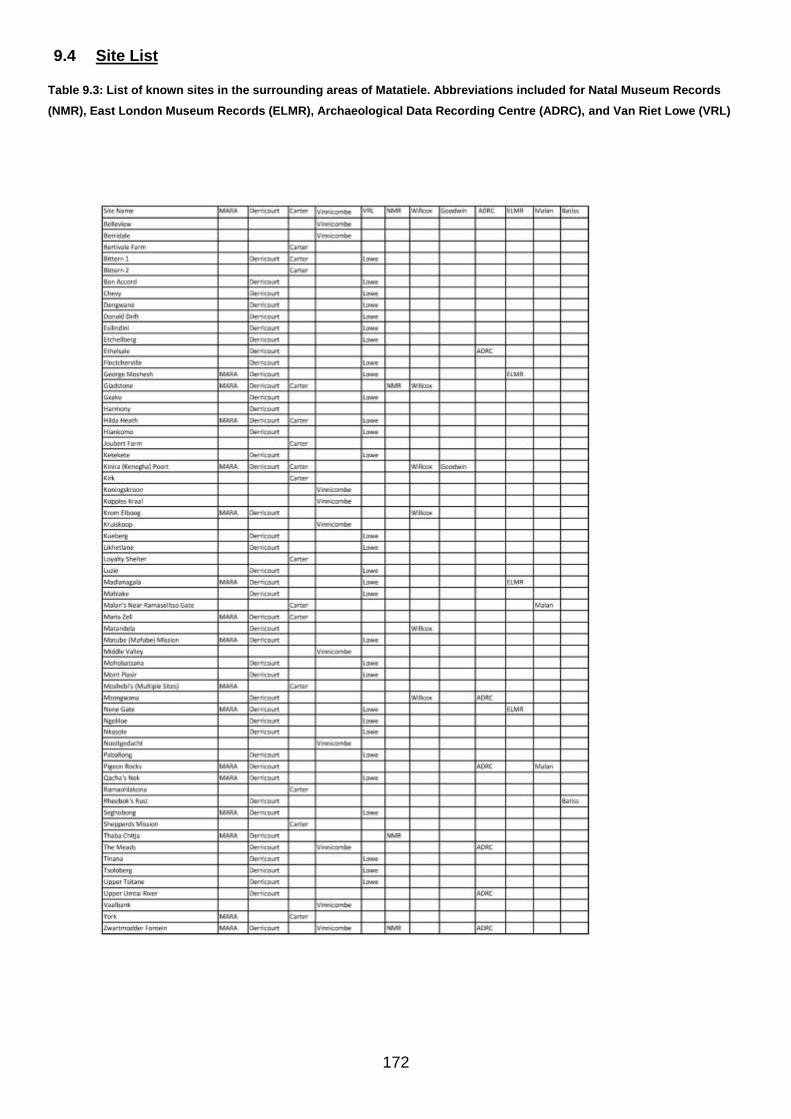
172
9.4 Site List
Table 9.3: List of known sites in the surrounding areas of Matatiele. Abbreviations included for Natal Museum Records
(NMR), East London Museum Records (ELMR), Archaeological Data Recording Centre (ADRC), and Van Riet Lowe (VRL)

173
9.5 Site usage
Without performing excavations, it is difficult to determine what the activities may have been at any
given site and, in any event, site use signatures may be regionally or locally specific. In each
research area (MARA and SNP) localised trends were identified with some certainty. These included
the Mofoqoi valley in the SNP, Phuting, New Stands and Military Hill in Matatiele.
9.5.1 Aspect
The notion of sites occurring in similar aspects may be a coincidence, however, such a notion needs
to take certain components into consideration: are other sites with alternate aspects painted
elsewhere, is the presence of these sites based on the occurrence of potential rock art locations in
easterly aspects or is there a conscious choice to paint in east facing sites. Assessing the distribution
of the aspect threshold, it can show the dynamic range of aspects that can be painted and the
threshold covers the majority of this range. Is it still acceptable to state that there is a preference to
paint in these sites? The aspect threshold covers 79% of the possible values, showing the broad
range of aspects that contain rock art sites, although the mean is south easterly, this can be seen
as either a preference for sites to be painted or the predominant aspect of the majority of potential
rock art locations.
9.5.2 Environmental Determinism
Are human choices influenced by the environment? This age old question is one that has been
asked and debated thoroughly within archaeology. Making correlations to site type is problematic
as there is limited evidence to support why a specific rock shelter has rock art housed in it while a
similar shelter has no rock art at all. Researchers have tried to make similarities between the rock
art content and environment, but this is also problematic for a number of reasons; no record of
environmental change from time of rock painting until today, some content within the rock art does
not and may not have appeared in specific areas in the past.
Archaeological uses of predictive models, as a means of explanation, are problematic as they seek
to correlate the environment to archaeological contents. The problem with this is that these
predictive models focus on environmental traits/characteristics (the characteristics that are of
relevance to predictive models and GIS), hence these models are inherently trying to identify parcels
of the environment that show similarities to known archaeological sites (Wheatley 2004: 5).

174
However, Wheatley (2004: 6) shows that the use of identifying sites based on the environment de-
humanises the people responsible for the archaeology. This statement is valid as the suggesting
that decisions made by humans were simple, straightforward and often governed by the
environment is limiting and harms the theoretical aspects of archaeology.
This assumption is valid because in some cases, the actual models are used to model human
behaviour, which is problematic as site locations may not have been decided based just on
environmental characteristics. Furthermore, Wheatley suggests that any assumptions made using
correlations assume that actions or agency of the people of interest is disregarded as they are
making decisions based on the immediate surroundings (Wheatley 2004: 5).
Rock art site locations are largely dependent on the availability of a rock face that could be painted
and therefore many sites share similarities such as geology, aspect, and elevation. Without a rock
face, the paintings would not occur. However the problem that exists relates to why some shelters
have rock art and why others do not some sites may have had rock art present and it has since
faded and, or flaked. However, specific site selection may be influenced by factors that researchers
are not aware of today such as spiritual or religious influences. So the question relates more to site
selection than that of environmental determinism.
9.6 Case Studies
Areas with high densities of rock art sites such as Phuting, Military Hill and New Stands were
identified by the predictive model as areas with high potential that required surveying. Although all
of these areas, namely particularly the Phuting Valley, would have been surveyed at some point,
the model was able to identify it as an area that would probably have contained rock art sites.
Therefore, it was surveyed sooner than it would have if the research continued in a systematic
fashion. Two of these areas are discussed as case studies and are assessed based on
archaeological content, environmental characteristics and the possible reasoning behind the high
density occurrences.
The initial MARA area and the percentage of sites that fall into areas classified as areas with the
potential for containing rock art sites, this will be followed by the assessment of sites that were
located in Sehlabathebe National Park. The analysis of areas that are identified as archaeological
hotspots will be discussed whilst paying particular attention to two areas identified during this
research, first the Phuting Valley and then the Mofoqoi River Valley of Sehlabathebe. The final
component that will be included in this results chapter is the inclusion of a few well known sites and
whether they fall into areas with the potential for containing rock art sites.

175
9.6.1 Phuting Valley Case Study
The Phuting valley occurs within the MARA research area and is one of the denser concentrations
of rock art sites within the MARA research area, let alone the greater region. The valley contains 21
rock art sites of which 20 occur on the north east facing slope of the valley. A scatter of Later Stone
Age tools was also located within the Phuting Valley. The valley houses five high significance rock
art sites with major potential for future research. This valley can also be used to study possible
movement passages throughout the region as it could have provided a thoroughfare between areas
above and below the Maloti-Drakensberg Mountains. Prior to the discovery of the sites within this
valley, sites were located in less nucleated areas.
The valley provides some questions to the researchers: first why are twenty rock art sites located
on one side of the valley and only one site located on the opposite side. Is this evidence of site
choice or a distinct preference in aspect? Why does this valley contain this many rock art sites and
what could contribute to this valleys high site density? Why do other areas not contain as many sites
as this? Are these sites possible occupation sites? Was the area occupied or was it just used for
the purpose of painting?
The presence of twenty rock art sites located on the north east facing side of the valley is based on
a few characteristics; the presence of sandstone rock shelters which is boosted by the amount of
large boulders providing overhangs (Boulders contain four of the twenty rock art sites), the north
east side of the valley is more accessible and less steep than the other, whereas the south west
facing slope is inhabited by black wattle today – although not a characteristic that would have
affected accessibility during the time of painting – it affects access today.
9.6.2 Mofoqoi Valley Case Study
The Mofoqoi river valley of SNP is a similar in nature to the Phuting Valley of MARA, as the majority
of rock art sites occur on one side of the river valley. The Mofoqoi valley has seven high significance
rock art sites on the north and east facing side of the valley whereas the west facing side of the
valley contains one high significance rock art site and two low significance sites. The valley contains
a substantial amount of potential rock art site locations that occur on the side of the valley with the
higher concentration of rock art sites. The presence of these sites could be based on a preferential
aspect or could be based on the availability of more sites on one side of the valley and not the other.
The presence of sites on one side of the valley might point towards a local preference to paint in
north east facing sites but the density of potential sites on the one side of the valley could obscure

176
this. Therefore, a preference towards a specific aspect might exist however this trend could be
biased by the lack of sites on the other side of the valley. In this example, would the occurrence of
potential rock art sites result in a similar distribution if these potential rock art sites occurred on the
opposite side of the valley?
9.7 Predictive Modelling Process
1. Create individual components for research area from obtained imagery
2. Obtain the relevant statistics for the research area, such as the distribution of sites against
the individual components
3. Export the remote sensing components into ERDAS Imagine for data slicing.
4. Slice data using ‘Level Slice’ located under the Terrain Menu of ERDAS Imagine and create
thresholds (Terrain Menu → Level Slice)
5. Export data and then reimport to ArcGIS (Ref.)
6. Add all the components to the Weighted Overlay, located within the Spatial Analyst submenu
of the ArcToolbox (ArcToolbox → Spatial Analyst → Overlay → Weighted Overlay)
7. Assign values to the individual components prior to computing the Weighted Overlay
8. Resultant image from Weighted Output shows the areas of rock art potential
9. Test resultant image against known sites to determine if the rock art sites correlate to areas
of rock art potential
10. Conduct a field survey of the MARA region using initial predictions
11. Use results from field survey to strengthen initial model and then apply it to Sehlabathebe
National Park.
12. Use results from Sehlabathebe to try strengthen model further

177
9.8 Rock Art Sites
Rock Art Site 1: Dipaki 2

178
Rock Art Site 2: Ha Phiri 1

179
Rock Art Site 3: Hekeng Ya Tshepe 1
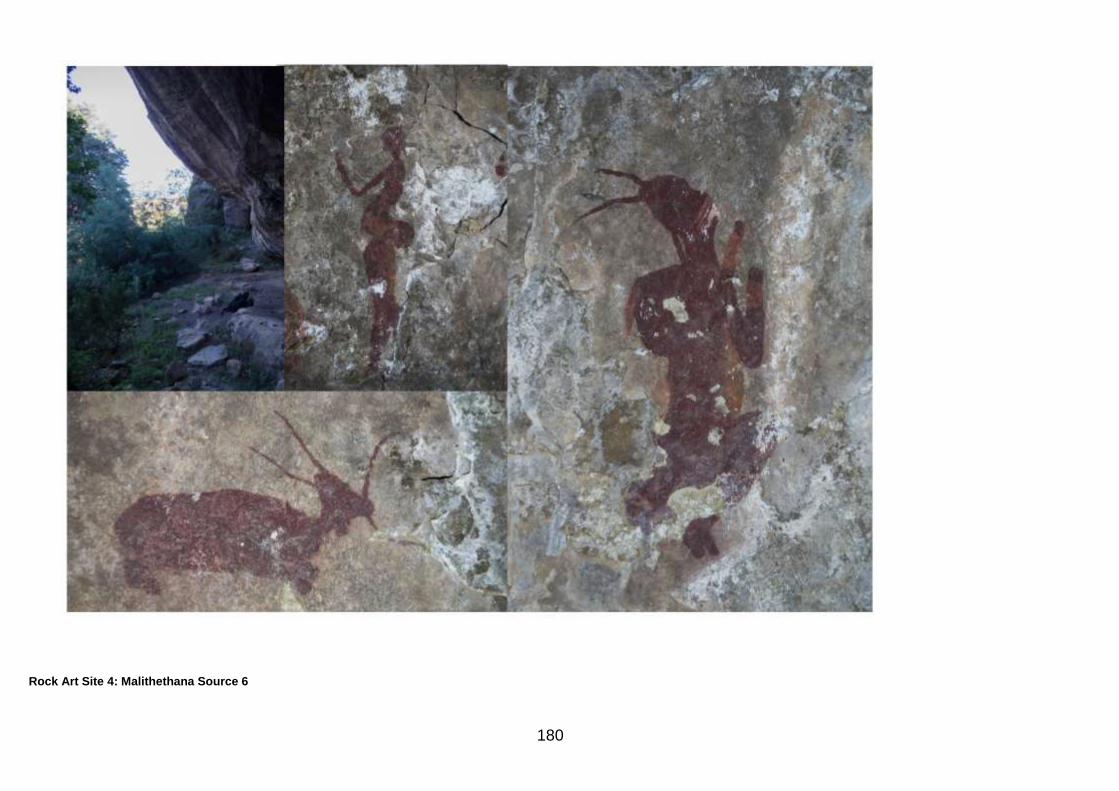
180
Rock Art Site 4: Malithethana Source 6

181
Rock Art Site 5: Mambhele 1

182
Rock Art Site 6: Phuting 5

183
Rock Art Site 7: Phuting 6
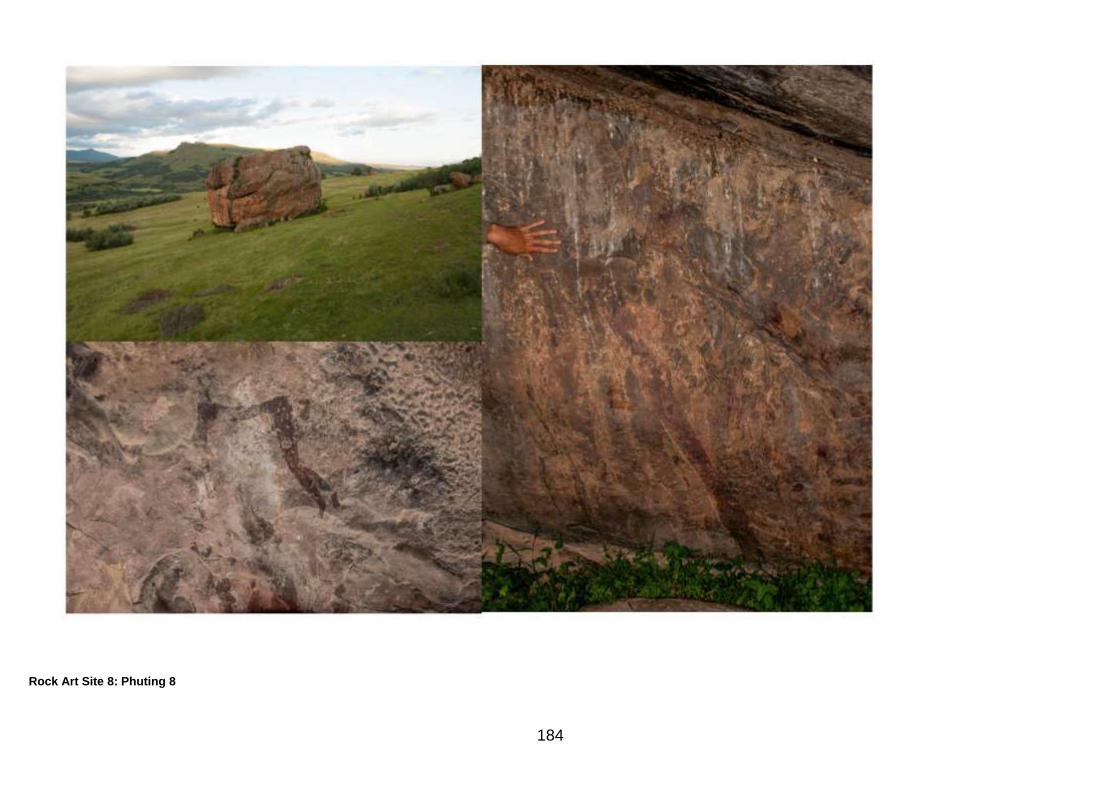
184
Rock Art Site 8: Phuting 8

185
Rock Art Site 9: Phuting 11

186
Rock Art Site 10: Phuting 15
Recommended