1
Local Minimum of Tropical Cyclogenesis in the Eastern Caribbean
Honors Thesis
Presented to the College of Agriculture and Life Sciences
Department of Earth and Atmospheric Sciences
of Cornell University
in Partial Fulfillment of the Requirements for the
Research Honors Program
by
Owen Honzer Shieh
May 2007
Dr. Stephen J. Colucci

2
Local Minimum of Tropical Cyclogenesis in the Eastern Caribbean
Owen H. Shieh and Stephen J. Colucci
Department of Earth and Atmospheric Sciences, Cornell University, Ithaca, New York
ABSTRACT
The study has determined that a local, climatological minimum of tropical
cyclogenesis exists over the eastern Caribbean Sea. This area, known colloquially by
forecasters as the “hurricane graveyard,” is located within the belt of tropical easterlies
during most of the Atlantic hurricane season, which lasts from June through November.
Tropical easterly waves emerging from the African continent usually follow a path
through the Lesser Antilles and into the eastern Caribbean. GOES infrared satellite
imagery shows that easterly waves frequently exhibit warming cloud tops and decreasing
convection in an area bounded by the islands to the north and east, Venezuela to the
south, and roughly 75 degrees longitude to the west. QuikSCAT derived surface winds
during clear-sky conditions frequently show the presence of accelerating easterlies in the
central Caribbean as part of the Caribbean Low-Level Jet (CLLJ). Analysis of the NCEP
global reanalysis wind fields suggests the presence of an area of persistent low-level mass
divergence in the eastern Caribbean. This implies a subsident regime that would weaken
convection. Climatologically, this phenomenon reaches peak intensity in July, then shifts
towards the east and weakens in the latter half of the Atlantic hurricane season. This is
reflected by the local minimum of tropical cyclogenesis points in the National Hurricane
Center’s best track data in the early part of the season. El Niño directly affects the
strength of the CLLJ, and hence, is related to the intensity of the low-level divergence in
the eastern Caribbean. The local minimum of tropical cyclogenesis in this region has
important implications to operational forecasting, since the vast majority of tropical
cyclones in the Caribbean eventually affect surrounding landmasses.

3
1. Introduction
Hurricane forecasters have long been puzzled by the apparent tendency of nascent
tropical cyclones to cease development or weaken as they traverse the eastern Caribbean
Sea. Given the low latitude of this region, most of these tropical disturbances are those
that develop from African easterly waves that are embedded in the deep, tropical
easterlies in the North Atlantic Ocean. Oftentimes, these surface atmospheric waves or
weak tropical cyclones and their associated convection unexpectedly decrease in intensity
in the eastern Caribbean, only to redevelop once they enter the western Caribbean, posing
a dilemma for forecasters.
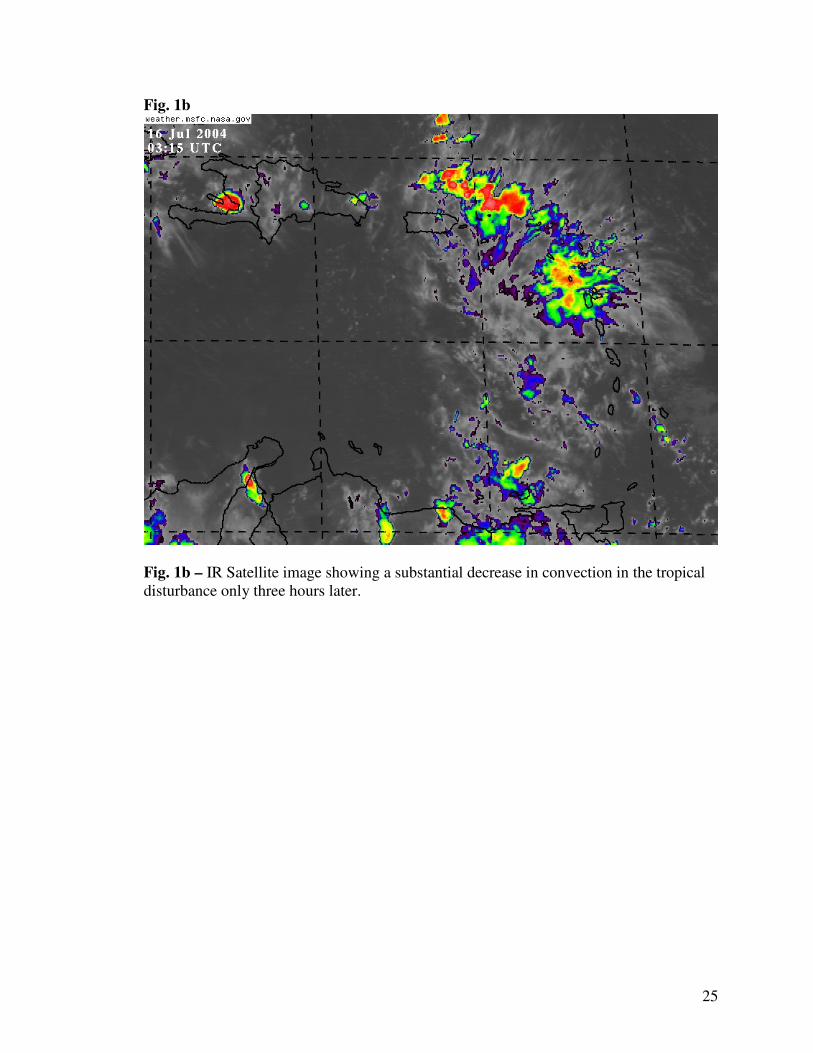
An example of a tropical disturbance that weakened upon entering the eastern
Caribbean can be seen in Fig. 1a and Fig. 1b. Fig. 1a shows the disturbance at 0015Z on
July 16, 2004 with healthy convection just west of the Lesser Antilles. However, only
three hours later (Fig. 1b), the convection collapsed.
For years, the National Hurricane Center has colloquially referred to this eastern
Caribbean region as a hurricane graveyard. A good example of this was in the forecast
discussion for Tropical Depression Joyce in 2000, “…The outflow has improved and I
would dare to say that it is favorable for strengthening. However…Tropical Depression
Joyce is about to move into the area which the old timers call the hurricane graveyard.
Historically…with a few exceptions…tropical cyclones do not develop in this
area…Joyce is kept at 30 knots through 48 hours. Thereafter…some strengthening is
indicated when the depression reaches the western Caribbean…if it survives…” (Avila
2000).

4
It is clear that an element of uncertainty surrounds the eastern Caribbean Sea with
respect to forecasting the intensity and subsequent development of tropical disturbances
and weaker tropical cyclones. Due to this uncertainty, there have been many cases when
forecasters have maintained the status quo of a disturbance traveling through the eastern
Caribbean Sea – even if conditions appear favorable for development – only to forecast
its re-intensification once it leaves the region. This study investigates the possible
climatological factors that may be contributing to this local minimum of tropical
cyclogenesis. Since the vast majority of tropical cyclones that develop or enter the
eastern Caribbean region eventually affect surrounding islands or landmasses, including
the United States, it is imperative that forecasters understand the factors that may be
contributing to the unexpected weakening of nascent tropical cyclones in the eastern
Caribbean.
2. Background
The conditions supportive of tropical cyclogenesis are generally well understood.
These conditions are summarized by Hennon and Hobgood (2003) as: (1) a persistent
area of convection, (2) sufficient planetary vorticity, (3) little to no vertical wind shear,
(4) sufficient moisture, (5) sufficiently warm ocean and deep mixed-layer, and (6) a state
of atmospheric conditional instability.
For the local minimum of tropical cyclogenesis to be a significant phenomenon,
there must be some condition that is climatologically persistent that tends to contribute
toward tropical cyclolysis. It is obvious that conditions (1), (2), (4), and (5) above are not
of concern for this study. The persistence of convection is itself the topic of study, as

5
convection is often observed to weaken unexpectedly in the eastern Caribbean. For areas
north of 5° N, planetary vorticity becomes a negligible concern (Hennon and Hobgood
2003). The eastern Caribbean is located entirely north of this latitude. Likewise, we can
discount the possibility of insignificant moisture playing a role in the eastern Caribbean,
since the region is embedded within the deep tropics with prevailing surface easterlies
advecting moisture from a generally uniform moisture source – the tropical Atlantic.
Occasionally, the Saharan Air Layer (SAL) is advected westward into the eastern
Caribbean, bringing in drier air and increasing the temperature inversion at the base of
the SAL, which may inhibit the development and intensification of tropical disturbances
(Dunion and Velden 2004). However, it is important to emphasize that while the SAL
can be detrimental to tropical convection, its associated inhibiting factors are advected
from east to west across the tropical North Atlantic. Therefore, if the eastern Caribbean
is affected, the rest of the tropical North Atlantic to the east of the region should also be
affected – perhaps to an even greater extent, assuming that the dry and warm SAL
gradually moderates as it is advected westward. Thus, any negative effects of the SAL
should not be unique to the eastern Caribbean and cannot explain the local minimum of
tropical cyclogenesis in that region.
It can be shown from satellite data that the eastern Caribbean Sea does not exhibit
significant departures in sea surface temperatures (SST) from the surrounding ocean.
The only difference is that there is a lag in the onset of the annual warming when
compared to the Gulf of Mexico and the western Caribbean (Wang and Enfield 2001).
There is no significant “cold pool” associated with the eastern Caribbean that would
explain the local minimum of tropical cyclogenesis in the region. There are indications

6
of cooler SST due to upwelling by the easterlies in the southwestern Caribbean Sea
(Inoue et al. 2002), but that is outside the geographic domain of this study.
Finally, it is necessary to address the remaining two conditions that favor tropical
cyclogenesis: (3) little to no vertical wind shear and (6) a state of atmospheric conditional
instability. If condition (3) were to be considered with a zonally averaged lower
tropospheric wind field, then in the context of the deep tropics, the vertical wind shear
can be increased by increasing the magnitude of the upper-level westerlies. There is no
evidence that would suggest that the eastern Caribbean region is more likely to
experience the temporal, synoptic-scale intrusions of upper-level westerlies from the mid-
latitudes, since the region is sub-synoptic scale. Hence, any increase in vertical wind
shear would most likely result from accelerations in the low-level easterlies. Condition
(6) can be broadly inferred to include mechanisms that cause vertical motion. The
presence of lift or subsidence would act to enhance or inhibit convection, respectively.
Given the above discussion, the eastern Caribbean region does not exhibit any
significant differences with its surrounding environment in terms of conditions (1), (2),
(4), and (5). Therefore, this study investigated the contributions of conditions (3) and (6)
on the tropical cyclogenesis potential in the eastern Caribbean. Namely, the objective of
this study was to identify any possible sources of vertical wind shear in the lower
troposphere and to see if there is any climatologically persistent impediment to buoyant
instability, such as atmospheric subsidence.
3. Data and Methodology

7
Maps with the QuikSCAT satellite-derived surface wind speeds over the
Caribbean Sea were used for the initial observational phase of this study. As shown in
Fig. 2a, the July mean wind magnitudes exhibit a maximum in the central Caribbean.
This particular figure shows the mean for July 2006, which was selected as a
representative example. Other years exhibit the same phenomenon. This maximum in
the surface easterlies is a manifestation of the Caribbean Low-Level Jet (CLLJ) (Wang
and Enfield 2003). Within the context of the June-November Atlantic hurricane season,
this feature is observed to be at its strongest during the beginning, then weakening as the
months progress. It is clear from Fig. 2b that the October 2006 mean wind magnitudes
for the central Caribbean are substantially weaker. The CLLJ effectively disappears
towards the latter half of the hurricane season.
The acceleration of the surface easterlies in the central Caribbean would imply a
region of horizontal surface speed divergence in the eastern Caribbean. To investigate
this possibility, the NCEP/NCAR Reanalysis data at 2.5° x 2.5° degree spatial resolution
and 6 hourly time resolution (00Z, 06Z, 12Z, and 18Z) were used for this study. Monthly
means as provided by the Reanalysis were based on the 1968 to 1996 time period.
However, for the statistical calculations within this study, the daily data from 1948 to
2004 were used to provide a larger sample size. Cross-sections through the 17 pressure
levels of the Reanalysis horizontal wind field (calculated using the u- and v-wind fields)
show that the CLLJ maximizes below the 850 mb level, which is consistent with Wang
and Enfield (2003). Also, given that tropical wave amplitudes often maximize between
850 mb and 950 mb (Thorncroft and Hodges 2001), the 925 mb level of the Reanalysis
was selected for further investigation.

8
As illustrated in Fig. 3, the eastern Caribbean domain was defined for this study to
be the area bounded meridionally by 17.5° N and 12.5° N and zonally by 75° W and 60°
W. Reanalysis monthly means of u- and v-wind fields were used to calculate
climatological divergence values within the domain. These were plotted using the
Graphical Analysis and Display System (GrADS) and compared to QuikSCAT images to
assess the qualitative relationship between the eastern Caribbean divergence field and the
strength of the CLLJ in the central Caribbean.
For the purpose of quantitative analyses, the 6-hourly Reanalysis data from 1948
to 2004 were used to calculate the divergence values averaged over the spatial domain
defined above. Monthly means were then computed, and a statistical unpaired hypothesis
test for a difference of the mean divergence between the beginning and the latter part of
the hurricane season, assuming independence (Wilks 2006), was performed. The mean
divergence values that were tested were those of the June and July months considered
togetehr versus that of the October and November months. By comparing the first two
and the last two months of the hurricane season, the sample size effectively becomes 114
(57 years x 2 months) for each of the means. Findings of this test as well as others
mentioned in this section will be discussed in the following section.
The National Hurricane Center/AOML Hurricane Research Division HURDAT
best-track data for Atlantic tropical cyclones was used to extract genesis points from the
1851 to 2005 time period. During this time, there were 1353 tropical cyclones that
reached a peak intensity of tropical storm or hurricane. Those cyclones that only reached
a maximum classification of tropical depression were not included in the HURDAT file.
Please note that locations of tropical cyclogenesis may not have been accurate prior to the

9
satellite era, with a bias towards areas near land. However, given the relatively “land-
locked” location of the eastern Caribbean, with land to the north, south, and east, it is
assumed that any tropical cyclones that formed in that region would have been identified
even without satellite detection. This would be assisted by the fact that most convection
embedded in the deep easterlies would affect the Leeward and Windward islands prior to
entering the eastern Caribbean.
The Southern Oscillation Index anomalies (1951 to 2004) provided by the
Climate Prediction Center were correlated by month with the divergence values during
those years. The results suggest that there may be large-scale climatological
teleconnections that may play a role in tropical cyclogenesis potential in the eastern
Caribbean.
Finally, a likelihood ratio test (Wilks 2006) was conducted to see whether the
probabilities of tropical cyclogenesis in the eastern Caribbean in any given year can be
described by two separate Poisson distributions (El Niño months and non-El Niño
months) with different means. El Niño is defined as any month with a negative SOI
anomaly. Non-El Niño is defined as any month with a positive SOI anomaly. The test
statistic that was used for the likelihood ratio test is as follows:
( )
( )( ) ( )
A
A 0
0
H2ln 2 L H L H
H
∗ Λ
Λ = = − Λ
Here, ( )0HΛ is the likelihood function associated with the null hypothesis ( 0H ), and
( )AHΛ is the likelihood function associated with the alternative hypothesis ( AH ).
Function L is the log-likelihood as defined by Wilks (2006). Since the sampling
distribution of *Λ can be described by the 2χ distribution, this statistic was used to test

10
whether the probability distribution of tropical cyclogenesis in the eastern Caribbean
during El Niño conditions is significantly different from that of non-El Niño months.
4. Results and Discussion
The calculations performed on the Reanalysis monthly means (1968 to 1996) for
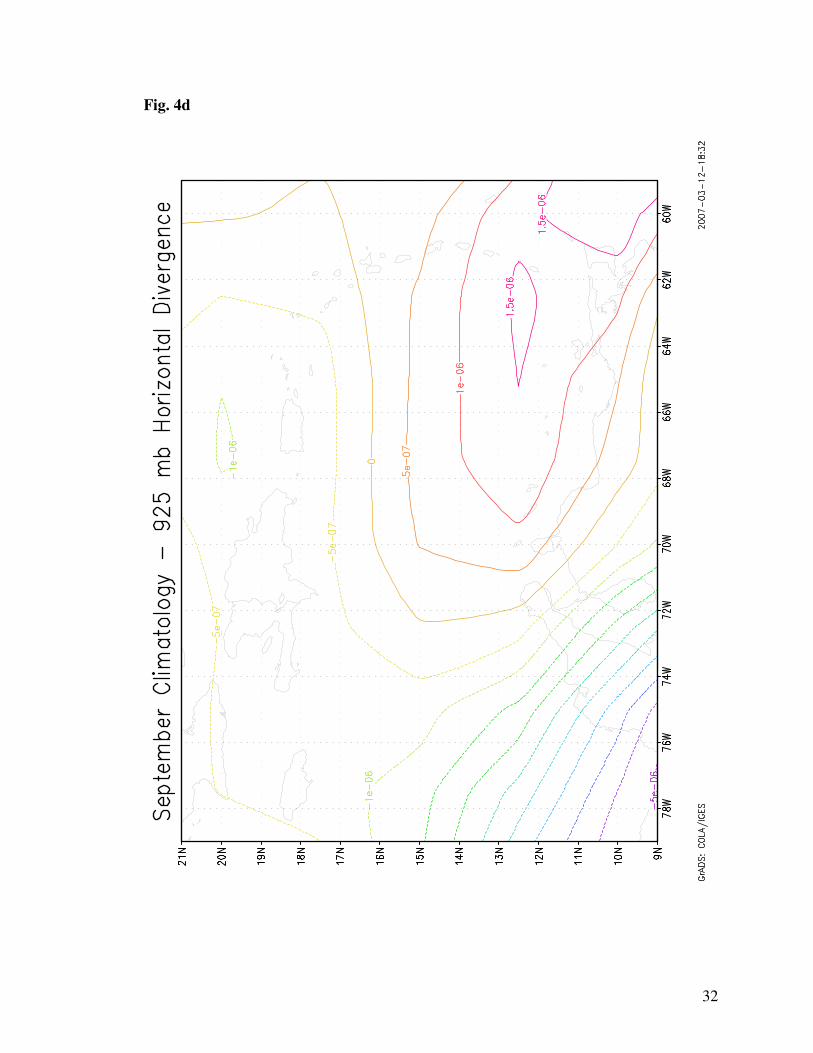
June and July (Fig. 4a and 4b) show a local maximum of mass divergence at 925 mb just
south of Hispaniola. The divergence maximum climatologically shifts east and weakens
as the hurricane season progresses (Fig. 4c-4e). This is consistent with the seasonal
decrease in the strength of the CLLJ. This deceleration in the central Caribbean surface
easterlies towards the latter part of the Atlantic hurricane season is resolved by the u- and
v-wind fields of the Reanalysis and is reflected by the decrease in divergence in the
eastern Caribbean.
Quantitatively, the 6-hourly Reanalysis u- and v-wind fields (1948 to 2004) show
the same result. The spatially and monthly averaged divergence values in the eastern
Caribbean decrease from June to November (Table 1). In fact, the divergence values
decrease by at least an order of magnitude throughout the domain by September, October,
and November. A statistical test was performed to determine the significance of this
seasonal decrease. With a z-score of 18.7 and a p-value of roughly zero, it can be
confidently concluded that the mean eastern Caribbean divergence at 925 mb decreases
seasonally with respect to the Atlantic hurricane season. Fig. 5a shows an extended time
series of the divergence values averaged by month from 1948 to 2004. It is clear that the
monthly divergence is periodic within each hurricane season, while the underlying mean
value has remained roughly constant throughout the 57-year period. This periodicity can

11
be seen more clearly in Fig. 5b, which is an arbitrary selection of the most recent decade
to show the intra-hurricane season fluctuation of divergence. Please note that for both of
these figures, the plots only include data from June through November of each year. The
divergence values from December to May are ignored to emphasize the decrease of
divergence during the hurricane seasons. Therefore, each year has a total of six data
points. The November data point of a given year is connected in the time series to the
June data point of the following year to provide continuity and express the periodic
nature of the divergence values.
Out of the 1353 tropical cyclones, as defined by the HURDAT database, that
formed in the Atlantic Basin from 1851 to 2005, only 46 of them (3.4%) have developed
in the eastern Caribbean. When compared to the 123 (9.1%) that have developed in the
northwest Caribbean of roughly the same domain size (defined here to be between 15°-
20° N and 75°-90° W) and the 119 (8.8%) that have developed in the deep Atlantic just
east of the eastern Caribbean (between 12.5°-17.5° N and 45°-60° W), it is clear that
there is a relative minimum of genesis points in the eastern Caribbean. The 46 tropical
cyclones that have formed in the eastern Caribbean are distributed with a peak in the
month of September (Fig. 6). At first glance, this appears to be similar to the tropical
cyclogenesis frequency distribution for the Atlantic Basin as a whole. However, it is
crucial to note that the distribution is skewed left, with greater occurrence frequency to
the right. There is a greater relative frequency of tropical cyclones that form in the latter
part of the hurricane season as opposed to the initial part. In addition, given that the
Caribbean as a whole exhibits a bimodal distribution of tropical cyclogenesis, with peaks
in June and October (Inoue 2002), the observed distribution for the eastern Caribbean is

12
unique with respect to just one peak towards the latter part of the hurricane season. The
fact that tropical cyclogenesis is more favored in the eastern Caribbean towards the latter
part of the hurricane season coincides with the climatological decrease of low-level
divergence in the eastern Caribbean.
Since there is a relationship between eastern Caribbean tropical cyclogenesis
potential and the strength of the CLLJ in the central Caribbean, it is of interest to
investigate possible climatological teleconnections that may affect the strength of the
CLLJ. According to Wang et al. (2003, 2006), El Niño in the boreal winter weakens the
North Atlantic Subtropical High (NASH). This occurs via multiple tropospheric
processes. During winters when El Niño is at its peak, the upward branch of the zonal
Walker Circulation shifts eastward. In turn, the subsident branch on the eastern flank of
the Walker Circulation shifts over the Amazon. This opposes the rising branch of the
meridional Hadley Circulation that is usually centered on the Amazon during boreal
winters. Since the Hadley Cell partially sustains the NASH, a weaker Hadley Cell would
lead to a weaker NASH in the winter. This, in turn, intensifies the easterly trade winds
over the North Atlantic, which increase evaporative cooling and upwelling in the Atlantic
Basin, thereby leading to an enhanced Atlantic Warm Pool (AWP) the following summer.
With the peak of the AWP occurring during the late summer and early fall, the rising
branch of the Hadley Cell shifts over the northwest Caribbean and the Gulf of Mexico,
providing negative sea-level pressure anomalies that weaken the southwestern edge of the
NASH. Hence, El Niño in the winter serves to weaken the NASH in the winter as well as
the following summer, through the positive feedback mechanism of an enhanced AWP.
The strength of the CLLJ is positively correlated with the North Atlantic Oscillation

13
(NAO), which implies a relation to the strength of the NASH (Wang 2007). A stronger
(weaker) NASH is associated with a stronger (weaker) CLLJ. Therefore, El Niño in the
winter weakens the CLLJ in the winter.
According to Wang (2003, 2007), the effects of El Niño on the NASH are
opposite during the winter and the summer. This implies that El Niño in the summer
strengthens the NASH and therefore strengthens the CLLJ. Reasons for this reversal in
relationship are unclear. Given the complex relationships between the global
climatological factors that may affect the strength of the CLLJ, we agree with Wang
(2007) that future numerical modeling efforts will be necessary to identify the relative
magnitudes of the contributions of each of the factors. However, based on the divergent
wind anomalies calculated in Wang (2003), we suggest that the sign reversal of the
correlation between El Niño and the NASH in the winter versus the summer is likely due
to the migration of the upward branch of the Hadley Cell from the Amazon in the winter
to the Gulf of Mexico and northwest Caribbean in the summer (in response to the AWP).
Therefore, when El Niño occurs in the summer, the upward branch of the Walker
Circulation opposes the southern, subsident branch of the Hadley Cell over the AWP.
These would then weaken the Hadley Cell, raise sea-level pressures over the AWP, and
the NASH would intensify, leading to a stronger CLLJ. This would explain Wang
(2003)’s observation that El Niño intensifies the CLLJ during the summer. Again,
numerical modeling efforts would need to be undertaken to quantify the various
climatological contributions to the strength of the CLLJ.
The fact that El Niño in the summer intensifies the CLLJ suggests that divergence
values in the eastern Caribbean should have a positive correlation with the intensity of El

14
Niño during the summer months. Correlations at 0-lag between the monthly divergence
values and the SOI (1951 to 2004) are shown in Table 2. All of the months show a
negative correlation, which imply that divergence in the eastern Caribbean becomes more
positive as SOI becomes more negative (stronger El Niño) during the hurricane season,
especially during the earlier months of the hurricane season. This is consistent with the
previously stated conclusion that there exists a positive correlation between the intensity
of El Niño in the summer and the intensity of the CLLJ. Assuming a Gaussian
distribution of the Fisher Z transformation (Wilks 2006), where Z is defined as follows:
1 1 rZ ln
2 1 r
+ = −
,
all of the correlations are significant at the 1% level with the exception of r = -0.13 for
November. This can be explained by the fact that November is the transition period into
the winter season, where the effects of El Niño upon the strength of the CLLJ are
opposite that of summer (Wang 2007). However, because of the fact that there is a
significant positive correlation between El Niño intensity and eastern Caribbean
divergence at 925 mb during most of the hurricane season, it can be confidently stated
that El Niño during the hurricane season will reduce the likelihood of tropical
cyclogenesis in the eastern Caribbean through the low-level divergence-inducing CLLJ.
A likelihood ratio test comparing the Poisson distributions of tropical cyclones
that form in the eastern Caribbean during negative SOI months with that of positive SOI
months suggests that the null hypothesis of equal distribution can be rejected at roughly
the 20% significance level ( 2 1.6χ ≈ with df = 1). The result of this test is not as strong
as one with a traditional rejection at the 10% significance level, but it must be noted that
only the period 1951 to 2004 was considered with respect to the SOI anomaly dataset

15
from the Climate Prediction Center. The event of tropical cyclogenesis in the eastern
Caribbean is so rare (with only 10 cases within this period) that even a sample size of 324
months produces a very small Poisson mean for both categories that are compared.
However, it is simply worth noting that there is marginally significant evidence to
suggest that the Poisson mean of tropical cyclogenesis frequencies during non-El Niño
months is indeed higher than that of El Niño months.
El Niño is already known to negatively affect the development of tropical
cyclones in the Atlantic Basic through an increase in vertical wind shear (Gray 1984).
However, it must be noted that since the relative frequencies of tropical cyclogenesis in
the eastern Caribbean are inversely related to the magnitude of the low-level divergence
in the region, it can be concluded that El Niño will further act to inhibit tropical
cyclogenesis in the eastern Caribbean through local subsidence in addition to the large-
scale increase in vertical wind shear throughout the Atlantic Basin. Further supporting
this argument is Wang (2007)’s finding that the CLLJ’s contribution to vertical wind
shear is only significant in the southwestern Caribbean. Therefore, the primary
contribution of the CLLJ to the inhibition of convective development (and cyclogenesis)
is through the enhanced subsidence in the vertical column in the eastern Caribbean due to
mass conservation. Wang (2007), referring to the entire Caribbean region as a whole,
suggests that “the easterly CLLJ increases the moisture flux divergence in the Caribbean
and thus suppresses the convection, decreasing rainfall and suppressing the formation of
tropical cyclones.” While this may be true and that there is a bimodal distribution of
tropical cyclogenesis in the Caribbean (Inoue et al. 2002), there is still a local minimum
of tropical cyclogenesis in the eastern Caribbean. Therefore, the argument in this study
16
for subsidence and low-level divergence being a primary factor against cyclogenesis in
the eastern Caribbean still holds.
5. Summary and Conclusions
Long-term historical records of tropical cyclogenesis points suggest that there is a
local minimum of tropical cyclogenesis frequencies in the eastern Caribbean Sea.
Indeed, short-term satellite imagery often indicate the decay of convective activity
associated with tropical disturbances embedded within the deep easterlies in the tropical
Atlantic as they traverse the eastern Caribbean region. Of all of the conditions that
inhibit tropical cyclogenesis, only one stands out to be climatologically persistent in the
eastern Caribbean – subsidence. The major findings of this study are as follows:
• The CLLJ is a semi-permanent feature in the central Caribbean that plays an
active roll in tropical cyclogenesis potential in the eastern Caribbean. The
CLLJ is an area of accelerating low-level easterlies that maximize at 925 mb
and creates an area of divergence at the same level in the eastern Caribbean,
which induces subsidence in the vertical column by mass conservation. This
inhibits the intensification of convection and hence works against
cyclogenesis.
• The intensity of the CLLJ and the magnitude of the divergence in the eastern
Caribbean varies intra-annually, with a maximum in July and a steady
decrease throughout the hurricane season.
• The relative frequencies of tropical cyclogenesis in the eastern Caribbean in
the 1851-2005 period exhibit a peak in September. However, the distribution

17
is skewed left, favoring higher probabilities of tropical cyclone formation in
the latter part of the hurricane season. This is consistent with the seasonal
decrease in low-level divergence in the eastern Caribbean.
• El Niño has a positive correlation with the strength of the CLLJ. Hence, El
Niño in the summer (during the hurricane season with the exception of
November) is significantly correlated with the low-level divergence in the
eastern Caribbean. This is also reflected by the climatological records of
more storms forming in the eastern Caribbean during months with negative
SOI.
The exact source of the CLLJ variability is still somewhat unknown due to the
many complex climate teleconnections that influence it (Wang 2007). In addition to what
has been discussed above, it has been suggested that there is a relationship between the
CLLJ and the onset of the Mid-Summer Drought in central American and Mexico
(Magaña 1999). The variability of the CLLJ was described from an observational
perspective in Wang (2007). In this present study, the CLLJ’s effects on eastern
Caribbean tropical cyclogenesis is investigated. The next step to improve understanding
of this phenomenon would be to isolate the most significant conditions that force the
CLLJ’s variability, which would best be done through numerical modeling efforts. In
addition, the climatological divergence patterns associated with CLLJ variability in
nearby regions such as the western Caribbean should be studied to see if there exists a
relationship with the observed tropical cyclogenesis frequency distribution for that
region.

18
By identifying low-level divergence and subsidence as the underlying cause for
the local minimum of tropical cyclogenesis in the eastern Caribbean Sea, this present
study hopes to shed light on the mystery of the “hurricane graveyard” of the Atlantic. In
actuality, this term is a misnomer, as major hurricanes do not seem to be affected by the
region of low-level divergence. A strong cyclone usually exhibits large convergence at
low-levels that overwhelms the pre-existing area of divergence. For example, Hurricane
Ivan (2004) traversed the region completely unaffected. This further supports the
conclusion that subsidence is the primary factor for inhibiting tropical cyclogenesis in
this area. If wind shear were a primary factor, one would expect even mature hurricanes
to be affected. However, only weaker systems such as weak tropical storms, tropical
depressions, and tropical disturbances pose this unique intensity forecasting challenge in
the eastern Caribbean. Additionally, the fact that the divergence values in the eastern
Caribbean Sea correspond to intensity of the CLLJ on a monthly basis would imply that
the divergence maximum in the NCEP Reanalysis is a pre-existing, climatological
phenomenon rather than a reflection of the deterioration of convection in that region due
to some other unknown factor.
The results of this study suggest that forecasters should take into account the
strength of the CLLJ ahead of the tropical disturbance of interest, as the storm enters the
eastern Caribbean. Due to the “land-locked” geography of the Caribbean Sea, residents
of the surrounding nations depend on accurate forecasts for nascent tropical cyclones in
this region.
6. Acknowledgements

19
We thank Dr. Li Dong, who was a graduate student at Cornell University during
the initial phase of this study, for her assistance with using the NCEP Reanalysis dataset.
We also thank Dr. Steve Lyons of The Weather Channel for his correspondence during
this project.

20
REFERENCES
Avila, L., 2000: Tropical Depression Joyce Discussion Number 25. National Hurricane
Center Advisory Archive. www.nhc.noaa.gov/archive/2000/dis/NAL1400.025.html
Dunion, J. P., C. S. Velden, 2004: The Impact of the Saharan Air Layer on Atlantic
Tropical Cyclone Activity. Bull. Amer. Meteor. Soc., 85, 353-365.
Gray W. M., 1984: Atlantic Seasonal Hurricane Frequency. Part I: El Niño and 30 mb
Quasi-Biennial Oscillation Influences. Mon. Wea. Rev., 112, 1649-1668.
Hennon, C. C., J. S. Hobgood, 2003: Forecasting Tropical Cyclogenesis over the Atlantic
Basin Using Large-Scale Data. Mon. Wea. Rev., 131, 2927-2940.
Inoue, M., I. C. Handoh, G. R. Bigg, 2002: Bimodal Distribution of Tropical
Cyclogenesis in the Caribbean: Characteristics and Environmental Factors. J.
Climate., 15, 2897-2905.
Magaña V., J. A. Amador, S. Medina, 1999: The Midsummer Drought over Mexico and
Central America. J. Climate., 12, 1577-1588.
Thorncroft, C. D., and K. Hodges, 2001: African easterly wave variability and its
relationship to Atlantic tropical cyclone activity. J. Climate, 14, 1166-1179.
Wang, C., and D. B. Enfield, 2001: The tropical Western Hemisphere warm pool.
Geophys. Res. Lett., 28, 1635-1638.
-----, and -----, 2003: A further study of the tropical Western Hemisphere warm pool. J.
Climate., 16, 1476-1493.
-----, and -----, S. Lee, C. W. Landsea, 2006: Influences of the Atlantic Warm Pool on
Western Hemisphere Summer Rainfall and Atlantic Hurricanes. J. Climate., 19,
3011-3028.
21
Wang, C., 2007: Variability of the Caribbean Low-Level Jet and Its Relations to Climate.
J. Climate (revised).
Wilks, D. S., 2006: Statistical Methods in the Atmospheric Sciences, (2nd
Ed.). Elsevier
Academic Press, New York.

22
Figure Captions
Fig. 1a – IR satellite image of a tropical disturbance, embedded within the tropical
easterlies, just entering the eastern Caribbean at 0015Z on July 16, 2004.
Fig. 1b – IR Satellite image showing a substantial decrease in convection in the tropical
disturbance only three hours later.
Fig. 2a – QuikScat monthly average wind data for July 2006. Arrows show only wind
direction. Magnitude is depicted by the shades of color. Note the strength of the CLLJ in
the central Caribbean.
Fig. 2b – QuikScat monthly average wind data for October 2006. Note the substantially
weaker CLLJ in the central Caribbean.
Fig. 3 – Eastern Caribbean domain of study: 12.5° N to 17.5° N and 60° W to 75° W.
Fig. 4 – Horizontal divergence [s-1
] climatology at 925 mb for a) June, b) July, c) August,
d) September, e) October, and f) November. Note that the divergence values
climatologically decrease towards the latter part of the hurricane season, consistent with
the variation of the CLLJ.
Fig. 5 – June through November timeseries of eastern Caribbean domain-averaged
divergence [s-1
] values a) from 1948 to 2004 and b) from 1994 to 2004. Note the cycle of
decreasing divergence values throughout each hurricane season.
Fig. 6 – Tropical cyclogenesis frequency distribution of the eastern Caribbean by month
from 1851 to 2005. Note the greater relative frequencies towards the latter part of the
hurricane season.

23
Table 1 – Monthly mean 925 mb divergence [s-1
] values averaged over the eastern
Caribbean domain from 1948 to 2004. Note the decreasing values as the hurricane
season progresses.
Table 2 – Correlation coefficients (0-lag) between the monthly mean 925 mb divergence
values averaged over the eastern Caribbean domain and the Southern Oscillation Index
(SOI) from 1951 to 2004.

24
Fig. 1a
Fig. 1a – IR satellite image of a tropical disturbance, embedded within the tropical
easterlies, just entering the eastern Caribbean at 0015Z on July 16, 2004.
25
Fig. 1b
Fig. 1b – IR Satellite image showing a substantial decrease in convection in the tropical
disturbance only three hours later.

26
Fig. 2a
Fig. 2a – QuikScat monthly average wind data for July 2006. Arrows show only wind
direction. Magnitude is depicted by the shades of color. Note the strength of the CLLJ in
the central Caribbean.

27
Fig. 2b
Fig. 2b – QuikScat monthly average wind data for October 2006. Note the substantially
weaker CLLJ in the central Caribbean.

28
Fig. 3
Fig. 3 – Eastern Caribbean domain of study: 12.5° N to 17.5° N and 60° W to 75° W.

29
Fig. 4a

30
Fig. 4b

31
Fig. 4c
32
Fig. 4d

33
Fig. 4e

34
Fig. 4f

35
Fig. 4 – Horizontal divergence [s-1
] climatology at 925 mb for a) June, b) July, c) August,
d) September, e) October, and f) November. Note that the divergence values
climatologically decrease towards the latter part of the hurricane season, consistent with
the variation of the CLLJ.

36
Table 1
Month Mean 925 mb Divergence [s-1
]
June 1.82 x 10
-6
July 1.36 x 10
-6
August 6.46 x 10
-7
September 1.07 x 10
-7
October -8.59 x 10
-8
November 1.54 x 10
-7
Table 1 – Monthly mean 925 mb divergence [s-1
] values averaged over the eastern
Caribbean domain from 1948 to 2004. Note the decreasing values as the hurricane
season progresses.

37
Fig. 5a
June-November Average Divergence
-1.50E-06
-1.00E-06
-5.00E-07
0.00E+00
5.00E-07
1.00E-06
1.50E-06
2.00E-06
2.50E-06
3.00E-06
3.50E-06
19
48
19
55
19
62
19
69
19
76
19
83
19
90
19
97
20
04
Year
Div
erg
en
ce
[s
^-1
]
Fig. 5b
June-November Average Divergence
-1.50E-06
-1.00E-06
-5.00E-07
0.00E+00
5.00E-07
1.00E-06
1.50E-06
2.00E-06
2.50E-06
3.00E-06
1994
1996
1998
2000
2002
2004
Year (most recent decade)
Div
erg
en
ce [
s^
-1]

38
Fig. 5 – June through November time series of eastern Caribbean domain-averaged
divergence [s-1
] values a) from 1948 to 2004 and b) from 1994 to 2004. Note the cycle of
decreasing divergence values throughout each hurricane season. Only the data points for
June through November are included.

39
Fig. 6
Fig. 6 – Tropical cyclogenesis frequency distribution of the eastern Caribbean by month
from 1851 to 2005. Note the greater relative frequencies towards the latter part of the
hurricane season.
Eastern Caribbean Tropical Cyclogenesis
Frequency Distribution
0
5
10
15
20
May
June
July
Augus
t
Septe
mbe
r
Octobe
r
Nov
ember
Month
Fre
qu
en
cy

40
Table 2
Month
0-lag Correlation Coefficient (r)
Monthly Divergence vs. SOI
June -0.39
July -0.46
August -0.61
September -0.36
October -0.39
November -0.13
Table 2 – Correlation coefficients (0-lag) between the monthly mean 925 mb divergence
values averaged over the eastern Caribbean domain and the Southern Oscillation Index
(SOI) from 1951 to 2004.
Recommended