2
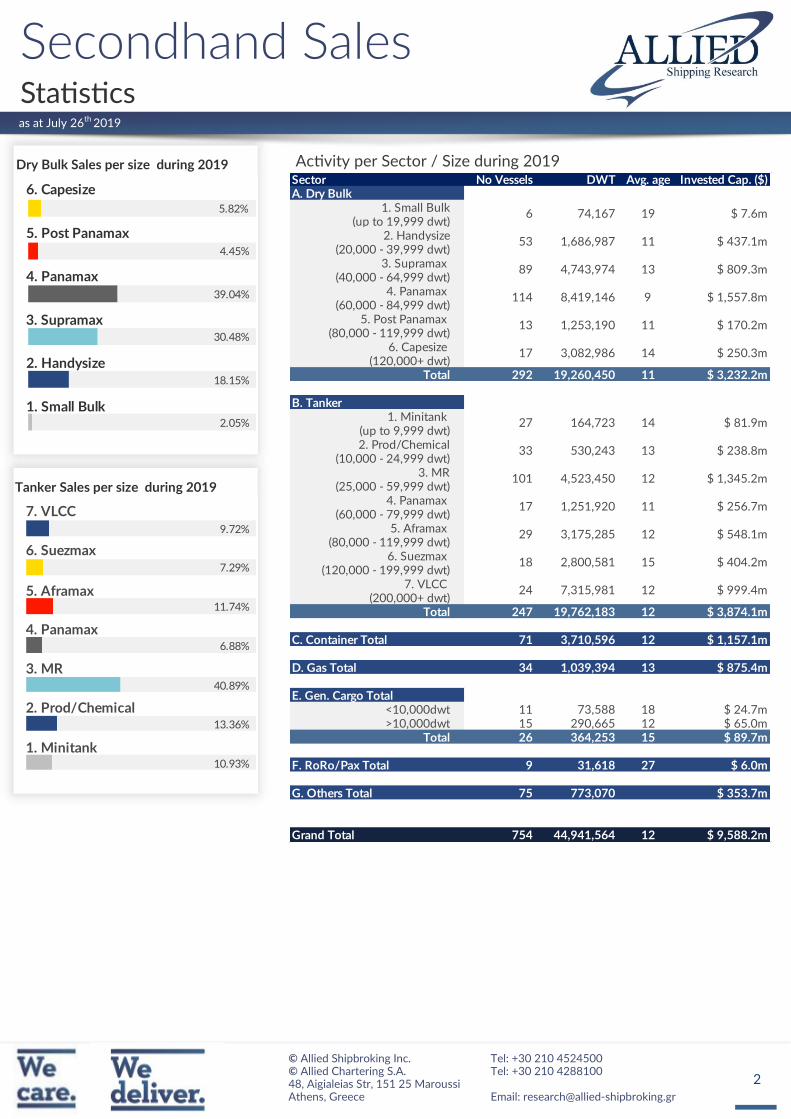
Sector No Vessels DWT Avg. age Invested Cap. ($)A. Dry Bulk
1. Small Bulk(up to 19,999 dwt)
2. Handysize(20,000 - 39,999 dwt)
3. Supramax (40,000 - 64,999 dwt)
4. Panamax (60,000 - 84,999 dwt)
5. Post Panamax (80,000 - 119,999 dwt)
6. Capesize (120,000+ dwt)
Total 292 19,260,450 11 $ 3,232.2m
B. Tanker1. Minitank
(up to 9,999 dwt)2. Prod/Chemical
(10,000 - 24,999 dwt)3. MR
(25,000 - 59,999 dwt)4. Panamax
(60,000 - 79,999 dwt)5. Aframax
(80,000 - 119,999 dwt)6. Suezmax
(120,000 - 199,999 dwt)7. VLCC
(200,000+ dwt)Total 247 19,762,183 12 $ 3,874.1m
C. Container Total 71 3,710,596 12 $ 1,157.1m
D. Gas Total 34 1,039,394 13 $ 875.4m
E. Gen. Cargo Total<10,000dwt 11 73,588 18 $ 24.7m>10,000dwt 15 290,665 12 $ 65.0m
Total 26 364,253 15 $ 89.7m
F. RoRo/Pax Total 9 31,618 27 $ 6.0m
G. Others Total 75 773,070 $ 353.7m
Grand Total 754 44,941,564 12 $ 9,588.2m
114 $ 1,557.8m
7,315,981
3,175,285
2,800,581
4,523,450
3,082,986
164,723
8,419,146
17 $ 250.3m
27 $ 81.9m
13 1,253,190 $ 170.2m
6 $ 7.6m
53 $ 437.1m
89 $ 809.3m4,743,974
74,167
1,686,987
19
11
13
17 $ 256.7m
$ 238.8m
14
13
1,251,920
33 530,243
12
11
101 $ 1,345.2m
24 $ 999.4m12
12
15
29 $ 548.1m
18 $ 404.2m
9
11
14
as at July 26th 2019
Dry Bulk Sales per size during 2019
7. VLCC
5. Aframax
4. Panamax
3. MR
2. Prod/Chemical
1. Minitank
6. Suezmax
9.72%
7.29%
11.74%
6.88%
40.89%
13.36%
10.93%
6. Capesize
5. Post Panamax
4. Panamax
3. Supramax
2. Handysize
1. Small Bulk
5.82%
4.45%
39.04%
30.48%
18.15%
2.05%
Tanker Sales per size during 2019
3
as at July 26th 2019
020406080
100120140160180
Jan
uary
Feb
ruar
y
Mar
ch
Ap
ril
May
June
July
Au
gust
Sep
tem
ber
Oct
obe
r
No
vem
ber
Dec
em
ber
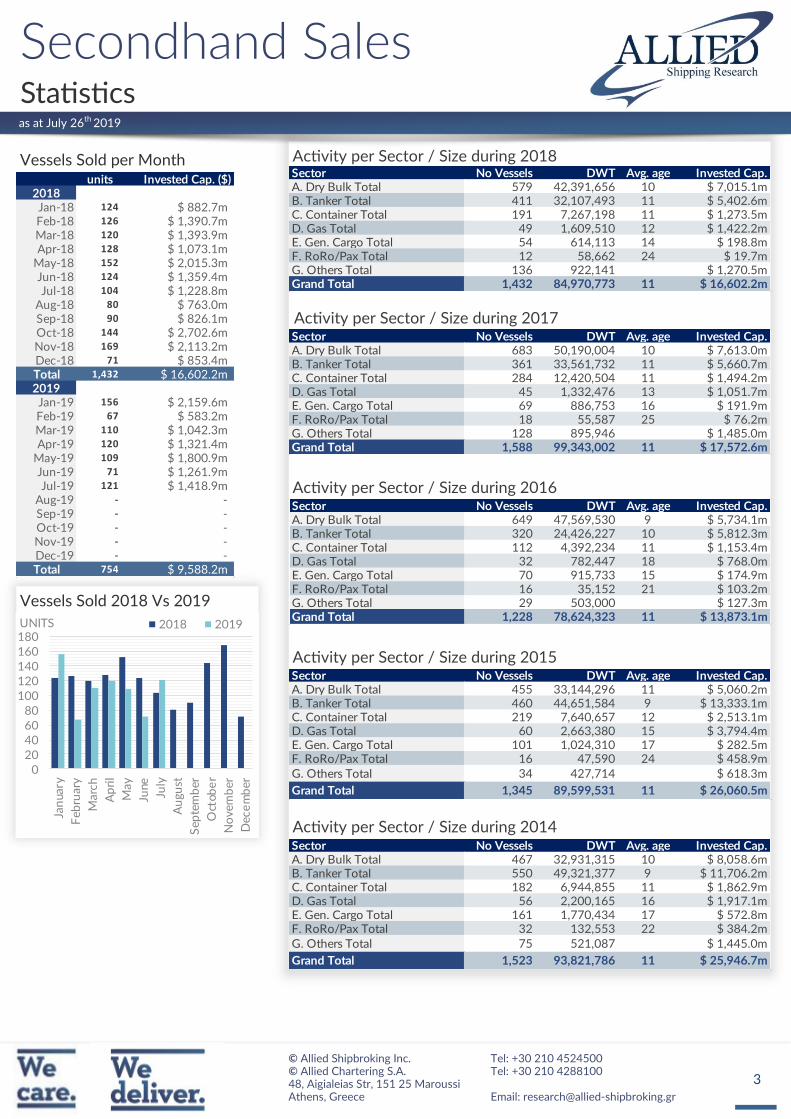
UNITS 2018 2019
Vessels Sold per Month
Vessels Sold 2018 Vs 2019
units Invested Cap. ($)2018Jan-18 124 $ 882.7m Feb-18 126 $ 1,390.7m Mar-18 120 $ 1,393.9m Apr-18 128 $ 1,073.1m
May-18 152 $ 2,015.3m Jun-18 124 $ 1,359.4m Jul-18 104 $ 1,228.8m
Aug-18 80 $ 763.0m Sep-18 90 $ 826.1m Oct-18 144 $ 2,702.6m Nov-18 169 $ 2,113.2m Dec-18 71 $ 853.4m Total 1,432 $ 16,602.2m 2019Jan-19 156 $ 2,159.6m Feb-19 67 $ 583.2m Mar-19 110 $ 1,042.3m Apr-19 120 $ 1,321.4m
May-19 109 $ 1,800.9m Jun-19 71 $ 1,261.9m Jul-19 121 $ 1,418.9m
Aug-19 - - Sep-19 - - Oct-19 - - Nov-19 - - Dec-19 - - Total 754 $ 9,588.2m
Sector No Vessels DWT Avg. age Invested Cap.A. Dry Bulk Total 579 42,391,656 10 $ 7,015.1mB. Tanker Total 411 32,107,493 11 $ 5,402.6mC. Container Total 191 7,267,198 11 $ 1,273.5mD. Gas Total 49 1,609,510 12 $ 1,422.2mE. Gen. Cargo Total 54 614,113 14 $ 198.8mF. RoRo/Pax Total 12 58,662 24 $ 19.7mG. Others Total 136 922,141 $ 1,270.5mGrand Total 1,432 84,970,773 11 $ 16,602.2m
Sector No Vessels DWT Avg. age Invested Cap.A. Dry Bulk Total 683 50,190,004 10 $ 7,613.0mB. Tanker Total 361 33,561,732 11 $ 5,660.7mC. Container Total 284 12,420,504 11 $ 1,494.2mD. Gas Total 45 1,332,476 13 $ 1,051.7mE. Gen. Cargo Total 69 886,753 16 $ 191.9mF. RoRo/Pax Total 18 55,587 25 $ 76.2mG. Others Total 128 895,946 $ 1,485.0mGrand Total 1,588 99,343,002 11 $ 17,572.6m
Sector No Vessels DWT Avg. age Invested Cap.A. Dry Bulk Total 649 47,569,530 9 $ 5,734.1mB. Tanker Total 320 24,426,227 10 $ 5,812.3mC. Container Total 112 4,392,234 11 $ 1,153.4mD. Gas Total 32 782,447 18 $ 768.0mE. Gen. Cargo Total 70 915,733 15 $ 174.9mF. RoRo/Pax Total 16 35,152 21 $ 103.2mG. Others Total 29 503,000 $ 127.3mGrand Total 1,228 78,624,323 11 $ 13,873.1m
Sector No Vessels DWT Avg. age Invested Cap.A. Dry Bulk Total 455 33,144,296 11 $ 5,060.2mB. Tanker Total 460 44,651,584 9 $ 13,333.1mC. Container Total 219 7,640,657 12 $ 2,513.1mD. Gas Total 60 2,663,380 15 $ 3,794.4mE. Gen. Cargo Total 101 1,024,310 17 $ 282.5mF. RoRo/Pax Total 16 47,590 24 $ 458.9mG. Others Total 34 427,714 $ 618.3m
Grand Total 1,345 89,599,531 11 $ 26,060.5m
Sector No Vessels DWT Avg. age Invested Cap.A. Dry Bulk Total 467 32,931,315 10 $ 8,058.6mB. Tanker Total 550 49,321,377 9 $ 11,706.2mC. Container Total 182 6,944,855 11 $ 1,862.9mD. Gas Total 56 2,200,165 16 $ 1,917.1mE. Gen. Cargo Total 161 1,770,434 17 $ 572.8mF. RoRo/Pax Total 32 132,553 22 $ 384.2mG. Others Total 75 521,087 $ 1,445.0m
Grand Total 1,523 93,821,786 11 $ 25,946.7m
4
as at July 26th 2019
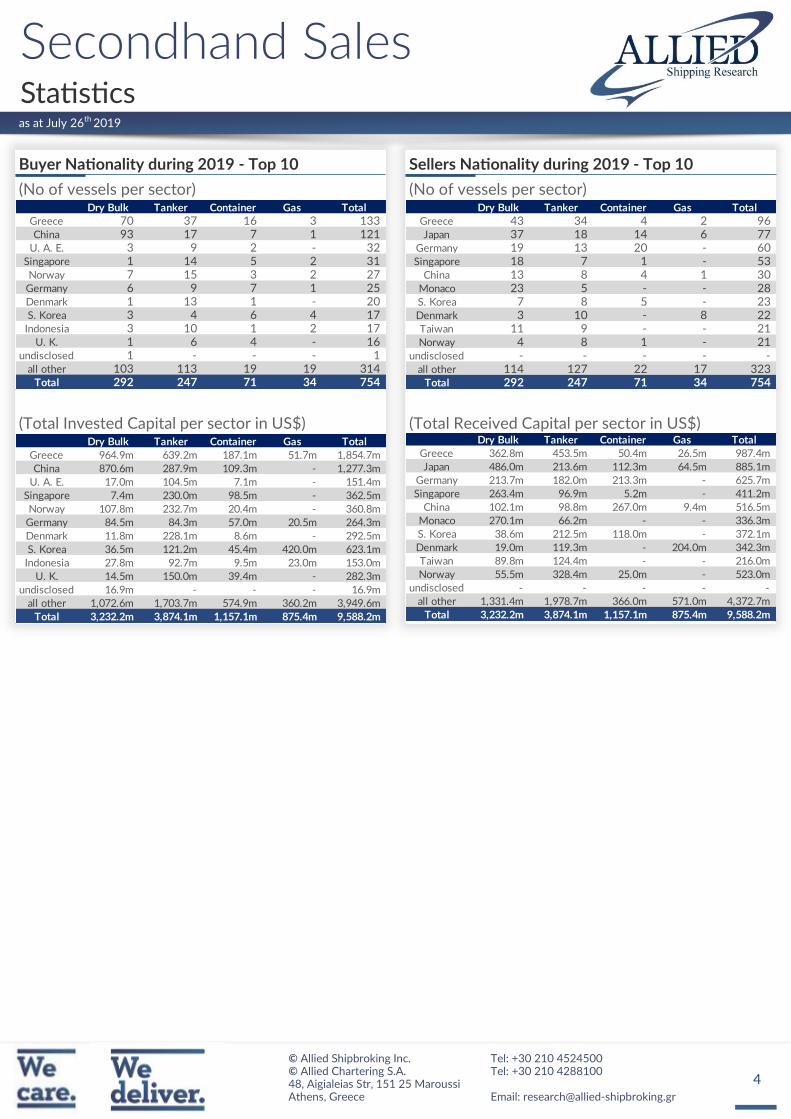
Buyer Nationality during 2019 - Top 10
(No of vessels per sector)
(Total Invested Capital per sector in US$)
Sellers Nationality during 2019 - Top 10
(No of vessels per sector)
(Total Received Capital per sector in US$)
Dry Bulk Tanker Container Gas Total
Greece 70 37 16 3 133 China 93 17 7 1 121
U. A. E. 3 9 2 - 32 Singapore 1 14 5 2 31 Norway 7 15 3 2 27
Germany 6 9 7 1 25 Denmark 1 13 1 - 20 S. Korea 3 4 6 4 17
Indonesia 3 10 1 2 17 U. K. 1 6 4 - 16
undisclosed 1 - - - 1 all other 103 113 19 19 314
Total 292 247 71 34 754
Dry Bulk Tanker Container Gas Total
Greece 964.9m 639.2m 187.1m 51.7m 1,854.7m
China 870.6m 287.9m 109.3m - 1,277.3m
U. A. E. 17.0m 104.5m 7.1m - 151.4m
Singapore 7.4m 230.0m 98.5m - 362.5m
Norway 107.8m 232.7m 20.4m - 360.8m
Germany 84.5m 84.3m 57.0m 20.5m 264.3m
Denmark 11.8m 228.1m 8.6m - 292.5m
S. Korea 36.5m 121.2m 45.4m 420.0m 623.1m
Indonesia 27.8m 92.7m 9.5m 23.0m 153.0m
U. K. 14.5m 150.0m 39.4m - 282.3m
undisclosed 16.9m - - - 16.9m
all other 1,072.6m 1,703.7m 574.9m 360.2m 3,949.6m
Total 3,232.2m 3,874.1m 1,157.1m 875.4m 9,588.2m
Dry Bulk Tanker Container Gas Total
Greece 43 34 4 2 96 Japan 37 18 14 6 77
Germany 19 13 20 - 60 Singapore 18 7 1 - 53
China 13 8 4 1 30 Monaco 23 5 - - 28 S. Korea 7 8 5 - 23 Denmark 3 10 - 8 22 Taiwan 11 9 - - 21 Norway 4 8 1 - 21
undisclosed - - - - - all other 114 127 22 17 323
Total 292 247 71 34 754
Dry Bulk Tanker Container Gas Total
Greece 362.8m 453.5m 50.4m 26.5m 987.4m
Japan 486.0m 213.6m 112.3m 64.5m 885.1m
Germany 213.7m 182.0m 213.3m - 625.7m
Singapore 263.4m 96.9m 5.2m - 411.2m
China 102.1m 98.8m 267.0m 9.4m 516.5m
Monaco 270.1m 66.2m - - 336.3m
S. Korea 38.6m 212.5m 118.0m - 372.1m
Denmark 19.0m 119.3m - 204.0m 342.3m
Taiwan 89.8m 124.4m - - 216.0m
Norway 55.5m 328.4m 25.0m - 523.0m
undisclosed - - - - -
all other 1,331.4m 1,978.7m 366.0m 571.0m 4,372.7m
Total 3,232.2m 3,874.1m 1,157.1m 875.4m 9,588.2m
5
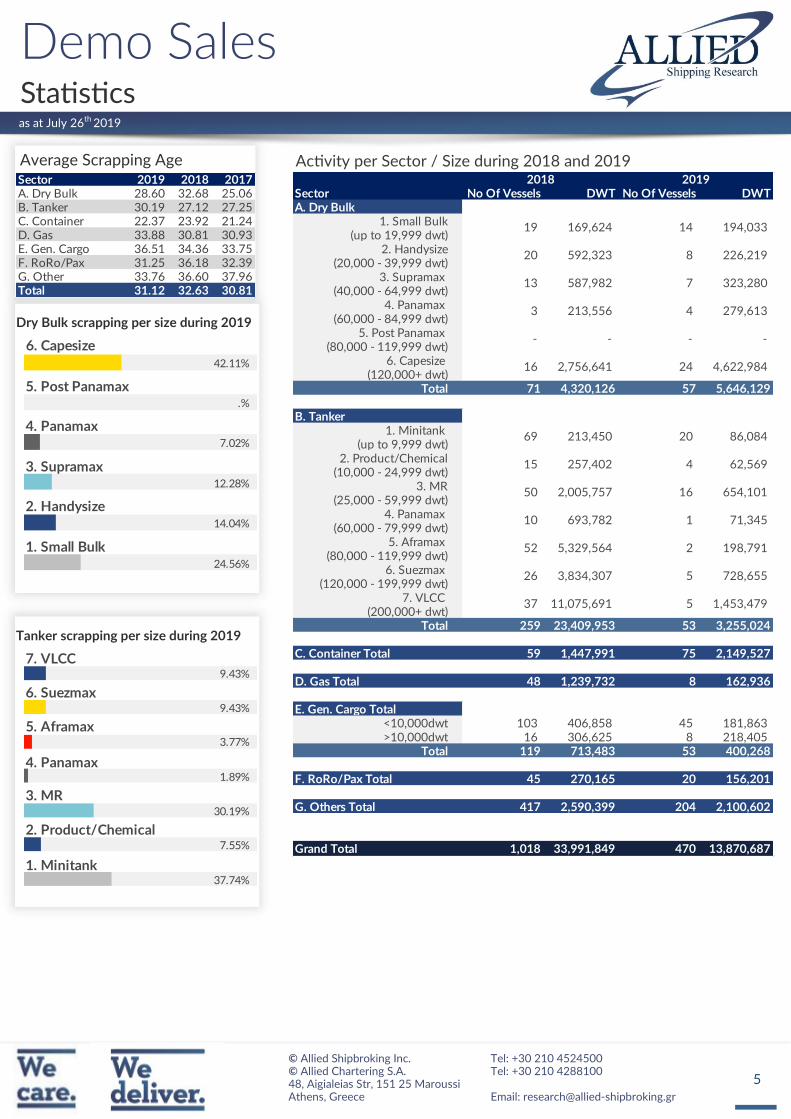
Sector No Of Vessels DWT No Of Vessels DWTA. Dry Bulk
1. Small Bulk(up to 19,999 dwt)
2. Handysize(20,000 - 39,999 dwt)
3. Supramax (40,000 - 64,999 dwt)
4. Panamax (60,000 - 84,999 dwt)
5. Post Panamax (80,000 - 119,999 dwt)
6. Capesize (120,000+ dwt)
Total 71 4,320,126 57 5,646,129
B. Tanker1. Minitank
(up to 9,999 dwt)2. Product/Chemical
(10,000 - 24,999 dwt)3. MR
(25,000 - 59,999 dwt)4. Panamax
(60,000 - 79,999 dwt)5. Aframax
(80,000 - 119,999 dwt)6. Suezmax
(120,000 - 199,999 dwt)7. VLCC
(200,000+ dwt)Total 259 23,409,953 53 3,255,024
C. Container Total 59 1,447,991 75 2,149,527
D. Gas Total 48 1,239,732 8 162,936
E. Gen. Cargo Total<10,000dwt 103 406,858 45 181,863 >10,000dwt 16 306,625 8 218,405
Total 119 713,483 53 400,268
F. RoRo/Pax Total 45 270,165 20 156,201
G. Others Total 417 2,590,399 204 2,100,602
Grand Total 1,018 33,991,849 470 13,870,687
2018 2019
19 169,624 14 194,033
20 592,323
69 213,450 20 86,084
- - - -
50 2,005,757 16 654,101
15 257,402 4 62,569
16 2,756,641 24 4,622,984
52 5,329,564 2 198,791
10 693,782 1 71,345
37 11,075,691 5 1,453,479
26 3,834,307 5 728,655
3 213,556 4 279,613
8 226,219
13 587,982 7 323,280
as at July 26th 2019
Sector 2019 2018 2017A. Dry Bulk 28.60 32.68 25.06B. Tanker 30.19 27.12 27.25C. Container 22.37 23.92 21.24D. Gas 33.88 30.81 30.93E. Gen. Cargo 36.51 34.36 33.75F. RoRo/Pax 31.25 36.18 32.39G. Other 33.76 36.60 37.96Total 31.12 32.63 30.81
7. VLCC
6. Suezmax
5. Aframax
4. Panamax
3. MR
2. Product/Chemical
1. Minitank
9.43%
9.43%
3.77%
1.89%
30.19%
7.55%
37.74%
6. Capesize
5. Post Panamax
4. Panamax
3. Supramax
2. Handysize
1. Small Bulk
42.11%
.%
7.02%
12.28%
14.04%
24.56%
Average Scrapping Age
Dry Bulk scrapping per size during 2019
Tanker scrapping per size during 2019
6
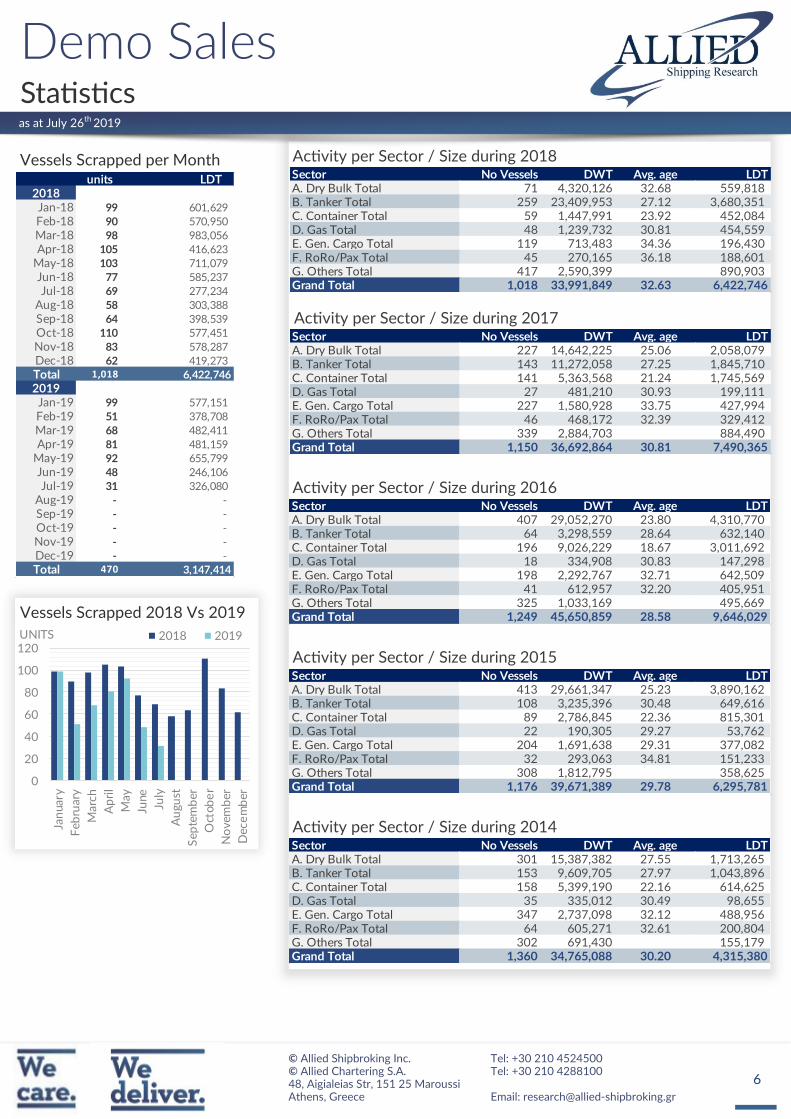
units LDT2018Jan-18 99 601,629
Feb-18 90 570,950
Mar-18 98 983,056
Apr-18 105 416,623
May-18 103 711,079
Jun-18 77 585,237
Jul-18 69 277,234
Aug-18 58 303,388
Sep-18 64 398,539
Oct-18 110 577,451
Nov-18 83 578,287
Dec-18 62 419,273
Total 1,018 6,422,746
2019Jan-19 99 577,151
Feb-19 51 378,708
Mar-19 68 482,411
Apr-19 81 481,159
May-19 92 655,799
Jun-19 48 246,106
Jul-19 31 326,080
Aug-19 - -
Sep-19 - -
Oct-19 - -
Nov-19 - -
Dec-19 - -
Total 470 3,147,414
as at July 26th 2019
0
20
40
60
80
100
120
Jan
uary
Feb
ruar
y
Mar
ch
Ap
ril
May
June
July
Au
gust
Sep
tem
ber
Oct
obe
r
No
vem
ber
Dec
em
ber
UNITS 2018 2019
Vessels Scrapped per Month
Vessels Scrapped 2018 Vs 2019
Sector No Vessels DWT Avg. age LDTA. Dry Bulk Total 71 4,320,126 32.68 559,818 B. Tanker Total 259 23,409,953 27.12 3,680,351 C. Container Total 59 1,447,991 23.92 452,084 D. Gas Total 48 1,239,732 30.81 454,559 E. Gen. Cargo Total 119 713,483 34.36 196,430 F. RoRo/Pax Total 45 270,165 36.18 188,601 G. Others Total 417 2,590,399 890,903 Grand Total 1,018 33,991,849 32.63 6,422,746
Sector No Vessels DWT Avg. age LDTA. Dry Bulk Total 227 14,642,225 25.06 2,058,079 B. Tanker Total 143 11,272,058 27.25 1,845,710 C. Container Total 141 5,363,568 21.24 1,745,569 D. Gas Total 27 481,210 30.93 199,111 E. Gen. Cargo Total 227 1,580,928 33.75 427,994 F. RoRo/Pax Total 46 468,172 32.39 329,412 G. Others Total 339 2,884,703 884,490 Grand Total 1,150 36,692,864 30.81 7,490,365
Sector No Vessels DWT Avg. age LDTA. Dry Bulk Total 407 29,052,270 23.80 4,310,770 B. Tanker Total 64 3,298,559 28.64 632,140 C. Container Total 196 9,026,229 18.67 3,011,692 D. Gas Total 18 334,908 30.83 147,298 E. Gen. Cargo Total 198 2,292,767 32.71 642,509 F. RoRo/Pax Total 41 612,957 32.20 405,951 G. Others Total 325 1,033,169 495,669 Grand Total 1,249 45,650,859 28.58 9,646,029
Sector No Vessels DWT Avg. age LDTA. Dry Bulk Total 413 29,661,347 25.23 3,890,162 B. Tanker Total 108 3,235,396 30.48 649,616 C. Container Total 89 2,786,845 22.36 815,301 D. Gas Total 22 190,305 29.27 53,762 E. Gen. Cargo Total 204 1,691,638 29.31 377,082 F. RoRo/Pax Total 32 293,063 34.81 151,233 G. Others Total 308 1,812,795 358,625 Grand Total 1,176 39,671,389 29.78 6,295,781
Sector No Vessels DWT Avg. age LDTA. Dry Bulk Total 301 15,387,382 27.55 1,713,265 B. Tanker Total 153 9,609,705 27.97 1,043,896 C. Container Total 158 5,399,190 22.16 614,625 D. Gas Total 35 335,012 30.49 98,655 E. Gen. Cargo Total 347 2,737,098 32.12 488,956 F. RoRo/Pax Total 64 605,271 32.61 200,804 G. Others Total 302 691,430 155,179 Grand Total 1,360 34,765,088 30.20 4,315,380
7
as at July 26th 2019
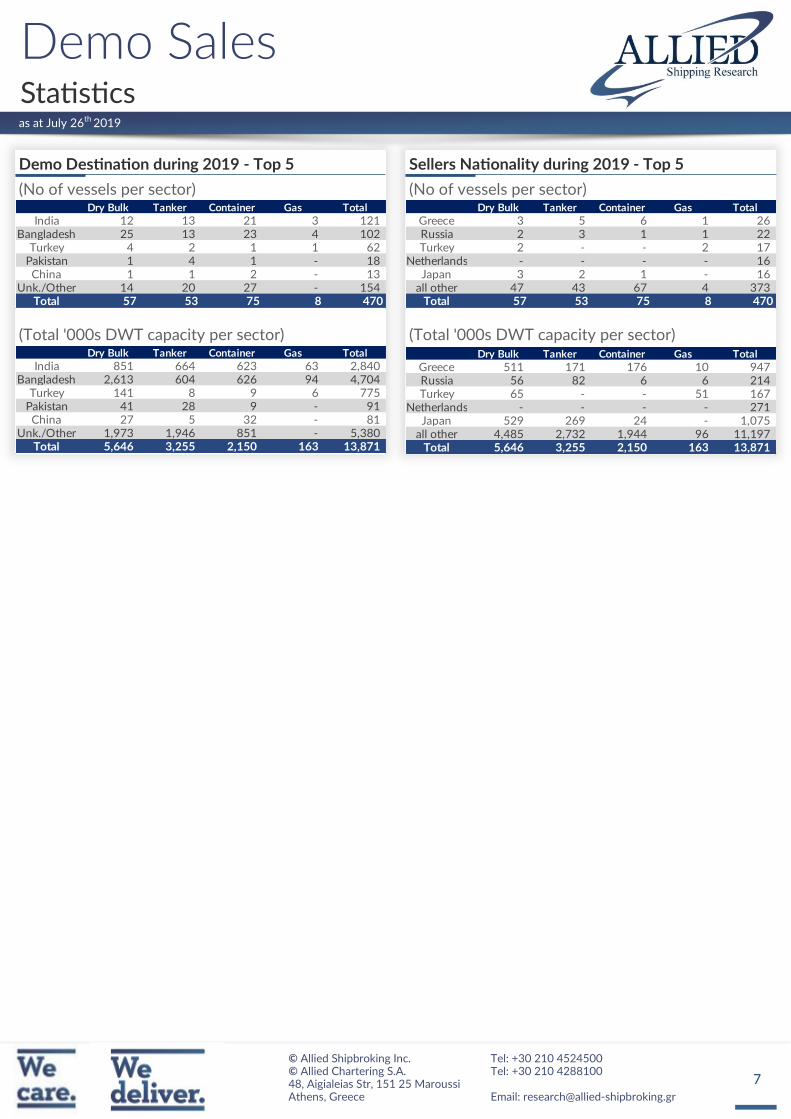
Demo Destination during 2019 - Top 5
(No of vessels per sector)
(Total '000s DWT capacity per sector)
Sellers Nationality during 2019 - Top 5
(No of vessels per sector)
(Total '000s DWT capacity per sector)
Dry Bulk Tanker Container Gas Total
India 12 13 21 3 121 Bangladesh 25 13 23 4 102
Turkey 4 2 1 1 62 Pakistan 1 4 1 - 18 China 1 1 2 - 13
Unk./Other 14 20 27 - 154 Total 57 53 75 8 470
Dry Bulk Tanker Container Gas Total
India 851 664 623 63 2,840 Bangladesh 2,613 604 626 94 4,704
Turkey 141 8 9 6 775 Pakistan 41 28 9 - 91 China 27 5 32 - 81
Unk./Other 1,973 1,946 851 - 5,380 Total 5,646 3,255 2,150 163 13,871
Dry Bulk Tanker Container Gas Total
Greece 3 5 6 1 26 Russia 2 3 1 1 22 Turkey 2 - - 2 17
Netherlands - - - - 16 Japan 3 2 1 - 16
all other 47 43 67 4 373 Total 57 53 75 8 470
Dry Bulk Tanker Container Gas Total
Greece 511 171 176 10 947 Russia 56 82 6 6 214 Turkey 65 - - 51 167
Netherlands - - - - 271 Japan 529 269 24 - 1,075
all other 4,485 2,732 1,944 96 11,197 Total 5,646 3,255 2,150 163 13,871
8
AERAKIS GEORGEMOBILE: +30 6946 04 57 37
BOLIS ILIASMOBILE: +30 6937 02 65 00
DASKALAKIS GEORGEMOBILE: +30 6932 24 80 07
DRAKOGIANNOPOULOS STAVROSMOBILE: +30 6932 20 15 65
DRAKOGIANNOPOULOS SAKISMOBILE: +30 6944 88 58 08
FRANGOS HARRISMOBILE: +30 6936 57 67 00
KLONIZAKIS JOHNMOBILE: +30 6948 50 55 81
KOSTOYANNIS JOHNMOBILE: +30 6932 43 39 99
MANOLAS NIKOLASMOBILE: +30 6940 63 22 56
MOISSOGLOU THEODOROSMOBILE: +30 6932 45 52 41
PAPAIOANNOU ANTONISMOBILE: +30 6936 54 80 22
PAPOUIS THASSOSMOBILE: +30 6944 29 49 89
PRACHALIAS ARGIRISMOBILE: +30 6947 62 82 62
STASSINAKIS JOHNMOBILE: +30 6972 60 92 09
TSALPATOUROS COSTISMOBILE: +30 6932 20 15 63
VARVAROS PLUTONMOBILE: +30 6937 25 15 15
Maritime Research & ValuationsCHASAPIS THOMAS
MOBILE: +30 6947 82 91 72LAZARIDIS GEORGE
MOBILE: +30 6946 95 69 40VAMVAKAS YIANNIS
MOBILE: +30 6942 94 71 87
Sale & Purchase
ALLIED SHIPBROKING INC. 48, Aigialeias Street, 4th Floor, Maroussi 151 25, Greece Tel: +30 210 45 24 500 Fax: +30 210 45 25 017/ 019 E-mail: [email protected]
ALLIED CHARTERING S.A. 48, Aigialeias Street, 4th Floor, Maroussi 151 25, Greece Tel : +30 210 42 88 100 Fax: +30 210 45 24 201
E-mail: [email protected]
E-mail: [email protected]
ALEXOPOULOS PANOS MOBILE: +30 6944 34 66 15
ARGYRI MARINAMOBILE: +30 6983 11 32 98
FLOURIS DIMITRISMOBILE: +30 6937 81 32 39
KAILAS VAGGELISMOBILE: +30 6942 48 05 69
KANELLOS DIMITRIS MOBILE: +30 6945 07 47 85
KAPPA ANGELIKI MOBILE: +30 6975 85 60 84
KARAMANIS COSTASMOBILE: +30 6941 54 14 65
PATELIS DIMITRIS MOBILE: +30 6944 04 43 61
THEODOTOS ARISTOFANIS MOBILE: +30 6951 79 82 89
TSALPATOUROU ANASTASIAMOBILE: +30 6951 79 82 91
TSALPATOUROU MARGARITA MOBILE: +30 6934 74 22 16
Tanker CharteringFLOURIS JOHN
MOBILE: +30 6955 80 15 03 PAPANTONOPOULOS NICOLAS
MOBILE: +30 6945 23 21 88STERGIOPOULOS ALEXANDROS
MOBILE: +30 6951 79 82 91
Dry Cargo Chartering
9
Disclaimer
The information contained within this report has been provided by Allied Shipbroking Inc. and Allied Chartering S.A. for general information
purposes.
All the information is compiled through Allied Shipbroking Inc. and Allied Chartering S.A. databases, as well as from other market sources. De-
spite having taken reasonable care in the gathering, filtering and auditing of this information and believing that the information is accurate and
correct, it may still contain errors, as a lot of the views regarding market levels are partially derived from estimates and/or subject judgments
while the reported transaction activity is gathered from several sources and rumors, some of which are sometimes hard to validate in full their
accuracy and truthfulness. As such we advise that the information be taken cautiously, while advising that this information does not obviate the
need to also make further enquiries and seek further information in order to obtain a more accurate outlook. As we make no warranties of any
kind, both expressed or implied, as to the completeness, accuracy, reliability or completeness of the information herein, Allied Shipbroking Inc.
and its connected persons shall not be held liable to any loss or damage of any kind, including direct, indirect and/or consequential damages
caused by negligence of any kind on our part.
Any choice to rely on this information provided is strictly at the recipient’s own risk.
This report and its information is confidential and solely for the internal use of its recipients, while any re-production or re-distribution of the
report and its material is strictly prohibited without prior permission from Allied Shipbroking Inc.
If you wish to subscribe to this or any other report we produce, please contact us directly.
Recommended