368
List of Subjects
42 CFR Part 412
Administrative practice and procedure, Health
facilities, Medicare, Puerto Rico, Reporting and
recordkeeping requirements.
42 CFR Part 413
Health facilities, Kidney diseases, Medicare, Puerto
Rico, Reporting and recordkeeping requirements.
42 CFR Chapter IV is amended as set forth below:
PART 412--PROSPECTIVE PAYMENT SYSTEMS FOR INPATIENT
HOSPITAL SERVICES
A. Part 412 is amended as follows:
1. The authority citation for part 412 continues to
read as follows:
Authority: Secs. 1102 and 1871 of the Social Security
Act (42 U.S.C. 1302 and 1395hh).
Subpart A--General Provisions
2. Section §412.1 is revised to read as follows:
§412.1 Scope of part.
(a) Purpose. (1) This part implements
sections 1886(d) and (g) of the Act by establishing a
prospective payment system for the operating costs of
inpatient hospital services furnished to Medicare

369
beneficiaries in cost reporting periods beginning on or
after October 1, 1983 and a prospective payment system for
the capital-related costs of inpatient hospital services
furnished to Medicare beneficiaries in cost reporting
periods beginning on or after October 1, 1991. Under these
prospective payment systems, payment for the operating and
capital-related costs of inpatient hospital services
furnished by hospitals subject to the systems (generally,
short-term, acute-care hospitals) is made on the basis of
prospectively determined rates and applied on a per
discharge basis. Payment for other costs related to
inpatient hospital services (organ acquisition costs
incurred by hospitals with approved organ transplantation
centers, the costs of qualified nonphysician anesthetist's
services, as described in §412.113(c), and direct costs of
approved nursing and allied health educational programs) is
made on a reasonable cost basis. Payment for the direct
costs of graduate medical education is made on a per
resident amount basis in accordance with §413.86 of this
chapter. Additional payments are made for outlier cases,
bad debts, indirect medical education costs, and for
serving a disproportionate share of low-income patients.
Under either prospective payment system, a hospital may

370
keep the difference between its prospective payment rate
and its operating or capital-related costs incurred in
furnishing inpatient services, and the hospital is at risk
for inpatient operating or inpatient capital-related costs
that exceed its payment rate.
(2) This part implements section 1886(j) of the Act
by establishing a prospective payment system for the
inpatient operating and capital costs of inpatient hospital
services furnished to Medicare beneficiaries by a
rehabilitation hospital or rehabilitation unit that meets
the conditions of §412.604.
(b) Summary of content. (1) This subpart describes
the basis of payment for inpatient hospital services under
the prospective payment systems specified in paragraph
(a)(1) of this section and sets forth the general basis of
these systems.
(2) Subpart B sets forth the classifications of
hospitals that are included in and excluded from the
prospective payment systems specified in paragraph (a)(1)
of this section, and sets forth requirements governing the
inclusion or exclusion of hospitals in the systems as a
result of changes in their classification.

371
(3) Subpart C sets forth certain conditions that must
be met for a hospital to receive payment under the
prospective payment systems specified in paragraph (a)(1)
of this section.
(4) Subpart D sets forth the basic methodology by
which prospective payment rates for inpatient operating
costs are determined under the prospective payment system
specified in paragraph (a)(1) of this section.
(5) Subpart E describes the transition ratesetting
methods that are used to determine transition payment rates
for inpatient operating costs during the first 4 years of
the prospective payment system specified in
paragraph (a)(1) of this section.
(6) Subpart F sets forth the methodology for
determining payments for outlier cases under the
prospective payment system specified in paragraph (a)(1) of
this section.
(7) Subpart G sets forth rules for special treatment
of certain facilities under the prospective payment system
specified in paragraph (a)(1) of this section for inpatient
operating costs.
(8) Subpart H describes the types, amounts, and
methods of payment to hospitals under the prospective

372
payment system specified in paragraph (a)(1) of this
section for inpatient operating costs.
(9) Subpart K describes how the prospective payment
system specified in paragraph (a)(1) of this section for
inpatient operating costs is implemented for hospitals
located in Puerto Rico.
(10) Subpart L sets forth the procedures and criteria
concerning applications from hospitals to the Medicare
Geographic Classification Review Board for geographic
redesignation under the prospective payment systems
specified in paragraph (a)(1) of this section.
(11) Subpart M describes how the prospective payment
system specified in paragraph (a)(1) of this section for
inpatient capital-related costs is implemented effective
with reporting periods beginning on or after
October 1, 1991.
(12) Subpart P describes the prospective payment
system specified in paragraph (a)(2) of this section for
rehabilitation hospitals and rehabilitation units and sets
forth the general methodology for paying for the operating
and capital-related costs of inpatient hospital services
furnished by rehabilitation hospitals and rehabilitation

373
units effective with cost reporting periods beginning on or
after January 1, 2002.
Subpart B--Hospital Services Subject to and Excluded from
the Prospective Payment Systems for Inpatient Operating
Costs and Inpatient Capital-Related Costs
3. Section 412.20 is amended by:
A. Revising paragraph (a).
B. Redesignating paragraph (b) as paragraph (c).
C. Adding a new paragraph (b).
D. Revising the introductory text of the redesignated
paragraph (c).
§412.20 Hospital services subject to the prospective
payment systems.
(a) Except for services described in paragraphs (b)
and (c) of this section, all covered inpatient hospital
services furnished to beneficiaries during subject cost
reporting periods are paid under the prospective payment
systems specified in §412.1(a)(1).
(b) Effective for cost reporting periods beginning on
or after January 1, 2002, covered inpatient hospital
services furnished to Medicare beneficiaries by a
rehabilitation hospital or rehabilitation unit that meet

374
the conditions of §412.604 are paid under the prospective
payment system described in subpart P of this part.
(c) Inpatient hospital services will not be paid
under the prospective payment systems specified in
§412.1(a)(1) under any of the following circumstances:
* * * * *
4. Section 412.22 is amended by:
A. Revising paragraphs (a) and (b).
B. Revising the introductory text of paragraph (e).
C. Revising introductory text of paragraph (h)(2).
§412.22 Excluded hospitals and hospital units: General
rules.
(a) Criteria. Subject to the criteria set forth in
paragraph (e) of this section, a hospital is excluded from
the prospective payment systems specified in §412.1(a)(1)
of this part if it meets the criteria for one or more of
the excluded classifications described in §412.23.
(b) Cost reimbursement. Except for those hospitals
specified in paragraph (c) of this section and §412.20(b),
all excluded hospitals (and excluded hospital units, as
described in §§412.23 through 412.29) are reimbursed under
the cost reimbursement rules set forth in part 413 of this
subchapter, and are subject to the ceiling on the rate of

375
hospital cost increases described in §413.40 of this
subchapter.
* * * * *
(e) Hospitals within hospitals. Except as provided
in paragraph (f) of this section, for cost reporting
periods beginning on or after October 1, 1997, a hospital
that occupies space in a building also used by another
hospital, or in one or more entire buildings located on the
same campus as buildings used by another hospital, must
meet the following criteria in order to be excluded from
the prospective payment systems specified in §412.1(a)(1):
* * * * *
(h) Satellite facilities. * * *
(2) Except as provided in paragraph (h)(3) of this
section, effective for cost reporting periods beginning on
or after October 1, 1999, a hospital that has a satellite
facility must meet the following criteria in order to be
excluded from the prospective payment systems specified in
§412.1(a)(1) for any period:
* * * * *
5. Section 412.23 is amended by:
A. Revising the introductory text of the section.

376
B. Revising the introductory text of paragraph (b).
C. Revising paragraphs (b)(2) introductory text,
(b)(8), and (b)(9).
§412.23 Excluded hospitals: Classifications.
Hospitals that meet the requirements for the
classifications set forth in this section are not
reimbursed under the prospective payment systems specified
in §412.1(a)(1):
* * * * *
(b) Rehabilitation hospitals. A rehabilitation
hospital must meet the following requirements to be
excluded from the prospective payment systems specified in
§412.1(a)(1) and to be paid under the prospective payment
system specified in §412.1(a)(2) and in Subpart P of this
part:
* * * * *
(2) Except in the case of a newly participating
hospital seeking classification under this paragraph as a
rehabilitation hospital for its first 12-month cost
reporting period, as described in paragraph (b)(8) of this
section, show that during its most recent 12-month cost
reporting period, it served an inpatient population of whom
at least 75 percent required intensive rehabilitative

377
services for treatment of one or more of the following
conditions:
* * * * *
(8) A hospital that seeks classification under this
paragraph as a rehabilitation hospital for the first full
12-month cost reporting period that occurs after it becomes
a Medicare-participating hospital may provide a written
certification that the inpatient population it intends to
serve meets the requirements of paragraph (b)(2) of this
section, instead of showing that it has treated that
population during its most recent 12-month cost reporting
period. The written certification is also effective for
any cost reporting period of not less than one month and
not more than 11 months occurring between the date the
hospital began participating in Medicare and the start of
the hospital’s regular 12-month cost reporting period.
(9) For cost reporting periods beginning on or after
October 1, 1991, if a hospital is excluded from the
prospective payment systems specified in §412.1(a)(1) or is
paid under the prospective payment system specified in
§412.1(a)(2) for a cost reporting period under paragraph
(b)(8) of this section, but the inpatient population it
actually treated during that period does not meet the

378
requirements of paragraph (b)(2) of this section, we adjust
payments to the hospital retroactively in accordance with
the provisions in §412.130.
* * * * *
6. In §412.25, paragraph (a) introductory text and
paragraph (e)(2) introductory text are revised to read as
follows:
§412.25 Excluded hospital units: Common requirements.
(a) Basis for exclusion. In order to be excluded
from the prospective payment systems specified in
§412.1(a)(1), a psychiatric or rehabilitation unit must
meet the following requirements.
* * * * *
(e) Satellite facilities. * * *
(2) Except as provided in paragraph (e)(3) of this
section, effective for cost reporting periods beginning on
or after October 1, 1999, a hospital unit that establishes
a satellite facility must meet the following requirements
in order to be excluded from the prospective payment
systems specified in §412.1(a)(1) for any period:
* * * * *
7. In §412.29, the introductory text is revised to
read as follows:

379
§412.29 Excluded rehabilitation units: Additional
requirements.
In order to be excluded from the prospective payment
systems described in §412.1(a)(1) and to be paid under the
prospective payment system specified in §412.1(a)(2), a
rehabilitation unit must meet the following requirements:
* * * * *
Subpart H--Payments to Hospitals Under the Prospective
Payment Systems
8. In §412.116, paragraph (a) is revised to read as
follows:
§412.116 Method of payment.
(a) General rule. (1) Unless the provisions of
paragraphs (b) and (c) of this section apply, hospitals are
paid for hospital inpatient operating costs and capital-
related costs for each discharge based on the submission of
a discharge bill.
(2) Payments for inpatient hospital services
furnished by an excluded psychiatric unit of a hospital (or
by an excluded rehabilitation unit of a hospital for cost
reporting periods beginning before January 1, 2002) are
made as described in §§413.64(a), (c), (d), and (e) of this
chapter.

380
(3) For cost reporting periods beginning on or after
January 1, 2002, payments for inpatient hospital services
furnished by a rehabilitation hospital or a rehabilitation
unit that meets the conditions of §412.604 are made as
described in §412.632.
* * * * *
9. In §412.130, paragraphs (a)(1), (a)(2), and (b)
are revised to read as follows:
§412.130 Retroactive adjustments for incorrectly excluded
hospitals and units.
(a) Hospitals for which adjustment is made. * * *
(1) A hospital that was excluded from the prospective
payment systems specified in §412.1(a)(1) or paid under the
prospective payment system specified in §412.1(a)(2), as a
new rehabilitation hospital for a cost reporting period
beginning on or after October 1, 1991 based on a
certification under §412.23(b)(8) of this part regarding
the inpatient population the hospital planned to treat
during that cost reporting period, if the inpatient
population actually treated in the hospital during that
cost reporting period did not meet the requirements of
§412.23(b)(2).
381
(2) A hospital that has a unit excluded from the
prospective payment systems specified in §412.1(a)(1) or
paid under the prospective payment system specified in
§412.1(a)(2), as a new rehabilitation unit for a cost
reporting period beginning on or after October 1, 1991,
based on a certification under §412.30(a) regarding the
inpatient population the hospital planned to treat in that
unit during the period, if the inpatient population
actually treated in the unit during that cost reporting
period did not meet the requirements of §412.23(b)(2).
* * * * *
(b) Adjustment of payment. (1) For cost reporting
periods beginning before January 1, 2002, the intermediary
adjusts the payment to the hospitals described in paragraph
(a) of this section as follows:
(i) The intermediary calculates the difference
between the amounts actually paid during the cost reporting
period for which the hospital, unit, or beds were first
excluded as a new hospital, new unit, or newly added beds
under subpart B of this part, and the amount that would
have been paid under the prospective payment systems
specified in §412.1(a)(1) for services furnished during
that period.

382
(ii) The intermediary makes a retroactive adjustment
for the difference between the amount paid to the hospital
based on the exclusion and the amount that would have been
paid under the prospective payment systems specified in
§412.1(a)(1).
(2) For cost reporting periods beginning on or after
January 1, 2002, the intermediary adjusts the payment to
the hospitals described in paragraph (a) of this section as
follows:
(i) The intermediary calculates the difference
between the amounts actually paid under subpart P of this
part during the cost reporting period for which the
hospital, unit, or beds were first classified as a new
hospital, new unit, or newly added beds under subpart B of
this part, and the amount that would have been paid under
the prospective payment systems specified in §412.1(a)(1)
for services furnished during that period.
(ii) The intermediary makes a retroactive adjustment
for the difference between the amount paid to the hospital
under subpart P of this part and the amount that would have
been paid under the prospective payment systems specified
in §412.1(a)(1).
383
Subparts N and O—-[Reserved]
10. Subparts N and O are added and reserved.
11. A new subpart P, consisting of §§412.600,
412.602, 412.604, 412.606, 412.608, 412.610, 412.612,
412.614, 412.616, 412.618, 412.620, 412.622, 412.624,
412.626, 412.628, 412.630, and 412.632, is added to read as
follows:
Subpart P—-Prospective Payment for Inpatient Rehabilitation
Hospitals and Rehabilitation Units
Sec.
412.600 Basis and scope of subpart.
412.602 Definitions.
412.604 Conditions for payment under the prospective
payment system for inpatient rehabilitation
facilities.
412.606 Patient assessments.
412.608 Patients' rights regarding the collection of
patient assessment data.
412.610 Assessment schedule.
412.612 Coordination of the collection of patient
assessment data.
412.614 Transmission of patient assessment data.

384
412.616 Release of information collected using the
patient assessment instrument.
412.618 Assessment process for interrupted stays.
412.620 Patient classification system.
412.622 Basis of payment.
412.624 Methodology for calculating the Federal
prospective payment rates.
412.626 Transition period.
412.628 Publication of the Federal prospective
payment rates.
412.630 Limitation on review.
412.632 Method of payment under the inpatient
rehabilitation facility prospective
payment system.
Subpart P--Prospective Payment for Inpatient Rehabilitation
Hospitals and Rehabilitation Units
§412.600 Basis and scope of subpart.
(a) Basis. This subpart implements section 1886(j)
of the Act, which provides for the implementation of a
prospective payment system for inpatient rehabilitation
hospitals and rehabilitation units (in this subpart
referred to as "inpatient rehabilitation facilities").

385
(b) Scope. This subpart sets forth the framework for
the prospective payment system for inpatient rehabilitation
facilities, including the methodology used for the
development of payment rates and associated adjustments,
the application of a transition phase, and related rules.
Under this system, for cost reporting periods beginning on
or after January 1, 2002, payment for the operating and
capital costs of inpatient hospital services furnished by
inpatient rehabilitation facilities to Medicare Part A fee-
for-service beneficiaries is made on the basis of
prospectively determined rates and applied on a per
discharge basis.
§412.602 Definitions.
As used in this subpart—
Assessment reference date means the specific calendar
day in the patient assessment process that sets the
designated endpoint of the common patient observation
period, with most patient assessment items usually
referring back in time from this endpoint.
CMS stands for the Centers for Medicare & Medicaid
Services.
386
Comorbidity means a specific patient condition that is
secondary to the patient's principal diagnosis that is the
primary reason for the inpatient rehabilitation stay.
Discharge. A Medicare patient in a inpatient
rehabilitation facility is considered discharged when-
(1) The patient is formally released;
(2) The patient stops receiving Medicare-covered Part
A inpatient rehabilitation services; or
(3) The patient dies in the inpatient rehabilitation
facility.
Encode means entering data items into the fields of
the computerized patient assessment software program.
Functional-related groups refers to the distinct
groups under which inpatients are classified using proxy
measurements of inpatient rehabilitation relative resource
usage.
Interrupted stay means a stay at an inpatient
rehabilitation facility during which a Medicare inpatient
is discharged from the inpatient rehabilitation facility
and returns to the same inpatient rehabilitation facility
within 3 consecutive calendar days. The duration of the
interruption of the stay of 3 consecutive calendar days
begins with the day of discharge from the inpatient

387
rehabilitation facility and ends on midnight of the third
day.
Outlier payment means an additional payment beyond the
standard Federal prospective payment for cases with
unusually high costs.
Patient assessment instrument refers to a document
that contains clinical, demographic, and other information
on a patient.
Rural area means an area as defined in
§412.62(f)(1)(iii).
Transfer means the release of a Medicare inpatient
from an inpatient rehabilitation facility to another
inpatient rehabilitation facility, a short-term, acute-care
prospective payment hospital, a long-term care hospital as
described in §412.23(e), or a nursing home that qualifies
to receive Medicare or Medicaid payments.
Urban area means an area as defined in
§412.62(f)(1)(ii).
§412.604 Conditions for payment under the prospective
payment system for inpatient rehabilitation facilities.
(a) General requirements. (1) Effective for cost
reporting periods beginning on or after January 1, 2002, an
inpatient rehabilitation facility must meet the conditions

388
of this section to receive payment under the prospective
payment system described in this subpart for inpatient
hospital services furnished to Medicare Part A fee-for-
service beneficiaries.
(2) If an inpatient rehabilitation facility fails to
comply fully with these conditions with respect to
inpatient hospital services furnished to one or more
Medicare Part A fee-for-service beneficiaries, we may, as
appropriate-
(i) Withhold (in full or in part) or reduce Medicare
payment to the inpatient rehabilitation facility until the
facility provides adequate assurances of compliance; or
(ii) Classify the inpatient rehabilitation facility
as an inpatient hospital that is subject to the conditions
of subpart C of this part and is paid under the prospective
payment systems specified in §412.1(a)(1).
(b) Inpatient rehabilitation facilities subject to
the prospective payment system. Subject to the special
payment provisions of §412.22(c), an inpatient
rehabilitation facility must meet the criteria to be
classified as a rehabilitation hospital or rehabilitation
unit set forth in §§412.23(b), 412.25, and 412.29 for

389
exclusion from the inpatient hospital prospective payment
systems specified in §412.1(a)(1).
(c) Completion of patient assessment instrument. For
each Medicare Part A fee-for-service patient admitted to or
discharged from an IRF on or after January 1, 2002, the
inpatient rehabilitation facility must complete a patient
assessment instrument in accordance with §412.606.
(d) Limitation on charges to beneficiaries--(1)
Prohibited charges. Except as provided in paragraph (d)(2)
of this section, an inpatient rehabilitation facility may
not charge a beneficiary for any services for which payment
is made by Medicare, even if the facility's costs of
furnishing services to that beneficiary are greater than
the amount the facility is paid under the prospective
payment system.
(2) Permitted charges. An inpatient rehabilitation
facility receiving payment under this subpart for a covered
hospital stay (that is, a stay that includes at least one
covered day) may charge the Medicare beneficiary or other
person only for the applicable deductible and coinsurance
amounts under §§409.82, 409.83, and 409.87 of this
subchapter and for items or services as specified under
§489.20(a) of this chapter.

390
(e) Furnishing of inpatient hospital services
directly or under arrangement. (1) Subject to the
provisions of §412.622(b), the applicable payments made
under this subpart are payment in full for all inpatient
hospital services, as defined in §409.10 of this
subchapter. Inpatient hospital services do not include the
following:
(i) Physicians' services that meet the requirements
of §415.102(a) of this subchapter for payment on a fee
schedule basis).
(ii) Physician assistant services, as defined in
section 1861(s)(2)(K)(i) of the Act.
(iii) Nurse practitioners and clinical nurse
specialist services, as defined in section
1861(s)(2)(K)(ii) of the Act.
(iv) Certified nurse midwife services, as defined in
section 1861(gg) of the Act.
(v) Qualified psychologist services, as defined in
section 1861(ii) of the Act.
(vi) Services of an anesthetist, as defined in
§410.69 of this chapter.
(2) Medicare does not pay any provider or supplier
other than the inpatient rehabilitation facility for

391
services furnished to a Medicare beneficiary who is an
inpatient of the inpatient rehabilitation facility, except
for services described in paragraphs (e)(1)(i) through
(e)(1)(vi) of this section.
(3) The inpatient rehabilitation facility must
furnish all necessary covered services to the Medicare
beneficiary either directly or under arrangements (as
defined in §409.3 of this subchapter).
(f) Reporting and recordkeeping requirements. All
inpatient rehabilitation facilities participating in the
prospective payment system under this subpart must meet the
recordkeeping and cost reporting requirements of §§413.20
and 413.24 of this subchapter.
§412.606 Patient assessments.
(a) Admission orders. At the time that each Medicare
Part A fee-for-service patient is admitted, the inpatient
rehabilitation facility must have physician orders for the
patient's care during the time the patient is hospitalized.
(b) Patient assessment instrument. An inpatient
rehabilitation facility must use the CMS inpatient
rehabilitation facility patient assessment instrument to
assess Medicare Part A fee-for-service inpatients who--
392
(1) Are admitted on or after January 1, 2002; or
(2) Were admitted before January 1, 2002, and are
still inpatients as of January 1, 2002.
(c) Comprehensive assessments. (1) A clinician of
the inpatient rehabilitation facility must perform a
comprehensive, accurate, standardized, and reproducible
assessment of each Medicare Part A fee-for-service
inpatient using the inpatient rehabilitation facility
patient assessment instrument specified in paragraph (b) of
this section as part of his or her patient assessment in
accordance with the schedule described in §412.610.
(2) A clinician employed or contracted by an
inpatient rehabilitation facility who is trained on how to
perform a patient assessment using the inpatient
rehabilitation facility patient assessment instrument
specified in paragraph (b) of the section must record
appropriate and applicable data accurately and completely
for each item on the patient assessment instrument.
(3) The assessment process must include-
(i) Direct patient observation and communication with
the patient; and
(ii) When appropriate and to the extent feasible,
patient data from the patient's physician(s), family,

393
someone personally knowledgeable about the patient's
clinical condition or capabilities, the patient's clinical
record, and other sources.
§412.608 Patients' rights regarding the collection of
patient assessment data.
(a) Before performing an assessment using the patient
assessment instrument, a clinician of the IRF must inform
the Medicare Part A fee-for-service inpatient of the
following patient rights:
(1) The right to be informed of the purpose of the
collection of the patient assessment data;
(2) The right to have the patient assessment
information collected be kept confidential and secure;
(3) The right to be informed that the patient
assessment information will not be disclosed to others,
except for legitimate purposes allowed by the Federal
Privacy Act and Federal and State regulations;
(4) The right to refuse to answer patient assessment
questions; and
(5) The right to see, review, and request changes on
his or her patient assessment.
(b) The inpatient rehabilitation facility must ensure
that a clinician documents in the Medicare Part A fee-for-

394
service inpatient's clinical record that the patient was
informed of the patient rights specified in paragraph (a)
of this section.
(c) The patient rights specified in paragraph (a) of
this section are in addition to the patient rights
specified under the conditions of participation for
hospitals in §482.13 of this chapter.
§412.610 Assessment schedule.
(a) General. For each Medicare Part A fee-for-
service inpatient, an inpatient rehabilitation facility
must complete a patient assessment instrument as specified
in §412.606 that covers a time period that is in accordance
with the assessment schedule specified in paragraph (c) of
this section.
(b) Starting the assessment schedule day count. The
first day that the Medicare Part A fee-for-service
inpatient is furnished Medicare-covered services during his
or her current inpatient rehabilitation facility hospital
stay is counted as day one of the patient assessment
schedule.
(c) Assessment schedules and reference dates. The
inpatient rehabilitation facility must complete a patient
assessment instrument upon the Medicare Part A fee-for-
395
service patient's admission and discharge as specified in
paragraphs (c)(1) and (c)(2) of this section.
(1) Admission assessment.
(i) General rule. The admission assessment-
(A) Time period is a span of time that covers
calendar days 1 through 3 of the patient's current Medicare
Part A fee-for-service hospitalization;
(B) Has an admission assessment reference date that
is the third calendar day of the span of time specified in
paragraph (c)(1)(i)(A) of this section; and
(C) Must be completed on the calendar day that
follows the admission assessment reference day.
(ii) Exception to the general rule. We may specify
in the patient assessment instrument item-by-item guide and
in other issued instructions, items that have a different
admission assessment time period to most appropriately
capture patient information for payment and quality of care
monitoring objectives.
(2) Discharge assessment.
(i) General rule. The discharge assessment-
(A) Time period is a span of time that covers 3
calendar days, and is the discharge assessment reference
date itself specified in paragraph (c)(2)(ii) of this

396
section and the 2 calendar days prior to the discharge
assessment reference date; and
(B) Must be completed on the 5th calendar day that
follows the discharge assessment reference date specified
in paragraph (c)(2)(ii) of this section with the discharge
assessment reference date itself being counted as the first
day of the 5 calendar day time span.
(ii) Discharge assessment reference date. The
discharge assessment reference date is the actual day that
the first of either of the following two events occurs:
(A) The patient is discharged from the IRF; or
(B) The patient stops being furnished Medicare Part A
fee-for-service inpatient rehabilitation services.
(iii) Exception to the general rule. We may specify
in the patient assessment instrument item-by-item guide and
in other issued instructions, items that have a different
discharge assessment time period to most appropriately
capture patient information for payment and quality of care
monitoring objectives.
(d) Encoding dates. The admission and discharge
patient assessments must be encoded by the 7th calendar day
from the completion dates specified in paragraph (c) of
this section.

397
(e) Accuracy of the patient assessment data. The
encoded patient assessment data must accurately reflect the
patient's clinical status at the time of the patient
assessment.
(f) Patient assessment instrument record retention.
An inpatient rehabilitation facility must maintain all
patient assessment data sets completed on Medicare Part A
fee-for-service patients within the previous 5 years either
in a paper format in the patient's clinical record or in an
electronic computer file format that the inpatient
rehabilitation facility can easily obtain.
§412.612 Coordination of the collection of patient
assessment data.
(a) Responsibilities of the clinician. A clinician
of an inpatient rehabilitation facility who has
participated in performing the patient assessment must have
responsibility for-
(1) The accuracy and thoroughness of the specific
data recorded by that clinician on the patient's assessment
instrument; and
(2) The accuracy of the assessment reference date
inserted on the patient assessment instrument completed
under §412.610(c).

398
(b) Penalty for falsification.
(1) Under Medicare, an individual who knowingly and
willfully-
(i) Completes a material and false statement in a
patient assessment is subject to a civil money penalty of
not more than $1,000 for each assessment; or
(ii) Causes another individual to complete a material
and false statement in a patient assessment is subject to a
civil money penalty of not more than $5,000 for each
assessment.
(2) Clinical disagreement does not constitute a
material and false statement.
§412.614 Transmission of patient assessment data.
(a) Data format. The inpatient rehabilitation
facility must encode and transmit data for each Medicare
Part A fee-for-service inpatient–
(1) Using the computerized version of the patient
assessment instrument available from us; or
(2) Using a computer program(s) that conforms to our
standard electronic record layout, data specifications, and
data dictionary, includes the required patient assessment
instrument data set, and meets our other specifications.

399
(b) How to transmit data. The inpatient
rehabilitation facility must-
(1) Electronically transmit complete, accurate, and
encoded data from the patient assessment instrument for
each Medicare Part A fee-for-service inpatient to our
patient data system in accordance with the data format
specified in paragraph (a) of this section; and
(2) Transmit data using electronic communications
software that provides a direct telephone connection from
the inpatient rehabilitation facility to the our patient
data system.
(c) Transmission dates. The inpatient rehabilitation
facility must transmit both the admission patient
assessment and the discharge patient assessments at the
same time to the our patient data system by the 7th
calendar day in the period beginning with the applicable
patient assessment instrument encoding date specified in
§412.610(d).
(d) Late transmission penalty. (1) We assess a
penalty when an inpatient rehabilitation facility does not
transmit the required data from the patient assessment
instrument to the our patient data system in accordance

400
with the transmission timeframe in paragraph (c) of this
section.
(2) If the actual patient assessment data
transmission date is later than 10 calendar days from the
transmission date specified in paragraph (c) of this
section, the patient assessment data is considered late and
the inpatient rehabilitation facility receives a payment
rate that is 25 percent less than the payment rate
associated with a case-mix group.
§412.616 Release of information collected using the
patient assessment instrument.
(a) General. An inpatient rehabilitation facility
may release information from the patient assessment
instrument only as specified in §482.24(b)(3) of this
chapter.
(b) Release to the inpatient rehabilitation
facility’s agent. An inpatient rehabilitation facility
may release information that is patient-identifiable to an
agent only in accordance with a written contract under
which the agent agrees not to use or disclose the
information except for the purposes specified in the
contract and only to the extent the facility itself is
permitted to do so under paragraph (a) of this section.

401
§412.618 Assessment process for interrupted stays.
For purposes of the patient assessment process, if a
Medicare Part A fee-for-service patient has an interrupted
stay, as defined under §412.602, the following applies:
(a) Assessment requirements. (1) The initial
case-mix group classification from the admission assessment
remains in effect (that is, no new admission assessment is
performed).
(2) When the patient has completed his or her entire
rehabilitation episode stay, a discharge assessment must be
performed.
(b) Recording and encoding of data. The clinician
must record the interruption of the stay on the patient
assessment instrument.
(c) Revised assessment schedule. (1) If the
interruption in the stay occurs before the admission
assessment, the assessment reference date, completion
dates, encoding dates, and data transmission dates for the
admission and discharge assessments are advanced by the
same number of calendar days as the length of the patient's
interruption in the stay.
(2) If the interruption in the stay occurs after the
admission assessment and before the discharge assessment,

402
the completion date, encoding date, and data transmission
date for the admission assessment are advanced by the same
number of calendar days as the length of the patient's
interruption in the stay.
§412.620 Patient classification system.
(a) Classification methodology.
(1) A patient classification system is used to
classify patients in inpatient rehabilitation facilities
into mutually exclusive case-mix groups.
(2) For purposes of this subpart, case-mix groups are
classes of Medicare patient discharges by functional-
related groups that are based on a patient's impairment,
age, comorbidities, functional capabilities, and other
factors that may improve the ability of the functional-
related groups to estimate variations in resource use.
(3) Data from admission assessments under
§412.610(c)(1) are used to classify a Medicare patient into
an appropriate case-mix group.
(4) Data from the discharge assessment under
§412.610(c)(2) are used to determine the weighting factors
under paragraph (b)(4) of this section.

403
(b) Weighting factors.
(1) General. An appropriate weight is assigned to
each case-mix group that measures the relative difference
in facility resource intensity among the various case-mix
groups.
(2) Short-stay outliers. We will determine a
weighting factor or factors for patients that are
discharged and not transferred (as defined in §412.602)
within a number of days from admission as specified by us.
(3) Patients who expire. We will determine a
weighting factor or factors for patients who expire within
a number of days from admission as specified by us.
(4) Comorbidities. We will determine a weighting
factor or factors to account for the presence of a
comorbidity, as defined in §412.602, that is relevant to
resource use in the classification system.
(c) Revision of case-mix group classifications and
weighting factors. We may periodically adjust the case-mix
groups and weighting factors to reflect changes in-
(1) Treatment patterns;
(2) Technology;
(3) Number of discharges; and

404
(4) Other factors affecting the relative use of
resources.
§412.622 Basis of payment.
(a) Method of payment.
(1) Under the prospective payment system, inpatient
rehabilitation facilities receive a predetermined amount
per discharge for inpatient services furnished to Medicare
Part A fee-for-service beneficiaries.
(2) The amount of payment under the prospective
payment system is based on the Federal payment rate,
including adjustments described in §412.624 and, if
applicable, during a transition period, on a blend of the
Federal payment rate and the facility-specific payment rate
described in §412.626.
(b) Payment in full. (1) The payment made under this
subpart represents payment in full (subject to applicable
deductibles and coinsurance as described in subpart G of
part 409 of this subchapter) for inpatient operating and
capital-related costs associated with furnishing Medicare
covered services in an inpatient rehabilitation facility,
but not for the cost of an approved medical education
program described in §§413.85 and 413.86 of this chapter.

405
(2) In addition to payments based on prospective
payment rates, inpatient rehabilitation facilities receive
payments for the following:
(i) Bad debts of Medicare beneficiaries, as provided
in §413.80 of this chapter; and
(ii) A payment amount per unit for blood clotting
factor provided to Medicare inpatients who have hemophilia.
§412.624 Methodology for calculating the Federal
prospective payment rates.
(a) Data used. To calculate the prospective payment
rates for inpatient hospital services furnished by
inpatient rehabilitation facilities, we use-
(1) The most recent Medicare data available, as of
the date of establishing the inpatient rehabilitation
facility prospective payment system, to estimate payments
for inpatient operating and capital-related costs made
under part 413 under this subchapter;
(2) An appropriate wage index to adjust for area wage
differences;
(3) An increase factor to adjust for the most recent
estimate of increases in the prices of an appropriate
market basket of goods and services included in covered
inpatient rehabilitation services; and

406
(4) Patient assessment data described in §412.606 and
other data that account for the relative resource
utilization of different patient types.
(b) Determining the average costs per discharge for
fiscal year 2001. We determine the average inpatient
operating and capital costs per discharge for which payment
is made to each inpatient rehabilitation facility using the
available data specified under paragraph (a)(1) of this
section. The cost per discharge is adjusted to fiscal year
2001 by an increase factor, described in paragraph (a)(3)
of this section, under the update methodology described in
section 1886(b)(3)(B)(ii) of the Act for each year through
the midpoint of fiscal year 2001.
(c) Determining the Federal prospective payment
rates. (1) General. The Federal prospective payment
rates will be established using a standard payment amount
referred to as the budget neutral conversion factor. The
budget neutral conversion factor is a standardized payment
amount based on average costs from a base year which
reflects the combined aggregate effects of the weighting
factors, various facility and case level adjustments, and
other adjustments.

407
(2) Update the cost per discharge. We apply the
increase factor described in paragraph (a)(3) of this
section to the facility’s cost per discharge determined
under paragraph (b) of this section to compute the cost per
discharge for fiscal year 2002. Based on the updated cost
per discharge, we estimate the payments that would have
been made to the facility for fiscal year 2002 under
part 413 of this chapter without regard to the prospective
payment system implemented under this subpart.
(3) Computation of the budget neutral conversion
factor. The budget neutral conversion factor is computed
as follows:
(i) For fiscal year 2002. Based on the updated costs
per discharge and estimated payments for fiscal year 2002
determined in paragraph (c)(2) of this section, we compute
a budget neutral conversion factor for fiscal year 2002, as
specified by us, that reflects, as appropriate, the
adjustments described in paragraph (d) of this section.
(ii) For fiscal years after 2002. The budget neutral
conversion factor for fiscal years after 2002 will be the
standardized payments for the previous fiscal year updated
by the increase factor described in paragraph (a)(3) of

408
this section, including adjustments described in
paragraph (d) of this section as appropriate.
(4) Determining the Federal prospective payment rate
for each case-mix group. The Federal prospective payment
rates for each case-mix group is the product of the
weighting factors described in §412.620(b) and the budget
neutral conversion factor described in paragraph (c)(3) of
this section.
(d) Adjustments to the budget neutral conversion
factor. The budget neutral conversion factor described in
paragraph (c)(3) of this section will be adjusted for the
following:
(1) Outlier payments. We determine a reduction
factor equal to the estimated proportion of additional
outlier payments described in paragraph (e)(4) of this
section.
(2) Budget neutrality. We adjust the Federal
prospective payment rates for fiscal year 2002 so that
aggregate payments under the prospective payment system,
excluding any additional payments associated with elections
not to be paid under the transition period methodology
under §412.626(b), are estimated to equal the amount that
would have been made to inpatient rehabilitation facilities

409
under part 413 of this subchapter without regard to the
prospective payment system implemented under this subpart.
(3) Coding and classification changes. We adjust the
budget neutral conversion factor for a given year if we
determine that revisions in case-mix classifications or
weighting factors for a previous fiscal year (or estimates
that such revisions for a future fiscal year) did result in
(or would otherwise result in) a change in aggregate
payments that are a result of changes in the coding or
classification of patients that do not reflect real changes
in case-mix.
(e) Calculation of the adjusted Federal prospective
payment. For each discharge, an inpatient rehabilitation
facility's Federal prospective payment is computed on the
basis of the Federal prospective payment rate that is in
effect for its cost reporting period that begins in a
Federal fiscal year specified under paragraph (c) of this
section. A facility's Federal prospective payment rate
will be adjusted, as appropriate, to account for area wage
levels, payments for outliers and transfers, and for other
factors as follows:
(1) Adjustment for area wage levels. The labor
portion of a facility's Federal prospective payment is

410
adjusted to account for geographical differences in the
area wage levels using an appropriate wage index. The
application of the wage index is made on the basis of the
location of the facility in an urban or rural area as
defined in §412.602.
(2) Adjustments for low-income patients. We adjust
the Federal prospective payment, on a facility basis, for
the proportion of low-income patients that receive
inpatient rehabilitation services as determined by us.
(3) Adjustments for rural areas. We adjust the
Federal prospective payment by a factor, as specified by us
for facilities located in rural areas, as defined in
§412.602.
(4) Adjustment for high-cost outliers. We provide
for an additional payment to a facility if its estimated
costs for a patient exceeds a fixed dollar amount (adjusted
for area wage levels and factors to account for treating
low-income patients and for rural locations) as specified
by us. The additional payment equals 80 percent of the
difference between the estimated cost of the patient and
the sum of the adjusted Federal prospective payment
computed under this section and the adjusted fixed dollar
amount.
411
(5) Adjustments related to the patient assessment
instrument. An adjustment to a facility's Federal
prospective payment amount for a given discharge will be
made, as specified under §412.614(d), if the transmission
of data from a patient assessment instrument is late.
(f) Special payment provision for patients that are
transferred.
(1) A facility's Federal prospective payment will be
adjusted to account for a discharge of a patient who-
(i) Is transferred from the inpatient rehabilitation
facility to another site of care, as defined in §412.602;
and
(ii) Stays in the facility for a number of days that
is less than the average length of stay for nontransfer
cases in the case-mix group to which the patient is
classified.
(2) We calculate the adjusted Federal prospective
payment for patients who are transferred in the following
manner:
(i) By dividing the Federal prospective payment by
the average length of stay for nontransfer cases in the
case-mix group to which the patient is classified to equal
the payment per day.

412
(ii) By multiplying the payment per day under
paragraph (f)(2)(i) of this section by the number of days
the patient stayed in the facility prior to being
discharged to equal the per day payment amount.
(iii) By multiplying the payment per day under
paragraph (f)(2)(i) by 0.5 to equal an additional one half
day payment for the first day of the stay before the
discharge.
(iv) By adding the per day payment amount under
paragraph (f)(2)(ii) and the additional one-half day
payment under paragraph (f)(2)(iii) to equal the unadjusted
payment amount.
(v) By applying the adjustments described in
paragraphs (e)(1), (e)(2), and (e)(3) of this section to
the unadjusted payment amount determined in
paragraph (f)(2)(iv) of this section to equal the adjusted
transfer payment amount.
(g) Special payment provision for interrupted stays.
When a patient in an inpatient rehabilitation facility has
one or more interruptions in the stay, as defined in
§412.602 and as indicated on the patient assessment
instrument in accordance with §412.618(b), we will make
payments in the following manner:

413
(1) Interruption of one day or less. Payment for a
patient stay with an interruption of one day or less will
be the adjusted Federal prospective payment under paragraph
(e) of this section that is based on the patient assessment
data specified in §412.618(a)(1). Payment for an
interruption of one day or less will only be made to the
inpatient rehabilitation facility.
(2) Interruption of more than one day. Payment for a
patient stay with an interruption of more than one day but
less than 3 consecutive days, as defined in §412.602, will
be-
(i) The adjusted Federal prospective payment under
paragraph (e) of this section that is based on the patient
assessment data specified in §412.618(a)(1) made to the
inpatient rehabilitation facility; and
(ii) If the reason for the interrupted patient stay
is to receive inpatient acute care hospital services, an
amount based on the prospective payment systems described
in §412.1(a)(1) made to the acute care hospital.
§412.626 Transition period.
(a) Duration of transition period and proportion of
the blended transition rate. (1) Except for a facility
that makes an election under paragraph (b) of this section,

414
for cost reporting periods beginning on or after
January 1, 2002 and before October 1, 2002, an inpatient
rehabilitation facility receives a payment comprised of a
blend of the adjusted Federal prospective payment, as
determined under §412.624(e) or §412.624(f) and a facility-
specific payment as determined under paragraph (a)(2) of
this section.
(i) For cost reporting periods beginning on or after
January 1, 2002 and before October 1, 2002, payment is
based on 33 1/3 percent of the facility-specific payment
and 66 2/3 percent of the adjusted FY 2002 Federal
prospective payment.
(ii) For cost reporting periods beginning on or after
October 1, 2002, payment is based entirely on the adjusted
Federal prospective payment.
(2) Calculation of the facility-specific payment.
The facility-specific payment is equal to the payment for
each cost reporting period in the transition period that
would have been made without regard to this subpart. The
facility's Medicare fiscal intermediary calculates the
facility-specific payment for inpatient operating costs and
capital-related costs in accordance with part 413 of this
chapter.
415
(b) Election not to be paid under the transition
period methodology. An inpatient rehabilitation facility
may elect a payment that is based entirely on the adjusted
Federal prospective payment for cost reporting periods
beginning before fiscal year 2003 without regard to the
transition period percentages specified in
paragraph (a)(1)(i) of this section.
(1) General requirement. An inpatient rehabilitation
facility will be required to request the election under
this paragraph (b) within 30 days of its first cost
reporting period for which payment is based on the IRF
prospective payment system for cost reporting periods
beginning on or after January 1, 2002 and before
October 1, 2002.
(2) Notification requirement to make election. The
request by the inpatient rehabilitation facility to make
the election under this paragraph (b) must be made in
writing to the Medicare fiscal intermediary. The
intermediary must receive the request on or before the 30th
day before the applicable cost reporting period begins,
regardless of any postmarks or anticipated delivery dates.
Requests received, postmarked, or delivered by other means
after the 30th day before the cost reporting period begins

416
will not be approved. If the 30th day before the cost
reporting period begins falls on a day that the postal
service or other delivery sources are not open for
business, the inpatient rehabilitation facility is
responsible for allowing sufficient time for the delivery
of the request before the deadline. If an inpatient
rehabilitation facility’s request is not received or not
approved, payment will be based on the transition period
rate specified in paragraph (a)(1)(i) of this section.
§412.628 Publication of the Federal prospective payment
rates.
We publish information pertaining to the inpatient
rehabilitation facility prospective payment system
effective for each fiscal year in the Federal Register.
This information includes the unadjusted Federal payment
rates, the patient classification system and associated
weighting factors, and a description of the methodology and
data used to calculate the payment rates. This information
is published on or before August 1 prior to the beginning
of each fiscal year.
§412.630 Limitation on review.
Administrative or judicial review under sections 1869
or 1878 of the Act, or otherwise, is prohibited with regard

417
to the establishment of the methodology to classify a
patient into the case-mix groups and the associated
weighting factors, the unadjusted Federal per discharge
payment rates, additional payments for outliers and special
payments, and the area wage index.
§412.632 Method of payment under the inpatient
rehabilitation facility prospective payment system.
(a) General rule. Subject to the exceptions in
paragraphs (b) and (c) of this section, an inpatient
rehabilitation facility receives payment under this subpart
for inpatient operating costs and capital-related costs for
each discharge only following submission of a discharge
bill.
(b) Periodic interim payments.
(1) Criteria for receiving periodic interim payments.
(i) An inpatient rehabilitation facility receiving
payment under this subpart may receive periodic interim
payments (PIP) for Part A services under the PIP method
subject to the provisions of §413.64(h) of this subchapter.
(ii) To be approved for PIP, the inpatient
rehabilitation facility must meet the qualifying
requirements in §413.64(h)(3) of this subchapter.

418
(iii) Payments to a rehabilitation unit are made
under the same method of payment as the hospital of which
it is a part as described in §412.116.
(iv) As provided in §413.64(h)(5) of this chapter,
intermediary approval is conditioned upon the
intermediary’s best judgment as to whether payment can be
made under the PIP method without undue risk of its
resulting in an overpayment to the provider.
(2) Frequency of payment. For facilities approved
for PIP, the intermediary estimates the inpatient
rehabilitation facility's Federal prospective payments net
of estimated beneficiary deductibles and coinsurance and
makes biweekly payments equal to 1/26 of the total
estimated amount of payment for the year. If the inpatient
rehabilitation facility has payment experience under the
prospective payment system, the intermediary estimates PIP
based on that payment experience, adjusted for projected
changes supported by substantiated information for the
current year. Each payment is made 2 weeks after the end
of a biweekly period of service as described in
§413.64(h)(6) of this subchapter. The interim payments are
reviewed at least twice during the reporting period and
adjusted if necessary. Fewer reviews may be necessary if
419
an inpatient rehabilitation facility receives interim
payments for less than a full reporting period. These
payments are subject to final settlement.
(3) Termination of PIP. (i) Request by the
inpatient rehabilitation facility. Subject to the
provisions of paragraph (b)(1)(iii) of this section, an
inpatient rehabilitation facility receiving PIP may convert
to receiving prospective payments on a non-PIP basis at any
time.
(ii) Removal by the intermediary. An intermediary
terminates PIP if the inpatient rehabilitation facility no
longer meets the requirements of §413.64(h) of this
chapter.
(c) Interim payments for Medicare bad debts and for
Part A costs not paid under the prospective payment system.
For Medicare bad debts and for costs of an approved
education program and other costs paid outside the
prospective payment system, the intermediary determines the
interim payments by estimating the reimbursable amount for
the year based on the previous year's experience, adjusted
for projected changes supported by substantiated
information for the current year, and makes biweekly
payments equal to 1/26 of the total estimated amount. Each

420
payment is made 2 weeks after the end of a biweekly period
of service as described in §413.64(h)(6) of this chapter.
The interim payments are reviewed at least twice during the
reporting period and adjusted if necessary. Fewer reviews
may be necessary if an inpatient rehabilitation facility
receives interim payments for less than a full reporting
period. These payments are subject to final cost
settlement.
(d) Outlier payments. Additional payments for
outliers are not made on an interim basis. The outlier
payments are made based on the submission of a discharge
bill and represent final payment.
(e) Accelerated payments. (1) General rule. Upon
request, an accelerated payment may be made to an inpatient
rehabilitation facility that is receiving payment under
this subpart and is not receiving PIP under paragraph (b)
of this section if the inpatient rehabilitation facility is
experiencing financial difficulties because of the
following:
(i) There is a delay by the intermediary in making
payment to the inpatient rehabilitation facility.
(ii) Due to an exceptional situation, there is a
temporary delay in the inpatient rehabilitation facility’s

421
preparation and submittal of bills to the intermediary
beyond its normal billing cycle.
(2) Approval of payment. An inpatient rehabilitation
facility’s request for an accelerated payment must be
approved by the intermediary and us.
(3) Amount of payment. The amount of the accelerated
payment is computed as a percentage of the net payment for
unbilled or unpaid covered services.
(4) Recovery of payment. Recovery of the accelerated
payment is made by recoupment as inpatient rehabilitation
facility bills are processed or by direct payment by the
inpatient rehabilitation facility.
B. Part 413 is amended as set forth below:
PART 413--PRINCIPLES OF REASONABLE COST REIMBURSEMENT;
PAYMENT FOR END-STAGE RENAL DISEASE SERVICES; PROSPECTIVELY
DETERMINED PAYMENT FOR SKILLED NURSING FACILITIES
1. The authority citation for part 413 is revised to
read as follows:
Authority: Secs. 1102, 1812(d), 1814(b), 1815,
1833(a), (i) and (n), 1861(v), 1871, 1881, 1883, and 1886
of the Social Security Act (42 U.S.C. 1302, 1395d(d),
1395f(b), 1395g, 1395l(a), (i), and (n), 1395x(v), 1395hh,
1395rr, 1395tt, and 1395ww).

422
Subpart A -- Introduction and General Rules
2. Section 413.1 is amended by:
A. Revising paragraph (d)(2)(ii).
B. Adding paragraphs (d)(2)(iv) and (d)(2)(v).
§413.1 Introduction.
* * * * *
(d) * * *
(2) * * *
(ii) Payment to children's, psychiatric, and long-
term hospitals (as well as separate psychiatric units
(distinct parts) of short-term general hospitals), that are
excluded from the prospective payment systems under subpart
B of part 412 of this subchapter, and hospitals outside the
50 States and the District of Columbia is on a reasonable
cost basis, subject to the provisions of §413.40.
* * * * *
(iv) For cost reporting periods beginning before
January 1, 2002, payment to rehabilitation hospitals (as
well as separate rehabilitation units (distinct parts) of
short-term general hospitals), that are excluded under
subpart B of part 412 of this subchapter from the
prospective payment systems is on a reasonable cost basis,
subject to the provisions of §413.40.

423
(v) For cost reporting periods beginning on or after
January 1, 2002, payment to rehabilitation hospitals (as
well as separate rehabilitation units (distinct parts) of
short-term general hospitals) that meet the conditions of
§412.604 of this chapter is based on prospectively
determined rates under subpart P of part 412 of this
subchapter.
* * * * *
Subpart C-- Limits on Cost Reimbursement
3. Section 413.40 is amended by:
A. Republishing the introductory text of paragraph
(a)(2)(i).
B. Adding a new paragraph (a)(2)(i)(C).
C. Revising paragraph (a)(2)(ii).
D. Adding a new paragraph (a)(2)(iii).
§413.40 Ceiling on the rate of increase in hospital
inpatient costs.
(a) Introduction. * * *
(2) Applicability. (i) This section is not
applicable to-
* * * * *
(C) Rehabilitation hospitals and rehabilitation units
that are paid under the prospective payment system for

424
inpatient hospital services in accordance with section
1886(j) of the Act and subpart P of part 412 of this
subchapter for cost reporting periods beginning on or after
January 1, 2002.
(ii) For cost reporting periods beginning on or after
October 1, 1983, this section applies to-
(A) Hospitals excluded from the prospective payment
systems described in §412.1(a)(1) of this subchapter; and
(B) Psychiatric and rehabilitation units excluded
from the prospective payment systems, as described in
§412.1(a)(1) of this chapter and in accordance with
§§412.25 through 412.30 of this chapter, except as limited
by paragraph (a)(2)(iii) of this section with respect to
rehabilitation hospitals and rehabilitation units specified
in §§412.23(b), 412.27, and 412.29 of this subchapter.
(iii) For cost reporting periods beginning on or
after October 1, 1983 and before January 1, 2002, this
section applies to rehabilitation hospitals and
rehabilitation units that are excluded from the prospective
payment systems described in §412.1(a)(1) of this
subchapter.
* * * * *
Subpart E-- Payments to Providers
425
4. In §413.64, paragraph (h)(2)(i) is revised to read
as follows:
§413.64 Payment to providers: Specific rules.
* * * * *
(h) Periodic interim payment method of reimbursement-
* * *
(2) * * *
(i) Part A inpatient services furnished in hospitals
that are excluded from the prospective payment systems,
described in §412.1(a)(1) of this chapter, under subpart B
of part 412 of this chapter or are paid under the
prospective payment system described in subpart P of part
412 of this chapter.
* * * * *

426
(Catalog of Federal Domestic Assistance Program No. 93.773,
Medicare--Hospital Insurance)
Dated: ________________
______________________________
Thomas A. Scully, Administrator, Centers for Medicare & Medicaid Services
Dated: ________________
________________________
Tommy G. Thompson, Secretary.
BILLING CODE 4120-01

427
Editorial Note: The following Addendum and Appendix A
through Appendix D to the preamble will not appear in the
Code of Federal Regulations.
Addendum--Tables
This section contains tables referred to throughout
the preamble to this final rule. The tables presented
below are as follows:
Table 1 – Relative Weights for Case-Mix Groups (CMGs)
Table 2 – Federal Prospective Payments for Case-Mix Groups
Table 3A – Wage Index for Urban Areas
Table 3B – Wage Index for Rural Areas
428
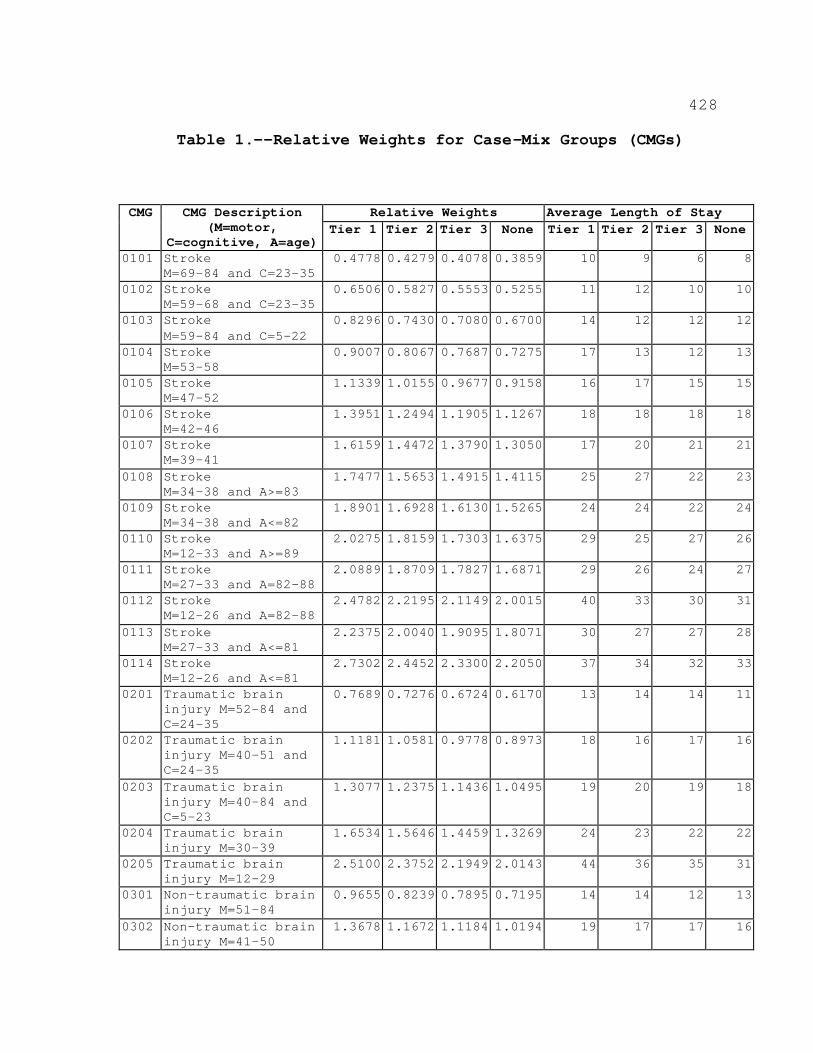
Table 1.--Relative Weights for Case-Mix Groups (CMGs)
CMG CMG Description (M=motor,
C=cognitive, A=age)
Relative Weights Average Length of Stay Tier 1 Tier 2 Tier 3 None Tier 1 Tier 2 Tier 3 None
0101 Stroke M=69-84 and C=23-35
0.4778 0.4279 0.4078 0.3859 10 9 6 8
0102 Stroke M=59-68 and C=23-35
0.6506 0.5827 0.5553 0.5255 11 12 10 10
0103 Stroke M=59-84 and C=5-22
0.8296 0.7430 0.7080 0.6700 14 12 12 12
0104 Stroke M=53-58
0.9007 0.8067 0.7687 0.7275 17 13 12 13
0105 Stroke M=47-52
1.1339 1.0155 0.9677 0.9158 16 17 15 15
0106 Stroke M=42-46
1.3951 1.2494 1.1905 1.1267 18 18 18 18
0107 Stroke M=39-41
1.6159 1.4472 1.3790 1.3050 17 20 21 21
0108 Stroke M=34-38 and A>=83
1.7477 1.5653 1.4915 1.4115 25 27 22 23
0109 Stroke M=34-38 and A<=82
1.8901 1.6928 1.6130 1.5265 24 24 22 24
0110 Stroke M=12-33 and A>=89
2.0275 1.8159 1.7303 1.6375 29 25 27 26
0111 Stroke M=27-33 and A=82-88
2.0889 1.8709 1.7827 1.6871 29 26 24 27
0112 Stroke M=12-26 and A=82-88
2.4782 2.2195 2.1149 2.0015 40 33 30 31
0113 Stroke M=27-33 and A<=81
2.2375 2.0040 1.9095 1.8071 30 27 27 28
0114 Stroke M=12-26 and A<=81
2.7302 2.4452 2.3300 2.2050 37 34 32 33
0201 Traumatic brain injury M=52-84 and C=24-35
0.7689 0.7276 0.6724 0.6170 13 14 14 11
0202 Traumatic brain injury M=40-51 and C=24-35
1.1181 1.0581 0.9778 0.8973 18 16 17 16
0203 Traumatic brain injury M=40-84 and C=5-23
1.3077 1.2375 1.1436 1.0495 19 20 19 18
0204 Traumatic brain injury M=30-39
1.6534 1.5646 1.4459 1.3269 24 23 22 22
0205 Traumatic brain injury M=12-29
2.5100 2.3752 2.1949 2.0143 44 36 35 31
0301 Non-traumatic brain injury M=51-84
0.9655 0.8239 0.7895 0.7195 14 14 12 13
0302 Non-traumatic brain injury M=41-50
1.3678 1.1672 1.1184 1.0194 19 17 17 16

429
CMG CMG Description (M=motor,
C=cognitive, A=age)
Relative Weights Average Length of Stay Tier 1 Tier 2 Tier 3 None Tier 1 Tier 2 Tier 3 None
0303 Non-traumatic brain injury M=25-40
1.8752 1.6002 1.5334 1.3976 23 23 22 22
0304 Non-traumatic brain injury M=12-24
2.7911 2.3817 2.2824 2.0801 44 32 34 31
0401 Traumatic spinal cord injury M=50-84
0.9282 0.8716 0.8222 0.6908 15 15 16 14
0402 Traumatic spinal cord injury M=36-49
1.4211 1.3344 1.2588 1.0576 21 18 22 19
0403 Traumatic spinal cord injury M=19-35
2.3485 2.2052 2.0802 1.7478 32 32 31 30
0404 Traumatic spinal cord injury M=12-18
3.5227 3.3078 3.1203 2.6216 46 43 62 40
0501 Non-traumatic spinal cord injury M=51-84 and C=30-35
0.7590 0.6975 0.6230 0.5363 12 13 10 10
0502 Non-traumatic spinal cord injury M=51-84 and C=5-29
0.9458 0.8691 0.7763 0.6683 15 17 10 12
0503 Non-traumatic spinal cord injury M=41-50
1.1613 1.0672 0.9533 0.8206 17 17 15 14
0504 Non-traumatic spinal cord injury M=34-40
1.6759 1.5400 1.3757 1.1842 23 21 21 19
0505 Non-traumatic spinal cord injury M=12-33
2.5314 2.3261 2.0778 1.7887 31 31 29 28
0601 Neurological M=56-84
0.8794 0.6750 0.6609 0.5949 14 13 12 12
0602 Neurological M=47-55
1.1979 0.9195 0.9003 0.8105 15 15 14 15
0603 Neurological M=36-46
1.5368 1.1796 1.1550 1.0397 21 18 18 18
0604 Neurological M=12-35
2.0045 1.5386 1.5065 1.3561 31 24 25 23
0701 Fracture of lower extremity M=52-84
0.7015 0.7006 0.6710 0.5960 13 13 12 11
0702 Fracture of lower extremity M=46-51
0.9264 0.9251 0.8861 0.7870 15 15 16 14
0703 Fracture of lower extremity M=42-45
1.0977 1.0962 1.0500 0.9326 18 17 17 16
0704 Fracture of lower extremity M=38-41
1.2488 1.2471 1.1945 1.0609 14 20 19 18
0705 Fracture of lower extremity M=12-37
1.4760 1.4740 1.4119 1.2540 20 22 22 21
0801 Replacement of lower extremity joint M=58-84
0.4909 0.4696 0.4518 0.3890 9 9 8 8
430
CMG CMG Description (M=motor,
C=cognitive, A=age)
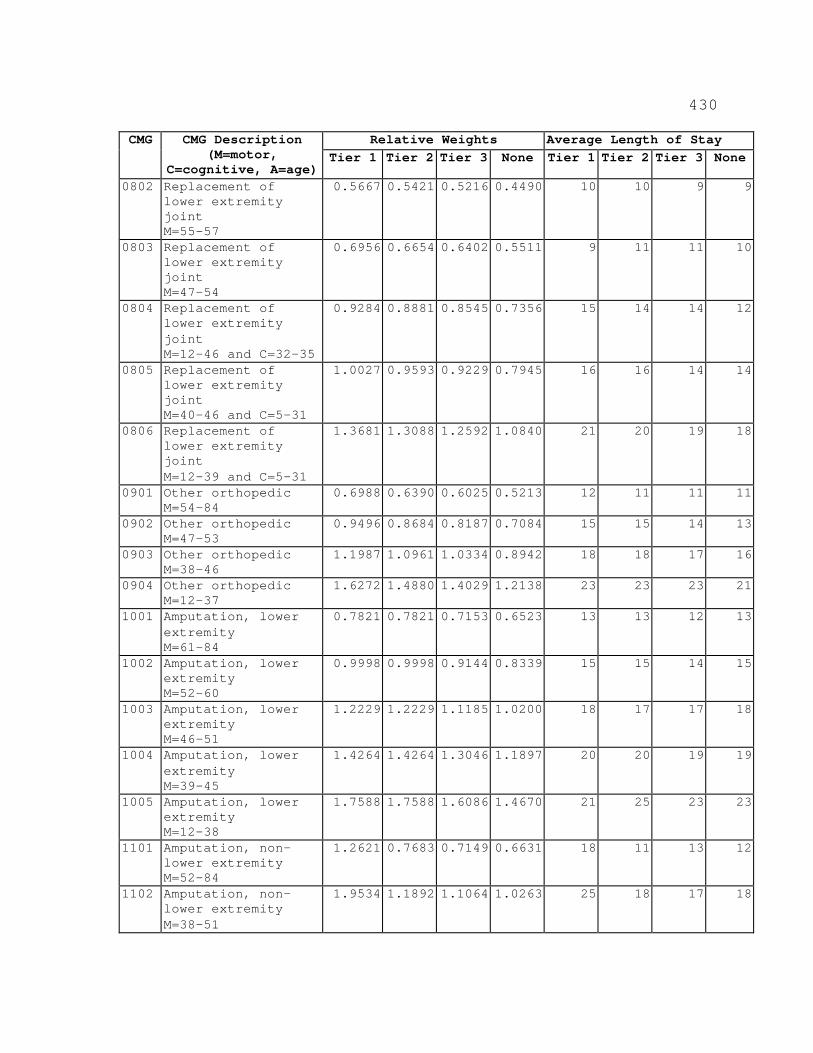
Relative Weights Average Length of Stay Tier 1 Tier 2 Tier 3 None Tier 1 Tier 2 Tier 3 None
0802 Replacement of lower extremity joint M=55-57
0.5667 0.5421 0.5216 0.4490 10 10 9 9
0803 Replacement of lower extremity joint M=47-54
0.6956 0.6654 0.6402 0.5511 9 11 11 10
0804 Replacement of lower extremity joint M=12-46 and C=32-35
0.9284 0.8881 0.8545 0.7356 15 14 14 12
0805 Replacement of lower extremity joint M=40-46 and C=5-31
1.0027 0.9593 0.9229 0.7945 16 16 14 14
0806 Replacement of lower extremity joint M=12-39 and C=5-31
1.3681 1.3088 1.2592 1.0840 21 20 19 18
0901 Other orthopedic M=54-84
0.6988 0.6390 0.6025 0.5213 12 11 11 11
0902 Other orthopedic M=47-53
0.9496 0.8684 0.8187 0.7084 15 15 14 13
0903 Other orthopedic M=38-46
1.1987 1.0961 1.0334 0.8942 18 18 17 16
0904 Other orthopedic M=12-37
1.6272 1.4880 1.4029 1.2138 23 23 23 21
1001 Amputation, lower extremity M=61-84
0.7821 0.7821 0.7153 0.6523 13 13 12 13
1002 Amputation, lower extremity M=52-60
0.9998 0.9998 0.9144 0.8339 15 15 14 15
1003 Amputation, lower extremity M=46-51
1.2229 1.2229 1.1185 1.0200 18 17 17 18
1004 Amputation, lower extremity M=39-45
1.4264 1.4264 1.3046 1.1897 20 20 19 19
1005 Amputation, lower extremity M=12-38
1.7588 1.7588 1.6086 1.4670 21 25 23 23
1101 Amputation, non-lower extremity M=52-84
1.2621 0.7683 0.7149 0.6631 18 11 13 12
1102 Amputation, non-lower extremity M=38-51
1.9534 1.1892 1.1064 1.0263 25 18 17 18

431
CMG CMG Description (M=motor,
C=cognitive, A=age)
Relative Weights Average Length of Stay Tier 1 Tier 2 Tier 3 None Tier 1 Tier 2 Tier 3 None
1103 Amputation, non-lower extremity M=12-37
2.6543 1.6159 1.5034 1.3945 33 23 22 25
1201 Osteoarthritis M=55-84 and C=34-35
0.7219 0.5429 0.5103 0.4596 13 10 11 9
1202 Osteoarthritis M=55-84 and C=5-33
0.9284 0.6983 0.6563 0.5911 16 11 13 13
1203 Osteoarthritis M=48-54
1.0771 0.8101 0.7614 0.6858 18 15 14 13
1204 Osteoarthritis M=39-47
1.3950 1.0492 0.9861 0.8882 22 19 16 17
1205 Osteoarthritis M=12-38
1.7874 1.3443 1.2634 1.1380 27 21 21 20
1301 Rheumatoid, other arthritis M=54-84
0.7719 0.6522 0.6434 0.5566 13 14 13 11
1302 Rheumatoid, other arthritis M=47-53
0.9882 0.8349 0.8237 0.7126 16 14 14 14
1303 Rheumatoid, other arthritis M=36-46
1.3132 1.1095 1.0945 0.9469 20 18 16 17
1304 Rheumatoid, other arthritis M=12-35
1.8662 1.5768 1.5555 1.3457 25 25 29 22
1401 Cardiac M=56-84
0.7190 0.6433 0.5722 0.5156 15 12 11 11
1402 Cardiac M=48-55
0.9902 0.8858 0.7880 0.7101 13 15 13 13
1403 Cardiac M=38-47
1.2975 1.1608 1.0325 0.9305 21 19 16 16
1404 Cardiac M=12-37
1.8013 1.6115 1.4335 1.2918 30 24 21 20
1501 Pulmonary M=61-84
0.8032 0.7633 0.6926 0.6615 15 13 13 13
1502 Pulmonary M=48-60
1.0268 0.9758 0.8855 0.8457 17 17 14 15
1503 Pulmonary M=36-47
1.3242 1.2584 1.1419 1.0906 21 20 18 18
1504 Pulmonary M=12-35
2.0598 1.9575 1.7763 1.6965 30 28 30 26
1601 Pain syndrome M=45-84
0.8707 0.8327 0.7886 0.6603 15 14 13 13
1602 Pain syndrome M=12-44
1.3320 1.2739 1.2066 1.0103 21 20 20 18
1701 Major multiple trauma without brain or spinal cord injury M=46-84
0.9996 0.9022 0.8138 0.7205 16 14 11 13

432
CMG CMG Description (M=motor,
C=cognitive, A=age)
Relative Weights Average Length of Stay Tier 1 Tier 2 Tier 3 None Tier 1 Tier 2 Tier 3 None
1702 Major multiple trauma without brain or spinal cord injury M=33-45
1.4755 1.3317 1.2011 1.0634 21 21 20 18
1703 Major multiple trauma without brain or spinal cord injury M=12-32
2.1370 1.9288 1.7396 1.5402 33 28 27 24
1801 Major multiple trauma with brain or spinal cord injury M=45-84 and C=33-35
0.7445 0.7445 0.6862 0.6282 12 12 12 10
1802 Major multiple trauma with brain or spinal cord injury M=45-84 and C=5-32
1.0674 1.0674 0.9838 0.9007 16 16 16 16
1803 Major multiple trauma with brain or spinal cord injury M=26-44
1.6350 1.6350 1.5069 1.3797 22 25 20 22
1804 Major multiple trauma with brain or spinal cord injury M=12-25
2.9140 2.9140 2.6858 2.4589 41 29 40 40
1901 Guillian Barre M=47-84
1.1585 1.0002 0.9781 0.8876 15 15 16 15
1902 Guillian Barre M=31-46
2.1542 1.8598 1.8188 1.6505 27 27 27 24
1903 Guillian Barre M=12-30
3.1339 2.7056 2.6459 2.4011 41 35 30 40
2001 Miscellaneous M=54-84
0.8371 0.7195 0.6705 0.6029 12 13 11 12
2002 Miscellaneous M=45-53
1.1056 0.9502 0.8855 0.7962 15 15 14 14
2003 Miscellaneous M=33-44
1.4639 1.2581 1.1725 1.0543 20 18 18 18
2004 Miscellaneous M=12-32 and A>=82
1.7472 1.5017 1.3994 1.2583 30 22 21 22
2005 Miscellaneous M=12-32 and A<=81
2.0799 1.7876 1.6659 1.4979 33 25 24 24
2101 Burns M=46-84
1.0357 0.9425 0.8387 0.8387 18 18 15 16
2102 Burns M=12-45
2.2508 2.0482 1.8226 1.8226 31 26 26 29

433
CMG CMG Description (M=motor,
C=cognitive, A=age)
Relative Weights Average Length of Stay Tier 1 Tier 2 Tier 3 None Tier 1 Tier 2 Tier 3 None
5001 Short-stay cases, length of stay is 3 days or fewer
. . . 0.1651 . . . 3
5101 Expired, orthopedic, length of stay is 13 days or fewer
. . . 0.4279 . . . 8
5102 Expired, orthopedic, length of stay is 14 days or more
. . . 1.2390 . . . 23
5103 Expired, not orthopedic, length of stay is 15 days or fewer
. . . 0.5436 . . . 9
5104 Expired, not orthopedic, length of stay is 16 days or more
. . . 1.7100 . . . 28

434
TABLE 2.--Federal Prospective Payments for Case-Mix Groups (CMGs)
CMG Payment
Rate Tier 1
Payment Rate Tier 2
Payment Rate Tier 3
Payment Rate No
Comorbidities 0101 $ 5,656.20 $ 5,065.48 $ 4,827.54 $ 4,568.28 0102 7,701.80 6,898.00 6,573.64 6,220.87 0103 9,820.80 8,795.63 8,381.30 7,931.46 0104 10,662.49 9,549.71 9,099.87 8,612.15 0105 13,423.11 12,021.49 11,455.63 10,841.24 0106 16,515.19 14,790.40 14,093.14 13,337.87 0107 19,129.02 17,131.95 16,324.60 15,448.59 0108 20,689.27 18,530.02 17,656.38 16,709.34 0109 22,375.00 20,039.37 19,094.69 18,070.71 0110 24,001.55 21,496.62 20,483.29 19,384.73 0111 24,728.40 22,147.71 21,103.60 19,971.89 0112 29,336.93 26,274.44 25,036.19 23,693.76 0113 26,487.53 23,723.35 22,604.66 21,392.45 0114 32,320.11 28,946.28 27,582.54 26,102.79 0201 9,102.24 8,613.33 7,959.87 7,304.05 0202 13,236.07 12,525.79 11,575.20 10,622.24 0203 15,480.55 14,649.53 13,537.94 12,423.98 0204 19,572.95 18,521.73 17,116.56 15,707.84 0205 29,713.38 28,117.62 25,983.23 23,845.28 0301 11,429.59 9,753.33 9,346.10 8,517.44 0302 16,192.02 13,817.31 13,239.62 12,067.66 0303 22,198.62 18,943.17 18,152.39 16,544.79 0304 33,041.04 28,194.56 27,019.05 24,624.22 0401 10,988.03 10,318.00 9,733.20 8,177.69 0402 16,822.98 15,796.63 14,901.67 12,519.87 0403 27,801.54 26,105.16 24,625.41 20,690.46 0404 41,701.72 39,157.74 36,938.11 31,034.50 0501 8,985.04 8,257.01 7,375.07 6,348.72 0502 11,196.38 10,288.41 9,189.84 7,911.34 0503 13,747.47 12,633.51 11,285.17 9,714.26 0504 19,839.30 18,230.52 16,285.54 14,018.56 0505 29,966.71 27,536.37 24,597.00 21,174.63 0601 10,410.34 7,990.65 7,823.73 7,042.43 0602 14,180.74 10,885.04 10,657.75 9,594.70 0603 18,192.64 13,964.10 13,672.89 12,307.97

435
CMG Payment
Rate Tier 1
Payment Rate Tier 2
Payment Rate Tier 3
Payment Rate No
Comorbidities 0604 23,729.27 18,213.95 17,833.95 16,053.51 0701 8,304.36 8,293.70 7,943.30 7,055.45 0702 10,966.72 10,951.33 10,489.65 9,316.51 0703 12,994.57 12,976.82 12,429.90 11,040.12 0704 14,783.29 14,763.17 14,140.49 12,558.93 0705 17,472.89 17,449.21 16,714.07 14,844.85 0801 5,811.27 5,559.12 5,348.41 4,604.98 0802 6,708.59 6,417.38 6,174.70 5,315.26 0803 8,234.51 7,877.01 7,578.69 6,523.92 0804 10,990.40 10,513.33 10,115.57 8,708.03 0805 11,869.96 11,356.19 10,925.29 9,405.29 0806 16,195.57 15,493.57 14,906.41 12,832.39 0901 8,272.39 7,564.48 7,132.40 6,171.15 0902 11,241.36 10,280.12 9,691.77 8,386.04 0903 14,190.21 12,975.63 12,233.39 10,585.54 0904 19,262.79 17,614.94 16,607.53 14,368.96 1001 9,258.50 9,258.50 8,467.72 7,721.93 1002 11,835.63 11,835.63 10,824.67 9,871.71 1003 14,476.69 14,476.69 13,240.80 12,074.76 1004 16,885.72 16,885.72 15,443.85 14,083.67 1005 20,820.67 20,820.67 19,042.61 17,366.35 1101 14,940.74 9,095.14 8,462.99 7,849.78 1102 23,124.35 14,077.75 13,097.56 12,149.34 1103 31,421.60 19,129.02 17,797.25 16,508.09 1201 8,545.85 6,426.85 6,040.93 5,440.74 1202 10,990.40 8,266.48 7,769.28 6,997.44 1203 12,750.71 9,589.96 9,013.45 8,118.50 1204 16,514.01 12,420.43 11,673.45 10,514.51 1205 21,159.24 15,913.82 14,956.13 13,471.64 1301 9,137.75 7,720.74 7,616.57 6,589.03 1302 11,698.31 9,883.55 9,750.96 8,435.76 1303 15,545.66 13,134.26 12,956.69 11,209.40 1304 22,092.08 18,666.16 18,414.01 15,930.40 1401 8,511.52 7,615.39 6,773.70 6,103.67 1402 11,721.99 10,486.10 9,328.34 8,406.16 1403 15,359.81 13,741.55 12,222.74 11,015.26 1404 21,323.79 19,076.94 16,969.77 15,292.33 1501 9,508.28 9,035.95 8,199.00 7,830.84 1502 12,155.26 11,551.52 10,482.55 10,011.40

436
CMG Payment
Rate Tier 1
Payment Rate Tier 2
Payment Rate Tier 3
Payment Rate No
Comorbidities 1503 15,675.88 14,896.94 13,517.81 12,910.52 1504 24,383.91 23,172.89 21,027.84 20,083.17 1601 10,307.35 9,857.50 9,335.45 7,816.63 1602 15,768.22 15,080.43 14,283.73 11,959.93 1701 11,833.26 10,680.24 9,633.76 8,529.28 1702 17,466.97 15,764.66 14,218.62 12,588.53 1703 25,297.81 22,833.13 20,593.38 18,232.89 1801 8,813.39 8,813.39 8,123.24 7,436.63 1802 12,635.88 12,635.88 11,646.22 10,662.49 1803 19,355.13 19,355.13 17,838.68 16,332.89 1804 34,495.93 34,495.93 31,794.50 29,108.46 1901 13,714.32 11,840.37 11,578.75 10,507.41 1902 25,501.42 22,016.31 21,530.95 19,538.62 1903 37,099.11 32,028.89 31,322.16 28,424.22 2001 9,909.59 8,517.44 7,937.38 7,137.13 2002 13,088.09 11,248.47 10,482.55 9,425.42 2003 17,329.65 14,893.39 13,880.06 12,480.80 2004 20,683.35 17,777.12 16,566.10 14,895.76 2005 24,621.86 21,161.61 19,720.92 17,732.14 2101 12,260.62 11,157.32 9,928.53 9,928.53 2102 26,644.97 24,246.59 21,575.94 21,575.94 5001 1,954.45 5101 5,065.48 5102 14,667.28 5103 6,435.14 5104 20,242.98

437
Table 3A.--Wage Index for Urban Areas
MSA Urban Area (Constituent Counties or County Equivalents)
Wage Index
0040 Abilene, TX Taylor, TX
0.8240
0060 Aguadilla, PR Aguada, PR Aguadilla, PR Moca, PR
0.4391
0080 Akron, OH Portage, OH Summit, OH
0.9541
0120 Albany, GA Dougherty, GA Lee, GA
0.9893
0160 Albany-Schenectady-Troy, NY Albany, NY Montgomery, NY Rensselaer, NY Saratoga, NY Schenectady, NY Schoharie, NY
0.8480
0200 Albuquerque, NM Bernalillo, NM Sandoval, NM Valencia, NM
0.9146
0220 Alexandria, LA Rapides, LA
0.8121
0240 Allentown-Bethlehem-Easton, PA Carbon, PA Lehigh, PA Northampton, PA
0.9839
0280 Altoona, PA Blair, PA
0.9317
0320 Amarillo, TX Potter, TX Randall, TX
0.8673
0380 Anchorage, AK Anchorage, AK
1.2775
0440 Ann Arbor, MI Lenawee, MI Livingston, MI Washtenaw, MI
1.1093

438
0450 Anniston,AL Calhoun, AL
0.8284
0460 Appleton-Oshkosh-Neenah, WI Calumet, WI Outagamie, WI Winnebago, WI
0.9052
0470 Arecibo, PR Arecibo, PR Camuy, PR Hatillo, PR
0.4525
0480 Asheville, NC Buncombe, NC Madison, NC
0.9479
0500 Athens, GA Clarke, GA Madison, GA Oconee, GA
0.9739
0520 Atlanta, GA Barrow, GA Bartow, GA Carroll, GA Cherokee, GA Clayton, GA Cobb, GA Coweta, GA De Kalb, GA Douglas, GA Fayette, GA Forsyth, GA Fulton, GA Gwinnett, GA Henry, GA Newton, GA Paulding, GA Pickens, GA Rockdale, GA Spalding, GA Walton, GA
1.0097
0560 Atlantic City-Cape May, NJ Atlantic City, NJ Cape May, NJ
1.1167
0580 Auburn-Opelika, AL Lee, AL
0.8079

439
0600 Augusta-Aiken, GA-SC Columbia, GA McDuffie, GA Richmond, GA Aiken, SC Edgefield, SC
0.9127
0640 Austin-San Marcos, TX Bastrop, TX Caldwell, TX Hays, TX Travis, TX Williamson, TX
0.9540
0680 Bakersfield, CA Kern, CA
0.9684
0720 Baltimore, MD Anne Arundel, MD Baltimore, MD Baltimore City, MD Carroll, MD Harford, MD Howard, MD Queen Annes, MD
0.9223
0733 Bangor, ME Penobscot, ME
0.9550
0743 Barnstable-Yarmouth, MA Barnstable, MA
1.3801
0760 Baton Rouge, LA Ascension, LA East Baton Rouge Livingston, LA West Baton Rouge, LA
0.8796
0840 Beaumont-Port Arthur, TX Hardin, TX Jefferson, TX Orange, TX
0.8734
0860 Bellingham, WA Whatcom, WA
1.1439
0870 Benton Harbor, MI Berrien, MI
0.8671
0875 Bergen-Passaic, NJ Bergen, NJ Passaic, NJ
1.1818
0880 Billings, MT Yellowstone, MT
0.9604

440
0920 Biloxi-Gulfport-Pascagoula, MS Hancock, MS Harrison, MS Jackson, MS
0.8236
0960 Binghamton, NY Broome, NY Tioga, NY
0.8600
1000 Birmingham, AL Blount, AL Jefferson, AL St. Clair, AL Shelby, AL
0.8360
1010 Bismarck, ND Burleigh, ND Morton, ND
0.7625
1020 Bloomington, IN Monroe, IN
0.8733
1040 Bloomington-Normal, IL McLean, IL
0.9095
1080 Boise City, ID Ada, ID Canyon, ID
0.9006
1123 Boston-Worcester-Lawrence-Lowell-Brockton, MA-NH Bristol, MA Essex, MA Middlesex, MA Norfolk, MA Plymouth, MA Suffolk, MA Worcester, MA Hillsborough, NH Merrimack, NH Rockingham, NH Strafford, NH
1.1086
1125 Boulder-Longmont, CO Boulder, CO
0.9731
1145 Brazoria, TX Brazoria, TX
0.8658
1150 Bremerton, WA Kitsap, WA
1.0975
1240 Brownsville-Harlingen-San Benito, TX Cameron, TX
0.8714
1260 Bryan-College Station, TX Brazos, TX
0.8237
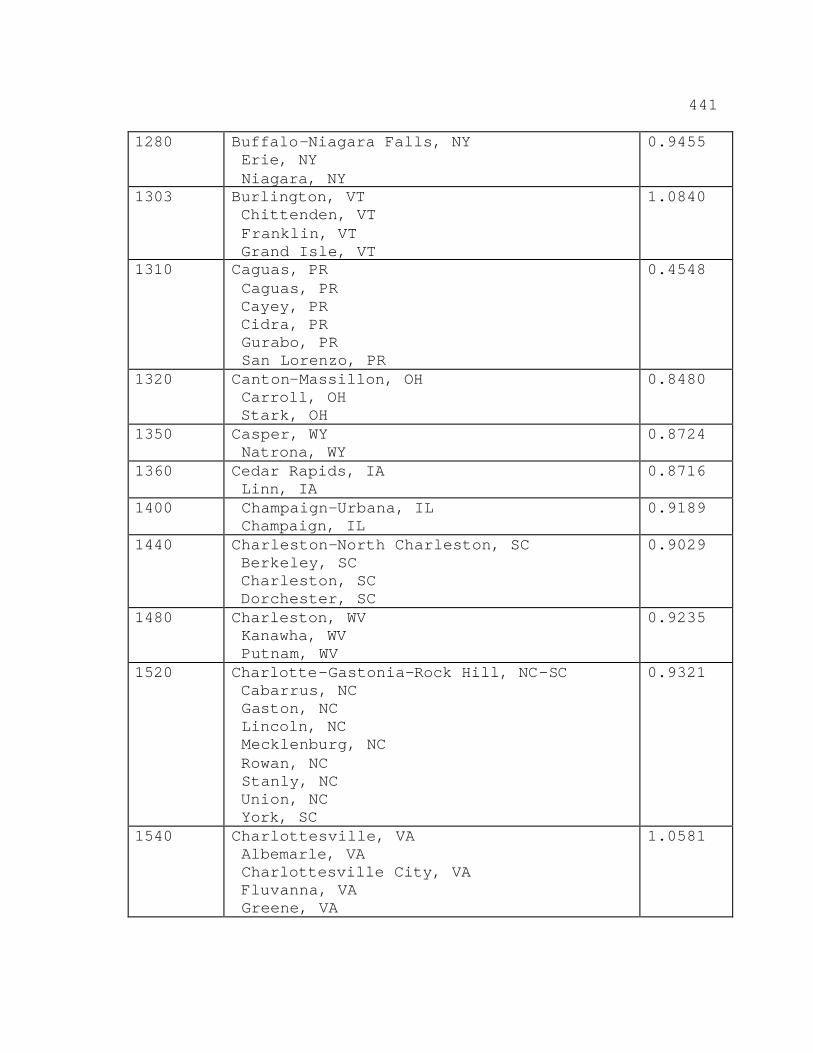
441
1280 Buffalo-Niagara Falls, NY Erie, NY Niagara, NY
0.9455
1303 Burlington, VT Chittenden, VT Franklin, VT Grand Isle, VT
1.0840
1310 Caguas, PR Caguas, PR Cayey, PR Cidra, PR Gurabo, PR San Lorenzo, PR
0.4548
1320 Canton-Massillon, OH Carroll, OH Stark, OH
0.8480
1350 Casper, WY Natrona, WY
0.8724
1360 Cedar Rapids, IA Linn, IA
0.8716
1400 Champaign-Urbana, IL Champaign, IL
0.9189
1440 Charleston-North Charleston, SC Berkeley, SC Charleston, SC Dorchester, SC
0.9029
1480 Charleston, WV Kanawha, WV Putnam, WV
0.9235
1520 Charlotte-Gastonia-Rock Hill, NC-SC Cabarrus, NC Gaston, NC Lincoln, NC Mecklenburg, NC Rowan, NC Stanly, NC Union, NC York, SC
0.9321
1540 Charlottesville, VA Albemarle, VA Charlottesville City, VA Fluvanna, VA Greene, VA
1.0581

442
1560 Chattanooga, TN-GA Catoosa, GA Dade, GA Walker, GA Hamilton, TN Marion, TN
0.9790
1580 Cheyenne, WY Laramie, WY
0.8308
1600 Chicago, IL Cook, IL De Kalb, IL Du Page, IL Grundy, IL Kane, IL Kendall, IL Lake, IL McHenry, IL Will, IL
1.1092
1620 Chico-Paradise, CA Butte, CA
0.9918
1640 Cincinnati, OH-KY-IN Dearborn, IN Ohio, IN Boone, KY Campbell, KY Gallatin, KY Grant, KY Kenton, KY Pendleton, KY Brown, OH Clermont, OH Hamilton, OH Warren, OH
0.9349
1660 Clarksville-Hopkinsville, TN-KY Christian, KY Montgomery, TN
0.8173
1680 Cleveland-Lorain-Elyria, OH Ashtabula, OH Geauga, OH Cuyahoga, OH Lake, OH Lorain, OH Medina, OH
0.9528
1720 Colorado Springs, CO El Paso, CO
0.9698
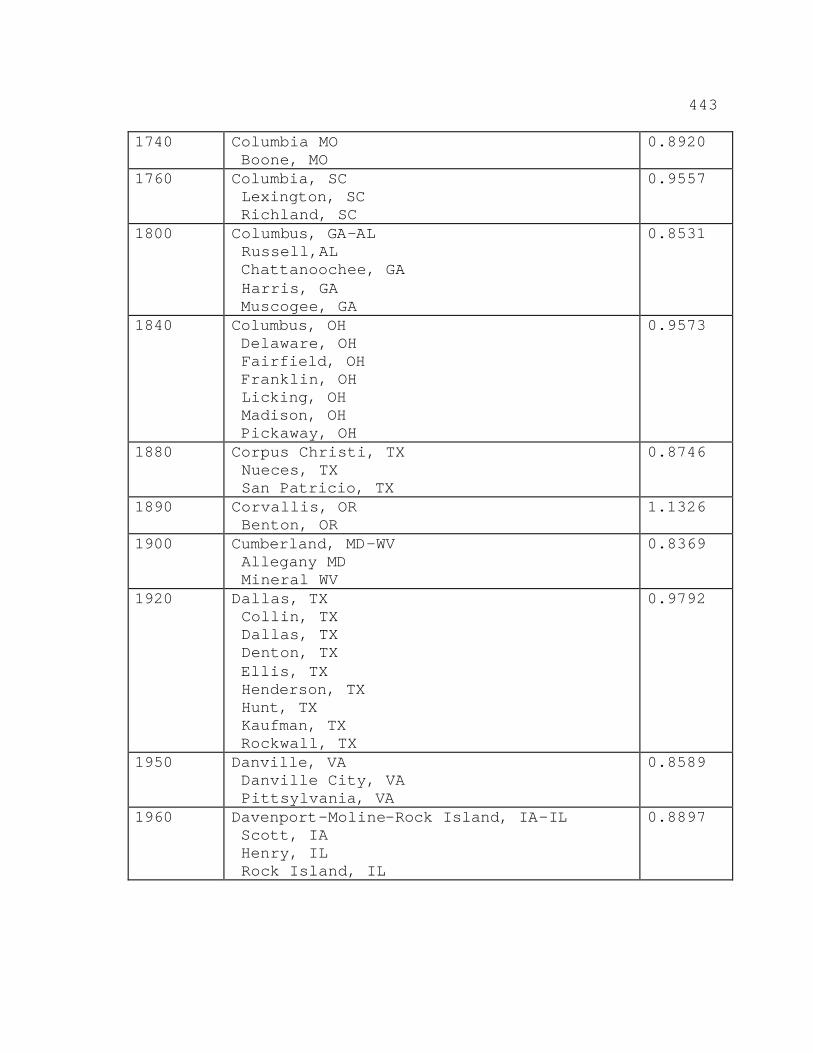
443
1740 Columbia MO Boone, MO
0.8920
1760 Columbia, SC Lexington, SC Richland, SC
0.9557
1800 Columbus, GA-AL Russell,AL Chattanoochee, GA Harris, GA Muscogee, GA
0.8531
1840 Columbus, OH Delaware, OH Fairfield, OH Franklin, OH Licking, OH Madison, OH Pickaway, OH
0.9573
1880 Corpus Christi, TX Nueces, TX San Patricio, TX
0.8746
1890 Corvallis, OR Benton, OR
1.1326
1900 Cumberland, MD-WV Allegany MD Mineral WV
0.8369
1920 Dallas, TX Collin, TX Dallas, TX Denton, TX Ellis, TX Henderson, TX Hunt, TX Kaufman, TX Rockwall, TX
0.9792
1950 Danville, VA Danville City, VA Pittsylvania, VA
0.8589
1960 Davenport-Moline-Rock Island, IA-IL Scott, IA Henry, IL Rock Island, IL
0.8897

444
2000 Dayton-Springfield, OH Clark, OH Greene, OH Miami, OH Montgomery, OH
0.9384
2020 Daytona Beach, FL Flagler, FL Volusia, FL
0.9165
2030 Decatur, AL Lawrence, AL Morgan, AL
0.8534
2040 Decatur, IL Macon, IL
0.8095
2080 Denver, CO Adams, CO Arapahoe, CO Denver, CO Douglas, CO Jefferson, CO
1.0120
2120 Des Moines, IA Dallas, IA Polk, IA Warren, IA
0.9073
2160 Detroit, MI Lapeer, MI Macomb, MI Monroe, MI Oakland, MI St. Clair, MI Wayne, MI
1.0364
2180 Dothan, AL Dale, AL Houston, AL
0.7943
2190 Dover, DE Kent, DE
1.0078
2200 Dubuque, IA Dubuque, IA
0.8746
2240 Duluth-Superior, MN-WI St. Louis, MN Douglas, WI
1.0032
2281 Dutchess County, NY Dutchess, NY
1.0187
2290 Eau Claire, WI Chippewa, WI Eau Claire, WI
0.8761

445
2320 El Paso, TX El Paso, TX
0.9332
2330 Elkhart-Goshen, IN Elkhart, IN
0.9145
2335 Elmira, NY Chemung, NY
0.8546
2340 Enid, OK Garfield, OK
0.8610
2360 Erie, PA Erie, PA
0.8892
2400 Eugene-Springfield, OR Lane, OR
1.0960
2440 Evansville-Henderson, IN-KY Posey, IN Vanderburgh, IN Warrick, IN Henderson, KY
0.8137
2520 Fargo-Moorhead, ND-MN Clay, MN Cass, ND
0.8750
2560 Fayetteville, NC Cumberland, NC
0.8655
2580 Fayetteville-Springdale-Rogers, AR Benton, AR Washington, AR
0.7910
2620 Flagstaff, AZ-UT Coconino, AZ Kane, UT
1.0681
2640 Flint, MI Genesee, MI
1.1153
2650 Florence, AL Colbert, AL Lauderdale, AL
0.7616
2655 Florence, SC Florence, SC
0.8737
2670 Fort Collins-Loveland, CO Larimer, CO
1.0620
2680 Ft. Lauderdale, FL Broward, FL
1.0118
2700 Fort Myers-Cape Coral, FL Lee, FL
0.9247
2710 Fort Pierce-Port St. Lucie, FL Martin, FL St. Lucie, FL
0.9538

446
2720 Fort Smith, AR-OK Crawford, AR Sebastian, AR Sequoyah, OK
0.8052
2750 Fort Walton Beach, FL Okaloosa, FL
0.9607
2760 Fort Wayne, IN Adams, IN Allen, IN De Kalb, IN Huntington, IN Wells, IN Whitley, IN
0.8647
2800 Fort Worth-Arlington, TX Hood, TX Johnson, TX Parker, TX Tarrant, TX
0.9392
2840 Fresno, CA Fresno, CA Madera, CA
1.0057
2880 Gadsden, AL Etowah, AL
0.8423
2900 Gainesville, FL Alachua, FL
0.9741
2920 Galveston-Texas City, TX Galveston, TX
0.9796
2960 Gary, IN Lake, IN Porter, IN
0.9451
2975 Glens Falls, NY Warren, NY Washington, NY
0.8361
2980 Goldsboro, NC Wayne, NC
0.8423
2985 Grand Forks, ND-MN Polk, MN Grand Forks, ND
0.8774
2995 Grand Junction, CO Mesa, CO
0.8947
3000 Grand Rapids-Muskegon-Holland, MI Allegan, MI Kent, MI Muskegon, MI Ottawa, MI
1.0070

447
3040 Great Falls, MT Cascade, MT
0.9065
3060 Greeley, CO Weld, CO
0.9664
3080 Green Bay, WI Brown, WI
0.9207
3120 Greensboro-Winston-Salem-High Point, NC Alamance, NC Davidson, NC Davie, NC Forsyth, NC Guilford, NC Randolph, NC Stokes, NC Yadkin, NC
0.9068
3150 Greenville, NC Pitt, NC
0.9402
3160 Greenville-Spartanburg-Anderson, SC Anderson, SC Cherokee, SC Greenville, SC Pickens, SC Spartanburg, SC
0.8894
3180 Hagerstown, MD Washington, MD
0.9409
3200 Hamilton-Middletown, OH Butler, OH
0.9061
3240 Harrisburg-Lebanon-Carlisle, PA Cumberland, PA Dauphin, PA Lebanon, PA Perry, PA
0.9338
3283 Hartford, CT Hartford, CT Litchfield, CT Middlesex, CT Tolland, CT
1.1236
3285 Hattiesburg, MS Forrest, MS Lamar, MS
0.7490
3290 Hickory-Morganton-Lenoir, NC Alexander, NC Burke, NC Caldwell, NC Catawba, NC
0.9008

448
3320 Honolulu, HI Honolulu, HI
1.1865
3350 Houma, LA Lafourche, LA Terrebonne, LA
0.8100
3360 Houston, TX Chambers, TX Fort Bend, TX Harris, TX Liberty, TX Montgomery, TX Waller, TX
0.9663
3400 Huntington-Ashland, WV-KY-OH Boyd, KY Carter, KY Greenup, KY Lawrence, OH Cabell, WV Wayne, WV
0.9876
3440 Huntsville, AL Limestone, AL Madison, AL
0.8932
3480 Indianapolis, IN Boone, IN Hamilton, IN Hancock, IN Hendricks, IN Johnson, IN Madison, IN Marion, IN Morgan, IN Shelby, IN
0.9747
3500 Iowa City, IA Johnson, IA
0.9537
3520 Jackson, MI Jackson, MI
0.9134
3560 Jackson, MS Hinds, MS Madison, MS Rankin, MS
0.8749
3580 Jackson, TN Chester, TN Madison, TN
0.8796

449
3600 Jacksonville, FL Clay, FL Duval, FL Nassau, FL St. Johns, FL
0.9186
3605 Jacksonville, NC Onslow, NC
0.7777
3610 Jamestown, NY Chautaqua, NY
0.7818
3620 Janesville-Beloit, WI Rock, WI
0.9587
3640 Jersey City, NJ Hudson, NJ
1.1440
3660 Johnson City-Kingsport-Bristol, TN-VA Carter, TN Hawkins, TN Sullivan, TN Unicoi, TN Washington, TN Bristol City, VA Scott, VA Washington, VA
0.8272
3680 Johnstown, PA Cambria, PA Somerset, PA
0.8767
3700 Jonesboro, AR Craighead, AR
0.7831
3710 Joplin, MO Jasper, MO Newton, MO
0.8148
3720 Kalamazoo-Battlecreek, MI Calhoun, MI Kalamazoo, MI Van Buren, MI
1.0440
3740 Kankakee, IL Kankakee, IL
0.9902

450
3760 Kansas City, KS-MO Johnson, KS Leavenworth, KS Miami, KS Wyandotte, KS Cass, MO Clay, MO Clinton, MO Jackson, MO Lafayette, MO Platte, MO Ray, MO
0.9458
3800 Kenosha, WI Kenosha, WI
0.9611
3810 Killeen-Temple, TX Bell, TX Coryell, TX
1.0164
3840 Knoxville, TN Anderson, TN Blount, TN Knox, TN Loudon, TN Sevier, TN Union, TN
0.8221
3850 Kokomo, IN Howard, IN Tipton, IN
0.9518
3870 La Crosse, WI-MN Houston, MN La Crosse, WI
0.9197
3880 Lafayette, LA Acadia, LA Lafayette, LA St. Landry, LA St. Martin, LA
0.8390
3920 Lafayette, IN Clinton, IN Tippecanoe, IN
0.8834
3960 Lake Charles, LA Calcasieu, LA
0.7399
3980 Lakeland-Winter Haven, FL Polk, FL
0.9239
4000 Lancaster, PA Lancaster, PA
0.9247

451
4040 Lansing-East Lansing, MI Clinton, MI Eaton, MI Ingham, MI
0.9880
4080 Laredo, TX Webb, TX
0.8168
4100 Las Cruces, NM Dona Ana, NM
0.8639
4120 Las Vegas, NV-AZ Mohave, AZ Clark, NV Nye, NV
1.0796
4150 Lawrence, KS Douglas, KS
0.8190
4200 Lawton, OK Comanche, OK
0.8996
4243 Lewiston-Auburn, ME Androscoggin, ME
0.9003
4280 Lexington, KY Bourbon, KY Clark, KY Fayette, KY Jessamine, KY Madison, KY Scott, KY Woodford, KY
0.8774
4320 Lima, OH Allen, OH Auglaize, OH
0.9320
4360 Lincoln, NE Lancaster, NE
0.9619
4400 Little Rock-North Little, AR Faulkner, AR Lonoke, AR Pulaski, AR Saline, AR
0.8908
4420 Longview-Marshall, TX Gregg, TX Harrison, TX Upshur, TX
0.8922
4480 Los Angeles-Long Beach, CA Los Angeles, CA
1.1984

452
4520 Louisville, KY-IN Clark, IN Floyd, IN Harrison, IN Scott, IN Bullitt, KY Jefferson, KY Oldham, KY
0.9261
4600 Lubbock, TX Lubbock, TX
0.8848
4640 Lynchburg, VA Amherst, VA Bedford City, VA Bedford, VA Campbell, VA Lynchburg City, VA
0.8851
4680 Macon, GA Bibb, GA Houston, GA Jones, GA Peach, GA Twiggs, GA
0.8848
4720 Madison, WI Dane, WI
1.0316
4800 Mansfield, OH Crawford, OH Richland, OH
0.8690
4840 Mayaguez, PR Anasco, PR Cabo Rojo, PR Hormigueros, PR Mayaguez, PR Sabana Grande, PR San German, PR
0.4577
4880 McAllen-Edinburg-Mission, TX Hidalgo, TX
0.8566
4890 Medford-Ashland, OR Jackson, OR
1.0344
4900 Melbourne-Titusville-Palm Bay, FL Brevard, FL
0.9688

453
4920 Memphis, TN-AR-MS Crittenden, AR De Soto, MS Fayette, TN Shelby, TN Tipton, TN
0.8688
4940 Merced, CA Merced, CA
0.9559
5000 Miami, FL Dade, FL
1.0110
5015 Middlesex-Somerset-Hunterdon, NJ Hunterdon, NJ Middlesex, NJ Somerset, NJ
1.0987
5080 Milwaukee-Waukesha, WI Milwaukee, WI Ozaukee, WI Washington, WI Waukesha, WI
0.9664
5120 Minneapolis-St. Paul, MN-WI Anoka, MN Carver, MN Chisago, MN Dakota, MN Hennepin, MN Isanti, MN Ramsey, MN Scott, MN Sherburne, MN Washington, MN Wright, MN Pierce, WI St. Croix, WI
1.0971
5140 Missoula, MT Missoula, MT
0.9274
5160 Mobile, AL Baldwin, AL Mobile, AL
0.8006
5170 Modesto, CA Stanislaus, CA
1.0401
5190 Monmouth-Ocean, NJ Monmouth, NJ Ocean, NJ
1.1293
5200 Monroe, LA Ouachita, LA
0.8316

454
5240 Montgomery, AL Autauga, AL Elmore, AL Montgomery, AL
0.7642
5280 Muncie, IN Delaware, IN
1.0683
5330 Myrtle Beach, SC Horry, SC
0.8440
5345 Naples, FL Collier, FL
0.9661
5360 Nashville, TN Cheatham, TN Davidson, TN Dickson, TN Robertson, TN Rutherford, TN Sumner, TN Williamson, TN Wilson, TN
0.9327
5380 Nassau-Suffolk, NY Nassau, NY Suffolk, NY
1.3784
5483 New Haven-Bridgeport-Stamford-Waterbury-Danbury, CT Fairfield, CT New Haven, CT
1.2192
5523 New London-Norwich, CT New London, CT
1.2061
5560 New Orleans, LA Jefferson, LA Orleans, LA Plaquemines, LA St. Bernard, LA St. Charles, LA St. James, LA St. John The Baptist, LA St. Tammany, LA
0.9235

455
5600 New York, NY Bronx, NY Kings, NY New York, NY Putnam, NY Queens, NY Richmond, NY Rockland, NY Westchester, NY
1.4483
5640 Newark, NJ Essex, NJ Morris, NJ Sussex, NJ Union, NJ Warren, NJ
1.1828
5660 Newburgh, NY-PA Orange, NY Pike, PA
1.0847
5720 Norfolk-Virginia Beach-Newport News, VA-NC Currituck, NC Chesapeake City, VA Gloucester, VA Hampton City, VA Isle of Wight, VA James City, VA Mathews, VA Newport News City, VA Norfolk City, VA Poquoson City,VA Portsmouth City, VA Suffolk City, VA Virginia Beach City, VA Williamsburg City, VA York, VA
0.8374
5775 Oakland, CA Alameda, CA Contra Costa, CA
1.5029
5790 Ocala, FL Marion, FL
0.9243
5800 Odessa-Midland, TX Ector, TX Midland, TX
0.9206

456
5880 Oklahoma City, OK Canadian, OK Cleveland, OK Logan, OK McClain, OK Oklahoma, OK Pottawatomie, OK
0.8774
5910 Olympia, WA Thurston, WA
1.0689
5920 Omaha, NE-IA Pottawattamie, IA Cass, NE Douglas, NE Sarpy, NE Washington, NE
0.9470
5945 Orange County, CA Orange, CA
1.1453
5960 Orlando, FL Lake, FL Orange, FL Osceola, FL Seminole, FL
0.9550
5990 Owensboro, KY Daviess, KY
0.8159
6015 Panama City, FL Bay, FL
0.9010
6020 Parkersburg-Marietta, WV-OH Washington, OH Wood, WV
0.8258
6080 Pensacola, FL Escambia, FL Santa Rosa, FL
0.8176
6120 Peoria-Pekin, IL Peoria, IL Tazewell, IL Woodford, IL
0.8494

457
6160 Philadelphia, PA-NJ Burlington, NJ Camden, NJ Gloucester, NJ Salem, NJ Bucks, PA Chester, PA Delaware, PA Montgomery, PA Philadelphia, PA
1.0753
6200 Phoenix-Mesa, AZ Maricopa, AZ Pinal, AZ
0.9628
6240 Pine Bluff, AR Jefferson, AR
0.7771
6280 Pittsburgh, PA Allegheny, PA Beaver, PA Butler, PA Fayette, PA Washington, PA Westmoreland, PA
0.9570
6323 Pittsfield, MA Berkshire, MA
1.0130
6340 Pocatello, ID Bannock, ID
0.9076
6360 Ponce, PR Guayanilla, PR Juana Diaz, PR Penuelas, PR Ponce, PR Villalba, PR Yauco, PR
0.4993
6403 Portland, ME Cumberland, ME Sagadahoc, ME York, ME
0.9687
6440 Portland-Vancouver, OR-WA Clackamas, OR Columbia, OR Multnomah, OR Washington, OR Yamhill, OR Clark, WA
1.0913

458
6483 Providence-Warwick-Pawtucket, RI Bristol, RI Kent, RI Newport, RI Providence, RI Washington, RI
1.0771
6520 Provo-Orem, UT Utah, UT
1.0014
6560 Pueblo, CO Pueblo, CO
0.8783
6580 Punta Gorda, FL Charlotte, FL
0.9602
6600 Racine, WI Racine, WI
0.9231
6640 Raleigh-Durham-Chapel Hill, NC Chatham, NC Durham, NC Franklin, NC Johnston, NC Orange, NC Wake, NC
0.9583
6660 Rapid City, SD Pennington, SD
0.8779
6680 Reading, PA Berks, PA
0.9105
6690 Redding, CA Shasta, CA
1.1641
6720 Reno, NV Washoe, NV
1.0550
6740 Richland-Kennewick-Pasco, WA Benton, WA Franklin, WA
1.1460

459
6760 Richmond-Petersburg, VA Charles City County, VA Chesterfield, VA Colonial Heights City, VA Dinwiddie, VA Goochland, VA Hanover, VA Henrico, VA Hopewell City, VA New Kent, VA Petersburg City, VA Powhatan, VA Prince George, VA Richmond City, VA
0.9618
6780 Riverside-San Bernardino, CA Riverside, CA San Bernardino, CA
1.1229
6800 Roanoke, VA Botetourt, VA Roanoke, VA Roanoke City, VA Salem City, VA
0.8663
6820 Rochester, MN Olmsted, MN
1.1334
6840 Rochester, NY Genesee, NY Livingston, NY Monroe, NY Ontario, NY Orleans, NY Wayne, NY
0.8991
6880 Rockford, IL Boone, IL Ogle, IL Winnebago, IL
0.8819
6895 Rocky Mount, NC Edgecombe, NC Nash, NC
0.8849
6920 Sacramento, CA El Dorado, CA Placer, CA Sacramento, CA
1.1932

460
6960 Saginaw-Bay City-Midland, MI Bay, MI Midland, MI Saginaw, MI
0.9557
6980 St. Cloud, MN Benton, MN Stearns, MN
0.9994
7000 St. Joseph, MO Andrews, MO Buchanan, MO
0.9071
7040 St. Louis, MO-IL Clinton, IL Jersey, IL Madison, IL Monroe, IL St. Clair, IL Franklin, MO Jefferson, MO Lincoln, MO St. Charles, MO St. Louis, MO St. Louis City, MO Warren, MO Sullivan City, MO
0.8947
7080 Salem, OR Marion, OR Polk, OR
1.0189
7120 Salinas, CA Monterey, CA
1.4518
7160 Salt Lake City-Ogden, UT Davis, UT Salt Lake, UT Weber, UT
0.9782
7200 San Angelo, TX Tom Green, TX
0.8083
7240 San Antonio, TX Bexar, TX Comal, TX Guadalupe, TX Wilson, TX
0.8540
7320 San Diego, CA San Diego, CA
1.1784

461
7360 San Francisco, CA Marin, CA San Francisco, CA San Mateo, CA
1.4250
7400 San Jose, CA Santa Clara, CA
1.3759
7440 San Juan-Bayamon, PR Aguas Buenas, PR Barceloneta, PR Bayamon, PR Canovanas, PR Carolina, PR Catano, PR Ceiba, PR Comerio, PR Corozal, PR Dorado, PR Fajardo, PR Florida, PR Guaynabo, PR Humacao, PR Juncos, PR Los Piedras, PR Loiza, PR Luguillo, PR Manati, PR Morovis, PR Naguabo, PR Naranjito, PR Rio Grande, PR San Juan, PR Toa Alta, PR Toa Baja, PR Trujillo Alto, PR Vega Alta, PR Vega Baja, PR Yabucoa, PR
0.4651
7460 San Luis Obispo-Atascadero-Paso Robles, CA San Luis Obispo, CA
1.0673
7480 Santa Barbara-Santa Maria-Lompoc, CA Santa Barbara, CA
1.0580
7485 Santa Cruz-Watsonville, CA Santa Cruz, CA
1.4040

462
7490 Santa Fe, NM Los Alamos, NM Santa Fe, NM
1.0538
7500 Santa Rosa, CA Sonoma, CA
1.2649
7510 Sarasota-Bradenton, FL Manatee, FL Sarasota, FL
0.9809
7520 Savannah, GA Bryan, GA Chatham, GA Effingham, GA
0.9601
7560 Scranton--Wilkes-Barre--Hazleton, PA Columbia, PA Lackawanna, PA Luzerne, PA Wyoming, PA
0.8401
7600 Seattle-Bellevue-Everett, WA Island, WA King, WA Snohomish, WA
1.0985
7610 Sharon, PA Mercer, PA
0.7900
7620 Sheboygan, WI Sheboygan, WI
0.8379
7640 Sherman-Denison, TX Grayson, TX
0.8694
7680 Shreveport-Bossier City, LA Bossier, LA Caddo, LA Webster, LA
0.8705
7720 Sioux City, IA-NE Woodbury, IA Dakota, NE
0.8471
7760 Sioux Falls, SD Lincoln, SD Minnehaha, SD
0.8790
7800 South Bend, IN St. Joseph, IN
0.9848
7840 Spokane, WA Spokane, WA
1.0496
7880 Springfield, IL Menard, IL Sangamon, IL
0.8656

463
7920 Springfield, MO Christian, MO Greene, MO Webster, MO
0.8484
8003 Springfield, MA Hampden, MA Hampshire, MA
1.0485
8050 State College, PA Centre, PA
0.9022
8080 Steubenville-Weirton, OH-WV Jefferson, OH Brooke, WV Hancock, WV
0.8548
8120 Stockton-Lodi, CA San Joaquin, CA
1.0606
8140 Sumter, SC Sumter, SC
0.8271
8160 Syracuse, NY Cayuga, NY Madison, NY Onondaga, NY Oswego, NY
0.9378
8200 Tacoma, WA Pierce, WA
1.1553
8240 Tallahassee, FL Gadsden, FL Leon, FL
0.8482
8280 Tampa-St. Petersburg-Clearwater, FL Hernando, FL Hillsborough, FL Pasco, FL Pinellas, FL
0.8960
8320 Terre Haute, IN Clay, IN Vermillion, IN Vigo, IN
0.8268
8360 Texarkana, AR-Texarkana, TX Miller, AR Bowie, TX
0.8341
8400 Toledo, OH Fulton, OH Lucas, OH Wood, OH
0.9742
8440 Topeka, KS Shawnee, KS
0.9051
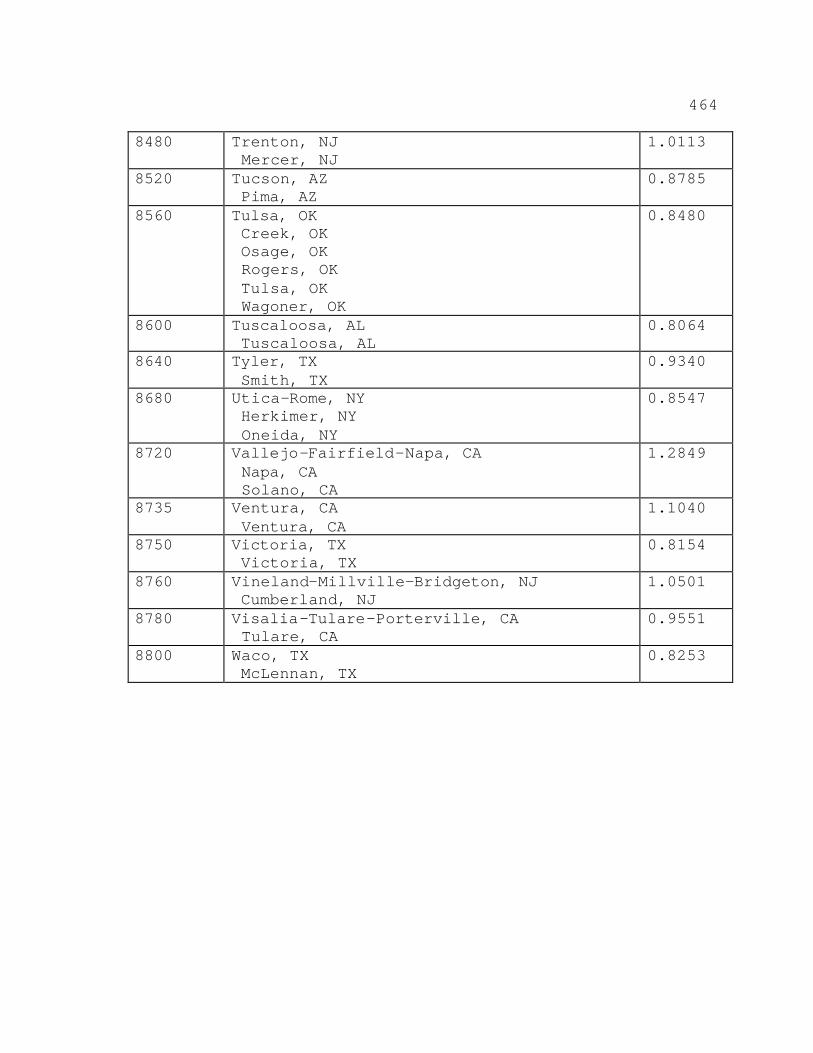
464
8480 Trenton, NJ Mercer, NJ
1.0113
8520 Tucson, AZ Pima, AZ
0.8785
8560 Tulsa, OK Creek, OK Osage, OK Rogers, OK Tulsa, OK Wagoner, OK
0.8480
8600 Tuscaloosa, AL Tuscaloosa, AL
0.8064
8640 Tyler, TX Smith, TX
0.9340
8680 Utica-Rome, NY Herkimer, NY Oneida, NY
0.8547
8720 Vallejo-Fairfield-Napa, CA Napa, CA Solano, CA
1.2849
8735 Ventura, CA Ventura, CA
1.1040
8750 Victoria, TX Victoria, TX
0.8154
8760 Vineland-Millville-Bridgeton, NJ Cumberland, NJ
1.0501
8780 Visalia-Tulare-Porterville, CA Tulare, CA
0.9551
8800 Waco, TX McLennan, TX
0.8253

465
8840 Washington, DC-MD-VA-WV District of Columbia, DC Calvert, MD Charles, MD Frederick, MD Montgomery, MD Prince Georges, MD Alexandria City, VA Arlington, VA Clarke, VA Culpepper, VA Fairfax, VA Fairfax City, VA Falls Church City, VA Fauquier, VA Fredericksburg City, VA King George, VA Loudoun, VA Manassas City, VA Manassas Park City, VA Prince William, VA Spotsylvania, VA Stafford, VA Warren, VA Berkeley, WV Jefferson, WV
1.0711
8920 Waterloo-Cedar Falls, IA Black Hawk, IA
0.8404
8940 Wausau, WI Marathon, WI
0.9418
8960 West Palm Beach-Boca Raton, FL Palm Beach, FL
0.9699
9000 Wheeling, OH-WV Belmont, OH Marshall, WV Ohio, WV
0.7665
9040 Wichita, KS Butler, KS Harvey, KS Sedgwick, KS
0.9502
9080 Wichita Falls, TX Archer, TX Wichita, TX
0.7647
9140 Williamsport, PA Lycoming, PA
0.8332

466
9160 Wilmington-Newark, DE-MD New Castle, DE Cecil, MD
1.0826
9200 Wilmington, NC New Hanover, NC Brunswick, NC
0.9394
9260 Yakima, WA Yakima, WA
0.9876
9270 Yolo, CA Yolo, CA
1.0199
9280 York, PA York, PA
0.9196
9320 Youngstown-Warren, OH Columbiana, OH Mahoning, OH Trumbull, OH
0.9477
9340 Yuba City, CA Sutter, CA Yuba, CA
1.0706
9360 Yuma, AZ Yuma, AZ
0.9529
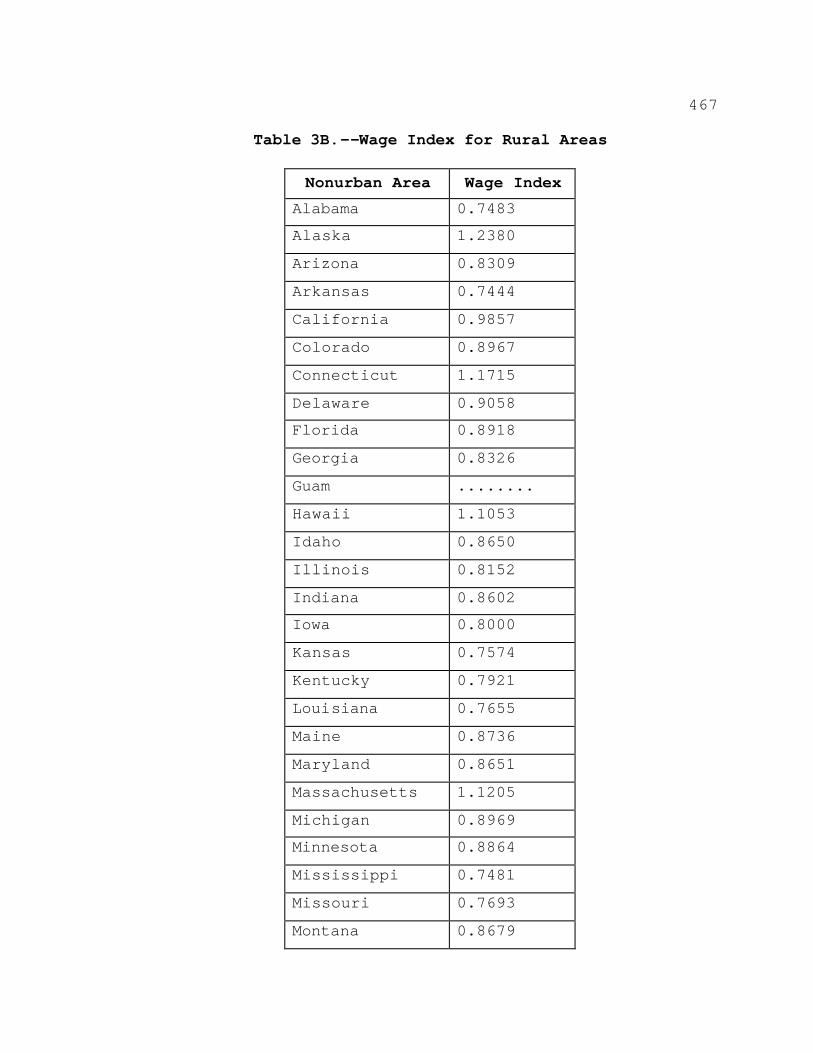
467
Table 3B.--Wage Index for Rural Areas
Nonurban Area Wage Index Alabama 0.7483
Alaska 1.2380
Arizona 0.8309
Arkansas 0.7444
California 0.9857
Colorado 0.8967
Connecticut 1.1715
Delaware 0.9058
Florida 0.8918
Georgia 0.8326
Guam ........
Hawaii 1.1053
Idaho 0.8650
Illinois 0.8152
Indiana 0.8602
Iowa 0.8000
Kansas 0.7574
Kentucky 0.7921
Louisiana 0.7655
Maine 0.8736
Maryland 0.8651
Massachusetts 1.1205
Michigan 0.8969
Minnesota 0.8864
Mississippi 0.7481
Missouri 0.7693
Montana 0.8679

468
Nebraska 0.8055
Nevada 0.9228
New Hampshire
New Jersey 1/ 0.9741
........
New Mexico 0.8495
New York 0.8472
North Carolina 0.8437
North Dakota 0.7676
Ohio 0.8663
Oklahoma 0.7484
Oregon 1.0124
Pennsylvania 0.8535
Puerto Rico
Rhode Island 1/ 0.4264
........
South Carolina 0.8369
South Dakota 0.7550
Tennessee 0.7836
Texas 0.7490
Utah 0.9029
Vermont 0.9266
Virginia 0.8181
Virgin Islands ........
Washington 1.0422
West Virginia 0.8206
Wisconsin 0.8865
Wyoming 0.8805
1/ All counties within the State are classified urban.
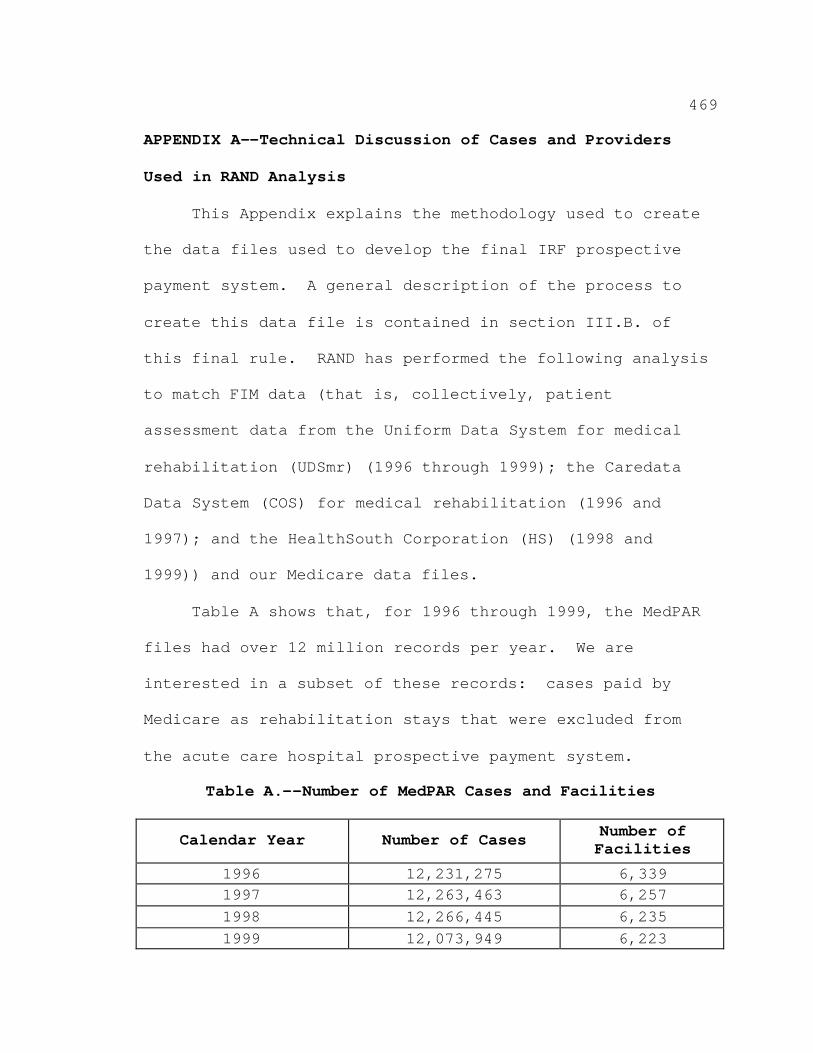
469
APPENDIX A--Technical Discussion of Cases and Providers
Used in RAND Analysis
This Appendix explains the methodology used to create
the data files used to develop the final IRF prospective
payment system. A general description of the process to
create this data file is contained in section III.B. of
this final rule. RAND has performed the following analysis
to match FIM data (that is, collectively, patient
assessment data from the Uniform Data System for medical
rehabilitation (UDSmr) (1996 through 1999); the Caredata
Data System (COS) for medical rehabilitation (1996 and
1997); and the HealthSouth Corporation (HS) (1998 and
1999)) and our Medicare data files.
Table A shows that, for 1996 through 1999, the MedPAR
files had over 12 million records per year. We are
interested in a subset of these records: cases paid by
Medicare as rehabilitation stays that were excluded from
the acute care hospital prospective payment system.
Table A.--Number of MedPAR Cases and Facilities
Calendar Year Number of Cases Number of Facilities
1996 12,231,275 6,339 1997 12,263,463 6,257 1998 12,266,445 6,235 1999 12,073,949 6,223

470
Table B shows total 1996 through 1999 rehabilitation
stays by type of provider (freestanding rehabilitation
facility versus excluded unit of an acute care hospital).
This was the "sampling" frame. In order to describe the
IRF prospective payment system case-mix, RAND attached
information from FIM instruments to each record in this
frame, thereby obtaining "complete" records. To the extent
that RAND was unable to add information to some records, it
was important to know both how to and whether to weight the
complete records so they would be representative of the
1996 through 1999 rehabilitation stays in the "sampling"
frames.
Table B.--Number of Rehabilitation MedPAR Cases and Facilities
Calendar Year
Type Number of Cases
Number of Facilities
Total Number of Cases
Total Number
of Facilities
1996 Excluded Unit 229,193 877
344,126 1,081Freestanding 114,933 204
1997 Excluded Unit 240,491 911
359,032 1,123Freestanding 118,541 212
1998 Excluded Unit 248,015 941
370,352 1,155Freestanding 122,337 214
1999 Excluded Unit 260,745 961
390,048 1,165Freestanding 129,303 204
Note: Freestanding facilities have characters 3-6 of the Medicare provider number in the range 3025-3099. Patients receiving rehabilitation care in excluded units of acute care hospitals have a "provider code" of T in their MedPAR records.
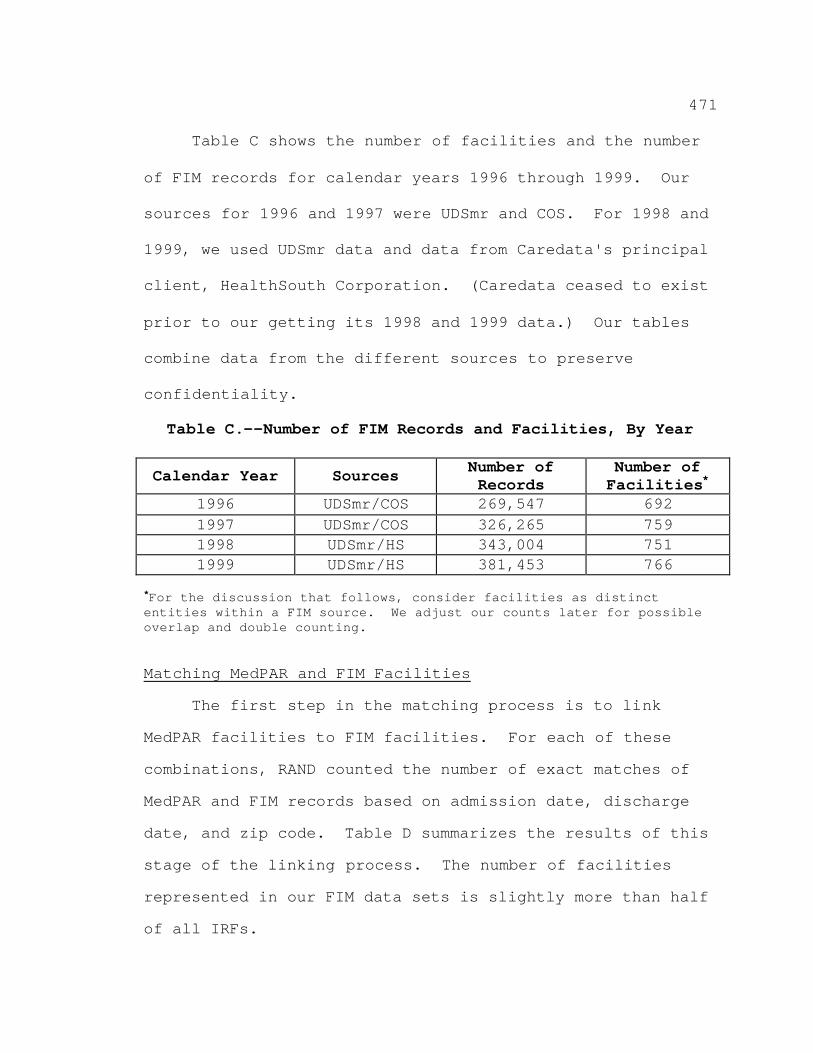
471
Table C shows the number of facilities and the number
of FIM records for calendar years 1996 through 1999. Our
sources for 1996 and 1997 were UDSmr and COS. For 1998 and
1999, we used UDSmr data and data from Caredata's principal
client, HealthSouth Corporation. (Caredata ceased to exist
prior to our getting its 1998 and 1999 data.) Our tables
combine data from the different sources to preserve
confidentiality.
Table C.--Number of FIM Records and Facilities, By Year
Calendar Year Sources Number of Records
Number of Facilities*
1996 UDSmr/COS 269,547 692 1997 UDSmr/COS 326,265 759 1998 UDSmr/HS 343,004 751 1999 UDSmr/HS 381,453 766
*For the discussion that follows, consider facilities as distinct entities within a FIM source. We adjust our counts later for possible overlap and double counting.
Matching MedPAR and FIM Facilities
The first step in the matching process is to link
MedPAR facilities to FIM facilities. For each of these
combinations, RAND counted the number of exact matches of
MedPAR and FIM records based on admission date, discharge
date, and zip code. Table D summarizes the results of this
stage of the linking process. The number of facilities
represented in our FIM data sets is slightly more than half
of all IRFs.

472
Table D.--Numbers of FIM Facilities Linked to MedPAR Facilities
Calendar Year Sources MedPAR
Uniquea MedPAR
Multipleb MedPAR
Nonmatchc Total
1996 UDSmr/COS 568 18 106 692 1997 UDSmr/COS 625 33 101 759 1998 UDSmr/HS 730 19 2 751 1999 UDSmr/HS 729 35 2 766
aFIM IRFs that appear to have a single MedPAR provider.bFIM IRFs that appear to have more than one MedPAR provider. cFIM IRFs that did not link to our Medicare files. The large drop between 1997 and 1998 is because SNF and long-term care hospital data were excluded from our 1998/1999 request.
The FIM data do not contain the Medicare beneficiary
identifier and, therefore, it was necessary to use a
probabilistic matching algorithm based on characteristics
of the beneficiary and the hospitalization. The matching
was accomplished in a series of four steps:
(1) Identify match variables;
(2) Recode certain FIM variables to be consistent
with MedPAR, create additional records for UDSmr
interrupted stays, and eliminate duplicate cases;
(3) Run a match algorithm to link FIM and MedPAR
records; and
(4) Choose a single MedPAR case if it matches
multiple UDSmr or COS cases.
Step 1: Identify Match Variables
473
A further search for matches only within the provider
number and facility identifier pairings was performed. An
attempt was made to match all MedPAR records to a FIM
record for all facilities.
For MedPAR, in addition to facility identity,
six variables were used to link the records: admission
date, discharge date, zip code, age at admission, sex, and
race. For FIM, the same information in a slightly recoded
form was available (for example, birth date). An indicator
of whether Medicare was the primary payer was used to
determine how to set certain parameters for the matching
algorithm.
Step 2: Create/Delete FIM Records
COS and HS coded interrupted stays in a manner similar
to Medicare: one record per rehabilitation discharge
episode. Therefore, these records did not require any
additional processing. However, UDSmr codes multiple stays
via a series of "transfer/return" dates on a single UDSmr
record. To facilitate matching UDSmr and MedPAR records,
multiple records for interrupted stays were created with
admission and discharge dates corresponding to the
beginning and ending of each stay. The additional records

474
were then given the same chance of matching MedPAR records
as any noninterrupted stay.
For UDSmr, COS, and HS files, there were some
duplicate cases that had to be eliminated.
Table E shows the number of records present at the
various stages of processing. The last column shows the
number of cases that would be matched to MedPAR.
Table E.--Number of FIM Records At Various Stages of Processing
Calendar Year Source
Number of Records
Original After
Expansion
After Duplicate
Elimination 1996 UDSmr/COS 269,547 276,554 275,378 1997 UDSmr/COS 326,265 334,794 333,370 1998 UDSmr/HS 343,004 352,602 352,469 1999 UDSmr/HS 381,453 391,820 391,627
Step 3: Match Discharges from MedPAR and FIM
Facilities
A match algorithm similar to the one used in Carter,
Relles, et al. (1997) was run assuming that links are
imperfect--any variable can be in error. A scoring
function was developed, based on Bayes' Theorem, which
gives the odds of a match based on how consistent variables
tend to be for true matching and nonmatching cases.

475
The scoring function selects pairs with the greatest
likelihood of being correct matches. A cutoff under which
scores below are considered "nonmatches" and scores above
are considered "matches" is chosen empirically. We sorted
the pairings by score, and examined candidate matches as a
function of this score. We wanted a conservative
criterion--agreement between two "matched" records not
likely to be resulting from chance. We noticed that cases
in the 3.2 range and above appeared to be the same: race
and sex agreeing, mild disagreement between usually at most
one of the other match variables (admission date, discharge
date, age, and zip code). We also looked at additional
variables not employed in the matching process. For cases
above the 3.2 threshold, a FIM variable tended to indicate
that Medicare was the "primary payer," and the Medicare
provider code tended to be "T" in acute care hospitals;
both were less likely below 3.2. Thus, we chose 3.2 as our
cutoff.
Step 4: Choose a Single MedPAR Case for Multiple FIM
Matches
While the matching was unique within a
facility/provider pair, some MedPAR providers were paired
with different facilities, as shown in Table F. Also, some

476
UDSmr and COS/HS facilities were the same: 6 overlaps in
1996, 7 in 1997, 26 in 1998, and 1 in 1999.
Table F.--MedPAR Facilities Paired with Multiple Facilities
Calendar Year Sources Number of Facilities
1996 UDSmr 5 COS 5
1997 UDSmr 8 COS 10
1998 UDSmr 10 HS 0
1999 UDSmr 18 HS 0
Each nonunique pairing had the potential of creating
multiple matches to a single MedPAR record. We eliminated
these matches in two steps. First, working within each
UDSmr, COS, and HS file, we eliminated MedPAR duplicate
links, keeping the match with the highest score. Then we
checked for duplicate links between UDSmr and the
corresponding COS/HS files within the same year, again
keeping the match with the highest score. Table G provides
results for cutoff score 3.2, as discussed in Step 3.

477
Table G.--Number of Linked Records After Duplicates Elimination
Calendar Year Sources
Number of Records
Total Records
Duplicates Eliminated1
Overlap Eliminated2
1996 UDSmr/COS 191,173 190,480 188,889 1997 UDSmr/COS 227,696 226,411 222,682 1998 UDSmr/HS 252,662 247,296 246,450 1999
1Multiple pairings can link the same MedPAR record to more than one FIM case. This step UDSmr/HS 281,230 273,772 273,548
eliminates those multiple links, keeping the link with the highest match score.2The same MedPAR provider might show up in both UDSmr and COS, again allowing the same MedPAR record to match more than one FIM case.
Quality of the Match
There are two aspects to evaluating the quality of the
match. The first is whether we actually matched all of the
cases. To evaluate this, we computed match rates for each
of our populations: FIM and MedPAR, by year. The second
aspect is the representativeness of the match for the
entire population. To evaluate this, we compared patient
and facility characteristics to both linked and full
population, and considered whether some form of weighting
would make those populations look sufficiently the same.
Match Rates
Table H suggests overall match rates in these FIM
facilities for the eligible population in the IRF
prospective payment system to be almost 90 percent. This

478
was slightly higher than expected--the Carter, Relles, et
al. (1997) match rates were about 86 percent.
Table H.--MedPAR Match Rates, Providers with a Full Year of Data
Calendar Year Sources MedPAR
Cases Matched Cases
Percent Matched
1996 UDSmr/COS 162,659 142,410 87.6 1997 UDSmr/COS 212,581 190,069 89.4 1998 UDSmr/HS 234,623 208,769 89.0 1999 UDSmr/HS 263,785 237,568 90.1
Note: Tabulations are for patients eligible for IRF prospective payment system.
The FIM files contain many cases not paid by Medicare,
but the files provide an indication of whether Medicare is
the primary payer. Accordingly, restricting our attention
to Medicare cases, we obtain the percentages shown in
Table I.
Table I.--FIM Match Rates for Medicare as the Primary Payer
Calendar Year Source FIM
Cases Matched Cases
Percent Matched
1996 UDSmr/COS 188,892 180,783 95.7 1997 UDSmr/COS 223,351 213,053 95.4 1998 UDSmr/HS 246,727 235,261 95.4 1999 UDSmr/HS 273,303 261,969 95.9
Note: FIM cases matching any Medicare case.
These match rates are also slightly higher than
reported in Carter and Relles (1997), where a 93.7 percent
rate was achieved for 1994 UDSmr data. We consider these

479
match rates to be acceptable, within the limitations of
information available.
Representativeness of Linked MedPAR
For analytical purposes, lack of representativeness is
most important for characteristics that are related to
outcomes we are trying to model. For example, if costs for
treating a patient in freestanding facilities differed from
costs in excluded units of acute care hospitals, we would
consider re-weighting the sample of linked cases to adjust
our total cost estimates.
Tables J through N present an analysis of the
characteristics of the facilities and cases in the matched
sample described in the previous tables. The data in
Tables J through N are the latest data available for the
purposes of constructing a data file used to develop the
IRF prospective payment system in this final rule.
Representativeness of Linked MedPAR Hospital
Characteristics
This section addresses the extent to which the
facilities present in the FIM file are representative of
the set of all facilities that provide inpatient
rehabilitation care to Medicare beneficiaries, and the
extent to which FIM patients are representative of all

480
Medicare eligible patients under the IRF prospective
payment system. This analysis reflects the effects of the
partial-year sample available for some FIM facilities as
well as the sampling of MedPAR facilities. The MedPAR
records contain data from over 1,000 IRFs in each year.
Table J divides these facilities into freestanding
rehabilitation facilities (freestanding rehabilitation) and
excluded rehabilitation units of acute-care hospitals
(excluded units). It presents the number of facilities in
the linked MedPAR sample, along with the total MedPAR
counts of rehabilitation patients at these facilities.

481
Table J.--Comparison of Number of FIM and MedPAR Rehabilitation Facilities, by Type
Year Type
of Facility
Number of Facilities Number of Rehabilitation
Patients
FIMa Total MedPARb
Percent FIM
FIMa Total MedPARb
Percent FIM
1996
Freestanding Rehabilitation
130 204 64 86,301 114,933 75
Excluded Unit
435 877 50 130,623 229,193 57
Total 565 1,081 42 216,924 344,126 63
1997
Freestanding Rehabilitation
142 212 67 94,327 118,541 80
Excluded Unit
489 911 54 150,787 240,491 63
Total 631 1,123 56 245,114 359,032 68
1998
Freestanding Rehabilitation
171 214 80 111,503 122,337 91
Excluded Unit
515 941 55 157,483 248,015 63
Total 686 1,155 59 268,986 370,352 73
1999
Freestanding Rehabilitation
170 204 83 120,284 129,303 93
Excluded Unit
554 961 58 171,886 260,745 66
Total 724 1,165 62 292,170 390,048 75 aHospitals with at least one linked MedPAR/ FIM rehabilitation record.bTotal (matched and unmatched) rehabilitation cases.
As shown in Table J, for 1999, FIM facilities
represented 62 percent of the facilities, but served almost
75 percent of all MedPAR IRF cases. Based on data found in
the table, in 1999, FIM freestanding facilities had an
average of 708 patients, 442 more than other-MedPAR
freestanding facilities; and FIM excluded units had an
average of 310 patients, 92 more than other-MedPAR excluded
units.

482
Table K shows the distribution of FIM IRFs by size.
This shows both that freestanding facilities are larger
than excluded units and that FIM IRFs tend to be larger
than other MedPAR facilities within type of facility.
Table K.--Comparison of Sizes of FIM and MedPAR Facilities, by Type of Facility
Number of MedPAR Patients
1996 1997
Freestanding Excluded Unit Freestanding Excluded Unit
FIM Other MedPAR FIM Other
MedPAR FIM Other MedPAR FIM Other
MedPAR
1-100 2 23 30 97 4 24 33 105
101-200 14 9 139 140 14 7 143 126
201-300 14 2 105 102 11 5 123 103
301-400 14 10 59 48 17 9 65 40
401-500 8 8 38 27 12 7 52 29
501-1000 56 16 58 26 59 15 67 18
1001-2000 20 6 6 2 24 3 6 1
2001-3000 1 0 0 0 0 0 0 0
3001-4000 1 0 0 0 1 0 0 0
Total 130 74 435 442 142 70 489 422 1998 1999
1-100 6 19 50 115 3 13 57 100
101-200 14 9 136 125 10 9 148 115
201-300 11 5 130 82 12 5 130 85
301-400 18 2 78 52 15 1 79 63
401-500 17 2 51 28 20 1 66 26
501-1000 80 3 60 24 76 2 62 17
1001-2000 24 3 10 0 33 3 12 1
2001-3000 0 0 0 0 0 0 0 0
3001-4000 1 0 0 0 1 0 0 0
Total 171 43 515 426 170 34 554 407
Table L shows the percentage of cases in FIM
facilities in each State.

483
Table L.--Number and Percentage of MedPAR Rehabilitation Cases For FIM Sample Hospitals, by State
MedPAR Rehabilitation Cases
Percent of Cases in FIM Hospital Sample STATE
1996 1997 1998 1999 1996 1997 1998 1999 AL 7,839 8,654 8,855 8,667 91 96 79 81AK 247 302 280 301 55 51 56 55AR 6,581 6,973 8,349 9,626 43 48 63 65AZ 3,672 4,084 4,436 5,244 62 57 63 67CA 15,294 15,559 15,579 16,936 53 51 56 58CO 4,757 4,263 4,035 3,946 27 65 33 69CT 2,217 2,290 1,901 1,989 69 88 90 89DC 1,097 996 1,076 1,167 12 10 8 20DE 1,399 1,361 1,375 1,628 76 72 70 66FL 23,021 23,630 24,058 24,741 74 79 91 90GA 9,615 10,716 10,874 11,062 64 65 66 68HI 1,087 1,016 831 696 100 100 100 100IA 1,264 1,404 1,324 1,579 100 100 98 100ID 1,829 1,807 1,782 1,903 97 98 97 97IL 14,953 14,894 14,720 16,111 54 62 60 62IN 8,943 8,884 9,301 9,683 60 60 83 86KS 3,224 3,333 3,647 4,074 27 24 64 72KY 5,198 5,201 5,653 6,489 74 79 86 80LA 9,206 10,061 10,292 11,079 36 50 68 67MA 8,765 8,631 8,973 9,582 52 67 77 78MD 867 715 767 782 77 80 80 86ME 1,255 1,460 1,629 1,873 10 72 79 80MI 16,523 17,255 18,157 18,797 82 82 80 81MN 2,048 2,112 2,508 2,594 54 74 49 49MO 9,788 10,513 10,677 11,009 34 42 58 62MS 1,968 2,021 2,050 2,442 86 86 85 83MT 878 766 652 681 100 100 100 100NC 7,123 8,771 9,588 9,912 89 88 97 98ND 1,821 1,636 1,627 1,697 86 83 73 71NE 1,195 1,107 1,143 1,083 92 91 89 88NH 2,310 2,505 2,435 2,375 57 58 77 75NJ 11,234 11,083 11,172 11,988 89 96 93 99NM 1,283 1,277 1,355 1,537 28 35 40 45NV 2,230 2,303 2,855 3,471 0 0 52 51NY 21,431 22,875 25,755 26,271 37 51 58 72OH 11,837 13,888 13,683 13,938 76 73 75 71OK 6,356 6,949 7,757 8,716 51 59 58 54OR 1,179 1,184 1,198 1,173 70 61 74 75PA 36,989 35,700 34,201 35,552 63 69 71 73RI 2,247 2,307 1,771 1,460 61 66 100 100SC 4,536 4,878 5,691 6,182 83 86 83 82SD 2,096 2,101 2,031 2,071 80 81 79 78TN 10,731 11,917 12,317 12,744 71 71 72 76

484
STATE MedPAR Rehabilitation Cases Percent of Cases in
FIM Hospital Sample 1996 1997 1998 1999 1996 1997 1998 1999
TX 33,619 36,616 38,871 40,387 58 62 70 72 UT 858 984 1,044 1,673 43 62 57 65 VA 6,738 7,235 7,544 7,671 73 78 70 73 VT 603 567 582 691 74 73 68 75 WA 3,753 3,608 3,598 3,918 99 99 99 91 WI 6,591 6,690 6,468 6,643 87 93 89 89 WV 3,497 3,574 3,467 3,899 100 99 99 100 WY 334 376 418 315 31 75 23 49
Total 344,126 359,032 370,352 390,048 63 68 73 75
Representativeness of Patient and Stay Characteristics
Table M compares demographic characteristics of all
Medicare rehabilitation patients with the matched FIM
sample. Of all the characteristics examined, the FIM
sample of discharges appears very similar.

485
Table M.--Patient Characteristics for MedPAR Rehabilitation Inpatients, by FIM Status
PATIENT CHARACTERISTIC FIM
OTHER MedPAR
TOTAL MedPAR FIM
OTHER MedPAR
TOTAL MedPAR
1996 1997 Sample Size 171,626 172,500 344,126 206,032 153,000 359,032 Average Age 75.4 75.6 75.5 75.4 75.6 75.5 Age 0-50 2.6% 2.8% 2.7% 2.8% 3.0% 2.8% Age 51-60 3.1% 3.1% 3.1% 3.2% 3.2% 3.2% Age 61-70 20.1% 19.3% 19.7% 19.5% 18.9% 19.2% Age 71-80 44.2% 42.8% 43.5% 43.9% 42.8% 43.4% Age 81-90 26.9% 28.1% 27.5% 27.4% 28.2% 27.7% Age 91+ 3.2% 3.9% 3.5% 3.2% 4.0% 3.6% Male 37.9% 37.3% 37.6% 38.0% 37.6% 37.8% White 86.7% 85.8% 86.3% 86.6% 85.3% 86.1% Black 9.8% 10.6% 10.2% 10.1% 10.9% 10.4% In-hospital death 0.2% 0.6% 0.4% 0.3% 0.7% 0.4%
1998 1999 Sample Size 232,691 137,661 370,352 257,024 133,024 390,048 Average Age 75.5 75.7 75.6 75.8 76.0 75.9 Age 0-50 2.8% 2.9% 2.8% 2.8% 2.8% 2.8% Age 51-60 3.4% 3.5% 3.5% 3.5% 3.5% 3.5% Age 61-70 18.9% 18.4% 18.7% 18.1% 17.8% 18.0% Age 71-80 43.6% 42.1% 43.0% 42.8% 41.5% 42.3% Age 81-90 27.8% 28.8% 28.2% 28.9% 29.9% 29.2% Age 91+ 3.6% 4.2% 3.8% 3.9% 4.5% 4.1% Male 37.9% 37.3% 37.7% 37.6% 37.2% 37.4% White 86.5% 84.8% 85.9% 86.6% 84.8% 86.0% Black 10.1% 10.8% 10.4% 9.8% 10.8% 10.2% In-hospital death 0.3% 0.6% 0.4% 0.3% 0.7% 0.4%
Table N compares resources used for linked FIM stays
with those for other Medicare rehabilitation patients.
Average length of stay for FIM cases is the same as for
non-FIM patients in 1996 and 1997, but is higher for FIM
patients in 1998 and 1999. For cases in freestanding
hospitals, FIM stays consume fewer resources in the first
half of the data period, but not in the second half.
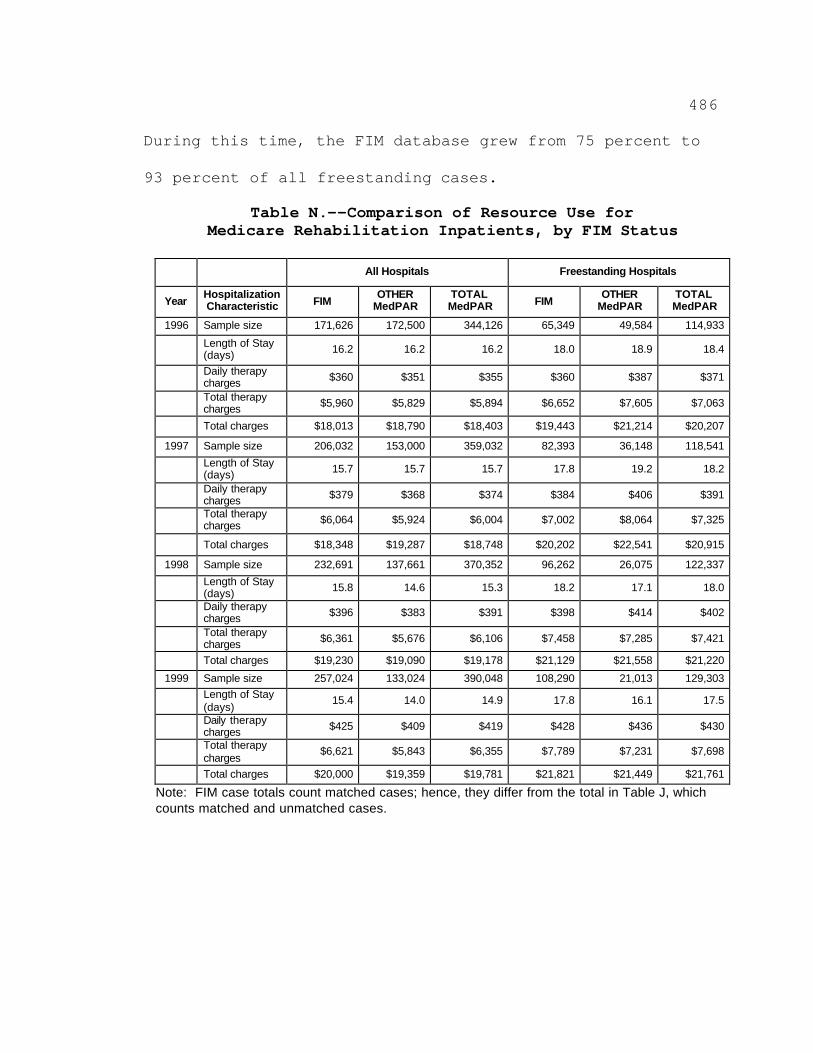
486
During this time, the FIM database grew from 75 percent to
93 percent of all freestanding cases.
Table N.--Comparison of Resource Use for Medicare Rehabilitation Inpatients, by FIM Status
All Hospitals Freestanding Hospitals
Year Hospitalization Characteristic FIM
OTHER MedPAR
TOTAL MedPAR FIM
OTHER MedPAR
TOTAL MedPAR
1996 Sample size 171,626 172,500 344,126 65,349 49,584 114,933
Length of Stay (days) 16.2 16.2 16.2 18.0 18.9 18.4
Daily therapy charges $360 $351 $355 $360 $387 $371
Total therapy charges $5,960 $5,829 $5,894 $6,652 $7,605 $7,063
Total charges $18,013 $18,790 $18,403 $19,443 $21,214 $20,207
1997 Sample size 206,032 153,000 359,032 82,393 36,148 118,541
Length of Stay (days) 15.7 15.7 15.7 17.8 19.2 18.2
Daily therapy charges $379 $368 $374 $384 $406 $391
Total therapy charges $6,064 $5,924 $6,004 $7,002 $8,064 $7,325
Total charges $18,348 $19,287 $18,748 $20,202 $22,541 $20,915
1998 Sample size 232,691 137,661 370,352 96,262 26,075 122,337
Length of Stay (days) 15.8 14.6 15.3 18.2 17.1 18.0
Daily therapy charges $396 $383 $391 $398 $414 $402
Total therapy charges $6,361 $5,676 $6,106 $7,458 $7,285 $7,421
Total charges $19,230 $19,090 $19,178 $21,129 $21,558 $21,220
1999 Sample size 257,024 133,024 390,048 108,290 21,013 129,303 Length of Stay (days)
15.4 14.0 14.9 17.8 16.1 17.5
Daily therapy charges $425 $409 $419 $428 $436 $430
Total therapy charges
$6,621 $5,843 $6,355 $7,789 $7,231 $7,698
Total charges $20,000 $19,359 $19,781 $21,821 $21,449 $21,761
Note: FIM case totals count matched cases; hence, they differ from the total in Table J, which counts matched and unmatched cases.
Recommended