University of Wollongong University of Wollongong
Research Online Research Online
Australian Institute for Innovative Materials - Papers Australian Institute for Innovative Materials
1-1-2014
Liquid ink deposition from an atomic force microscope tip: deposition Liquid ink deposition from an atomic force microscope tip: deposition
monitoring and control of feature size monitoring and control of feature size
Cathal D. O'Connell University of Wollongong, [email protected]
Michael J. Higgins University of Wollongong, [email protected]
David Marusic Univeristy of Wollongong
Simon E. Moulton University of Wollongong, [email protected]
Gordon G. Wallace University of Wollongong, [email protected]
Follow this and additional works at: https://ro.uow.edu.au/aiimpapers
Part of the Engineering Commons, and the Physical Sciences and Mathematics Commons
Recommended Citation Recommended Citation O'Connell, Cathal D.; Higgins, Michael J.; Marusic, David; Moulton, Simon E.; and Wallace, Gordon G., "Liquid ink deposition from an atomic force microscope tip: deposition monitoring and control of feature size" (2014). Australian Institute for Innovative Materials - Papers. 1037. https://ro.uow.edu.au/aiimpapers/1037
Research Online is the open access institutional repository for the University of Wollongong. For further information contact the UOW Library: [email protected]
Liquid ink deposition from an atomic force microscope tip: deposition monitoring Liquid ink deposition from an atomic force microscope tip: deposition monitoring and control of feature size and control of feature size
Abstract Abstract The controlled deposition of attoliter volumes of liquid inks may engender novel applications such as targeted drug delivery to single cells and localized delivery of chemical reagents at nanoscale dimensions. Although the deposition of small organic molecules from an atomic force microscope tip, known as dip-pen nanolithography (DPN), has been extensively studied, the deposition of liquid inks is little understood. In this work, we have used a set of model ink-substrate systems to develop an understanding of the deposition of viscous liquids using an unmodified AFM tip. First, the growth of dot size with increasing dwell time is characterized. The dynamics of deposition are found to vary for different ink-substrate systems, and the change in deposition rate over the course of an experiment limits our ability to quantify the ink-transfer dynamics in terms of liquid properties and substrate wettability. We find that the most critical parameter affecting the deposition rate is the volume of ink on the cantilever, an effect resulting in a 10-fold decrease in deposition rate (aL/s) over 2 h of printing time. We suggest that a driving force for deposition arises from the gradient in Laplace pressure set up when the tip touches the substrate. Second, the forces acting upon the AFM cantilever during ink deposition were measured in order to gain insight into the underlying ink-transfer mechanism. The force curve data and simple geometrical arguments were used to elucidate the shape of the ink meniscus at the instant of deposition, a methodology that may be used as an accurate and real-time means of monitoring the volume of deposited dots. Taken together, our results illustrate that liquid deposition involves a very different transfer mechanism than traditionally ascribed to DPN molecular transport.
Keywords Keywords ink, deposition, atomic, force, microscope, tip, monitoring, control, liquid, feature, size
Disciplines Disciplines Engineering | Physical Sciences and Mathematics
Publication Details Publication Details O'Connell, C. D., Higgins, M. J., Marusic, D., Moulton, S. E. & Wallace, G. G. (2014). Liquid ink deposition from an atomic force microscope tip: deposition monitoring and control of feature size. Langmuir: the ACS journal of surfaces and colloids, 30 (10), 2712-2721.
This journal article is available at Research Online: https://ro.uow.edu.au/aiimpapers/1037
1
Liquid ink deposition from an atomic force
microscope tip: deposition monitoring and control of
feature size
Cathal D. O’Connell, Michael J. Higgins, David Marusic, Simon E. Moulton, Gordon G.
Wallace*
ARC Centre of Excellence for Electromaterials Science, Intelligent Polymer Research Institute,
AIIM Facility, Innovation Campus, University of Wollongong, Wollongong, NSW 2522,
Australia
2
ABSTRACT.
The controlled deposition of attolitre volumes of liquid inks may engender novel applications
such as targeted drug delivery to single cells and localized delivery of chemical reagents at
nanoscale dimensions. Although the deposition of small organic molecules from an atomic force
microscope tip, known as dip-pen nanolithography (DPN), has been extensively studied, the
deposition of liquid inks is little understood. In this work we have used a set of model ink-
substrate systems to develop an understanding of the deposition of viscous liquids using an
unmodified AFM tip. Firstly, the growth of dot-size with increasing dwell-time is characterized.
The dynamics of deposition are found vary for different ink-substrate systems and the change in
deposition rate over the course of an experiment limits our ability to quantify the ink-transfer
dynamics in terms of liquid properties and substrate wettability. We find that the most critical
parameter affecting deposition rate is the volume of ink on the cantilever, an effect resulting in a
ten-fold decrease in deposition rate (aL/s) over two hours printing time. We suggest that a
driving force for deposition arises from the gradient in Laplace pressure set up when the tip
touches the substrate. Secondly, the forces acting upon the AFM cantilever during ink deposition
were measured in order to gain insight into the underlying ink-transfer mechanism. The force
curve data and simple geometrical arguments were used to elucidate the shape of the ink
meniscus at the instant of deposition, a methodology which may be used as an accurate and real-
time means of monitoring the volume of deposited dots. Taken together, our results illustrate that
liquid deposition involves a very different transfer mechanism than traditionally ascribed to DPN
molecular transport.
3
1. INTRODUCTION
Dip-pen nanolithography (DPN) is a nanofabrication technique which uses an atomic force
microscope (AFM) tip to direct-write functional materials at sub 50 nm resolution.1 The
deposition of alkanethiol molecules onto a gold substrate by DPN has been studied extensively
over the past decade.2–11
In molecular ink DPN, control of feature-size, and therefore pattern
fidelity, arises from an empirical understanding of the rate of deposition over a range of ‘dwell
times’ for dot printing or ‘write-speeds’ for line writing.2,3
Deposition rate is influenced by a
multitude of critical parameters including ink loading,4 tip sharpness,
5 relative humidity,
3
temperature,6 surface roughness,
7 molecular diffusivity and dissolution kinetics
8 and others. The
mechanism of molecular transport has been given a theoretical framework9 and progress in
refining the technique has become a lively conversation involving the interplay of experiment,4
theory,8,12
and numerical simulation.7,10,11
Recently, the DPN technique has been applied to the
deposition of liquid inks.13–19
Liquid inks are attractive due to their versatility in depositing on
various materials.17,20
They can also be used to generate 3D structures not achievable by
molecular inks, such as spherical cap lenses for sub-wavelength optical lithography18
or for the
molded fabrication of stamps.19
Liquid inks have also been exploited as universal ‘ink-carriers’
for functional materials or biological molecules15
and hydrogels loaded with proteins have been
patterned for a novel drug-delivery approach targeting single cells.21
Confidence in any
fabrication technique is built upon its ability to faithfully reproduce the user’s design. The
stringent control of feature size, however, is challenging in AFM deposition of liquid inks. For
example, it is necessary to ‘bleed’ the pen of excess ink before reproducible deposition is
obtained.13,14,17
Even after bleeding, the coefficient of variation in dot diameter is often quoted at
4
between 10-15%.22,23
A 10% variation in diameter would correspond to a 21% variation in
feature area, and a 33% variation in feature volume (from spherical cap geometry).
The explanation for such printing inconsistency is made difficult because, as opposed to
molecular ink DPN, a solid framework of understanding does not presently exist for deposition
of liquid inks from an AFM tip. In particular, although the driving force for deposition has been
described as arising from ‘physioadsorption’ or ‘capillarity’,13,14
this mechanism has not been
quantitatively treated. The relative effects of ink properties such as viscosity and surface tension
are also poorly understood. A model describing the rate of flow of ink onto the substrate (dwell-
time dependence) has not been presented. When discussing liquid ink deposition, the language
(‘diffusion coefficient’) and the analysis procedures for molecular ink DPN are sometimes used,
despite the patently different morphologies of resulting features (i.e. spherical caps as opposed to
two-dimensional circles).15,16
Although explicit studies of liquid deposition from an unmodified AFM tip are lacking, some
groups have studied the related system of liquid deposition from a nano-fountain probe (or liquid
nanodispenser).24–31
A nano-fountain probe is an AFM tip with a nanofluidic channel (typically
with diameter <100 nm) emerging at the tip apex and through which liquid can be dispensed.
The key parameters in nano-fountain probe deposition were found to be the aperture diameter as
well as tip and substrate hydrophobicity.24,26,27
Despite some promising demonstrations of
attolitre volume dispensing, this technique has not been widely adopted, possibly due to issues
with blockage of the nano-channels. Other groups have also studied the capillary forces between
an AFM tip coated in liquid and a surface.32,33
This system is highly pertinent to many fields as
the nanoscale tip provides a ‘model asperity’ for studying the fundamental origins of adhesion,
wear and lubrication.34,35
5
In this article we use model ink-substrate systems (exhibiting differing viscosities and
wettabilities) to gain understanding of the ink transfer process in AFM deposition of liquid inks.
This work provides new insight in two main areas: (1) By studying the dwell-time/dot-size
relationship of various ink-substrate systems we find that, although dots with volume ranging 5
orders of magnitude (0.1-5000 aL) can be deposited, the deposition rate decreases dramatically
over the course of an experiment. We find that the volume of ink on the pen is the dominant
factor affecting deposition rate. This has the practical consequence that the size of printed
droplets cannot be predefined using dwell time. (2) One way to circumvent this change in
deposition rate, may be to monitor deposition in situ and calibrate on the fly. By measuring the
forces on the AFM cantilever during ink deposition we elucidate the shape of the meniscus at the
instant of deposition. We illustrate that this method can be used to monitor the size of invididual
droplets in real time.
2. EXPERIMENTAL SECTION
Materials. Octadecyltrimethoxysilane was obtained from Sigma Aldrich. Norland Optical
Adhesives are highly viscous, UV curable, acrylic based liquid adhesives. The formulations
NOA 68 and NOA 68T were obtained from Norland Products (Cranbury NJ, USA). A summary
of the composition of each adhesive is included in Table 1.
6
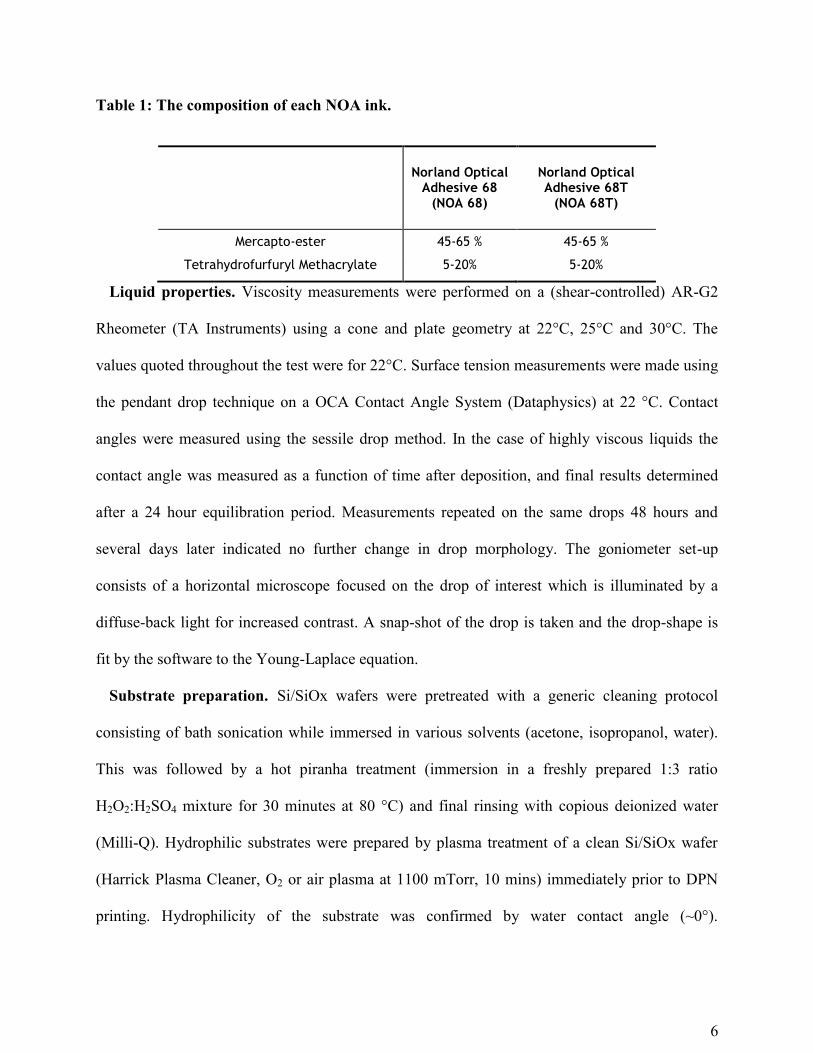
Table 1: The composition of each NOA ink.
Norland Optical Adhesive 68
(NOA 68)
Norland Optical Adhesive 68T
(NOA 68T)
Mercapto-ester 45-65 % 45-65 %
Tetrahydrofurfuryl Methacrylate 5-20% 5-20%
Liquid properties. Viscosity measurements were performed on a (shear-controlled) AR-G2
Rheometer (TA Instruments) using a cone and plate geometry at 22°C, 25°C and 30°C. The
values quoted throughout the test were for 22°C. Surface tension measurements were made using
the pendant drop technique on a OCA Contact Angle System (Dataphysics) at 22 °C. Contact
angles were measured using the sessile drop method. In the case of highly viscous liquids the
contact angle was measured as a function of time after deposition, and final results determined
after a 24 hour equilibration period. Measurements repeated on the same drops 48 hours and
several days later indicated no further change in drop morphology. The goniometer set-up
consists of a horizontal microscope focused on the drop of interest which is illuminated by a
diffuse-back light for increased contrast. A snap-shot of the drop is taken and the drop-shape is
fit by the software to the Young-Laplace equation.
Substrate preparation. Si/SiOx wafers were pretreated with a generic cleaning protocol
consisting of bath sonication while immersed in various solvents (acetone, isopropanol, water).
This was followed by a hot piranha treatment (immersion in a freshly prepared 1:3 ratio
H2O2:H2SO4 mixture for 30 minutes at 80 °C) and final rinsing with copious deionized water
(Milli-Q). Hydrophilic substrates were prepared by plasma treatment of a clean Si/SiOx wafer
(Harrick Plasma Cleaner, O2 or air plasma at 1100 mTorr, 10 mins) immediately prior to DPN
printing. Hydrophilicity of the substrate was confirmed by water contact angle (~0°).
7
Hydrophobic substrates were prepared by functionalization of the Si/SiOx substrate with
octadecyltrimethoxysilane (ODTMS). Briefly; after pretreatment the substrates were plasma
treated (as above), then immersed in a freshly prepared solution of 0.1% ODTMS in isopropanol
for 5 minutes, before a further 5 minutes on a hotplate (80 °C) for 5 minutes. The substrates
were dipped in the 0.1% ODTMS/isopropanol solution and placed on the hotplate (80°C, 5
minutes) a further three times to ensure consistent levels of silanization. Hydrophobicity of the
substrate was confirmed by water contact angle (~88°). This degree of hydrophobicity was
maintained for several weeks as confirmed by repeated water contact angle measurements.
AFM deposition protocol. AFM deposition experiments were performed using an Nscriptor
system (NanoInk, Skokie, IL) in an environment controlled at 45% relative humidity and 22°C
temperature. The NOA ink of interest was wetted onto a single probe on an array of NanoInk M-
Type probes (NanoInk part # PEN-0300-03, material Si3N4, length 107 µm, width 22 µm, spring
constant 0.5 N/m) by dipping into the filled microwell of a NanoInk Universal Inkwell (part #
IWL‐0009‐03). The tip was bled of excess ink in a method similar to that previously reported for
AFM deposition of liquid inks by bringing it in contact with the substrate in several (typically 4-
5) locations, until deposition of large ~10 µm ‘bleed-spots’ ceased.14,36
Patterns were generated
using the InkCAD software (v 2.7.1) provided with the Nscriptor system.
AFM measurements. AFM force curve measurements were performed in air on an Asylum
MFP-3D system (Asylum Research, Santa Barbara, CA). Resonance frequencies of all
cantilevers were measured using the thermal noise method. The stiffness and sensitivity of each
cantilever was measured prior to dipping in ink. Force maps were processed using Asylum
Research software (based in the Igor-Pro environment, Wavemetrics). The raw data of cantilever
deflection voltage versus z-piezo extension was converted to force vs tip-sample separation using
8
the measured stiffness and sensitivity of the cantilever. In addition to block-processed force maps
to calculated maximum adhesion, force curve analysis was performed manually for each force
curve to extract extension length data. Topographical images were generated on the Asylum
MFP-3D instrument in intermittent contact mode. Morphologies of the printed features were
analyzed using the Particle Size plug-in for the Asylum Research software.
3. RESULTS AND DISCUSSION
3.1 Liquid properties
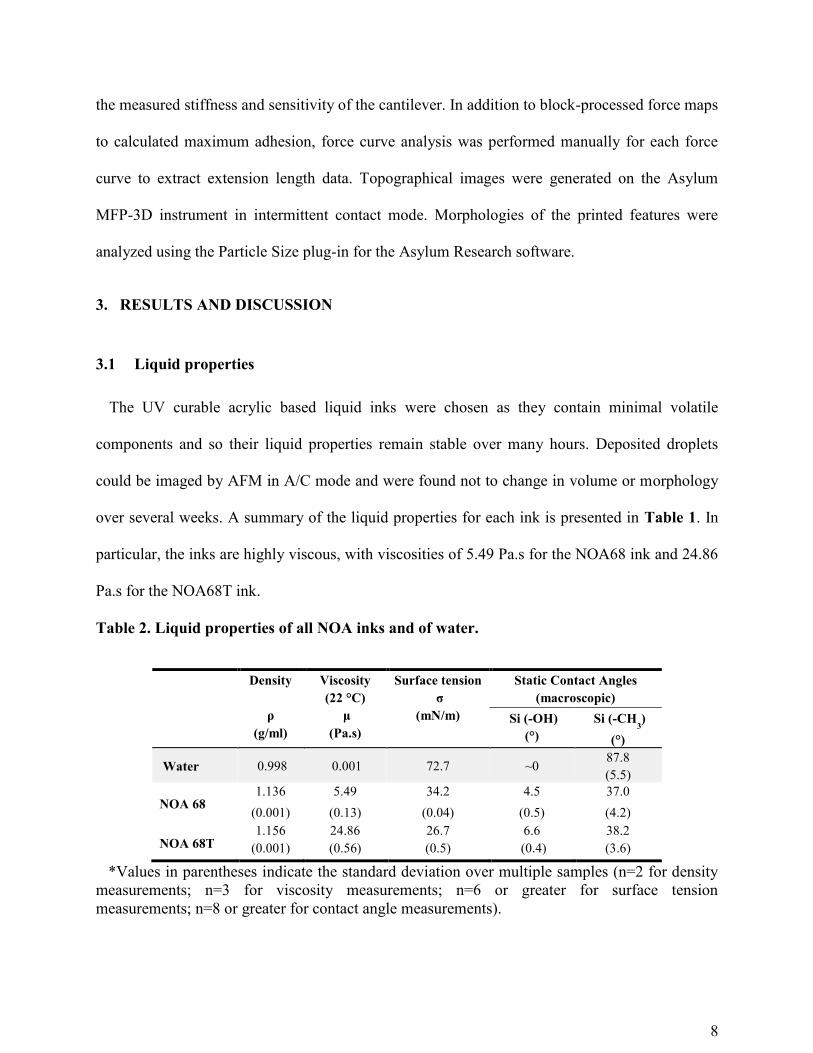
The UV curable acrylic based liquid inks were chosen as they contain minimal volatile
components and so their liquid properties remain stable over many hours. Deposited droplets
could be imaged by AFM in A/C mode and were found not to change in volume or morphology
over several weeks. A summary of the liquid properties for each ink is presented in Table 1. In
particular, the inks are highly viscous, with viscosities of 5.49 Pa.s for the NOA68 ink and 24.86
Pa.s for the NOA68T ink.
Table 2. Liquid properties of all NOA inks and of water.
Density
ρ
(g/ml)
Viscosity
(22 °C)
μ
(Pa.s)
Surface tension
σ
(mN/m)
Static Contact Angles
(macroscopic)
Si (-OH)
(°)
Si (-CH3)
(°)
Water 0.998 0.001 72.7 ~0 87.8 (5.5)
NOA 68 1.136
(0.001) 5.49
(0.13) 34.2
(0.04) 4.5
(0.5) 37.0 (4.2)
NOA 68T 1.156
(0.001) 24.86
(0.56) 26.7
(0.5) 6.6
(0.4) 38.2
(3.6) *Values in parentheses indicate the standard deviation over multiple samples (n=2 for density
measurements; n=3 for viscosity measurements; n=6 or greater for surface tension
measurements; n=8 or greater for contact angle measurements).
9
3.2 Dwell time dependence
The growth of feature-size with dwell-time is a critical parameter in DPN of molecules as it
enables feature generation from sub 50 nm up to ~10 µm length scale. Investigations of the
‘transport rate’ relationship have been the basis for many studies into molecular ink transfer
mechanisms.3,4,37,38
However, dedicated studies using liquid inks are lacking.
We have systematically investigated the dwell time dependence of dot-size for each NOA ink
on both hydrophilic (plasma cleaned) and hydrophobic (ODTMS functionalised) silicon
substrates. Varying deposition dynamics were observed for different ink-substrate systems.
However, we found that the factor affecting transport rate most dramatically is not any intrinsic
liquid or interfacial property; rather, it is the volume of ink on the cantilever at the time of
printing.
3.2.1 Growth of dot radius with dwell time
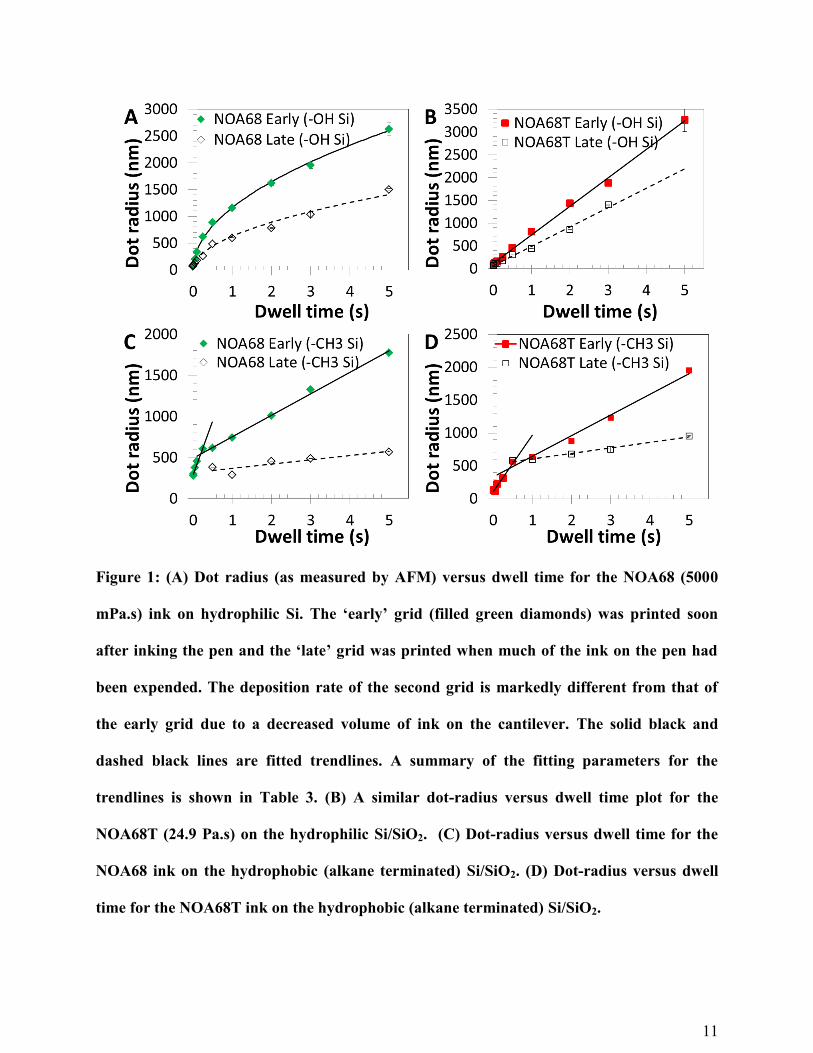
Figure 1 shows the dependence of dot-radius on dwell time for each ink-substrate system.
Figure 1A and 1B show dot radius (as measured by AFM) plotted against dwell time for the
NOA68 (5.5 Pa.s) ink and the NOA68T (24.9 Pa.s) ink on hydrophilic Si/SiO2 respectively.
Figure 1C and 1D show dot radius plotted against dwell time for the NOA68 ink and the
NOA68T ink on hydrophobic (alkane functionalised) Si/SiO2 respectively. In each plot, data
from two calibration-grids are shown, both obtained during the same experiment, under the same
environmental conditions, by the same pen. The ‘early’ grids were printed soon after inking the
pen and the ‘late’ grids were printed after two hours printing time, when much of the ink on the
pen had been expended.
Different ink-substrate systems followed different deposition dynamics. The NOA68 ink
exhibited a power-law (r~t1/2
) dependence of dot radius on dwell time (Figure 1 A). A similar t1/2
10
dependence is often observed in microfluidics, for example in the Lucas-Washburn equation for
filling of micro-channels. In the case of microfluidic channels, the x~t1/2
filling rate arises from a
situation of constant filling pressure acting over an increasing channel length (therefore
increasing hydraulic resistance).39,40
However, the r~t1/2
behavior was not general. The NOA68T
ink on the shows a linear (r~t) growth of radius with dwell time on the hydrophilic substrate
(Figure 1 B). On the hydrophobic substrate, both the NOA68 and the NOA68T inks exhibit two
step deposition kinetics where feature radius at short dwell times (0.02-0.25s) grows faster than
at longer dwell times (0.5-5s) (Figure 1 C and D). This two-step dynamics may arise from
capillary induced spreading at short dwell times (nanoscale features), which is then limited by
the rate of flow down the tip at longer dwell times.
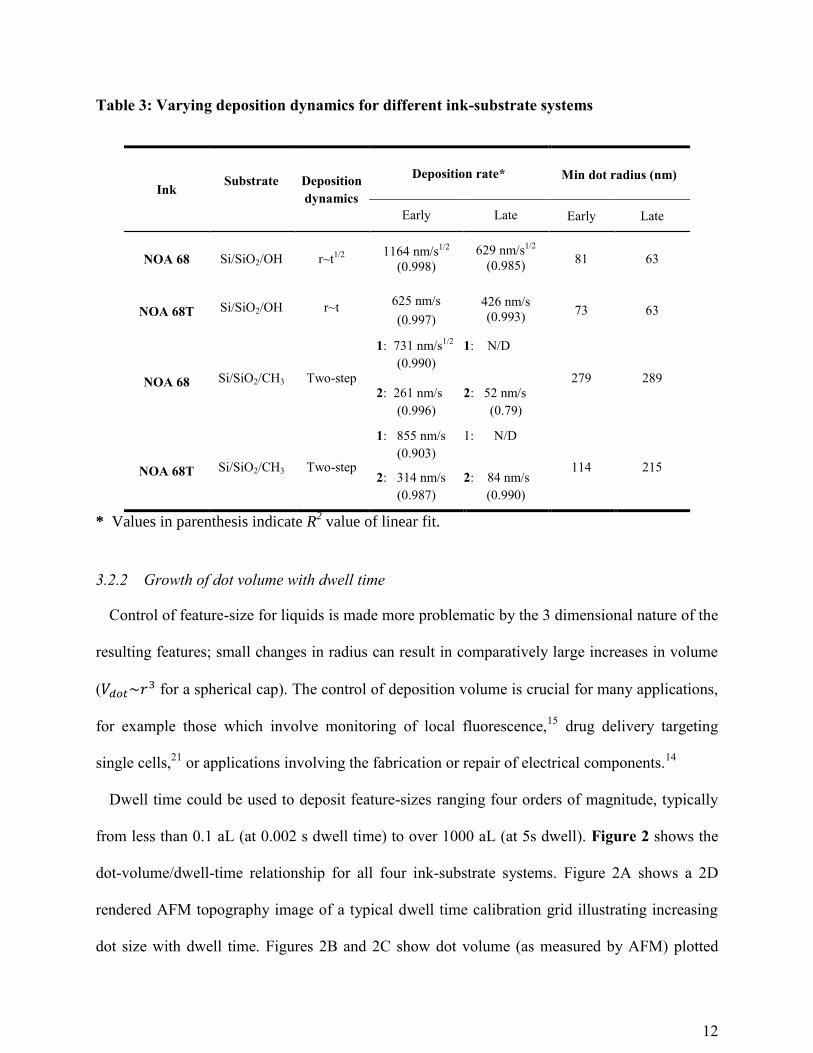
The varying deposition kinetics highlights the difficulty in using empirical dwell time
relationships to control feature size. Though we do not attempt rigorous explanations of the
differing deposition mechanisms, a summary of the observed dwell-time behavior, as well as the
deposition rates (obtained from fitted trendlines) is provided in Table 3.
In all systems, we observed a significant decrease in the rate of deposition for the late grid,
compared with the early grid. This suggests a general influence of the volume of ink on the
cantilever on the deposition rate. This aspect is discussed in detail in Section 3.2.2 below.
11
Figure 1: (A) Dot radius (as measured by AFM) versus dwell time for the NOA68 (5000
mPa.s) ink on hydrophilic Si. The ‘early’ grid (filled green diamonds) was printed soon
after inking the pen and the ‘late’ grid was printed when much of the ink on the pen had
been expended. The deposition rate of the second grid is markedly different from that of
the early grid due to a decreased volume of ink on the cantilever. The solid black and
dashed black lines are fitted trendlines. A summary of the fitting parameters for the
trendlines is shown in Table 3. (B) A similar dot-radius versus dwell time plot for the
NOA68T (24.9 Pa.s) on the hydrophilic Si/SiO2. (C) Dot-radius versus dwell time for the
NOA68 ink on the hydrophobic (alkane terminated) Si/SiO2. (D) Dot-radius versus dwell
time for the NOA68T ink on the hydrophobic (alkane terminated) Si/SiO2.
12
Table 3: Varying deposition dynamics for different ink-substrate systems
Ink Substrate
Deposition
dynamics
Deposition rate* Min dot radius (nm)
Early Late Early Late
NOA 68 Si/SiO2/OH r~t1/2
1164 nm/s
1/2
(0.998)
629 nm/s1/2
(0.985) 81 63
NOA 68T Si/SiO2/OH r~t 625 nm/s
(0.997)
426 nm/s
(0.993) 73 63
NOA 68 Si/SiO2/CH3 Two-step
1: 731 nm/s1/2
(0.990)
1: N/D
279 289
2: 261 nm/s
(0.996)
2: 52 nm/s
(0.79)
NOA 68T Si/SiO2/CH3 Two-step
1: 855 nm/s
(0.903)
1: N/D
114 215
2: 314 nm/s
(0.987)
2: 84 nm/s
(0.990)
* Values in parenthesis indicate R2 value of linear fit.
3.2.2 Growth of dot volume with dwell time
Control of feature-size for liquids is made more problematic by the 3 dimensional nature of the
resulting features; small changes in radius can result in comparatively large increases in volume
( for a spherical cap). The control of deposition volume is crucial for many applications,
for example those which involve monitoring of local fluorescence,15
drug delivery targeting
single cells,21
or applications involving the fabrication or repair of electrical components.14
Dwell time could be used to deposit feature-sizes ranging four orders of magnitude, typically
from less than 0.1 aL (at 0.002 s dwell time) to over 1000 aL (at 5s dwell). Figure 2 shows the
dot-volume/dwell-time relationship for all four ink-substrate systems. Figure 2A shows a 2D
rendered AFM topography image of a typical dwell time calibration grid illustrating increasing
dot size with dwell time. Figures 2B and 2C show dot volume (as measured by AFM) plotted
13
against dwell time for the NOA68 (5.5 Pa.s) ink and the NOA68T (24.9 Pa.s) ink on hydrophilic
Si/SiO2 respectively. Figures 2D and 2E show dot volume plotted against dwell time for the
NOA68 ink and the NOA68T ink on hydrophobic (alkane functionalised) Si/SiO2 respectively.
Figures 2F-H show optical micrographs of an M-type probe prior to inking (figure 2F), just after
filling with ink (figure 1G), and the same probe after printing for 2 hours and much of the ink has
been depleted (figure 1H).
Over the course of an experiment, there is a dramatic decrease in deposition rate for each ink
on both the hydrophilic and hydrophobic substrates. Considering first Figure 2B. Data for two
grids are shown, both printed during the same experiment, under the same environmental
conditions, by the same pen. The ‘early’ grid (filled green diamonds with solid line) was printed
soon after inking the pen and the ‘late’ grid (open black diamonds with dashed line) was printed
when much of the ink on the pen had been expended. For identical dwell times, the early grid
clearly deposits much larger features than the late grid. For example, at a dwell time of 5s the
early grid yields an average dot volume of 1700 aL, whereas the late grid yields a dot volume of
180 aL. A similar order of magnitude difference in feature size between early and late grids is
observed for all dwell times. The inset is a magnified view of the shortest dwell time features,
illustrating the generality of the divergence. Similar behaviour is observed for the NOA68T (24.9
Pa.s) ink on the hydrophilic substrate (Figure 2 C). Despite the varying deposition rates
displayed for early and late grids, it is interesting to note that the minimum feature sizes remain
similar in each case.
On the hydrophobic substrate, the deposition rates for late grids are again much decreased for
both inks. For the NOA68 ink (Figure 2 D), at a dwell time of 5s the early grid yields an average
dot volume of 3200 aL, whereas the late grid yields a dot volume of 64 aL. As shown in the
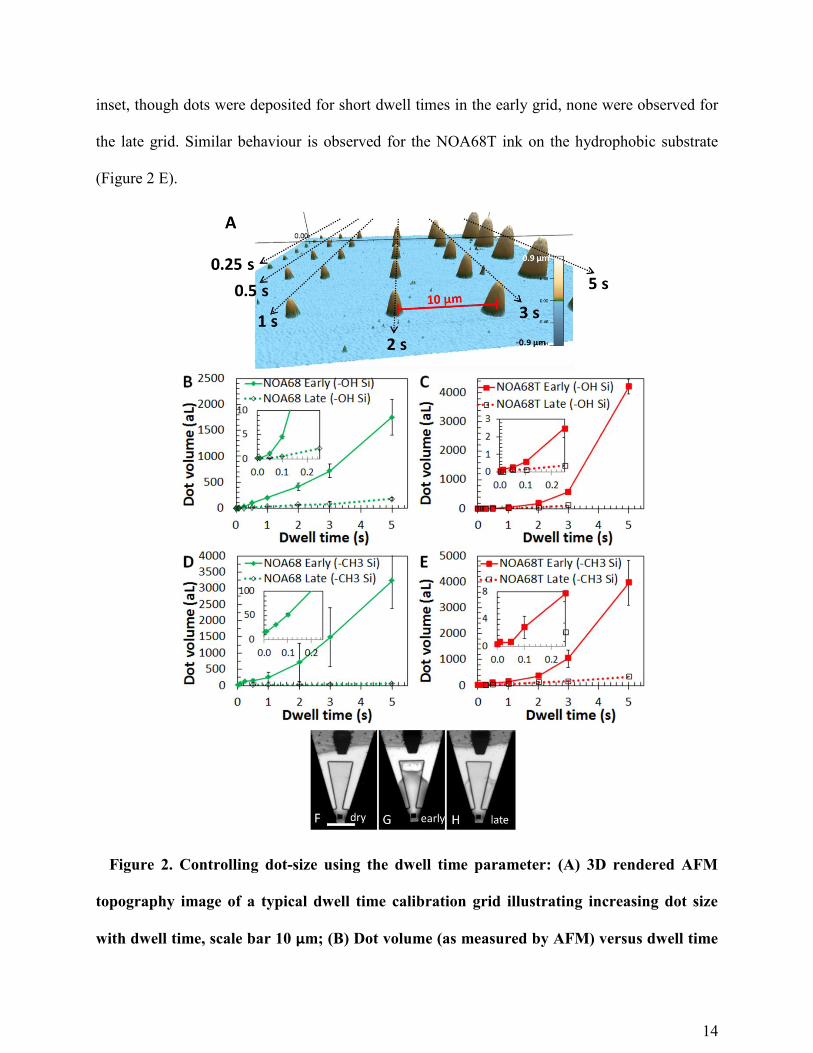
14
inset, though dots were deposited for short dwell times in the early grid, none were observed for
the late grid. Similar behaviour is observed for the NOA68T ink on the hydrophobic substrate
(Figure 2 E).
Figure 2. Controlling dot-size using the dwell time parameter: (A) 3D rendered AFM
topography image of a typical dwell time calibration grid illustrating increasing dot size
with dwell time, scale bar 10 µm; (B) Dot volume (as measured by AFM) versus dwell time
15
for the NOA68 (5000 mPa.s) ink on hydrophilic Si/SiO2. The inset is a magnified view of
the shortest dwell time features. (C) A similar dot-volume versus dwell time plot for the
NOA68T (24.9 Pa.s) on the hydrophilic Si/SiO2. (D) Dot-volume versus dwell time for the
NOA68 ink on the hydrophobic (alkane terminated) Si/SiO2. (E) Dot-volume versus dwell
time for the NOA68T ink on the hydrophobic (alkane terminated) Si/SiO2. (F) Optical
micrograph of a dry M-type probe (as used in this study) prior to inking, scale bar 10 µm.
(G) Optical micrograph of an M-type probe just after filling with NOA68T ink. The
deposition rate of this filled pen corresponds with the ‘early grid above. (H) Optical
micrograph of the same probe after printing for 2 hours and much of the ink has been
depleted.
We suggest that this change in deposition rate may arise due to a decreased Laplace pressure
gradient, arising due to the depletion of ink volume on the cantilever. According to the Young-
Laplace equation, the constricting force of surface tension on a droplet-air interface results in an
increased pressure inside a liquid droplet relative to outside. In general, the pressure difference
(ΔPLap, known as the Laplace pressure or overpressure) is a product of the liquid surface tension
(γ) and the mean curvature of the interface (κ):
(1)
The mean curvature is given by
, where R1 and R2 are the principal radii of
curvature of the interface. For spherical droplets R1=R2=R. For menisci, we designate R1 as
positive and R2 as negative. Thus:
(2)
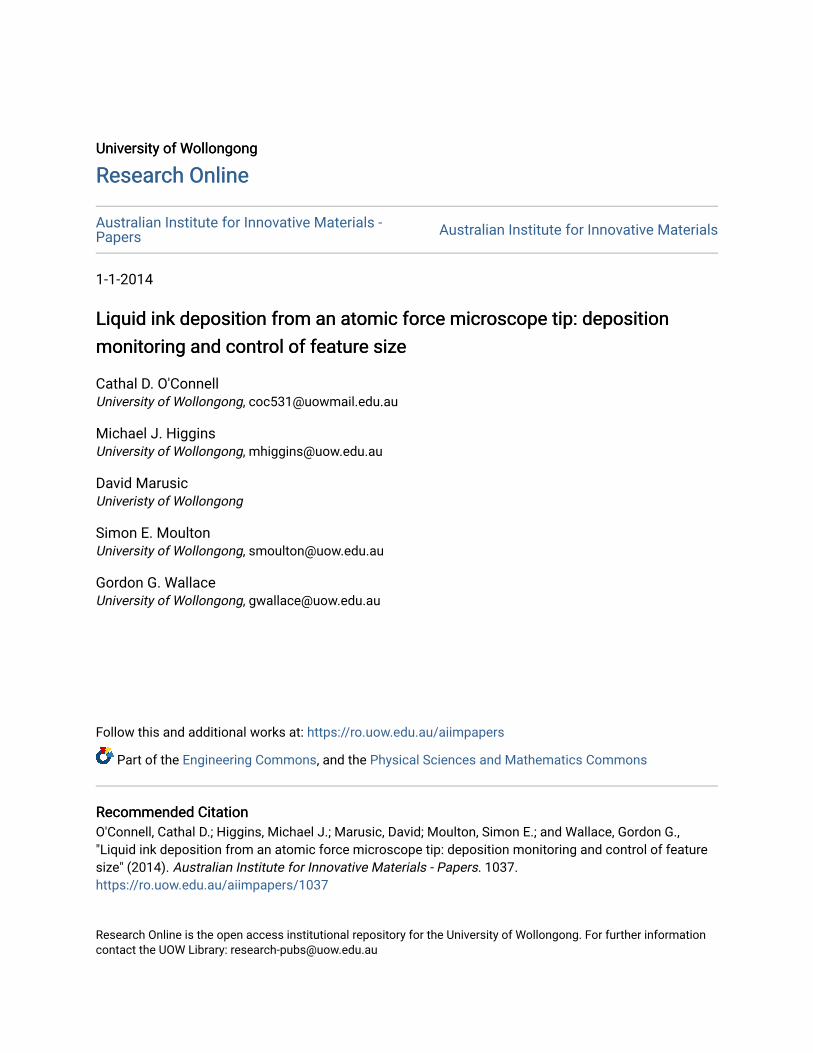
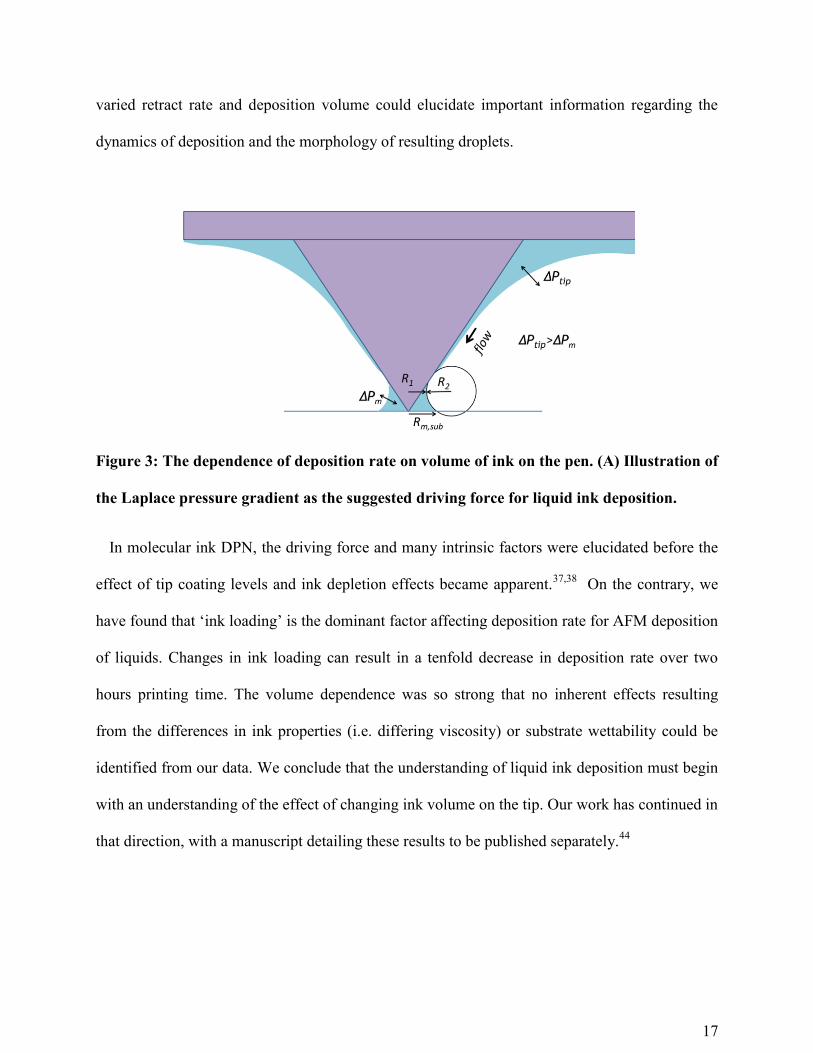
In the concave shape of a meniscus, one of the radii of curvature (R2) is negative (Figure 3
(A)Error! Reference source not found.). Thus, when the magnitude of R1 is greater than the
16
magnitude of R2, the Laplace pressure will also be negative. Such negative pressures have been
measured for nano-scale menisci formed by capillary condensation between an AFM tip and
substrate, with the magnitude of the pressure being up to 140MPa.41
In Figure 3 we consider a liquid meniscus of micron scale where the sharpness of the tip is
negligible. Due to the inclination angle of the tip pyramid (αtip~45°), R1~R2 and the Laplace
pressure in the meniscus is approximately zero (ΔPm~0). The Laplace pressure in the ink at the
base of the tip is positive (ΔPtip>0), a situation maintained because the base of the pyramid meets
the cantilever at 135°, causing R1<R2. Thus, when an AFM tip touches the substrate, a pressure
gradient is set up from the top to the bottom of the tip according to the difference in Laplace
pressure. According to Pascal’s law the liquid must flow from the higher to the lower pressure
region.42
If the Laplace pressure in the tip reservoir (ΔPtip) is proportional to the volume of ink, then this
driving pressure will decrease during an experiment as ink is depleted. Although we have not
done so in this work, one method to quantify the Laplace pressure for a given volume in this
geometry may be to use a simulation method based on energy minimization, such as the Surface
Evolver software.43
In this analysis, tip geometry is a crucial factor. Deposition should be more
difficult to achieve with high aspect ratio tips, and easier to achieve with lower aspect ratio tips.
An investigation of how deposition rate depends on the inclination angle, αtip, could shed light on
the degree to which Laplace pressure is driving deposition.
The apparent increase in viscosity in cases of nanoscale confinement may also affect
deposition, especially as the thickness of flow, along the tip and in the spreading meniscus, may
concerns films of <10 nm thickness.47
The retraction rate of the tip is likely also an important
parameter. Though we have only used one retract rate in this work, a study which systematically
17
varied retract rate and deposition volume could elucidate important information regarding the
dynamics of deposition and the morphology of resulting droplets.
Figure 3: The dependence of deposition rate on volume of ink on the pen. (A) Illustration of
the Laplace pressure gradient as the suggested driving force for liquid ink deposition.
In molecular ink DPN, the driving force and many intrinsic factors were elucidated before the
effect of tip coating levels and ink depletion effects became apparent.37,38
On the contrary, we
have found that ‘ink loading’ is the dominant factor affecting deposition rate for AFM deposition
of liquids. Changes in ink loading can result in a tenfold decrease in deposition rate over two
hours printing time. The volume dependence was so strong that no inherent effects resulting
from the differences in ink properties (i.e. differing viscosity) or substrate wettability could be
identified from our data. We conclude that the understanding of liquid ink deposition must begin
with an understanding of the effect of changing ink volume on the tip. Our work has continued in
that direction, with a manuscript detailing these results to be published separately.44
18
As deposition rate changes significantly during a print run, the empirical control of dwell time
may not be the most useful means to control feature size. There arises a need to monitor, in situ,
the size of each deposited feature. This will be further examined in the next section.
3.3 Deposition monitoring using AFM force curves
AFM force measurements have been used for two decades to model the formation of liquid
meniscii at nanoscale apertures.34
For example, the adhesion force between a tip and substrate
can be used to monitor the capillary condensation of a water meniscus at various relative
humidities.45
More recently, AFM force measurements have been used to gain insight into the
mechanism of liquid deposition from a nano-fountain pen.27
Besides the direct information
acquired about the underlying ink-transfer mechanism, the force curves being generated may
allow for a direct method to monitor feature size in-situ and in real time (without time-
consuming AFM imaging). Such a capability, besides being useful and time-saving in an ink-
development project, would also prove invaluable during a potential device manufacture; it
would provide a means to instantaneous error detection (and correction).
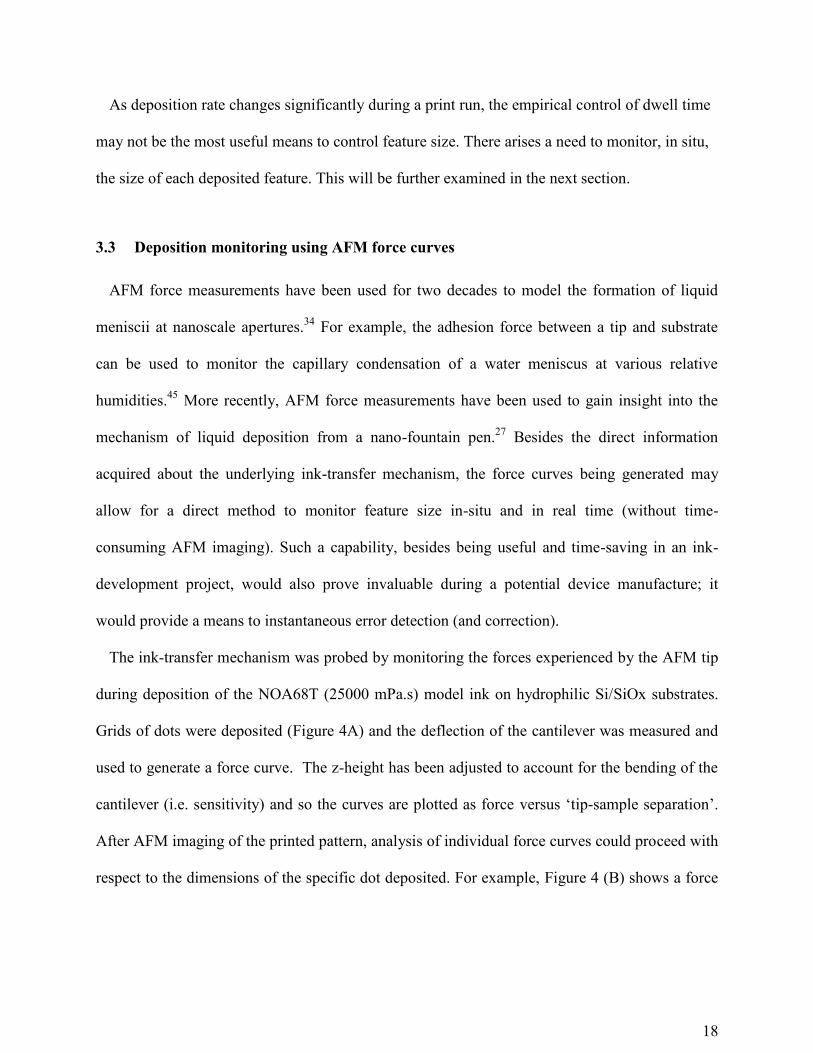
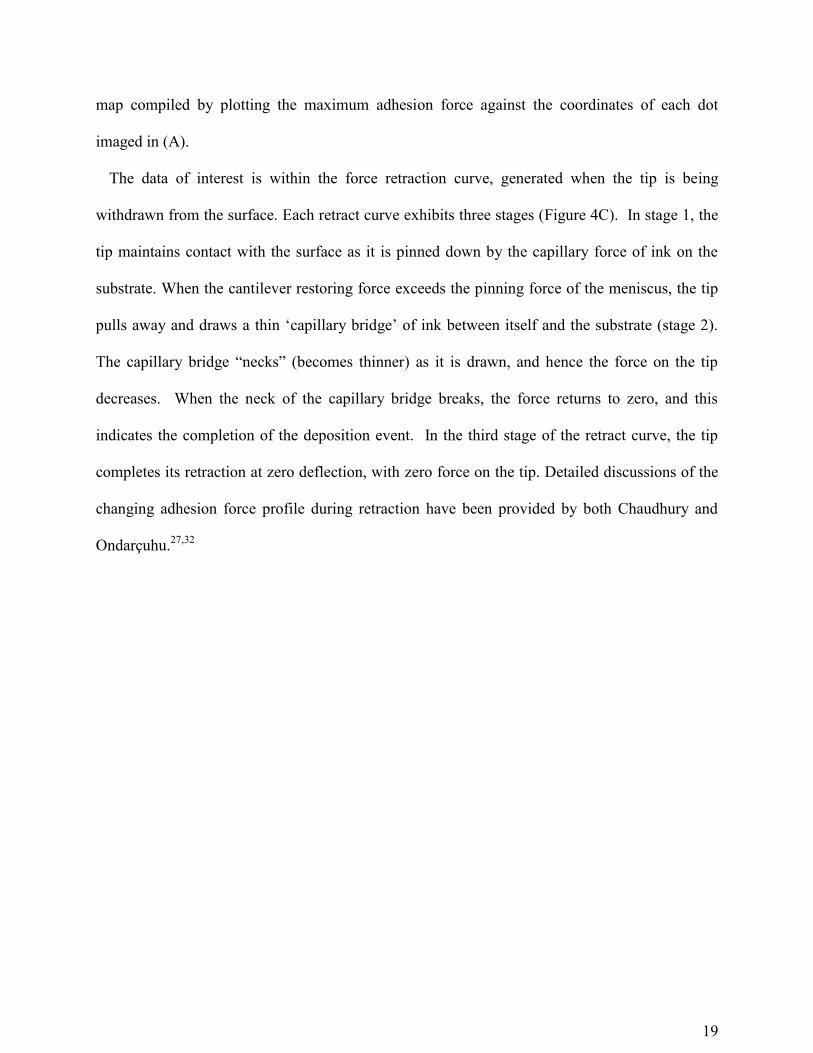
The ink-transfer mechanism was probed by monitoring the forces experienced by the AFM tip
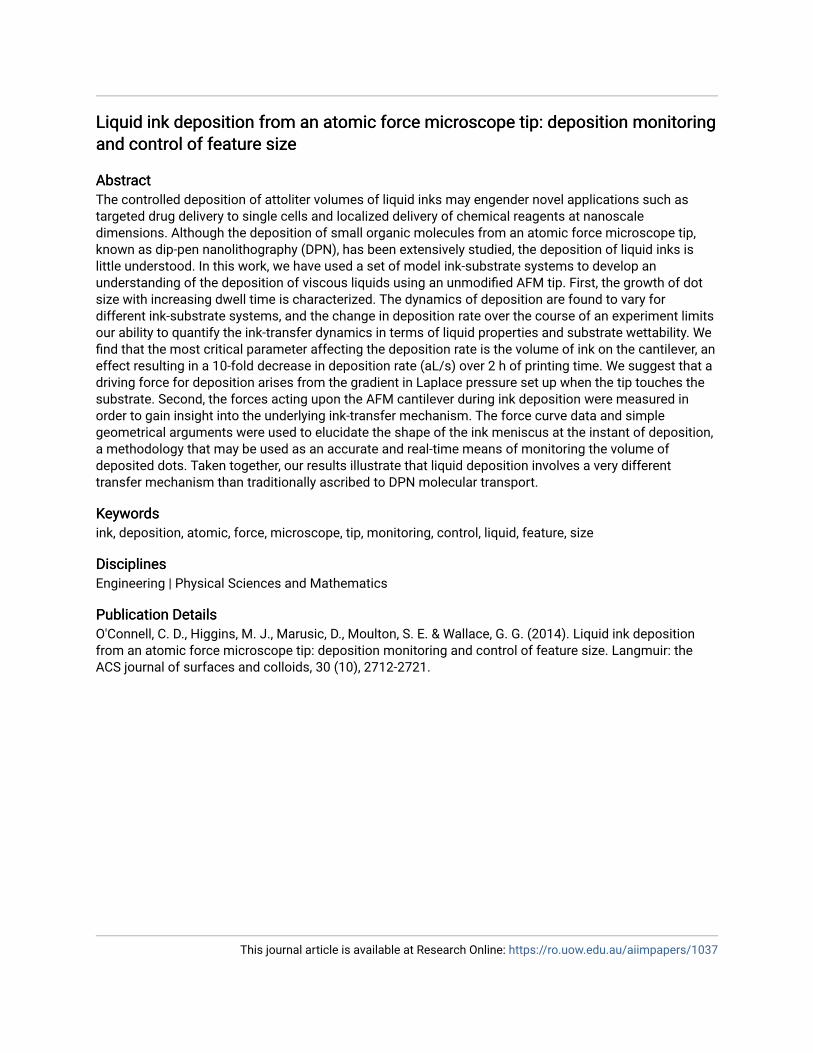
during deposition of the NOA68T (25000 mPa.s) model ink on hydrophilic Si/SiOx substrates.
Grids of dots were deposited (Figure 4A) and the deflection of the cantilever was measured and
used to generate a force curve. The z-height has been adjusted to account for the bending of the
cantilever (i.e. sensitivity) and so the curves are plotted as force versus ‘tip-sample separation’.
After AFM imaging of the printed pattern, analysis of individual force curves could proceed with
respect to the dimensions of the specific dot deposited. For example, Figure 4 (B) shows a force
19
map compiled by plotting the maximum adhesion force against the coordinates of each dot
imaged in (A).
The data of interest is within the force retraction curve, generated when the tip is being
withdrawn from the surface. Each retract curve exhibits three stages (Figure 4C). In stage 1, the
tip maintains contact with the surface as it is pinned down by the capillary force of ink on the
substrate. When the cantilever restoring force exceeds the pinning force of the meniscus, the tip
pulls away and draws a thin ‘capillary bridge’ of ink between itself and the substrate (stage 2).
The capillary bridge “necks” (becomes thinner) as it is drawn, and hence the force on the tip
decreases. When the neck of the capillary bridge breaks, the force returns to zero, and this
indicates the completion of the deposition event. In the third stage of the retract curve, the tip
completes its retraction at zero deflection, with zero force on the tip. Detailed discussions of the
changing adhesion force profile during retraction have been provided by both Chaudhury and
Ondarçuhu.27,32
20
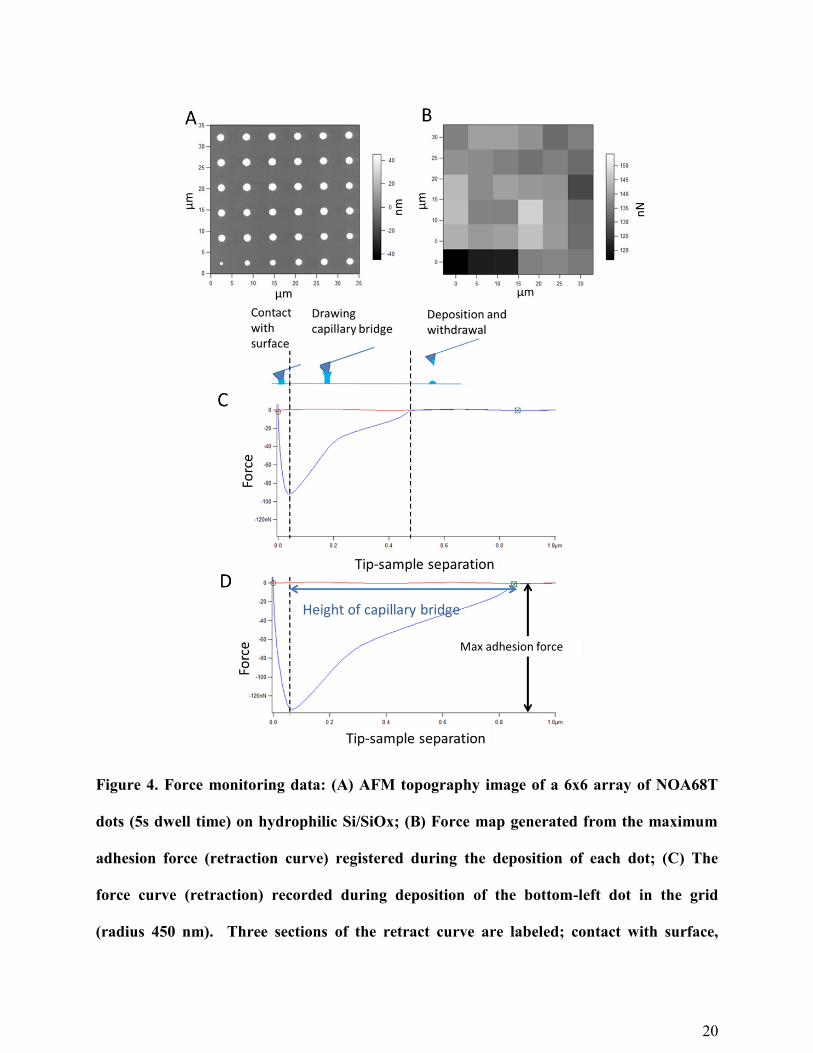
Figure 4. Force monitoring data: (A) AFM topography image of a 6x6 array of NOA68T
dots (5s dwell time) on hydrophilic Si/SiOx; (B) Force map generated from the maximum
adhesion force (retraction curve) registered during the deposition of each dot; (C) The
force curve (retraction) recorded during deposition of the bottom-left dot in the grid
(radius 450 nm). Three sections of the retract curve are labeled; contact with surface,
21
drawing of the capillary bridge, and final deposition; (D) The force curve (retraction)
recorded during the deposition of bottom right dot in the grid (radius 780 nm). The
cantilever experiences larger forces and greater capillary bridge extension when larger
dots are deposited.
To achieve reliable deposition monitoring, a direct relationship must be demonstrated between
some feature of the force curve and resulting dot dimensions. Figure 4 (C) and (D) show force
curves for two separate deposited dots; one of radius 450nm and one of radius 780 nm. It is clear
that the force curve corresponding to the larger dot has a very different profile, with a stronger
maximum adhesion force force (130 nN as opposed to 90nN), a greater total adhesion energy
(40.43 fJ as opposed to 18.85 fJ), and a greater height of the capillary bridge (477 nm as opposed
to 270 nm). In general, deposition of a larger dot generates a larger force on the tip, a higher
adhesion energy and an increased height of the capillary bridge at break-point.
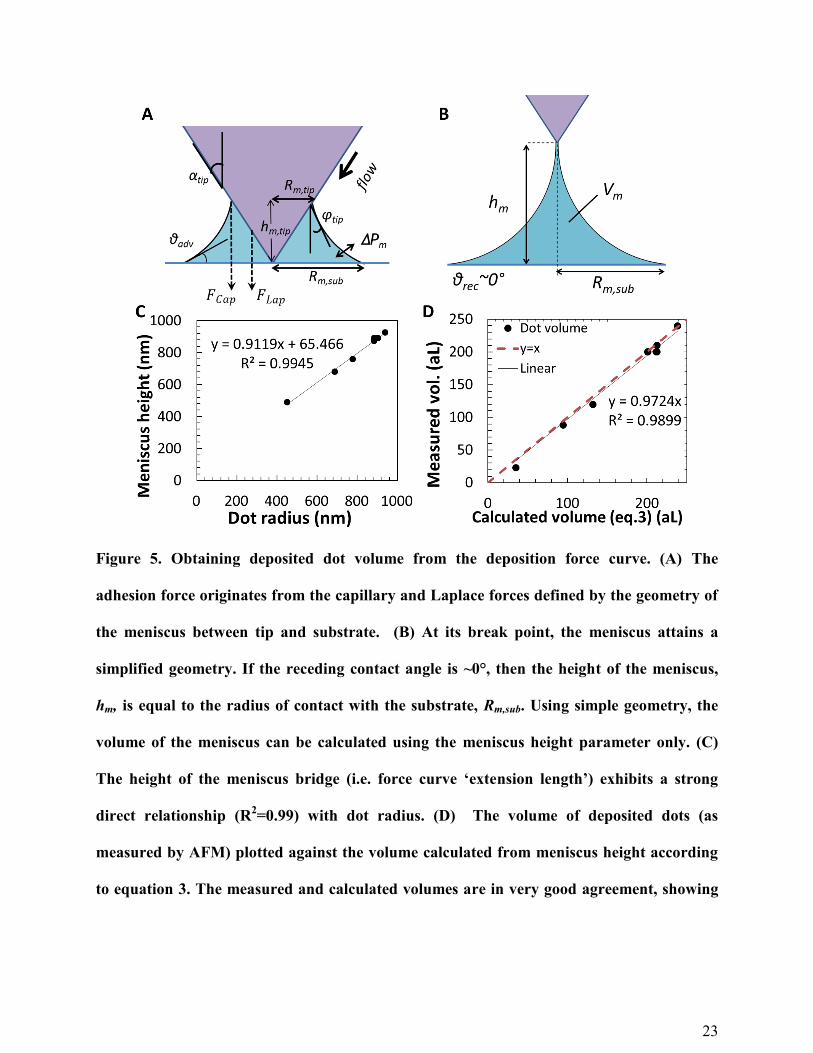
Though the maximum adhesion force exhibits a correlation with dot radius (see supporting
information), it is not an ideal parameter with which to monitor deposition. The adhesion force
arises from capillary, FCap, and Laplace, FLap, forces which depend on the geometry of the tip-
ink-substrate meniscus. As shown in Figure 5 (A), this geometry is complex, involving
parameters such as the radius of ink contact around the tip, Rm,tip, the meniscus radius at the
substrate (Rm,sub), the meniscus height on the tip (hm,tip), the ink-substrate contact angle (θadv), and
the ink-tip contact angle (θtip). All of these parameters are difficult to independently verify, and
many of them can change during the retract event.27,32
As shown in Figure 5 (B) the meniscus at the instant of break presents a much simplified
geometry. If we assume that only the bottom half of the meniscus bridge is deposited on the
surface, then no knowledge of the ink-tip interaction geometry is required. To calculate the
22
volume of the half-meniscus, we first approximate the meniscus curvature to be semi-circular (a
common assumption).46
We also assume the receding contact angle, θrec, is near zero (likely for
low contact angle systems; θc~7° for this system). In this case, the height of the meniscus at
break, hm, is equal to the radius of contact with the substrate, Rm,sub at that instant. By rotational
geometry the volume of the meniscus, Vm, is given by:
(3)
If we assume that Vm also constitutes the volume of the deposited dot, Vdot, then the height of
the meniscus bridge may, by itself, be used to calculate the size of the deposited feature.
To investigate this, dots of the NOA68T ink were deposited on hydrophilic Si/SiO2 using a
range of dwell times. The dot volumes ranged from 20 aL to 240 aL and force curves were
recorded during each deposition event. The deposited features were subsequently imaged at high
resolution using AFM. The dimensions of each dot were then analysed in terms of the force
curve of its deposition event.
As shown in Figure 5 (C), we have found a direct relationship between the height of the
meniscus bridge at break, hm, (obtained from the force curve) and the radius of deposited dots.
Furthermore, as shown in Figure 5 (D), the volumes of deposited dots (from AFM topographical
images) are in excellent agreement with the volumes calculated from meniscus height according
to equation 3 (R2=0.9899), supporting our assumption that Vm = Vdot. Such a level of agreement
is promising for an in-situ, real time, deposition monitoring system.
23
Figure 5. Obtaining deposited dot volume from the deposition force curve. (A) The
adhesion force originates from the capillary and Laplace forces defined by the geometry of
the meniscus between tip and substrate. (B) At its break point, the meniscus attains a
simplified geometry. If the receding contact angle is ~0°, then the height of the meniscus,
hm, is equal to the radius of contact with the substrate, Rm,sub. Using simple geometry, the
volume of the meniscus can be calculated using the meniscus height parameter only. (C)
The height of the meniscus bridge (i.e. force curve ‘extension length’) exhibits a strong
direct relationship (R2=0.99) with dot radius. (D) The volume of deposited dots (as
measured by AFM) plotted against the volume calculated from meniscus height according
to equation 3. The measured and calculated volumes are in very good agreement, showing
24
that our assumptions are validated. The linear trendline and line of perfect correlation,
y=x, are plotted for comparison.
3.4 Different mechanisms for molecular ink DPN and liquid ink deposition
Throughout this paper, we have described several phenomena which have not been observed
for DPN of molecular inks. The deposition dynamics were found to vary for different ink-
substrate systems. The deposition rate was found to decrease dramatically as the volume of ink in
the cantilever reservoir was depleted. Deposition was found to occur, not via diffusion, but via
the breaking of a meniscus bridge between tip and substrate. Since ‘DPN’ nominally refers to
diffusive transport from an AFM tip, we suggest that a distinction should be drawn between
molecular ink DPN and the deposition of liquids from an AFM tip.
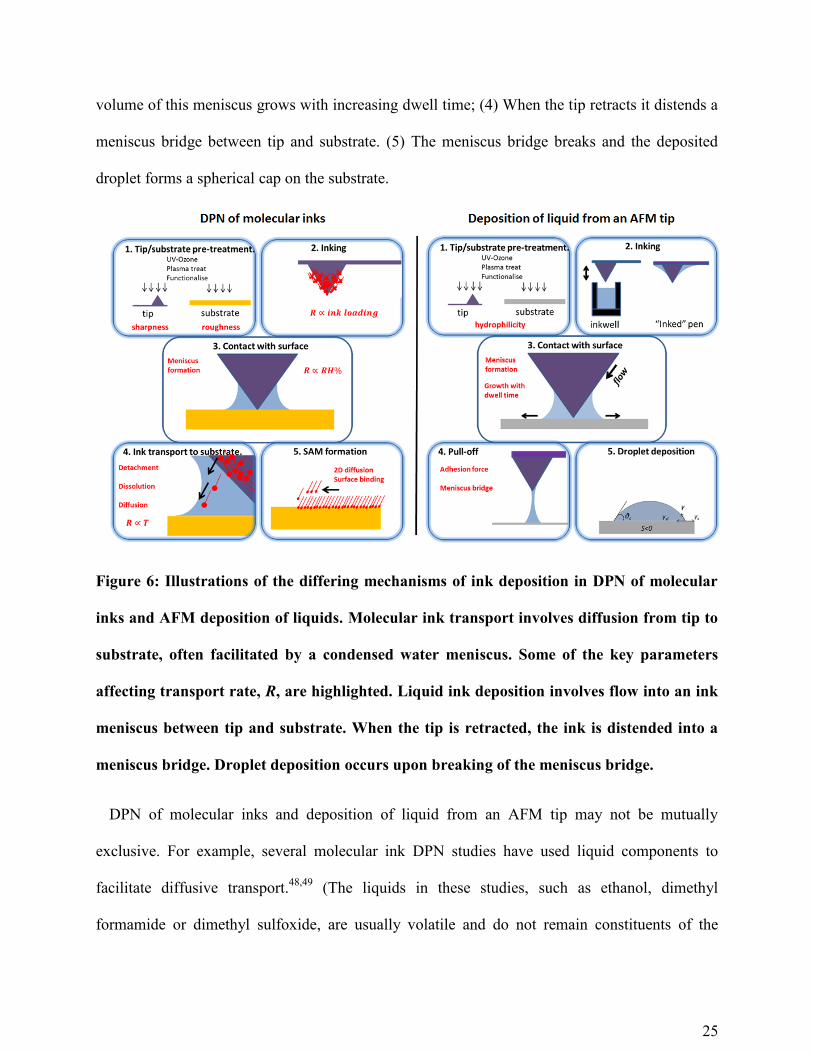
Figure 6 illustrates the differing ink transport mechanisms for molecular ink DPN and liquid
ink deposition. DPN of molecular inks involves five distinct stages: (1) Pre-treatment of tip and
substrate; (2) Coating the AFM tip with dried ink (typically alkanethiol molecules); (3) Contact
of the tip with the surface and the formation of a water meniscus between the tip and substrate
due to capillary condensation; (4) Diffusion of the ink molecules from tip to substrate. The
diffusion may or may not be facilitated by dissolution in the water meniscus, depending on the
hydrophilicity of the molecule; (5) Lateral diffusion of the molecules on the substrate and
covalent attachment.
In DPN of liquid inks, the deposition mechanism is very different: (1) Pre-treatment of tip and
substrate; (2) The DPN tip is inked by dipping it into a microfluidic inkwell, after which the ink
is held in a reservoir etched into the underside of the cantilever; (3) When the tip is brought into
contact with substrate, liquid ink ‘flows’ down to form a meniscus between tip and sample. The
25
volume of this meniscus grows with increasing dwell time; (4) When the tip retracts it distends a
meniscus bridge between tip and substrate. (5) The meniscus bridge breaks and the deposited
droplet forms a spherical cap on the substrate.
Figure 6: Illustrations of the differing mechanisms of ink deposition in DPN of molecular
inks and AFM deposition of liquids. Molecular ink transport involves diffusion from tip to
substrate, often facilitated by a condensed water meniscus. Some of the key parameters
affecting transport rate, R, are highlighted. Liquid ink deposition involves flow into an ink
meniscus between tip and substrate. When the tip is retracted, the ink is distended into a
meniscus bridge. Droplet deposition occurs upon breaking of the meniscus bridge.
DPN of molecular inks and deposition of liquid from an AFM tip may not be mutually
exclusive. For example, several molecular ink DPN studies have used liquid components to
facilitate diffusive transport.48,49
(The liquids in these studies, such as ethanol, dimethyl
formamide or dimethyl sulfoxide, are usually volatile and do not remain constituents of the
26
functional pattern.) Conversely, some diffusive transport may occur as a component of liquid
ink transport. (Though we have not explored the parameter in this study, relative humidity does
affect the deposition rate of the NOA inks). Ultimately, as features of smaller dimensions are
considered, a distinction between ‘liquid ink’ and ‘molecular ink’ may not be valid.
Nevertheless, a distinction between diffusive molecular ink transport versus deposition via the
breaking of a meniscus bridge is useful in many cases as each mechanism highlights different
parameters which need to be controlled.
4. CONCLUSIONS
A set of model ink-substrate systems were used to develop an understanding of the deposition
of liquids by AFM. We began by investigating the growth of dot-size with increasing dwell-time.
The dramatic change in deposition rate over the course of an experiment limited our ability to
quantify the deposition dynamics in terms of liquid properties and substrate wettability. We
found that a critical parameter affecting deposition rate was the volume of ink on the pen.
We analyzed the forces acting upon the AFM cantilever during ink deposition to gain insight
into the dynamics of ink-transfer. The force curve data and simple geometrical arguments were
used to elucidate the shape of the ink meniscus at the instant of deposition, a methodology which
may lead to an accurate and real-time means of monitoring the volume of deposited dots. Such
in-situ monitoring could be an important capability for future autonomous fabrication systems.
For example, an algorithm could be incorporated using dynamic information from force curves
to adapt to specific deposition conditions (level of ink on pen, humidity, local substrate
hydrophilicity etc). Ideally, such a system would utilise optical feedback, and individual
actuation, on every pen in an array. Although this would necessitate a vastly more complex
instrumentation, feedback systems for 2 dimensional arrays of cantilevers were demonstrated
27
over a decade ago.50
We encountered limitations to the deposition monitoring technique due to
the relatively low stiffness (k~0.5 N/m) of the M-type probes. For example, the large adhesion
forces generated during deposition of very large dots resulted in bending of the cantilever beyond
the limit of detection. This put an upper limit on the magnitude of adhesion forces which could
be measured. On the other hand, the meniscus bridge height of very small dots could not be
measured as this information was washed out by the cantilever restoring force. Higher
sensitivity of detection (and greater control of overcoming the pinning meniscus force) could be
achieved with the use of higher stiffness cantilevers.
Taken together, our results illustrate how liquid deposition involves a very different transfer
mechanism than traditionally ascribed to molecular transport. Different parameters, in particular
the volume of ink on the cantilever, are important in defining deposition rate. In recent work, we
have shown that deposition rate depends not just on the volume of ink on the cantilever, but on
the relative location of the ink on the cantilever (and on the tip itself) and that this ink
distribution is subject to dynamic reorganisation.44
The resulting feature-size variation
emphasizes the utility of an in-situ deposition monitoring strategy.
ASSOCIATED CONTENT
Supporting Information. A discussion of the relationship between adhesion force and feature
size. This material is available free of charge via the Internet at http://pubs.acs.org.
AUTHOR INFORMATION
Corresponding Author
* E-mail: [email protected]
28
Author Contributions
C.D.O’C and M.J.H. designed experiments. C.D.O’C and D.M. performed experiments.
C.D.O’C, M.J.H. and S.E.M. analysed results. C.D.O’C wrote the manuscript. M.J.H and
G.G.W. directed the project. All authors have given approval to the final version of the
manuscript.
Notes
The authors declare no competing financial interest.
ACKNOWLEDGMENT
The authors are grateful for the continued financial support of the Australian Research Council
under the Australian Federation and Laureate Fellowships of Prof Gordon Wallace, the
Australian Research Fellowship of Assoc. Prof. Michael Higgins and the QEII Fellowship of
Assoc. Prof. Simon Moulton. The Nanoink system is gratefully provided via the Australian
National Fabrication Facility (ANFF), Materials Node.
REFERENCES
(1) Piner, R. D. “Dip-Pen” Nanolithography. Science (80-. ). 1999, 283, 661–663.
(2) Sheehan, P.; Whitman, L. Thiol Diffusion and the Role of Humidity in “Dip Pen
Nanolithography.”Phys. Rev. Lett. 2002, 88, 156104.
(3) Peterson, E. J.; Weeks, B. L.; Yoreo, J. J. De; Schwartz, P. V Effect of Environmental
Conditions on Dip Pen Nanolithography of Mercaptohexadecanoic Acid. 2004, 15206–
15210.
(4) Giam, L. R.; Wang, Y.; Mirkin, C. A. Nanoscale molecular transport: the case of dip-pen
nanolithography. J. Phys. Chem. A 2009, 113, 3779–82.
29
(5) Hong, S. Multiple Ink Nanolithography: Toward a Multiple-Pen Nano-Plotter. Science
(80-. ). 1999, 286, 523–525.
(6) Rozhok, S.; Piner, R.; Mirkin, C. a. Dip-Pen Nanolithography: What Controls Ink
Transport? J. Phys. Chem. B 2003, 107, 751–757.
(7) Wu, C.-D.; Fang, T.-H. Simulation of deposition of ink molecules on rough substrates in
dip-pen nanolithography. Model. Simul. Mater. Sci. Eng. 2011, 19, 065008.
(8) Weeks, B.; Noy, A.; Miller, A.; De Yoreo, J. Effect of Dissolution Kinetics on Feature
Size in Dip-Pen Nanolithography. Phys. Rev. Lett. 2002, 88, 1–4.
(9) Saha, S. K.; Culpepper, M. L. An Ink Transport Model for Prediction of Feature Size in
Dip Pen Nanolithography. Small 2010, 15364–15369.
(10) Ahn, Y.; Hong, S.; Jang, J. Growth dynamics of self-assembled monolayers in dip-pen
nanolithography. J. Phys. Chem. B 2006, 110, 4270–3.
(11) Wu, C.-D.; Fang, T.-H.; Lin, J.-F. Formation mechanism and mechanics of dip-pen
nanolithography using molecular dynamics. Langmuir 2010, 26, 3237–41.
(12) Chung, S.; Felts, J. R.; Wang, D.; King, W. P.; De Yoreo, J. J. Temperature-dependence
of ink transport during thermal dip-pen nanolithography. Appl. Phys. Lett. 2011, 99,
193101.
(13) Wang, H.; Nafday, O. A.; Haaheim, J. R.; Tevaarwerk, E.; Amro, N. A.; Sanedrin, R. G.;
Chang, C.; Ren, F.; Pearton, S. J. Toward conductive traces: Dip Pen Nanolithography®
of silver nanoparticle-based inks. Appl. Phys. Lett. 2008, 93, 143105.
(14) Hung, S.; Nafday, O. A.; Haaheim, J. R.; Ren, F.; Chi, G. C.; Pearton, S. J. Dip Pen
Nanolithography of Conductive Silver Traces. J. Phys. Chem. C 2010, 114, 9672–9677.
(15) Senesi, A. J.; Rozkiewicz, D. I.; Reinhoudt, D. N.; Mirkin, C. A. Agarose-assisted dip-pen
nanolithography of oligonucleotides and proteins. ACS Nano 2009, 3, 2394–402.
(16) Sanedrin, R. G.; Huang, L.; Jang, J.-W.; Kakkassery, J.; Mirkin, C. A. Polyethylene
Glycol as a Novel Resist and Sacrificial Material for Generating Positive and Negative
Nanostructures**. 2008, 920–924.
(17) Nakashima, H.; Higgins, M. J.; O’Connell, C.; Torimitsu, K.; Wallace, G. G. Liquid
deposition patterning of conducting polymer ink onto hard and soft flexible substrates via
dip-pen nanolithography. Langmuir 2012, 28, 804–11.
(18) Jang, J.-W.; Zheng, Z.; Lee, O.-S.; Shim, W.; Zheng, G.; Schatz, G. C.; Mirkin, C. a
Arrays of nanoscale lenses for subwavelength optical lithography. Nano Lett. 2010, 10,
4399–404.
30
(19) Hernandez-Santana, A.; Irvine, E.; Faulds, K.; Graham, D. Rapid prototyping of
poly(dimethoxysiloxane) dot arrays by dip-pen nanolithography. Chem. Sci. 2011, 2, 211.
(20) O’Connell, C. D.; Higgins, M. J.; Sullivan, R. P.; Jamali, S. S.; Moulton, S. E.; Wallace,
G. G. Nanoscale platinum printing on insulating substrates. Nanotechnology 2013.
(21) Collins, J. M.; Lam, R. T. S.; Yang, Z.; Semsarieh, B.; Smetana, A. B.; Nettikadan, S.
Targeted delivery to single cells in precisely controlled microenvironments. Lab Chip
2012, 12, 2643–8.
(22) Nanoink inc. Hydrogel Patterning (Tech note); 2010; pp. 1–2.
(23) Nanoink inc. Patterning Functional Hydrogels (Tech note); 2010; pp. 1–2.
(24) Fang, A.; Dujardin, E.; Ondarçuhu, T. Control of droplet size in liquid nanodispensing.
Nano Lett. 2006, 6, 2368–74.
(25) Arcamone, J.; Dujardin, E.; Rius, G.; Pérez-Murano, F.; Ondarçuhu, T. Evaporation of
femtoliter sessile droplets monitored with nanomechanical mass sensors. J. Phys. Chem. B
2007, 111, 13020–7.
(26) Ondarçuhu, T.; Arcamone, J.; Fang, a.; Durou, H.; Dujardin, E.; Rius, G.; Pérez-Murano,
F. Controlled deposition of nanodroplets on a surface by liquid nanodispensing:
Application to the study of the evaporation of femtoliter sessile droplets. Eur. Phys. J.
Spec. Top. 2009, 166, 15–20.
(27) Fabié, L.; Durou, H.; Ondarçuhu, T. Capillary forces during liquid nanodispensing.
Langmuir 2010, 26, 1870–8.
(28) Kim, K.; Moldovan, N.; Espinosa, H. D. Patterning techniques A Nanofountain Probe
with Sub-100 nm Molecular Writing Resolution**. 2005, 632–635.
(29) Wu, B.; Ho, A.; Moldovan, N.; Espinosa, H. D. Direct deposition and assembly of gold
colloidal particles using a nanofountain probe. Langmuir 2007, 23, 9120–3.
(30) Kim, K.-H.; Sanedrin, R. G.; Ho, A. M.; Lee, S. W.; Moldovan, N.; Mirkin, C. A.;
Espinosa, H. D. Direct Delivery and Submicrometer Patterning of DNA by a
Nanofountain Probe. Adv. Mater. 2008, 20, 330–334.
(31) Loh, O.; Lam, R.; Chen, M.; Moldovan, N.; Huang, H.; Ho, D.; Espinosa, H. D.
Nanofountain-probe-based high-resolution patterning and single-cell injection of
functionalized nanodiamonds. Small 2009, 5, 1667–74.
(32) Malotky, D. L.; Chaudhury, M. K. Investigation of Capillary Forces Using Atomic Force
Microscopy. Langmuir 2001, 17, 7823–7829.
31
(33) Men, Y.; Zhang, X.; Wang, W. Capillary liquid bridges in atomic force microscopy:
formation, rupture, and hysteresis. J. Chem. Phys. 2009, 131, 184702.
(34) Bhushan, B.; Israelachvili, J. N.; Landman, U. Nanotribology: friction, wear and
lubrication at the atomic scale. Nature 1995, 374, 607–616.
(35) Chilamakuri, S. K.; Bhushan, B. A comprehensive kinetic meniscus model for prediction
of long-term static friction. J. Appl. Phys. 1999, 86, 4649.
(36) O’Connell, C. D.; Higgins, M. J.; Nakashima, H.; Moulton, S. E.; Wallace, G. G. Vapor
phase polymerization of EDOT from submicrometer scale oxidant patterned by dip-pen
nanolithography. Langmuir 2012, 28, 9953–60.
(37) Hampton, J. R.; Dameron, A. A.; Weiss, P. S. Transport rates vary with deposition time in
dip-pen nanolithography. J. Phys. Chem. B 2005, 109, 23118–20.
(38) Wu, T.-H.; Lu, H.-H.; Lin, C.-W. Dependence of transport rate on area of lithography and
pretreatment of tip in dip-pen nanolithography. Langmuir 2012, 28, 14509–13.
(39) Eijkel, J. C. T.; van den Berg, A. Young 4ever--the use of capillarity for passive flow
handling in lab on a chip devices. Lab Chip 2006, 6, 1405–8.
(40) Van Honschoten, J. W.; Brunets, N.; Tas, N. R. Capillarity at the nanoscale. Chem. Soc.
Rev. 2010, 39, 1096–114.
(41) Yang, S. H.; Nosonovsky, M.; Zhang, H.; Chung, K.-H. Nanoscale water capillary bridges
under deeply negative pressure. Chem. Phys. Lett. 2008, 451, 88–92.
(42) Gao, C.; Bhushan, B. Tribological performance of magnetic thin-film glass disks: its
relation to surface roughness and lubricant structure and its thickness. Wear 1995, 190,
60–75.
(43) Brakke, K. a. The Surface Evolver and the Stability of Liquid Surfaces. Philos. Trans. R.
Soc. A Math. Phys. Eng. Sci. 1996, 354, 2143–2157.
(44) O’Connell, C. D.; Sullivan, R.; Higgins, M. J.; Moulton, S. E.; Wallace, G. G. Ink-on-
probe hydrodynamics in atomic force microscope deposition of liquid inks. Submitted
2013.
(45) Butt, H.-J.; Kappl, M. Normal capillary forces. Adv. Colloid Interface Sci. 2009, 146, 48–
60.
(46) Cai, S.; Bhushan, B. Meniscus and viscous forces during normal separation of liquid-
mediated contacts. Nanotechnology 2007, 18, 465704.
32
(47) Ortiz-Young, D.; Chiu, H.-C.; Kim, S.; Voïtchovsky, K.; Riedo, E. The interplay between
apparent viscosity and wettability in nanoconfined water. Nat. Commun. 2013, 4, 2482.
(48) Demers, L. M.; Ginger, D. S.; Park, S.-J.; Li, Z.; Chung, S.-W.; Mirkin, C. A. Direct
patterning of modified oligonucleotides on metals and insulators by dip-pen
nanolithography. Science 2002, 296, 1836–8.
(49) Lee, K.-B.; Park, S.-J.; Mirkin, C. a; Smith, J. C.; Mrksich, M. Protein nanoarrays
generated by dip-pen nanolithography. Science 2002, 295, 1702–5.
(50) Minne, S. C.; Adams, J. D.; Yaralioglu, G.; Manalis, S. R.; Atalar, A.; Quate, C. F.
Centimeter scale atomic force microscope imaging and lithography. Appl. Phys. Lett.
1998, 73, 1742.
33
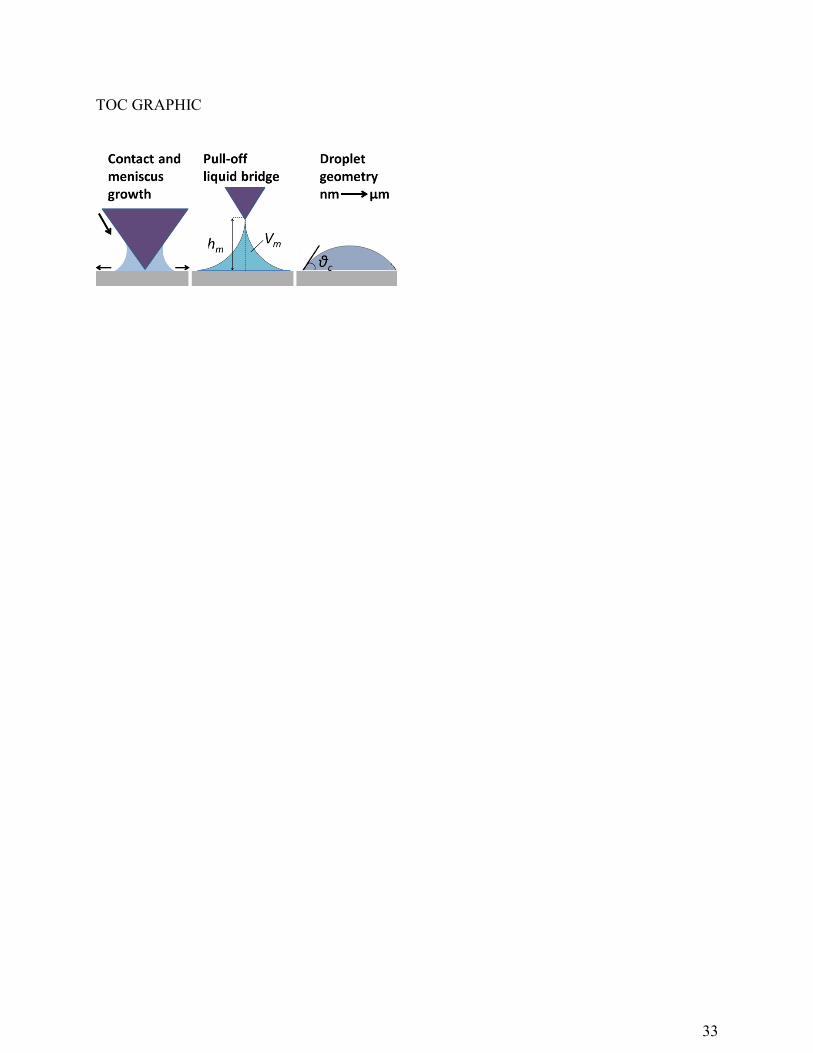
TOC GRAPHIC
Recommended